Embed Size (px)
Citation preview
RESEARCH ARTICLE
Influence of pharmaceutical marketing on
Medicare prescriptions in the District of
Columbia
Susan F. Wood1‡, Joanna Podrasky2, Meghan A. McMonagle3, Janani Raveendran4,
Tyler Bysshe5, Alycia Hogenmiller6, Adriane Fugh-Berman6‡*
1 Department of Health Policy and Management, George Washington University Milken Institute School of
Public Health, Washington DC, United States of America, 2 Department of Infection Prevention and Control,
JPS Health Network, Fort Worth, Texas, United States of America, 3 Department of Regional Planning,
MedStar Health, Columbia, Maryland, United States of America, 4 George Washington University School of
Medicine, Washington DC, United States of America, 5 National Opinion Research Center at the University of
Chicago, Bethesda, Maryland, United States of America, 6 Department of Pharmacology and Physiology,
Georgetown University Medical Center, Washington DC, United States of America
‡ These authors are joint senior authors on this work.
Abstract
Importance
Gifts from pharmaceutical companies are believed to influence prescribing behavior, but
few studies have addressed the association between industry gifts to physicians and drug
costs, prescription volume, or preference for generic drugs. Even less research addresses
the effect of gifts on the prescribing behavior of nurse practitioners (NPs), physician assis-
tants (PAs), and podiatrists.
Objective
To analyze the association between gifts provided by pharmaceutical companies to individ-
ual prescribers in Washington DC and the number of prescriptions, cost of prescriptions,
and proportion of branded prescriptions for each prescriber.
Design
Gifts data from the District of Columbia’s (DC) AccessRx program and the federal
Center for Medicare and Medicaid Services (CMS) Open Payments program were ana-
lyzed with claims data from the CMS 2013 Medicare Provider Utilization and Payment
Data.
Setting
Washington DC, 2013
PLOS ONE | https://doi.org/10.1371/journal.pone.0186060 October 25, 2017 1 / 13
a1111111111
a1111111111
a1111111111
a1111111111
a1111111111
OPENACCESS
Citation: Wood SF, Podrasky J, McMonagle MA,
Raveendran J, Bysshe T, Hogenmiller A, et al.
(2017) Influence of pharmaceutical marketing on
Medicare prescriptions in the District of Columbia.
PLoS ONE 12(10): e0186060. https://doi.org/
10.1371/journal.pone.0186060
Editor: Tomasz Bochenek, Jagiellonian University,
POLAND
Received: November 11, 2016
Accepted: September 25, 2017
Published: October 25, 2017
Copyright: © 2017 Wood et al. This is an open
access article distributed under the terms of the
Creative Commons Attribution License, which
permits unrestricted use, distribution, and
reproduction in any medium, provided the original
author and source are credited.
Data Availability Statement: All relevant data are
within the paper and its Supporting Information
file. The Open Payments data are publicly available.
The DC Access Rx are not publicly available, by
law. DC Official Code, Title 48, Subchapter I.
AccessRX Program 48-831.07(e) states "The
Department shall protect the confidentiality of all
information subject to confidentiality protection
under District or federal law, rule or regulation." It is
available here: https://doh.dc.gov/sites/default/files/
dc/sites/doh/publication/attachments/Subchapter%
20I_AccessRX%20Program.pdf. The data is
Participants
Physicians, nurse practitioners, physician assistants, podiatrists, and other licensed Medi-
care Part D prescribers who participated in Medicare Part D (a Federal prescription drug
program that covers patients over age 65 or who are disabled).
Exposure(s)
Gifts to healthcare prescribers (including cash, meals, and ownership interests) from phar-
maceutical companies.
Main outcomes and measures
Average number of Medicare Part D claims per prescriber, number of claims per patient,
cost per claim, and proportion of branded claims.
Results
In 2013, 1,122 (39.1%) of 2,873 Medicare Part D prescribers received gifts from pharmaceu-
tical companies totaling $3.9 million in 2013. Compared to non-gift recipients, gift recipients
prescribed 2.3 more claims per patient, prescribed medications costing $50 more per claim,
and prescribed 7.8% more branded drugs. In six specialties (General Internal Medicine,
Family Medicine, Obstetrics/Gynecology, Urology, Ophthalmology, and Dermatology), gifts
were associated with a significantly increased average cost of claims. For Internal Medicine,
Family Medicine, and Ophthalmology, gifts were associated with more branded claims. Gift
acceptance was associated with increased average cost per claim for PAs and NPs. Gift
acceptance was also associated with higher proportion of branded claims for PAs but not
NPs. Physicians who received small gifts (less than $500 annually) had more expensive
claims ($114 vs. $85) and more branded claims (30.3% vs. 25.7%) than physicians who
received no gifts. Those receiving large gifts (greater than $500 annually) had the highest
average costs per claim ($189) and branded claims (39.9%) than other groups. All differ-
ences were statistically significant (p<0.05).
Conclusions and relevance
Gifts from pharmaceutical companies are associated with more prescriptions per patient,
more costly prescriptions, and a higher proportion of branded prescriptions with variation
across specialties. Gifts of any size had an effect and larger gifts elicited a larger impact on
prescribing behaviors. Our study confirms and expands on previous work showing that
industry gifts are associated with more expensive prescriptions and more branded prescrip-
tions. Industry gifts influence prescribing behavior, may have adverse public health implica-
tions, and should be banned.
Background
Pharmaceutical companies influence healthcare providers’ attitudes and therapeutic choices
through financial incentives that include research grants, educational grants, consulting fees,
speaker fees, gifts, and meals. Although pharmaceutical company promotion influences a
Pharmaceutical marketing and Medicare prescriptions
PLOS ONE | https://doi.org/10.1371/journal.pone.0186060 October 25, 2017 2 / 13
owned by the DC Department of Health, and all
names of companies, recipients and specific
amounts are held confidentially. Data requests can
be made to: Department of Health Government of
the District of Columbia Health Regulation and
Licensing Administration Pharmaceutical Control–
AccessRx 899 N. Capitol Street, NE Washington, D.
C. 20002.
Funding: This study was funded by the District of
Columbia Department of Health. The funders
played a role in deciding the topic of this report, but
had no role in study design, data collection and
analysis, decision to publish, or preparation of the
manuscript.
Competing interests: AFB directs PharmedOut, a
Georgetown University Medical Center project that
encourages rational prescribing. AH is the paid
project manager of PharmedOut. PharmedOut has
a contract with the George Washington Milken
Institute School of Public Health to create content
for the DC Center for Rational Prescribing (DCRx),
which creates industry-free continuing medical
education modules and resources for the
Washington DC Department of Health. AFB also
has a contract with the George Washington Milken
Institute School of Public Health to analyze
pharmaceutical marketing data from Washington
DC. AFB is a paid expert witness at the request of
plaintiffs in litigation regarding pharmaceutical
marketing practices. SW is the PI for the DC Center
for Rational Prescribing, a contract with the
Washington DC Department of Health to create
industry-free continuing medical education
modules and resources for the Washington DC
Department of Health. MM and JP were former
employees of the DC Center for Rational
Prescribing; JR is a former intern for DCRx. This
does not alter our adherence to PLOS ONE policies
on sharing data and materials.
physician’s prescribing behavior,[1–5] studies have consistently shown that physicians do not
believe that promotion affects their own prescribing.[6–12]
Less information is available on the influence of industry on physician assistants (PAs),
nurse practitioners (NPs), optometrists, podiatrists, and other healthcare providers who pre-
scribe medications. The National Ambulatory Medical Care Survey (NAMCS), a national sur-
vey that assesses the use of medical services in the United States,[13] found that NPs and PAs
write just as many prescriptions as physicians.[14] The number of prescriptions written by
NPs and PAs has more than doubled over the past five years; in 2015, NPs and PAs wrote 676
million of 4.4 billion (15.4%) prescriptions in the U.S.[15] Only a few studies have documented
the influence of pharmaceutical promotions and marketing activities on the prescribing of
advanced practice nurses.[16–18] No studies were identified on the influence of industry on
PAs.
Gifts, no matter their size, have a powerful effect on human relationships. Reciprocity is a
strong guiding principle of human interaction.[19–21] Even gifts of small value, such as “mod-
est” industry-sponsored lunches, may foster a subconscious obligation to reciprocate through
changes in prescribing practices.[20] DeJong et al has shown that a meal with a value of less
than $20 can increase the prescribing of branded statins, beta-blockers, ACE inhibitors, and
antidepressants.[22]
Recently available public data show that industry gifts are common among physicians in
general [23] and among specialists (i.e. surgeons,[24] emergency medicine physicians,[25]
obstetricians/gynecologists,[26] radiation oncologists,[27] gynecologic oncologists,[28] otolar-
yngologists,[29] and pediatricians.[30]) One study has shown that industry gifts are associated
with more expensive prescriptions for Medicare patients (in the U.S., Medicare is Federally-
funded insurance that covers patients over 65 and disabled individuals).[4] Another study has
found that industry gifts to physicians in Massachusetts increased prescribing of branded stat-
ins.[31]
Nationally, no laws prohibit the acceptance of gifts or payments from industry by healthcare
providers. Several states restrict gift acceptance; Minnesota, for example, limits gifts and food
to $50 per year and limits payments for speaking to “reasonable” fees for “bona fide” educa-
tion.[32] In Washington DC, members of a medication advisory committee are not allowed to
accept a gift from a pharmaceutical company.[33]
In 2009, the Pharmaceutical Research and Manufacturers of America (PhRMA), the trade
group for pharmaceutical companies, instituted a voluntary gift restriction policy, recom-
mending that companies not provide any entertainment or recreational items, “reminder”
items (i.e. pens, notepads, mugs), or gifts intended for entertainment or recreation. Gifts
intended for education or patient care are allowed if they do not cost more than $100.[34]
The 2004 AccessRx Act requires pharmaceutical companies to report all pharmaceutical
marketing expenditures, including gifts to all persons and entities licensed to provide health-
care in the District (i.e. physicians, nurses, physician assistants, and pharmacists), salaries
spent on pharmaceutical representatives and other pharmaceutical marketers, and advertising.
A portion of this law was pre-empted when the federal Centers for Medicare and Medicaid
Service (CMS) Open Payments system went into effect in August 2013. Open Payments col-
lects information on gifts to doctors (i.e. Doctor of Medicine, Doctor of Osteopathy, Doctor of
Dentistry, Doctor of Dental Surgery, Doctor of Podiatry, Doctor of Optometry, Doctor of Chi-
ropractic Medicine).
The release of the CMS Medicare Provider Utilization and Payment Data, which summa-
rizes the utilization and payments for procedures, services, and prescription drugs provided by
organizational or individual providers to Medicare patients,[35] provided a unique opportu-
nity to examine prescribing behavior. Combining CMS Part D Prescriber data (Medicare Part
Pharmaceutical marketing and Medicare prescriptions
PLOS ONE | https://doi.org/10.1371/journal.pone.0186060 October 25, 2017 3 / 13
D is prescription coverage) with data from Washington DC Department of Health’s (DOH)
AccessRx and CMS Open Payments allowed us to gain insight into the impact of pharmaceuti-
cal marketing efforts on individual prescribing behavior.
Methods
Study design
Primary outcomes of this study included the average number of Medicare claims per pre-
scriber, claims per patient, cost per claim, and proportion of branded claims. A claim was clas-
sified as branded or generic within the CMS Medicare Part D data set. The average number of
claims per prescriber was calculated by dividing the total number of claims for all prescribers
by the total number of prescribers included in the study. The average number of claims per
patient was calculated by dividing the total number of claims by the total number of Medicare
Part D patients associated with each prescriber. The average cost per claim was calculated by
dividing the total cost of claims by the total number of claims. The proportion of branded
claims was calculated by dividing the total number of claims of branded drugs by the total
number of claims. This study was approved via expedited review by the George Washington
University’s Institutional Review Board under IRB #060942.
Data sources
This analysis combined pharmaceutical marketing data from the DC DOH AccessRx program
and the CMS Open Payments program with Medicare Part D claims data from CMS’ Medicare
Provider Utilization and Payment Data. Our study included all gifts provided in 2013. Physi-
cian gifts from January to July 2013 were obtained from AccessRx. Physician gifts from August
to December 2013 were obtained from Open Payments. The reason for switching databases
was that reporting of physician gifts to Open Payments began in August 2013, which pre-
empted reporting of physician gifts to AccessRx. Information for NPs, PAs, and other non-
physician prescribers were obtained entirely from the AccessRx database, as Open Payments
does not gather these data. Open Payments, but not AccessRx, collects data on payments from
medical device companies. For consistency, we identified all manufacturers of devices and
medical supplies through online searches and excluded these from analyses, thus limiting our
analysis to pharmaceutical companies.
There are minor differences in reporting requirements between AccessRx and Open Pay-
ments. AccessRx requires reporting of expenses more than $25 made by a manufacturer or
labeler (repackager) of prescription drugs associated with educational or informational pro-
grams, food, entertainment, gifts, travel, and product samples.[36] Information excluded from
reporting includes “reasonable compensation” in connection with a clinical trial, scholarships
for certain conferences, and samples that will be distributed free of charge to patients. Gifts
reportable to Open Payments in 2013 include payments of $10 or more from any manufactur-
ers of drugs, devices, biologics, or medical supplies covered by Medicare, Medicaid, or the
Children’s Health Insurance Program to a physician or teaching hospital.[37] Information
excluded from reporting includes manufacturers who make less than 10% gross revenue from
covered products and drug samples for patients.
Participants
Medicare Part D prescribers in DC, including physicians, nurse practitioners, and physician
assistants, were identified by inclusion in the 2013 CMS Medicare Provider Utilization and
Payment Data.
Pharmaceutical marketing and Medicare prescriptions
PLOS ONE | https://doi.org/10.1371/journal.pone.0186060 October 25, 2017 4 / 13
Gift recipients were identified based on inclusion in either the AccessRx or Open Payments
database. Prescribers who submitted more than ten Medicare claims in 2013 and appeared in
either AccessRx or Open Payments as receiving a gift of any value were recorded as gift recipi-
ents (CMS excludes claim counts of ten or fewer from the Medicare Provider Utilization and
Payment database). Prescribers who submitted Medicare claims and appeared in the database,
but whose names did not appear in either the AccessRx or Open Payments datasets, were
assumed to be non-gift recipients.
Names were used to match Medicare claims in CMS’ Medicare Provider Utilization and
Payment Data to gifts reported in AccessRx and Open Payments. Although the U.S. used
national provider identifiers (NPIs), a unique 10-digit number for each healthcare provider,
we did not use NPI numbers because they were not available in all databases. Instead, we used
middle initials, facility affiliations, and specialty information to assist with matching records.
When there were inconsistencies in the spelling of names and other identifiers between data-
bases, a manual search for a gift recipient’s name was performed in other fields and efforts
were made to identify prescribers by address or affiliation. Healthcare prescribers were
excluded from the analysis only if all of these tactics failed.
Specialties were determined through CMS Medicare Provider Utilization and Payment
data and by recipient credentials included in the AccessRx data. Internal Medicine subspecial-
ties (Cardiology, Endocrinology, Gastroenterology, Infectious Disease, Pulmonary Disease),
Family Medicine, Obstetrics/Gynecology, Urology, Opthalmology, Dermatology, Emergency
Medicine, Psychiatry and its subspecialties (General Psychiatry, Psychiatry/Neurology, Neuro-
psychiatry), and Other Surgery Specialties (Cardiothoracic Surgery, Colorectal Surgery, Oral
and Maxillofacial Surgery, Plastic and Reconstructive Surgery, Vascular Surgery, Neurosur-
gery, Thoracic and Vascular Surgery) were grouped into categories (Table 1). Subspecialties
with small numbers were combined in order to increase the statistical power in the analysis.
Specialties with fewer than five individuals were excluded to avoid the bias associated with
small sample sizes.
Data analysis
The impact of gifts on prescribing patterns was analyzed by comparing gift recipients
(n = 1,123) to non-gift recipients (n = 1,750). Subset analyses examined differences by specialty
and gift value. The mean values of the average cost per claim and proportion of branded claims
were tested using a one-way analysis of variance (ANOVA) and Scheffe post-hoc comparisons
with the level of significance of p< 0.05.
Subset analyses were performed to determine whether those receiving small gifts (n = 798),
defined as gifts totaling less than $500 year affected prescribing patterns compared to non-gift
recipients (n = 1,750) and those receiving gifts greater than $500 (n = 324). A two-tailed T-test
was used to compare all differences.
Results
Analysis of healthcare prescribers as a whole
In 2013, 1,122 (39.1%) of the 2,873 Medicare Part D prescribers in Washington DC included
in our analysis received gifts totaling $3.9 million. The remaining 1,750 (60.9%) prescribers
were considered non-gift recipients. Gifts ranged from a total of $7 to more than $200,000 per
prescriber. Payments of more than $200,000 to one individual were all monetary payments.
Gift recipients prescribed an average of 892 claims each, more than twice as many as the
389 claims per prescriber for non-gift recipients. Gift recipients submitted significantly more
claims per patient (8.8 vs. 6.5) and had a greater average cost per claim ($135 vs. $85). On
Pharmaceutical marketing and Medicare prescriptions
PLOS ONE | https://doi.org/10.1371/journal.pone.0186060 October 25, 2017 5 / 13
average, one of three prescriptions (33.5%) written by gift recipients was for a branded drug,
compared to one of four prescriptions (25.7%) written by non-gift recipients. All results were
significant (p<0.0001) (Table 2).
Analysis by specialty
In six specialties (Internal Medicine, Family Medicine, Obstetrics/Gynecology, Urology, Oph-
thalmology, and Dermatology), gift acceptance was associated with significantly increased
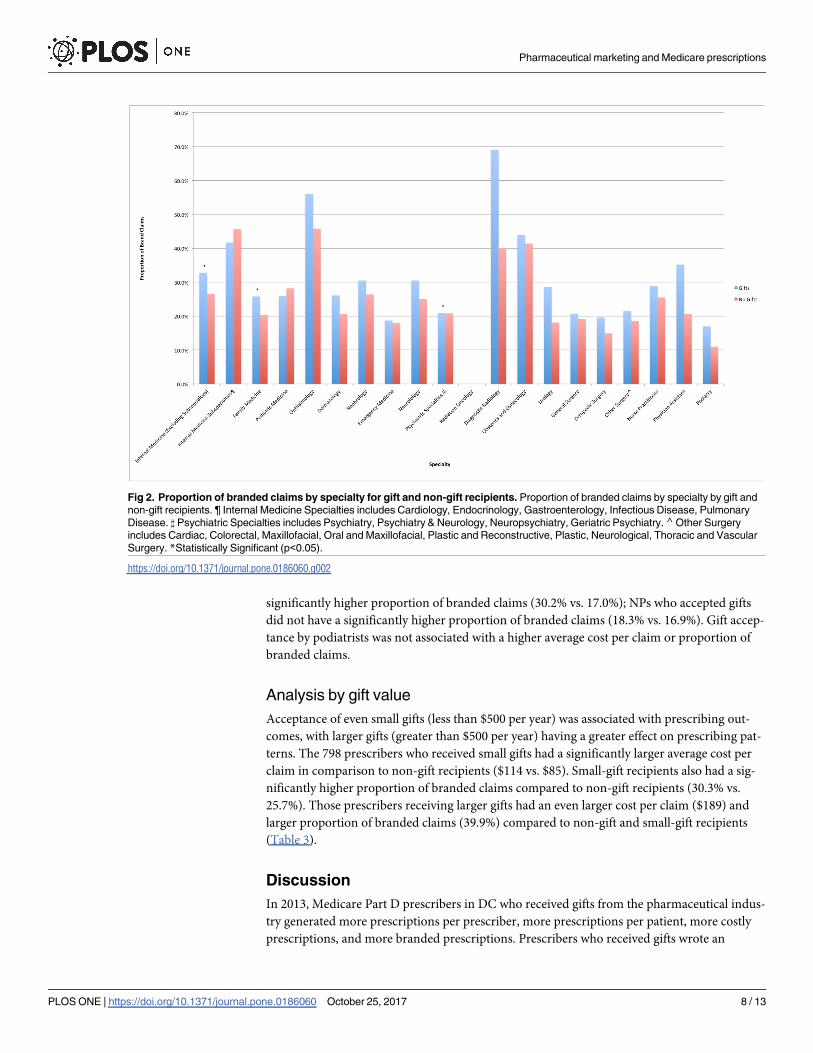
average cost per claim (Fig 1). For three of these specialties (Internal Medicine, Family Medi-
cine, and Ophthalmology), gift acceptance was also associated with a higher proportion of
branded claims (Fig 2). In eleven other specialties, gift acceptance was not associated with a
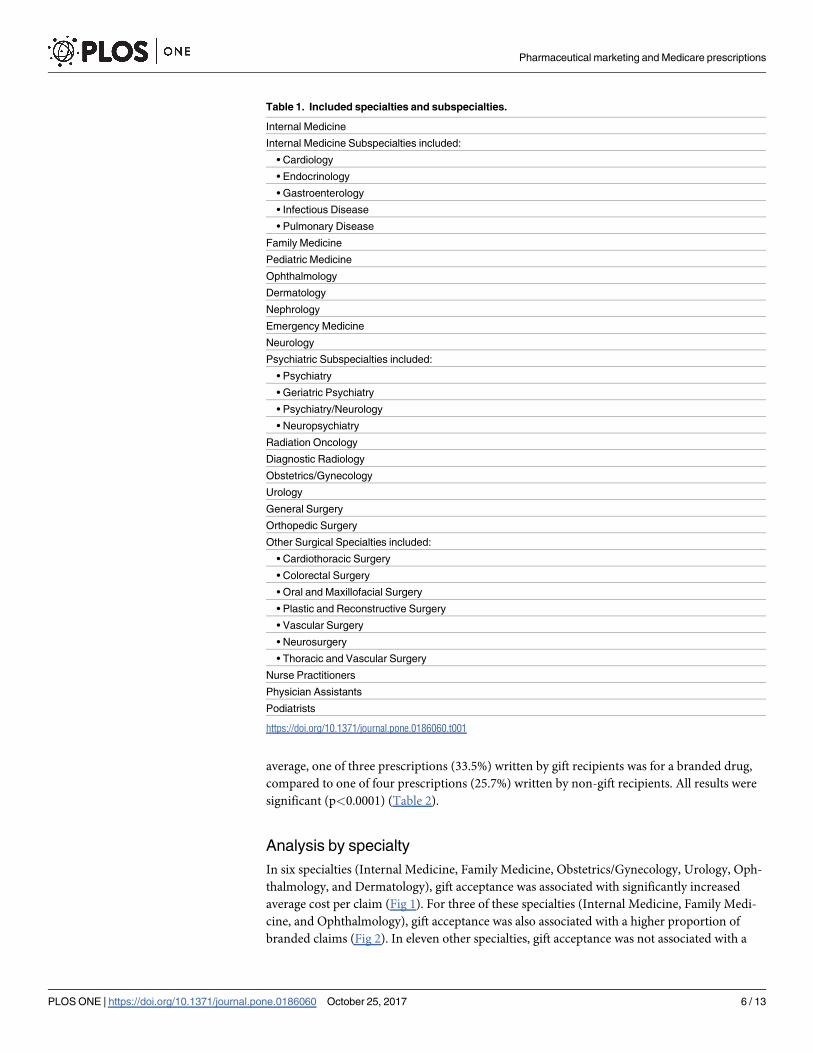
Table 1. Included specialties and subspecialties.
Internal Medicine
Internal Medicine Subspecialties included:
• Cardiology
• Endocrinology
• Gastroenterology
• Infectious Disease
• Pulmonary Disease
Family Medicine
Pediatric Medicine
Ophthalmology
Dermatology
Nephrology
Emergency Medicine
Neurology
Psychiatric Subspecialties included:
• Psychiatry
• Geriatric Psychiatry
• Psychiatry/Neurology
• Neuropsychiatry
Radiation Oncology
Diagnostic Radiology
Obstetrics/Gynecology
Urology
General Surgery
Orthopedic Surgery
Other Surgical Specialties included:
• Cardiothoracic Surgery
• Colorectal Surgery
• Oral and Maxillofacial Surgery
• Plastic and Reconstructive Surgery
• Vascular Surgery
• Neurosurgery
• Thoracic and Vascular Surgery
Nurse Practitioners
Physician Assistants
Podiatrists
https://doi.org/10.1371/journal.pone.0186060.t001
Pharmaceutical marketing and Medicare prescriptions
PLOS ONE | https://doi.org/10.1371/journal.pone.0186060 October 25, 2017 6 / 13
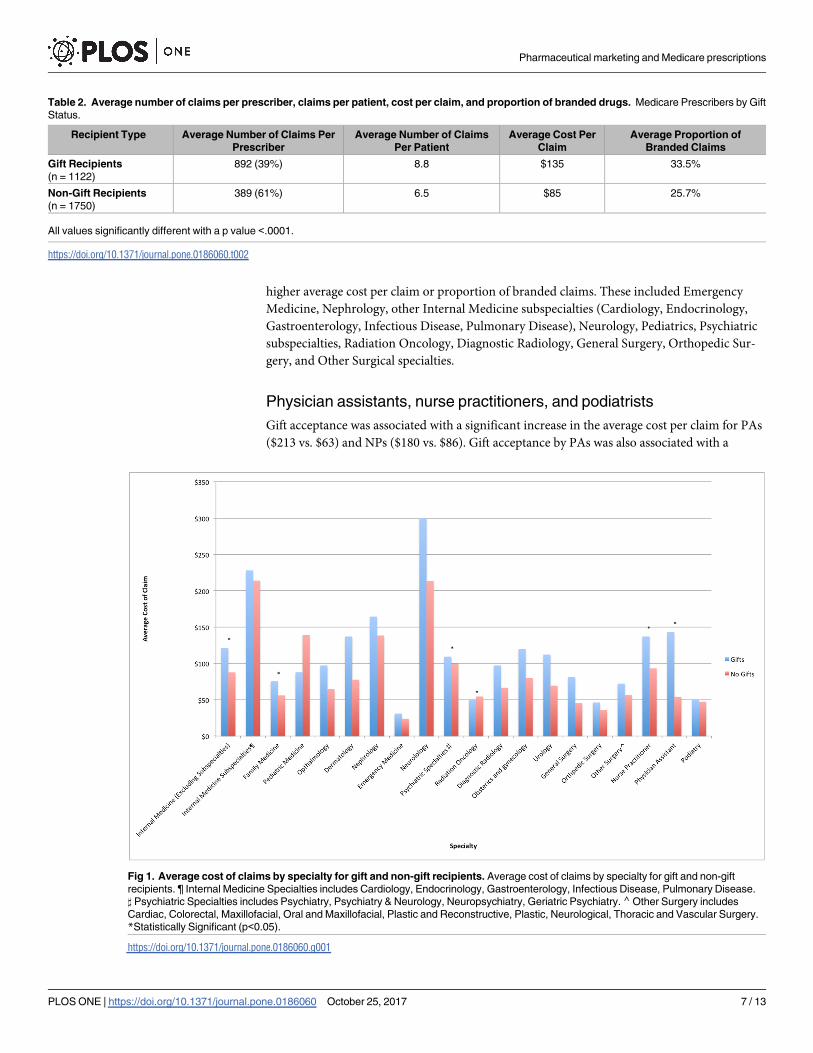
higher average cost per claim or proportion of branded claims. These included Emergency
Medicine, Nephrology, other Internal Medicine subspecialties (Cardiology, Endocrinology,
Gastroenterology, Infectious Disease, Pulmonary Disease), Neurology, Pediatrics, Psychiatric
subspecialties, Radiation Oncology, Diagnostic Radiology, General Surgery, Orthopedic Sur-
gery, and Other Surgical specialties.
Physician assistants, nurse practitioners, and podiatrists
Gift acceptance was associated with a significant increase in the average cost per claim for PAs
($213 vs. $63) and NPs ($180 vs. $86). Gift acceptance by PAs was also associated with a
Table 2. Average number of claims per prescriber, claims per patient, cost per claim, and proportion of branded drugs. Medicare Prescribers by Gift
Status.
Recipient Type Average Number of Claims Per
Prescriber
Average Number of Claims
Per Patient
Average Cost Per
Claim
Average Proportion of
Branded Claims
Gift Recipients
(n = 1122)
892 (39%) 8.8 $135 33.5%
Non-Gift Recipients
(n = 1750)
389 (61%) 6.5 $85 25.7%
All values significantly different with a p value <.0001.
https://doi.org/10.1371/journal.pone.0186060.t002
Fig 1. Average cost of claims by specialty for gift and non-gift recipients. Average cost of claims by specialty for gift and non-gift
recipients. ¶ Internal Medicine Specialties includes Cardiology, Endocrinology, Gastroenterology, Infectious Disease, Pulmonary Disease.
] Psychiatric Specialties includes Psychiatry, Psychiatry & Neurology, Neuropsychiatry, Geriatric Psychiatry.⌃Other Surgery includes
Cardiac, Colorectal, Maxillofacial, Oral and Maxillofacial, Plastic and Reconstructive, Plastic, Neurological, Thoracic and Vascular Surgery.
*Statistically Significant (p<0.05).
https://doi.org/10.1371/journal.pone.0186060.g001
Pharmaceutical marketing and Medicare prescriptions
PLOS ONE | https://doi.org/10.1371/journal.pone.0186060 October 25, 2017 7 / 13
significantly higher proportion of branded claims (30.2% vs. 17.0%); NPs who accepted gifts
did not have a significantly higher proportion of branded claims (18.3% vs. 16.9%). Gift accep-
tance by podiatrists was not associated with a higher average cost per claim or proportion of
branded claims.
Analysis by gift value
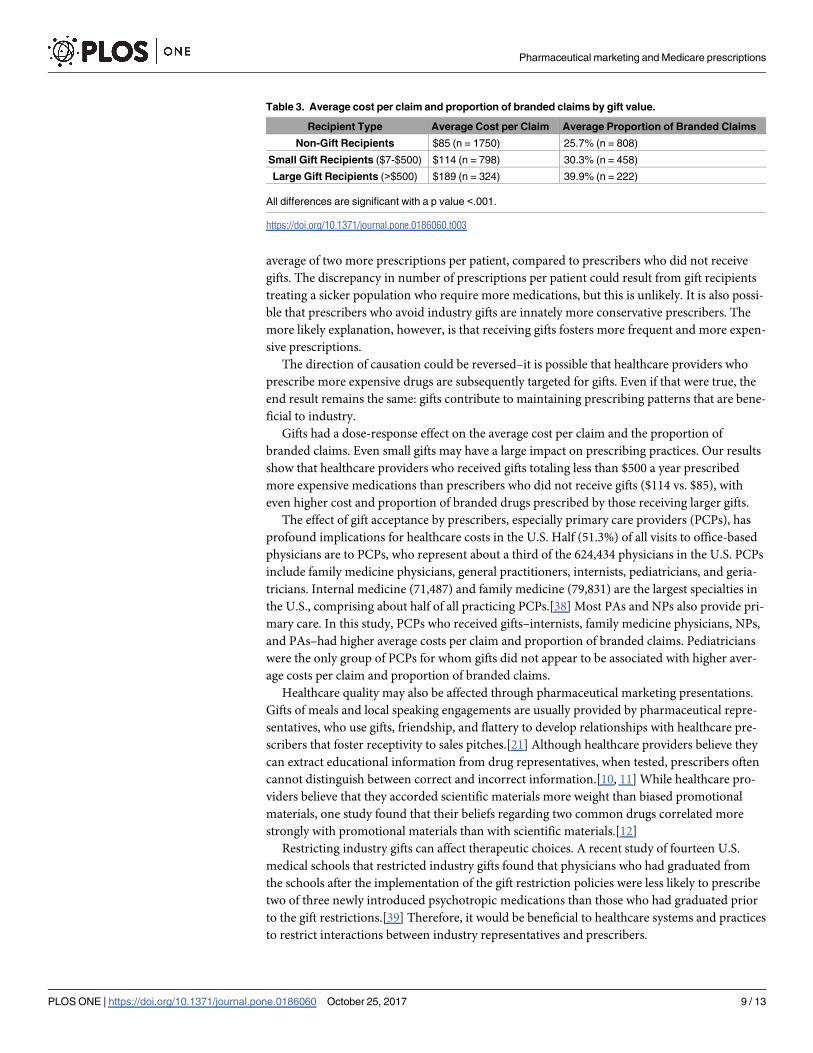
Acceptance of even small gifts (less than $500 per year) was associated with prescribing out-
comes, with larger gifts (greater than $500 per year) having a greater effect on prescribing pat-
terns. The 798 prescribers who received small gifts had a significantly larger average cost per
claim in comparison to non-gift recipients ($114 vs. $85). Small-gift recipients also had a sig-
nificantly higher proportion of branded claims compared to non-gift recipients (30.3% vs.
25.7%). Those prescribers receiving larger gifts had an even larger cost per claim ($189) and
larger proportion of branded claims (39.9%) compared to non-gift and small-gift recipients
(Table 3).
Discussion
In 2013, Medicare Part D prescribers in DC who received gifts from the pharmaceutical indus-
try generated more prescriptions per prescriber, more prescriptions per patient, more costly
prescriptions, and more branded prescriptions. Prescribers who received gifts wrote an
Fig 2. Proportion of branded claims by specialty for gift and non-gift recipients. Proportion of branded claims by specialty by gift and
non-gift recipients. ¶ Internal Medicine Specialties includes Cardiology, Endocrinology, Gastroenterology, Infectious Disease, Pulmonary
Disease. ] Psychiatric Specialties includes Psychiatry, Psychiatry & Neurology, Neuropsychiatry, Geriatric Psychiatry. ⌃Other Surgery
includes Cardiac, Colorectal, Maxillofacial, Oral and Maxillofacial, Plastic and Reconstructive, Plastic, Neurological, Thoracic and Vascular
Surgery. *Statistically Significant (p<0.05).
https://doi.org/10.1371/journal.pone.0186060.g002
Pharmaceutical marketing and Medicare prescriptions
PLOS ONE | https://doi.org/10.1371/journal.pone.0186060 October 25, 2017 8 / 13
average of two more prescriptions per patient, compared to prescribers who did not receive
gifts. The discrepancy in number of prescriptions per patient could result from gift recipients
treating a sicker population who require more medications, but this is unlikely. It is also possi-
ble that prescribers who avoid industry gifts are innately more conservative prescribers. The
more likely explanation, however, is that receiving gifts fosters more frequent and more expen-
sive prescriptions.
The direction of causation could be reversed–it is possible that healthcare providers who
prescribe more expensive drugs are subsequently targeted for gifts. Even if that were true, the
end result remains the same: gifts contribute to maintaining prescribing patterns that are bene-
ficial to industry.
Gifts had a dose-response effect on the average cost per claim and the proportion of
branded claims. Even small gifts may have a large impact on prescribing practices. Our results
show that healthcare providers who received gifts totaling less than $500 a year prescribed
more expensive medications than prescribers who did not receive gifts ($114 vs. $85), with
even higher cost and proportion of branded drugs prescribed by those receiving larger gifts.
The effect of gift acceptance by prescribers, especially primary care providers (PCPs), has
profound implications for healthcare costs in the U.S. Half (51.3%) of all visits to office-based
physicians are to PCPs, who represent about a third of the 624,434 physicians in the U.S. PCPs
include family medicine physicians, general practitioners, internists, pediatricians, and geria-
tricians. Internal medicine (71,487) and family medicine (79,831) are the largest specialties in
the U.S., comprising about half of all practicing PCPs.[38] Most PAs and NPs also provide pri-
mary care. In this study, PCPs who received gifts–internists, family medicine physicians, NPs,
and PAs–had higher average costs per claim and proportion of branded claims. Pediatricians
were the only group of PCPs for whom gifts did not appear to be associated with higher aver-
age costs per claim and proportion of branded claims.
Healthcare quality may also be affected through pharmaceutical marketing presentations.
Gifts of meals and local speaking engagements are usually provided by pharmaceutical repre-
sentatives, who use gifts, friendship, and flattery to develop relationships with healthcare pre-
scribers that foster receptivity to sales pitches.[21] Although healthcare providers believe they
can extract educational information from drug representatives, when tested, prescribers often
cannot distinguish between correct and incorrect information.[10, 11] While healthcare pro-
viders believe that they accorded scientific materials more weight than biased promotional
materials, one study found that their beliefs regarding two common drugs correlated more
strongly with promotional materials than with scientific materials.[12]
Restricting industry gifts can affect therapeutic choices. A recent study of fourteen U.S.
medical schools that restricted industry gifts found that physicians who had graduated from
the schools after the implementation of the gift restriction policies were less likely to prescribe
two of three newly introduced psychotropic medications than those who had graduated prior
to the gift restrictions.[39] Therefore, it would be beneficial to healthcare systems and practices
to restrict interactions between industry representatives and prescribers.
Table 3. Average cost per claim and proportion of branded claims by gift value.
Recipient Type Average Cost per Claim Average Proportion of Branded Claims
Non-Gift Recipients $85 (n = 1750) 25.7% (n = 808)
Small Gift Recipients ($7-$500) $114 (n = 798) 30.3% (n = 458)
Large Gift Recipients (>$500) $189 (n = 324) 39.9% (n = 222)
All differences are significant with a p value <.001.
https://doi.org/10.1371/journal.pone.0186060.t003
Pharmaceutical marketing and Medicare prescriptions
PLOS ONE | https://doi.org/10.1371/journal.pone.0186060 October 25, 2017 9 / 13
Strengths and limitations
The strength of this study lies in combining publicly available information from CMS Open
Payments with information from DC’s AccessRx program. Each database had only partial
information on 2013, but by combining the databases, we could track payments for the full
year. While disclosure of payments in the CMS Open Payments database is limited to physi-
cians and teaching hospitals, DC’s AccessRx program is far more comprehensive, tracking
pharmaceutical spending on PAs, nurses, APNs, pharmacists, non-teaching hospitals, profes-
sional organizations, and universities. In addition, Washington, DC is the only jurisdiction in
the U.S. that tracks expenditures on pharmaceutical advertising and salaries for employees of
pharmaceutical companies.
One of the limitations of this study is the inability to establish causation. Our study also
cannot predict prescribing patterns across different patient demographics. Our analysis is lim-
ited to patients enrolled in the Medicare Part D prescription drug program, the vast majority
of whom are over age 65. Most clinicians who see patients covered by Medicare Part D would
also be seeing patients covered by other insurance programs. It is possible that healthcare pro-
viders who see Medicare patients prescribe differently to patients with private insurance, cov-
ered under Medicaid (the Federal program for individuals living in poverty), or without
insurance. It is also possible that prescribers who do not see Medicare patients prescribe differ-
ently than prescribers who see Medicare patients. Both scenarios seem unlikely.
Within the CMS Medicare Provider Utilization and Payment database, prescribers who
generate fewer than eleven claims or who have fewer than eleven Medicare patients are
excluded. Thus, the data analyzed accounts for 86.8% of claims and 78.1% of total costs in the
Medicare Part D program. Comparing gift recipient information resulted in approximately
23.2% of gift recipients being excluded from the analysis of the average number of claims per
patient, and 48.2% of gift recipients being excluded from the analysis of the proportion of
branded drugs. It is possible that excluded individuals differ from included individuals but this
is unlikely. The reporting limits in the programs may result in an underestimation of gifts to
prescribers.
We did not assess the health status of patient populations. However, gift recipients were
compared to non-gift recipients within specialties, so differences in availability of generic
drugs for conditions treated in different specialties should not be a concern.
Despite the study limitations listed above, our data supports the basic premise that industry
gifts influence the prescribing patterns of healthcare providers.
Our study aligns with a national report from ProPublica that linked 2014 Medicare Part D
data with Open Payments data to examine the effect of gifts on prescribing for 150,323 physi-
cians in five specialties–internal medicine, family medicine, cardiology, psychiatry, and oph-
thalmology. In all of these specialties, physicians who received any gifts from pharmaceutical
or device manufacturers prescribed a higher proportion of branded drugs than physicians who
did not receive gifts. Physicians who received industry gifts were two to three times more likely
to prescribe branded drugs at very high rates compared to others in the same specialty. ProPu-
blica also analyzed gifts by type of payment and found that physicians who received speaking
payments had the highest rates of branded drug prescribing compared to those who received
other types of gifts. However, physicians who received a meal increased their branded drug
prescribing when compared to physicians who did not receive gifts.[5]
This study also aligns with a national study that examined 725,169 physicians who pre-
scribed medications through Medicare Part D and found that 341,644 physicians (47.1%) were
reported as receiving gifts in Open Payments. Being in the top quintile of gift recipients was
associated with increased cost per patient and proportion of branded prescriptions.[4]
Pharmaceutical marketing and Medicare prescriptions
PLOS ONE | https://doi.org/10.1371/journal.pone.0186060 October 25, 2017 10 / 13
The association between prescription frequency and cost suggests that industry influence is
related to prescription drug costs. This poses both a financial burden on the healthcare system
and individual patients. Further, this influence may have adverse public health implications,
including polypharmacy and overtreatment that may decrease the quality of care through
adverse drug reactions.
Conclusions
In Washington, DC, healthcare providers who received gifts of any size from pharmaceutical
companies generated more prescriptions per patient, more costly prescriptions, and a higher
proportion of branded prescriptions compared to healthcare providers who did not receive
gifts. Our study confirms and expands upon previous work showing that industry gifts are
associated with more expensive prescriptions and more branded prescriptions. The impact of
pharmaceutical marketing could have a profound effect on healthcare costs. Because DC is
unique in the breadth of data it gathers on non-physician prescribers and costs associated with
marketing personnel, this study is more robust than any state could do and demonstrates the
impact of marketing on healthcare costs in DC. We recommend further research on the influ-
ence of pharmaceutical marketing on patient care. We also recommend further education for
healthcare providers about the influence of industry marketing on prescribing behavior. Fed-
eral and state agencies are encouraged to maintain and further develop reporting standards for
industry marketing activities. Continued research on the influence of industry marketing on
prescribing practices, continuous and robust pharmaceutical marketing restrictions, and mon-
itoring and expanding public access to data is needed to mitigate conflicts of interest in health-
care. State and Federal governments should consider restricting pharmaceutical marketing on
the grounds that it compromises public health. Industry gifts influence prescribing behavior,
may have adverse public health implications, and should be banned.
Acknowledgments
We would like to acknowledge Joy Eckert for assistance with manuscript preparation.
Author Contributions
Conceptualization: Susan F. Wood, Adriane Fugh-Berman.
Data curation: Joanna Podrasky, Meghan A. McMonagle, Tyler Bysshe.
Formal analysis: Susan F. Wood, Joanna Podrasky, Meghan A. McMonagle, Tyler Bysshe.
Funding acquisition: Susan F. Wood.
Methodology: Susan F. Wood, Tyler Bysshe, Adriane Fugh-Berman.
Project administration: Joanna Podrasky, Meghan A. McMonagle, Alycia Hogenmiller.
Supervision: Susan F. Wood, Adriane Fugh-Berman.
Writing – original draft: Susan F. Wood, Joanna Podrasky, Meghan A. McMonagle, Janani
Raveendran, Alycia Hogenmiller, Adriane Fugh-Berman.
Writing – review & editing: Susan F. Wood, Joanna Podrasky, Meghan A. McMonagle, Janani
Raveendran, Tyler Bysshe, Alycia Hogenmiller, Adriane Fugh-Berman.
Pharmaceutical marketing and Medicare prescriptions
PLOS ONE | https://doi.org/10.1371/journal.pone.0186060 October 25, 2017 11 / 13
References1. Chren MM, Landefeld CS. Physicians’ behavior and their interactions with drug companies: A controlled
study of physicians who requested additions to a hospital drug formulary. JAMA. 1994; 271(9):684–9.
PMID: 8309031
2. Lurie N, Rich EC, Simpson DE, Meyer J, Schiedermayer DL, Goodman JL, et al. Pharmaceutical repre-
sentatives in academic medical centers: interaction with faculty and housestaff. J Gen Intern Med.
1990; 5(3):240–3. PMID: 2341925.
3. Wazana A. Physicians and the pharmaceutical industry: is a gift ever just a gift? JAMA. 2000; 283
(3):373–80. PMID: 10647801.
4. Perlis RH, Perlis CS. Physician Payments from Industry Are Associated with Greater Medicare Part D
Prescribing Costs. PLoS One. 2016; 11(5):e0155474. https://doi.org/10.1371/journal.pone.0155474
PMID: 27183221.
5. Ornstein C, Jones RG, Tigas M. Now there’s proof: Docs who get company cash tend to prescribe more
brand-name meds ProPublica: Accessed: May 2, 2017; 2016. https://www.propublica.org/article/
doctors-who-take-company-cash-tend-to-prescribe-more-brand-name-drugs.
6. Sigworth SK, Nettleman MD, Cohen GM. Pharmaceutical branding of resident physicians. JAMA. 2001;
286(9):1024–5. PMID: 11559285.
7. McKinney WP, Schiedermayer DL, Lurie N, Simpson DE, Goodman JL, Rich EC. Attitudes of internal
medicine faculty and residents toward professional interaction with pharmaceutical sales representa-
tives. JAMA. 1990; 264(13):1693–7. PMID: 2398609.
8. Steinman MA, Shlipak MG, McPhee SJ. Of principles and pens: Attitudes and practices of medicine
housestaff toward pharmaceutical industry promotions. Am J Med. 2001; 110(7):551–7. PMID:
11347622
9. Dana J, Loewenstein G. A social science perspective on gifts to physicians from industry. JAMA. 2003;
290(2):252–5. https://doi.org/10.1001/jama.290.2.252 PMID: 12851281
10. Shaughnessy AF, Slawson DC, Bennett JH. Separating the wheat from the chaff: identifying fallacies in
pharmaceutical promotion. J Gen Intern Med. 1994; 9(10):563–8. PMID: 7823228
11. Molloy W, Strang D, Guyatt G, Lexchin J, Bedard M, Dubois S, et al. Assessing the quality of drug detail-
ing. J Clin Epidemiol. 2002 Aug; 55(8):825–32. PMID: 12384198
12. Avorn J, Chen M, Hartley R. Scientific versus commercial sources of influence on the prescribing
behavior of physicians. Am J Med. 1982; 73(1):4–8. PMID: 7091173
13. National Ambulatory Medical Care Survey (NAMCS): Center for Disease Control; [cited 2017 Jul 14].
https://www.healthdata.gov/dataset/national-ambulatory-medical-care-survey-namcs.
14. Cipher DJ, Hooker RS, Guerra P. Prescribing trends by nurse practitioners and physician assistants in
the United States. J Am Acad Nurse Pract. 2006; 18(6):291–6. https://doi.org/10.1111/j.1745-7599.
2006.00133.x PMID: 16719848.
15. IMS Health Study: U.S. Drug Spending Growth Reaches 8.5 Percent in 2015 [Internet]. Parsippany, NJ:
IMS Health; 2016 [cited 2016 May 1]. https://www.imshealth.com/en/about-us/news/ims-health-study-
us-drug-spending-growth-reaches-8.5-percent-in-2015
16. Blunt E. The Influence of Pharmaceutical Company Sponsored Educational Programs, Promotions and
Gifts on the Self-Reported Prescribing Beliefs and Practices of Certified Nurse Practitioners in Three
States: Drexel University; 2004.
17. Ladd EC, Mahoney DF, Emani S. "Under the radar": nurse practitioner prescribers and pharmaceutical
industry promotions. Am J Manag Care. 2010; 16(12):e358–62. PMID: 21291293
18. Grundy Q, Bero L, Malone R. Interactions between non-physician clinicians and industry: A systematic
review. PLoS Medicine. 2013 Nov; 10(11):e1001561. https://doi.org/10.1371/journal.pmed.1001561
PMID: 24302892
19. Mather C. The pipeline and the porcupine: Alternate metaphors of the physician–industry relationship.
Soc Sci Med. 2005; 60:1323–34. https://doi.org/10.1016/j.socscimed.2004.07.011 PMID: 15626527
20. Sah S. Conflicts of interest and your physician: psychological processes that cause unexpected
changes in behavior. J Law Med Ethics. 2012; 40(3):482–7. https://doi.org/10.1111/j.1748-720X.2012.
00680.x PMID: 23061575
21. Fugh-Berman A, Ahari S. Following the script: How drug reps make friends and influence doctors. PLoS
Medicine. 2007; 4(4):e150–0625. https://doi.org/10.1371/journal.pmed.0040150 PMID: 17455991
22. DeJong C, Aguilar T, Tseng CW, Lin GA, Boscardin WJ, Dudley RA. Pharmaceutical Industry-Spon-
sored Meals and Physician Prescribing Patterns for Medicare Beneficiaries. JAMA Intern Med. 2016;
176(8):1114–10. https://doi.org/10.1001/jamainternmed.2016.2765 PMID: 27322350.
Pharmaceutical marketing and Medicare prescriptions
PLOS ONE | https://doi.org/10.1371/journal.pone.0186060 October 25, 2017 12 / 13
23. Marshall DC, Jackson ME, Hattangadi-Gluth JA. Disclosure of Industry Payments to Physicians: An
Epidemiologic Analysis of Early Data From the Open Payments Program. Mayo Clin Proc. 2016; 91
(1):84–96. https://doi.org/10.1016/j.mayocp.2015.10.016 PMID: 26763512.
24. Iyer S, Derman P, Sandhu HS. Orthopaedics and the Physician Payments Sunshine Act: An Examina-
tion of Payments to U.S. Orthopaedic Surgeons in the Open Payments Database. J Bone Joint Surg
Am. 2016; 98(5):e18. https://doi.org/10.2106/JBJS.O.00343 PMID: 26935466.
25. Fleischman W, Ross JS, Melnick ER, Newman DH, Venkatesh AK. Financial Ties Between Emergency
Physicians and Industry: Insights From Open Payments Data. Ann Emerg Med. 2016; 68(2):153–8.e4.
https://doi.org/10.1016/j.annemergmed.2016.01.014 PMID: 26973175.
26. Tierney NM, Saenz C, McHale M, Ward K, Plaxe S. Industry Payments to Obstetrician-Gynecologists:
An Analysis of 2014 Open Payments Data. Obstet Gynecol. 2016; 127(2):376–82. https://doi.org/10.
1097/AOG.0000000000001270 PMID: 26942368.
27. Jairam V, Yu JB. Examination of Industry Payments to Radiation Oncologists in 2014 Using the Centers
for Medicare and Medicaid Services Open Payments Database. Int J Radiat Oncol Biol Phys. 2016; 94
(1):19–26. https://doi.org/10.1016/j.ijrobp.2015.09.004 PMID: 26547386.
28. Shalowitz DI, Spillman MA, Morgan MA. Interactions with industry under the Sunshine Act: an example
from gynecologic oncology. Am J Obstet Gynecol. 2016; 214(6):703–7. https://doi.org/10.1016/j.ajog.
2016.02.035 PMID: 26902988.
29. Svider PF, Bobian M, Lin HS, Setzen M, Baredes S, Eloy JA, et al. Are industry financial ties associated
with greater scholarly impact among academic otolaryngologists? Laryngoscope. 2016. https://doi.org/
10.1002/lary.26027 PMID: 27114324.
30. Parikh K, Fleischman W, Agrawal S. Industry Relationships With Pediatricians: Findings From the
Open Payments Sunshine Act. Pediatrics. 2016; 137(6). https://doi.org/10.1542/peds.2015-4440
PMID: 27244857.
31. Yeh JS, Franklin JM, Avorn J, Landon J, Kesselheim AS. Association of Industry Payments to Physi-
cians With the Prescribing of Brand-name Statins in Massachusetts. JAMA Intern Med. 2016; 176
(6):763–8. https://doi.org/10.1001/jamainternmed.2016.1709 PMID: 27159336.
32. Staton T. Look out, pharma marketers. California may turn off speaking fees and ban pharma gifts.:
FiercePharma; 2017 [cited 2017 Jul 19]. http://www.fiercepharma.com/marketing/look-out-pharma-
marketers-california-just-advanced-a-gift-ban-bill.
33. SafeRx Amendment Act of 2008. Sect. 303 (2008).
34. Pharmaceutical Research and Manufacturers of America. Code on Interactions with Healthcare Profes-
sionals 2008 [cited 2017 Jul 14]. http://phrma-docs.phrma.org/sites/default/files/pdf/phrma_marketing_
code_2008-1.pdf.
35. Medicare Provider Utilization and Payment Data: U.S. Centers for Medicare and Medicaid Services;
2016 Dec 20 [cited 2017 Jul 14]. https://www.cms.gov/Research-Statistics-Data-and-Systems/
Statistics-Trends-and-Reports/Medicare-Provider-Charge-Data/index.html.
36. District of Columbia Official Code: AccessRx Act of 2004. [cited 2016 Aug 18]. http://doh.dc.gov/sites/
default/files/dc/sites/doh/publication/attachments/AccessRx-Act-of-2004.pdf.
37. Medicare, Medicaid, Children’s Health Insurance Programs; Transparency Reports and Reporting of
Physician Ownership or Investment Interests In: Department of Health and Human Services Centers for
Medicare and Medicaid Services, editor.: Federal Register; 2013. p. 9458–528.
38. The Number of Practicing Primary Care Physicians in the United States. Rockville, MD: Agency for
Healthcare Research and Quality; 2014 Oct [cited 2016 April 25]. http://www.ahrq.gov/research/
findings/factsheets/primary/pcwork1/index.html.
39. King M, Essick C, Bearman P, Ross JS. Medical school gift restriction policies and physician prescribing
of newly marketed psychotropic medications: difference-in-differences analysis. BMJ. 2013; 346:f264.
https://doi.org/10.1136/bmj.f264 PMID: 23372175.
Pharmaceutical marketing and Medicare prescriptions
PLOS ONE | https://doi.org/10.1371/journal.pone.0186060 October 25, 2017 13 / 13


![Impact of Pharmaceutical Care on Self-Administration of ... · The influence of pharmaceutical care on asthma, dyslipidemia, hypertension, and diabetes has been investigated [4]-[10],](https://img.pdfslide.us/doc/110x75/5ec717abcfc7895e4b1099ab/impact-of-pharmaceutical-care-on-self-administration-of-the-influence-of-pharmaceutical.jpg)