Embed Size (px)
Citation preview
Influence of particle size on the mechanism of dry granularrun-up on a rigid barrier
C. W. W. NG*, C. E. CHOI*{, L. H. D. LIU*, Y. WANG{, D. SONG* and N. YANG*
Granular flows comprise a wide range of particle sizes. The particle size governs the degree of graincontact and inertial stresses in the flow, thus influencing the mechanism of impact against a rigidbarrier. The current commonly adopted design approaches estimating the run-up height are based onthe energy principle and the momentum approach. However, both neglect the discrete nature of flows,and do not consider the effects of particle size on the flow regime. In this study, physical experimentsusing different sizes of monodispersed sand and glass spheres were carried out to investigate therun-up mechanisms on a rigid barrier. Results have shown that the run-up height is not only dependenton the Froude number of the flow before impact, but also on the particle size which principally governsthe mechanism of run-up. Inertial flows comprising large particles (the Savage number (NSav) > 0·1)profoundly transfer momentum vertically upon impact, resulting in significant grain saltation and highrun-up heights. In contrast, frictional flows comprising fine particles (NSav < 0·1) tend to pile up withoutsignificant run-up due to a high degree of contact stresses. This implies that for flows with coarseparticles entrained at the front of the flow by way of particle-size segregation, the run-up height isprincipally influenced by large particles that accumulate at the flow front.
KEYWORDS: geophysics; landslides; model tests
ICE Publishing: all rights reserved
NOTATIONE modulus of elasticity of solid particlesEf final energy of the flow impacting the rigid barrier (J)Ei initial energy of the flow approaching the rigid barrier (J)e coefficient of restitution of solid particlesg gravitational acceleration (m/s2)h characteristic flow depth (m)hf run-up height (m)L length of the block (m)m mass of the flow (kg)
NFr the Froude numberNSav the Savage number
P mean normal stress (Pa)PB normal stress applied at the boundary of the shear
region (Pa)s factor describing the angularity or sphericity of the solid
particlesT travel time of the flowu speed of an upstream propagating bore from the rigid
barrier (m/s)v bulk flow velocity (m/s)
hv2i1/2 translational velocity from particle interaction (m/s)hw2i1/2 rotational velocity from particle interaction (m/s)
γ̇ shear rate (1/s)δ characteristic particle diameter (m)θ channel inclination (deg)μ surface coefficient of frictionρ bulk density of the flow (kg/m3)ρf density of debris flow in contact with the barrier (kg/m3)
ρi density of upstream flow (kg/m3)ρP solid density of the granular material (kg/m3)σij mean normal stress tensorτij stress tensorτij deviatoric stress (Pa)υ solids fraction of the flow of solid particlesϕ dynamic friction angle of the flow material (deg)
INTRODUCTIONGeophysical flows comprise a wide range of particle sizes(Jakob et al., 2005) that vary spatially within the flow mass,by way of processes such as particle-size segregation (Gray &Chugunov, 2006; Johnson et al., 2012). Pouliquen (1999)demonstrated that the flow dynamics parameters are sen-sitive to the normalised particle size δ/h. The particle size ofthe sediment flow principally governs the grain stresses andhence its flow dynamics (Iverson, 1997; McArdell et al.,2007; Bowman et al., 2010) as described by the Savagenumber (Savage & Hutter, 1989)
Nsav ¼ γ̇2δ2
gh tan ϕð1Þ
where δ is the characteristic particle diameter; g is the gravit-ational acceleration; h is the flow depth; ϕ is the dynamicfriction angle of the flow and γ̇ is the depth-averaged shearrate. To estimate the shear rate γ̇, the velocity profile along thedirection orthogonal to the bedwas assumed to be linear. Theshear rate is calculated as γ̇ ¼ dv=dh (Kaitna et al., 2007; Hsuet al., 2014), where v is the velocity at the flow surface and h isthe flow height. When NSav< 0·1, the grain contact stressestend to dominate, whereas when NSav> 0·1 the inertial grainstresses tend to dominate (Savage & Hutter, 1989).
To intercept geophysical flows, structural countermea-sures such as rigid barriers (Lo, 2000) are often installedalong the predicted flow path. Flows impacting rigid barrierstend to transfer momentum vertically into run-up,potentially overspilling the barrier (Jiang & Zhao, 2015;
*Department of Civil and Environmental Engineering, TheHong Kong University of Science and Technology, Kowloon,Hong Kong.{The HKUST Jockey Club Institute for Advanced Study,Kowloon, Hong Kong.{Department of Architecture and Civil Engineering, CityUniversity of Hong Kong, Kowloon, Hong Kong.
Manuscript received 31 October 2016; first decision 10 February2017; accepted 11 February 2017.Published online at www.geotechniqueletters.com on 2 March2017.
Ng, C. W. W. et al. (2017) Géotechnique Letters 7, 79–89, http://dx.doi.org/10.1680/jgele.16.00159
79
Downloaded by [ HKUST Library] on [26/09/17]. Copyright © ICE Publishing, all rights reserved.
Ng et al., 2016; Choi et al., 2016b). To control overspilling,it is imperative to understand the run-up mechanicsholistically and be able to predict maximum run-upheights (Kwan, 2012).Run-up mechanisms have been investigated using
small-scale flume modelling for uniform single-phase flows(Chu et al., 1995; Mancarella & Hungr, 2010; Choi et al.,2015). However, the aforementioned studies adopt mono-disperse dry granular or pure water flows for studying therun-up mechanisms, without investigating the influence ofparticle size itself. Explicit consideration of particle size effectis important as it influences the energy attenuation duringimpact (Ashwood & Hungr, 2016; Koo et al., 2016; Choiet al., 2016a). Jiang et al. (2015) have adopted three types ofnatural granular materials to study the effects of dynamicinternal friction angle and particle diameter on the impactprocess. Results demonstrate that particle characteristics haveprofound effects on the impact force. Choi et al. (2016a) haveinvestigated the influence of flows with different particle sizesimpacting slit structures using glass spheres, demonstratingthat large grains resulted in significant saltation, implyingthat the particle size is an important parameter to considerfor flow–structure interaction. Two commonly adoptedapproaches for predicting run-up have been proposed byJóhannesson et al. (2009) and Kwan (2012). The details areprovided in Appendix 1. The former, an energy-basedapproach, neglecting energy losses is given as follows
hfh¼ 1þ v2
2ghð2Þ
where hf is the run-up height, h the flow depth, v the flowvelocity and g is the acceleration due to gravity. Thedimensionless group v2/(ghcosθ) is the Froude number NFr,indicating the ratio of inertial to gravitational forces. Valuesof NFr less than and greater than unity characterise sub-critical and supercritical flows, respectively. Another com-monly adopted approach proposed by Jóhannesson et al.(2009) is based on conservation of mass and momentum andis given as follows
ρfρi
hfhi
� �2
� hfhi
� 1þ ρfhfρihi
� ��1
�2N2Fr ¼ 0 ð3Þ
where ρf and ρi are the density of debris flow in contact withthe barrier and upstream flow, respectively. The details areprovided in Appendix 1.
In this study, a series of flume experiments were carriedout to create dry granular flows to study the effects ofparticle size on run-up mechanisms, and to investigate thevalidity of using continuum mechanics in predicting therun-up height on a rigid barrier.
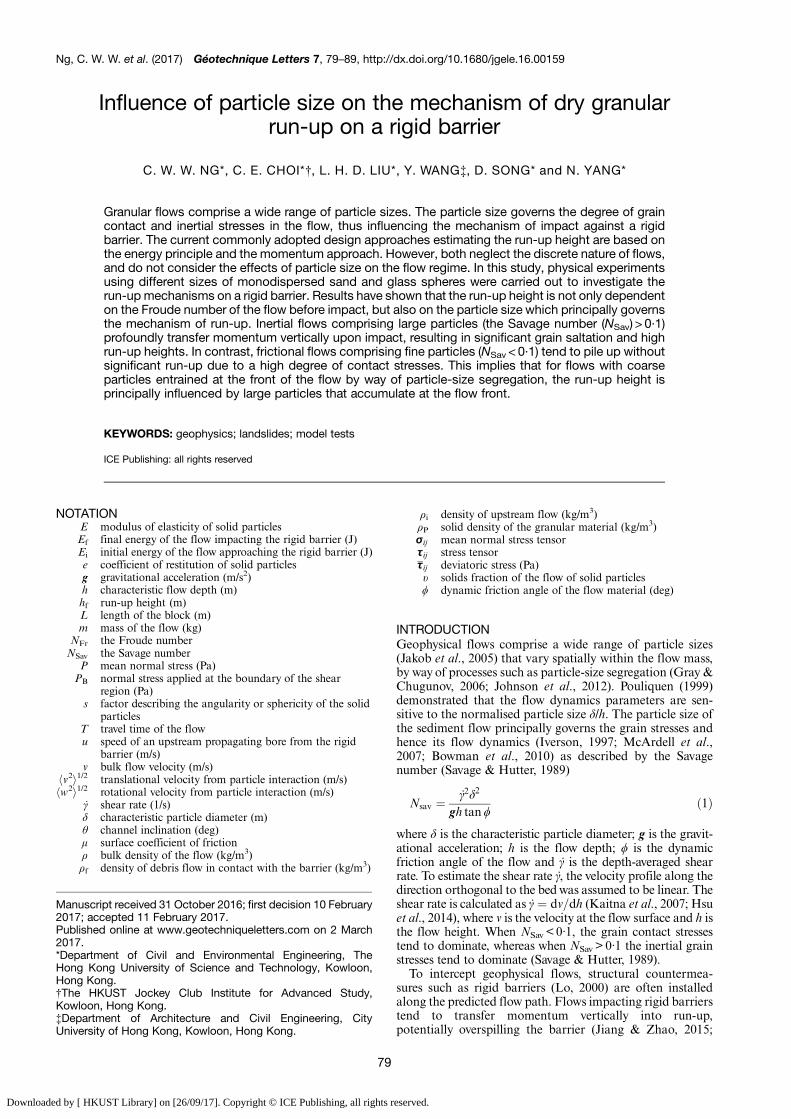
FLUME MODELLINGThe 5 m long rectangular flume model (Fig. 1) (Choi et al.,2014) was adopted for this study. The channel has a widthand depth of 0·2 and 0·5 m, respectively. The channel isinclinable from 23° to 40° using an overhead crane in thelaboratory. The hopper at the top of the flume has a maxi-mum volume of 0·06 m3.
ScalingHübl et al. (2009), Zhou & Ng (2010), Armanini (2015) andIverson (2015) identified the Froude number as a keydimensionless parameter for scaling debris–structure inter-action. Also of significance is the ratio between inertialstress and contact stress expressed by Nsav (Savage, 1984).To guide the experiment design and to ascertain the govern-ing parameters, a dimensional analysis is provided inAppendix 2.
InstrumentationThe flume model is instrumented with photoconductivesensors (Silonex NORP12 cadmium sulfide), which areinstalled at regular intervals of 500 mm at the base of thechannel. A laser sensor (model: Wenglor YT44MGV) wasinstalled on the top of the flume to measure the flow depthprofile just upstream of the barrier. Two high-speed cameras(model: Mikrotron MotionBLITZ EoSens mini2) were usedto capture the impact kinematics. The high-speed camerascaptured images at 640 frames per second at a resolution of1400× 1600. The high-speed camera settings enabled thevelocity fields to be interpreted using particle image vel-ocimetry (PIV) (White et al., 2003). Figure 1 shows a sideview of the instrumentation set-up.
Test programmeTwo types of granular materials were investigated, specifi-cally Leighton Buzzard sand and glass spheres. Fractions E(0·15 mm) and C (0·6 mm) and glass spheres with particle
Laser sensor
Hopper
High-speed camera
Photoconductive sensor
Note: All dimensions in mm
Gate
Flow direction200
500
500
Rigid barrier H
θ
Fig. 1. Side view of the test set-up
Ng, Choi, Liu et al.80
Downloaded by [ HKUST Library] on [26/09/17]. Copyright © ICE Publishing, all rights reserved.

diameters of 3·0, 10·0, 23·0 and 40·0 mm were adopted. Thedynamic friction angle of the test material was measuredby means of tilting tests referring to Pudasaini & Hutter(2007), Hungr (2008), Mancarella & Hungr (2010). Thegranular material was deposited on a 0·1 m high straight-faced pile on the channel base. The channel was graduallyinclined to tilt the face of the pile at the pace of a fraction of adegree. A light impact was applied onto the channel sideat each step. The dynamic friction angle was recordedas the slope angle of face of the pile when a layer of granularmaterial was observed slowly flowing on the pile face follow-ing the agitation. Since the dynamic friction angle dependson the properties of the granular material, the dynamic fric-tion angle varies for different granular materials (Podczeck& Mia, 1996; Mair et al., 2002). The tilting tests indicatedthat larger particle size have lower dynamic friction angles,whereas the smallest particle size shows the highest dynamicfriction angle. This is in agreement with Tan & Newton(1990) and Podczeck & Mia (1996). The material propertiesare summarised in Table 1. The Froude conditions of theflow before impacting the rigid barrier were varied by adjust-ing the channel inclination. To characterise the Froude con-dition andNSav flows, control tests (Fig. 2(a)) without a rigidbarrier were performed for each combination of particle size,material type and channel inclination. Likewise, the run-uptest was conducted with a rigid barrier installed within thechannel to study the run-up mechanism (Fig. 2(b)). Eachrun-up test was replicated to ascertain the repeatability of theexperiments and error bars are provided in the interpretationbelow. The test programme is summarised in Table 2 and thetest results are summarised in Table 3.
Model set-up and testing proceduresA transparent acrylic rigid barrier with a height, width andthickness of 600, 200 and 10 mm, respectively, was installedorthogonally to the channel at a distance of 1200 mmfrom the gate. Grids (50 mm×50 mm) were imposed on thebarrier for interpretation of high-speed images. The gate
was then secured using a magnetic lock and springs attachedto the gate were then loaded to the peripheral frame ofthe flume model. To ensure that all tests are comparablewith the analytical solution based on the energy principle(Kwan, 2012), and conservation of mass and momentum(Jóhannesson et al., 2009), all tests were conducted using thesame initial potential energy, and thus mass, specifically30 kg. The differences of initial bulk density are summarisedin Table 1. The channel was then inclined to an appropriateinclination angle. The granular materials were released bydeactivating the magnetic lock.
INTERPRETATION OF RESULTSRun-up kinematicsFigures 3 and 4 show the typical run-up kinematics forsupercritical dry sand (test R40-LC) and glass sphere flows(test R40-G40) at a channel inclination of 23°, respectively.The captured kinematics from the high-speed camera isshown on the left and its corresponding PIV analysis (Whiteet al., 2003) is shown on the right. The flow direction is fromleft to right, and the maximum velocities as captured usingPIV are shown.
The dry sand forms a thin wedge-like flow front, approach-ing the barrier at t=0 s with a measured velocity of 1·8 m/s(Fig. 3(a)). The flow front impacts the rigid barrier anddeposits at the base of the rigid barrier (Fig. 3(b)). The velocitydecreases by about 11% after impact. Subsequent flowmaterial impacts and piles up on top of the existing deposits,forming a dead zone at the base of the barrier at t=0·6 s(Fig. 3(c)). The ramp-like dead zone transfers the momentumof subsequent granular flow upwards. At t=0·9 s (Fig. 3(d)),the maximum velocity of the approaching sand is reduced by50%, the maximum pileup height is reached, and the impactprocess rapidly attenuates thereafter. The experimental resultof the sand flow predominantly exhibits a pileup mechanism,where the sand layers on top of the deposits at the base of thebarrier. The mechanism is in agreement with Armanini et al.(2011) and Choi et al. (2015).
Table 1. Material properties
Material type Leighton Buzzard sand Glass sphere
Particle diameter: mm 0·15 0·6 3·0 10·0 23·0 40·0Dynamic friction angle: deg 20·6 22·6 17·8 16·6 11·6 11·7Solid density: kg/m3 2650 2550Bulk density: kg/m3 1700 1680 1620 1611 1583 1513
Density, ρ Density, ρf
Velocity, vPo
sitio
n of
rigi
d ba
rrier
Rigid
barri
er
Flow depth, hRunup height, hf
θ θ
(a) (b)
Fig. 2. Side view of the: (a) control test and (b) run-up test
Influence of particle size on the mechanism of dry granular run-up on a rigid barrier 81
Downloaded by [ HKUST Library] on [26/09/17]. Copyright © ICE Publishing, all rights reserved.
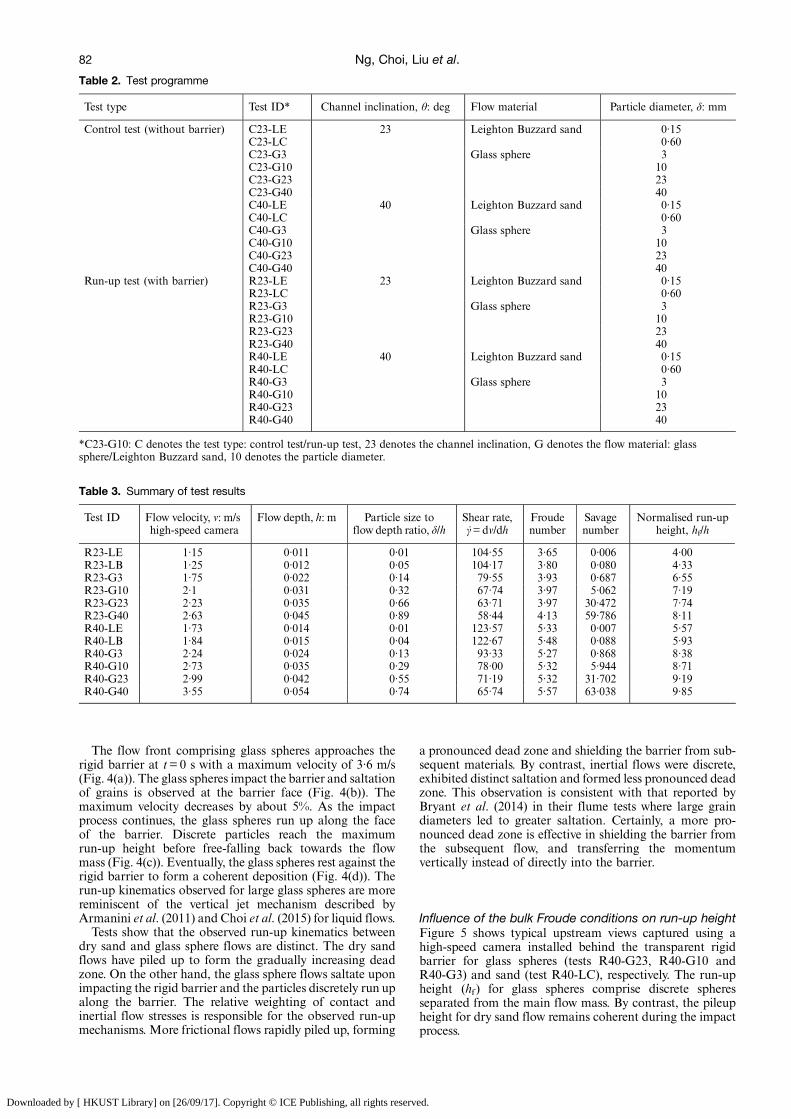
The flow front comprising glass spheres approaches therigid barrier at t=0 s with a maximum velocity of 3·6 m/s(Fig. 4(a)). The glass spheres impact the barrier and saltationof grains is observed at the barrier face (Fig. 4(b)). Themaximum velocity decreases by about 5%. As the impactprocess continues, the glass spheres run up along the faceof the barrier. Discrete particles reach the maximumrun-up height before free-falling back towards the flowmass (Fig. 4(c)). Eventually, the glass spheres rest against therigid barrier to form a coherent deposition (Fig. 4(d)). Therun-up kinematics observed for large glass spheres are morereminiscent of the vertical jet mechanism described byArmanini et al. (2011) and Choi et al. (2015) for liquid flows.Tests show that the observed run-up kinematics between
dry sand and glass sphere flows are distinct. The dry sandflows have piled up to form the gradually increasing deadzone. On the other hand, the glass sphere flows saltate uponimpacting the rigid barrier and the particles discretely run upalong the barrier. The relative weighting of contact andinertial flow stresses is responsible for the observed run-upmechanisms. More frictional flows rapidly piled up, forming
a pronounced dead zone and shielding the barrier from sub-sequent materials. By contrast, inertial flows were discrete,exhibited distinct saltation and formed less pronounced deadzone. This observation is consistent with that reported byBryant et al. (2014) in their flume tests where large graindiameters led to greater saltation. Certainly, a more pro-nounced dead zone is effective in shielding the barrier fromthe subsequent flow, and transferring the momentumvertically instead of directly into the barrier.
Influence of the bulk Froude conditions on run-up heightFigure 5 shows typical upstream views captured using ahigh-speed camera installed behind the transparent rigidbarrier for glass spheres (tests R40-G23, R40-G10 andR40-G3) and sand (test R40-LC), respectively. The run-upheight (hf ) for glass spheres comprise discrete spheresseparated from the main flow mass. By contrast, the pileupheight for dry sand flow remains coherent during the impactprocess.
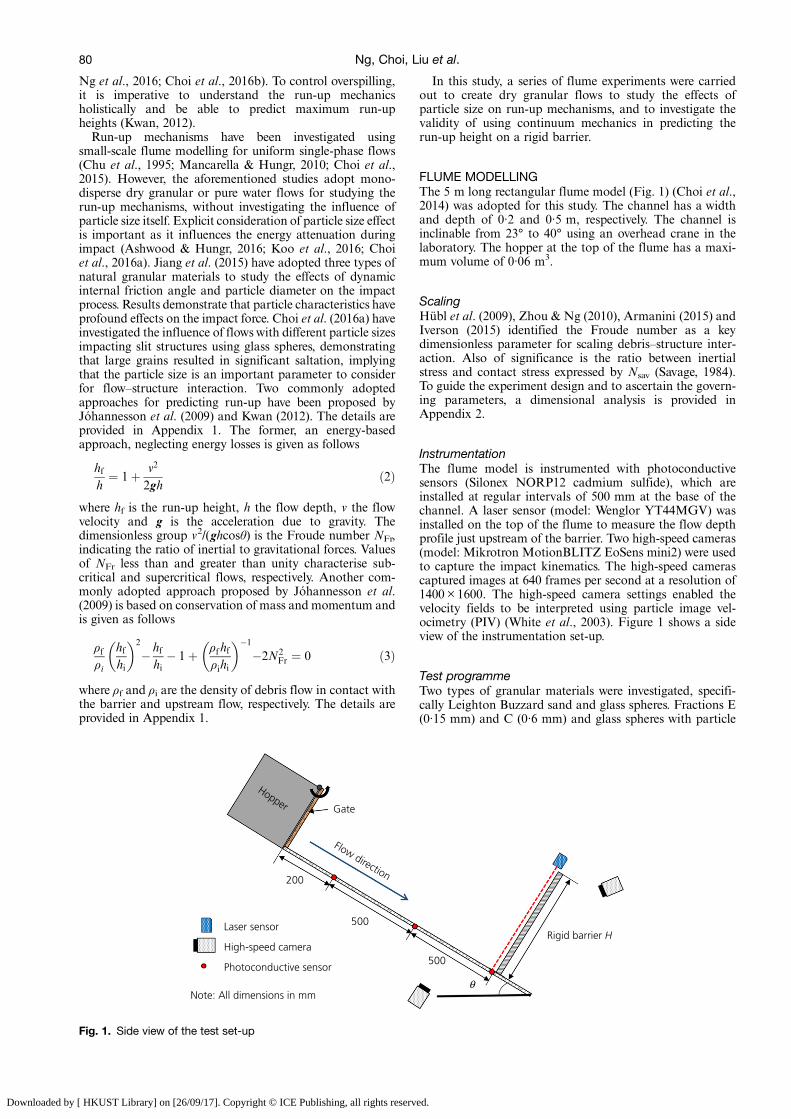
Table 2. Test programme
Test type Test ID* Channel inclination, θ: deg Flow material Particle diameter, δ: mm
Control test (without barrier) C23-LE 23 Leighton Buzzard sand 0·15C23-LC 0·60C23-G3 Glass sphere 3C23-G10 10C23-G23 23C23-G40 40C40-LE 40 Leighton Buzzard sand 0·15C40-LC 0·60C40-G3 Glass sphere 3C40-G10 10C40-G23 23C40-G40 40
Run-up test (with barrier) R23-LE 23 Leighton Buzzard sand 0·15R23-LC 0·60R23-G3 Glass sphere 3R23-G10 10R23-G23 23R23-G40 40R40-LE 40 Leighton Buzzard sand 0·15R40-LC 0·60R40-G3 Glass sphere 3R40-G10 10R40-G23 23R40-G40 40
*C23-G10: C denotes the test type: control test/run-up test, 23 denotes the channel inclination, G denotes the flow material: glasssphere/Leighton Buzzard sand, 10 denotes the particle diameter.
Table 3. Summary of test results
Test ID Flow velocity, v: m/shigh-speed camera
Flow depth, h: m Particle size toflow depth ratio, δ/h
Shear rate,γ̇=dv/dh
Froudenumber
Savagenumber
Normalised run-upheight, hf/h
R23-LE 1·15 0·011 0·01 104·55 3·65 0·006 4·00R23-LB 1·25 0·012 0·05 104·17 3·80 0·080 4·33R23-G3 1·75 0·022 0·14 79·55 3·93 0·687 6·55R23-G10 2·1 0·031 0·32 67·74 3·97 5·062 7·19R23-G23 2·23 0·035 0·66 63·71 3·97 30·472 7·74R23-G40 2·63 0·045 0·89 58·44 4·13 59·786 8·11R40-LE 1·73 0·014 0·01 123·57 5·33 0·007 5·57R40-LB 1·84 0·015 0·04 122·67 5·48 0·088 5·93R40-G3 2·24 0·024 0·13 93·33 5·27 0·868 8·38R40-G10 2·73 0·035 0·29 78·00 5·32 5·944 8·71R40-G23 2·99 0·042 0·55 71·19 5·32 31·702 9·19R40-G40 3·55 0·054 0·74 65·74 5·57 63·038 9·85
Ng, Choi, Liu et al.82
Downloaded by [ HKUST Library] on [26/09/17]. Copyright © ICE Publishing, all rights reserved.

400
350
300
250
200
150
100
50
00 100 200 300 400 500
400
350
300
250
200
150
100
50
00 100 200 300 400 500
400
350
300
250
200
150
100
50
00 100 200 300 400 500
400
350
300
250
200
150
100
50
0100 200 300 400 500
Vmax = 1·8 m/s
Vmax = 1·6 m/s
Vmax = 1·2 m/s
Vmax = 0·9 m/s
Flow front
Pile up
Pile up
Dead zone
Dead zone
Rigid barrier
Flow direction
(a) t = 0 s
(b) t = 0·3 s
(c) t = 0·6 s
(d) t = 0·9 s
Fig. 3. Observed run-up mechanism for sand flow from side camera and PIV analysis (test R40-LC): (a) t=0 s, (b) t=0·3 s, (c) t=0·6 sand (d) t=0·9 s
Influence of particle size on the mechanism of dry granular run-up on a rigid barrier 83
Downloaded by [ HKUST Library] on [26/09/17]. Copyright © ICE Publishing, all rights reserved.

Rigid barrier
Flow direction
(a) t = 0.0 s
(b) t = 0·1 s
(c) t = 0·2 s
(d) t = 0·3 s
400
350
300
250
200
150
100
50
00 100 200 300 400 500
Vmax = 3·6 m/s
Flow front
400
350
300
250
200
150
100
50
00 100 200 300 400 500
Vmax = 3·4 m/s
Vertical jet
400
350
300
250
200
150
100
50
00 100 200 300 400 500
Vmax = 2·2 m/s
Vertical jet
Pile up
400
350
300
250
200
150
100
50
00 100 200 300 400 500
Vmax = 1·3 m/s
Dead zone
Fig. 4. Observed run-up mechanism for glass sphere flow from side camera and PIV analysis (test R40-G40): (a) t=0·0 s, (b) t=0·1 s,(c) t=0·2 s and (d) t=0·3 s
Ng, Choi, Liu et al.84
Downloaded by [ HKUST Library] on [26/09/17]. Copyright © ICE Publishing, all rights reserved.

Figure 6 shows the influence of the upstream Froudeconditions (NFr) before impacting the normalised run-upheight (hf/h) for 30 kg of sand and glass spheres with varyingparticle diameters (δ) at inclinations of 23° and 40°.Reference lines for the energy principle (Kwan, 2012) andmomentum-based approach proposed by Jóhannesson et al.(2009) are shown for reference. The energy principle acts asan upper bound since it does not consider the energy loss.The measured results show that the NFr of the granular
flows generally increases with the channel inclination. Thisis due to the gravitational component of the flow increasesand leads to higher flow velocities and higher shear rateswhich spread the granular mass along the flow direction(Choi et al., 2015), and thus reducing the flow thickness. Theenergy principle overpredicts the run-up height by up tothree times and is not suitable for frictional flows (Choiet al., 2015). On the other hand, the momentum-basedapproach more closely captures the pileup height for drysand flows. Results indicate that a density ratio (ρf/ρ) of 1 cancapture the measured pileup heights.
For comparable upstream Froude conditions beforeimpact, glass sphere flows exhibit run-up heights that arealmost two times higher than that of dry sand flows. Glasssphere flows have larger particle diameters compared withdry sand flows, which are much more inertial when charac-terising the flows using the NSav. The inertial nature of theflows enables the particles to separate from the flow massduring the run-up process.
Influence of particle diameter on run-up heightFigure 7 shows the influence of particle size on flowdynamics described by the Savage number. The Savagenumber indicates the relative significance of contact andinertial grain stresses in a granular flow. The measuredresults show that the Savage number increases when thenormalised particle size becomes larger. This implies thatflows comprising larger particles are more inertial. Tohighlight the effect of particle size on flow dynamics, whenδ/h=1, a granular flow has a single layer of large particles.
(a) (b)
hf
hf
hf
hf
(c) (d)
Fig. 5. Upstream view of typical run-up heights: (a) test R40-G23, (b) test R40-G10, (c) test R40-G3 and (d) test R40-LC
Sand (measured, θ = 23°)
Sand (measured, θ = 40°)
Glass sphere (measured, θ = 23°)
Glass sphere (measured, θ = 40°)
Energy principle (theoretical)
Momentum approach (theoretical, ρf /ρi = 1·0)
Momentum approach (theoretical, ρf /ρi = 2·0)
Momentum approach (theoretical, ρf /ρi = 3·0)
20
Nor
mal
ised
run
up/p
ileup
hei
ght
(hf/
h)
16
12
8
4
00 1 2 3
Froude number (NFr)
4 5 6
Fig. 6. Comparison of measured normalised run-up height with energy principle (Kwan, 2012) and the momentum approach(Jóhannesson et al., 2009)
Influence of particle size on the mechanism of dry granular run-up on a rigid barrier 85
Downloaded by [ HKUST Library] on [26/09/17]. Copyright © ICE Publishing, all rights reserved.

Therefore, the Savage number is infinitely large since nocontact shearing exists. In this study, δ/h affects the flowdynamics significantly, which is in agreement with thefindings of Pouliquen (1999).Figure 8 shows the influence of grain stresses using the
NSav on the normalised run-up height. The empirical thres-hold value of NSav = 0·1 (Savage & Hutter, 1989), character-ising whether a flow is dominated by frictional or inertialstresses, is shown for reference. The measured results showthat the glass sphere flows are dominated by inertial stresses(NSav > 0·1), whereas dry sand flows in this study are domi-nated by contact stresses (NSav < 0·1). This is because moreenergy is dissipated through the contact stress (Sovilla et al.,2008). However, for glass sphere flow dominated byinertial stress, less contact stresses exist among the particles.Moreover, the large particles exhibit a discrete nature anddemonstrate grain saltation (Groh et al., 2010).
CONCLUSIONSA series of flume experiments were carried out to study theeffects of particle size on dry granular run-up mechanisms.
The conclusions drawn are based on the results from areduced scale flume model. Small-scale modelling cannotcapture all fundamental aspects of prototype flows sincethe geomaterial behaviour is stress-state dependent (Nget al., 2016). More specifically, under reduced stress con-ditions, the soil will undergo dilation rather than an expectedcontractive response under prototype conditions (Iverson &George, 2014). Furthermore, the glass spheres used inthis study are perfectly round and have smooth surfaceswhich are a simplification of the coarse particles in naturalgeophysical flows. In reality, coarse particles in prototypeflows are irregular and rough, which may lead to lowershear rates (Mollon & Zhao, 2013). The simplificationmade in this study will lead to conservative run-up heights.
• The particle size affects the flow dynamics describedby the Savage number significantly. In this study, theSavage number increases when the normalised particlebecomes larger since the contact stress surpasses theshearing stress.
• The run-up height is not only dependent on the Froudenumber of the flow before impact, but also on the particle
Sand (measured, θ = 23°)
Glass sphere (measured, θ = 23°)
Sand (measured, θ = 40°)
Glass sphere (measured, θ = 40°)
70
60
50
Sava
ge n
umbe
r (N
sav)
40
30
20
10
00 0·2 0·4
Normalised particle size (δ /h)0·6 0·8 1·0
Fig. 7. The effect of normalised particle size on Savage number
Sand (measured, θ = 23°)
Sand (measured, θ = 40°)
Glass sphere (measured, θ = 23°)
Glass sphere (measured, θ = 40°)
12
8
Nor
mal
ised
run
up/p
ileup
hei
ght
(hf/
h)
4
00·001 0·01 0·1
Savage number (Nsav)
1 10 100
0·01 0·03
0·12
0·14
0·290·55
0·66
0·32
0·89
0·74
0·020·01
Sava
ge &
Hut
ter
(198
9)
Fig. 8. Influence of Savage number on run-up height (the normalised particle size δ/h for each test is labelled)
Ng, Choi, Liu et al.86
Downloaded by [ HKUST Library] on [26/09/17]. Copyright © ICE Publishing, all rights reserved.
size which principally governs the run-up mechanism.Inertial flows comprising large grains (NSav > 0·1)profoundly transfers momentum vertically upon impact,resulting in significant saltation and high run-up heights.This implies that large particles accumulating at the flowfront can dangerously saltate over a rigid barrier;whereas, frictional flows comprising fine particles(NSav < 0·1) tend to pile up due to a high degree ofcontact stresses, resulting in a coherent impact processwithout significant run-up. Results indicate that bothFroude and Savage numbers should be considered ina run-up assessment.
• The momentum approach based on continuummechanics underestimates the run-up height of granularflows comprising large particles. This indicates thatfor landslides such as rock avalanches andboulder-entrained debris flow, the particle size must betaken into account to consider the discrete nature ofthe run-up process and to ensure a conservativeprediction of run-up height.
The series of flume experiments is aimed at investigatingthe effect of particle size and run-up mechanism. By varyingthe particle size of the granular material for each test, thedynamic friction angle also changed correspondingly. Theeffect of the dynamic friction angle is reflected in the Savagenumber ðNsav ¼ γ̇2δ2=gh tan ϕÞ. The larger particle size leadsto a smaller dynamic friction angle, and thus a larger Savagenumber, which is inversely proportional to the dynamicfriction angle.
ACKNOWLEDGEMENTSThe authors acknowledge the financial support fromresearch grant T22-603/15-N provided by the ResearchGrants Council of the Government of Hong Kong SAR,China, and the HKUST Jockey Club Institute for AdvancedStudy for their support.
APPENDIX 1: EQUATIONS OF RUN-UPA1.1 Energy principleThe debris run-up height against a vertical rigid barrier canbe calculated using the energy principle (Armanini et al.,2011; Kwan, 2012). The flow is assumed as a homogeneousmaterial that retains its macroscopic shape as it travels withspeed v and thickness h on a uniform and frictionless slope invacuum. No energy losses occur during the impact process.The conservation of energy is expressed as follows
Ei ¼ Ef ð4Þwhere Ei is the initial energy of the flow approaching therigid barrier and Ef is the final energy of the flow impactingthe rigid barrier.The initial energy of debris flows approaching the rigid
barrier is shown as follows
Ei ¼ 12mv2 þmgh ð5Þ
where m is the mass of the flow, g the gravitationalacceleration and h is the flow depth.The final energy of debris flows impacting the rigid barrier
at its maximum height
Ef ¼ mghf ð6Þwhere hf is the run-up height of flow impacting the rigidbarrier.
Substituting equations (5) and (6) into equation (4)
12mv2 þmgh ¼ mghf ð7Þ
The run-up height on the rigid barrier is therefore
hf ¼ hþ v2
2gð8Þ
The normalised run-up height by flow depth h can beexpressed as
hfh¼ 1þ v2
2ghð9Þ
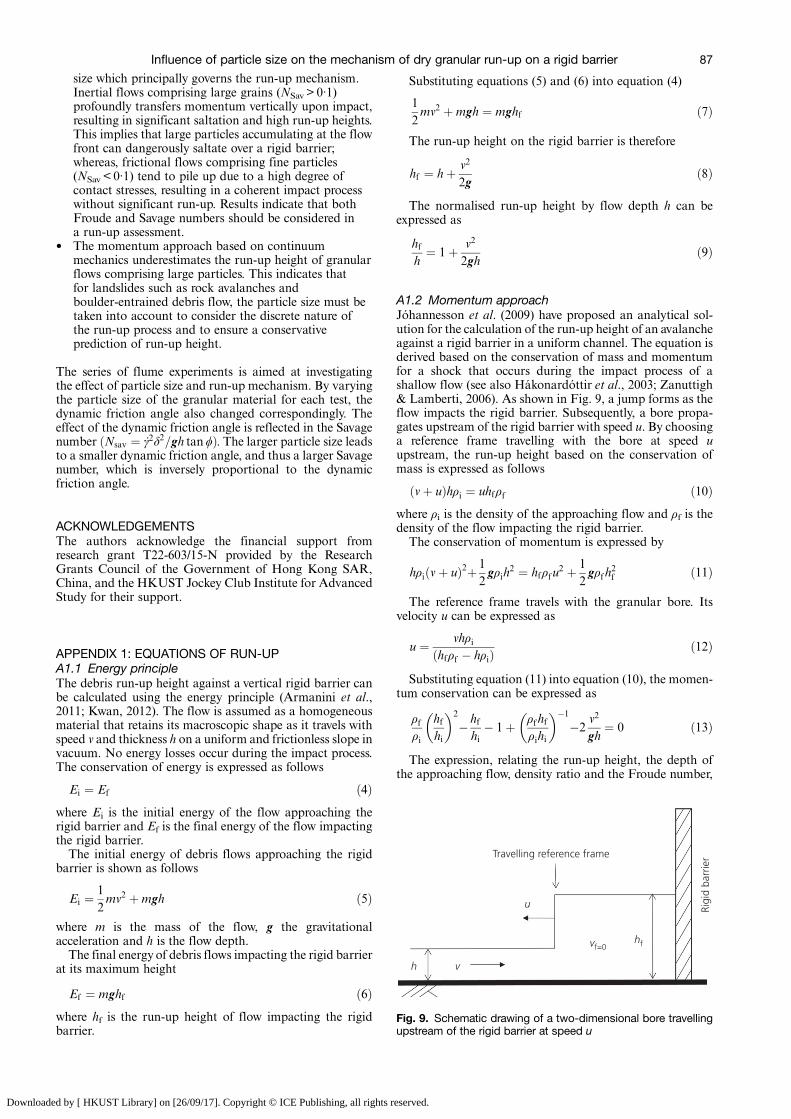
A1.2 Momentum approachJóhannesson et al. (2009) have proposed an analytical sol-ution for the calculation of the run-up height of an avalancheagainst a rigid barrier in a uniform channel. The equation isderived based on the conservation of mass and momentumfor a shock that occurs during the impact process of ashallow flow (see also Hákonardóttir et al., 2003; Zanuttigh& Lamberti, 2006). As shown in Fig. 9, a jump forms as theflow impacts the rigid barrier. Subsequently, a bore propa-gates upstream of the rigid barrier with speed u. By choosinga reference frame travelling with the bore at speed uupstream, the run-up height based on the conservation ofmass is expressed as follows
vþ uð Þhρi ¼ uhfρf ð10Þwhere ρi is the density of the approaching flow and ρf is thedensity of the flow impacting the rigid barrier.
The conservation of momentum is expressed by
hρi vþ uð Þ2þ 12gρih
2 ¼ hfρfu2 þ 1
2gρfh
2f ð11Þ
The reference frame travels with the granular bore. Itsvelocity u can be expressed as
u ¼ vhρihfρf � hρið Þ ð12Þ
Substituting equation (11) into equation (10), the momen-tum conservation can be expressed as
ρfρi
hfhi
� �2
� hfhi
� 1þ ρfhfρihi
� ��1
�2v2
gh¼ 0 ð13Þ
The expression, relating the run-up height, the depth ofthe approaching flow, density ratio and the Froude number,
Travelling reference frame
u
vf=0hf
Rigi
d ba
rrie
r
h v
Fig. 9. Schematic drawing of a two-dimensional bore travellingupstream of the rigid barrier at speed u
Influence of particle size on the mechanism of dry granular run-up on a rigid barrier 87
Downloaded by [ HKUST Library] on [26/09/17]. Copyright © ICE Publishing, all rights reserved.

is given by
ρfρi
hfhi
� �2
� hfhi
� 1þ ρfhfρihi
� ��1
�2N2Fr ¼ 0 ð14Þ
APPENDIX 2: DIMENSIONAL ANALYSIS OF DRYGRANULAR FLOWA dimensional analysis (Savage, 1984; Iverson, 2015) byusing Buckingham Π group was carried out to guide theexperimental set-up and ascertain the governing dimension-less group. The Froude number and Savage numbers areidentified as the two key parameters governing the flow in aninclined channel.
A2.1 MACROSCOPIC ANALYSISThe dimensional analysis conducted by Iverson (2015)assumes a block with homogeneous material travellingdown an inclined plane in vacuum. The speed v can beexpressed using the following variables
v ¼ f1 g;L; h; ρ; θ; σ;ϕ; tð Þ ð15Þwhere g is the gravitational acceleration; L is the length ofthe block; h is the flow depth; ρ is the bulk density; θ is thechannel inclination; σ is a generic stress variable, describingthe effects of internal deformation on energy dissipation; ϕ isthe dynamic friction angle; and t is the travel time.θ and ϕ are intrinsically dimensionless and play no role in
the identification of dimensionless variables. Buckingham’sΠ theorem indicates that the other seven dimensional vari-ables must be related and can be expressed using fourindependent dimensionless variables. To ascertain the fourvariables, the function equation (15) is postulated to have thegeneric relationship
v ¼ kgaLbhcρdσetf ð16ÞBy expressing all physical variables in equation (16) by
mass [M ], length [L] and time [T ]
L½ �T½ � ¼
L½ �T½ �2
!a
L½ �b L½ �c M½ �L½ �3
!dM½ �
L½ � T½ �2 !e
T½ �f
To achieve the dimensional homogeneity, three conditionsmust be satisfied
M½ � : 0 ¼ d þ e
L½ � : 1 ¼ aþ bþ c� 3d � e
T½ � : �1 ¼ �2a� 2eþ f
Therefore, the unknowns a, b, d can be algebraicallyeliminated by substituting c, e, f
v ¼ kðgLÞ1=2 hL
� �c σ
ρgL
� �e t
L=gð Þ1=2 !f
ð17Þ
Equation (17) can be rewritten in dimensionless form as
v
ðgLÞ1=2¼ f2
hL;
σ
ρgL;
t
L=gð Þ1=2; θ; ϕ
!ð18Þ
where v/(gL)1/2 is the Froude number (the ratio of theinertial force to the gravitational force); h/L is the length
scale; σ/ρgL is the scaled stress; and t/(L/g)1/2 is the time scalefor motion.
A2.2 MICROSCOPIC ANALYSISThe dimensional analyses of steady, uniform shear flowsbuild on the foundation established by Savage’s (1984)analysis of dry granular flows. Correspondingly, the devia-toric stress τij can be expressed as
τij ¼ τij � 13τkkσij ¼ τij � pσij ð19Þ
where τij is the stress tensor and, p is the mean normal stress.The deviatoric stress τij and pressure p can be expressed as
τij ¼ f3 ρP; γ̇; v2� �1=2
; w2� �1=2; p; υ; δ; h; g; e; μ;E; s
� �ð20Þ
p¼ f3 ρP; γ̇; v2� �1=2
; w2� �1=2; υ; δ; h;PB; g; e; μ;E; s
� �ð21Þ
where ρP is the solid density of the granular material; γ̇ isthe shear rate; hv2i1/2 and hw2i1/2 are the translational androtational velocity from particle interaction; υ is the solidsfraction; δ is the particle diameter; h is the depth shear flow;g is the gravitational acceleration; PB is the normal stressapplied at the boundary of the shear region; e, μ and E arethe coefficient of restitution, the surface coefficient of fric-tion and the modulus of elasticity of the solid particles,respectively; and s is a factor describing the angularity orsphericity of the solid particles.
Dimensional homogeneity requires
τijρpδ
2γ̇2¼ f4
P
ρpδ2γ̇2
;δγ̇
v2h i1=2;
γ̇
w2h i1=2;
gδγ̇2
; υ;δ
h;PE; e; μ; s
!
ð22Þ
P
ρpδ2γ̇2
¼ f4δγ̇
v2h i1=2;
γ̇
w2h i1=2;gδγ̇2
;ρpδ
2γ̇2
PB;PB
E; υ;
δ
h;PE; e; μ; s
!
ð23ÞFor fluid-like flow regime, if the shear rates and stress level
are high enough, so that the gravity effect is insignificant,then the dimensionless group g=δγ̇2 tends to 0. If the shearrates and stress level are low enough, so that the particles canbe regarded as rigid, then the dimensionless group P/E tendsto 0. δγ̇= v2
� �1=2and γ̇= w2
� �1=2are the normalised transla-
tional and rotational velocity from particle interaction; δ/h isthe normalised particle diameter. The dimensionless groupρpδ
2γ̇2=PB, which is proportional to the ratio of the dynamicor collisional stresses to total boundary stress, is the primaryparameter that distinguishes the various flow regimes for drygranules. It can be rewritten as
Nsav ¼ρpδ
2γ̇2
PB¼ ρpγ̇
2δ2
ρpgh tan ϕ¼ γ̇2δ2
gh tan ϕð24Þ
REFERENCESArmanini, A. (2015). Closure relations for mobile bed debris flows
in awide range of slopes and concentrations. Adv. Water Resour.81, No. 7, 75–83.
Armanini, A., Larcher, M. & Odorizzi, M. (2011). Dynamicimpact of a debris flow front against a vertical wall. In5th international conference on debris-flow hazards.Mitigation, mechanics, prediction and assessment, Padua, Italy(eds R. Genevois, D. L. Hamilton and A. Prestininzi),
Ng, Choi, Liu et al.88
Downloaded by [ HKUST Library] on [26/09/17]. Copyright © ICE Publishing, all rights reserved.
pp. 1041–1049. Rome, Italy: Casa Editrice Università LaSapienza.
Ashwood, W. & Hungr, O. (2016). Estimating total resisting forcein flexible barrier impacted by a granular avalanche usingphysical and numerical modelling. Can. Geotech. J. 53, No. 10,1700–1717.
Bowman, E. T., Laue, J., Imre, B. & Springman, S. M. (2010).Experimental modelling of debris flow behaviour using ageotechnical centrifuge. Can. Geotech. J. 47, No. 7, 742–762.
Bryant, S. K., Take, W. A. & Bowman, E. T. (2014). Observationsof grain-scale interactions and simulation of dry granular flowsin a large-scale flume. Can. Geotech. J. 52, No. 5, 638–655.
Choi, C. E., Ng, C. W. W., Song, D., Kwan, J. S. H., Shiu, H. Y. K.,Ho, K. K. S. & Koo, R. C. H. (2014). Flume investigationof landslide debris baffles. Can. Geotech. J. 51, No. 5, 540–533.
Choi, C. E., Au-Yeung, S. C. H. & Ng, C. W. W. (2015). Flumeinvestigation of landslide granular debris andwater runup mech-anisms.Géotech. Lett. 5, No. 1, 28–32, http://dx.doi.org/10.1680/geolett.14.00080.
Choi, C. E., Goodwin, G., Ng, C. W. W., Chu, H. K., Kwan, J. S. H.& Pun, W. K. (2016a). Coarse granular flow interaction withslit-structures. Géotech. Lett. 6, No. 4, 267–274, http://dx.doi.org/10.1680/jgele.16.00103.
Choi, C. E., Ng, C. W. W., Goodwin, G. R., Liu, L. H. D. &Cheung, W. W. (2016b). Flume investigation of the influence ofrigid barrier deflector angle on dry granular overflow mech-anisms. Can. Geotech. J. 53, No. 10, 1751–1759.
Chu, T., Hill, G., McClung, D. M., Ngun, R. & Sherkat, R.(1995). Experiments on granular flows to predict avalancherunup. Can. Geotech. J. 32, No. 2, 285–295.
Gray, J. M. N. T. & Chugunov, V. A. (2006). Particle-size segre-gation and diffusive remixing in shallow granular avalanches.J. Fluid Mech. 569, 365–398.
Groh, C., Rehberg, I. & Kruelle, C. A. (2010). Particle dynamics ofa cartoon dune. New J. Phys. 12, No. 6, 063025.
Hákonardóttir, K. M., Hogg, A. J., Jóhannesson, T. &Tómasson, G. G. (2003). A laboratory study of the retardingeffects of braking mounds on snow avalanches. J. Glaciology 49,No. 165, 191–200.
Hsu, L., Dietrich, W. E. & Sklar, L. S. (2014). Mean and fluctuatingbasal forces generated by granular flows: laboratoryobservationsin a large vertically rotating drum. J. Geophys. Res., Earth Surf.119, No. 6, 1283–1309.
Hübl, J., Suda, J., Proske, D., Kaitna, R. & Scheidl, C.(2009). Debris flow impact estimation. In 11th internationalsymposium on water management and hydraulic engineering,Ohrid, Macedonia, vol. 1, pp. 137–148.
Hungr, O. (2008). Simplified models of spreading flow of drygranular material. Can. Geotech. J. 45, No. 8, 1156–1168.
Iverson, R.M. (1997). The physics of debris flows.Rev. Geophys. 35,No. 3, 245–296.
Iverson, R. M. (2015). Scaling and design of landslide anddebris-flow experiments. Geomorphology 244, No. 9, 9–20.
Iverson, R. M. & George, D. L. (2014). A depth-averageddebris-flow model that includes the effects of evolvingdilatancy. I. Physical basis. Proceedings of the Royal Society470, No. 2170, 20130819.
Jakob, M., Hungr, O. & Jakob, D. M. (2005). Debris-flow hazardsand related phenomena. Berlin, Germany: Springer.
Jiang, Y. J. & Zhao, Y. (2015). Experimental investigation of drygranular flow impact via both normal and tangential forcemeasurements. Géotech. Lett. 5, No. 1, 33–38, http://dx.doi.org/10.1680/geolett.15.00003.
Jiang, Y. J., Zhao, Y., Towhata, I. & Liu, D. X. (2015). Influenceof particle characteristics on impact event of dry granular flow.Powder Technol. 271, No. A, 53–67.
Jóhannesson, T., Gauer, P., Issler, P., Lied, K. & Hákonardóttir,K. M. (2009). The design of avalanche protection dams: recentpractical and theoretical developments, Project report EUR23339. Brussels, Belgium: European Commission.
Johnson, C. G., Kokelaar, B. P., Iverson, R., Logan, M.,LaHusen, R. G. & Gray, J. M. N. T. (2012). Grain-sizesegregation and levee formation in geophysical mass flows.J. Geophys. Res., Earth Surf. 117, No. F01032, 1–23.
Kaitna, R., Rickenmann, D. & Schatzmann, M. (2007).Experimental study on rheologic behaviour of debris flowmaterial. Acta Geotech. 2, No. 2, 71–85.
Koo, R. C. H., Kwan, J. S. H., Ng, C. W.W., Lam, C., Choi, C. E. &Song, D. (2016). Velocity attenuation of debris flows and a newmomentum-based load model for rigid barriers. Landslides1, No. 5, 1–13.
Kwan, J. S. H. (2012). Supplementary technical guidance ondesign of rigid debris-resisting barriers, Report no. 270.Kowloon, Hong Kong: Geotechnical Engineering Office.
Lo, D. O. K. (2000). Review of natural terrain landslide debris-resisting barrier design, Report no. 104. Kowloon, Hong Kong:Geotechnical Engineering Office.
Mair, K., Frye, K. M. & Marone, C. (2002). Influence of graincharacteristics on the friction of granular shear zones.J. Geophys. Res., Solid Earth 107, No. B102219, 1–9.
Mancarella, D. & Hungr, O. (2010). Analysis of run-up of granularavalanches against steep, adverse slopes and protective barriers.Can. Geotech. J. 47, No. 8, 827–841.
McArdell, B. W., Bartelt, P. & Kowalski, J. (2007). Fieldobservations of basal forces and fluid pore pressure in a debrisflow. Geophys. Res. Lett. 34, No. L07406, 1–4.
Mollon, G. & Zhao, J. (2013). The influence of particle shape ongranular Hopper flow. AIP Conf. Proc. 1542, No. 1, 690–693.
Ng, C. W. W., Song, D., Choi, C. E., Kwan, J. S. H., Shiu, H. Y. K.& Koo, R. C. H. (2016). Centrifuge modelling of drygranular and viscous impact on rigid and flexible barriers.Can. Geotech. J. 54, No. 2, 188–206.
Podczeck, F. & Mia, Y. (1996). The influence of particle size andshape on the angle of internal friction and the flow factorof unlubricated and lubricated powders. Int. J. Pharm. 144,No. 2, 187–194.
Pouliquen, O. (1999). Scaling laws in granular flows down roughinclined planes. Phys. Fluids (1994-present) 11, No. 3, 542–548.
Pudasaini, S. P. & Hutter, K. (2007). Avalanche dynamics: dynamicsof rapid flows of dense granular avalanches. Berlin, Germany:Springer.
Savage, S. B. (1984). The mechanics of rapid granular flows. Adv.Appl. Mech. 24, 289–366.
Savage, S. B. & Hutter, K. (1989). The motion of a finite mass ofgranular material down a rough incline. J. Fluid Mech. 199,No. 2, 177–215.
Sovilla, B., Schaer, M., Kern, M. & Bartelt, P. (2008). Impactpressures and flow regimes in dense snow avalanchesobserved at the Vallée de la Sionne test site. J. Geophys. Res.113, No. F01010, 1–14.
Tan, S. B. & Newton, J. M. (1990). Powder flowability as anindication of capsule filling performance. Int. J. Pharm. 61,No. 1–2, 145–155.
White, D. J., Take, W. A. & Bolton, M. D. (2003). Soil deformationmeasurement using particle image velocimetry (PIV) and photo-grammetry. Géotechnique 53, No. 7, 619–632, http://dx.doi.org/10.1680/geot.2003.53.7.619.
Zanuttigh, B. & Lamberti, A. (2006). Experimental analysis of theimpact of dry avalanches on structures and implication for debrisflows. J. Hydraul. Res. 47, No. 4, 381–383.
Zhou, G. G. D. & Ng, C. W. W. (2010). Dimensional analysisof natural debris flows. Can. Geotech. J. 47, No. 7, 719–729.
HOW CAN YOU CONTRIBUTE?
To discuss this paper, please submit up to 500 words tothe editor at [email protected]. Your contribution will beforwarded to the author(s) for a reply and, if consideredappropriate by the editorial board, it will be published as adiscussion in a future issue of the journal.
Influence of particle size on the mechanism of dry granular run-up on a rigid barrier 89
Downloaded by [ HKUST Library] on [26/09/17]. Copyright © ICE Publishing, all rights reserved.


![Structural correlations and dependent scattering mechanism ... · scattering mechanism [34, 35], which denotes the multiple scattering trajec-tories visiting the same particle more](https://img.pdfslide.us/doc/110x75/5f8a6f33d06f2f20f04e2d60/structural-correlations-and-dependent-scattering-mechanism-scattering-mechanism.jpg)