Embed Size (px)
Citation preview

Eng. &Tech. Journal, Vol.31, Part (A), No.13, 2013
2513
Influence of Noisy Environment on the Speech Recognition Rate Based on the Altera FPGA
Dr. Eyad I. Abbas Electrical Engineering Department, University of Technology/Baghdad Email: [email protected] Alaa Abdulhussain Refeis Electrical Engineering Department, University of Technology/Baghdad
Received on: 8/1/2013 & Accepted on: 9/5/2013 ABSTRACT
This paper introduce an approach to study the effects of different levels of environment noise on the recognition rate of speech recognition systems, which are not used any type of filters to deal with this issue. This is achieved by implementing an embedded SoPC (System on a Programmable Chip) technique with Altera Nios II processor for real-time speech recognition system. Mel Frequency Cepstral Coefficients (MFCCs) technique was used for speech signal feature extraction (observation vector). Model the observation vector of voice information by using Gaussian Mixture Model (GMM), this model passed to the Hidden Markov Model (HMM) as probabilistic model to process the GMM statistically to make decision on utterance words recognition, whether a single or composite, one or more syllable words. The framework was implemented on Altera Cyclone II EP2C70F896C6N FPGA chip sitting on ALTERA DE2-70 Development Board. Each word model (template) stored as Transition Matrix, Diagonal Covariance Matrices, and Mean Vectors in the system memory. Each word model utilizes only 4.45Kbytes regardless of the spoken word length. Recognition words rate (digit/0 to digit/10) given 100% for the individual speaker. The test was conducted at different sound levels of the surrounding environment (53dB to 73dB) as measured by Sound Level Meter (SLM) instrument. Keywords: Mel Frequency Cepstral Coefficients (MFCC), Gaussian Mixture Model (GMM), Hidden Markov Model (HMM), System on a Programmable Chip (SoPC), Nios II processor.
على البوابات مستندعلى معدل تمییز الكالم ة الصاخبةالبیئتأثیر تیرالالمنطقیة المبرمجة نوع ال
الخالصة
لدراسة تأثیر المستویات المختلف ة م ن الضوض اء البیئی ة عل ى مع دل التمیی ز یقدم ھذا البحث مدخال ت م انج از ھ ذا العم ل . التي التستخدم اي نوع م ن الفالت ر للتعام ل م ع ھ ذه القض یة النظمة تمییز الكالم
.الحقیق ي ل زمن لتمییز الك الم ف ي ا ٢مع معالج التیرا نیوس نظام على رقاقة قابلھ للبرمجةتنفیذ بواسطة المتجھ ات (خ واص إش ارة الص وت نغم ة طی ف الت ردد كوس یلة إلس تخراج تقنی ة مع امالت تس تخدمُأ
اوس ین، ھ ذا المودی ل گنم وذج خل یط نمذجة المتجھات الظاھرة لمعلومات الصوت بإس تخدام ).الظاھرةاوس ین إحص ائیًا إلتخ اذ گیم رر ال ى نم وذج م اركوف المخف ي كمودی ل إحتم الي لمعالج ة نم وذج خل یط
اح د او و ص وتي م ن مقط ع ،القرار لتمییز الكالمات المنطوقة، سواء كان ت الكلم ات منف رده او مركب ھ
Eng. &Tech. Journal, Vol.31, Part (A), No.13, 2013 Influence of Noisy Environment on the Speech Recognition Rate Based on the Altera FPGA
2514
٢ت م تنفی ذ العم ل عل ى رقاق ة البواب ات المنطقی ة المبرج ة ن وع س ایكلون .اكث ر(EP2C70F896CN6) وعة عل ى لوح ة التط ویر ن وع التی را ض موDE2-70 . الب رمج الخدمی ة
عل ى ش كل مص فوفة انتقالی ة ف ي ذاك رة النظ ام ك ل كلم ة تخ زن .لبن اء المكون ات المادی ة المس تخدمةك ل كلم ة تأخ ذ حج م مس اوي ال ى .و متجھ ات الوس ط الحس ابي ومجموعة مصفوفات التغاییر القطری ة
رق م ص فر ال ى رق م عش رة (مع دل تمیی ز الكلم ات .كیلوبای ت بغ ض النظ ر ع ن ط ول الكلم ة ٤.٤٥مختلف ة م ن إج ري االختب ار ف ي مس تویات . للش خص المتح دث% ١٠٠تعط ي نس بة ) باالنكلیزی ة
.جھاز قیاس مستوى الصوت كما تم قیاسھا في) دیسیبل ٧٣-٥٣( االصوات المحیطیة
INTRODUCTION oice signals convey numerous discriminative features that can be used to identify speakers. Speech contains significant energy ranging rom zero frequency up to around 5 kHz [1]. Most of the speech recognition systems
objective is to extract, characterize and recognize the information about the utterance words.
One of the most important features extraction method used for the speech applications is Mel Frequency Cepstral Coefficient (MFCC). It’s non-parametric method used to modeling the human auditory system. In recent studies of speech recognition system, the MFCC parameters perform better than others in the recognition accuracy [2]. MFCC has random multi-dimensional continuous feature vectors, however the most important class of finite mixture densities are Gaussian mixtures, to represent the continuous feature/observation vectors into statistically distributions.
Gaussian Mixture Model (GMM) is one solution to fit the continuous feature/observation vectors (MFCCs) for each utterance word and estimate parameters of the GMM for a set of MFCCs from training speech signals. To obtain the optimum parameters of GMM, iterative Expectation-Maximization (EM) algorithm used to calculate Maximum Likelihood (ML) estimation [3][4].
Hidden Markov Model (HMM) is a probabilistic model used in most speech recognition systems with high recognition rate and good anti-noise performance [5]. One topology used for speech recognition is so called left-to-right HMM structure. Continuous HMM was used in this work, so the observations were characterized as continuous signals (vectors). The measured MFCCs are in the form of a multi-dimensional vector space for the speech signals. The PDF was used as multivariate Gaussian PDF and defined by mean vector(μ) with covariance matrix(σ) [4]. SPEECH PRE-PROCESSING
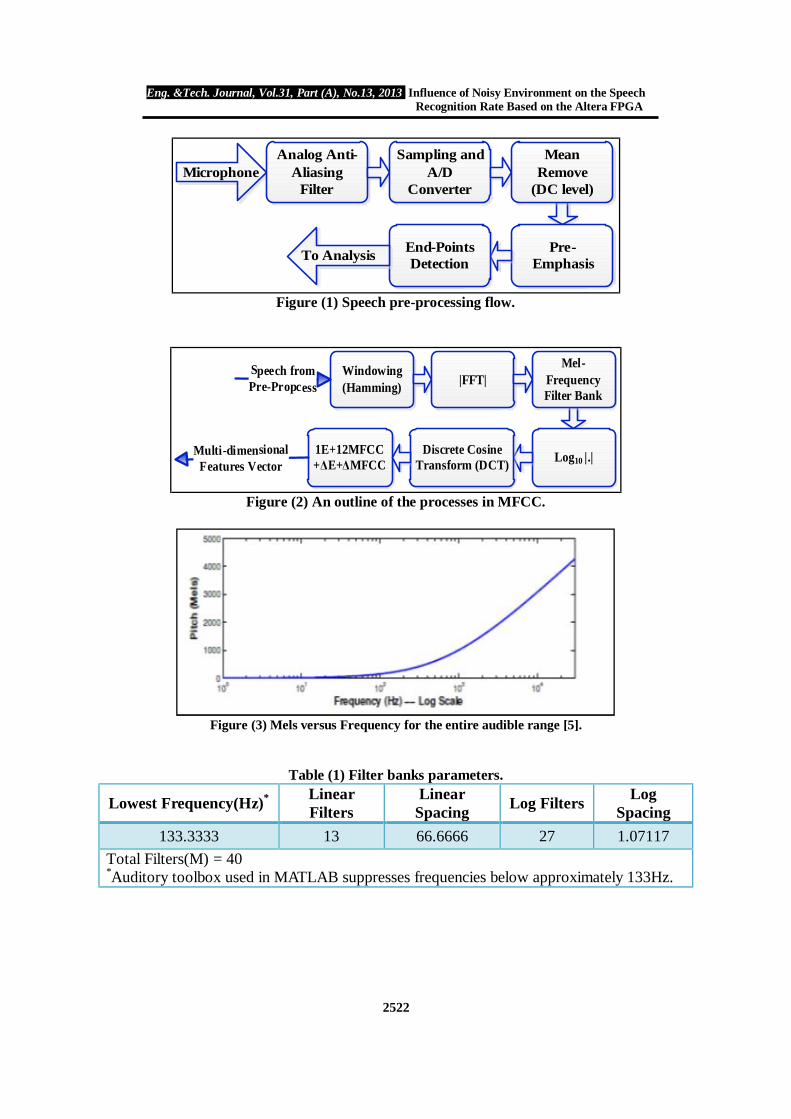
To accommodate the voice signal to be further analysis to extract features. Figure (1)illustrates the pre-processing functions. According to the sampling theorem: sampling frequency cannot smaller than 2 times of bandwidth of the signal, so to capture more information to give high recognition rate, 16KHz chosen to be sampling frequency since the bandwidth of speech signal is not higher than 4KHz [6].
Analog to digital (A/D) converter is to quantizes (digital representation of samples) of each discrete sample x(n), n=0, 1, ...N-1 into a specific number. In this work, the type of A/D is Sigma/Delta conversion with 24-bits resolution, which is provided by Altera DE2-70 Development Board as dedicated chip.
The microphone with A/D converter may be add a DC offset voltage level to the output signal that should be removed from the digital data by subtract all samples from the mean value of the signal within a limit time period, in this work 1.5 sec. was
V

Eng. &Tech. Journal, Vol.31, Part (A), No.13, 2013 Influence of Noisy Environment on the Speech Recognition Rate Based on the Altera FPGA
2515
chosen as time period. This process performs important thing when determine end and start points for the utterance voice. It is essential to remove any constant DC level voltage. Pre-emphasis it is a digital High-Pass Filter is governed as in Eq. 1
S(n) = X(n) − X(n − 1) 1 ≤ n ≤ L …(1)
S(n) represents the signal that has been processed with pre-emphasis, while X(n) represents the original signal, and L is the length of each audio frame (samples number). Pre-emphasis filter used to compensate the decayed speech signal [7]. A typically values for chosen within 0.95 to 1.0. The value of reflect the degree of pre-emphasis [6]. A typical value of is 0.95, which gives rise to a more than 20dB amplification of the high frequency spectrum [8].
End-Point Detection (EPD) is the process of removing unwanted parts of speech sound signal: silence, speech, and background noise segments, however the data necessary to compute will decrease, and the computation time will speed up [7]. There are many algorithms adopted to detect the boundary of speech segment: Time Domain, Frequency Domain, and Mixed Parameter EPDs. This work focused on Time Domain EPD, includes two algorithms for determine the EPD of the speech segment based on short time analysis of the speech signal. One is STE (Sort-Time Energy). The amplitude of unvoiced segments is generally much lower than the amplitude of voiced segments. The short-time energy of the speech signal provides a convenient representation that reflects these amplitude variations [9]. The other one is Short-Time Zero Crossing Rate (STZCR). Prior calculation of STZCR process, any DC offset voltage level must be removed from the speech signal. STZCR counts how many times the signal crosses the time axis during the short-time frame. Eqs. 2 and 3 used to compute STE and STZCR respectively.
E[m] = ∑ S [n] … (2) C[m] = ∑ |sgn(s[n]) − sgn(s[n− 1])| … (3)
SPEECH SIGNAL FEATURE EXTRACTION In this work, the MFCC was chosen; it’s based on the human peripheral auditory
system. The human perception of the frequency contents of sounds does not follow a linear scale. Thus for each tone with an actual frequency t measured in Hz, a subjective pitch is measured on a scale called the “Mel Scale”, Mel is an abbreviation of the word melody, is a unit of pitch [4]. The Mel frequency scale is linear frequency spacing below 1000 Hz and logarithmic spacing above 1kHz. As a reference point, the pitch of a 1 Hz tone, 40 dB above the perceptual hearing threshold, is defined as 1000 Mels [1]. Equation 4 is the approximate formula used to compute the Mels for a given frequency f in Hz. [2].
Mel(f) = 2595 ∗ log (1 + ) … (4)
One method to compute the MFCC in this work can be summarized as in Figure (2) First the pre-processed signal blocked into overlapping frames with hamming window which has the form [5]:
Eng. &Tech. Journal, Vol.31, Part (A), No.13, 2013 Influence of Noisy Environment on the Speech Recognition Rate Based on the Altera FPGA
2516
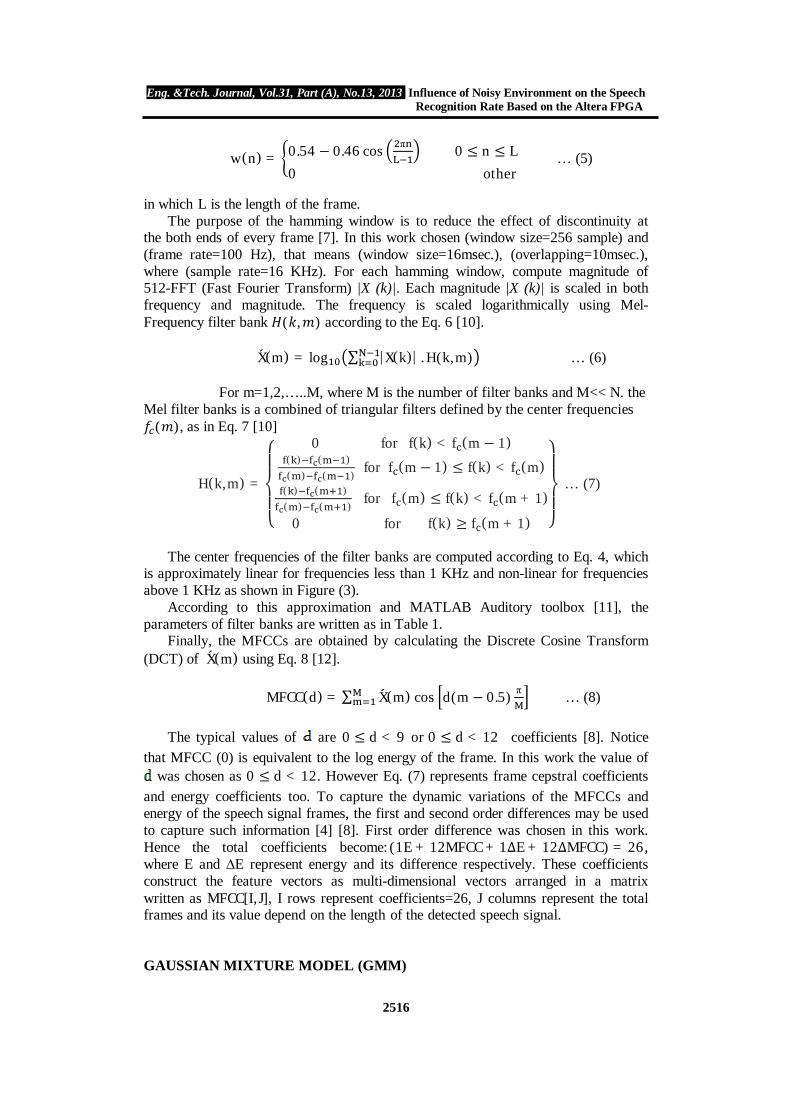
w(n) = 0.54 − 0.46 cos π 0 ≤ n ≤ L0 other … (5)
in which L is the length of the frame.
The purpose of the hamming window is to reduce the effect of discontinuity at the both ends of every frame [7]. In this work chosen (window size=256 sample) and (frame rate=100 Hz), that means (window size=16msec.), (overlapping=10msec.), where (sample rate=16 KHz). For each hamming window, compute magnitude of 512-FFT (Fast Fourier Transform) |X (k)| . Each magnitude |X (k)| is scaled in both frequency and magnitude. The frequency is scaled logarithmically using Mel-Frequency filter bank ( , ) according to the Eq. 6 [10].
X (m) = log ∑ |X(k)| . H(k, m) … (6) For m=1,2,…..M, where M is the number of filter banks and M<< N. the
Mel filter banks is a combined of triangular filters defined by the center frequencies ( ), as in Eq. 7 [10]
H(k, m) = ⎩⎪⎨⎪⎧ 0 for f(k) < f (m − 1) ( ) ( ) ( ) ( ) for f (m − 1) ≤ f(k) < f (m) ( ) ( ) ( ) ( ) for f (m) ≤ f(k) < f (m + 1)0 for f(k) ≥ f (m + 1) ⎭⎪⎬
⎪⎫ … (7)
The center frequencies of the filter banks are computed according to Eq. 4, which
is approximately linear for frequencies less than 1 KHz and non-linear for frequencies above 1 KHz as shown in Figure (3).
According to this approximation and MATLAB Auditory toolbox [11], the parameters of filter banks are written as in Table 1.
Finally, the MFCCs are obtained by calculating the Discrete Cosine Transform (DCT) of X (m) using Eq. 8 [12].
MFCC(d) = ∑ X (m) cos d(m − 0.5) π … (8)
The typical values of are 0 ≤ d < 9 or 0 ≤ d < 12 coefficients [8]. Notice that MFCC (0) is equivalent to the log energy of the frame. In this work the value of
was chosen as 0 ≤ d < 12. However Eq. (7) represents frame cepstral coefficients and energy coefficients too. To capture the dynamic variations of the MFCCs and energy of the speech signal frames, the first and second order differences may be used to capture such information [4] [8]. First order difference was chosen in this work. Hence the total coefficients become: (1E + 12MFCC + 1∆E + 12∆MFCC) = 26, where E and ∆E represent energy and its difference respectively. These coefficients construct the feature vectors as multi-dimensional vectors arranged in a matrix written as MFCC[I, J], I rows represent coefficients=26, J columns represent the total frames and its value depend on the length of the detected speech signal.
GAUSSIAN MIXTURE MODEL (GMM)
Eng. &Tech. Journal, Vol.31, Part (A), No.13, 2013 Influence of Noisy Environment on the Speech Recognition Rate Based on the Altera FPGA
2517
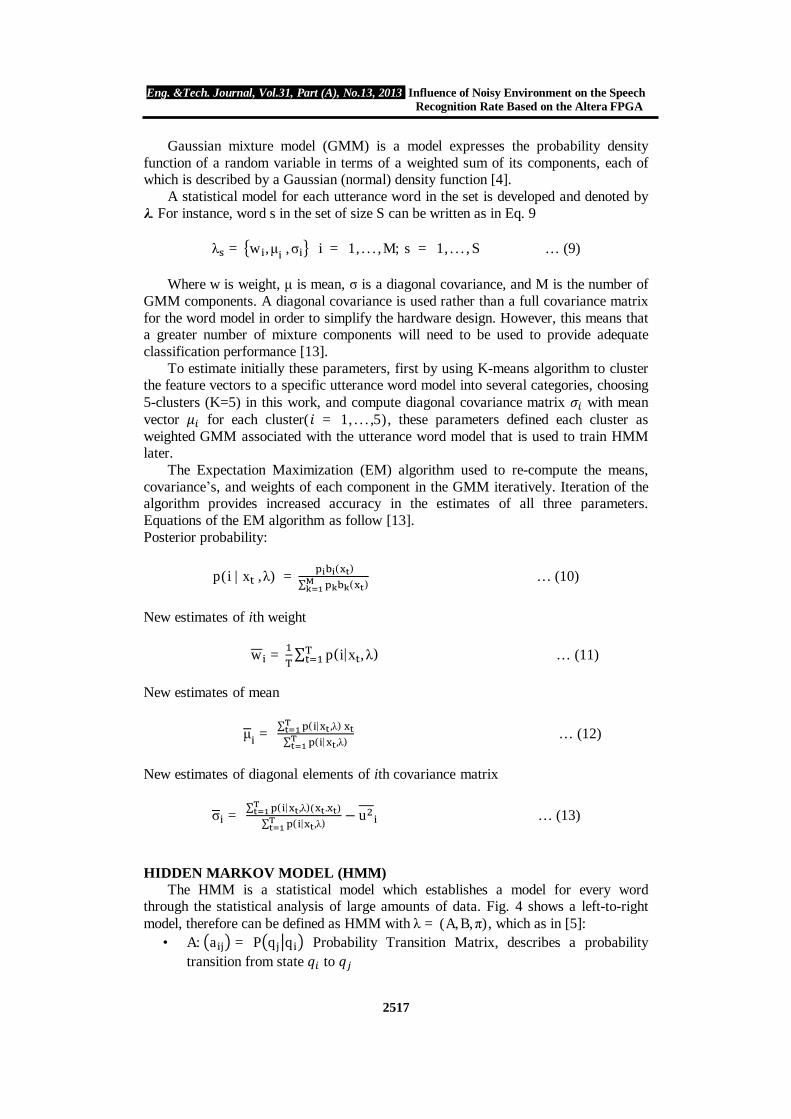
Gaussian mixture model (GMM) is a model expresses the probability density function of a random variable in terms of a weighted sum of its components, each of which is described by a Gaussian (normal) density function [4].
A statistical model for each utterance word in the set is developed and denoted by λ. For instance, word s in the set of size S can be written as in Eq. 9
λ = w , μ , σ i = 1, . . . , M; s = 1, . . . , S … (9)
Where w is weight, μ is mean, σ is a diagonal covariance, and M is the number of
GMM components. A diagonal covariance is used rather than a full covariance matrix for the word model in order to simplify the hardware design. However, this means that a greater number of mixture components will need to be used to provide adequate classification performance [13].
To estimate initially these parameters, first by using K-means algorithm to cluster the feature vectors to a specific utterance word model into several categories, choosing 5-clusters (K=5) in this work, and compute diagonal covariance matrix with mean vector for each cluster( = 1, . . . ,5), these parameters defined each cluster as weighted GMM associated with the utterance word model that is used to train HMM later.
The Expectation Maximization (EM) algorithm used to re-compute the means, covariance’s, and weights of each component in the GMM iteratively. Iteration of the algorithm provides increased accuracy in the estimates of all three parameters. Equations of the EM algorithm as follow [13]. Posterior probability: p(i | x , λ) = ( )∑ ( ) … (10)
New estimates of ith weight w = ∑ p(i|x , λ) … (11) New estimates of mean
μ = ∑ ( | ,λ) ∑ ( | ,λ) … (12) New estimates of diagonal elements of ith covariance matrix
σ = ∑ ( | ,λ)( . ) ∑ ( | ,λ) − u … (13)
HIDDEN MARKOV MODEL (HMM) The HMM is a statistical model which establishes a model for every word
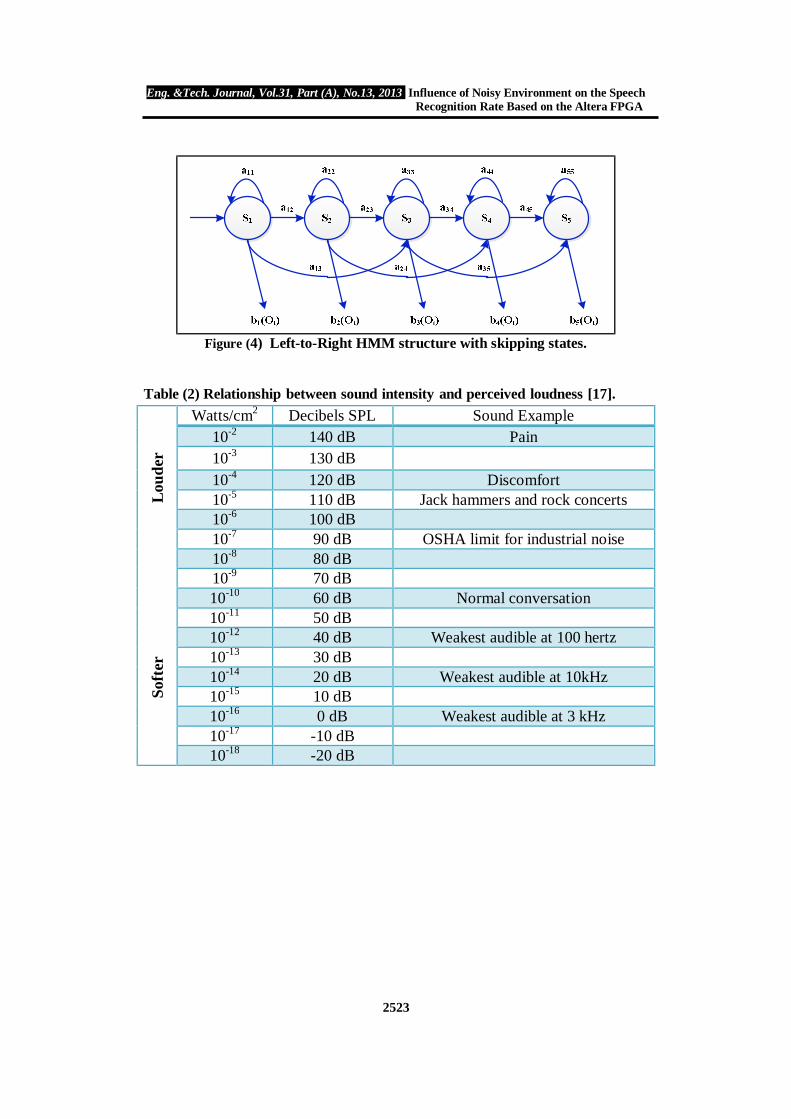
through the statistical analysis of large amounts of data. Fig. 4 shows a left-to-right model, therefore can be defined as HMM with λ = (A, B, π), which as in [5]:
• A: a = P q q Probability Transition Matrix, describes a probability transition from state to
Eng. &Tech. Journal, Vol.31, Part (A), No.13, 2013 Influence of Noisy Environment on the Speech Recognition Rate Based on the Altera FPGA
2518
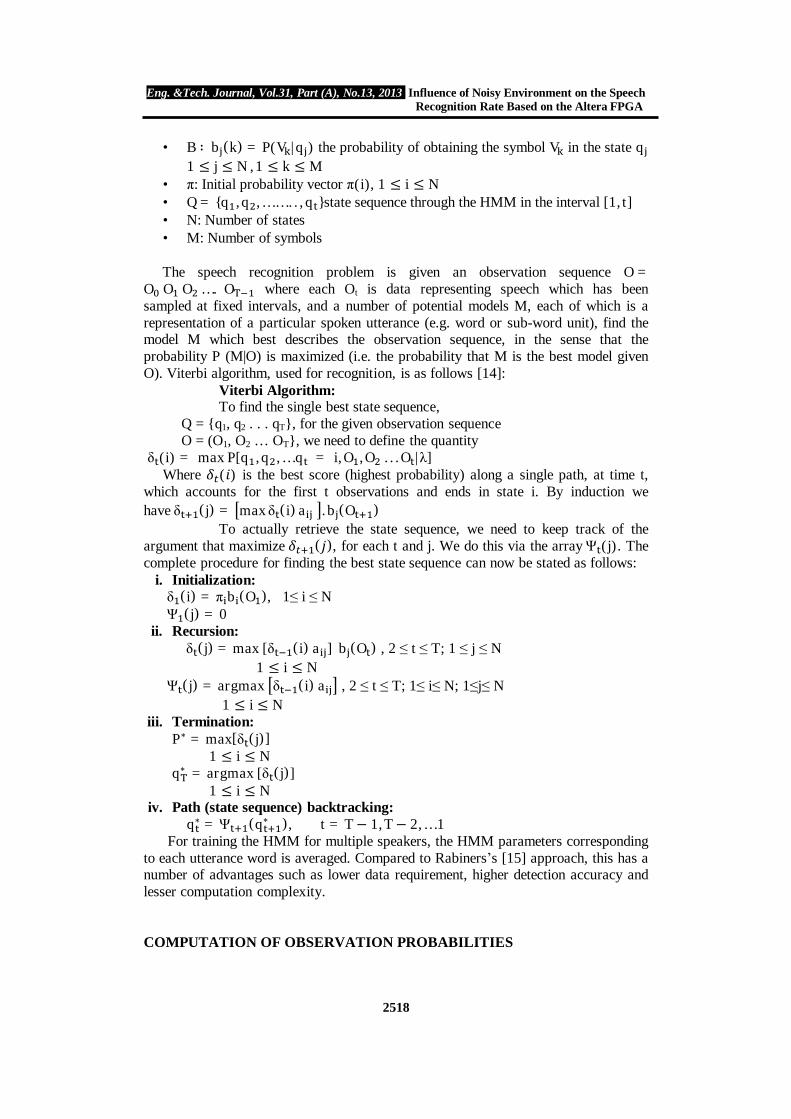
• B ∶ b (k) = P(V |q ) the probability of obtaining the symbol V in the state q 1 ≤ j ≤ N , 1 ≤ k ≤ M • π: Initial probability vector π(i), 1 ≤ i ≤ N • Q = {q , q , … … . . , q }state sequence through the HMM in the interval [1, t] • N: Number of states • M: Number of symbols
The speech recognition problem is given an observation sequence O =O O O …. O where each Ot is data representing speech which has been
sampled at fixed intervals, and a number of potential models M, each of which is a representation of a particular spoken utterance (e.g. word or sub-word unit), find the model M which best describes the observation sequence, in the sense that the probability P (M|O) is maximized (i.e. the probability that M is the best model given O). Viterbi algorithm, used for recognition, is as follows [14]:
Viterbi Algorithm: To find the single best state sequence,
Q = {q1, q2 . . . qT}, for the given observation sequence O = (O1, O2 … OT}, we need to define the quantity
δ (i) = max P[q , q , … q = i, O , O . . . O |λ] Where ( ) is the best score (highest probability) along a single path, at time t,
which accounts for the first t observations and ends in state i. By induction we have δ (j) = max δ (i) a . b (O )
To actually retrieve the state sequence, we need to keep track of the argument that maximize ( ), for each t and j. We do this via the array Ψ (j). The complete procedure for finding the best state sequence can now be stated as follows:
i. Initialization: δ (i) = π b (O ), 1≤ i ≤ N Ψ (j) = 0
ii. Recursion: δ (j) = max [δ (i) a ] b (O ) , 2 ≤ t ≤ T; 1 ≤ j ≤ N 1 ≤ i ≤ N
Ψ (j) = argmax δ (i) a , 2 ≤ t ≤ T; 1≤ i≤ N; 1≤j≤ N 1 ≤ i ≤ N iii. Termination: P∗ = max[δ (j)] 1 ≤ i ≤ N q ∗ = argmax [δ (j)] 1 ≤ i ≤ N iv. Path (state sequence) backtracking: q ∗ = Ψ (q ∗ ), t = T − 1, T − 2, … 1
For training the HMM for multiple speakers, the HMM parameters corresponding to each utterance word is averaged. Compared to Rabiners’s [15] approach, this has a number of advantages such as lower data requirement, higher detection accuracy and lesser computation complexity.
COMPUTATION OF OBSERVATION PROBABILITIES

Eng. &Tech. Journal, Vol.31, Part (A), No.13, 2013 Influence of Noisy Environment on the Speech Recognition Rate Based on the Altera FPGA
2519
Continuous HMMs, however, compute their observation probabilities based on feature vectors extracted from the speech waveform. The computation is typically based on uncorrelated multivariate Gaussian distributions, but can be further complicated by using Gaussian mixtures, where the final probability is the sum of a number of individually weighted Gaussian values. As with Viterbi algorithm, we can perform these calculations in the log domain, resulting in the Eq. 14 [16]
ln N O ; μ , σ = [− ln(2π) −∑ ln (σ )] − ∑ O − μ . σ ….(14)
Where O is a vector of observation values at time t; μ and σ are mean and
variance vectors respectively for state j; O , μ and σ are the elements of the aforementioned vectors, enumerated from 0 to L-1.
Note that the values in square brackets are dependent only on the current state, not the current observation, so can be computed in advance. For each vector element of each state, we now require a subtraction, a square and a multiplication. Because each of these calculations is independent of any other at time t, they can be performed in parallel if sufficient resources are available [16]. SOUND LEVEL MEASUREMENTS (EXTERNAL NOISE LEVEL VARIATION)
The relationship between sound intensity and perceived loudness is shown in Table (2), expressed as sound intensity on a logarithmic scale, called decibel SPL (Sound Power Level). On this scale, 0 dB SPL is a sound wave power of 10-6 watts/cm2, about the weakest sound detectable by the human ear. Normal speech is at about 60 dB SPL, while painful damage to the ear occurs at about 140 dB SPL [17]. In this work the level of external noise was considered as variable level test to study its effect on the speech recognition system without needed for building any types of filter. IMPLEMENTATION AND RESULTS
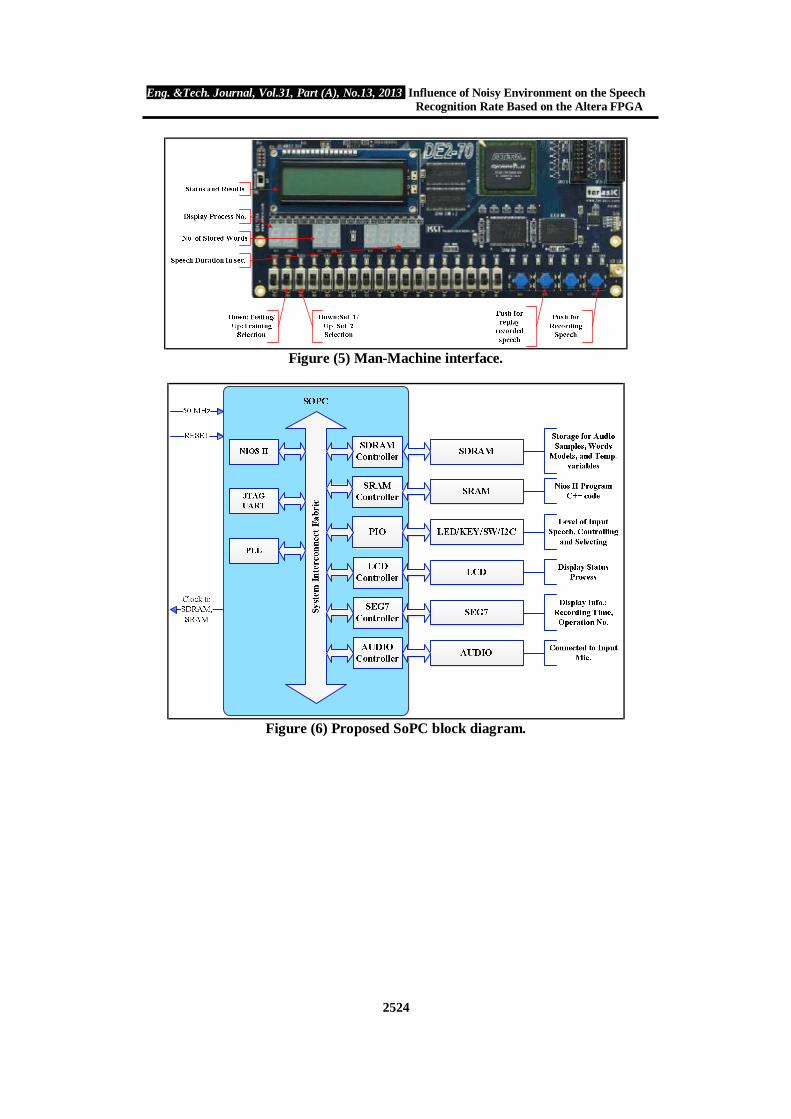
Altera provide soft-core processor called Nios II processor. This processor defined by the Hardware Description Language (HDL). The Nios II processor associated with memory and peripheral components are easily instantiated by using Altera SoPC Builder in conjunction with the Quartus® II software. Generally this system adopted HDL to define the hardware components required with the Nios II processor. Programming the functions of the recognition system is developed by using Nios II IDE/C++ development software. Altera DE2-70 development board with Cyclone II EP2C70F896C6N FPGA chip sitting on it was chosen to implement this work. Figures (5, 6) shows the functions interface and the block diagram of the system respectively.
This system is capable of running the training and recognition process in the same design. Acquire the real-time speech signal through microphone connected directly to the microphone-in jack of the Altera DE2-70 board. Sampling frequency is 16KHz, A/D Sigma-Delta type has 24-bit resolution. English digits 0 to 10 used as trained utterance words, each digit gain 3 samples and the duration of each training words was 1.5sec, however for each utterance word the total samples are 24000 samples. Only the effective and useful samples are chosen to feature extraction according to the pre-process operations.

Eng. &Tech. Journal, Vol.31, Part (A), No.13, 2013 Influence of Noisy Environment on the Speech Recognition Rate Based on the Altera FPGA
2520
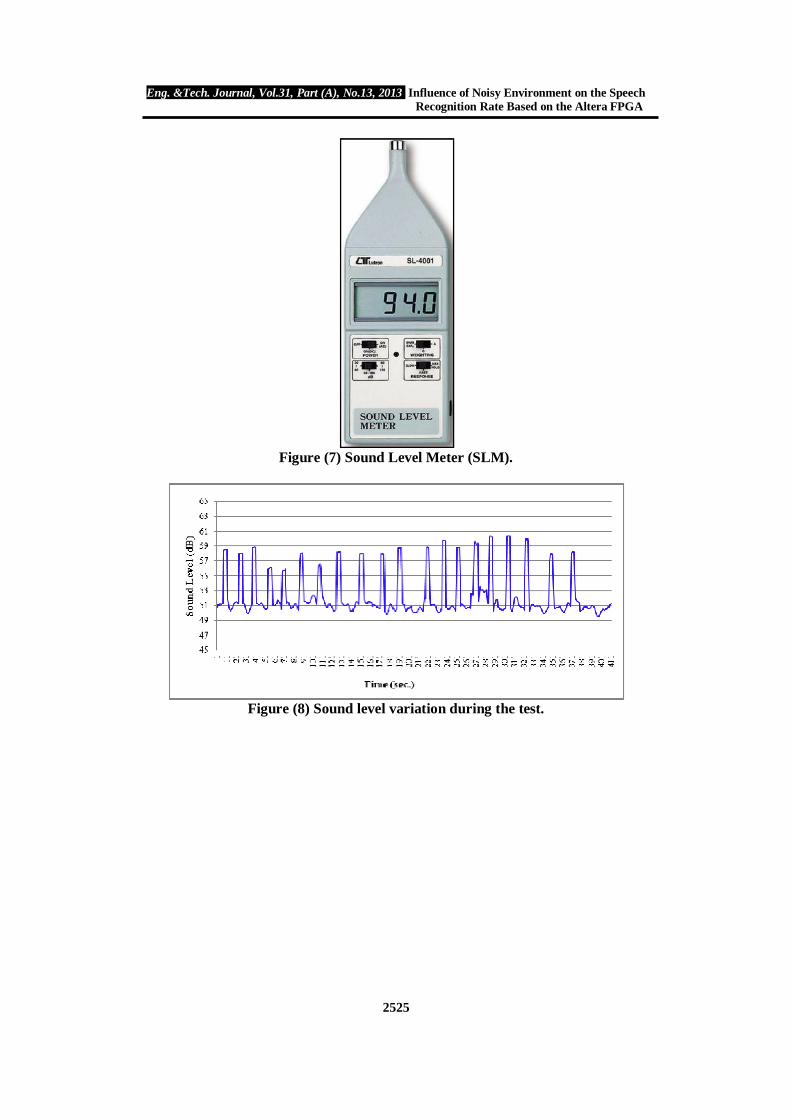
To study the effect of the sound of the surrounding environment on the recognition rate, an instrument known as Sound Level Meter (SLM), model SL-4001 as shown in Figure (7) was used in this test to measure the sound level in (dB).
Figure (8) shows reading samples of SLM instrument variation of the sound level of the surrounding, the base level represents the sound level of the room test, at each pulse uttered word occur, and the pulse width shows the duration of the utterance words. In this test, an external random white noise (uniformly distributed with zero mean and 16e3 variance) was used to obtain multilevel noise while recognition process passed.
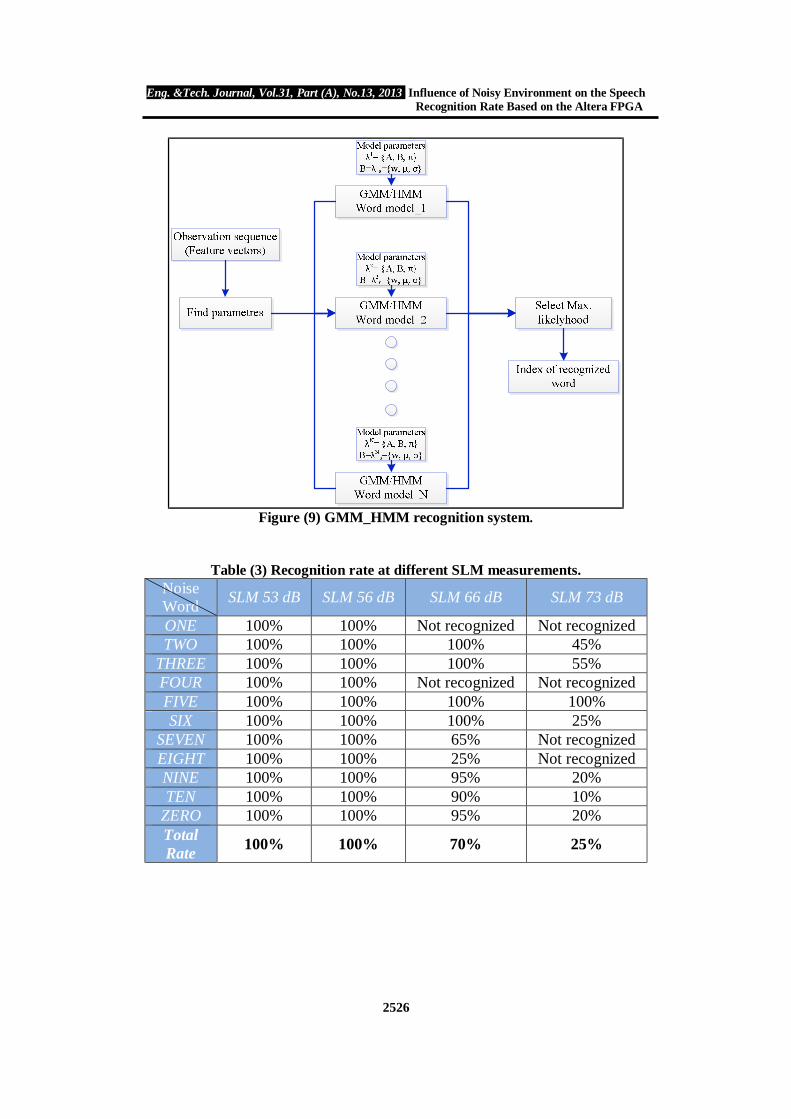
Figure (9) shows the GMM_HMM recognition system. The recognition results for the training words (digit/0 to digit/10) given accuracy 100% for the individual speaker. Table (3) shows the summary of the test taken into account the variation of the levels of the surrounding sounds.
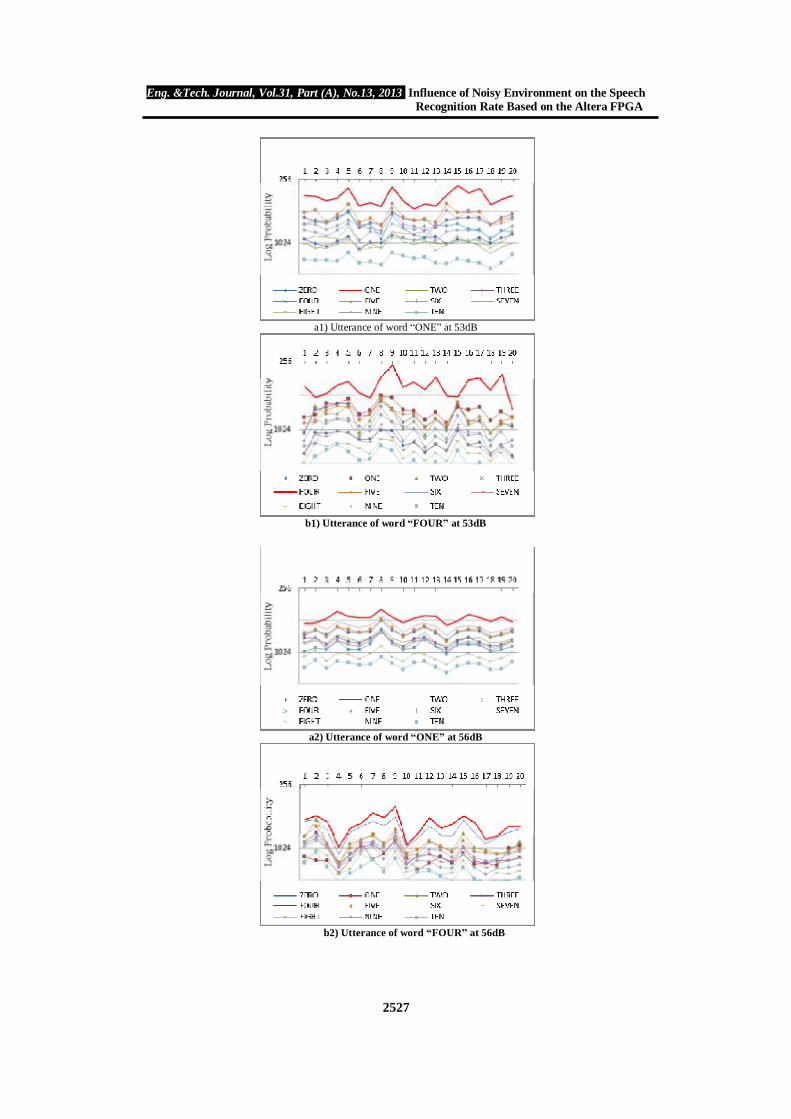
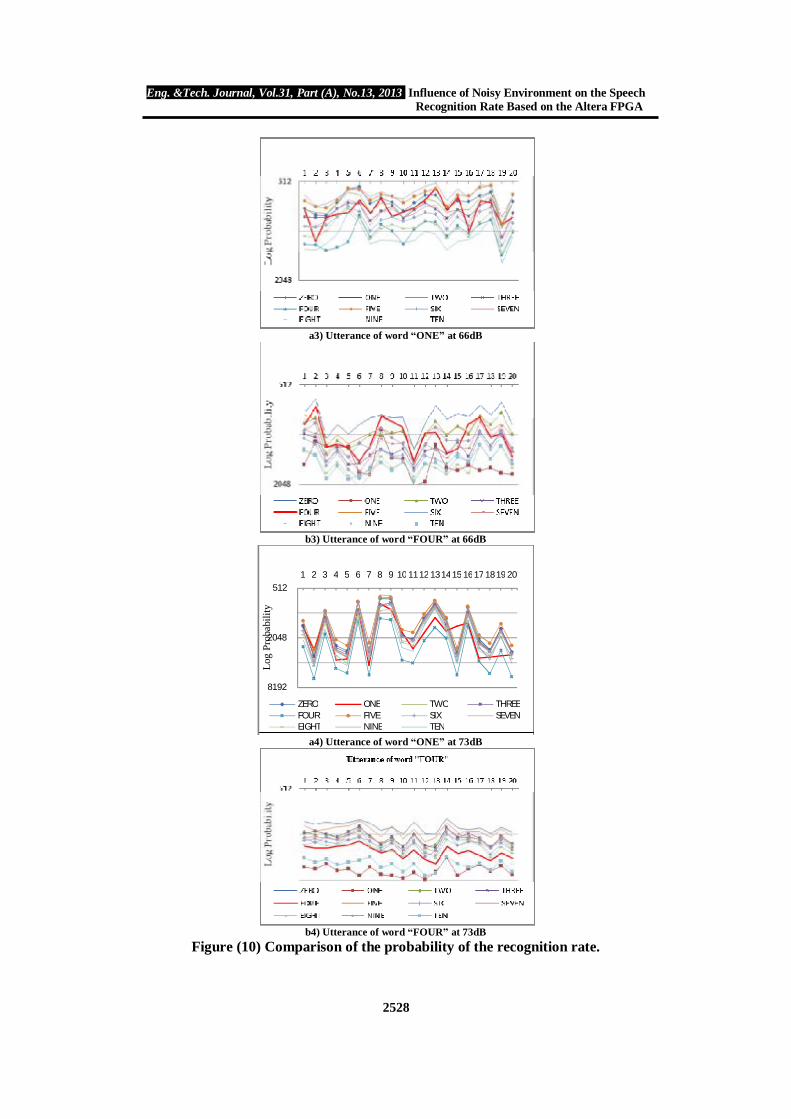
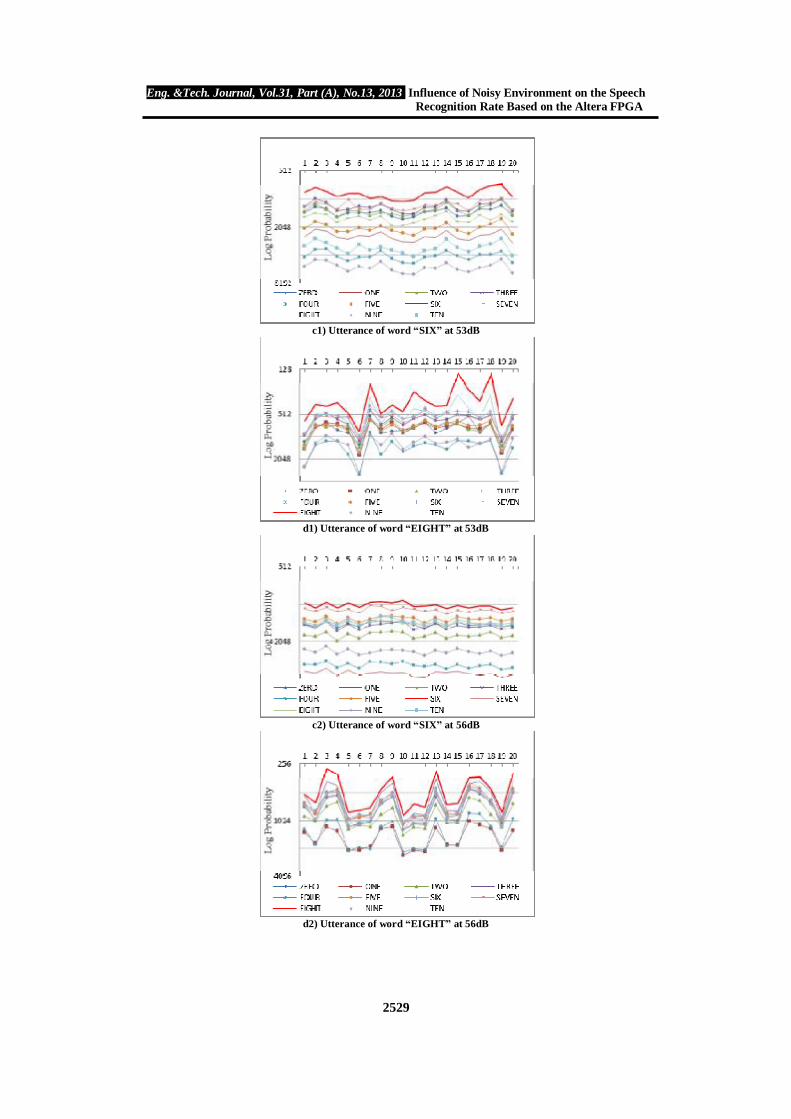
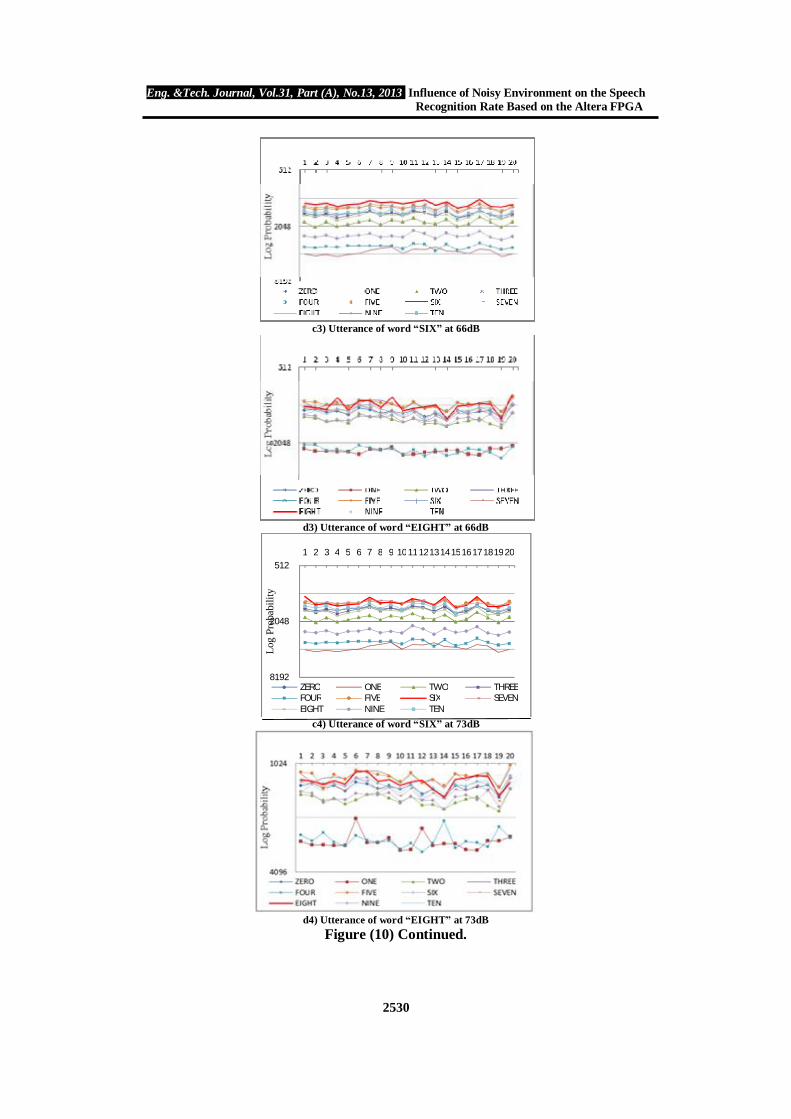
Figure (10) shows the comparison probability of the recognition probability of utterance words with each other labeled as (ONE, FOUR, SIX, and EIGHT) have been taken as example. Each word uttered as 20 times as test, the less probability, the most guess for the recognition word, as shown in the red line curves. CONCLUSIONS
MFCC method provides an excellent method to compression the audio signals by extracting the most features of the voice signal by converting it to multi-dimensional vector (i.e. for 4800 samples and by taking 13 coefficients to obtain compression ratio reached to 92.1% independent on the length of the audio samples. Taking an inverse of MFCC computations to get back the original speech data, therefore it’s easy to process the small amount of data.
The effect of the sound level of the environment on the uttered words has different effects not equally on the words recognition; some words have high sensitivity more than the other. This system is allowed to be used with somewhat loud environment (within certain limits), since the curves have a somewhat parallel property with each others. Those mean all the external sound effects (i.e. noise) have an equal effect on each recognition probability curve, make it capable to recognize an uttered word even with existence of noise.
To use this system with a very loud environment (i.e. into a noisy factory), the system should be retrained under this condition to be able to recognize the uttered word correctly.
Using SoPC to build Altera Nios II processor with C++ as programming language provided a suitable platform for implementation an embedded system and it is possible to modify it easily and quickly to meet our future requirements. REFERENCES [1].Tiwari,V. “MFCC and its applications in speaker recognition”, International
Journal on Emerging Technologies, India, ISSN 0975-8364, 2010. [2]. Wang,C. J.-Fa. Wang, and Y.-S. Weng, “Chip Design of MFCC Extraction for
Speech Recognition”, CiteSeer, Elsevier Science,Vol. 32, No. 1-2, PP. 111-131, November 2002.
[3]. Ning, D. “Developing an Isolated Word Recognition System in MATLAB”, Matlab Digest, Technical Articles, http://www.matworks.com, January 2010.
[4]. Beigi, H. “Fundamentals of Speaker Recognition”, Springer, e-ISBN 978-0-387-77592-0, 2011.
Eng. &Tech. Journal, Vol.31, Part (A), No.13, 2013 Influence of Noisy Environment on the Speech Recognition Rate Based on the Altera FPGA
2521
[5].S.Ke, Y.Hou, Z.Huang, and H.Li, “A HMM Speech Recognition System Based on FPGA”, IEEE, Congress on Image and Signal Processing, Vol. 5, PP. 305-309, 2008.
[6]. Kurcan, R.S. “Isolated Word Recognition from In-Ear Microphone Data Using Hidden Markov Models (HMM)”, M.Sc. thesis, Naval Postgraduate School, Turkish Naval Academy, March 2006.
[7]. PAN, S-T. C-F.CHEN, and J-H.ZENG, “Speech Recognition via Hidden Markov Model and Neural Network Trained by Genetic Algorithm”, Proceedings of the Ninth International Conference on Machine Learning and Cybernetics, Qingdao, PP. 2950-2955, IEEE, 11-14 July 2010.
[8]. Becchetti, C. and K.P.Ricotti, “Speech Recognition”, Choudhary Press Delhi, ISBN 978-81-265-1774-9, 2008.
[9]. Rabiner, L. R. and R. W. Schafer, “Digital Processing of Speech Signals”, Prentice Hall, ISBN 0-13-213603-1, 1978.
[10]. Sigurdsson, S. K.B.Petersen, and T.L.Schioler, “Mel Frequency Cepstral Coefficients: An Evaluation of Robustness of MP3 Encoded Music”, IMM Publications, Proceedings of the Seventh International Conference on Music Information Retrieval (ISMIR), PP. 286-289, October 2006.
[11]. Slaney, M. “Auditory Toolbox: A MATLAB Toolbox for Auditory Modeling Work”, Interval Research Corporation, Technical Report, Ver. 2, 1998.
[12]. Zheng,F. G.Zhang, and Z.Song, “Comparison of Different Implementations of MFCC”, Journal of Computer Science and Technology, Vol. 16, No. 6, PP. 582-589, Sept. 2001.
[13]. Ehkan, P. T.Allen, and S.F. Quigley, “FPGA Implementation for GMM-Based Speaker Identification”, Hindawi Publishing Corporation, International Journal of Reconfigurable Computing, Vol. 2011, Article ID 420369, 8 pages, ISSN 16877195, 2011.
[14]. Amudha,V. B.Venkataramani, R. Vinoth kumar, and S. Ravishankar, “Software/Hardware Co-Design of HMM Based Isolated Digit Recognition System”, Academy Publisher, Journal of Computers, Vol. 4, No. 2, PP. 154-159, ISSN 1796203X, February 2009.
[15]. Rabiner, L. & B. Juang, “Fundamentals of Speech Recognition”, Printice-Hall International, Inc., ISBN: 0-13-285826-6, 1993.
[16]. Melnikoff,S.J. S.F.Quigley, and M.J.Russel, “Speech recognition on a FPGA Using Discrete and Continuous Hidden Markov Models”,12th International Conference on Field Programmable Logic and Applications,2002.
[17]. Smith, S.W. “Digital Signal Processing”, California Technical Publishing, 2nd Edition, ISBN 0-9660176-6-8, 1999.
Eng. &Tech. Journal, Vol.31, Part (A), No.13, 2013 Influence of Noisy Environment on the Speech Recognition Rate Based on the Altera FPGA
2522
MicrophoneAnalog Anti-
Aliasing Filter
Sampling and A/D
Converter
Pre-Emphasis
End-Points DetectionTo Analysis
Mean Remove
(DC level)
Figure (1) Speech pre-processing flow.
Windowing(Hamming) |FFT|
Log10 |.|Discrete Cosine Transform (DCT)
Mel-Frequency Filter Bank
1E+12MFCC+ΔE+ΔMFCC
Multi-dimensional Features Vector
Speech from Pre-Propcess
Figure (2) An outline of the processes in MFCC.
Figure (3) Mels versus Frequency for the entire audible range [5].
Table (1) Filter banks parameters.
Lowest Frequency(Hz)* Linear Filters
Linear Spacing Log Filters Log
Spacing 133.3333 13 66.6666 27 1.07117
Total Filters(M) = 40 *Auditory toolbox used in MATLAB suppresses frequencies below approximately 133Hz.
Eng. &Tech. Journal, Vol.31, Part (A), No.13, 2013 Influence of Noisy Environment on the Speech Recognition Rate Based on the Altera FPGA
2523
Figure (4) Left-to-Right HMM structure with skipping states.
Table (2) Relationship between sound intensity and perceived loudness [17].
S
ofte
r
Lo
uder
Watts/cm2 Decibels SPL Sound Example 10-2 140 dB Pain 10-3 130 dB 10-4 120 dB Discomfort 10-5 110 dB Jack hammers and rock concerts 10-6 100 dB 10-7 90 dB OSHA limit for industrial noise 10-8 80 dB 10-9 70 dB 10-10 60 dB Normal conversation 10-11 50 dB 10-12 40 dB Weakest audible at 100 hertz 10-13 30 dB 10-14 20 dB Weakest audible at 10kHz 10-15 10 dB 10-16 0 dB Weakest audible at 3 kHz 10-17 -10 dB 10-18 -20 dB
Eng. &Tech. Journal, Vol.31, Part (A), No.13, 2013 Influence of Noisy Environment on the Speech Recognition Rate Based on the Altera FPGA
2524
Figure (5) Man-Machine interface.
Figure (6) Proposed SoPC block diagram.
Eng. &Tech. Journal, Vol.31, Part (A), No.13, 2013 Influence of Noisy Environment on the Speech Recognition Rate Based on the Altera FPGA
2525
Figure (7) Sound Level Meter (SLM).
Figure (8) Sound level variation during the test.
Eng. &Tech. Journal, Vol.31, Part (A), No.13, 2013 Influence of Noisy Environment on the Speech Recognition Rate Based on the Altera FPGA
2526
Figure (9) GMM_HMM recognition system.
Table (3) Recognition rate at different SLM measurements. Noise Word SLM 53 dB SLM 56 dB SLM 66 dB SLM 73 dB
ONE 100% 100% Not recognized Not recognized TWO 100% 100% 100% 45%
THREE 100% 100% 100% 55% FOUR 100% 100% Not recognized Not recognized FIVE 100% 100% 100% 100% SIX 100% 100% 100% 25%
SEVEN 100% 100% 65% Not recognized EIGHT 100% 100% 25% Not recognized NINE 100% 100% 95% 20% TEN 100% 100% 90% 10%
ZERO 100% 100% 95% 20% Total Rate 100% 100% 70% 25%
Eng. &Tech. Journal, Vol.31, Part (A), No.13, 2013 Influence of Noisy Environment on the Speech Recognition Rate Based on the Altera FPGA
2527
a1) Utterance of word “ONE” at 53dB
b1) Utterance of word “FOUR” at 53dB
a2) Utterance of word “ONE” at 56dB
b2) Utterance of word “FOUR” at 56dB
Eng. &Tech. Journal, Vol.31, Part (A), No.13, 2013 Influence of Noisy Environment on the Speech Recognition Rate Based on the Altera FPGA
2528
a3) Utterance of word “ONE” at 66dB
b3) Utterance of word “FOUR” at 66dB
a4) Utterance of word “ONE” at 73dB
b4) Utterance of word “FOUR” at 73dB
Figure (10) Comparison of the probability of the recognition rate.
512
2048
8192
1 2 3 4 5 6 7 8 9 10 11 12 13 14 15 16 17 18 19 20
Log
Prob
abili
ty
ZERO ONE TWO THREEFOUR FIVE SIX SEVENEIGHT NINE TEN
Eng. &Tech. Journal, Vol.31, Part (A), No.13, 2013 Influence of Noisy Environment on the Speech Recognition Rate Based on the Altera FPGA
2529
c1) Utterance of word “SIX” at 53dB
d1) Utterance of word “EIGHT” at 53dB
c2) Utterance of word “SIX” at 56dB
d2) Utterance of word “EIGHT” at 56dB
Eng. &Tech. Journal, Vol.31, Part (A), No.13, 2013 Influence of Noisy Environment on the Speech Recognition Rate Based on the Altera FPGA
2530
c3) Utterance of word “SIX” at 66dB
d3) Utterance of word “EIGHT” at 66dB
c4) Utterance of word “SIX” at 73dB
d4) Utterance of word “EIGHT” at 73dB
Figure (10) Continued.
512
2048
8192
1 2 3 4 5 6 7 8 9 10 11 12 13 14 15 16 17 18 19 20
Log
Prob
abili
ty
ZERO ONE TWO THREEFOUR FIVE SIX SEVENEIGHT NINE TEN