Embed Size (px)
Citation preview
* Corresponding author.
1944-3994/1944-3986 © 2020 Desalination Publications. All rights reserved.
Desalination and Water Treatment www.deswater.com
doi: 10.5004/dwt.2020.25125
181 (2020) 436–446March
Influence of natural and synthetic blended polymers on the electrospun PVA/chitosan/PANI composite nanofibers to be used for dye decolorization
M.A. Khalila, M.F. El-Kadyb,c, G.M. El-Subruitia, E.M. El-Sayedb,*aFaculty of Science-Alexandria University, Advanced Technology and New Materials Research Institute (ATNMRI), City of Scientific Research and Technological Applications, emails: [email protected] (M.A. Khalil), [email protected] (G.M. El-Subruiti) bFabrication Technology Research Department, Advanced Technology and New Materials Research Institute (ATNMRI), City of Scientific Research and Technological Applications, Tel. 01227155270; email: [email protected] (E.M. Mohamed El-Sayed) cChemical Engineering - Chemical and Petroleum Engineering Department Egypt-Japan University of Science and technology (E-JUST), email: [email protected] (M.F. El-Kady)
Received 29 June 2019; Accepted 3 November 2019
a b s t r a c tIn this work, mixing polyvinyl alcohol (PVA), chitosan (CS) and polyaniline (PANI) to prepare composite nanofibers with improved adsorption capacity using electrospinning technique has been studied, Thereby overcoming the difficulty of producing PANI nanofibers. The morphologies of the prepared nanocomposites were fully examined by SEM, Fourier transform infrared spectroscopy and X-ray diffraction measurements. Results indicated that the blended PVA/CS/PANI-based nano-fibers exhibited better size morphology with smaller diameter than (PVA/PANI) and pure polyani-line. Batch experiments were conducted using the prepared (PVA/PANI/CS) composite to study its affinity for dye decolorization. Different factors affecting the adsorption process such as contact time, initial dye concentration, temperature and pH were optimized. The maximum percentage removal was found to be 96% at 300 rpm using adsorbent dose of 60 mg and temperature of 25°C and initial dye concentration 50 ppm. Also, the adsorption isotherms, kinetics and thermodynamics for the removal process were studied. The adsorption process followed Freundlich isotherm and pseudo-first order kinetics.
Keywords: Electrospinning; Polyaniline; Chitosan; Polyvinyl alcohol; Nanofibers
1. Introduction
Dyes are common hazardous contaminants that can cause detrimental effects on environment and natural water sources. Hence, the removal of these organic pollutants from water system is a priority for ensuring a safe and clean envi-ronment. From the view point of simplicity and economy, the acid dyes such as acid blue 25 removal is difficult because of the complexity of aromatic structure as well as the synthetic origin of these contaminants [1,2]. Thus, for the removal of such dyes from aqueous mediums, efficient treatment
procedures are required; they tend to pass through the tradi-tional treatment [3]. Adsorption has become the most widely used technology for simultaneous water deep purification [4–6]. Adsorption processes have many applications for the removal and recovery of metals, dyes, oils, organic mixtures and pharmaceuticals from water [7], with the gradual devel-opments of new adsorbent materials, the field of adsorption became broader and specific in nature for particular pollut-ants including heavy metals, phenols, antibiotics, and pesti-cides [8]. Among the various adsorbents, polyaniline (PANI) containing plenty amount of positively charged amine and imine groups has drawn tremendous attention due to its ease
437M.A. Khalil et al. / Desalination and Water Treatment 181 (2020) 436–446
of synthesis, low cost, remarkable environmental stability and reversibility [9,10]. Although natural polymers are more favored because of their natural occurring, biocompatibility and biodegradability [11], synthetic polymers have better thermal stability and mechanical properties [12–14]. Thus, blending synthetic polymers such as polyaniline and poly-vinyl alcohol with natural polymer such as chitosan may form a polymeric composite with physical and chemical properties compared with those of single components [12]. The advanced nanocomposites play an important role in the environmental protection due to their specificity, selectivity, and a wide range of usability; great efforts have been done to improve the chemical, mechanical, and thermal stabili-ties of composites so they can be used as a selective mate-rial for removal of heavy metals and dyes [15]. Nanofibers produced by electrospinning have attracted growing inter-ests for biological and chemical separations. Electrospinning is a processing technique in which an electrically charged jet of polymer solution is captured on a grounded collector plate. The electrical charge of the polymer solution allows the polymer to form uniform and very thin fibers, commonly known as electrospun nanofibers. The electrospinning pro-cess results in a product with a high surface area-to-volume ratio, which makes it ideal for many applications [16,17]. Some of the many uses of electrospun nanofibers include as adsorbents for protein purification [18,19], as scaffolds for tissue engineering [20], in nanocomposites, in materials for fuel cells, solar cells, Li-ion batteries, and supercapacitors [21] and in water treatment in the form of non-carbonized filtration membranes [22]. Electrospun nanofiber membranes can be used as either an adsorbent material [23]. In this work, different polyaniline mixtures with polyvinyl alcohol (PVA) or chitosan (CS)/PVA were electrospun to produce nanofibers (NFs). The influence of blending different poly-mers was studied and optimized based on SEM images of the produced nanofibers. Batch experiments were conducted using the best prepared composites to study its efficiency for dye decolorization.
2. Materials and methods
2.1. Materials
Chloroform, glacial acetic acid, glutaraldehyde (25% aqueous solution), hydrochloric acid (37%), potassium dichro mate and sodium hydroxide were purchased from Sigma-Aldrich, USA. Acid blue 25, ethanol, and N,N-dimethylformamide were obtained from Fisher Scientific, USA. Chitosan was obtained from Bio Basic Inc., Canada. Aniline monomer was purchased from Oxford Lab Chem, India. Polyvinyl alcohol (M.wt = 72.000 g/mol, Degree of polymerization 1,700–1,800) was obtained from Qualikems Fine Chemicals Pvt. Ltd., India.
2.2. Preparation of polyaniline nanoparticles (PANI)
Polyaniline nanoparticles were synthesized by oxida-tive polymerization of aniline monomer by using potassium dichromate as oxidizer according to the method of Zoromba et al. [24] with some modifications to simplify the preparation process and increasing the yield, where a mixture of 20 mL conc. HCl, 10 mL aniline monomer and 10 mL distilled water
were stirred vigorously for 15 min, then 50 mL of K2Cr2O7 (0.44 M) solution was added to the mixture dropwise during vigorous stirring, then the total volume was completed to 100 mL by distilled water. The precipitated PANI was filtered and washed with ethanol and distilled water several times then dried at 60°C for 24 h in an oven.
2.3. Preparation of polyaniline nanofibers
Polyaniline nanofibers were prepared with electrospin-ning of pure polyaniline solution. 100 mg of polyaniline were dispersed in 10 mL chloroform. The solution was stirred for 6 h. The solution was then set on an electrospin-ning setup (NANON, Germany) to form the nanofiber on aluminum foil under a voltage of 35 kV. The working dis-tance between nozzle to collector was 15 cm and the flow rate was 0.3 mL h−1.
2.4. Preparation of PANI/PVA nanofibers
PANI/PVA nanofibers were prepared using direct elec-trospinning route. All the electrospinning parameters were optimized. In a typical synthesizer, three solutions of differ-ent PVA and PANI ratios were prepared by adding different amounts of PANI NPs to 5 wt.% PVA solution in a mixture of solvents (H2O:DMF) (1:1). The mixture is vigorously stirred at 80°C for 1 h till obtaining clear viscous solution then cooled to room temperature, three different amounts of PANI NPs (0.5, 1, 2.5 wt.%) were added to the previous solution with stirring till a viscous homogeneous solutions was obtained. The precursor solution was set on an electrospinning setup for nanofiber formation under a voltage of 35 kV. PANI/PVA nanofibers were collected on aluminum foil with a nozzle to collector distance of 15 cm and a flow rate of 0.3 mL/h.
2.5. Preparation of (PVA/PANI/CS) nanofibers
Three solutions with different PVA, PANI and CS ratios were prepared by adding different amounts of PANI and CS to 5 wt.% solution of PVA in solvent mixture of (H2O:DMF). 1.5 g of PVA was dissolved in 200 mL mixture of (H2O:DMF) (1:1) by vigorous stirring at 80°C for 1 h till complete dissolu-tion, three different amounts of PANI NPs (3.0, 6.0 and 6.0 g) were added to the previous PVA solution under stirring till a viscous homogeneous solution was obtained. Then differ-ent amounts of chitosan (3.0, 3.0 and 1.5 g) were dissolved in 100 mL 3% acetic acid solution in distilled water by vigorous stirring at 80°C for 1 h. The chitosan solutions were mixed with the previously prepared (PVA/PANI) solution, respec-tively. The precursor solution was set on an electrospinning setup for nanofiber formation under a voltage of 35 kV. PVA/PANI/CS nanofibers were collected on aluminum foil with a nozzle to collector distance of 15 cm and a flow rate of 0.3 mL/h.
2.6. Cross-linking of PANI-composites
Cross-linking is a must for hydrophilic polymers (PVA and CS) to decrease their solubility in water and increase their stability under extreme conditions of temperature, pH and pressure [25]. The cross-linking reaction of the polymeric
M.A. Khalil et al. / Desalination and Water Treatment 181 (2020) 436–446438
chains was carried out by adding 100 µL glutaraldehyde for each 100 mL of polymer solution with vigorous stirring at 60°C for 1 h. The solution was stored in refrigerator overnight before the electrospinning process [26].
2.7. Measurements and characterization of the prepared nanofibers
The morphology of the prepared PANI nanoparticles and fabricated PANI-based nanofibers was determined by using SEM (JEOL JSM 6360LA, Japan). The X-ray diffraction (XRD) pattern of the samples was determined by X-ray dif-fractometer (Shimadzu-7000, Japan). The Fourier transform infrared spectroscopy (FTIR) spectra were determined by Fourier Transform Infrared Spectrophotometer (Shimadzu FTIR-8400 S, Japan). The thermal stability of the samples was studied by using Thermo Gravimetric Analyzer (Shimadzu TGA-50, Japan). Measurement of Brunauer–Emmett–Teller (BET) surface area was performed using N2 adsorption/desorption isotherms using Belsorp II mini (BEL Japan Inc).
2.8. Batch adsorption for dye decolorization
The optimized PVA/CS/PANI composite nanofibers have been prepared with high thickness. A series of batch experiments were performed to study the removal of AB 25 using these nanofibers. The several processing parameters affecting the adsorption process, contact time, initial dye concentration, temperature and pH were studied, as well as studying the adsorption isotherms, kinetics and thermo-dynamics of the process have been considered. The initial and final dye concentrations for all solutions were measured using UV-Visible spectrophotometer (T70 single split beam), then the percentage of dye removal %R was calculated from the following equation:
%RC CC
=−
×0
0
100 (1)
where %R is the percentage of removal, C0 and C are the ini-tial and final dye concentrations (mg/L), respectively. The amount of dye adsorbed (qt) at different time intervals (t) was determined from the following equation:
qC CmV
tt=
−0 (2)
where qt (mg/g) is the adsorption capacity at time t, C0 (mg/L) is the initial dye concentration, Ct (mg/L) is the dye concen-tration at time t, V (L) is the volume of the solution, and m (g) is the mass of PVA/CS/PANI nanofibers used [27].
3. Results and discussions
3.1. Electrospinning of PVA/PANI-based composite
No fibers are formed by the electrospinning of pure PANI solution; this is due to the low density of PANI poly-mer solution, where pure PANI cannot form true solution because it is partially dissolved and it is just dispersed well with other polymers to be electrospun [28]. So, another
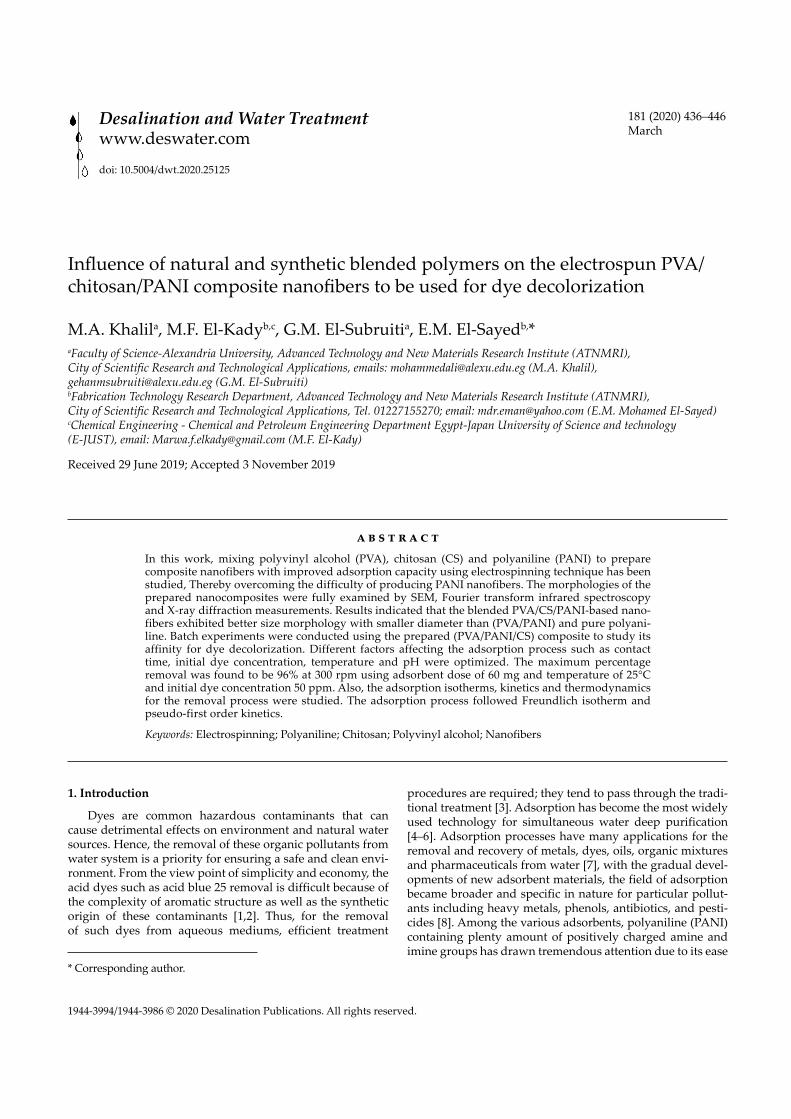
polymer should be blended with PANI to obtain viscous polymer solution which can be electrospun easily. First, we blended PANI and PVA with different ratios. SEM images of the PANI-based composites nanofibers with different ratios of PVA to PANI (10:1), (5:1) and (2:1) are shown in Figs. 1a–c, respectively.
It was found that by increasing the concentration of PANI, the prepared nanofibers diameters decrease in addi-tion to the decrease of beads number. But it was observed that by increasing the concentration of PANI to a certain amount, excess PANI nanoparticles were observed to be non-dispersed which restrict the electrospinning process due to block out of the syringe needle with time.
So, the optimum blending ratio of PVA/PANI is con-sidered to be 5:1. As an attempt to decrease the diameter of the fabricated PANI composite nanofibers, the effect of add-ing another polymer has been investigated.
3.2. Electrospinning of PVA/CS/PANI composite
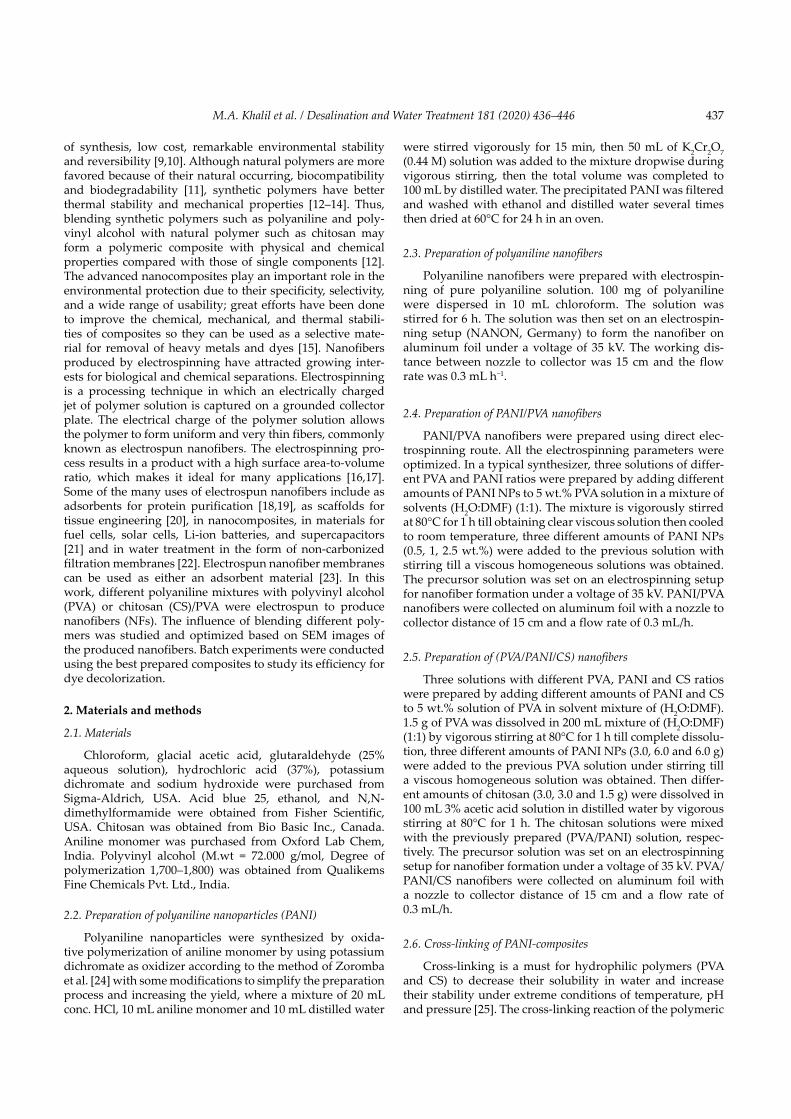
The SEM images of the PVA/CS/PANI nanofibers with different concentration ratios of PVA:PANI:CS 5:1:1, 5:2:1 and 5:2:0.5 are shown in Fig. 2, where the effect of PANI and CS concentrations can be explained. A uniform nanofi-ber that is free from beads with average diameter of 35 nm was fabricated at PVA:PANI:CS mixing ratio of 5:1:1 as illus-trated from Fig. 2a. The increase of PANI concentration in the presence of chitosan increases the average diameter to about 49 nm as shown in Fig. 2b. As shown from Fig. 2c, the average nanofiber diameter was increased to about 87 nm that implies the negative effect of decreasing chitosan concentration.
All in all, adding chitosan to PANI-composites nanofi-bers decrease the diameters of the formed nanofibers and decrease the presence of beads. Also, chitosan has a great effect on improving the morphology of the nanofibers, in addition to making the electrospinning process easier. Also chitosan’s functional groups and natural chelating properties make chitosan useful for the binding and removal of dif-ferent types of water pollutants. Finally, the best prepared PANI-composite nanofibers were the nanofibers prepared by electrospinning of polymer solution with concentration ratio PVA:PANI:CS 5:1:1 at conditions of flow rate 0.3 mL/h, applied voltage 35 kV and travel distance 15 cm; this com-posite will be used for further studies.
3.3. Characterization of the best fabricated PANI-based composite nanofiber
3.3.1. Transmission electron microscope
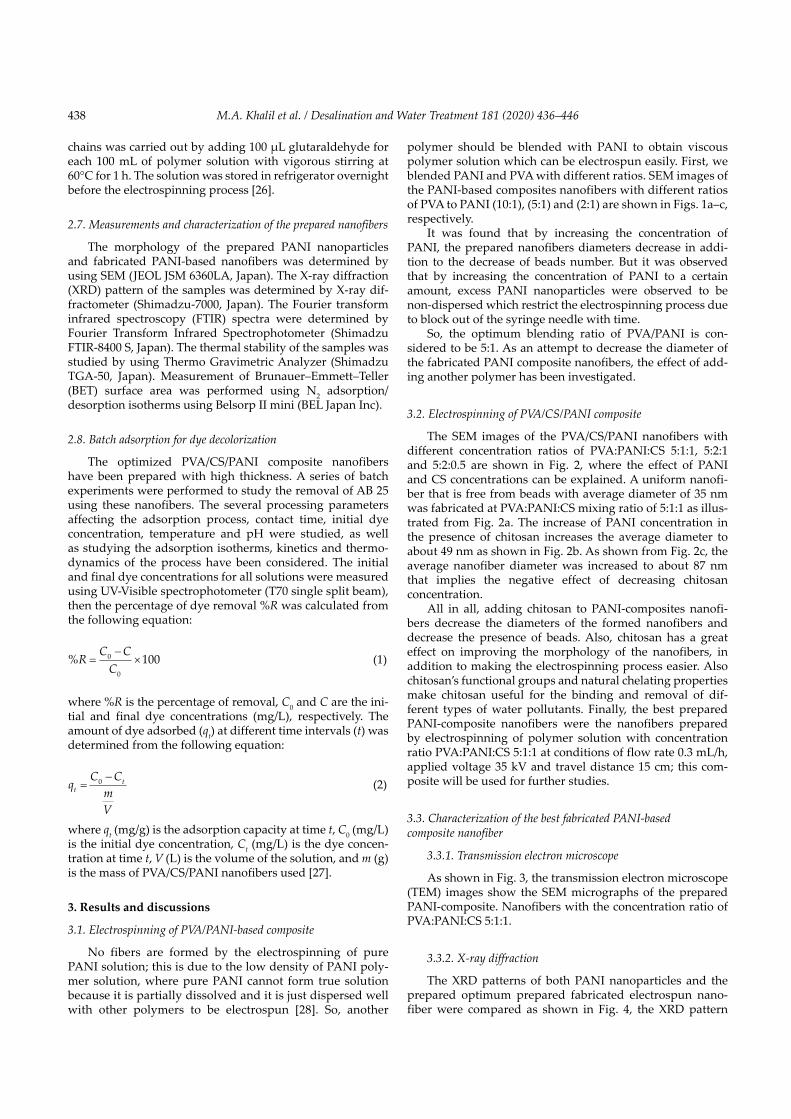
As shown in Fig. 3, the transmission electron microscope (TEM) images show the SEM micrographs of the prepared PANI-composite. Nanofibers with the concentration ratio of PVA:PANI:CS 5:1:1.
3.3.2. X-ray diffraction
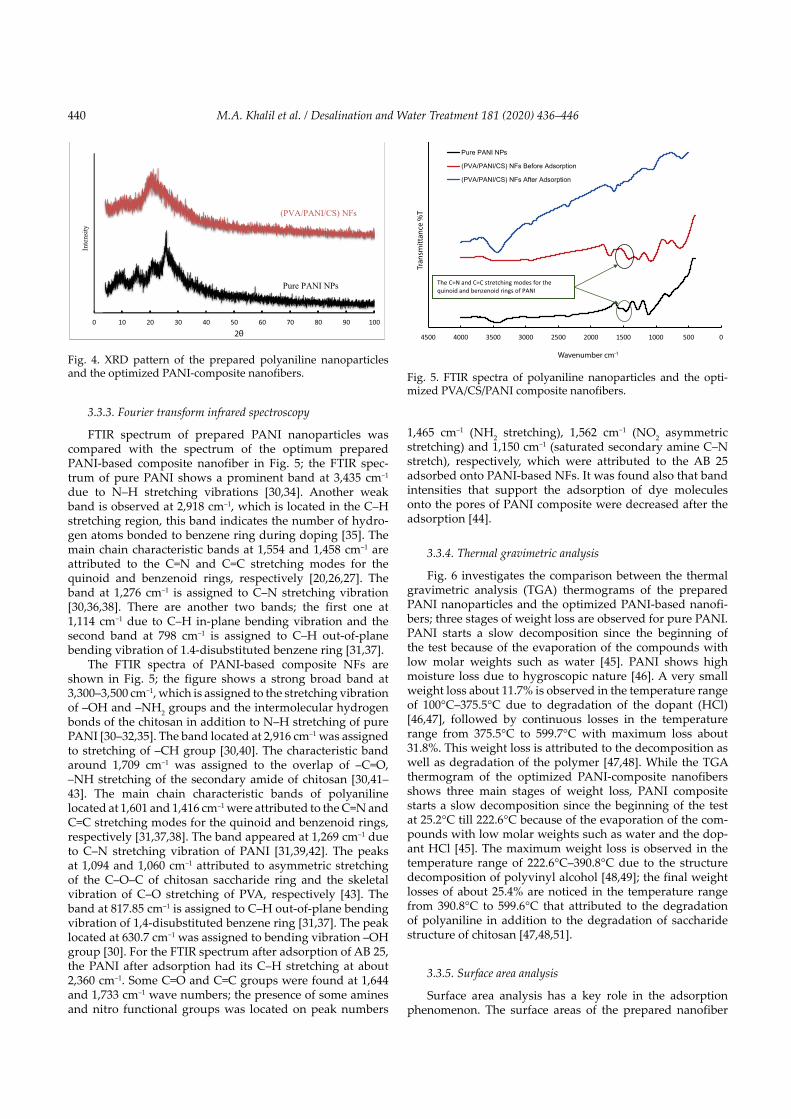
The XRD patterns of both PANI nanoparticles and the prepared optimum prepared fabricated electrospun nano-fiber were compared as shown in Fig. 4, the XRD pattern
439M.A. Khalil et al. / Desalination and Water Treatment 181 (2020) 436–446
of the prepared polyaniline nanoparticles shows four sharp peaks at 2θ of 25.57°, 26.82°, 20.70° and 15.23°. This confirms the crystalline structure of the synthesized PANI due to pla-nar nature of benzenoid and quinoid units in PANI chain [29]. The XRD pattern of the optimized PANI-based com-posite nanofibers shows three peaks at 2θ of 20.14°, 19.34° and 21.02°, which are corresponding to the characteristic peaks of chitosan [30,31], polyvinyl alcohol [30,32,33] and PANI, respectively. This XRD pattern confirms that the
PANI-composite nanofibers are less in crystallinity com-pared with the synthesized PANI nanoparticles due to the presence of PVA and CS [33], where chitosan is known as a partially crystalline polymer, and its crystalline nature exhib-ited due to the accumulation of linear chains in the structure of chitosan through inter-molecular and intra-molecular hydrogen bonding between hydroxyl and amino groups in chitosan [29,30], also polyvinyl alcohol is known by its semi crystalline nature [29,31,32].
Fig. 1. SEM images of (PVA/PANI) composites nanofibers.
Fig. 2. SEM images of PVA/CS/PANI composites nanofibers with different concentration ratios of PVA:PANI:CS. (a) 5:1:1, (b) 5:2:1, and (c) 5:2:0.5.
Fig. 3. TEM images of the optimized PANI-composite nanofibers with the concentration ratio of PVA:PANI:CS 5:1:1.
M.A. Khalil et al. / Desalination and Water Treatment 181 (2020) 436–446440
3.3.3. Fourier transform infrared spectroscopy
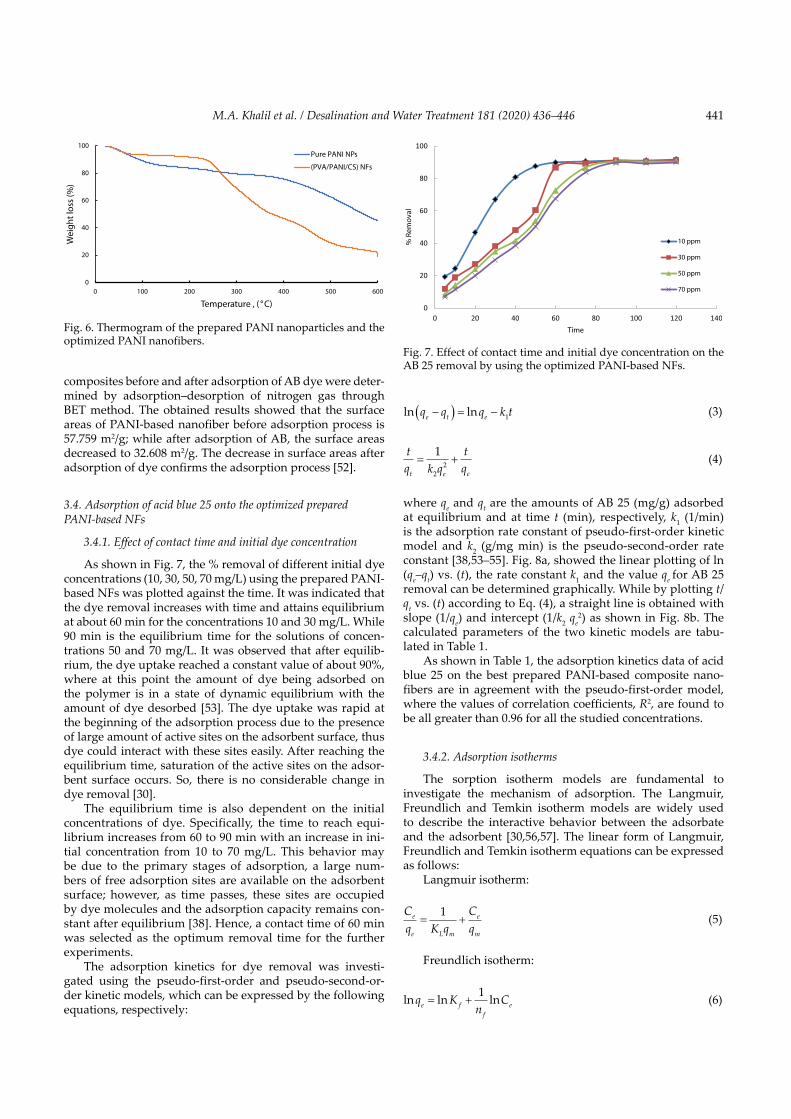
FTIR spectrum of prepared PANI nanoparticles was compared with the spectrum of the optimum prepared PANI-based composite nanofiber in Fig. 5; the FTIR spec-trum of pure PANI shows a prominent band at 3,435 cm−1 due to N–H stretching vibrations [30,34]. Another weak band is observed at 2,918 cm–1, which is located in the C–H stretching region, this band indicates the number of hydro-gen atoms bonded to benzene ring during doping [35]. The main chain characteristic bands at 1,554 and 1,458 cm–1 are attributed to the C=N and C=C stretching modes for the quinoid and benzenoid rings, respectively [20,26,27]. The band at 1,276 cm–1 is assigned to C–N stretching vibration [30,36,38]. There are another two bands; the first one at 1,114 cm−1 due to C–H in-plane bending vibration and the second band at 798 cm−1 is assigned to C–H out-of-plane bending vibration of 1.4-disubstituted benzene ring [31,37].
The FTIR spectra of PANI-based composite NFs are shown in Fig. 5; the figure shows a strong broad band at 3,300–3,500 cm−1, which is assigned to the stretching vibration of –OH and –NH2 groups and the intermolecular hydrogen bonds of the chitosan in addition to N–H stretching of pure PANI [30–32,35]. The band located at 2,916 cm–1 was assigned to stretching of –CH group [30,40]. The characteristic band around 1,709 cm−1 was assigned to the overlap of –C=O, –NH stretching of the secondary amide of chitosan [30,41–43]. The main chain characteristic bands of polyaniline located at 1,601 and 1,416 cm–1 were attributed to the C=N and C=C stretching modes for the quinoid and benzenoid rings, respectively [31,37,38]. The band appeared at 1,269 cm–1 due to C–N stretching vibration of PANI [31,39,42]. The peaks at 1,094 and 1,060 cm−1 attributed to asymmetric stretching of the C–O–C of chitosan saccharide ring and the skeletal vibration of C–O stretching of PVA, respectively [43]. The band at 817.85 cm−1 is assigned to C–H out-of-plane bending vibration of 1,4-disubstituted benzene ring [31,37]. The peak located at 630.7 cm−1 was assigned to bending vibration –OH group [30]. For the FTIR spectrum after adsorption of AB 25, the PANI after adsorption had its C–H stretching at about 2,360 cm–1. Some C=O and C=C groups were found at 1,644 and 1,733 cm–1 wave numbers; the presence of some amines and nitro functional groups was located on peak numbers
1,465 cm–1 (NH2 stretching), 1,562 cm−1 (NO2 asymmetric stretching) and 1,150 cm−1 (saturated secondary amine C–N stretch), respectively, which were attributed to the AB 25 adsorbed onto PANI-based NFs. It was found also that band intensities that support the adsorption of dye molecules onto the pores of PANI composite were decreased after the adsorption [44].
3.3.4. Thermal gravimetric analysis
Fig. 6 investigates the comparison between the thermal gravimetric analysis (TGA) thermograms of the prepared PANI nanoparticles and the optimized PANI-based nanofi-bers; three stages of weight loss are observed for pure PANI. PANI starts a slow decomposition since the beginning of the test because of the evaporation of the compounds with low molar weights such as water [45]. PANI shows high moisture loss due to hygroscopic nature [46]. A very small weight loss about 11.7% is observed in the temperature range of 100°C–375.5°C due to degradation of the dopant (HCl) [46,47], followed by continuous losses in the temperature range from 375.5°C to 599.7°C with maximum loss about 31.8%. This weight loss is attributed to the decomposition as well as degradation of the polymer [47,48]. While the TGA thermogram of the optimized PANI-composite nanofibers shows three main stages of weight loss, PANI composite starts a slow decomposition since the beginning of the test at 25.2°C till 222.6°C because of the evaporation of the com-pounds with low molar weights such as water and the dop-ant HCl [45]. The maximum weight loss is observed in the temperature range of 222.6°C–390.8°C due to the structure decomposition of polyvinyl alcohol [48,49]; the final weight losses of about 25.4% are noticed in the temperature range from 390.8°C to 599.6°C that attributed to the degradation of polyaniline in addition to the degradation of saccharide structure of chitosan [47,48,51].
3.3.5. Surface area analysis
Surface area analysis has a key role in the adsorption phenomenon. The surface areas of the prepared nanofiber
0 10 20 30 40 50 60 70 80 90 100
Inte
nsity
2θ
Pure PANI NPs
(PVA/PANI/CS) NFs
Fig. 4. XRD pattern of the prepared polyaniline nanoparticles and the optimized PANI-composite nanofibers.
050010001500200025003000350040004500
Tran
smitt
ance
%T
Wavenumber cm-1
Pure PANI NPs
(PVA/PANI/CS) NFs Before Adsorption
(PVA/PANI/CS) NFs After Adsorption
The C=N and C=C stretching modes for the quinoid and benzenoid rings of PANI
Fig. 5. FTIR spectra of polyaniline nanoparticles and the opti-mized PVA/CS/PANI composite nanofibers.
441M.A. Khalil et al. / Desalination and Water Treatment 181 (2020) 436–446
composites before and after adsorption of AB dye were deter-mined by adsorption–desorption of nitrogen gas through BET method. The obtained results showed that the surface areas of PANI-based nanofiber before adsorption process is 57.759 m2/g; while after adsorption of AB, the surface areas decreased to 32.608 m2/g. The decrease in surface areas after adsorption of dye confirms the adsorption process [52].
3.4. Adsorption of acid blue 25 onto the optimized prepared PANI-based NFs
3.4.1. Effect of contact time and initial dye concentration
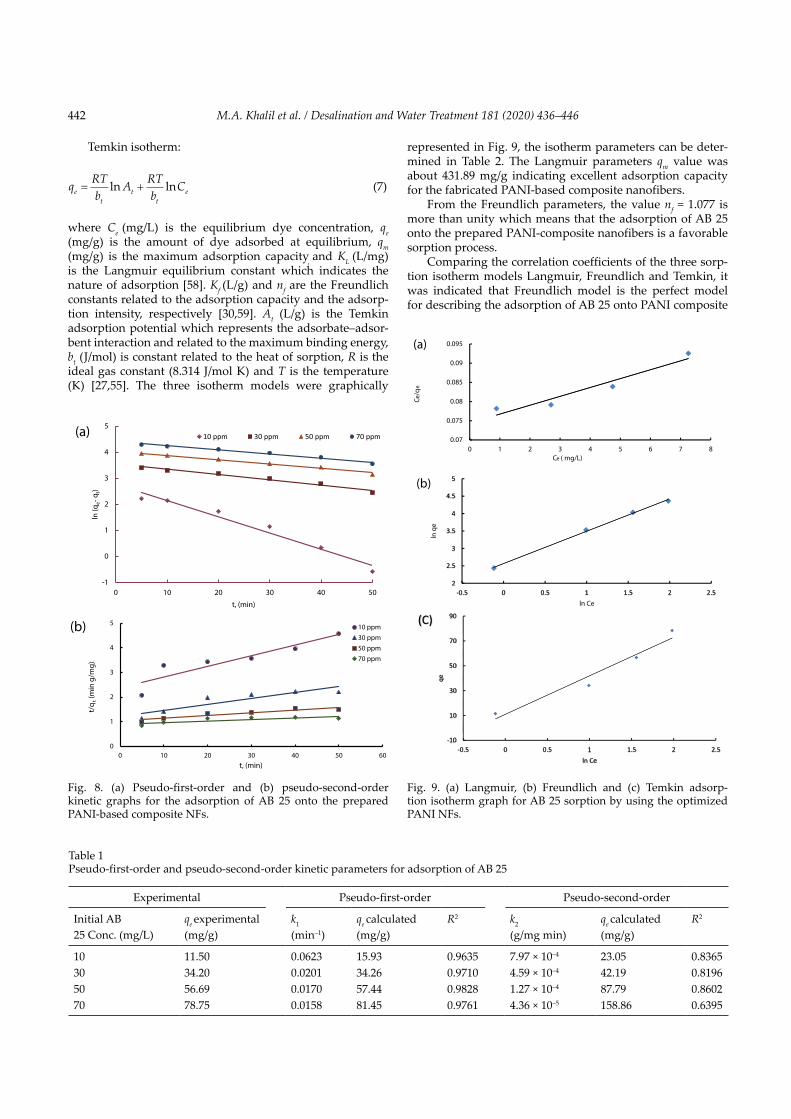
As shown in Fig. 7, the % removal of different initial dye concentrations (10, 30, 50, 70 mg/L) using the prepared PANI-based NFs was plotted against the time. It was indicated that the dye removal increases with time and attains equilibrium at about 60 min for the concentrations 10 and 30 mg/L. While 90 min is the equilibrium time for the solutions of concen-trations 50 and 70 mg/L. It was observed that after equilib-rium, the dye uptake reached a constant value of about 90%, where at this point the amount of dye being adsorbed on the polymer is in a state of dynamic equilibrium with the amount of dye desorbed [53]. The dye uptake was rapid at the beginning of the adsorption process due to the presence of large amount of active sites on the adsorbent surface, thus dye could interact with these sites easily. After reaching the equilibrium time, saturation of the active sites on the adsor-bent surface occurs. So, there is no considerable change in dye removal [30].
The equilibrium time is also dependent on the initial concentrations of dye. Specifically, the time to reach equi-librium increases from 60 to 90 min with an increase in ini-tial concentration from 10 to 70 mg/L. This behavior may be due to the primary stages of adsorption, a large num-bers of free adsorption sites are available on the adsorbent surface; however, as time passes, these sites are occupied by dye molecules and the adsorption capacity remains con-stant after equilibrium [38]. Hence, a contact time of 60 min was selected as the optimum removal time for the further experiments.
The adsorption kinetics for dye removal was investi-gated using the pseudo-first-order and pseudo-second-or-der kinetic models, which can be expressed by the following equations, respectively:
ln lnq tq q ke t e−( ) = − 1 (3)
tq k q
tqt e e
= +1
22 (4)
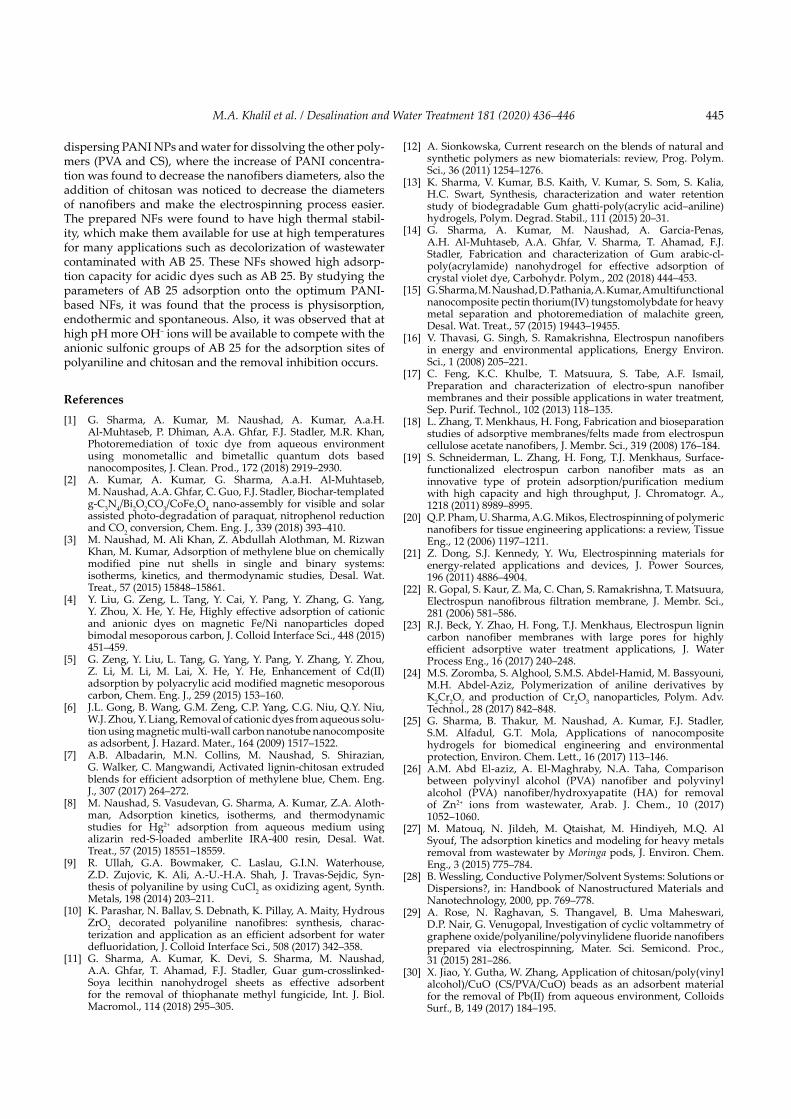
where qe and qt are the amounts of AB 25 (mg/g) adsorbed at equilibrium and at time t (min), respectively, k1 (1/min) is the adsorption rate constant of pseudo-first-order kinetic model and k2 (g/mg min) is the pseudo-second-order rate constant [38,53–55]. Fig. 8a, showed the linear plotting of ln (qe–qt) vs. (t), the rate constant k1 and the value qe for AB 25 removal can be determined graphically. While by plotting t/qt vs. (t) according to Eq. (4), a straight line is obtained with slope (1/qe) and intercept (1/k2 qe
2) as shown in Fig. 8b. The calculated parameters of the two kinetic models are tabu-lated in Table 1.
As shown in Table 1, the adsorption kinetics data of acid blue 25 on the best prepared PANI-based composite nano-fibers are in agreement with the pseudo-first-order model, where the values of correlation coefficients, R2, are found to be all greater than 0.96 for all the studied concentrations.
3.4.2. Adsorption isotherms
The sorption isotherm models are fundamental to investi gate the mechanism of adsorption. The Langmuir, Freundlich and Temkin isotherm models are widely used to describe the interactive behavior between the adsorbate and the adsorbent [30,56,57]. The linear form of Langmuir, Freundlich and Temkin isotherm equations can be expressed as follows:
Langmuir isotherm:
Cq K q
Cq
e
e L m
e
m
= +1 (5)
Freundlich isotherm:
ln ln lnq K Cne ff
e= +1 (6)
0
20
40
60
80
100
0 100 200 300 400 500 600
Wei
ght l
oss
(%)
Temperature , ( °C)
Pure PANI NPs
(PVA/PANI/CS) NFs
Fig. 6. Thermogram of the prepared PANI nanoparticles and the optimized PANI nanofibers.
0
20
40
60
80
100
0 20 40 60 80 100 120 140
% R
emov
al
Time
10 ppm
30 ppm
50 ppm
70 ppm
Fig. 7. Effect of contact time and initial dye concentration on the AB 25 removal by using the optimized PANI-based NFs.
M.A. Khalil et al. / Desalination and Water Treatment 181 (2020) 436–446442
Temkin isotherm:
q RTb
RTb
A Cet
tt
e= +ln ln (7)
where Ce (mg/L) is the equilibrium dye concentration, qe (mg/g) is the amount of dye adsorbed at equilibrium, qm (mg/g) is the maximum adsorption capacity, and KL (L/mg) is the Langmuir equilibrium constant which indicates the nature of adsorption [58]. Kf (L/g) and nf are the Freundlich constants related to the adsorption capacity and the adsorp-tion intensity, respectively [30,59]. At (L/g) is the Temkin adsorption potential which represents the adsorbate–adsor-bent interaction and related to the maximum binding energy, bt (J/mol) is constant related to the heat of sorption, R is the ideal gas constant (8.314 J/mol K) and T is the temperature (K) [27,55]. The three isotherm models were graphically
represented in Fig. 9, the isotherm parameters can be deter-mined in Table 2. The Langmuir parameters qm value was about 431.89 mg/g indicating excellent adsorption capacity for the fabricated PANI-based composite nanofibers.
From the Freundlich parameters, the value nf = 1.077 is more than unity which means that the adsorption of AB 25 onto the prepared PANI-composite nanofibers is a favorable sorption process.
Comparing the correlation coefficients of the three sorp-tion isotherm models Langmuir, Freundlich and Temkin, it was indicated that Freundlich model is the perfect model for describing the adsorption of AB 25 onto PANI composite
-1
0
1
2
3
4
5
0 10 20 30 40 50
ln (q
e- q
t)
t, (min)
(a) 10 ppm 30 ppm 50 ppm 70 ppm
0
1
2
3
4
5
0 10 20 30 40 50 60
t/q
t (m
in g
/mg)
t, (min)
(b) 10 ppm30 ppm50 ppm70 ppm
Fig. 8. (a) Pseudo-first-order and (b) pseudo-second-order kinetic graphs for the adsorption of AB 25 onto the prepared PANI-based composite NFs.
0.07
0.075
0.08
0.085
0.09
0.095
0 1 2 3 4 5 6 7 8
Ce/q
e
Ce ( mg/L)
(a)
2
2.5
3
3.5
4
4.5
5
2-0.5 0 0.5 1 1.5 2 2.5
ln q
e
ln Ce
(b)
-10
10
30
50
70
90
0-0.5 0 0.5 1 1.5 2 2.5
5
qe
ln Ce
(C)
Fig. 9. (a) Langmuir, (b) Freundlich and (c) Temkin adsorp-tion isotherm graph for AB 25 sorption by using the optimized PANI NFs.
Table 1Pseudo-first-order and pseudo-second-order kinetic parameters for adsorption of AB 25
Experimental Pseudo-first-order Pseudo-second-order
Initial AB 25 Conc. (mg/L)
qe experimental (mg/g)
k1
(min–1)qe calculated (mg/g)
R2 k2
(g/mg min)qe calculated (mg/g)
R2
10 11.50 0.0623 15.93 0.9635 7.97 × 10⁻⁴ 23.05 0.836530 34.20 0.0201 34.26 0.9710 4.59 × 10⁻⁴ 42.19 0.819650 56.69 0.0170 57.44 0.9828 1.27 × 10⁻⁴ 87.79 0.860270 78.75 0.0158 81.45 0.9761 4.36 × 10⁻⁵ 158.86 0.6395

443M.A. Khalil et al. / Desalination and Water Treatment 181 (2020) 436–446
nanofibers indicating excellent fitting of adsorption data to Freundlich model for heterogenous multilayer sorbent.
3.4.3. Effect of temperature
As shown in Fig. 10, the adsorption capacity of PANI-based NFs for AB 25 increases with increasing the tem-perature increase, proving that the sorption process is endothermic, where the temperature increases the diffusivity of dye particles [38].
3.4.4. Thermodynamic studies
The change in standard free energy (ΔG°), standard enthalpy change (ΔH°), and standard entropy change (ΔS°) of adsorption were calculated from the following equations [60,61]:
∆G RT KC° = − ln (8)
KCCCA
S
= (9)
where ΔG° is the standard free energy change (kJ/mol), R is the universal gas constant (8.314 J/mol K), KC is the equi-librium constant and T is the temperature in K and CA and CS are the equilibrium concentrations of dye on adsorbent (mg/g) and in the solution (mg/L), respectively [59,60]:
The free energy (ΔG°) for the specific sorption is calculated by using the following equations [59,60]:
∆ ∆ ∆G H T S° ° °= − (10)
lnK S HR RTC = −° °∆ ∆ (11)
where ΔH° and ΔS° are the standard enthalpy change (kJ/mol) and the standard entropy change (kJ/mol K), respectively. ΔH° and ΔS° can be determined graphically from the van’t Hoff plot of (ln KC) vs. (1/T), as shown in Fig. 11, where the slope and intercept of this plot equals to –∆H/R and ∆S/R, respectively [60,61].
The calculated thermodynamic parameters obtained are summarized in Table 3. The calculated negative values of
ΔG° indicate the feasibility and spontaneous nature of the sorption processes under standard conditions. It is also observed that ΔG° becomes more negative with raising tem-perature, confirming greater sorption at higher tempera-tures [42,57,61–63]. The positive value of enthalpy change ∆H° confirms that the adsorption process is endothermic. The value of ∆H° could give information about the type of adsorption. The magnitude of ∆H° for physisorption is 2.1–20.9 kJ/mol and for chemisorption is 20.9–418.4 kJ/mol [30,47,48,50]. The ∆H° value of this adsorption process equals to 11.212 kJ/mol for PANI composite nanofibers, indi-cating that the adsorption process is physisorption process. The positive value of ∆S° reflects the affinity of the adsor-bent material for AB 25 as well as increase of randomness at solid–solution interface during dye adsorption [42,60,61,63].
Table 2Isotherm parameters for AB 25 sorption by using the optimized PANI composite nanofibers
Langmuir R2 0.928qm (mg/g) 431.89KL (L/mg) 0.0311
Freundlich R2 0.997nf 1.077Kf (L/g) 13.011
Temkin R2 0.952bt (J/mol) 79.93At (L/g) 1.42
88
90
92
94
20 30 40 50 60 70 80
% R
emov
al
Temperature (°C)
Fig. 10. Effect of temperature on the AB 25 removal by using the prepared PANI-based composite NFs.
2
2.5
3
3.5
0.0028 0.0029 0.003 0.0031 0.0032 0.0033 0.0034
ln K
C
1/T, (K-1)
Fig. 11. van’t Hoff plot of ln KC against 1/T for AB 25 adsorption by using the optimized PANI NFs.
Table 3Thermodynamic parameters of the adsorption of AB 25 onto the optimized prepared PANI-based composite nanofibers
Temperature (K)
∆G° (kJ/mol)
∆H° (kJ/mol)
∆S° (kJ/mol K)
298 –6.022 11.212 0.058318 –7.178333 –8.046348 –8.913

M.A. Khalil et al. / Desalination and Water Treatment 181 (2020) 436–446444
3.4.5. Effect of pH
Solution pH has a great effect on acid blue 25 removal with inhibition observed at high pH values as shown in Fig. 12. The acid blue 25 decolorization by PANI-based nano-fibers kept nearly 80% in the pH range of 3.0–7.0. Further increase of the solution pH above 7.0, the removal decreased to about 49% at pH 9.0 and the lowest % dye removal was observed at pH 11.0 [56,57].
This could be explained by the fact that at low pH, amine groups of polyaniline and chitosan are easily pro-tonated, which induces an electrostatic attraction between dye molecules and adsorption sites, while at high pH more OH− ions are available to compete with the anionic sulfonic groups of acid blue 25 for the adsorption sites of polyaniline and chitosan. This phenomenon decreases the number of adsorption sites for acid blue 25 [57].
The mechanism of this electrostatic attraction can be explained as following. Dye molecules in aqueous solution dissociated as:
Dye SO Na Dye SO Na− → − +− +3 3 (12)
In acidic pH, the amino group of the prepared composite protonated as:
R NH H O R NH H O− + → − ++ +2 3 3 2 . (13)
As a final point, the adsorption process incomes through the electrostatic attraction between the two counter ions (positively charged nitrogen atom and the dye anion; Fig. 13).
R NH Dye SO R NH O S Dye− + − → − − − −+ − +3 3 3 3 . (14)
Finally, by comparing the dye-adsorption performance of PANI-composite nanofibers with other adsorbents which is widely used in practice, we could find that PANI-composite nanofiber prepared in the present work provides a higher maximum adsorption capacity Qmax. The term maximum adsorption capacity Qmax (mg/g) was introduced (the amount adsorbed per mass of adsorbent) to compare between the produced PANI-composite nanofibers and other adsorbent used for removal of AB 25. Fig. 14 shows a plot of Qmax for different adsorbents and the created PANI-composite nano-fibers. According to this term, Noby et al. [64] studied the
adsorption of AB 25 onto different morphologies of synthe-sized polyaniline nanorods and nanoparticles with maxi-mum dye adsorption capacity Qmax of the two nanostruc-tured materials 78 and 70 mg/g, respectively, has studied the correlation between the adsorption capacity of commer-cial activated carbons and the pore size distributions in the removal of anionic dyes such as AB 25 where the maximum dye adsorption capacity Qmax was found to be 345 mg/g [65]. Jiang et al. [43] studied the preparation of waste tea activated carbon through chemical activation with a novel activating agent potassium acetate and using it for the sorption of AB 25 and the maximum dye adsorption capacity Qmax was found 203.34 mg/g. In the present work, PANI-composite nanofi-bers manifested Qmax = 431.89 mg/g. Therefore, an efficient adsorption process could be developed with the created PANI nanostructures.
4. Conclusion
The characteristics of PANI represented in the crystal-line nature and thermal stability make it a good choice to be electrospun and used in many applications. However, pure PANI has low electrospinnability, blending it with other polymers such as CS and PVA has a great potential for elec-trospinning uniform PANI-based NFs with low diameters. The novelty in this work for the electrospinning of PANI easily through using mixture of solvents, namely, DMF for
0
20
40
60
80
100
2 3 4 5 6 7 8 9 10 11 12
% R
emov
al
pH
Fig. 12. Effect of pH on the AB 25 removal by using the optimized PANI composite NFs.
0
50
100
150
200
250
300
350
400
450
H. Noby (2017)PANINPS
H. Noby (2017)PANINRS
M. Auta (2011) J. E Aguiar(2016)
PANI-Composite NFs(present work)
Max
imum
ads
orpt
ion
capa
city
(mg/
g)
Adsorbent
Fig. 14. Plot of Qmax of AB 25 adsorption for different adsorbents and the created PANI-composite nanofibers.
Fig. 13. Interactions of Acid blue dye with PANI-based nanofibers.
445M.A. Khalil et al. / Desalination and Water Treatment 181 (2020) 436–446
dispersing PANI NPs and water for dissolving the other poly-mers (PVA and CS), where the increase of PANI concentra-tion was found to decrease the nanofibers diameters, also the addition of chitosan was noticed to decrease the diameters of nanofibers and make the electrospinning process easier. The prepared NFs were found to have high thermal stabil-ity, which make them available for use at high temperatures for many applications such as decolorization of wastewater contaminated with AB 25. These NFs showed high adsorp-tion capacity for acidic dyes such as AB 25. By studying the parameters of AB 25 adsorption onto the optimum PANI-based NFs, it was found that the process is physisorption, endothermic and spontaneous. Also, it was observed that at high pH more OH− ions will be available to compete with the anionic sulfonic groups of AB 25 for the adsorption sites of polyaniline and chitosan and the removal inhibition occurs.
References[1] G. Sharma, A. Kumar, M. Naushad, A. Kumar, A.a.H.
Al-Muhtaseb, P. Dhiman, A.A. Ghfar, F.J. Stadler, M.R. Khan, Photoremediation of toxic dye from aqueous environment using monometallic and bimetallic quantum dots based nanocomposites, J. Clean. Prod., 172 (2018) 2919–2930.
[2] A. Kumar, A. Kumar, G. Sharma, A.a.H. Al-Muhtaseb, M. Naushad, A.A. Ghfar, C. Guo, F.J. Stadler, Biochar-templated g-C3N4/Bi2O2CO3/CoFe2O4 nano-assembly for visible and solar assisted photo-degradation of paraquat, nitrophenol reduction and CO2 conversion, Chem. Eng. J., 339 (2018) 393–410.
[3] M. Naushad, M. Ali Khan, Z. Abdullah Alothman, M. Rizwan Khan, M. Kumar, Adsorption of methylene blue on chemically modified pine nut shells in single and binary systems: isotherms, kinetics, and thermodynamic studies, Desal. Wat. Treat., 57 (2015) 15848–15861.
[4] Y. Liu, G. Zeng, L. Tang, Y. Cai, Y. Pang, Y. Zhang, G. Yang, Y. Zhou, X. He, Y. He, Highly effective adsorption of cationic and anionic dyes on magnetic Fe/Ni nanoparticles doped bimodal mesoporous carbon, J. Colloid Interface Sci., 448 (2015) 451–459.
[5] G. Zeng, Y. Liu, L. Tang, G. Yang, Y. Pang, Y. Zhang, Y. Zhou, Z. Li, M. Li, M. Lai, X. He, Y. He, Enhancement of Cd(II) adsorption by polyacrylic acid modified magnetic mesoporous carbon, Chem. Eng. J., 259 (2015) 153–160.
[6] J.L. Gong, B. Wang, G.M. Zeng, C.P. Yang, C.G. Niu, Q.Y. Niu, W.J. Zhou, Y. Liang, Removal of cationic dyes from aqueous solu-tion using magnetic multi-wall carbon nanotube nanocomposite as adsorbent, J. Hazard. Mater., 164 (2009) 1517–1522.
[7] A.B. Albadarin, M.N. Collins, M. Naushad, S. Shirazian, G. Walker, C. Mangwandi, Activated lignin-chitosan extruded blends for efficient adsorption of methylene blue, Chem. Eng. J., 307 (2017) 264–272.
[8] M. Naushad, S. Vasudevan, G. Sharma, A. Kumar, Z.A. Aloth-man, Adsorption kinetics, isotherms, and thermodynamic studies for Hg2+ adsorption from aqueous medium using alizarin red-S-loaded amberlite IRA-400 resin, Desal. Wat. Treat., 57 (2015) 18551–18559.
[9] R. Ullah, G.A. Bowmaker, C. Laslau, G.I.N. Waterhouse, Z.D. Zujovic, K. Ali, A.-U.-H.A. Shah, J. Travas-Sejdic, Syn-thesis of polyaniline by using CuCl2 as oxidizing agent, Synth. Metals, 198 (2014) 203–211.
[10] K. Parashar, N. Ballav, S. Debnath, K. Pillay, A. Maity, Hydrous ZrO2 decorated polyaniline nanofibres: synthesis, charac-terization and application as an efficient adsorbent for water defluoridation, J. Colloid Interface Sci., 508 (2017) 342–358.
[11] G. Sharma, A. Kumar, K. Devi, S. Sharma, M. Naushad, A.A. Ghfar, T. Ahamad, F.J. Stadler, Guar gum-crosslinked-Soya lecithin nanohydrogel sheets as effective adsorbent for the removal of thiophanate methyl fungicide, Int. J. Biol. Macromol., 114 (2018) 295–305.
[12] A. Sionkowska, Current research on the blends of natural and synthetic polymers as new biomaterials: review, Prog. Polym. Sci., 36 (2011) 1254–1276.
[13] K. Sharma, V. Kumar, B.S. Kaith, V. Kumar, S. Som, S. Kalia, H.C. Swart, Synthesis, characterization and water retention study of biodegradable Gum ghatti-poly(acrylic acid–aniline) hydrogels, Polym. Degrad. Stabil., 111 (2015) 20–31.
[14] G. Sharma, A. Kumar, M. Naushad, A. Garcia-Penas, A.H. Al-Muhtaseb, A.A. Ghfar, V. Sharma, T. Ahamad, F.J. Stadler, Fabrication and characterization of Gum arabic-cl-poly(acrylamide) nanohydrogel for effective adsorption of crystal violet dye, Carbohydr. Polym., 202 (2018) 444–453.
[15] G. Sharma, M. Naushad, D. Pathania, A. Kumar, A multifunctional nanocomposite pectin thorium(IV) tungstomolybdate for heavy metal separation and photoremediation of malachite green, Desal. Wat. Treat., 57 (2015) 19443–19455.
[16] V. Thavasi, G. Singh, S. Ramakrishna, Electrospun nanofibers in energy and environmental applications, Energy Environ. Sci., 1 (2008) 205–221.
[17] C. Feng, K.C. Khulbe, T. Matsuura, S. Tabe, A.F. Ismail, Preparation and characterization of electro-spun nanofiber membranes and their possible applications in water treatment, Sep. Purif. Technol., 102 (2013) 118–135.
[18] L. Zhang, T. Menkhaus, H. Fong, Fabrication and bioseparation studies of adsorptive membranes/felts made from electrospun cellulose acetate nanofibers, J. Membr. Sci., 319 (2008) 176–184.
[19] S. Schneiderman, L. Zhang, H. Fong, T.J. Menkhaus, Surface-functionalized electrospun carbon nanofiber mats as an innovative type of protein adsorption/purification medium with high capacity and high throughput, J. Chromatogr. A., 1218 (2011) 8989–8995.
[20] Q.P. Pham, U. Sharma, A.G. Mikos, Electrospinning of polymeric nanofibers for tissue engineering applications: a review, Tissue Eng., 12 (2006) 1197–1211.
[21] Z. Dong, S.J. Kennedy, Y. Wu, Electrospinning materials for energy-related applications and devices, J. Power Sources, 196 (2011) 4886–4904.
[22] R. Gopal, S. Kaur, Z. Ma, C. Chan, S. Ramakrishna, T. Matsuura, Electrospun nanofibrous filtration membrane, J. Membr. Sci., 281 (2006) 581–586.
[23] R.J. Beck, Y. Zhao, H. Fong, T.J. Menkhaus, Electrospun lignin carbon nanofiber membranes with large pores for highly efficient adsorptive water treatment applications, J. Water Process Eng., 16 (2017) 240–248.
[24] M.S. Zoromba, S. Alghool, S.M.S. Abdel-Hamid, M. Bassyouni, M.H. Abdel-Aziz, Polymerization of aniline derivatives by K2Cr2O7 and production of Cr2O3 nanoparticles, Polym. Adv. Technol., 28 (2017) 842–848.
[25] G. Sharma, B. Thakur, M. Naushad, A. Kumar, F.J. Stadler, S.M. Alfadul, G.T. Mola, Applications of nanocomposite hydrogels for biomedical engineering and environmental protection, Environ. Chem. Lett., 16 (2017) 113–146.
[26] A.M. Abd El-aziz, A. El-Maghraby, N.A. Taha, Comparison between polyvinyl alcohol (PVA) nanofiber and polyvinyl alcohol (PVA) nanofiber/hydroxyapatite (HA) for removal of Zn2+ ions from wastewater, Arab. J. Chem., 10 (2017) 1052–1060.
[27] M. Matouq, N. Jildeh, M. Qtaishat, M. Hindiyeh, M.Q. Al Syouf, The adsorption kinetics and modeling for heavy metals removal from wastewater by Moringa pods, J. Environ. Chem. Eng., 3 (2015) 775–784.
[28] B. Wessling, Conductive Polymer/Solvent Systems: Solutions or Dispersions?, in: Handbook of Nanostructured Materials and Nanotechnology, 2000, pp. 769–778.
[29] A. Rose, N. Raghavan, S. Thangavel, B. Uma Maheswari, D.P. Nair, G. Venugopal, Investigation of cyclic voltammetry of graphene oxide/polyaniline/polyvinylidene fluoride nanofibers prepared via electrospinning, Mater. Sci. Semicond. Proc., 31 (2015) 281–286.
[30] X. Jiao, Y. Gutha, W. Zhang, Application of chitosan/poly(vinyl alcohol)/CuO (CS/PVA/CuO) beads as an adsorbent material for the removal of Pb(II) from aqueous environment, Colloids Surf., B, 149 (2017) 184–195.
M.A. Khalil et al. / Desalination and Water Treatment 181 (2020) 436–446446
[31] M.M. Ayad, N.A. Salahuddin, I.M. Minisy, W.A. Amer, Chitosan/ polyaniline nanofibers coating on the quartz crystal microbalance electrode for gas sensing, Sensor Actuat. B, 202 (2014) 144–153.
[32] M.I. Voronova, O.V. Surov, S.S. Guseinov, V.P. Barannikov, A.G. Zakharov, Thermal stability of polyvinyl alcohol/nanocrystalline cellulose composites, Carbohydr. Polym., 130 (2015) 440–447.
[33] A. Alakanandana, A.R. Subrahmanyam, J. Siva Kumar, Structural and electrical conductivity studies of pure PVA and PVA doped with Succinic acid polymer electrolyte system, Mater. Today: Proceedings, 3 (2016) 3680–3688.
[34] M.R. Karim, Fabrication of electrospun aligned nanofibers from conducting polyaniline copolymer/polyvinyl alcohol/chitosan oligossacaride in aqueous solutions, Synth. Met., 178 (2013) 34–37.
[35] R.E. Morsi, E.A. Khamis, A.M. Al-Sabagh, Polyaniline nanotubes: Facile synthesis, electrochemical, quantum chemical characteristics and corrosion inhibition efficiency, J. Taiwan Inst. Chem. Eng., 60 (2016) 573–581.
[36] J. Tang, X. Jing, B. Wang, F. Wang, Infrared spectra of soluble polyaniline, Synth. Met., 24 (1988) 231–238.
[37] Y. Li, X. Zhao, Q. Xu, Q. Zhang, D. Chen, Facile preparation and enhanced capacitance of the polyaniline/sodium alginate nanofiber network for supercapacitors, Langmuir, 27 (2011) 6458–6463.
[38] M. Bhaumik, R.I. McCrindle, A. Maity, S. Agarwal, V.K. Gupta, Polyaniline nanofibers as highly effective re-usable adsorbent for removal of reactive black 5 from aqueous solutions, J. Colloid Interface Sci., 466 (2016) 442–451.
[39] A. Chellachamy Anbalagan, S.N. Sawant, Brine solution-driven synthesis of porous polyaniline for supercapacitor electrode application, Polym. J., 87 (2016) 129–137.
[40] M. Ayad, G. El-Hefnawy, S. Zaghlol, Facile synthesis of polyaniline nanoparticles; its adsorption behavior, Chem. Eng. J., 217 (2013) 460–465.
[41] Y. Gutha, J.L. Pathak, W. Zhang, Y. Zhang, X. Jiao, Antibacterial and wound healing properties of chitosan/poly(vinyl alcohol)/zinc oxide beads (CS/PVA/ZnO), Int. J. Biol. Macromol., 103 (2017) 234–241.
[42] R. Karthik, S. Meenakshi, Facile synthesis of cross linked-chitosan-grafted-polyaniline composite and its Cr(VI) uptake studies, Int. J. Biol. Macromol., 67 (2014) 210–219.
[43] M. Jiang, K. Wang, J.F. Kennedy, J. Nie, Q. Yu, G. Ma, Preparation and characterization of water-soluble chitosan derivative by Michael addition reaction, Int. J. Biol. Macromol., 47 (2010) 696–699.
[44] M. Auta, B.H. Hameed, Preparation of waste tea activated carbon using potassium acetate as an activating agent for adsorption of Acid Blue 25 dye, Chem. Eng. J., 171 (2011) 502–509.
[45] Z. Qiang, G. Liang, A. Gu, L. Yuan, Hyperbranched polyaniline: a new conductive polyaniline with simultaneously good solubility and super high thermal stability, Mater. Lett., 115 (2014) 159–161.
[46] S. Bilal, S. Gul, R. Holze, A.-u.-H.A. Shah, An impressive emulsion polymerization route for the synthesis of highly soluble and conducting polyaniline salts, Synth. Met., 206 (2015) 131–144.
[47] P.S.R. Devi, M.N. Deo, S. Kawadiya, N. Raje, S.R. Vishwakarma, R. Verma, A.V.R. Reddy, Evaluation of the effect of heating on the ion exchage capacity of polyaniline, Synth. Met., 210 (2015) 297–303.
[48] L. Ding, X. Wang, R.V. Gregory, Thermal properties of chemically synthesized polyaniline (EB) powder, Synth. Met., 104 (1999) 73–78.
[49] C. Santos, C.J. Silva, Z. Buttel, R. Guimaraes, S.B. Pereira, P. Tamagnini, A. Zille, Preparation and characterization of polysaccharides/PVA blend nanofibrous membranes by electro-spinning method, Carbohydr. Polym., 99 (2014) 584–592.
[50] Z. Peng, L.X. Kong, A thermal degradation mechanism of polyvinyl alcohol/silica nanocomposites, Polym. Degrad. Stabil., 92 (2007) 1061–1071.
[51] S. Kumari, S.H. Kumar Annamareddy, S. Abanti, P. Kumar Rath, Physicochemical properties and characterization of chitosan synthesized from fish scales, crab and shrimp shells, Int. J. Biol. Macromol., 104 (2017) 1697–1705.
[52] S. Xuan, F. Wang, J.M. Lai, K.W. Sham, Y.X. Wang, S.F. Lee, J.C. Yu, C.H. Cheng, K.C. Leung, Synthesis of biocompatible, mesoporous Fe3O4 nano/microspheres with large surface area for magnetic resonance imaging and therapeutic applications, ACS Appl. Mater. Inter., 3 (2011) 237–244.
[53] R.E. Morsi, M.Z. Elsabee, Polyaniline nanotubes: mercury and competative heavy metals uptake, Am. J. Polym. Sci., 5 (2015) 10–17.
[54] F. Hayeeye, M. Sattar, W. Chinpa, O. Sirichote, Kinetics and thermodynamics of Rhodamine B adsorption by gelatin/activated carbon composite beads, Colloids Surf., A, 513 (2017) 259–266.
[55] S.A. Chaudhry, Z. Zaidi, S.I. Siddiqui, Isotherm, kinetic and thermodynamics of arsenic adsorption onto iron-zirconium binary oxide-coated sand (IZBOCS): modelling and process optimization, J. Mol. Liq., 229 (2017) 230–240.
[56] J. Wang, K. Zhang, L. Zhao, Sono-assisted synthesis of nano-structured polyaniline for adsorption of aqueous Cr(VI): effect of protonic acids, Chem. Eng. J., 239 (2014) 123–131.
[57] A. Kamari, W.S.W. Ngah, M.Y. Chong, M.L. Cheah, Sorption of acid dyes onto GLA and H2SO4 cross-linked chitosan beads, Desalination, 249 (2009) 1180–1189.
[58] A.E. Chávez-Guajardo, J.C. Medina-Llamas, L. Maqueira, C.A.S. Andrade, K.G.B. Alves, C.P. de Melo, Efficient removal of Cr (VI) and Cu (II) ions from aqueous media by use of polypyrrole/maghemite and polyaniline/maghemite magnetic nanocomposites, Chem. Eng. J., 281 (2015) 826–836.
[59] L. Tang, Y. Fang, Y. Pang, G. Zeng, J. Wang, Y. Zhou, Y. Deng, G. Yang, Y. Cai, J. Chen, Synergistic adsorption and reduction of hexavalent chromium using highly uniform polyaniline–magnetic mesoporous silica composite, Chem. Eng. J., 254 (2014) 302–312.
[60] H.M. Gad, A.A. El-Sayed, Activated carbon from agricultural by-products for the removal of Rhodamine-B from aqueous solution, J. Hazard. Mater., 168 (2009) 1070–1081.
[61] R. Kumar, M.O. Ansari, M.A. Barakat, DBSA doped polyaniline/multi-walled carbon nanotubes composite for high efficiency removal of Cr(VI) from aqueous solution, Chem. Eng. J., 228 (2013) 748–755.
[62] M.A. Shaker, H.M. albishri, Dynamics and thermodynamics of toxic metals adsorption onto soil-extracted humic acid, Chemosphere, 111 (2014) 587–595.
[63] C. Sun, C. Li, C. Wang, R. Qu, Y. Niu, H. Geng, Comparison studies of adsorption properties for Hg(II) and Au(III) on polystyrene-supported bis-8-oxyquinoline-terminated open-chain crown ether, Chem. Eng. J., 200–202 (2012) 291–299.
[64] H. Noby, A. El-Shazly, M. Elkady, M. Ohshima, Adsorption Profiles of Acid Dye Using Synthesized Polyaniline Nanostructure with Different Morphologies, J. Chem. Eng. Jpn., 50 (2017) 170–177.
[65] J.E. Aguiar, J.C.A. de Oliveira, P.F.G. Silvino, J.A. Neto, I.J. Silva, S.M.P. Lucena, Correlation between PSD and adsorption of anionic dyes with different molecular weigths on activated carbon, Colloids Surf., 496 (2016) 125–131.