Embed Size (px)
Citation preview

INFLUENCE OF MPESA CASHLESS PAYMENTS PRODUCT ON THE
OPERATIONS OF EAST AFRICA BREWERIES DISTRIBUTORS IN
NAIROBI COUNTY
BY
CAROLINE NYAMBURA THUO
A RESEARCH PROJECT SUBMITTED IN PARTIAL FULFILLMENT OF THE
REQUIREMENTS FOR THE AWARD OF DEGREE OF MASTER OF ARTS IN PROJECT
PLANNING AND MANAGEMENT OF THE UNIVERSITY OF NAIROBI
2014

ii
DECLARATON
This project is my own work and that it has not been submitted anywhere for any award. Where
other sources of information have been used, they have been acknowledged.
Signature…………………………. Date………………………………
Caroline Nyambura Thuo
L50/64883/2010
This project has been submitted for examination with my approval as the University supervisor
Signature…………………………………..Date……………………………
Prof. J.M Khalagai
School of Mathematics
University of Nairobi

iii
DEDICATION
I dedicate this project to my parents Phillip and Jane Thuo for their encouragement and support
throughout my academic journey.
.

iv
ACKNOWLEDGEMENT
I would like to express gratitude, First to my research supervisor professor Jairus M. Khalagai
whose insight and direction was invaluable in this project. Secondly to my lecturers whose
guidance went beyond the call of duty.
The support of my family without which this proposal would not have been possible is also
greatly appreciated.
I thank staff at the Safaricom resource center and all respondents who were the source of data
used herein.
Last but not least, I am grateful to The University of Nairobi for the opportunity to study the
field of Project Management and Project planning at Masters level.
Thank you all.

v
TABLE OF CONTENT
DEDICATION.............................................................................................................................. iii
ACKNOWLEDGEMENT ........................................................................................................... iv
LIST OF TABLES ..................................................................................................................... viii
LIST OF FIGURES ..................................................................................................................... ix
ABSTRACT .................................................................................................................................. xi
CHAPTER ONE:INTRODUCTION .......................................................................................... 1
1.1 Background of the Study .......................................................................................................... 1
1.2 Statement of the Problem .......................................................................................................... 5
1.3 Purpose of the Study ................................................................................................................. 6
1.4 Objectives of the Study ............................................................................................................. 6
1.5 Research Questions ................................................................................................................... 6
1.6 Limitation of the Study ............................................................................................................. 7
1.7 Significance of the Study .......................................................................................................... 7
1.8 Delimitations of the Study ........................................................................................................ 7
1.9 Assumptions of the Study ......................................................................................................... 7
1.10 Definition of Significant Terms .............................................................................................. 7
1.11 Organization of the study ........................................................................................................ 8
CHAPTER TWO: LITERATURE REVIEW ............................................................................ 9
2.1 Introduction ............................................................................................................................... 9
2.2 The Origin and Rise of non- Cash payments ............................................................................ 9
2.2.1 Costs in The Operations of EABL Distributors ................................................................... 14
2.2.2 Security in The Operations of EABL Distributors .............................................................. 15
2.2.3 Convenience in the Operations of EABL Distributors ........................................................ 17
2.2.4 Book Keeping Volumes in the Operations of EABL Distributors ...................................... 18
2.5 Theoretical Background .......................................................................................................... 19
2.6 Conceptual Framework ........................................................................................................... 21

vi
2.7 Research Gap .......................................................................................................................... 22
2.8 Summary of the Chapter ......................................................................................................... 24
CHAPTER THREE:RESEARCH METHODOLOGY .......................................................... 25
3.1 Introduction ............................................................................................................................. 25
3.2 Study Design ........................................................................................................................... 25
3.3 Target Population .................................................................................................................... 26
3.4SampleSize and sampling procedure ....................................................................................... 26
3.5 Data collectionInstrumentsand procedures ............................................................................. 26
3.6 Data analysis ........................................................................................................................... 26
3.7 Instruments Validity................................................................................................................ 27
3.8 Operationalization of Variables .............................................................................................. 29
3.9 Methods of Data Analysis ....................................................................................................... 31
3.10 Summary ............................................................................................................................... 31
CHAPTER FOUR:DATA ANALYSIS, PRESENTATION, INTERPRETATION AND
DISCUSSION .............................................................................................................................. 32
4.1 Introduction ............................................................................................................................. 32
4.1.1 Response Rate ...................................................................................................................... 32
4.2 Demographic information ....................................................................................................... 32
4.3 Influence of Cost of Operations on Use of M-Pesa Cashless Payments Product ................... 33
4.4 Influence of Security in Operations on Use of M-Pesa Cashless Payments Product ............. 34
4.5 Influence of Convenience in Operations on Use of M-Pesa Cashless Payments Product ...... 36
4.6 Influence of Book Keeping Volumes in Operations on Use of M-Pesa Cashless Payments
Product .......................................................................................................................................... 38
4.7 Discussion of the Findings ...................................................................................................... 39
CHAPTER FIVE:SUMMARY OF THE FINDINGS, CONCLUSIONS AND
RECOMMENDATIONS ............................................................................................................ 41
5.1 Introduction ............................................................................................................................. 41
5.2 Summary of the Findings ........................................................................................................ 41
5.3 Conclusion .............................................................................................................................. 42
vii
5.4 Recommendations ................................................................................................................... 43
5.5 Area for Further Research ....................................................................................................... 44
APPENDICES ............................................................................................................................. 50
Appendix 1: Questionnaire ........................................................................................................... 50
Appendix 2: Time Frame………………………………...………………………………………42

viii
LIST OF TABLES
Table 1: Operationalization of Variables ...................................................................................... 30
Table 4. 1: Occupation of the respondents .................................................................................... 33
Table 4. 2: If there were costs that the business had reduced or increased due to the use of Mpesa
cashless ......................................................................................................................................... 33
Table 4. 3: Extent that the costs had been reduced due to the use of Mpesa ................................ 34
Table 4. 4: Whether they had ever lost cash in transit .................................................................. 34
Table 4. 5: Extent that they had lost cash in transit ...................................................................... 35
Table 4. 6: If use of Mpesa cashless had reduced the number of trips to the distribution route... 36
Table 4. 7: Whether the amount of time spent processing cash in transit and at delivery had
reduced .......................................................................................................................................... 36
Table 4. 8: How Mpesa cashless had affected amount of Book Keeping..................................... 38
Table 4. 9: How Mpesa cashless use had affected the amount of printing papers purchased ...... 38

ix
LIST OF FIGURES
Figure 1: Conceptual Framework ................................................................................................. 21
x
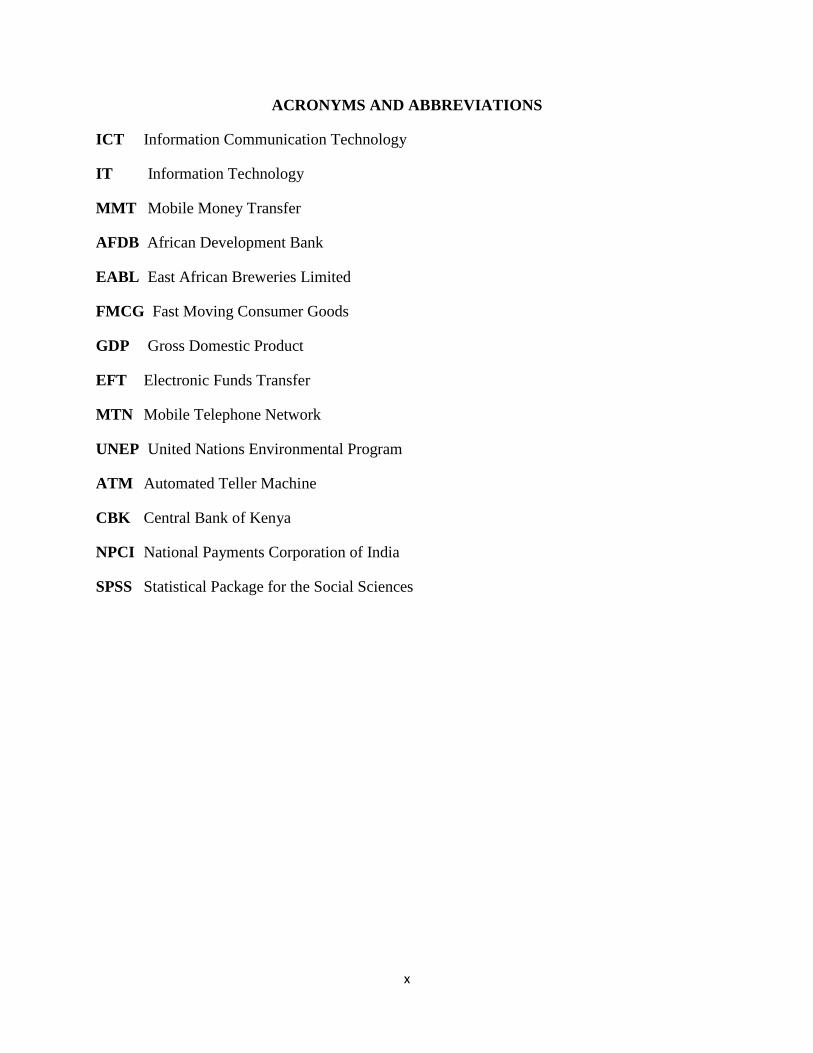
ACRONYMS AND ABBREVIATIONS
ICT Information Communication Technology
IT Information Technology
MMT Mobile Money Transfer
AFDB African Development Bank
EABL East African Breweries Limited
FMCG Fast Moving Consumer Goods
GDP Gross Domestic Product
EFT Electronic Funds Transfer
MTN Mobile Telephone Network
UNEP United Nations Environmental Program
ATM Automated Teller Machine
CBK Central Bank of Kenya
NPCI National Payments Corporation of India
SPSS Statistical Package for the Social Sciences

xi
ABSTRACT
The pace of transformation in the use of mobile phone transactions is attributable to the
high levels of mobile phone penetration in developing countries. M-Pesa allows users to
exchange cash for "e-float" on their phones, to send e-float to other cellular phone users, and to
exchange e-float back into cash. This study intended to investigate the influence of Mpesa
Cashless Payments Product on the operations of East Africa Breweries Limited distributors. The
following objectives were used to guide the study: to investigate how cost has influenced the use
of M-Pesa cashless payments production the operations of East Africa Breweries Limited
distributors; to establish how security has influenced the use of M-Pesa cashless payments
product in the operations of East Africa Breweries Limited distributors; to establish how
convenience has influenced the use of M-Pesa cashless payments product in the operations of
East Africa Breweries Limited distributors; to investigate how Book Keeping Volumes have
influenced the use of M-Pesa cashless payments product in the operations of East Africa
Breweries Limited distributors. Descriptive study design was used. The total number of clients
on the Mpesa cashless product is 625 as at 23rd
Oct 2013. A census conducted. The entire EABL
Mpesa cashless payments product constituted the sample, they were 88 in total. Data was
collected using questionnaire method. Data was analyzed using frequency distribution tables and
percentages. After receiving the online questionnaires, data coding was done by creating dummy
variable names. This was then followed by data entry according to the assigned codes. The keyed
in data was subjected to the SPSS processor which computed the data results. The study found
that Mpesa Cashless Payments Product influenced the operations of East Africa Breweries
Limited distributors. The study found that cost had reduced due to the use of Mpesa cashless.
The study found that security had increased due to the use of Mpesa cashless. The study found
that convenience had increased due to the use of Mpesa cashless. The study found that Book
Keeping Volumes had reduced due to the use of Mpesa cashless. The study concludes that cost
had reduced due to the use of Mpesa cashless. The study concludes that security had increased
due to the use of Mpesa cashless. The study concludes that convenience had increased due to the
use of Mpesa cashless. Mpesa cashless use had reduced the amount of printing papers purchased.
Recommendations were to have EABL sensitize their customers to encourage customers to pay
bills through Mpesa other than cash. The government should sensitize and encourage people on
use of plastic and cashless money. Safaricom need to reduce the Mpesa transaction costs to
encourage everyone to use Mpesa to pay for their goods and services. The government needs to
put in place measures to fight online fraud.

1
CHAPTER ONE
INTRODUCTION
1.1 Background of the Study
Modern businesses in the developing world are increasingly deploying the use of alternative
payment methods to enhance the quality of services to their customers and increase growth.
These are methods other than the exchange of cash at the point of sale. The pace of
transformation in the business sector has sped up with more businesses realizing the potential
of using alternative modes of payments to ease their transactions. They are increasingly
deploying the use of mobile payments to enhance the quality of their services and increase
growth (Mbogo, 1998).
This research elaborated the backdrop of the state of affairs relating to Mpesa cashless
payments product and its influence on the operations of East African Breweries distributors.
The pace of transformation in the use of mobile phone transactions is attributable to the high
levels of mobile phone penetration in developing countries. In sub-Saharan Africa it is said that
there are more mobile telephones than pit latrines (Wang, 2013). In Nigeria, mobile service
provider MTN launched MTN money, a money transfer service conducted from a mobile
phone. In the Congo, Celpay is a mode of banking enabled by mobile phones. At the Ivory
Coast as well, Orange money is also a mobile money transfer system in use. MTN money is
also in use in Uganda (Menekse, Gencer, 2009). Orange money, Airtel money and Yu cash are
some of the money transfer services offered by mobile phone service providers in Kenya.
In Kenya the business community has undergone many challenges with the introduction of
Information Communication Technology (ICT). Mobile phones are in the centre of this
development. The mode of payment through mobile phones has impacted the way in which
business conduct their transactions. Mpesa is at the forefront of these mobile phone transactions
The businesses view this mode of payment as an easier form of cash delivery to their suppliers
and business partners, a system which is relatively affordable, personal and can be used
anywhere at any time (Anurag, Tyagi and Raddi,2009). There‘s appeal in mobile banking and

2
mobile payment services across the country as there are probably more people with mobile
handsets than bank accounts (Porteous, 2006). M‐PESA was developed by mobile phone
operator Vodafone and launched commercially by its Kenyan affiliate Safaricom in March
2007. M‐PESA (―M‖ for mobile and ―PESA‖ for money in Swahili) is an electronic payment
and store of value system that is accessible through mobile phones. To access the service,
customers first register at an authorized M‐PESA retail outlet. They are then assigned an
individual electronic money account that is linked to their phone number and accessible
through a SIM card‐resident application on the mobile phone. Customers can deposit to and
withdraw cash from their accounts by exchanging cash for electronic value at a network of
retail stores or agents. These stores are paid a fee by Safaricom each time they exchange these
two forms of liquidity on behalf of customers. Once customers have money in their accounts,
they can use their phones to transfer funds to other M‐PESA users and even to non‐registered
users, pay bills, and purchase mobile airtime credit. All transactions are authorized and
recorded in real time using secure SMS (Safaricom, 2007).
M-Pesa allows users to exchange cash for "e-float" on their phones, to send e-float to other
cellular phone users, and to exchange e-float back into cash. The story of the growth of mobile
telephones in Africa is one of a tectonic and unexpected change in communications technology.
From virtually unconnected in the 1990's, over 60 percent of Africans now have mobile phone
coverage, and there are now over ten times as many mobile phones as landline phones in use
(Aker and Mbiti, 2010). Even with the story of mobile phones' growth as a background, the
growth of M-Pesa is startling. Within eight months of its inception in March 2007, over 1.1
million Kenyans had registered to use M-Pesa, and over 87 million United States Dollars had
been transferred over the system (Safaricom, 2007). By September 2009, over 8.5 million
Kenyans had registered to use the service and 3.7 billion United States Dollars (equivalent to
10 percent of Kenya's GDP) had been transferred over the system since inception (Safaricom,
2009). This explosive growth was also mirrored in the growth of M-Pesa agents (or service
locations), which grew to over 18,000 locations by April 2010, from a base of approximately
450 in mid-2007 (Safaricom, 2009 and Vaughan, 2007). By contrast, Kenya has only 491 bank
branches, 500 Postbank branches, and 352 ATMs (Mas and Ng'weno, 2009).
3
While the mobile telephone is within sight of becoming a mature business, e-money services
like M-Pesa are still in their early days and are continually evolving in response to competitive
pressures and customer needs. The proliferation of M-Pesa in Kenya has generated research
attempting to explain the roots of the phenomenon and to understand its effects. Kaimenyi and
Ndung'u (2009) attribute the rapid growth in mobile money in Kenya to four factors: a
conducive legal and tax environment, private-public policy dialogue, strategic and prudent
macroeconomic policies, and a guarantee of the existence of a contestable market discouraging
dominance by initial entrants. Comninos et al. (2008) argue that the initial success of Kenya‗s
mobile money industry can be attributed to the high demand for remittances generated by rural
urban migration, while its rapid scaling is due to the mobile providers‗ growth strategy. The use
of mobile payment technology requires basic knowledge to operate. As a result, majority of the
businesses in Kenya have embraced its use in their daily operations. The number of people
owning mobile phones in Africa has grown to 735 million, setting the stage for mass adoption
of Kenya‘s money transfer model by countries keen to enhance access to financial services. A
policy brief from the office of the African Development Bank‘s (AfDB) chief economist
MthuliNcube relies on the annual average growth of 30 per cent in mobile telephone use on the
continent since 2000 to arrive at the figure. (AfDB,2013) Africa had 620 million subscribers at
the close of 2011, 19 million of them in Kenya.
The rapid adoption of mobile money transfer services in Kenya since Safaricom launched its M-
Pesa in 2007 has quickly caught the attention of other mobile telephone operators on the
continent (Business Daily, 2012) since inception; Mpesa has evolved in service offering. M-
PESA'S initial main offering was peer to peer money transfer enabling users to send money to
anyone with a mobile phone. M-PESA filled a niche which previously was essentially handled
via informal channels- through personal trips, friends, relatives, and public transport.
Safaricom based the initial launch of the M-PESA service on the 'send money home' proposition.
This targeted city dwellers with the need to send money to their relatives in the rural areas.
In recent months Safaricom has increasingly opened up M-PESA to offer more services. Since
its launch in March 2007, M-PESA has spread quickly, and has become the most successful
mobile-phone based financial service in the developing world. M-PESA customers can now pay
bills, pay for goods and services, deposit and withdraw money from bank, pay loans, buy water,
pay school fees, buy air tickets and even buy insurance. This evolution of the M-PESA service

4
has enabled up to 40 per cent of the adult population in Kenya get access to financial services.
M-PESA is definitely on the right path, and my hope is that the service will keep evolving until
the problem of financial inclusion in Kenya is successfully tackled (Business Daily, 2012)
For Fast Moving Consumer Goods companies, cash is expensive and inefficient. A company has
to worry about protecting cash from theft, receiving fake currency, and transporting cash. All of
this security, processing time and transportation entails costs. Safaricom is partnering with Fast
Moving Consumer Goods (FMCG) companies in Kenya to deploy cashless payments with M-
PESA. Safaricom‘ s deal with FMCG companies in Kenya represents what could be the first
successful cashless distribution networks in the world. The FMCG companies are using the M-
PESA Buy Goods payment option to receive payments from bars, restaurants and other retail
outlets countrywide. Majority of these bars, restaurants and retail outlets also accept M-PESA
payments from their customers. (Gakure, 2013)With Mpesa cashless, the business sales teams or
distribution tracks are given till numbers, which they use to buy stock from EABL, receive
payments from bar owners and deposit the cash into the bank (Business Daily, 2012)
The distributors are not levied any transactions fees, however, bar owners are charged Sh9 for
every crate they buy through the system. Beer distributors can transact between Sh50, 000 and
Sh70, 000. The average monthly value transacted through system stands at Sh2 billion, which is
bound to rise as the distributors embrace the system fully. Between 3pm and 4pm every day the
tracks distributing beer rush back to their depots to secure the cash they had instead of continuing
with the beer distribution, which not only affected the products availability in the market but also
sales. Safaricom provided a proposal on how the distributors could use the M-Pesa buy goods
platform to remit cash, do purchases and bank deposits. The service though available on the M-
Pesa platform had some challenges. Earlier, it took 72 hours for a transaction made through the
buy goods service to reflect on the third parties accounts. This made it impossible to use the
service in the beer distribution business that requires real time transactions. Safaricom fixed this
by reducing first the waiting period to 48 hours and eventually to less than a minute, giving birth
to the cashless payments system. Other than reducing security risks, the system make it possible
for the distributors to do the purchases themselves, avoiding diversion of business cash (Business
daily, 2012). The distributors now receive payment on a phone that acts as the till. All the funds
from various distributor routes are consolidated by a single Mpesa number that is owned by the

5
business, usually in the accounts or finance office. An online web portal reflects all the
transactions carried out by the tills immediately (Safaricom Intranet, 2014)
1.2 Statement of the Problem
Cashless economy does not refer to an outright absence of cash transactions in the economic
setting but one in which the amount of cash-based transactions are kept to the barest minimum.
It is an economic system in which transactions are not done predominantly in exchange for
actual cash.
In Kenya, Distributors of fast moving consumer goods such as alcoholic and nonalcoholic
beverages handle large amounts of money during the ferrying of these goods to hotels and bars.
In the past East African Breweries distributors have faced problems in security of the funds in
transit. As the bars and hotels pay for the product, the point of sale is the distribution truck.
This had led them to welding the cash box to the truck, handcuffing the driver to the cash box
and even employing security agencies to guard trucks during these rounds (Business Daily,
1012).
However, the global use of cash payment is still endemic, especially for low-value retail
transactions. But while cash may be convenient, it makes taxation less transparent, and it is
costly to distribute, manage, handle and process. It therefore follows that; cash as a mode of
payment is an expensive proposition for any business. As a result, many businesses are seeking
to reduce these costs and encourage the use of non-cash payment means.
This accounts for the high rate of penetration for mobile phone related services such as mobile
money transfer. (Jack, Suri 2010). The mobile phones have been a key ICT product that has
affected business practices. In April 2007, following a student software development project
from Kenya, Safaricom‘ s launched a new mobile phone based payment and money transfer
service, known as M-Pesa. The qualitative studies on M-Pesa such as Morawczynski and
Pickens (2009) have suggested that M-Pesa serves as a partial substitute for the formal banking
system. Due to this it have had a lot of effects on business operations. It is due to this that this
study examined the ways Mpesa cashless product had influenced the dangers of cash in transit
for East African Breweries distributors.

6
1.3 Purpose of the Study
This study intended to investigate the influence of Mpesa Cashless Payments Product on the
operations of East Africa Breweries Limited distributors.
1.4 Objectives of the Study
The following objectives were used to guide the study
1. To investigate how cost of operation has influenced the use of M-Pesa cashless payments
product by East Africa Breweries Limited distributors
2. To establish how security of operations has influenced the use of M-Pesa cashless
payments product by of East Africa Breweries Limited distributors
3. To establish how convenience in operations has influenced the use of M-Pesa cashless
payments product by East Africa Breweries Limited distributors
4. To investigate how Book Keeping Volumes in operations have influenced the use of M-
Pesa cashless payments product by East Africa Breweries Limited distributors
1.5 Research Questions
1. How has the cost of operations influenced the use of M-Pesa cashless payments product
by East Africa Breweries Limited distributors?
2. How has the security in operations influenced the use of M-Pesa cashless payments
product by East Africa Breweries Limited distributors?
3. How has the convenience in operations influenced the use of M-Pesa cashless payments
product by East Africa Breweries Limited distributors?
4. How have Book Keeping Volumes in operations influenced the use of M-Pesa cashless
payments product by East Africa Breweries Limited distributors?

7
1.6 Limitation of the Study
The study demanded a lot of time that was hard to get but the researcher managed to get a
research assistant to help. The respondents delayed in filling in the questionnaires but the
researcher followed up with phone calls to get them to submit the feedback.
1.7 Significance of the Study
The importance of the study was as follows; there is some evidence showing that the
introduction of the Mpesa cashless to the EABL distributors has influenced their business
operations in terms of increasing convenience, reducing costs, reducing book keeping volumes
increasing security. This could be a solution for other businesses that use distributors or ferry
large amounts of cash. The study could also be used to encourage businesses to come up with
innovative ways of avoiding cash transactions in favor of non cash methods such as Mpesa and
credit cards for safety.
1.8 Delimitations of the Study
The study covered 88 EABL distributors in Nairobi County who employ M-Pesa cashless in
their transactions. This however does not mean that it is only EABL distributors in Nairobi that
have employed Mpesa cashless in their transactions. It also does not mean that only EABL
distributors use Mpesa cashless. However due to the bulk of the cashless customers being
EABL distributors they were chosen as the area of the study proposal.
1.9 Assumptions of the Study
The distributors would accept to be interviewed. The respondents would offer honest and
accurate information. The time and resources would be sufficient to complete the study
1.10 Definition of Significant Terms
East African Breweries: A Kenyan born company dealing in beverages of alcoholic and
non-alcoholic nature.

8
Mpesa Cashless: An Mpesa based product launched in 2012 by Safaricom that
allows payments to be made through a mobile devises acting as a
till and comes with an online interface reflecting all transactions
made. Several tills can be controlled by one Mpesa account.
Cost: Fees associated with the operations of the EABL distributors.
Book Keeping Volumes: Amount of work that goes towards keeping financial records and
document management in the operations of EABL distributors.
Convenience: The ease with which EABL distributors operate.
Security: The level of exposure to dangers of cash in transit in operations
of the EABL distributors.
1.11 Organization of the study
The study has five chapters. Chapter One the introduction has subheadings; background to the
study, problem statement, purpose and objectives of the study, research questions,
justification,limitations, delimitations, and assumptions of the study and definition of significant
terms. Chapter Two has literature review, it has been organized according to the objectives of the
study. A theoretical framework and conceptual framework are at the end. Chapter Three has
presented the research design, target population, sampling procedure and sample size, research
instruments, data collection procedure and analysis and operationalization of study variables.
Chapter Four presents the data analysis, interpretation,discussion and presentation of the
findings. Chapter Five has presented the summary, discussions, conclusions and
recommendations of the study.

9
CHAPTER TWO
LITERATURE REVIEW
2.1 Introduction
This chapter delves into the available literature on ‗non-cash‘ modes of payment. In so doing
the researcher starts with literature on a global perspective proceeding to the regional view and
finally the country down to Nairobi. It is based on the research objectives being the influence of
Mpesa cashless on the costs, convenience, security and book keeping volumes for EABL
distributors. The theoretical back ground in light of the study variables is also discussed. The
conceptual framework and interpretation of the variables therein is also expounded on.
2.2 The Origin and Rise of Cashless Payments
According to the Federal Government (2013), In the United States of America payment
systems have evolved into a near cashless society. This is encouraged by the high development
in ICT, Federal laws and presence of a financial industry both public and private offering
monetary clearing services such as banks, credit card companies and automatic clearing houses.
These forms of cashless payments are credit cards, cheques, debit cards and electronic money
transfers. Credit cards are the most frequently used electronic payment instrument in the United
States. These cards combine a payment instrument with a credit arrangement. There were 20.5
billion credit card transactions processed during 2000, valued at USD 1.5 trillion. Bank credit
cards are generally issued by a bank under a license from a national organization, such as Visa
or MasterCard, and typically involve a revolving credit agreement. There were 9.5 billion bank
credit card transactions during 2000. In addition to bank-issued cards, a number of other
companies offer credit cards directly to businesses and consumers. These include Discover
Card; national travel and entertainment cards, such as American Express; and limited-use
proprietary cards, such as those issued by retail stores and oil and telephone companies.
A 1998 survey of consumers indicated that 68% of US households have at least one general
purpose credit card, a 21% increase since 1989. In 1998, limited-use cards issued by retail

10
stores and oil companies (generally limited to in-store use) were held by 50% and 19% of US
households, respectively.
According to the World payments Report (2012) compiled by the Royal bank of Scotland, the
global volume of non-cash payments continues to show healthy growth, with the largest gain in
volumes occurring in developing markets. Volumes grew by 7.1% to reach 283 billion in 2010,
the most recent year for which official final data is available for all regions. Volumes jumped
16.9% in developing markets, boosted by an increase of more than 30% in both Russia and
China. That growth far outpaced the modest increase in volumes in developed markets, which
were still suffering the effects of the financial and economic crisis. Even in developed markets,
though, the growth in non-cash payments volumes, at 4.9%, outpaced the rate of growth in
gross domestic product (GDP), and developed markets still accounted for about 80% of all non-
cash payments transactions globally. Cards (debit cards and credit cards) are still the biggest
driver of non-cash payments volumes globally. Cards accounted for 55.8% of all non-cash
payments in 2010, up from 53.4% in 2009 and 35.3% in 2001.
Debit cards alone accounted for more than one in three of all payments, partly as the use of
cards for smaller-ticket transactions becomes more widespread. The aggregate use of checks
continued to decline (down 6.7% in 2010), while the outright volume of credit transfers and
direct debit transactions continued to increase in 2010, though the relative usage of these
instruments is gradually declining compared to cards. Global payments volumes are expected
to have reached 306 billion in 2011. When global data are finalized for 2011, it is expected to
show the growth rate among developed economies rising only slightly, by 5.6%, but the
increase in developing economies is expected to be a more robust 18.4%. As a result, the share
of payments volumes from developed markets will have slipped again, to 77.7% in 2011 from
79.5% in 2010. Electronic and mobile payments maintain their rapid growth trajectory.
Industry estimates show the number of online payments for e-commerce activities (e-payments)
is forecast to reach 31.4 billion in 2013, after growing by a sustained 20.0% a year in 2009-13.
Analysts believe the number of payments using mobile devices (m-payments) could grow even
faster, by 52.7% a year to reach 17 billion in 2013. Widespread innovation in customer-focused
m-payments solutions, especially by non-banks, is rising to meet the growing demand. With
these markets growing so rapidly, there is a mounting need for central banks to make sure

11
reliable market data is being collected and monitored with the same rigor for emerging payment
channels as for legacy instruments (Royal Bank of Scotland, 2012)
India is currently the 13th largest non-cash payments market in the world, but has the potential
to grow significantly. Volumes have been growing about 10% a year as the National Payments
Corporation of India (NPCI) continues to drive infrastructure improvements and the
development of cheap and efficient electronic payment instruments for instance m-payments,
the RuPay domestic cards scheme, and a biometric authentication card system that is currently
being rolled out.. The market share of checks has continued to decline gradually, however—to
59% of all transactions in 2010 from 93% in 2001—during which time the market shares of
cards and credit transfers have increased. China is the eighth largest payment market, and
volumes jumped 30.3% in 2010. The use of cards now predominates, though cash is still used
heavily for retail payments—as it is in India and Russia. Credit transfers are the next most
commonly used and reliable method of settlement, as concerns persist about the security of e-
banking, and even the use of cash, given the flow of counterfeit currency. Still, online shopping
is becoming more commonplace, especially among residents of major cities. The payment
options on Taobao.com, the most popular on-line shopping website in China, include multiple
card and non-card settlement options. The directive on electronic payments, enacted by China
in 2005, also guided banks on providing e-payment services, and adopted measures to handle
checks electronically, and improve check processing efficiency.(Royal Bank of Scotland, 2012)
In the Middle East, Hawala is one of several Informal Funds Transfer Systems, according to the
Journal of Language and Entrepreneurship in Africa (2010) that is used in different countries in
many parts of the world. Hawala is generally associated with the Middle East and the Indian
Subcontinent where it is called Hundi. Hawala is believed to have arisen in the financing of
long-distance trade around the emerging capital trade centers in the early medieval period.
In South Asia, it appears to have developed into a fully-fledged money market instrument,
which was only gradually replaced by the instruments of the formal banking system in the first
half of the 20th century. Today, hawala is probably used mostly for migrant
workers' remittances to their countries of origin (Journal of Language and Entrepreneurship in
Africa ,2010)

12
The global adoption of Mobile phones has occurred at perhaps the fastest rate of any consumer
technology in History. This accounts for the high rate of penetration for mobile phone related
services such as mobile money transfer. (Jack,Suri 2010). Mobile telephony penetration in
Africa has increased exponentially from less than 2 million subscribers in 1998 to over 400
million in 2009 (Ondiege,2010)In Africa, mobile service provider MTN launched MTN money
based, a money transfer service conducted from a mobile phone. In the Congo, celpay is a
mode of banking enabled by mobile phones. At the Ivory Coast, Orange money is also a mobile
money transfer system in use. MTN money is also in use in Uganda (Menekse Gencer, 2009).
Orange money, Airtel money and Yu cash are some of the money transfer services offered by
mobile phone service providers in Kenya. Business practices in Kenya have gone through many
changes, the most important being the introduction of Information Communication and
Technology (ICT). The mobile phones have been a key ICT product that has affected business
practices. In April 2007, following a student software development project from Kenya,
Safaricom‘ s launched a new mobile phone based payment and money transfer service, known
as M-Pesa. The service allows users to deposit money into an account stored on their cell
phones, to send balances using SMS technology to other users (including sellers of goods and
services), and to redeem deposits for regular money. Users are charged a small fee for sending
and withdrawing money using the service. M-Pesa has spread quickly, and has become the
most successful mobile phone based financial service in the developing world. By 2012, a stock
of about 17 million M-Pesa accounts had been registered in Kenya (Camner and Sjöblom,
2009).
The initial work of developing the product was given to a product and technology development
company known as Sagentia. Development and second line support responsibilities were
transferred to IBM in September 2009, to where most of the original Sagentia team transferred.
The initial concept of M-Pesa was to create a service which allowed microfinance borrowers to
conveniently receive and repay loans using the network of Safaricom airtime resellers. This
would enable microfinance institutions (MFIs) to offer more competitive loan rates to their
users, as there is a reduced cost relative to dealing in cash. The users of the service would gain
through being able to track their finances more easily. But when the service was piloted,
customers adopted the service for a variety of alternative uses and complications arose with

13
Faulu, the partnering MFI. M-Pesa was re-focused and launched with a different value
proposition: sending remittances across the country and making payments (Camner and
Sjöblom, 2009).
According to Mas and Radcliffe, (2010), M-Pesa is a branchless banking service, meaning that
it is designed to enable users to complete basic banking transactions without visiting a bank
branch. The continuing success of M-Pesa in Kenya has been due to the creation of a highly
popular, affordable payment service with only limited involvement of a bank. MPESA has had
a significant impact on the economy and has created 30,000 direct jobs. At the user level, the
benefits are immense. In a survey conducted by FSD Kenya, 47 per cent of the Mpesa
customers reported that they save up to 3hrs per transaction compared to other available means
of money transfer. The survey also noted that, they save up to US$3 per transaction. Micro-
business enterprises in the developing world are increasingly deploying the use of mobile
payments to enhance the quality of their services and increase growth. The pace of
transformation in the micro business sector has speeded up with more micro businesses
realizing the potential of using the mobile payments in their service delivery. However, there
are only a handful of studies on the application of digital technology for success and growth on
micro business.
Payment systems exhibit network externalities as the value of a payment system to a single user
increases when more users begin to use it (Hughes and Lonie, 2007). Consumer decision to
adopt a payment system is therefore significantly affected by the amount of other consumers
and traders using it. Failure to create a critical mass has contributed to discontinuance of
several previous payment systems, including several smart card systems (Szmigin& Bourne,
1999). It is therefore a critical success factor for the M-Pesa mobile payment provider to reach
a wide enough base. The coverage area of the M-Pesa mobile payments is spread throughout
the country with over six million registered subscriber base as at 31st March, 2009 (Annual
Report 2008/2009).According to Scott et al (2004), Mobile phones offer easy communication
and the current M-Pesa facilities have reduced the average transaction costs for the consumer.
Safaricom‘ s Annual Report 2008/2009 show that person to person transactions stood at KES.
120.61 billion for the same year against 14.74 billion for the year 2007/2008. The total
cumulative person to person transactions stood at Kshs. 135.38 billion as at 31st March 2009

14
since inception of the mobile payment service. This indicates that M-Pesa mobile payment is
reaching many. The benefits associated with M-Pesa are so enormous that those who try to
place regulatory pressure on it might feel guilty if they appear to frustrate it.
The extent to which the mobile payment usage would impact on performance depends largely
on whether there is an enabling environment (Porteous, 2006). Porteous defines an enabling
environment as a set of conditions which promote a sustainable trajectory of market
development. Of particular interest are the environments in which widespread access is likely.
According to Vaughan, (2007), M-Pesa has widespread access and requires an enabling
environment to enhance the success of its consumers. Businesses are spread throughout the
country with huge clusters in the market areas and near shopping centers. This enables them to
easily access the M-Pesa service providers for registration and to make cash deposits into their
accounts as well as payments for other services. The East Africa Breweries Distributors have
thus been able to use the cashless product due to the acceptance levels of Mpesa and mobile
phone penetration.
2.2.1 Costs in the Operations of EABL Distributors
Consumers invest considerable time and money in managing their personal finances
(Chakravorti and Mazzota, 2013) the United States the cost of cash is higher for poor and
unbanked people than for other groups. Poor Americans who lack access to formal financial
institutions carry larger amounts in cash and pay the most fees in aggregate terms for cash
access transactions. Well-banked wealthier Americans, on the other hand, report carrying far
lesser amounts in cash, traveling less to access cash, and pay few, if any, fees. The costs of
using cash do not accrue at points of sale. Since merchants rarely provide discounts or
surcharges for using cash at the point of sale, the costs of cash manifest elsewhere in the
lifecycle of cash. This could mean, among other things, costs that accrue as a result of the time
or money spent in making trips to a bank, ATM, or fees to cash checks. (Chakravorti and
Mazzota, 2013)
A company has to worry about protecting cash from theft, receiving fake currency, and
transporting cash. All of this - security, processing time and transportation, - entails costs.
15
(Mwangi, 2013)Beer distributors can transact between Sh50, 000 and Sh70, 000. The average
monthly value transacted through system stands at Sh2 billion but between 3pm and 4pm every
day the tracks distributing beer rush back to their depots to secure the cash they had instead of
continuing with the beer distribution, which not only affected the products availability in the
market but also sales. (Business Daily, 2012).
2.2.2 Security in The Operations of EABL Distributors
Security, simply put referrers to freedom from danger. In the proposed study, security will refer
to mitigation from the risks that the cash in transit face such as being stolen by the employees
themselves and even thieves.
With the downturn in the global economy, cash-in-transit crime is on the rise. In the U.K.
alone, there is an estimated 500 billion pounds being transported each year. Money stolen in
attacks is a major source of funding for serious organized crime. In 2008, there were 1,000
documented attacks against cash-in-transit couriers in the UK. Applied DNA sciences, 2014)
According to the Institute of Business in the global context at the Fletcher school of Business
cash must be held in physical form, counted, guarded, and accounted for. It can be difficult to
transport and send. Being possibly the last thing you can expect to recover from a stolen wallet,
acceptable everywhere, and anonymous, it is inherently insecure. In any serious quantity, most
legitimate businesses prefer some other party, such as a bank, to handle cash on their behalf.
(Chakravorti and Mazzota, 2013)Safe Work Australia, an Australian Government statutory
agency established in 2009 working with the Commonwealth, state and territory governments
to improve work health and safety and workers‘ compensation arrangements. In its 2013 report
dubbed ‗Managing cash in Transit and security, the following is reported; A person conducting
a business or undertaking must ensure, so far as is reasonably practicable, the health and safety
of other persons is not put at risk from work carried out as part of the conduct of the business or
undertaking and provide safe systems of work. Cash-in-transit activities will usually involve
more than one person conducting a business or undertaking who each have health and safety
duties to the extent of their ability to influence and control various aspects of health and safety
related to the cash-in-transit activity. In these situations, the duty holders should exchange
information about the hazards and risks and work together in a co-operative and coordinated
16
way to eliminate or minimise the risks so far as is reasonably practicable. Potential hazards may
be identified in a number of ways, including: inspecting client work sites, inspecting vehicles
and equipment, observing systems of work and work practices, analyzing the routes for cash-
in-transit transfers, talking to workers about problems they have noticed, reviewing incident,
injury and dangerous incident reports e.g. a report on a hold-up, and determining the levels of
training, experience and competence for the tasks. Managing security risks requires assessing
all foreseeable risks from carrying out cash-in-transit activities. Security risks can be created by
not addressing other health and safety hazards, for example slips, trips or falls can make a
security worker vulnerable to an opportunistic robber. A risk assessment involves considering
what could happen if someone is exposed to a hazard and the likelihood of it happening. A risk
assessment can help determine how severe a risk is, whether existing control measures are
effective, what action should be taken to control the risk and how urgently the action needs to
be taken. Many hazards and their associated risks are well known and have well established and
accepted control measures. In these situations the second step to formally assess the risk is
unnecessary. If, after identifying a hazard, you already know the risk and how to control it
effectively, you may simply implement the controls. Risk assessments of cash-in-transit
activities should be conducted by a competent person, for example a person who holds
qualifications in Security Risk Management and relevant experience in the cash-in-transit
industry. The factors to consider when assessing risks arising from cash-in-transit activities
include: whether the activity is overt e.g. not attempting to hide the transport by using a marked
armored vehicle and uniformed workers, whether the activity is covert e.g. attempting to hide
the transport by using an unmarked vehicle and non-uniformed workers the regularity of the
client runs, the time of the work and periods of peak traffic, the amount of cash and the weight
in each transfer, the types of work being carried out e.g. patrol how many people are exposed
e.g. crew levels and public activity adequacy of communication systems e.g. back to base radio
or equivalent technology, mobile phones the suitability and condition of the vehicles the
suitability of equipment for the activity e.g. firearms environmental factors like outdoors, hot
and cold environments, wet conditions and darkness, and working hours. Regular route and
delivery times increase vulnerability to robbery attempts. Delivery routes and times should be
varied as much as possible. Where delivery routes and times are identified as risk factors, risk
management strategies should be put in place. Security providers should try to reduce cash
17
build-ups. This may be achieved by putting in place cash limits for each cash-in-transit activity
based on a risk assessment and industry operational needs. (Safe Work Australia, 2013)
2.2.3 Convenience in the Operations of EABL Distributors
Convenience implies to the quality of being suitable to one‘s comfort, purpose or needs. In the
fast food industry, mobile payment has proved to offer service s that are of expediency to the
users, for example, a customer in the office is able to order for French fries via a mobile phone
and make payment via the same means; M-Pesa and within a short time delivery is made to
where the customer is. This service has come in handy especially to those who are largely
engaged in their places of work thus finding it difficult to walk to these franchises to these
foods themselves. They save on time hence the can do more at their work places by using time
saved on constructive activities (Porteous and Finmark, 2007). Cash must be held in physical
form, counted, guarded, and accounted for. It can be difficult to transport and send. Being
possibly the last thing you can expect to recover from a stolen wallet, acceptable everywhere,
and anonymous, it is inherently insecure. In any serious quantity, most legitimate businesses
prefer some other party, such as a bank, to handle cash on their behalf. In other words, cash
satisfies two of the most significant criteria of digital disruption: there are viable digital
alternatives with wide networks of adopters and cash presents the carrier with multiple forms of
disutility or costs (Chakravorti and Mazzota, 2013)According to Aker and Mbiti, (2010), use of
mobile money despite being convenient comes with various challenges, safety being a key
issue. In a mobile environment, it is necessary to have perceived security and trust in the
payment system. Security and safety of mobile payment transactions is one of the primary
concerns for users. They state that safety represents no delay, no transaction incompleteness
and no private information disclosure during payment transactions. The use of the pin and
secret code for the M-Pesa transactions enhances the security and privacy issues. Key
requirements for any financial transaction in an electronic environment should include
confidentiality, authentication, data integrity and non-repudiation. Other security factors
important to the users are anonymity and privacy, which relate to use policies of customers‘
personal information. The users of M-Pesa are issued with unique secret identification number
which is confidential to them alone. This is aimed at protecting their accounts such that no

18
other person will be able to make transaction using the account unless access is made using the
personal identification number issued. Medhi et al (2009), states that a lost or stolen mobile
phone does not mean catastrophe as no one can access an M-Pesa account without a correct
personal identification number (PIN). In a different context, he further explains that in a
country where majority of people have no bank accounts, M-Pesa provides both convenience
and safety. People walk around with their virtual money knowing they can withdraw cash any
time at a minimal fee.
The perceived safety
of Mpesa and its convenience are major reasons that early adopters of the technology chose to u
se it. Table 9 reports households‘ primary reasons for using or not using MPESA. Among user
s, 26% report that safety was their main motivation for adopting it; nearly twice as many (45%)
say ease of operation was the main reason. About 12% say they use MPESA for emergencies.
For nonusers the reason that was mentioned most often as the primary cause of nonadoption wa
s lack of adequate access to the network of agents. In the year since the survey was fielded, the
number ofagents has risen from about 2,500 to more than 12,000 so this constraint is less likel
y to bind now. (Jack and Suri, 2009) The EABL distributors ferrying large amounts of cash
exposed to these security risks as opposed to cashless payment product users.
2.2.4 Book Keeping Volumes in the Operations of EABL Distributors
Book keeping in offices translates to long man hours. According to UNEP (2011) Going
paperless has many advantages: increased efficiency, paper and printing cost savings, time
savings, storage cost savings, environmental benefits, efficient file retrieval, and enhanced
customer service. There are a variety of possible benefits for companies deciding to make their
offices ―paperless.‖ An obvious benefit is potential cost reduction. Other benefits that can be
achieved include becoming more ―green‖ or environmentally friendly and increasing
efficiency. When combined together, all of these lead toward an overall benefit of improving
customer service. By doing this, companies may continue to keep their current customers
happy and make new customers become long-standing loyal ones, as well. There are many
concerns in today‘s world about the state of the environment. With more and more people
supporting going green and supporting companies that do so. In the United States The Natural

19
Resources Defense Council has found that ―offices throw out about 350 pounds of paper per
employee every year,‖ (Ryan, 2008). Dan Shapley (2007), writer for The Daily Green Paper, an
online newsletter geared toward the green revolution, paper accounts for a quarter of landfill
waste and one third of municipal landfill waste. One third of human-related methane emissions
come from municipal landfills. This is significant considering that methane is 23-times more
potent a greenhouse gas than is carbon dioxide. By cutting office paper use by just 10%, the
United States would prevent the emission of 1.6 million tons of greenhouse gases. This would
be similar to removing 280,000 cars from the road. In turn, besides the above benefits, the
company will have the reputation of being environmentally friendly. (Bradwel, 2005)In Africa
Senegal‘s experience in paperless trade implementation started in the mid-1980s when
government authority (Ministry of Finance) made the decision to computerize official
processes, in general, and trade procedures, in particular. Implementation really took shape in
the 1990s, with the reform initiated by customs to improve clearance formalities. These efforts
later culminated into the establishment of the customs automated system.
2.5 Theoretical Background
The acceptance of technology theory by Davis and Bagozi (1992) states that the ease of
technology acceptance by a population depends on two factors. Firstly, the usefulness of the
technology and secondly the ease of use.
Mobile payment procedures are essentially information technology (IT) procedures and
channels through which users make various payment transactions. Studies show that the
acceptance to use the mobile payments varies with the context in which users are able to use a
mobile payment procedure. Moreover, the mobile payment procedures are functional services
adopted for utilitarian reasons (Mas, Morawczynski, 2009).
These factors are perceived useful and are defined as the degree to which a person or business
believes that using this system; mobile payment, would influence or change on the way
transactions are usually conducted. There are certain factors that are considered to be primary
determinants for adopting and using mobile money which include; easy accessibility and
convenience, security, and satisfaction (Jack and Suri, 2011). The EABL distributor
interviewed on the Business Daily journal October,2012 said the her working hours have

20
reduced significantly due to the reduction in book keeping volumes after introduction of Mpesa
Cashless Payments product. (Business Daily, 2012)

21
2.6 Conceptual Framework
A conceptual frame work explains either graphically or narratively the main things to be
studied the key factors, constructs or variable to be studied and the relationship among them. (
Miles and Huberman ,1994)
Figure 1: Conceptual Framework
Independent Variables Dependent Variable
Moderating Variable
Cost in the operations of EABL distributors is an independent variable influencing the use of
the Mpesa Cashless Payments Product.
Security in the operations of EABL distributors is an independent variable influencing the use
of the Mpesa Cashless Payments Product.
Cost- Expenditure on
Transport, head count,
banking fees
Security -Number of
robberies or safe trips
Convenience – Time,
Reliability
Book Keeping Volumes -
Time spent processing
payments, amount of
printing paper used
Operations of EABL Distributors-
Revenue increment, Cost Savings
Interest in Mpesa Cashless
Service

22
Convenience in the operations of EABL distributors is an independent variable influencing the
use of the Mpesa Cashless Payments Product.
Book Keeping Volumes in the operations of EABL distributors is an independent variable
influencing the use of the Mpesa Cashless Payments Product.
Operations of EABL Distributors is the dependent variable influencing the use of the Mpesa
Cashless Payments Product
Interest in the Mpesa Cashless product is the moderating variable that affects the
independent variable in the presence of the independent variables. This means for example
even when the costs of operations were brought down by the use of Mpesa cashless product,
the distributors still had to be interested in the product to use it.
2.7 Research Gap
Originally, M-PESA intended just to design and test a platform that would allow customers to
receive money and repay small loans using their handsets. The service was also designed to
help microfinance institutions streamline their operations, raising efficiency and boosting
business growth. After the pilot the executives at Safaricom saw M-PESA as an opportunity
first to become a payment service provider and second to increase customer retention. It has
certainly achieved these objectives.
M-money services have advantages of ubiquity, convenience and cost-effectiveness over other
money transfer or payment intermediaries such as banks and other financial institutions. A 2010
CGAP study which compared pricing of 16 leading ‗‗branchless‘‘ banking services against ten
formal banks found that branchless banking was 19 percent cheaper than its formal
counterparts.
Mobile remittance services, in contrast, have the potential to extend remittance services to
millions of those with limited access to traditional bank services, while also reducing
transaction costs in terms of commission fees and transport. Mobile payments are conducive for
micro transactions. In Africa, Kenya‘s M-PESA service has proved to be the most widely-used
mobile remittance service to date. Commercially launched in March 2007 (The Economist,

23
2007), the service is reportedly used by over 50 percent of the country‘s adult population
(Graham, 2010). Similar initiatives have been introduced in other African countries, including,
Tanzania, Uganda, Ghana, Zambia, Congo and South Africa (Laurent, 2006; Mas and
Morawczynski, 2009).
Previous empirical studies support the argument that mobile money transfer is positively
associated with firm-level growth. Positive effects of mobile money investments and business
transaction usage on firms growth have been demonstrated in the health care sector (Devaraj
and Kohli, 2000, 2003). Similar results were found in the insurance industry where top
performing firms with high premium income growth had higher mobile money transaction
expense ratios and lower non- mobile money transaction costs (Harris and Katz, 1991). In
addition, positive effects of mobile money transactions investment on sales growth were found
among valve manufacturing firms (Weill, 1992). Koellinger (2005) finds a positive relationship
between mobile money transactions and not--related innovation and turnover growth using data
from the 2003 e-Business Watch survey.
Various local authors stressed that mobile money transfer may be characterized as a typical
general purpose technology that, like earlier technological breakthroughs, has a wide range of
applications and a large impact on economic activity, Ondijo (22008). At the aggregate level,
Kongelo (2004) and Njia (2006) argue that the resurgence of growth in the developing
countries is mainly founded on the development and deployment of semiconductors that
continuously exhibit a price decline and increasing performance, following Moore‘s law
(Moore 1965). Other authors have also demonstrated an increasingly productive use of mobile
money transfer in the user sectors, and not only a productivity growth in the ICT producing
sector itself Mokua and Ndeche (2007). However Gordana (2003) raised doubts about this
productivity growth acceleration story by taking a case of exchange bureaus in Nairobi and
attributed most of the observed changes in international business transactions to price-
measurement success and cyclical factors. None of these studies focused on the influence of
Mpesa Cashless Payments Product on the operations of East Africa Breweries Limited
distributors.

24
2.8 Summary of the Chapter
This chapter delved into the Rise of Non Cash Payments globally, regionally, in Kenya and
then in Nairobi. The aspects of Cost, Security and Book Keeping Volumes associated with non
cash payments. The theoretical framework was outlined as Adoption of Technology Theory
(Davis, 1992) The conceptual framework concludes the chapter

25
CHAPTER THREE
RESEARCH METHODOLOGY
3.1 Introduction
According to Polit and Hungler (1995) methodology refers to ways of obtaining, organizing and
analyzing data.
The methodology section of this research study described the procedures that are followed in
conducting the study. Techniques of obtaining data are developed and data collected for
eventual analysis, results, discussions, conclusions and recommendations. This helps other
researchers in understanding one's study particularly in the case of replication. This section
therefore discusses populations, samples, study designs, data collection procedures/ instruments
and data analysis. This aims at answering the question what, where, when, and how much and
by what means was the research conducted. It is the conceptual structure within which the
research was conducted. Descriptive research design was adopted in this case. The researcher
visited the population of interest. The respondents were contacted via email in their usual
working place allowing them to respond more freely to questions.
3.2 Study Design
Descriptive study design was used. Descriptive study design is concerned with describing the
characteristics of a particular individual or group. Descriptive research is therefore concerned
with specific predictions, with narration of facts and distinctiveness concerned with individuals,
group or situations. The advantage of this design is that it allowed it to be flexible in data
collection and also made use of open ended and closed questions which allowed the
respondents to give extra information freely. It was also appropriate because it ensured that the
respondents were not be manipulated in their response.
According to Kothari (2005) descriptive research design includes surveys and fact finding
enquiries of different kinds. The major purpose of descriptive research is description of the
state of affairs as they exist at present. In descriptive studies the researcher must be able to
define clearly, what he wants to measure and must find adequate measures of finding it along

26
with a clear cut definition of "population" he wants to study. The designs in such studies must
be rigid and not flexible and must focus attention on the following: formulating the objective of
the study, designing the methods of data collection, selecting the sample, collecting the data,
processing and analyzing the data and reporting the findings.
3.3 Target Population
According to Kothari (2004) all the items under consideration in any field of inquiry constitutes
a ‗universe‘ or ‗population‘. The total number of EABL Distributors on the Mpesa cashless
product is 88as at 23rd
Oct 2013 (Safaricom Intranet, 2013)
3.4Sample Size and Sampling procedure
A complete enumeration of all the items in the ‗population‘ is known as a census (Kothari,
2004). The entire list of EABL distributors on the Mpesa Cashless product was used.
3.5 Data collection Instruments and procedures
Data was collected using questionnaire method. The questionnaire contained both open ended
and closed ended questions. Appropriate forms of questions were used depending on the
information sort, the sampled respondents and the kind of analysis intended. The questions
were simple and logical. The questionnaires were administered on an online method called
survey monkey. Respondents were expected to read and understand the questions and type in
responses in the spaces provided.
3.6 Data analysis
Data was analyzed using frequency distribution tables and percentages. It involved strictly
related operations which included; scanning by checking the entire questionnaire to ensure that
they are complete and instructions are followed, establishment of categories and range, and the
application of these categories to raw data through coding for purposes of analyzing and finally
the tabulation of data in tables for each question in order to draw statistical inferences
27
3.7 Instruments Validity
Validity estimates how accurately data obtained in the study represents a given variable or
construct in the study (Mugenda, 2008).The questionnaire was given to some professionals who
include my supervisor to critique it. This ensured that the structured questionnaire remains
focused, accurate and consistent with the study objectives. The instruments were pre-tested to
ascertain whether the target audience would give the effective response as well as test their
understanding of the questions being asked. This also reduced ambiguity. The results thereof
were however not included in the final findings.
3.8 Instruments Reliability
Reliability according to Saunders et. al (2003) is concerned with whether the procedures will
yield the same results on other occasions or not. Yin (2003) stresses that the goal of reliability is
to minimize the errors and biases in a study. The questionnaire was initially administered to 5
respondents. Another 5 respondents were randomly picked after 2 days and similar
questionnaires used to collect data. The responses were be summarized and compared to the
earlier ones to test reliability. This proved the reliability of the questionnaire as responses were
similar.
Reliability of the questionnaire was evaluated through Cronbach‘s Alpha which measures the
internal consistency. The Alpha measures internal consistency by establishing if certain items
measure the same construct. Nunnally (1978) established the Alpha value threshold at 0.6 which
the study benchmarked against. Cronbach Alpha was established for every objective in order to
determine if each scale (objective) would produce consistent results should the research be done
later on. Table 4.1 shows that all the scales were significant, having an Alpha above the
prescribed threshold of 0.6. Costs had an Alpha of 0.926. Security had an Alpha of 0.865.
Convenience had an Alpha of 0.791. Book keeping volumes had an Alpha of 0.762. When all
scales were combined, the Cronbach‘s Alpha became 0.836.

28

29
3.8 Operationalization of Variables
OBJECTI
VE
VARIABLE INDICAT
ORS
MEASURE
MENT
MEASURE
MENT
SCALE
TOOLS
OF
ANALYSI
S
TYPE OF
ANALYSIS
i) To
investigate
how M-
Pesa
cashless
has
influenced
costs in the
operations
of East
African
Breweries
Limited
distributors
1.
Independent
Variable Cost
Expenditur
e on cash
transit
Amount of
money spent
Ratio
scale
Mean Descriptive
analysis
ii) To
establish
how M-
Pesa
cashless
has
influenced
security in
the
operations
of East
African
Breweries
Limited
distributors
2.
Independent
Variable
Security
Number of
trips
successfull
y free of
danger
Amount of
stock and
cash arriving
safely
Ratio
scale
Ordinal
scale
Mean Descriptive
analysis
iii) To
establish
how M-
Pesa
cashless
has
3.
Independent
Variable
Convenience
Time
taken
to
compl
ete
Number
of hours
Number
of trips
Ordinal
Ordinal
Freque
ncy
Freque
ncy
Descriptive
analysis
Descriptive
analysis

30
influenced
convenienc
e in the
operations
of East
African
Breweries
Limited
distributors
deliver
y route
Numbe
r of
trips
made
back to
the
office
to
deposit
cash in
order
to
secure
it
iii) To
investigate
how M-
Pesa
cashless
has
influenced
Book
Keeping
Volumes in
the
operations
of East
African
Breweries
Limited
distributors
4.
Independent
Variable
Book
Keeping
Volumes
Time
taken
to
prepare
paperw
ork
Amoun
t of
Printin
g done
Number
of man
hours
spent
working
on
paperwor
k
necessita
ted by
cash
payment
s
Amount
of money
spent on
stationer
y for
paperwor
k
Ordinal
Ordinal
Ratio
Mean
Mean
Descriptive
analysis
Descriptive
analysis
Table 1: Operationalization of Variables
31
3.9 Methods of Data Analysis
After receiving the online questionnaires, data coding was done by creating dummy variable
names. These were in turn given values (ordinal scale) and computed via SPSS. Data cleaning
was done where by the data file was checked for accuracy and completion. This was then
followed by data entry according to the assigned codes. The keyed in data was subjected to the
SPSS processor which computed the data results. The output results were used to draw
conclusions with regard to the research questions.
3.10 Summary
This chapter dealt with the research methodology which helped in gathering and analyzing data
in respect to the research questions highlighted in the first chapter. This facilitated the
presentation of the research findings in a much easier and comprehensive format.

32
CHAPTER FOUR
DATA ANALYSIS, PRESENTATION, INTERPRETATION AND DISCUSSION
4.1 Introduction
The main objective of the study was to investigate the influence of Mpesa Cashless Payments
Product on the operations of East Africa Breweries Limited distributors. Qualitative data was
analyzed through quantitative analysis. Tables were used to present the data. The questionnaires
were dropped and later picked at a later date to allow the respondents to feel the questionnaires at
their own time. Once the respondents answered the questionnaire, data was then coded and
analyzed using SPSS.
4.1.1 Response Rate
The study targeted 88 respondents in collecting data with regard to influence of Mpesa Cashless
Payments Product on the operations of East Africa Breweries Limited distributors. From the
study, 76 respondents out of the 88 sample respondents filled-in and returned the questionnaires
making a response rate of 86.36%. This reasonable response rate was achieved after the
researcher made personal calls and physical visits to remind the respondent to fill-in and return
the questionnaires.
4.2 Demographic information
This section describes the general characteristics of the research respondents in terms of
occupation
The study sought to find out occupation of the respondents. From the findings, 59.21% of the
respondents were operations managers, 34.21% of the respondents were finance managers and
6.58% of the respondents were human resource managers. This implies that the respondents had
knowledge on Mpesa Cashless Payments Product.
The table 4.1 represents the occupations of the respondents

33
Table 4. 1: Occupation of the respondents
Frequency Percentage
Finance manager 26 34.21
Operations manager 45 59.21
Human resource manager 5 6.58
Total 76 100
4.3 Influence of Cost of Operations on Use of M-Pesa Cashless Payments Product
The study sought to find out if there were costs that the business had reduced or increased due
to the use of Mpesa cashless. According to the findings, 94.74% of the respondents indicated
that there were costs that the business had reduced or increased due to the use of Mpesa
cashless while 5.26% of the respondents indicated that there were no costs that the business had
reduced or increased due to the use of Mpesa cashless. Since merchants rarely provide
discounts or surcharges for using cash at the point of sale, the costs of cash manifest elsewhere
in the lifecycle of cash. This could mean, among other things, costs that accrue as a result of the
time or money spent in making trips to a bank, ATM, or fees to cash checks. (Chakravorti and
Mazzota, 2013). The table below shows the findings on the cost of operations on the use of
Mpesa cashless product. The respondents were asked if there were costs that the business had
reduced or increased due to the use of Mpesa cashless
Table 4. 2: If there were costs that the business had reduced or increased due to the use of
Mpesa cashless
Frequency Percentage
Yes 72 94.74
No 4 5.26
Total 76 100

34
4. 3. 1 Extent that the costs had been reduced due to the use of Mpesa
The respondents were asked the extent to which the costs of operations had been reduced due to
the use of Mpesa. From the findings, security guard fees and transport had been reduced due to
the use of Mpesa to a very great extent as shown by a mean of 4.831 and 4.682 respectively. In
addition, human resources/head count and banking fees had been reduced due to the use of
Mpesa to a great extent as shown by a mean of 4.195 and 3.754 respectively. A company has to
worry about protecting cash from theft, receiving fake currency, and transporting cash. All of
this - security, processing time and transportation, - entails costs. (Mwangi, 2013).
The table below represents these findings
Table 4. 4: Extent that the costs had been reduced due to the use of Mpesa
Mean Stdev
Transport 4.682 0.296
Banking Fees 3.754 0.491
Security Guard Fees 4.831 0.923
Human Resources/Head count 4.195 0.385
4.4 Influence of Security in Operations on Use of M-Pesa Cashless Payments Product
The respondents were asked whether they had ever lost cash in transit. According to the findings,
85.53% of the respondents indicated that they had ever lost cash in transit while 14.47% of the
respondents indicated that they had never lost cash in transit. Security providers should try to
reduce cash build-ups. This may be achieved by putting in place cash limits for each cash-in-
transit activity based on a risk assessment and industry operational needs. (Safe Work Australia,
2013).The table below represents the findings on whether the respondents had ever lost cash in
transit
Table 4. 5: Whether they had ever lost cash in transit
Frequency Percentage
Yes 65 85.53
No 11 14.47
Total 76 100

35
4.4.1 Extent that they had lost cash in transit
The respondents were asked the extent to which they had lost cash in transit. From the findings,
the respondents had lost cash in transit through theft by external parties to a great extent as
shown by a mean of 4.172. In addition, the respondents had lost cash in transit through theft by
employees to a great extent as shown by a mean of 3.759. In any serious quantity, most
legitimate businesses prefer some other party, such as a bank, to handle cash on their behalf.
(Chakravorti and Mazzota, 2013).
Table 4. 6: Extent that they had lost cash in transit
Mean Stdev
Theft by employees 3.759 0.482
Theft by external parties 4.172 0.194

36
4.5 Influence of Convenience in Operations on Use of M-Pesa Cashless Payments Product
The respondents were asked if the use of Mpesa cashless had reduced the number of trips to the
distribution route. According to the findings,97.37% of the respondents indicated that Mpesa
cashless had reduced the number of trips to the distribution route while 2.63% of the respondents
indicated that Mpesa cashless had not reduced the number of trips to the distribution route. This
service has come in handy especially to those who are largely engaged in their places of work
thus finding it difficult to walk to these franchises to these foods themselves. They save on time
hence the can do more at their work places by using time saved on constructive activities
(Porteous and Finmark, 2007). The table below represents these findings
Table 4. 7: If use of Mpesa cashless had reduced the number of trips to the distribution
route
Frequency Percentage
Yes 74 97.37
No 2 2.63
Total 76 100
4.5.1 Whether the amount of time spent processing cash in transit and at delivery had
reduced
The study sought to find out whether the amount of time spent processing cash in transit and at
delivery had reduced. From the findings, 93.42% of the respondents indicated that the amount of
time spent processing cash in transit and at delivery had reduced while 6.58% of the respondents
indicated that the amount of time spent processing cash in transit and at delivery had not
reduced.
The perceived safetyof Mpesa and its convenience are major reasons that early adopters of t
he technology chose to use it.
Table 4. 8: Whether the amount of time spent processing cash in transit and at delivery had
reduced
Frequency Percentage
Yes 71 93.42
No 5 6.58
Total 76 100

37

38
4.6 Influence of Book Keeping Volumes in Operations on Use of M-Pesa Cashless Payments
Product
The study sought to find out how Mpesa cashless had affected amount of book keeping required.
According to the findings,88.16% of the respondents indicated that Mpesa cashless had reduced
the amount of book keeping, 5.26% of the respondents indicated that Mpesa cashless had not
changed the amount of book keeping and 3.95% of the respondents indicated that Mpesa
cashless had increased the amount of book keeping. According to UNEP (2011) Going paperless
has many advantages: increased efficiency, paper and printing cost savings, time savings, storage
cost savings, environmental benefits, efficient file retrieval, and enhanced customer service. The
table below shows how Mpesa cashless had affected amount of Book keeping
Table 4. 9: How Mpesa cashless had affected amount of Book keeping
Frequency Percentage
Reduced 67 88.16
Increased 3 3.95
Not changed 4 5.26
Total 76 100
Table 4. 10: How Mpesa cashless use had affected the amount of printing papers purchased
The study sought to find out how Mpesa cashless use had affected the amount of printing papers
purchased. From the findings, 92.11% of the respondents indicated that Mpesa cashless use had
reduced the amount of printing papers purchased while 7.89% of the respondents indicated that
Mpesa cashless use had not changed the amount of printing papers purchased. In Africa
Senegal‘s experience in paperless trade implementation started in the mid-1980s when
government authority (Ministry of Finance) made the decision to computerize official processes,
in general, and trade procedures, in particular (Bradwel, 2005). The table 4.9 presents the
findings on how Mpesa cashless use had affected the amount of printing papers purchased
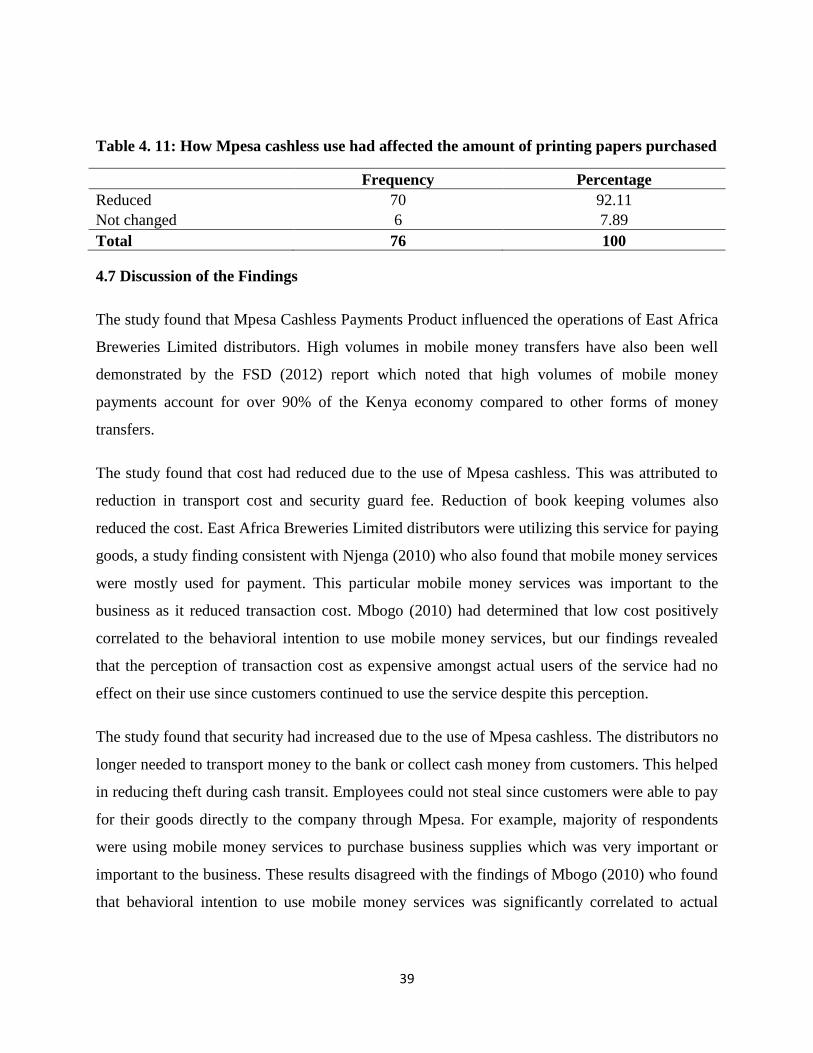
39
Table 4. 11: How Mpesa cashless use had affected the amount of printing papers purchased
Frequency Percentage
Reduced 70 92.11
Not changed 6 7.89
Total 76 100
4.7 Discussion of the Findings
The study found that Mpesa Cashless Payments Product influenced the operations of East Africa
Breweries Limited distributors. High volumes in mobile money transfers have also been well
demonstrated by the FSD (2012) report which noted that high volumes of mobile money
payments account for over 90% of the Kenya economy compared to other forms of money
transfers.
The study found that cost had reduced due to the use of Mpesa cashless. This was attributed to
reduction in transport cost and security guard fee. Reduction of book keeping volumes also
reduced the cost. East Africa Breweries Limited distributors were utilizing this service for paying
goods, a study finding consistent with Njenga (2010) who also found that mobile money services
were mostly used for payment. This particular mobile money services was important to the
business as it reduced transaction cost. Mbogo (2010) had determined that low cost positively
correlated to the behavioral intention to use mobile money services, but our findings revealed
that the perception of transaction cost as expensive amongst actual users of the service had no
effect on their use since customers continued to use the service despite this perception.
The study found that security had increased due to the use of Mpesa cashless. The distributors no
longer needed to transport money to the bank or collect cash money from customers. This helped
in reducing theft during cash transit. Employees could not steal since customers were able to pay
for their goods directly to the company through Mpesa. For example, majority of respondents
were using mobile money services to purchase business supplies which was very important or
important to the business. These results disagreed with the findings of Mbogo (2010) who found
that behavioral intention to use mobile money services was significantly correlated to actual

40
usage. However, it is important to note that this study setting was different from that of Mbogo
(2010).
The study found that convenience had increased due to the use of Mpesa cashless. The
distributor did not need to make many trips to their customers so as to pick the money. The
money could be easily sent on Mpesa to the company. Dushinski (2010) points out that mobile
technology not only lets marketers reach customers where they are, it allows them to engage
mobile users by targeting their immediate their immediate and specific needs.
The study found that Book Keeping Volumes had reduced due to the use of Mpesa cashless. The
distributors no longer need to issue hardcopy receipts as indication of payment since the Mpesa
message acted as indication of payment. This reduced book keeping volumes thus reducing cost.
This was in line with Bradwel (2005) who stated that in Africa Senegal‘s experience in paperless
trade implementation started in the mid-1980s when government authority (Ministry of Finance)
made the decision to computerize official processes, in general, and trade procedures, in
particular. Implementation really took shape in the 1990s, with the reform initiated by customs to
improve clearance formalities. These efforts later culminated into the establishment of the
customs automated system.
4.9 Summary of the Chapter
Chapter Four delves into the analysis of the captured data; presentation of the analyzed data is in
frequency distribution tables. The analyzed data is then interpreted to bring out the research
findings .A discussion of the same then follows comparing the findings with empirical studies
done on the subject. The study concludes with a discussion of the findings.

41
CHAPTER FIVE
SUMMARY OF THE FINDINGS, CONCLUSIONS AND RECOMMENDATIONS
5.1 Introduction
The chapter provides the summary of the findings from chapter four, and it also gives the
conclusions and recommendations of the study based on the objectives of the study. The
objectives of this study were to investigate the influence of Mpesa Cashless Payments Product on
the operations of East Africa Breweries Limited distributors.
5.2 Summary of the Findings
The study aimed at investigating how cost, security, convenience and Book Keeping Volumes
have influenced the use of M-Pesa cashless payments product in the operations of East Africa
Breweries Limited distributors.
The study found that 94.74% of the respondents indicated that there were costs that the business
had reduced or increased due to the use of Mpesa cashless. Security guard fees and transport had
been reduced due to the use of Mpesa to a very great extent as shown by a mean of 4.831 and
4.682 respectively. Mbogo (2010) had determined that low cost positively correlated to the
behavioral intention to use mobile money services, but our findings revealed that the perception
of transaction cost as cheap amongst actual users of the service had big effect on their use thus
they chose to use the service.
In addition, 85.53% of the respondents indicated that they had ever lost cash in transit. The
respondents had lost cash in transit through theft by external parties to a great extent as shown by
a mean of 4.172. Security providers should try to reduce cash build-ups. This may be achieved
by putting in place cash limits for each cash-in-transit activity based on a risk assessment and
industry operational needs. (Safe Work Australia, 2013)
Moreover, 97.37% of the respondents indicated that Mpesa cashless had reduced the number of
trips to the distribution route. Also93.42% of the respondents indicated that the amount of time
spent processing cash in transit and at delivery had reduced. Most respondents were confident
using Mpesa cashless. Communication and quality of service was reliable.

42
The perceived safety of Mpesa and its convenience are major reasons that
early adopters of the technology chose to use it.
The study found that 88.16% of the respondents indicated that Mpesa cashless had reduced the
amount of book keeping. In addition, 92.11% of the respondents indicated that Mpesa cashless
use had reduced the amount of printing papers purchased. In Africa Senegal‘s experience in
paperless trade implementation started in the mid-1980s when government authority (Ministry of
Finance) made the decision to computerize official processes, in general, and trade procedures, in
particular (Bradwel, 2005).
5.3 Conclusion
The study concludes that cost had reduced due to the use of Mpesa cashless. Security guard fees,
human resources/head count, banking fees and transport had been reduced due to the use of
Mpesa to a very great extent. Since merchants rarely provide discounts or surcharges for using
cash at the point of sale, the costs of cash manifest elsewhere in the lifecycle of cash. This could
mean, among other things, costs that accrue as a result of the time or money spent in making
trips to a bank, ATM, or fees to cash checks. (Chakravorti and Mazzota, 2013).
The study concludes that security had increased due to the use of Mpesa cashless. Loss of cash
in transit through theft by external parties and by employees had reduced. In any serious
quantity, most legitimate businesses prefer some other party, such as a bank, to handle cash on
their behalf. (Chakravorti and Mazzota, 2013).
The study concludes that convenience had increased due to the use of Mpesa cashless. The
amount of time spent processing cash in transit and at delivery had reduced. Communication and
quality of service was rated as reliable. This service has come in handy especially to those who
are largely engaged in their places of work thus finding it difficult to walk to these franchises to
these foods themselves. They save on time hence the can do more at their work places by using
time saved on constructive activities (Porteous and Finmark, 2007).
The study concludes that Book Keeping Volumes had reduced due to the use of Mpesa cashless.
Mpesa cashless use had reduced the amount of printing papers purchased. According to UNEP
(2011) going paperless has many advantages: increased efficiency, paper and printing cost
43
savings, time savings, storage cost savings, environmental benefits, efficient file retrieval, and
enhanced customer service.
5.4 Recommendations
i. The study recommends East Africa Breweries Limited distributors to encourage their
customers to pay through Mpesa.
ii. This finding needs further investigation to determine how this applies against price
elasticity of demand. It will also be important to evaluate if other distributors would note
similar findings as East Africa Breweries Limited distributors. Equally, considering that
M-Pesa was by far the biggest provider of service in this region, it will be useful to
evaluate how they have managed to achieve high uptake despite other cheaper providers
like Airtel Money.
iii. EABL need to sensitize their customers to encourage customers to pay bills through
Mpesa other than cash.
iv. Mobile money transactional cost especially M-Pesa may require further evaluation since
even when the perception amongst users was that the service was expensive, they were
still more likely to use it and think of the service as important to the business.
v. The government should sensitize and encourage people on use of plastic and cashless
money. This will help to reduce theft of cash in transit.
vi. Safaricom need to reduce the Mpesa transaction costs to encourage everyone to use
Mpesa to pay for their goods and services.
vii. The government needs to put in place measures to fight online fraud.
viii. Kenya is used as a model of an economy rapidly moving towards cashless transactions.
The amount transacted in 2012/2013 fiscal year was close to the country national budget
(Okutoyi, 2013). With Safaricom creating partnerships with 25 banks in Kenya to provide
these services, mobile money will become a progressively more convenient method of
financial transaction for SMEs. Educating SMEs on such benefits will lead to increasing
use of the service thereby reaping the benefits previously not accessible to them.

44
5.5 Area for Further Research
The study recommends further study on the causes of the inconvenience associated with mobile
money and reasons why mobile-bank services (accessing bank account via mobile phone) are not
popular among businesses.
An experimental study ought to be done to evaluate the contribution of mobile money services to
business convenience and financial management with one group using the mobile money and the
other not using the service.
Further follow-up studies on the same topic could identify changes over time especially with the
expectation that mobile money services may become the primary platform for cashless
transactions especially with services like ‗Lipa-na-M-Pesa‘ rapidly gaining popularity. This
study can be replicated in the same setting at a different time, or to other distributors in Kenya.
A study to explore factors that have made M-Pesa achieve high uptake despite other cheaper
providers like Airtel money and other competitors like the banking sector and wire transfer
services like Western Union will shed more light into the competitiveness of M-Pesa.

45
REFERENCES
Adewale, A and Alawire A. (2012) Evaluating the Systemic Transition to a Cashless Economy in
.Nigeria. AfeBabalola University, Ado-Ekiti.
Aker J. C and Mbiti M, (2010) Mobile Phones and Economic Development in Africa.
Anurag, S, Tiyagi, R, Raddi S (2009) ―Mobile Payment 2.0:The next generation model‖, in
HSBC‘s Guide to cash , supply chain and treasury management in Asia Pacific. Ed .178-
183.
Bagozzi R. (2007) ―the legacy of the technology acceptance model and a proposal for paradigm
shift‖ Journal of the association for information systems V8 (4): 244-247.
Beck, T. (2009) Finance Access: Trends, Analysis and Policy Conclusions‖.Tilburg University
and CEPR.
Camner G. and Sjöblom E., (2009) Can the Success of M-Pesa be repeated: A Review of
Implementations in Kenya and Tanzania.
Comninos, and Stork C. (2008) M-banking the Unbanked. International Information
Management Corporation
Donner, J.andTellezb, C. A (2008) Mobile banking and economic development: Linking
adoption, impact, and use, Journal of Communication 18, no. 4.
Donner, J. and Escobari, M. (2009) A review of the research on mobile use by micro and small
enterprises (MSEs), in Proceedings of the 3rd international conference on Information
and communication technologies and development.
Dushinski (2010) Micro-Payment Systems and Their Application to Mobile Networks.
Washington, DC: infoDev / World Bank.
Heyer A. and Mas I. (2009) Seeking Fertile Grounds for Mobile Money; Communications
Commission of Kenya (CCK) Sector Statistics Report.
Hughes, N. and Lonie, S. (2007) M-PESA: Mobile Money for the" Unbanked" Turning Cell
phones into 24-Hour Tellers in Kenya, Innovations: Technology, Governance,
Globalization 2.
Jack, W. and Suri, T. Mobile Money: The Economics of M-PESA, NBER Working Paper 16721,
January (2011)
Kimenyi, M. S and Ndung‗u, N. S (2009) Expanding the Financial Services Frontier: Lessons
From Mobile Phone Banking in Kenya,‖Washington, DC: Brookings Institution),
October.
46
Kutzman, J (1993) The death of money: how the electronic economy has destabilized the world's
markets and created financial chaos Simon& Schuster, Limited.
Laurent, C. (2006), ‗‗The African remittance landscape: an overview’’, available at:
www.fluiditsolutions.
Mas I. and Morawczynski O. (2009) Designing Mobile Money Services Lessons from M-PESA,
Innovations: Technology, Governance, and Globalization 4, no. 2.
Mas, I. and Radcliffe D. (2010) Mobile Payments Go Viral: M-PESA in Kenya, Bill & Melinda
Gates Foundation.
McKay, C. and Pickens, M. (2010) ‗‗Branchless banking pricing analysis’
Mbogo, M. (2010). The Impact of Mobile Payments on the Success and Growth of Micro-
Business: The Case of M-Pesa in Kenya, Journal of Language, Technology &
Entrepreneurship in Africa 2.
Medhi, I.Ratan A. and Toyama K, (2009) Mobile-Banking Adoption and Usage by Low-Literate,
Low-Income Users in the Developing World, Internationalization, Design and Global
Development.
Morawczynski O. and Mas, I. (2009) Designing Mobile Money Services: Lessons from M-
PESA, Innovations 4.
Morawczynski, O. (2008) Surviving in the dual system‗: How M-PESA is fostering urban-to-
rural remittances in a Kenyan Slum in Proceedings of the IFIP WG.
Morawczynski, O. and Miscione G. (2008) Examining trust in mobile banking transactions: The
case of M-PESA in Kenya, Social Dimensions of Information and Communication
Technology Policy.
Morawczynski, O. and Pickens, M. (2008) Poor People Using Mobile Financial Services:
Observations on Customer Usage and Impact from M-PESA.
Morawczynski, O.(2009) Exploring the usage and impact of transformational‖ mobile financial
services: the case of M-PESA in Kenya, Journal of Eastern African Studies.
Njenga, A. (2009). Mobile phone banking: Usage experiences in Kenya, unpublished MBA
thesis of Catholic University of Eastern Africa.
Ondiege, P. (2010) Africa development BankAfrica Development brief;
http://www.afdb.org/fileadmin/uploads/afdb/Documents/Publications/John%20brief%201
_John%20brief%201.pdf Volume 1 • Issue 8December 2010.
Pierre Laurent Chatain, Andrew Zerzan, Wameek Noor, NajahDannaoui, Louis de Koker (2011)
Protecting Mobile Money against Financial Crimes: Global Policy Challenges.. A world
bank paper.

47
Polit, D.F., &Hungler, B.P. (1997) Essentials of nursing research: Methods, appraisal, and
utilization. (4th ed.) Philadelphia: Lippincott.
Porteous D.andFinmark (2007) Just how transformational is m-banking, Study of Kenya mobile
banking.
Porteous, D.(2006) The enabling environment for mobile banking in Africa, Bankable Frontiers
Associates.
Ruthven, O. (2011) Money mosaics: Financial choice and strategy in a West Delhi squatter
settlement. Journal of International Development.
Scott, N.Batchelor, S.Ridley J., and B. Jorgensen, (2004) The impact of mobile phones in Africa,
Commission for Africa, London.
The Journal of Language, Technology & Entrepreneurship in Africa, Vol. 2. No.1. 2010, ISSN
1998-1279.
Vaughan, P. (2007) Early lessons from the deployment of M-PESA, Vodafone‗s own mobile
transactions service, The transformational potential of m-transactions 6.
World Bank ; Kenya Economic Update, Kenya at the Tipping Point With a Special Focus on the
ICT Revolution and Mobile Money, World Bank (December 2010)
https://crm.safaricom.co.ke:8080/ecommunications_enu/start.swe?SWECmd=Start&SWEHo=cr
m.safaricom.co.ke 2013
http://proactivecapital.com/applied-dna-apdn-chart-loomis-case-study 2014
http://safintranet/ 20th
Oct, 2013
http://www.books.google.co.ke/books?id=jvi9BwJr6TkC&printsec=frontcover&dq=history+mo
bile+phone+money+transfer.edu&hl=en&sa=X&ei=1YhJUfOtI4mohAezh4CgDQ&ved=
0CEUQ6AEwAw#v=onepage&q=history%20mobile%20phone%20money%20transfer.e
du&f=false 20th
Oct 2013
http://www.slideshare.net/mpayconnect/mobile-financial-services-for-the-next-billion-20th
Oct
2013 customers-mobile-payments-series?from_search=2
http://newsfeed.time.com/2013/03/25/more-people-have-cell-phones-than-toilets-u-n-study-
shows/
http://www.thinkm-pesa.com/2013/04/m-pesa-sets-world-first-with-cashless.html
http://www.businessdailyafrica.com/Corporate-News/Africa-eyes-M-Pesa-model-as-mobile-
phone-use-goes-up/-/539550/1659986/-/iagf2tz/-/index.html
http://www.capgemini.com/sites/default/files/resource/pdf/The_8th_Annual_World_Payments_R
eport_2012.pdf

48
http://www.safaricom.co.ke/business/solutions-by-business-size/large-corporate/m-pesa 2013
Safe Work AutraliaCode of conduct ; Managing Cash in Transit Security Risks;
http://www.safeworkaustralia.gov.au/sites/SWA/about/Publications/Documents/777/COP
-Cash-in-transit.pdf 2013

49

50
APPENDICES
Appendix 1: Questionnaire
All information given in this questionnaire will be treated with confidentiality
Section A: Background information
1. Which distributor agency do you work for? ………………………………………..
2. What is your occupation? …………………………………………………………
Section B: Costs
3. a) Are there any costs that your business has reduced or increased due to the use of
Mpesa cashless?
YES
NO
b) To what extent has the following costs been reduced due to the use of Mpesa. Where 1 is very
low extent and 5 id very great extent
1 2 3 4 5
Transport
Banking Fees
Security Guard Fees
Human Resources/Head count
Transport
Section C: Security
4. a) Have you ever lost cash in transit?
YES
NO
b) To what extent have you lost cash in transit through the following? Where 1 is very low extent
and 5 id very great extent
1 2 3 4 5
Theft by employees
Theft by external parties

51
Section D: Convenience
5. a) Has the use of Mpesa cashless reduced the number of trips to the distribution route?
YES
NO
If yes, please explain
………………………………………………………………………………………………………
……………………
………………………………………………………………………………………………………
……………………………………………………….
………………………………………………………………………………………………………
………………………………………………………….
………………………………………………………………………………………………………
………………………………………………………….
b) Has the amount of time spent processing cash in transit and at delivery changed?
YES
NO
If Yes, please explain
………………………………………………………………………………………………………
……………………………………………………
………………………………………………………………………………………………………
……………………………………………………..
………………………………………………………………………………………………………
…………………………………………………….
………………………………………………………………………………………………………
……………………………………………………..
………………………………………………………………………………………………………
…………………………………………………….
52
Section E: Book Keeping
6. a) How has Mpesa cashless affected amount of paperwork you do? eg Manual Receipts
and book keeping ?
Reduced
Increased
Not changed
if Other
explain………………………………………………………………………………………………
………………………………………………….
………………………………………………………………………………………………………
……………………………………………………..
………………………………………………………………………………………………………
…………………………………………………….
………………………………………………………………………………………………………
…………………………………………………….
b) How has Mpesa cashless use affected the amount of printing papers purchased?
reduced
increased
not changed
if Other
explain………………………………………………………………………………………………
………………………………………………….
………………………………………………………………………………………………………
……………………………………………………..
………………………………………………………………………………………………………
…………………………………………………….
………………………………………………………………………………………………………
…………………………………………………….
THANK YOU FOR PARTCIPATING

53
Appendix 2: TIME FRAME
This project took five months. The break downs is as below
PERIOD ITEM
January – March 2014 Proposal preparation
April – June 2014 Data collection, analysis and presentation
July 2014 Summary findings, conclusions and recommendations