Embed Size (px)
Citation preview
Journal of Physics Conference Series
OPEN ACCESS
Influence of molecular structure on plasmacarbonization of organic semiconductor moleculesTo cite this article Toshihiro Shimada et al 2013 J Phys Conf Ser 441 012041
View the article online for updates and enhancements
You may also likeA media information analysis forimplementing effective countermeasureagainst harmful rumorMitsuyoshi Nagao Kazuhiro Suto andAzuma Ohuchi
-
Effect of Reduction Temperature of Fe-Co-NiC Catalyst on the Solid Alkaline FuelCell PerformanceAyaka Nakamura Hiroki TakahashiTatsuya Takeguchi et al
-
Synthesis of metal hydride alloys usingautonomous metal hydride actuator forseawater exchange in Hakodate portK Minato M Miyatake S Honmura et al
-
This content was downloaded from IP address 219772472 on 30112021 at 2324
Influence of molecular structure on plasma carbonization of
organic semiconductor molecules
Toshihiro Shimada12
Naoki Muraya3 Jun Tomita
3 Takashi Yanase
4
Taro Nagahama1
1 Division of Materials Chemistry Faculty of Engineering Hokkaido University
Kita-ku Sapporo Hokkaido 060-8628 Japan 2 CREST-JST Gobancho Chiyoda-ku Tokyo 100-0013 Japan
3 Graduate School of Chemical Science and Engineering Hokkaido University Kita-ku
Sapporo
Hokkaido 060-8628 Japan 4 Frontier Chemistry Center Faculty of Engineering Hokkaido University Kita-ku Sapporo
Hokkaido 060-8628 Japan
Abstract
The plasma treatment of organic semiconductor molecules includes issues related with nanoscale
plasma interfaces The process was examined by optical emission spectroscopy It was found that
molecules are sublimed by the heat and decomposed by the interaction with the plasma The product
carbon solids were examined by Raman spectroscopy The raman spectra are strongly dependent on
the molecular structures The carbon solids which does not show graphitic Raman spectra have
nanostructures originating from initial molecules
1 Introduction
Carbon materials with controlled nanostructure are gathering much attention recently for the
application in electrode materials for rechargeable batteries[1] carbon-based catalysis[2] and new
semiconductors such as carbon nanotubes (CNTs)[3] and graphene[4] However the strategy for
finely control the nanostructure is rather limited so far for example calcination of polymers with
various functional moieties[5] diameter control of the CNTs by controlling the size of the catalysts[6]
and doping of other elements during the growth[7] In order to explore the possibility of producing
nanostructured carbon from organic molecules we have studied the high temperature treatment of the
molecules by vacuum deposition at 1800 oC[8] However the amount of the product was too small to
allow detailed systematic examination We here report the study on the possibility of synthesizing
carbon materials with well-defined nanostructures by treating organic semiconductor molecules with
plasma Recent advances in the organic electronics various molecules with wide p-electron systems
have been synthesized By exposing these molecules to plasma radicals and ions of these molecules
will be formed and they will polymerize to make a solid It is expected that the product may contain
the structure of the initial organic semiconductor molecules In this paper we examined the effect of
microwave plasma by optical emission spectroscopy of the plasma and Raman spectroscopy of the
product solids
11th APCPST and 25th SPSM IOP PublishingJournal of Physics Conference Series 441 (2013) 012041 doi1010881742-65964411012041
Content from this work may be used under the terms of the Creative Commons Attribution 30 licence Any further distributionof this work must maintain attribution to the author(s) and the title of the work journal citation and DOI
Published under licence by IOP Publishing Ltd 1
2 Experiment
The organic semiconductor molecules used as the raw materials in this study are shown in Fig 1
They are solid powders at room temperature and used as purchased 1~2 mg of the powder was
sealed in a quartz tube (4mm OD 25mm ID 4 cm length) and the gas inside the tube was replaced
with 999 N2 It was pumped by a rotary pump to the pressure of 100 Pa and then sealed by fusing
an oxygen burner It was observed that the molecules are sublimed in the tube when the tube was
heated to 100 ~ 300 oC (the temperatures are dependent on the molecules) The tube was set to a
surfatron reactor shown in Fig 2 Microwave (~ 500 W) from magnetron was irradiated and the
Fig 1 Structure of the molecules used as source materials
Fig 2 Schematic drawing of the surfatron reactor
plasma was excited The colour of the plasma changed as the time elapsed and the plasma ceased
eventually The optical emission spectra were monitored by a fibre optic spectrometer (Ocean Optics
11th APCPST and 25th SPSM IOP PublishingJournal of Physics Conference Series 441 (2013) 012041 doi1010881742-65964411012041
2
USB-2000) which was calibrated by emission wavelengths of neon After the plasma treatment the
inside of the tube turned brown or black colour The obtained solids were examined by Raman
spectroscopy using Renishaw Invia spectrometer using 532 nm or 780 nm laser excitation The laser
wavelength was chosen to achieve high resolution spectra while avoiding fluorescence
3 Results and discussion
The typical time evolution of optical emission spectra during the plasma treatment is shown in Fig 3
The molecule was PTCDA After the plasma ignition emission peaks arising from the N2 gas plasma
Fig 3 Optical emission spectra from PTCDA- containing tube during the plasma treatment
was observed (Fig 3(a)) After several second the quartz tube was heated by microwave and the
plasma and molecules are vaporized Corresponding emission was appears as peaks in visible region
(Fig3(b)) When the molecule contains oxygen as in the case of PTCDA peaks around 700-800 nm
appears It shows the decomposition at the oxygen containing part of the molecule After several
seconds the N-originated peaks diminished and the many small peaks were observed in the visible
region(Fig3(c)) Finally a broad peak appeared from infrared region and shifted toward the visible
region(Fig3(d)) At this moment the quartz tube glowed and sometimes it deformed We consider
that the broad peak was the blackbody radiation from the quartz tube and the sample It is supposed
that the temperature was elevated to the glass transition temperature of the quartz glass (~1000 oC)
We found that the molecules are categorized into three groups The firs group is easily graphatized
molecules Figure 4 shows the Raman spectra of the product obtained from DAF and PTCDA D peak
(~1350 cm-1
) and G peak (~1580cm-1
) are observed clearly and no other peaks are noticeable It is the
signature of the formation of graphite-like carbon The broadness of the D and G peaks and their ratio
indicates that the size of the graphite is very small probably not far beyond the size of the molecules
[9] It is noticed that PTCDA shows shaper peaks then DAF which is in accordance with the fact that
PTCDA easily produces graphemes by CVD [10] The broad background peak observed in the Raman
spectra of these materials probably correspond to various ill-defined structures having various
vibration frequencies It is difficult to analyze the structure because fluorescence is also present even
with infrared (780nm) excitation
11th APCPST and 25th SPSM IOP PublishingJournal of Physics Conference Series 441 (2013) 012041 doi1010881742-65964411012041
3
Fig 4 Raman spectra of solids obtained from the plasma treatment of DAF and PTCDA (group 1)
Fig 5 Raman spectra of solids obtained from the plasma treatment of QA DMA and AQ (group 2)
Figure 5 shows the Raman spectra of the second group ie giving strong single D and G peaks
with additional peaks indicated by arrows originating from substitution groups These molecules
have linearly fused benzene rings It is considered that these molecules are decomposed to give
graphite-like carbons but substantial amount are not incorporated in the graphite lattice Although the
origin of the additional peaks are still under investigation preliminary quantum chemical simulation
suggests that vibration of the CH3- group coupled with that of the fused benzene rings corresponds to
the peak around 900 cm-1
The third group is shown in Fig 6 They shows strong additional peaks with D and G peaks
weaker and broader than other groups The initial molecules are derivative of small linear aromatics
It shows that these molecules are not easily graphitized The striking difference is the difference
between NTCDA and PTCDA both having the carboxylicdianhydride structure It is noticed that the
size of the core aromatics is very important
4 Conclusion
We investigated the plasma treatment of organic semiconductor molecules We found that
molecules are sublimed by the heat and decomposed by the interaction with the plasma The product
carbon solids were examined by Raman spectroscopy and whether the graphitic carbon is formed or
not is strongly dependent on the molecular structure The carbon solid which does not show graphitic
Raman spectra have nanostructures probably originating from initial molecules and its functions as an
electrode or catalyst are promising
11th APCPST and 25th SPSM IOP PublishingJournal of Physics Conference Series 441 (2013) 012041 doi1010881742-65964411012041
4
Fig 6 Raman spectra of solids obtained from the plasma treatment of NTCDA AN and NA (group3)
Acknowledgments
The present work has been partly supported by KAKENHI for Scientific Research on Innovative
Areas Frontier Science of Interactions between Plasmas and Nano-Interfaces Raman spectra were
taken with the facility of CRIS Hokkaido University The authors are grateful to the discussion with
Prof T Hasegawa (University of Tokyo) for the valuable discussion under CREST-JST project
References
[1] Liwen Ji Zhan Lin Mataz Alcoutlabi and Xiangwu Zhang 2011 Energy Environ Sci 4 2682
[2] Ozaki J Tanifuji S Kimura N Furuuchi A and Oya A 2006 Carbon 44 1324
[3] Baughman RH Zakhidov AA de Heer WA 2002 Science 297 787
[4] Novoselov KS et al 2004 Science 306 666
[5] Meng Yet al 2006 Chem Mater 18 4447
[6] Terrones M et al 1997 Nature 388 52
[7] Lin YC et al 2010 Appl Phys Lett 96 133110
[8] Noguchi TShimada T Hanzawa A and Hasegawa T 2009 Thin Solid Films 518 778
[9] Concardo LG et al 2006 Appl Phys Lett 88 163106
[10] Yudasaka M et al 1994 ApplPhysLett64 3237
11th APCPST and 25th SPSM IOP PublishingJournal of Physics Conference Series 441 (2013) 012041 doi1010881742-65964411012041
5
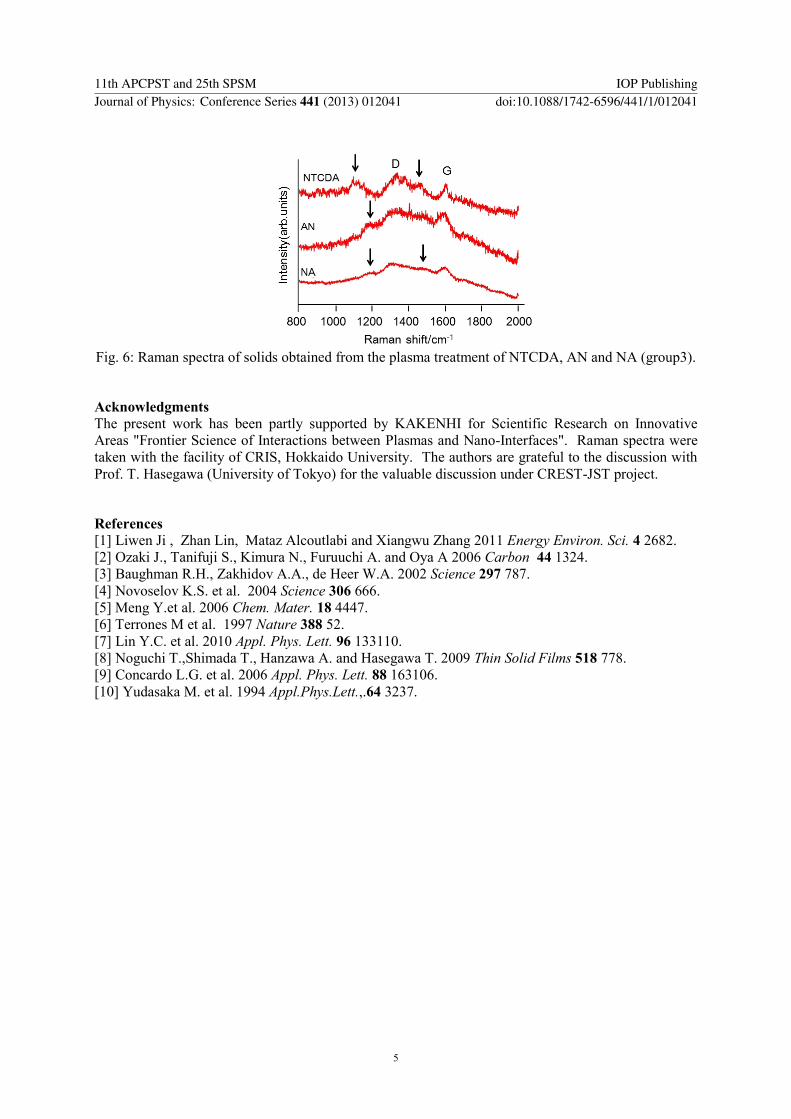