Embed Size (px)
Citation preview
Influence of microstructure in the
martensitic transformation and in the
physical and magnetic properties in
metamagnetic shape memory alloys
Memory presented by:
Javier López García
Supervisors:
Vicente Recarte Callado
José Alberto Rodríguez Velamazán


iii

Acknowledgments
This thesis was carried out with the support of institutions as Institut Laue-Langevin
(ILL), which financed my contract during this three years, and Public University of Navarra as
academic institution, and also a lot of people that I would like to acknowledge in the following
lines.
First of all, I want to thank my thesis directors, José Alberto Rodríguez Velamazán and
Vicente Recarte, for the opportunity they have given to me to work in this project. Above all, I
would like to highlight the great accessibility and dedication they have shown and the trust
placed in me throughout the thesis, showing their great human quality, making working with
them a pleasure. Likewise, I would like to thank Iñaki Pérez de Landazábal and Vicente Sánchez
Alarcos that, as part of the research group, have shown great availability by providing a critical
view of the project, the experiments and the publications.
On the other hand, to thank Iraultza Unzueta, Jose Ángel García and Ferrnando Plazaola
of the University of the Basque Country (UPV / EHU), a group that has worked hand in hand
with me in the synthesis and treatment of samples and in the characterization using Mössbauer
spectroscopy.
In addition to thanking the ILL for the phD contract, I cannot forget all my fellow
students that I have met in Grenoble, especially my colleagues Stass, Joao, Gaynor, Quentin
(little fights for the leg gap) with which the disconnected chats in the office made it a very
friendly place to work. Special mention deserves Lidia Mazzuca, who helped me to integrate
both in the group of students and in the life in Grenoble and with whom we became united by
a great friendship at the end of these three years. The "Spanish community" was growing with
the arrival of Palmerina, Javier Murias, Ángel and María Pedrosa with whom the talks at the
time of rest helped to change the chip and even to de-stress from the long days of work; I think
we have not left any topic that we have not talked about in our bench. Finally, the life in
Grenoble would not have been the same if I had not met a great scientist like my Polish friend
Rafał Wawrzyńczak (after three years I still do not know how to pronounce your family name)
with whom, in addition to discussing the problems that arose during the thesis, the hours spent
in the D'enfer on Fridays combining beer and pool evaded us from the problems of the week
and allowed beginning the weekend with joy.
Outside the scientific field, although I met him at the ILL, I wanted to thank Willy, my
fatigue partner on the bike, for the great moments (and especially the bad times) that we have
spent touring the mountains of Grenoble preparing for the Marmotte. Beatings shared with other
great cyclists like Pablo and Thomas. Furthermore, I have to acknowledge the football team
“Los Latinos” for welcoming me in this great team where I had the opportunity to improve my
poor French and win the local league. In this team I had the opportunity to meet another good
ii
friend, Jesús Pavón, with whom I spent really good times playing indoor football and knowing
more about Grenoble and their places, growing in this way a good friendship and what we can
call the iberic-italian group also formed by Cinzia De Cesare and Marta Crisanti.
On the other hand, I remember many people in Pamplona that I can not forget to
acknowledge them. Starting for the people that I shared office with, as Adrián and Isaac among
others. Specially, I have to present my acknowledgement to Jesús Beato who made my stay in
Pamplona much easier by introducing me in such an amazing group of people “Tercio Stalker”
where I had the opportunity to meet good people and know more about the night of Pamplona,
renaming some of its streets.
Cambiamos de idioma para agradecer a esas otras personas que posiblemente no
dominen el inglés. Empezar este agradecimiento a toda la cuadrilla de Cruces/Zorroza, amigos
con los que he crecido y compartido toda mi vida y que me han mostrado su apoyo durante toda
la tesis, aunque no acabo de estar seguro si alguno ha llegado a entender lo que hago.
También agradecer los ánimos recibidos por otro gran grupo de amigos desde hace
mucho tiempo en Pedrosa de Río Úrbel, gente con la que he crecido desde bien pequeño y que
siempre han estado al pie del cañón animando y aguantándome a partes iguales. Por otro lado,
también pertenecientes a este pequeño pueblo de la provincia de Burgos, agradecer a Rodrigo
y Blanca todo el interés y el apoyo mostrado durante estos tres años y esa visita medio
inesperada a Grenoble.
Volviendo al norte de la península, mostrar mi agradecimiento a la familia Hérnandez-
Mejía, familia con la que he compartido gran parte de mi vida y algunos que otros malos
momentos pedaleando bien desde Bilbao hasta Burgos o por las interminables subidas de los
Alpes franceses. Agradecer también a sus hijas Sara y Ester destacando sus palabras de aliento
durante la parte final de la tesis.
Por otro lado, no me puedo olvidar de Janire Escolar por los años que hemos pasado
juntos y el apoyo y ayuda ofrecida durante los años de tesis, carrera y máster.
Por último, pero no por ello lo último, sino todo lo contrario, agradecer a toda mi familia
por el apoyo mostrado, desde mi abuela, que aún me sigue preguntando por el colegio, pasando
por mis tíos Juanjo y Tomás y por supuesto mis padres y mi hermano, que no ha habido un día
en el que no me hayan animado a seguir trabajando y peleando para llegar al objetivo final.
iii
Summary
Ferromagnetic shape memory alloys have raised substantial interest from both
fundamental and applied points of view, due to the unique properties they show related to the
occurrence of a first-order structural transformation – the martensitic transformation – between
magnetically ordered phases. In particular, in Ni-Mn-Z (Z=In, Sn, and Sb) Heusler alloys, the
so-called metamagnetic shape memory alloys, the transformation takes place between a
ferromagnetic austenite and a weakly magnetic martensitic phase, in such a way that a large
magnetization drop occurs at the martensitic transformation. This allows the induction of the
martensitic transformation by an applied magnetic field, thus giving rise to multifunctional
properties (namely giant magnetoresistance, magnetic shape memory effect and large inverse
magnetocaloric effect) of great technical interest for practical applications, like sensing or
magnetic refrigeration. The transformation temperatures, the magnetization of the different
structural phases, the entropy change associated to the martensitic transformation and, in
general, all the magnetostructural features giving rise to those functional properties depend on
the composition, the structure and the microstructure of the alloys. The compositional
dependence has been deeply studied in ferromagnetic shape memory alloys, being directly
related to the electronic concentration. Variations in the composition like doping with different
magnetic atoms (cobalt doping, in particular) have shown a strong influence in the magnetism
of these materials. Also, the effect of the atomic order has been thoroughly analyzed in several
previous works and shown to be a parameter of great influence to tune the magnetostructural
properties of this kind of systems, although some metamagnetic shape memory alloys present
an extraordinary high stability of the atomic order. The role of the microstructure, in turn, has
been less investigated, in spite of its potential for tuning the magnetostructural properties of
these systems, in particular as a suitable alternative in cases with highly stable atomic order.
Therefore, in this work we have focused in the study of the influence of the microstructure in
metamagnetic shape memory alloys (Ni-Mn-In and Ni-Mn-Sn systems) together with the effect
of Co-doping, in order to gain insight into these effects and to control and improve the properties
of these materials.
Ni-Mn-In and Ni-Mn-Sn ternary alloys, and the corresponding quaternary (Co-doped)
alloys have been prepared and subsequently subjected to thermo-mechanical treatments (hand
milling, ball milling, and thermal annealing at different temperatures) in order to modify their
microstructure in a controlled way. The alloys have been characterized macroscopically by
calorimetric and magnetic measurements, and studied at the microscopic level mainly through
X-ray and neutron diffraction, which provided us information about the crystal structures, the
atomic order in the alloys, the microstructural parameters as grain size and internal strains and
the magnetic structures. The combination of the results obtained in the microscopic study with
the calorimetric and magnetic macroscopic characterization allowed us to gain a better
understanding of the role of the microstructure and cobalt doping in the magnetostructural
properties of these metamagnetic shape memory alloys and identify routes to obtain improved
functional properties.
iv
Starting with the ternary Ni-Mn-Sn system, we have stablished the correlation between
microstructural parameters and magnetostructural properties in these alloys. We have
characterized the different microstructural states induced by thermo-mechanical treatments and
correlated them with the properties of the alloys (in particular, the magneto-caloric effect).
First, we have used laboratory X-rays diffraction to obtain the microstructural parameters of a
Ni50Mn35Sn15 alloy subjected to different thermal treatments after hand-milling, and we have
related the defects on the sample with the internal strains state induced by the milling and
annealing processes. Then, powder neutron diffraction has been used to determine the crystal
and magnetic structures of the alloys, allowing relating the magnetocaloric effect with the
magnetic coupling. Finally, the magnetic characterization of the set of samples was completed
by Mössbauer spectroscopy, showing also the suitability of this technique for microstructural
characterization.
The cobalt-doped quaternary system, Ni-Co-Mn-Sn-Co has been the next subject of
study. We have determined the magnetostructural properties in milled and in annealed samples
of the in Ni45Co5Mn35Sn15 alloy, showing an improvement of the magnetostructural properties
by Co addition, related with a change in the magnetic coupling of the Mn atoms, and an
unconventional improved magnetocaloric effect in a soft-milled alloy. Therefore, the presence
of a small amount of defects affects in a different way to the ternary and quaternary alloys:
while in the Ni-Mn-Sn system the introduction of defects such as vacancies or antiphase
boundaries reduces the entropy change associated to the martensitic transformation, the effect
is opposite in Ni-Co-Mn-Sn. This unusual result incited further investigation of the effect of
milling, with a systematic study on the microstructure by synchrotron X-rays powder diffraction
in ball-milled samples, showing the evolution of the microstructural parameters and the
magnetostructural properties with the milling time. The increase of the milling time produces
amorphization of the material and induces the martensitic phase, reducing in this way the
amount of austenite with martensitic transformation and decreasing the enthalpy associated to
the transition. Moreover, neutron powder diffraction has shown that the magnetic structure in
austenite remains ferromagnetic upon milling but with a significant decrease of the ordered
magnetic moments.
With the aim of obtaining further understanding of the effect of Cobalt doping the
magnetic coupling, we have selected the Ni-Mn-In system as case study. Ni50Mn34In16 and
Ni45Co5Mn37In13 alloys with two different thermal treatments were macroscopically
characterized by magnetometry and calorimetry measurements and the atomic order and
magnetic structures studied by neutron diffraction. It has been shown the variation in the Curie
and martensitic transformation temperatures due to the different thermal treatments and Co
doping and, more relevantly, the increase produced in the saturation magnetization of the
austenite phase, reaching ca. 60% when Co-doping and thermal treatment by slow cooling are
combined. As shown by neutron diffraction in austenite phase, slow cooling thermal treatments
produce a higher degree of atomic order, together with a reduction of strains and defects, which
cause an increase in the total ordered magnetic moment and a slight enhancement of the
ferromagnetic coupling, while cobalt doping has a stronger effect in increasing the
ferromagnetic coupling, which explains the noticeable effect in the magnetization. The spin
density maps obtained from polarized neutron diffraction have revealed the magnetic
interaction pathways responsible for this coupling scheme.

v
Since in the systematic study of the effect of milling we have observed that long milling times
lead to amorphous states, we have extended our study to the recrystallization processes in Ni-
Co-Mn-Sn and Ni-Co-Mn-In alloys, with the analysis of the evolution of the different phases,
the cell parameters and microstrutural parameters as grain size, micro and macrostrains.

vi
vii
Index
Acknowledgments .................................................................................................................................... i
Summary ................................................................................................................................................. iii
Chapter 1. Introduction ........................................................................................................................ 1
1.1. Martensitic transformation .................................................................................................. 1
1.1.1. Thermoelastic transformation......................................................................................... 2
1.2. Shape memory alloys ............................................................................................................. 4
1.3. Ni-Mn-Z alloys ....................................................................................................................... 6
1.3.1. Structure .......................................................................................................................... 7
1.3.1. Magnetism ..................................................................................................................... 11
1.4. Magnetostructural effect in Ni-Mn-Z alloys ..................................................................... 13
1.4.1. Magnetic-field induced strain (MFIS). Magnetic shape memory effect (MSME) .......... 13
1.4.2. Magnetic-field Induced Martensitic Transformation (MFIMT) ..................................... 14
1.4.3. Magnetocaloric effect ................................................................................................... 16
1.4.4. Giant magnetoresistance. ............................................................................................. 18
1.5. Tunning the multifunctional properties ............................................................................ 19
1.5.1. Composition .................................................................................................................. 19
1.5.2. Atomic order .................................................................................................................. 26
1.5.3. Microstructure ............................................................................................................... 31
1.6. Objectives and thesis structure .......................................................................................... 32
Chapter 2. Experimental techiniques ................................................................................................ 51
2.1. Sample preparation ............................................................................................................. 51
2.1.1. Synthesis ........................................................................................................................ 51
2.1.2. Homogenization and thermal treatments ..................................................................... 52
2.1.3. Mechanical treatments ................................................................................................. 53
2.2. Sample characterization ..................................................................................................... 54
2.2.1. Scanning Electron Microscopy (SEM) and Transmission Electron Microscopy (TEM) .. 54
2.2.2. Thermal characterization. Differential scanning calorimetry (DSC) .............................. 55
2.2.3. Macroscopic magnetic characterization: magnetometry ............................................. 56
2.2.4. Mössbauer spectroscopy ............................................................................................... 58
2.3. Crystal and magnetic structural characterization: x-rays and neutron diffraction ..... 59
viii
2.3.1. Diffraction: powders and single crystals ....................................................................... 59
2.3.2. Rietveld refinement ....................................................................................................... 62
2.3.3. Microstructural analysis ................................................................................................ 63
2.3.4. X-ray diffraction. Laboratory and synchrotron diffractometers ................................... 65
2.3.5. Neutron properties and basic concepts on neutron scattering .................................... 67
2.3.6. Magnetic diffraction ...................................................................................................... 70
2.3.7. Polarized neutron diffraction ........................................................................................ 72
2.3.8. Examples of neutron diffraction instruments: D9 single-crystal diffractometer and D1B
powder diffractometer .................................................................................................................. 74
Chapter 3. Relation between microstructure, atomic order and magneto-structural properties in
Ni-Mn-Sn system ................................................................................................................................. 79
3.1. Introduction ......................................................................................................................... 79
3.2. Experimental results and discussion .................................................................................. 80
3.2.1. Calorimetric measurements .......................................................................................... 80
3.2.2. X-ray diffraction ............................................................................................................. 83
3.2.3. Magnetic measurements ............................................................................................... 86
3.2.4. Neutron diffraction: atomic order and magnetic structures ........................................ 91
3.2.5. Mössbauer spectroscopy ............................................................................................... 99
3.3. Summary and conclusions ................................................................................................ 101
Chapter 4. Enhancement of magnetocaloric effect by intrinsic defects and microstructure
evolution by ball-milling in Ni45Co5Mn35Sn15 shape memory alloy ............................................... 105
4.1. Introduction ....................................................................................................................... 105
4.2. Experimental results ......................................................................................................... 106
4.2.1. Macroscopic characterization ..................................................................................... 107
4.2.2. Neutron diffraction analysis ........................................................................................ 110
4.2.3. Magnetocaloric analysis .............................................................................................. 113
4.2.4. Systematic milling ........................................................................................................ 117
4.3. Summary and conclusions ................................................................................................ 127
Chapter 5. Analysis of the improvement of the magnetic properties in Ni-Mn-In alloys by
thermal treatment and cobalt doping .............................................................................................. 133
5.1. Introduction ....................................................................................................................... 133
5.2. Experimental results ......................................................................................................... 134
5.2.1. Macroscopic magnetic characterization ..................................................................... 134
5.2.2. Microscopic insight: Neutron diffraction .................................................................... 136
ix
5.3. Summary and conclusions ................................................................................................ 141
Chapter 6. Recrystallization process in NiCoMnSn and NiCoMnIn magnetic shape memory
alloys ................................................................................................................................................... 147
6.1. Introduction ....................................................................................................................... 147
6.2. Experimental results ......................................................................................................... 148
6.2.1. Bulk and powder characterization .............................................................................. 148
6.2.2. Recrystallization process ............................................................................................. 152
6.2.3. Microstructural analysis .............................................................................................. 157
6.3. Summary and conclusions ................................................................................................ 162
Chapter 7. Summary and conclusions ............................................................................................. 167
List of papers published by the autor .............................................................................................. 172

1
Chapter 1. Introduction
1.1.MARTENSITIC TRANSFORMATION
Hardening of steels by quenching is one of the most important technological processes in
metallurgy. If the steel is quenched rapidly enough from the austenite state there is no time for
eutectoidal decomposition and the steel undergoes a diffusionless structural transformation. The
first observation of this transformation was carried out by the german metallurgist Adolf
Martens, after who both the transformation and the steel final structure are known as martensitic
transformation (MT) and martensitic phase, respectively. Although the term “martensitic” was
initially used to describe the structural transition in steels, nowadays it is applied to all
diffussionless structural changes in metallic alloys.
Actually, the MT is a solid-solid shear-dominant displacive diffusionless fist order
transition between two different crystallographic structures; a high temperature phase known
as austenite and another crystallographic structure with lower symmetry at lower temperatures
called martensite. Due to its diffussionless nature, atomic bonds are not broken during the MT,
and as consequence the atomic displacements are limited by the interatomic distance, the atomic
order remaining constant in both phases [1–8]. This mechanism, where thermal activation is
not necessary, allows the MT to take place at low temperature. However, for alloys where the
MT occurs at high temperature, the thermal energy can produce diffusive phenomena, thus
altering the stability of the transforming phases and the transformation properties themselves.
As a first order transition, it has associated an enthalpy, a change of volume, a hysteresis of
transformation, the presence of an interface and the possibility of the coexistence of phases in
thermodynamic equilibrium. The MT can be understood as the superposition of two processes;
a homogeneous deformation of the crystal lattice and an invariant shear of the new lattice. The
homogeneous deformation of the lattice, which leads to the change of crystallographic structure,
is produced by a shearing process of certain atomic planes of the austenitic phase. This
deformation implies the appearance of elastic and superficial energies in the surrounding
volume of the transformed zone that impedes the transformation, and can even stop it. To
accommodate the new structure and minimize the emergent energies, a deformation of the new
lattice is produced by an invariant shearing process. This is a process of accommodation,
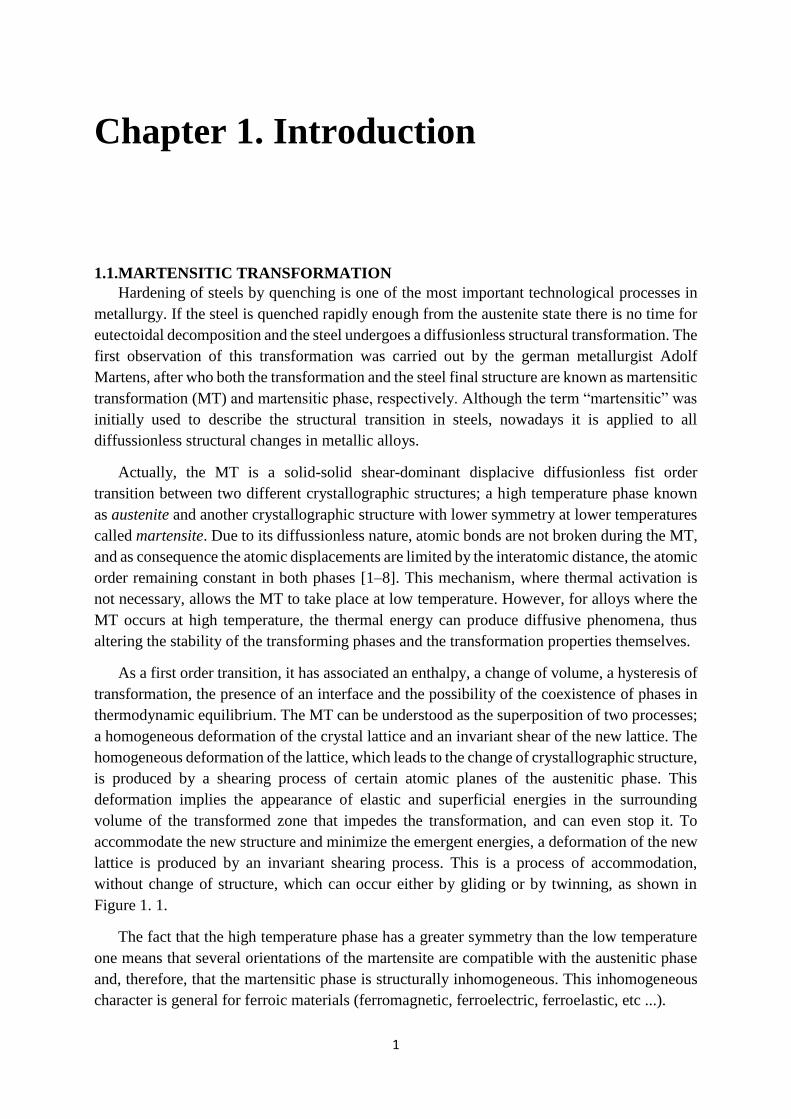
without change of structure, which can occur either by gliding or by twinning, as shown in
Figure 1. 1.
The fact that the high temperature phase has a greater symmetry than the low temperature
one means that several orientations of the martensite are compatible with the austenitic phase
and, therefore, that the martensitic phase is structurally inhomogeneous. This inhomogeneous
character is general for ferroic materials (ferromagnetic, ferroelectric, ferroelastic, etc ...).
Chapter 1
2
As the growth of the martensitic phase implies an increase in the elastic energy associated
with the deformation, during the transformation a self-compensating distribution of domains
(called “martensitic variants”) occurs in order to decrease the overall macroscopic deformation
and, therefore, minimize the energy of the deformation. Thus, each variant is formed with an
orientation that counteracts the accumulated energy in the formation of the previous variant.
Figure 1. 1. Schematic representation of the gliding and twining accommodation processes
during the transformation.
1.1.1. Thermoelastic transformation
Two types of martensitic transformation can be distinguished taking into account the
kinetics of the transformation, the burst-type (non thermoelastic) and the thermoelastic
martensitic transformations. The first ones are characterized by a large volume change that
implies the presence of plastic deformation and a wide thermal hysteresis (hundreds of Kelvins).
This type of transformations are typical on quenched steels and iron alloys. On the other hand,
the thermoelastic martensitic transformations have a small volume change associated, a small
mismatch between the cell parameter of both phases (that favors the absence of plastic
deformation) and consequently low hysteresis (tens of Kelvins), and a complete reversibility.
In this type of transformation, the martensite is formed by nucleation and growth on cooling.
The nucleation and growing of new martensite variants stops when cooling is interrupted, the
processes resuming on further cooling. On heating, the inverse transformation takes place by
means of the backward motion of the austenite-martensite interfaces formed in the direct
transformation, the martensite plates disappearing in the reverse order of their appearance. In
this way, the structure of the austenite is restored in the inverse transformation, recovering the
original orientation. According to this formation kinetics, thermoelastic martensitic
1.1. Martensitic transformation
3
transformations are considered athermic, which implies that the transformation is solely a
function of temperature and, therefore, independent of time [3].
From the macroscopic point of view, it is possible to explain the reversibility of the
transformation considering the atomic order of the crystal structures. The retransformation path,
the last variants to be formed being the first to disappear, ensures maintaining the atomic order
of the austenite phase. So the reversibility associated to the shape memory alloy corresponds to
the retransformation of the martensitic structure that minimizes the energy of the system.
From the thermodynamic point of view, the term "thermoelastic" means that, for any
temperature and applied stress in the temperature range in which the transformation extends, a
state of thermoelastic equilibrium is established, defined by a local balance of the forces acting
on the interfaces that separate the martensitic phase from the austenitic phase. The difference
in the Gibbs free energy between the two phases gives the driving force of the transformation.
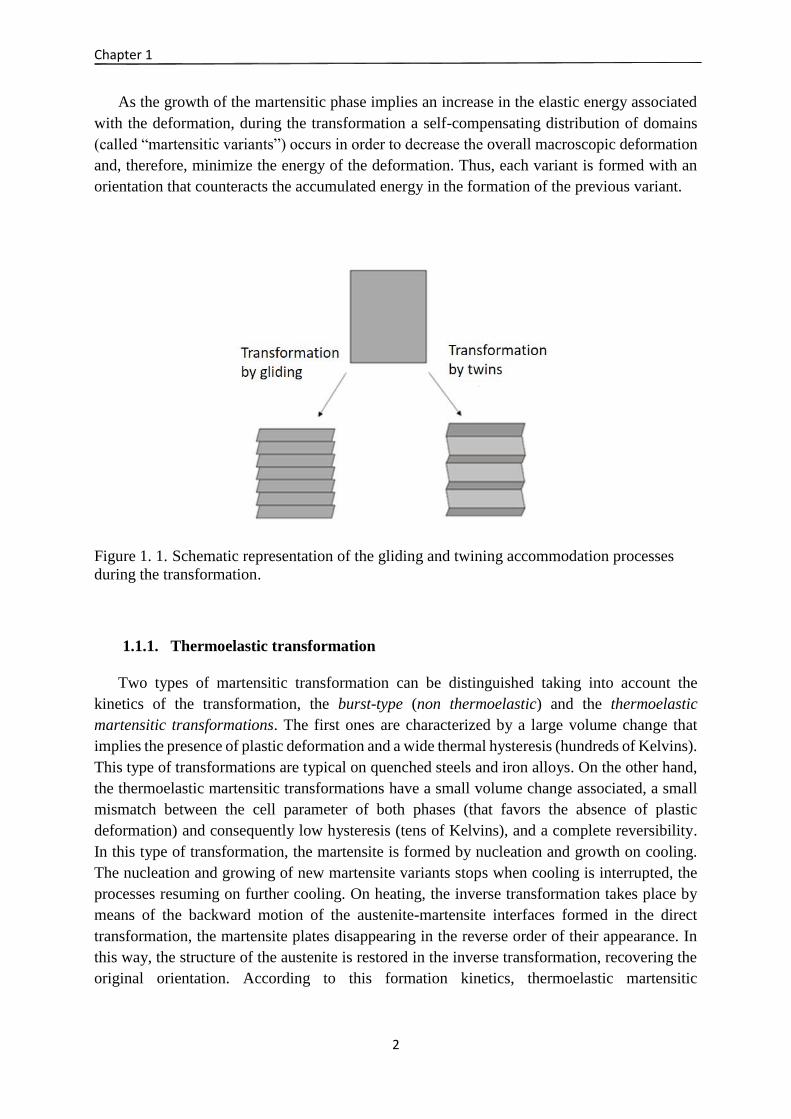
As can be seen in figure 1.2, at a temperature above the equilibrium temperature 𝑇0 the Gibb’s
free energy is lower in austenite than in martensite, so the cubic phase is more stable. On the
other hand, the martensite is more stable below 𝑇0 due to its lower Gibb’s energy. During the
direct transformation (austenite → martensite), there is a balance between the difference in free
energy, which favors the transformation, and the increase in elastic energy that inhibits the
transformation. The contribution of the elastic energy makes it necessary to supercool below
the critical temperature 𝑇0 in which the Gibbs energies of the austenitic and martensitic phases
are equal (Figure 1. 2.). The reverse transformation (martensite → austenite) is favored both
by the elastic energy stored in the direct transformation and by the free energy difference of the
two phases. In addition, the presence of dissipative mechanisms linked to the movement of
austenite-martensite interphases and the accommodation of the domains of martensite supposes
a loss of energy that causes the occurrence of hysteresis [9].
Figure 1. 2. Schematic diagram of the Gibb’s free energy of martensite and austenite in the
martensitic transformation region.
Chapter 1
4
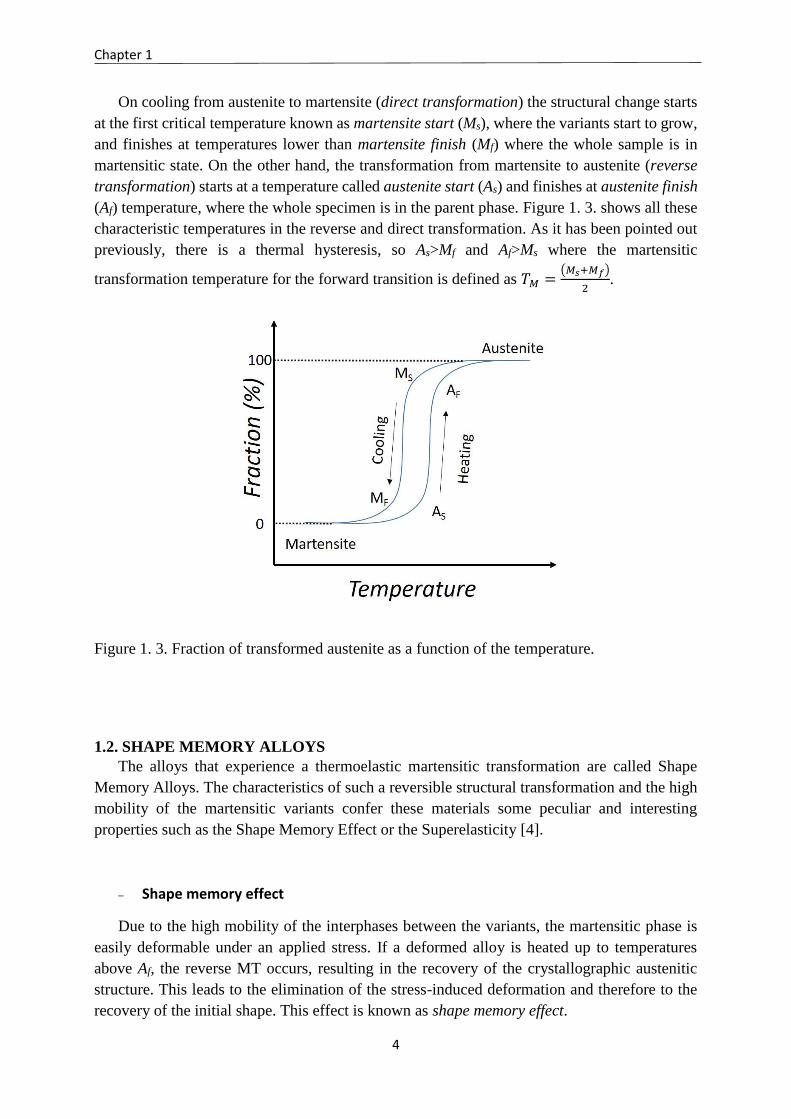
On cooling from austenite to martensite (direct transformation) the structural change starts
at the first critical temperature known as martensite start (Ms), where the variants start to grow,
and finishes at temperatures lower than martensite finish (Mf) where the whole sample is in
martensitic state. On the other hand, the transformation from martensite to austenite (reverse
transformation) starts at a temperature called austenite start (As) and finishes at austenite finish
(Af) temperature, where the whole specimen is in the parent phase. Figure 1. 3. shows all these
characteristic temperatures in the reverse and direct transformation. As it has been pointed out
previously, there is a thermal hysteresis, so As>Mf and Af>Ms where the martensitic
transformation temperature for the forward transition is defined as 𝑇𝑀 =(𝑀𝑠+𝑀𝑓)
2.
Figure 1. 3. Fraction of transformed austenite as a function of the temperature.
1.2. SHAPE MEMORY ALLOYS The alloys that experience a thermoelastic martensitic transformation are called Shape
Memory Alloys. The characteristics of such a reversible structural transformation and the high
mobility of the martensitic variants confer these materials some peculiar and interesting
properties such as the Shape Memory Effect or the Superelasticity [4].
Shape memory effect
Due to the high mobility of the interphases between the variants, the martensitic phase is
easily deformable under an applied stress. If a deformed alloy is heated up to temperatures
above Af, the reverse MT occurs, resulting in the recovery of the crystallographic austenitic
structure. This leads to the elimination of the stress-induced deformation and therefore to the
recovery of the initial shape. This effect is known as shape memory effect.
1.2. Shape memory alloys
5
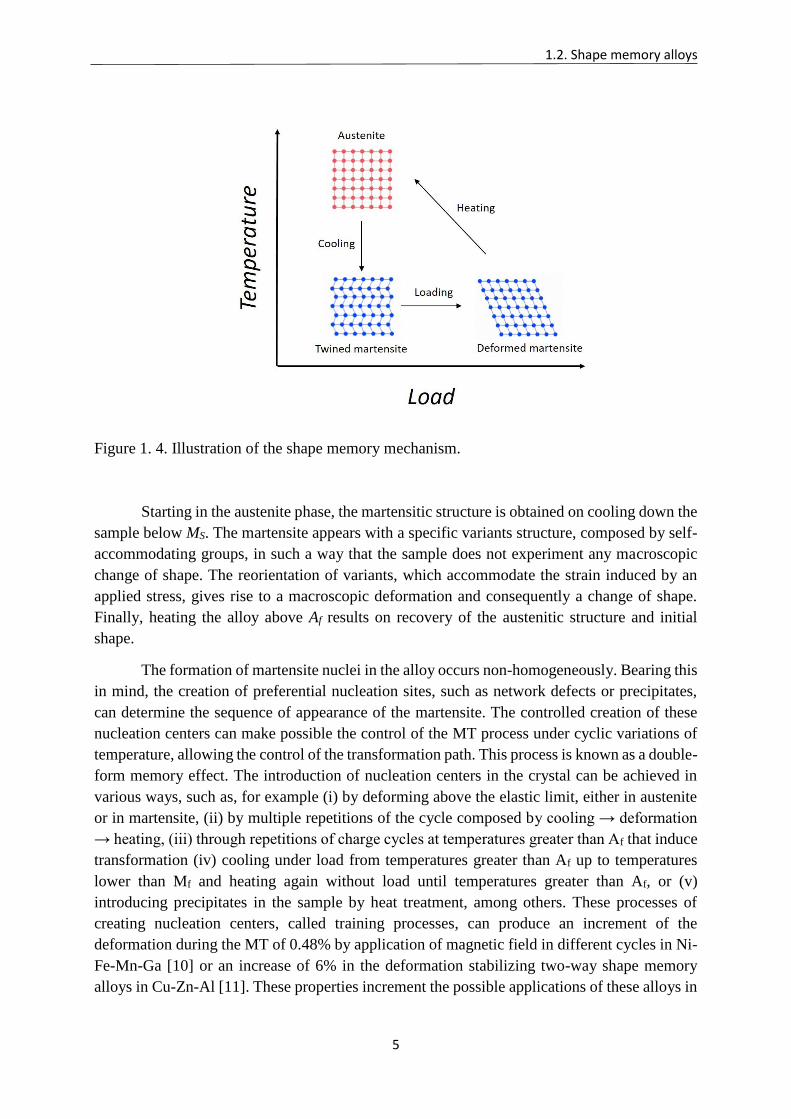
Figure 1. 4. Illustration of the shape memory mechanism.
Starting in the austenite phase, the martensitic structure is obtained on cooling down the
sample below MS. The martensite appears with a specific variants structure, composed by self-
accommodating groups, in such a way that the sample does not experiment any macroscopic
change of shape. The reorientation of variants, which accommodate the strain induced by an
applied stress, gives rise to a macroscopic deformation and consequently a change of shape.
Finally, heating the alloy above Af results on recovery of the austenitic structure and initial
shape.
The formation of martensite nuclei in the alloy occurs non-homogeneously. Bearing this
in mind, the creation of preferential nucleation sites, such as network defects or precipitates,
can determine the sequence of appearance of the martensite. The controlled creation of these
nucleation centers can make possible the control of the MT process under cyclic variations of
temperature, allowing the control of the transformation path. This process is known as a double-
form memory effect. The introduction of nucleation centers in the crystal can be achieved in
various ways, such as, for example (i) by deforming above the elastic limit, either in austenite
or in martensite, (ii) by multiple repetitions of the cycle composed by cooling → deformation
→ heating, (iii) through repetitions of charge cycles at temperatures greater than Af that induce
transformation (iv) cooling under load from temperatures greater than Af up to temperatures
lower than Mf and heating again without load until temperatures greater than Af, or (v)
introducing precipitates in the sample by heat treatment, among others. These processes of
creating nucleation centers, called training processes, can produce an increment of the
deformation during the MT of 0.48% by application of magnetic field in different cycles in Ni-
Fe-Mn-Ga [10] or an increase of 6% in the deformation stabilizing two-way shape memory
alloys in Cu-Zn-Al [11]. These properties increment the possible applications of these alloys in
Chapter 1
6
fields as different as actuators, thermo- and magnetosensors, medicine or civil structures [12–
16].
- Superelastic effect
When a mechanical stress is applied to the alloy at temperatures higher than Af the alloy
may transform to martensite. This is due to the fact that the work carried out by this stress
supposes an additional contribution to the driving force responsible for the transformation,
making it possible to promote the transformation at temperatures higher than the one
corresponding to the transformation induced by temperature. Once the stress is removed, the
sample recovers the deformation without any residual strain, since at that temperature the stable
phase is the austenitic structure instead of the martensite. This superelastic effect can be
described by the Clausius-Clapeyron equation:
𝑑𝜎
𝑑𝑇0=
∆𝑆
𝜀 (1.1)
where 𝜎 is the external strain, ∆𝑆 is the entropy change associated to the MT and 휀 is the
macroscopic deformation associated also to the structural change. In case of single-crystal, the
application of stress at temperatures higher than Af can provide a monovariant martensite in the
alloy producing an strain close to 10% [17]. Furthermore, a tensile strain of 21.3% was found
in Cu-Al-Ni polycrystalline alloy, where the grain growth was controlled by continuous
unidirectional solidification [18].
1.3.Ni-Mn-Z ALLOYS
The alloys that undergo thermoelastic MT between magnetically ordered phases can have
certain special characteristics due to the coupling of their structural and magnetic properties. In
this case, if the magnetic properties of the austenite and the martensite are different, the
structural transformation (the martensitic one) involves a change in the magnetic properties,
giving rise to a magnetostructural first-order transformation, where the elastic and magnetic
subsystems are coupled. Then, magnetic field appears as another stimulus to which the MT is
sensitive.
Among the magnetic shape memory alloys, Ni-Mn-Z (Z = Ga, In, Sn, Sb) are by far the
most studied systems due to the interesting effects they show, as the magnetic-field-induced
strain, the magnetic shape memory effect or the magnetic-field-induced martensitic
transformation. The main characteristics of these materials, subject of study in this thesis, are
described below.
1.3. Ni-Mn-Z alloys
7
1.3.1. Structure
High-temperature phases
Ni-Mn-Z alloys with compositions close to Ni2MnZ are a particular type of Heusler
alloys. Heusler alloys are intermetallic compounds with general composition X2YZ, where X
and Y are 3d elements corresponding to transition metals as Fe, Co, Cu, Ni, etc., and Z can be
an element for IIIA, IVA or VA groups of the periodic table. The typical crystallographic
structure of these materials is a cubic L21 structure (space group 𝐹 𝑚3̅𝑚) with next-nearest-
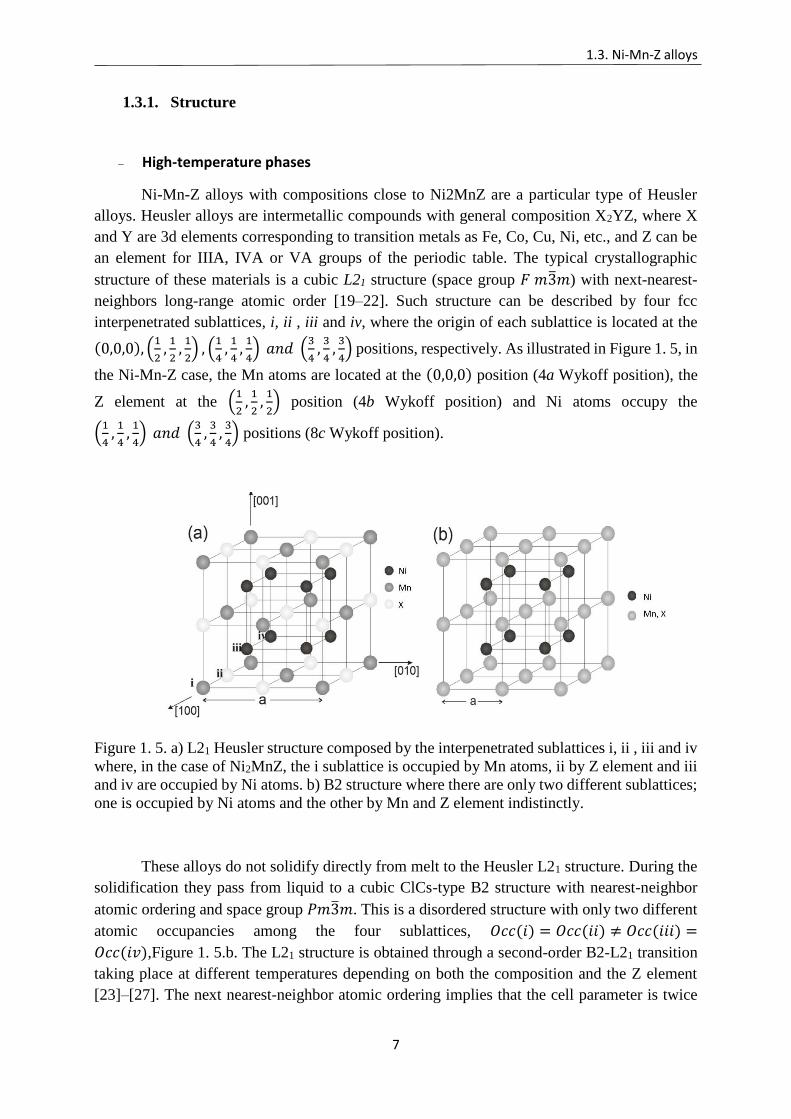
neighbors long-range atomic order [19–22]. Such structure can be described by four fcc
interpenetrated sublattices, i, ii , iii and iv, where the origin of each sublattice is located at the
(0,0,0), (1
2,
1
2,
1
2) , (
1
4,
1
4,
1
4) 𝑎𝑛𝑑 (
3
4,
3
4,
3
4) positions, respectively. As illustrated in Figure 1. 5, in
the Ni-Mn-Z case, the Mn atoms are located at the (0,0,0) position (4a Wykoff position), the
Z element at the (1
2,
1
2,
1
2) position (4b Wykoff position) and Ni atoms occupy the
(1
4,
1
4,
1
4) 𝑎𝑛𝑑 (
3
4,
3
4,
3
4) positions (8c Wykoff position).
Figure 1. 5. a) L21 Heusler structure composed by the interpenetrated sublattices i, ii , iii and iv
where, in the case of Ni2MnZ, the i sublattice is occupied by Mn atoms, ii by Z element and iii
and iv are occupied by Ni atoms. b) B2 structure where there are only two different sublattices;
one is occupied by Ni atoms and the other by Mn and Z element indistinctly.
These alloys do not solidify directly from melt to the Heusler L21 structure. During the
solidification they pass from liquid to a cubic ClCs-type B2 structure with nearest-neighbor
atomic ordering and space group 𝑃𝑚3̅𝑚. This is a disordered structure with only two different
atomic occupancies among the four sublattices, 𝑂𝑐𝑐(𝑖) = 𝑂𝑐𝑐(𝑖𝑖) ≠ 𝑂𝑐𝑐(𝑖𝑖𝑖) =
𝑂𝑐𝑐(𝑖𝑣),Figure 1. 5.b. The L21 structure is obtained through a second-order B2-L21 transition
taking place at different temperatures depending on both the composition and the Z element
[23]–[27]. The next nearest-neighbor atomic ordering implies that the cell parameter is twice
Chapter 1
8
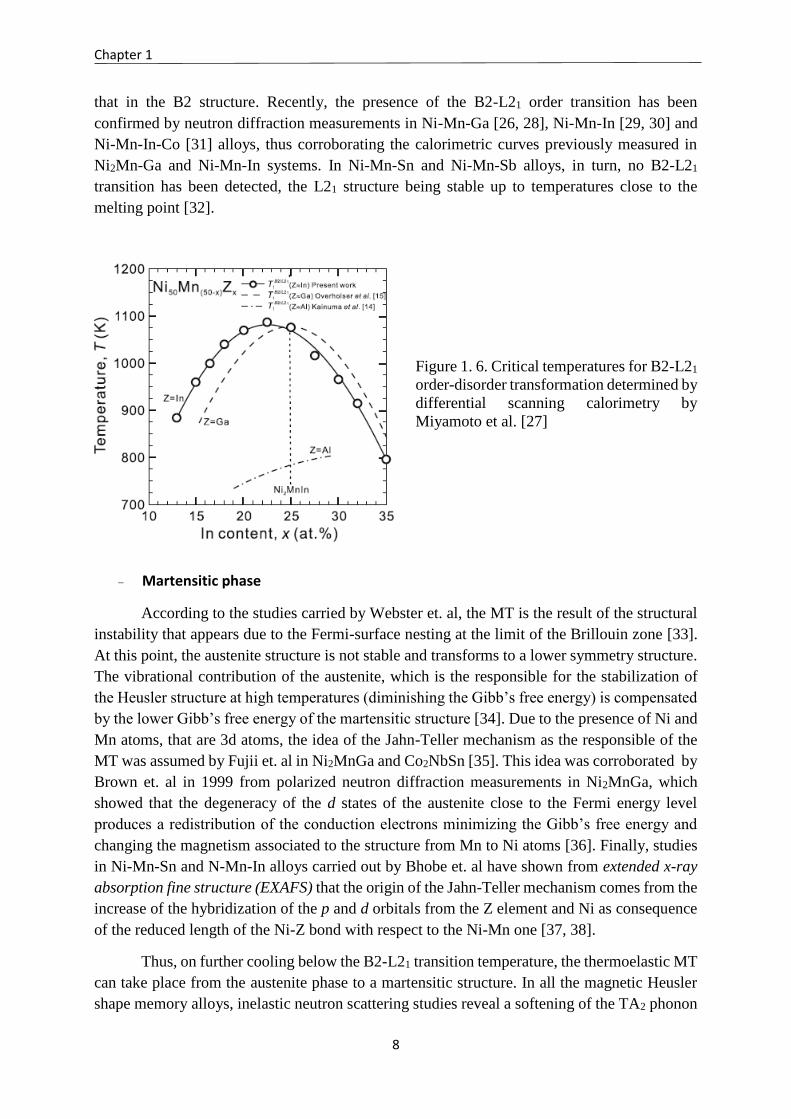
that in the B2 structure. Recently, the presence of the B2-L21 order transition has been
confirmed by neutron diffraction measurements in Ni-Mn-Ga [26, 28], Ni-Mn-In [29, 30] and
Ni-Mn-In-Co [31] alloys, thus corroborating the calorimetric curves previously measured in
Ni2Mn-Ga and Ni-Mn-In systems. In Ni-Mn-Sn and Ni-Mn-Sb alloys, in turn, no B2-L21
transition has been detected, the L21 structure being stable up to temperatures close to the
melting point [32].
Figure 1. 6. Critical temperatures for B2-L21
order-disorder transformation determined by
differential scanning calorimetry by
Miyamoto et al. [27]
Martensitic phase
According to the studies carried by Webster et. al, the MT is the result of the structural
instability that appears due to the Fermi-surface nesting at the limit of the Brillouin zone [33].
At this point, the austenite structure is not stable and transforms to a lower symmetry structure.
The vibrational contribution of the austenite, which is the responsible for the stabilization of
the Heusler structure at high temperatures (diminishing the Gibb’s free energy) is compensated
by the lower Gibb’s free energy of the martensitic structure [34]. Due to the presence of Ni and
Mn atoms, that are 3d atoms, the idea of the Jahn-Teller mechanism as the responsible of the
MT was assumed by Fujii et. al in Ni2MnGa and Co2NbSn [35]. This idea was corroborated by
Brown et. al in 1999 from polarized neutron diffraction measurements in Ni2MnGa, which
showed that the degeneracy of the d states of the austenite close to the Fermi energy level
produces a redistribution of the conduction electrons minimizing the Gibb’s free energy and
changing the magnetism associated to the structure from Mn to Ni atoms [36]. Finally, studies
in Ni-Mn-Sn and N-Mn-In alloys carried out by Bhobe et. al have shown from extended x-ray
absorption fine structure (EXAFS) that the origin of the Jahn-Teller mechanism comes from the
increase of the hybridization of the p and d orbitals from the Z element and Ni as consequence
of the reduced length of the Ni-Z bond with respect to the Ni-Mn one [37, 38].
Thus, on further cooling below the B2-L21 transition temperature, the thermoelastic MT
can take place from the austenite phase to a martensitic structure. In all the magnetic Heusler
shape memory alloys, inelastic neutron scattering studies reveal a softening of the TA2 phonon
1.3. Ni-Mn-Z alloys
9
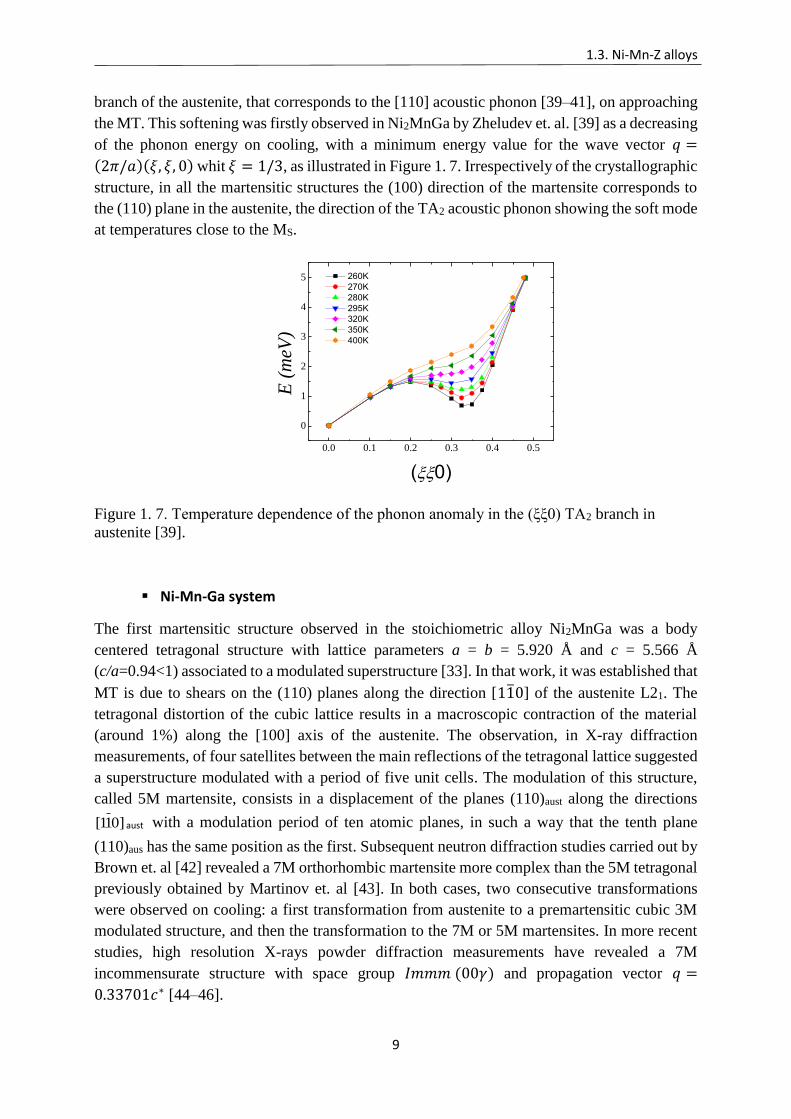
branch of the austenite, that corresponds to the [110] acoustic phonon [39–41], on approaching
the MT. This softening was firstly observed in Ni2MnGa by Zheludev et. al. [39] as a decreasing
of the phonon energy on cooling, with a minimum energy value for the wave vector 𝑞 =
(2𝜋/𝑎)(𝜉, 𝜉, 0) whit 𝜉 = 1/3, as illustrated in Figure 1. 7. Irrespectively of the crystallographic
structure, in all the martensitic structures the (100) direction of the martensite corresponds to
the (110) plane in the austenite, the direction of the TA2 acoustic phonon showing the soft mode
at temperatures close to the MS.
0.0 0.1 0.2 0.3 0.4 0.5
0
1
2
3
4
5
260K
270K
280K
295K
320K
350K
400K
E (
meV
)
(0)
Figure 1. 7. Temperature dependence of the phonon anomaly in the (ξξ0) TA2 branch in
austenite [39].
Ni-Mn-Ga system
The first martensitic structure observed in the stoichiometric alloy Ni2MnGa was a body
centered tetragonal structure with lattice parameters a = b = 5.920 Å and c = 5.566 Å
(c/a=0.94<1) associated to a modulated superstructure [33]. In that work, it was established that
MT is due to shears on the (110) planes along the direction [11̅0] of the austenite L21. The
tetragonal distortion of the cubic lattice results in a macroscopic contraction of the material
(around 1%) along the [100] axis of the austenite. The observation, in X-ray diffraction
measurements, of four satellites between the main reflections of the tetragonal lattice suggested
a superstructure modulated with a period of five unit cells. The modulation of this structure,
called 5M martensite, consists in a displacement of the planes (110)aust along the directions
]011[ aust with a modulation period of ten atomic planes, in such a way that the tenth plane
(110)aus has the same position as the first. Subsequent neutron diffraction studies carried out by
Brown et. al [42] revealed a 7M orthorhombic martensite more complex than the 5M tetragonal
previously obtained by Martinov et. al [43]. In both cases, two consecutive transformations
were observed on cooling: a first transformation from austenite to a premartensitic cubic 3M
modulated structure, and then the transformation to the 7M or 5M martensites. In more recent
studies, high resolution X-rays powder diffraction measurements have revealed a 7M
incommensurate structure with space group 𝐼𝑚𝑚𝑚 (00𝛾) and propagation vector 𝑞 =
0.33701𝑐∗ [44–46].
Chapter 1
10
This structure was confirmed also by Righi et. al, who found the same structure but with a larger
propagation vector 𝑞 = 0.4248𝑐∗ [47]. Moreover, again Righi et. al have shown that off
stoichiometric Ni-Mn-Ga presents a 5M commensurate structure with a fundamental
monoclinic lattice [48].
Ni-Mn-Z (Z=In, Sn, Sb)
In these alloys, the martensitic phase may show many different crystallographic structures
depending on the Z element and the alloy composition.
In Ni-Mn-Sn system, an orthorhombic structure with a four-layered modulation (called 4O) and
𝑃𝑚𝑚𝑎 space group was determined by Sutou et. al. from transmission electron microscopy
observations [49], where the presence of three new satellites around the main reflection gave
information about the modulation of the structure. This structure was corroborated from powder
neutron diffraction measurements performed by Brown et. al. in Ni-Mn-Sn and Ni-Mn-Sb [50,
51] and by Rama Rao et. al [52] in Ni-Mn-Sb alloys. In Ni-Mn-In system, Krenke et. al [53]
found, from neutron diffraction measurements, that the martensitic structure at 5 K was a 10M
monoclinic structure. For similar compositions, Brown et. al. [54] found a three-fold modulated
monoclinic structure with space group 𝑃2/𝑚. In fact, further systematic studies have revealed
the coexistence of several crystallographic structures (4O, 3M, 5M, 7M, commensurate and
incommensurate, orthorhombic and monoclinic… [55–57]) in martensites of different alloys.
In Table 1. I, the different martensitic structures obtained in Ni-Mn based Heusler alloys are
summarized. The relationship between the austenitic and the 4O and 3M martensitic structures
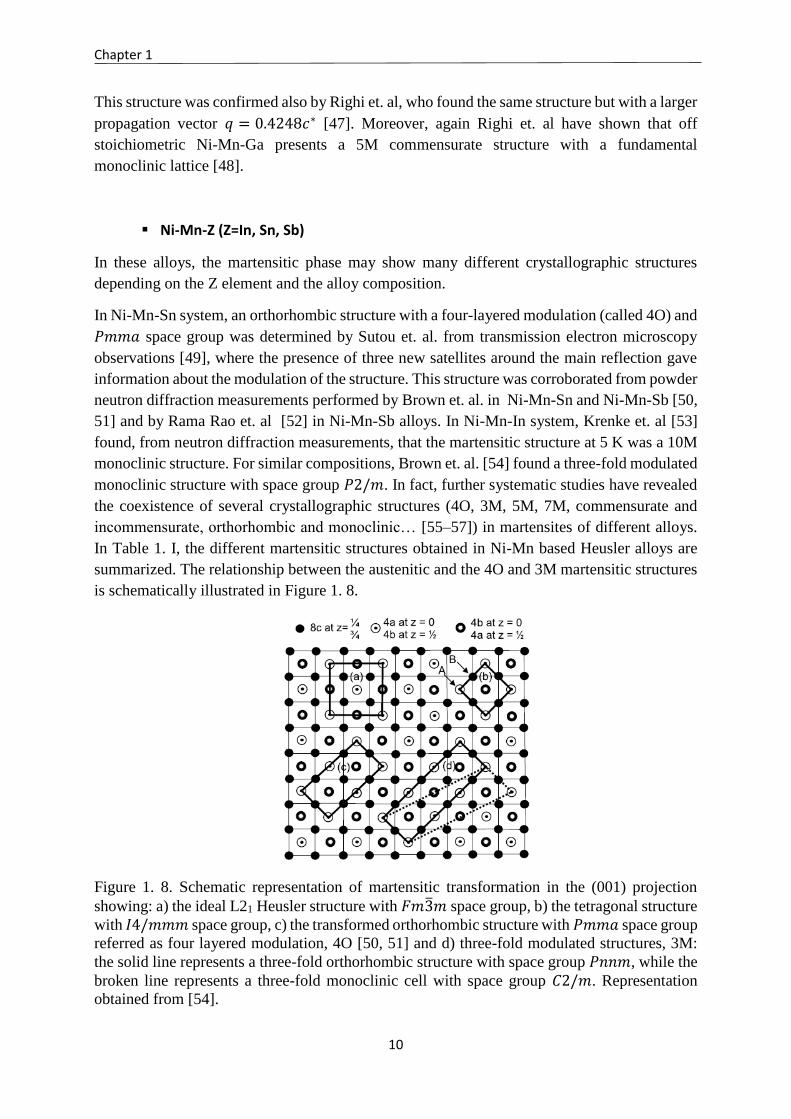
is schematically illustrated in Figure 1. 8.
Figure 1. 8. Schematic representation of martensitic transformation in the (001) projection
showing: a) the ideal L21 Heusler structure with 𝐹𝑚3̅𝑚 space group, b) the tetragonal structure
with 𝐼4/𝑚𝑚𝑚 space group, c) the transformed orthorhombic structure with 𝑃𝑚𝑚𝑎 space group
referred as four layered modulation, 4O [50, 51] and d) three-fold modulated structures, 3M:
the solid line represents a three-fold orthorhombic structure with space group 𝑃𝑛𝑛𝑚, while the
broken line represents a three-fold monoclinic cell with space group 𝐶2/𝑚. Representation
obtained from [54].
1.3. Ni-Mn-Z alloys
11
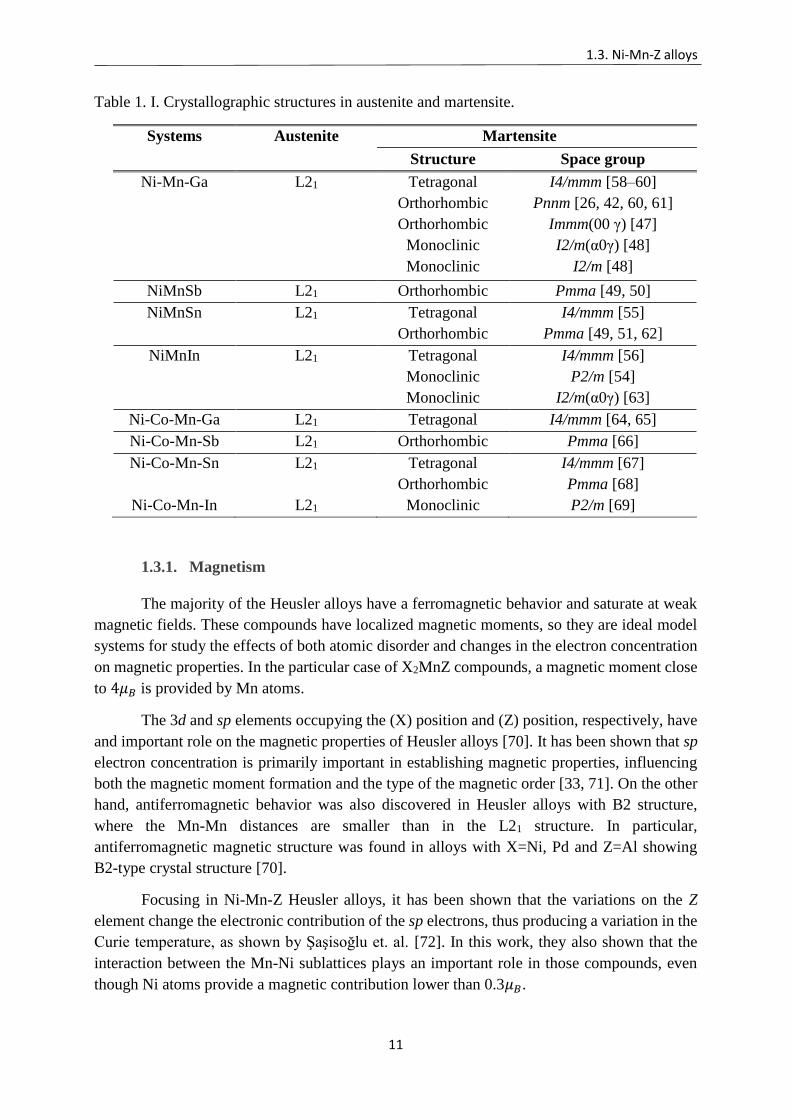
Table 1. I. Crystallographic structures in austenite and martensite.
Systems Austenite Martensite
Structure Space group
Ni-Mn-Ga L21 Tetragonal
Orthorhombic
Orthorhombic
Monoclinic
Monoclinic
I4/mmm [58–60]
Pnnm [26, 42, 60, 61]
Immm(00 γ) [47]
I2/m(α0γ) [48]
I2/m [48]
NiMnSb L21 Orthorhombic Pmma [49, 50]
NiMnSn L21 Tetragonal
Orthorhombic
I4/mmm [55]
Pmma [49, 51, 62]
NiMnIn L21 Tetragonal
Monoclinic
Monoclinic
I4/mmm [56]
P2/m [54]
I2/m(α0γ) [63]
Ni-Co-Mn-Ga L21 Tetragonal I4/mmm [64, 65]
Ni-Co-Mn-Sb L21 Orthorhombic Pmma [66]
Ni-Co-Mn-Sn L21 Tetragonal
Orthorhombic
I4/mmm [67]
Pmma [68]
Ni-Co-Mn-In L21 Monoclinic P2/m [69]
1.3.1. Magnetism
The majority of the Heusler alloys have a ferromagnetic behavior and saturate at weak
magnetic fields. These compounds have localized magnetic moments, so they are ideal model
systems for study the effects of both atomic disorder and changes in the electron concentration
on magnetic properties. In the particular case of X2MnZ compounds, a magnetic moment close
to 4𝜇𝐵 is provided by Mn atoms.
The 3d and sp elements occupying the (X) position and (Z) position, respectively, have
and important role on the magnetic properties of Heusler alloys [70]. It has been shown that sp
electron concentration is primarily important in establishing magnetic properties, influencing
both the magnetic moment formation and the type of the magnetic order [33, 71]. On the other
hand, antiferromagnetic behavior was also discovered in Heusler alloys with B2 structure,
where the Mn-Mn distances are smaller than in the L21 structure. In particular,
antiferromagnetic magnetic structure was found in alloys with X=Ni, Pd and Z=Al showing
B2-type crystal structure [70].
Focusing in Ni-Mn-Z Heusler alloys, it has been shown that the variations on the Z
element change the electronic contribution of the sp electrons, thus producing a variation in the
Curie temperature, as shown by Şaşisoğlu et. al. [72]. In this work, they also shown that the
interaction between the Mn-Ni sublattices plays an important role in those compounds, even
though Ni atoms provide a magnetic contribution lower than 0.3𝜇𝐵.
Chapter 1
12
Two main groups of magnetic alloys may be distinguished according to the magnetic
behavior: ferromagnetic (mainly the Ni-Mn-Ga systems), characterized by presenting
ferromagnetic behavior in both the austenite and martensite phases, and metamagnetic (Ni-Mn-
Z systems with Z = Sn, Sb, In) characterized by a weak magnetic behavior in the martensite
phase and therefore by a large magnetization drop at the MT. This large magnetization drop
occurring at the MT allows the induction of the MT by an applied magnetic field, thus giving
rise to multifunctional properties (namely giant magnetoresistance, magnetic shape memory
and large inverse magnetocaloric effect) of great technical interest for practical applications in
fields like sensing or magnetic refrigeration.
Brown et. al. developed a thorough study on the magnetic coupling in the austenite in
ferromagnetic (Ni-Mn-Ga) and metamagnetic (Ni-Mn-Sn, Ni-Mn-Sb and Ni-Mn-In) Heusler
alloys, those last ones with excess of Mn and presenting MT. In the case of an excess of Mn,
which is usual for compositions undergoing the MT at temperatures of technological interest,
some Mn atoms are located at 4b sites (ii sublattice). In all the experiments, the observed
magnetic structure was ferromagnetic, which means that the coupling between the 4a and 4b
sites where the Mn atoms are located is ferromagnetic. The calculated magnetic moment values
lied close to 2𝜇𝐵 and 1𝜇𝐵, respectively, and 0.33𝜇𝐵 in the 8c position assigned to Ni atom [42,
50, 51, 54]. However, other powder neutron diffraction experiments in Ni-Mn-Sn alloy carried
out by Umetsu et. al. showed an antiferromagnetic coupling between de Mn atoms located in
4a and 4b sites [73]. The main difference between both alloys is the amount of Mn atoms,
having higher Mn concentration in the case of Brown’s study. In addition, another important
result was obtained by Umetsu et. al. in Co-doped alloy (substitution of Ni by Co), where the
magnetic coupling suffers a variation from antiferromagnetic to ferromagnetic. The explanation
of this change, proposed by Kurtulus et. al by density-functional theory studies, is related to
the fact that the interactions between Co and Mn are stronger than the interactions between Ni
and Mn [74]. Other studies have been carried out to clarify the magnetic structure of the
martensite of metamagnetic shape memory alloys from neutron scattering measurements.
Antiferromagnetic correlations were deduced in Ni-Mn-Sn and Ni-Mn-Sb by Aksoy et. al. from
diffuse scattering measurements with neutron polarization analysis [75, 76]. The presence of
short-range antiferromagnetic correlations in martensite is supported by the observation of
exchange bias at low temperatures in some Ni-Mn-based Heusler alloys [77–83]. In Ni-Mn-Sn
system, however, recent Mössbauer spectroscopy studies seem to give evidence of a
paramagnetic state [84], hence the exact nature of the magnetic correlations in martensite is
also still under discussion.
In summary, the magnetism in these alloys mainly arises from the coupling between the
Mn atoms, in which the magnetic moment is chiefly confined, so the magnetic
exchangeinteractions (which can be treated in the framework of a Ruderman-Kittel-Kasuya-
Yoshida model) strongly depend on the Mn–Mn distance, and therefore different sequences of
magnetostructural transformations can be observed depending on both the third alloying
element and the change in interatomic distances caused by the MT. In particular, in Ni-Mn-Z
(Z=In, Sn, and Sb) alloys, as mentioned before, the MT takes place between a ferromagnetic
austenite and a weak magnetic martensitic phase. This behavior is thought to be related to a
1.4. Magnetostructural effects in Ni-Mn-Z alloys
13
development of local antiferromagnetic correlations promoted by the variation of the distance
between Mn atoms taking place as a result of the MT.
1.4. MAGNETOSTRUCTURAL EFFECTS IN Ni-Mn-Z ALLOYS
The alloys that undergo thermoelastic martensitic transformation and are also
ferromagnetic can have certain special characteristics due to the coupling of their structural and
magnetic properties. In this case, if the magnetic properties of the austenite and the martensite
are different, the structural transformation (the martensitic one) involves a change in the
magnetic properties, giving rise to a magnetostructural 1st order transformation, where elastic
and magnetic subsystems are coupled. Then, magnetic field appears as another stimulus to
which the MT is sensitive. As a consequence, new effects linked to the MT may arise, as the
magnetic-field-induced strain, the magnetic shape memory effect or the magnetic-field-induced
MT.
1.4.1. Magnetic-field induced strain (MFIS). Magnetic shape memory effect
(MSME)
In ferromagnetic alloys, the MT promotes the formation of a structure of magnetic domains
linked to the structure of crystallographic domains. In this case, the application of a magnetic
field may cause the movements of the martensitic variants and hence a large macroscopic
deformation on the alloy. This particular effect, consequence of the coupling between the
structural and magnetic degrees of freedom in ferromagnetic martensitic structures, can be only
possible at temperatures below the MT (AS) and Curie temperature (TC).
The magnetic shape memory alloys are characterized by a net magnetic moment or
spontaneous magnetization (Ms). When a magnetic field is applied on the alloy, a magnetostatic
energy known as Zeeman energy tends to align the magnetic moments with the applied
magnetic field, which can be described with the equation:
𝐸𝑚𝑎𝑔𝑛𝑒𝑡𝑜𝑠𝑡𝑎𝑡𝑖𝑐 = −µ0
𝑯 · 𝑴𝑺 (1.2)
where µ0 is the permeability in the vacuum, H is the external magnetic field and the Ms the
spontaneous magnetization.
On the other hand, the energy of magnetocrystalline anisotropy opposes to the displacement
of magnetization out of certain directions, the so-called directions of easy magnetization or easy
axes. For materials with a uniaxial anisotropy, this energy can be expressed as:
𝐸𝑎𝑛𝑖𝑠𝑜𝑡𝑟𝑜𝑝𝑦 = 𝐾𝑢𝑠𝑖𝑛2𝜃 (1.3)
where 𝐾𝑢 is the constant of uniaxial anisotropy and 𝜃 is the angle between the magnetization and
the easy axis of magnetization.
Chapter 1
14
When an external magnetic field is applied, the magnetization tends to rotate from the
directions of easy magnetization to the direction of the external magnetic field, this tendency
being greater the greater the saturation magnetization (Msat). If the energy of anisotropy is high,
the magnetizations are strongly fixed to the crystallographic orientations of each variant,
changing the direction of easy magnetization along the interface. In this case, the application of
a magnetic field creates a Zeeman energy difference along the boundary between the variants
that causes a pressure on the boundary. If this pressure is greater than the de-twinning stress,
the movement of the twin boundary will occur resulting in the growth of those variants that are
favorably oriented with respect to the direction of the external field, in order to minimize the
Zeeman energy. The condition for the movement of variants can be formulated as:
𝜎𝑚𝑎𝑔 =𝐾𝑈
𝜀𝑂> 𝜎𝑑𝑡𝑤 (1.4)
where 𝜎𝑚𝑎𝑔 is the magnetic stress, 휀𝑂 is the maximum deformation induced by the magnetic
field and 𝜎𝑑𝑡𝑤 corresponds is de-twinning stress [38].
As in the case of stress-induced deformation, the strain will persist after removing the
magnetic field. Now, if the magnetically-deformed martensite is heated up to temperatures
above Af, the reverse MT takes place and the austenitic structure, and hence the original shape,
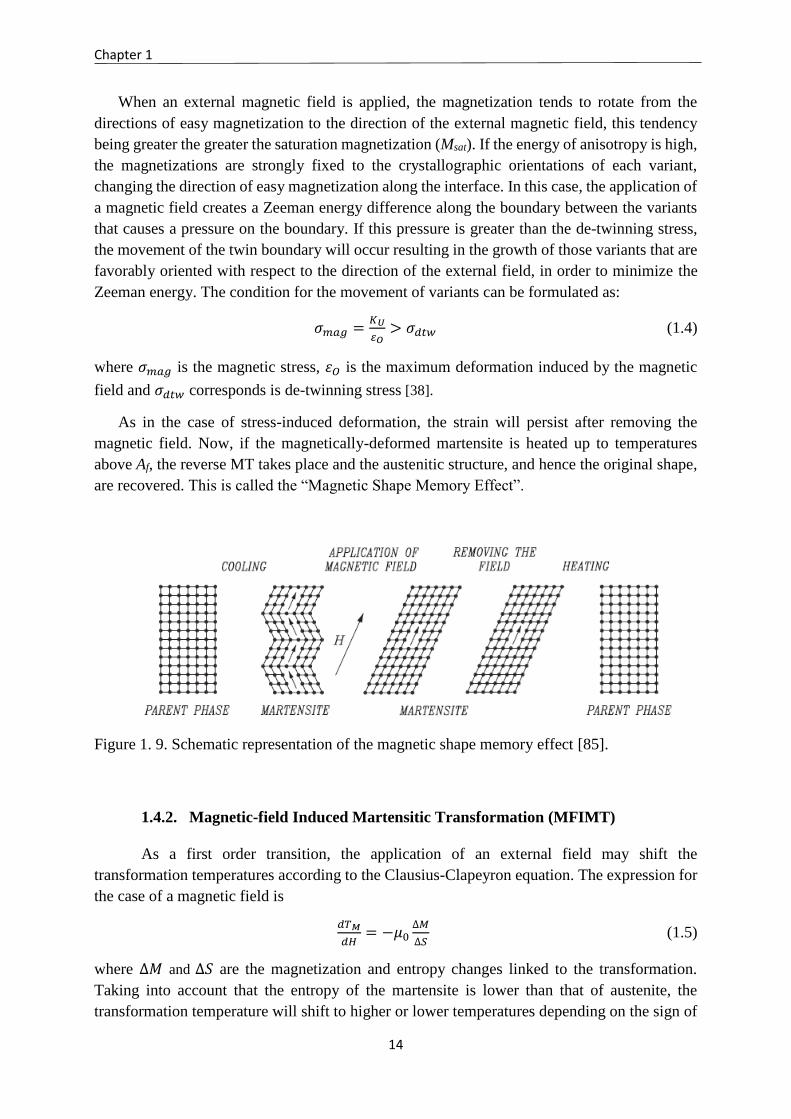
are recovered. This is called the “Magnetic Shape Memory Effect”.
Figure 1. 9. Schematic representation of the magnetic shape memory effect [85].
1.4.2. Magnetic-field Induced Martensitic Transformation (MFIMT)
As a first order transition, the application of an external field may shift the
transformation temperatures according to the Clausius-Clapeyron equation. The expression for
the case of a magnetic field is
𝑑𝑇𝑀
𝑑𝐻= −𝜇0
∆𝑀
∆𝑆 (1.5)
where ∆𝑀 and ∆𝑆 are the magnetization and entropy changes linked to the transformation.
Taking into account that the entropy of the martensite is lower than that of austenite, the
transformation temperature will shift to higher or lower temperatures depending on the sign of
1.4. Magnetostructural effects in Ni-Mn-Z alloys
15
the magnetization change. In the case of metamagnetic shape memory alloys, the large
magnetization drop occurring at the MT leads to very large negative shifts in the transformation
temperature under the application of high magnetic fields. Hence, if the magnetic field is
applied in the martensitic state at temperatures close to AS, it can result in the magnetic induction
of the reverse MT.
This phenomenon was firstly studied in Ni45Co5Mn36.7In13.3 Heusler single-crystal,
where it was demonstrated not only the induction of the austenite by the applied magnetic field
but also the almost full recovery of the induced strain with the applied magnetic field [86]. After
this first discovery, the magnetic induction of the MT has been observed and studied in all the
Ni-Mn-based metamagnetic systems; Ni-Mn-In [87], Ni-Mn-Sn [88], Ni-Mn-Sb [89], Ni-Co-
Mn-Sn [90], Ni-Co-Mn-Al [91] or Ni-Co-Mn-Ga [92]. The weak magnetic state in martensite,
and consequently the huge change in magnetization at the martensitic transformation, is the
main responsible of the possibility of inducing the reverse transformation by magnetic field.
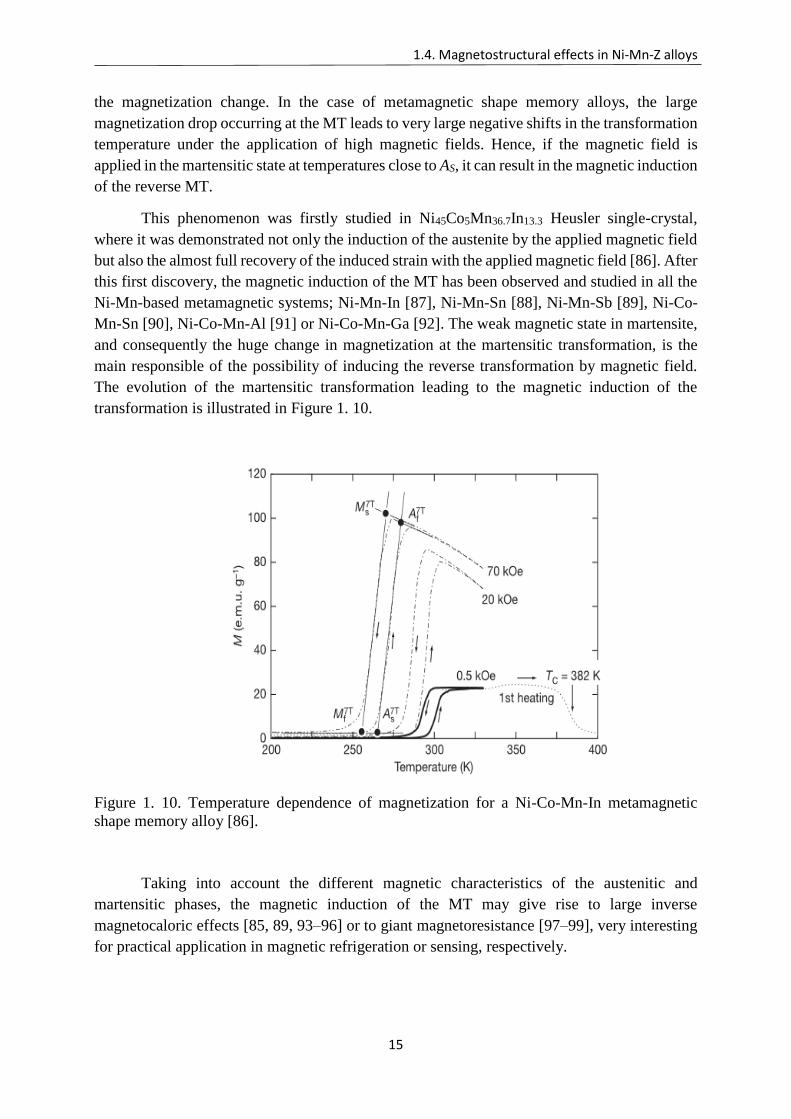
The evolution of the martensitic transformation leading to the magnetic induction of the
transformation is illustrated in Figure 1. 10.
Figure 1. 10. Temperature dependence of magnetization for a Ni-Co-Mn-In metamagnetic
shape memory alloy [86].
Taking into account the different magnetic characteristics of the austenitic and
martensitic phases, the magnetic induction of the MT may give rise to large inverse
magnetocaloric effects [85, 89, 93–96] or to giant magnetoresistance [97–99], very interesting
for practical application in magnetic refrigeration or sensing, respectively.
Chapter 1
16
1.4.3. Magnetocaloric effect
The magnetocaloric effect can be defined as the variation in the temperature that a magnetic
material suffers when a magnetic field is applied on it. Depending of the measuring conditions,
the magnetocaloric effect can be expressed as a temperature change in adiabatic conditions or
as an entropy change in isothermal conditions, caused by the application of a magnetic field.
This phenomenon is intrinsic for all magnetic materials and is produced as a result of the
coupling of the magnetic sublattice with the applied magnetic field, giving a variation in the
magnetic contribution to the entropy of the solid [100].
The effect of the application of the magnetic field in the temperature and entropy of a
magnetic material can be obtained from thermodynamic considerations. The total differential
of the total entropy can be written as:
𝑑𝑆 = (𝜕𝑆
𝜕𝑇)
𝐻,𝑃𝑑𝑇 + (
𝜕𝑆
𝜕𝐻)
𝑇,𝑃𝑑𝐻 + (
𝜕𝑆
𝜕𝑃)
𝑇,𝐻𝑑𝑃 (1.6)
where T,H and P are the thermodynamic variables temperature, magnetic field and pressure,
respectively. Focusing only in an isobaric process, that is, at constant pressure, and taking into
account that the partial derivative of entropy with respect to the magnetic field can be related
to magnetization through the Maxwell equation
(𝜕𝑆
𝜕𝐻)
𝑇= (
𝜕𝑀
𝜕𝑇)
𝐻 (1.7)
and the partial derivative of entropy with respect to temperature can be expressed as
(𝜕𝑆
𝜕𝑇)
𝐻=
𝐶
𝑇 (1.8)
where C is the heat capacity of the material, the equation (1.6) results in
𝑑𝑆(𝑇, 𝐻) =𝐶(𝑇,𝐻)
𝑇𝑑𝑇 + (
𝜕𝑀(𝑇,𝐻)
𝜕𝑇)
𝐻𝑑𝐻 (1.9)
where the entropy is expressed in terms of easily measurable variables. In this expression, the
entropy can be assumed to be the total entropy of the material as long as all the contributions to
the entropy (vibrational, electronic, etc…) are included in the value of C, which provides all
the degrees of freedom of the system.
Figure 1. 11 shows a schematic representation of the magnetocaloric effect in a S-T diagram.
By applying a magnetic field in a conventional magnetic material (or by increasing the intensity
of the magnetic field), the magnetic contribution to the entropy is modified as a consequence
of the increment of the magnetic order on the alloy. There are two different ways to vary the
magnetic field: adiabatically or isothermally. If the variation of the magnetic field is carried out
under adiabatic conditions, in a reversible process, the system experiments a variation in the
temperature ΔTad that corresponds to the adiabatic difference between the functions S(Hf) and
S(Hi). Applying the adiabatic condition (dS=0) in the equation (1.9), the expression for the
adiabatic temperature change as a function of the applied magnetic field is expressed as:
∆𝑇𝑎𝑑(𝑇, 𝐻) = − ∫𝑇
𝐶(𝑇,𝐻)
𝐻𝑓
𝐻𝑖(
𝜕𝑀(𝑇,𝐻)
𝜕𝑇)
𝐻𝑑𝐻 (1.10)
where the integration limits correspond to the initial and final magnetic fields.
1.4. Magnetostructural effects in Ni-Mn-Z alloys
17
On the other hand, the variation on the magnetic field can be carried out in isothermal
conditions, thus producing a variation in the entropy of the system ΔSiso. If we impose the condition
dT=0, the isothermal variation in the entropy can be expressed as follows:
∆𝑆𝑖𝑠𝑜(𝑇, 𝐻) = ∫ (𝜕𝑀(𝑇,𝐻)
𝜕𝑇)
𝐻𝑑𝐻
𝐻𝑓
𝐻𝑖 (1.11)
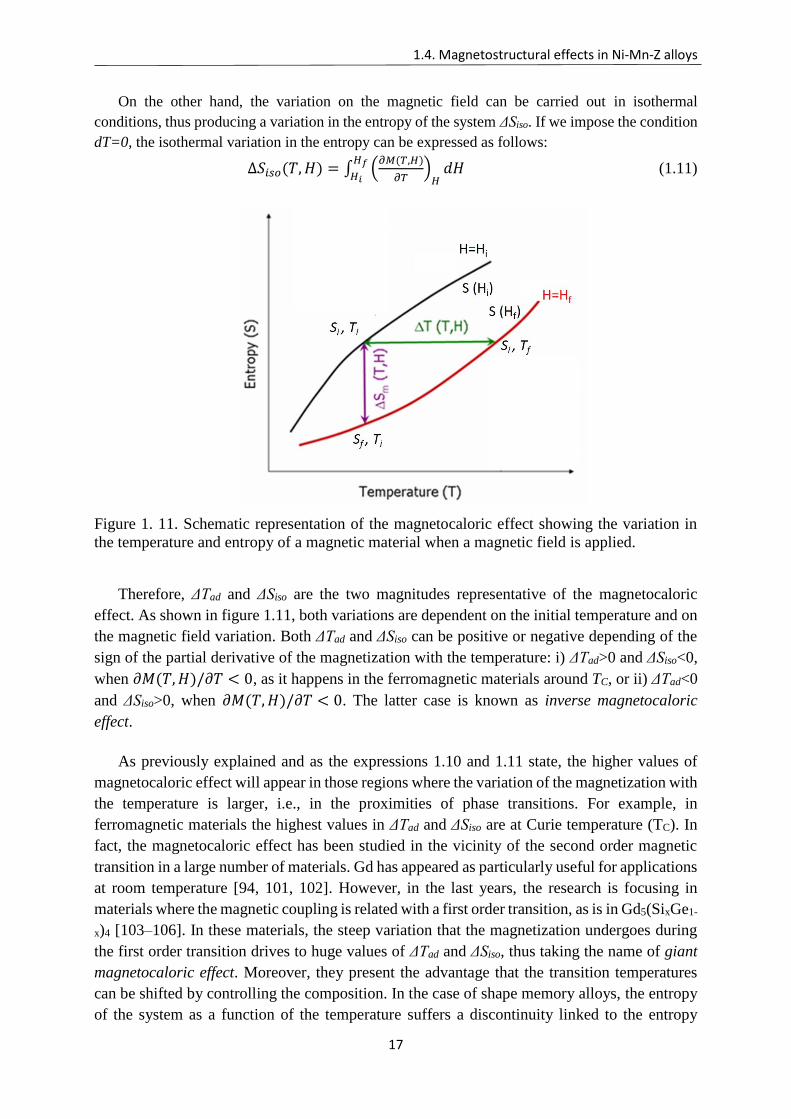
Figure 1. 11. Schematic representation of the magnetocaloric effect showing the variation in
the temperature and entropy of a magnetic material when a magnetic field is applied.
Therefore, ΔTad and ΔSiso are the two magnitudes representative of the magnetocaloric
effect. As shown in figure 1.11, both variations are dependent on the initial temperature and on
the magnetic field variation. Both ΔTad and ΔSiso can be positive or negative depending of the
sign of the partial derivative of the magnetization with the temperature: i) ΔTad>0 and ΔSiso<0,
when 𝜕𝑀(𝑇, 𝐻)/𝜕𝑇 < 0, as it happens in the ferromagnetic materials around TC, or ii) ΔTad<0
and ΔSiso>0, when 𝜕𝑀(𝑇, 𝐻)/𝜕𝑇 < 0. The latter case is known as inverse magnetocaloric
effect.
As previously explained and as the expressions 1.10 and 1.11 state, the higher values of
magnetocaloric effect will appear in those regions where the variation of the magnetization with
the temperature is larger, i.e., in the proximities of phase transitions. For example, in
ferromagnetic materials the highest values in ΔTad and ΔSiso are at Curie temperature (TC). In
fact, the magnetocaloric effect has been studied in the vicinity of the second order magnetic
transition in a large number of materials. Gd has appeared as particularly useful for applications
at room temperature [94, 101, 102]. However, in the last years, the research is focusing in
materials where the magnetic coupling is related with a first order transition, as is in Gd5(SixGe1-
x)4 [103–106]. In these materials, the steep variation that the magnetization undergoes during
the first order transition drives to huge values of ΔTad and ΔSiso, thus taking the name of giant
magnetocaloric effect. Moreover, they present the advantage that the transition temperatures
can be shifted by controlling the composition. In the case of shape memory alloys, the entropy
of the system as a function of the temperature suffers a discontinuity linked to the entropy
Chapter 1
18
change at the MT, ∆SMT. As previously explained, the application of a magnetic field promotes
a shift in the transformation temperature, expressed by the Clausius–Clapeyron equation,
resulting in the magnetic induction of an entropy change, that is, in a magnetocaloric effect. If
the effect of the magnetic field is strong enough to induce the whole first order transition (and
its effect on the heat capacities of the two phases is small) a limit value of the MCE with ∆S ≈
∆SMT should be expected.
The magnetocaloric effect has been widely studied in the Heusler alloys (Ni-Mn-Ga [96,
107–109], Ni-Mn-Sn [88, 110, 111], Ni-Mn-In [53, 88, 112], Ni-Mn-Sb[89, 113, 114] and Ni-
Fe-Ga[93, 115]). The highest values of magnetocaloric effect in Ni-Mn-Ga systems have been
observed in alloys close to the stoichiometry and have been obtained in those alloys where the
magnetic and structural transitions overlap, reaching values of direct magnetocaloric effect
close to ∆𝑆 = 23𝐽/𝑘𝑔𝐾 at 5T [116]. The largest reported values of inverse magnetocaloric
effect in ternary metamagnetic alloys are ∆𝑆 = 19 𝐽/𝑘𝑔𝐾, obtained in Ni50Mn37Sn13 [117] and
Ni50Mn34In16 [88], while the values obtained in Ni50Mn37Sb13 reach ∆𝑆 = 9.1 𝐽/𝑘𝑔𝐾 [89]. The
introduction of another 3d element such as Co, which produces an increment of magnetization
in austenite and reduces the magnetic coupling in martensite, produces an increase of ∆𝑀 that
implies the increase of the ∆𝑆 in the MT. In this way the large variations in the entropy have
been obtained, reaching 31.9𝐽/𝑘𝑔𝐾, 34𝐽/𝑘𝑔𝐾 and 30/𝑘𝑔𝐾 for Ni-Co-Mn-Sn [118], Ni-Co-
Mn-Sb [119] and Ni-Co-Mn-In [120], respectively.
There are two different ways to measure the magnetocaloric effect: directly and indirectly.
The direct methods consist in the direct measurement (by calorimetry) of the adiabatic change
on the temperature or the isothermal entropy variation that the material undergoes when a
magnetic field is applied. On the other hand, indirect methods are based in the calculation of
the values of ΔTad and ΔSiso from magnetization measurements using the previous equations. In
the present work, the MCE values (that is, the values of the entropy change) have been estimated
indirectly from thermomagnetization curves at different applied magnetic fields, using equation
1.11.
1.4.4. Giant magnetoresistance.
Magnetoresistance is the variation of the electric resistance when a magnetic field is applied
on a material. This behavior was discovered by William Thomson for iron in 1857. Depending
on the variation in the resistance it is possible to have giant magnetoresistance or even colossal
magnetoresistance [121–123] reaching variations of 1300% at room temperature in La-Ca-Mn-
O films. The magnetoresistance is attributed to the influence of the state of spin on the
dispersion of conduction electrons [124]. This phenomenon has been observed and studied in
some ferromagnetic and metamagnetic shape memory alloys [97–99, 125]. For example,
negative magnetoresistance was measured in Ni-Mn-Fe-Ga system in a broad range of
temperatures, being mostly relevant in the range of temperatures close to the MT. This behavior
was ascribed to the electronic redistribution and the increment in the dispersion in the presence
of interphases. Due to the difference in the resistivity between structural phases, a huge change
1.5. Tunning the multifunctional properties
19
in the magnetoresistance can be expected in the MT in metamagnetic shape memory systems,
which show values up to -80% linked to the induction of the MT in Ni-Mn-In [126] or -48% in
Ni-Mn-Sn [127] systems.
1.5. TUNNING THE MULTIFUNCTIONAL PROPERTIES
The MT characteristics and the magnetic properties of Ni-Mn-Z alloys depend on
composition, atomic order and microstructure. This makes possible to properly tune the
multifunctional features linked to the magnetostructural properties in these materials.
1.5.1. Composition
As the MT occurs when the Fermi surface coincides with the Brillouin zone, the
concentration of electrons in the conduction band (e/a) can be considered as one of the main
factors in the structural stability. In this sense, the compositional dependence of the Ni-Mn-Z
Heusler alloys affects to the MT temperature and to the martensitic and austenitic Curie
temperatures modifying in this way the magnetic and physical properties.
To obtain the e/a value we assume that each atom contributes with the most external
electrons, considering the configuration of the electronic band structure in Heusler alloys [128].
In this way, Ni (3d84d2) provides 10 electrons, Mn (3d54d2) contributes with 7 and, depending
of the Z element, it contributes with 3 in the case of Ga (4s24p1) and In (5s25p1), 4 for Sn (5s25p2)
and 5 electrons for Sb (5s25p3).
In the case of Ni-Mn-Ga alloys, V. A. Chernenko was the first to establish empirically
the relation between the MT and e/a, resolving in this way the phase diagram of those alloys
[129]. Since then, many systematic studies were carried out analyzing the magnetic and
structural properties as a function of e/a. In this study it was revealed that the temperatures of
the martensitic and premartensitic transformations increase significantly when the value of e/a
increases, while the Curie temperature of the austenite remains nearly constant. A critical value
e/a≈7.7 is reached when MS=TC. Below and above this value, MS<TC when e/a<7.7 and MS>TC
when e/a>7.7. Additionally, the enthalpy and entropy associated to this structural transition
increase with the e/a value [130]. It was also demonstrated the importance of e/a in the
martensitic structures, affecting the symmetry and the type of modulation [131]. More in detail,
as Figure 1. 12 shows, Ϛakir et. al [132] have demonstrated the relation between e/a and the
structure in the martensite by replacing Ga by Mn, showing the existence of intermartensitic
transitions. The authors found that intermartensitic transitions take place following the
sequence 7M→L10, 5M→7M, and 5M→7M→L10 on decreasing temperature and that the L10
(non-modulated tetragonal phase with space group I4/mmm) tends to be the ground state as it
was previously considered theoretically [133].
Chapter 1
20
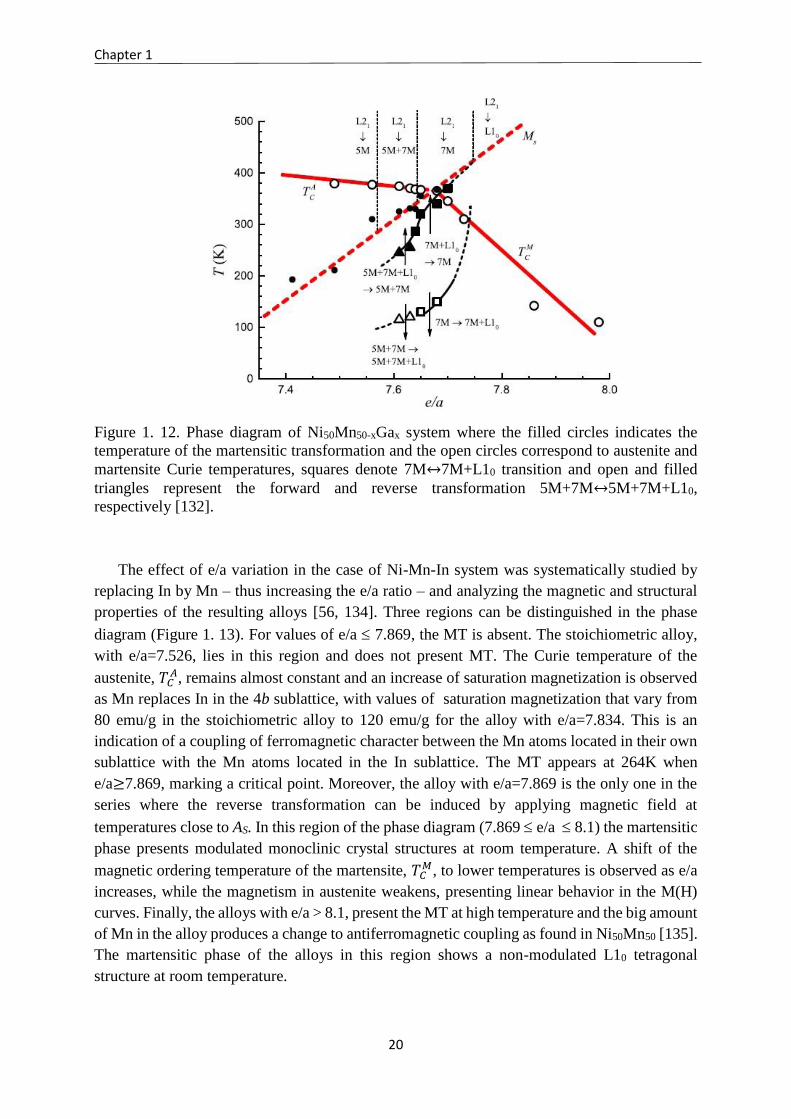
Figure 1. 12. Phase diagram of Ni50Mn50-xGax system where the filled circles indicates the
temperature of the martensitic transformation and the open circles correspond to austenite and
martensite Curie temperatures, squares denote 7M↔7M+L10 transition and open and filled
triangles represent the forward and reverse transformation 5M+7M↔5M+7M+L10,
respectively [132].
The effect of e/a variation in the case of Ni-Mn-In system was systematically studied by
replacing In by Mn – thus increasing the e/a ratio – and analyzing the magnetic and structural
properties of the resulting alloys [56, 134]. Three regions can be distinguished in the phase
diagram (Figure 1. 13). For values of e/a 7.869, the MT is absent. The stoichiometric alloy,
with e/a=7.526, lies in this region and does not present MT. The Curie temperature of the
austenite, 𝑇𝐶𝐴, remains almost constant and an increase of saturation magnetization is observed
as Mn replaces In in the 4b sublattice, with values of saturation magnetization that vary from
80 emu/g in the stoichiometric alloy to 120 emu/g for the alloy with e/a=7.834. This is an
indication of a coupling of ferromagnetic character between the Mn atoms located in their own
sublattice with the Mn atoms located in the In sublattice. The MT appears at 264K when
e/a≥7.869, marking a critical point. Moreover, the alloy with e/a=7.869 is the only one in the
series where the reverse transformation can be induced by applying magnetic field at
temperatures close to AS. In this region of the phase diagram (7.869 e/a 8.1) the martensitic
phase presents modulated monoclinic crystal structures at room temperature. A shift of the
magnetic ordering temperature of the martensite, 𝑇𝐶𝑀, to lower temperatures is observed as e/a
increases, while the magnetism in austenite weakens, presenting linear behavior in the M(H)
curves. Finally, the alloys with e/a > 8.1, present the MT at high temperature and the big amount
of Mn in the alloy produces a change to antiferromagnetic coupling as found in Ni50Mn50 [135].
The martensitic phase of the alloys in this region shows a non-modulated L10 tetragonal
structure at room temperature.
1.5. Tunning the multifunctional properties
21
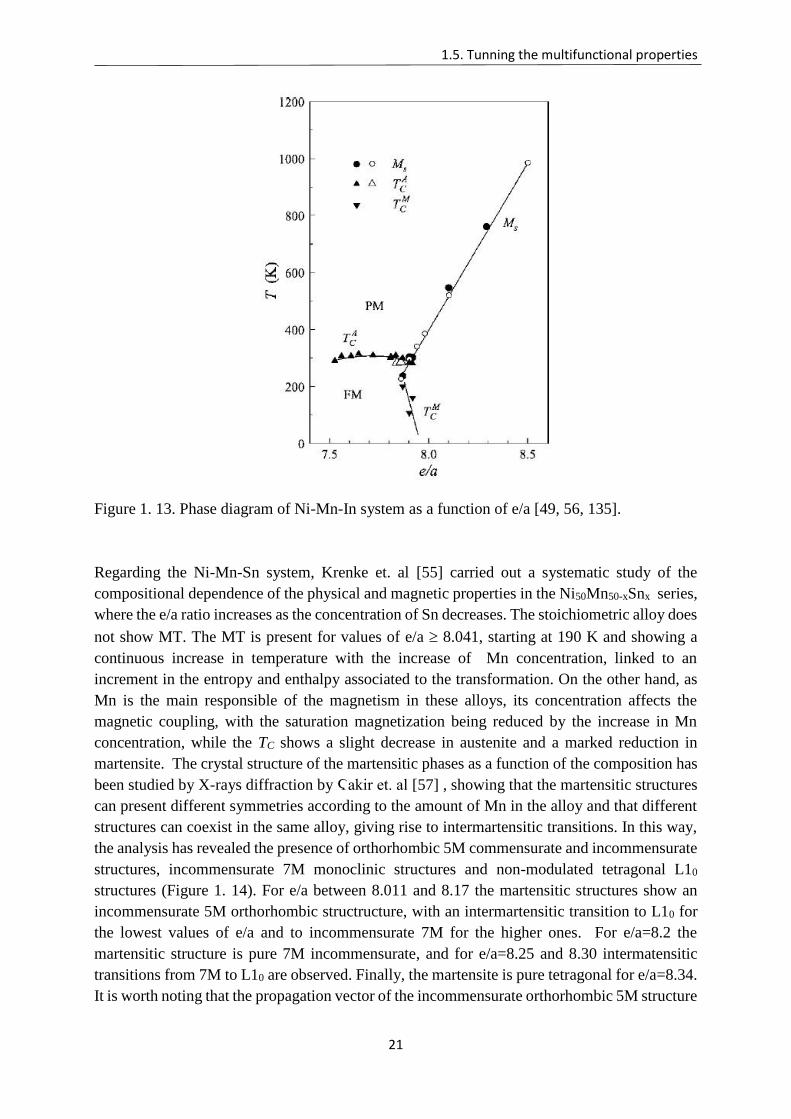
Figure 1. 13. Phase diagram of Ni-Mn-In system as a function of e/a [49, 56, 135].
Regarding the Ni-Mn-Sn system, Krenke et. al [55] carried out a systematic study of the
compositional dependence of the physical and magnetic properties in the Ni50Mn50-xSnx series,
where the e/a ratio increases as the concentration of Sn decreases. The stoichiometric alloy does
not show MT. The MT is present for values of e/a 8.041, starting at 190 K and showing a
continuous increase in temperature with the increase of Mn concentration, linked to an
increment in the entropy and enthalpy associated to the transformation. On the other hand, as
Mn is the main responsible of the magnetism in these alloys, its concentration affects the
magnetic coupling, with the saturation magnetization being reduced by the increase in Mn
concentration, while the TC shows a slight decrease in austenite and a marked reduction in
martensite. The crystal structure of the martensitic phases as a function of the composition has
been studied by X-rays diffraction by Ϛakir et. al [57] , showing that the martensitic structures
can present different symmetries according to the amount of Mn in the alloy and that different
structures can coexist in the same alloy, giving rise to intermartensitic transitions. In this way,
the analysis has revealed the presence of orthorhombic 5M commensurate and incommensurate
structures, incommensurate 7M monoclinic structures and non-modulated tetragonal L10
structures (Figure 1. 14). For e/a between 8.011 and 8.17 the martensitic structures show an
incommensurate 5M orthorhombic structructure, with an intermartensitic transition to L10 for
the lowest values of e/a and to incommensurate 7M for the higher ones. For e/a=8.2 the
martensitic structure is pure 7M incommensurate, and for e/a=8.25 and 8.30 intermatensitic
transitions from 7M to L10 are observed. Finally, the martensite is pure tetragonal for e/a=8.34.
It is worth noting that the propagation vector of the incommensurate orthorhombic 5M structure
Chapter 1
22
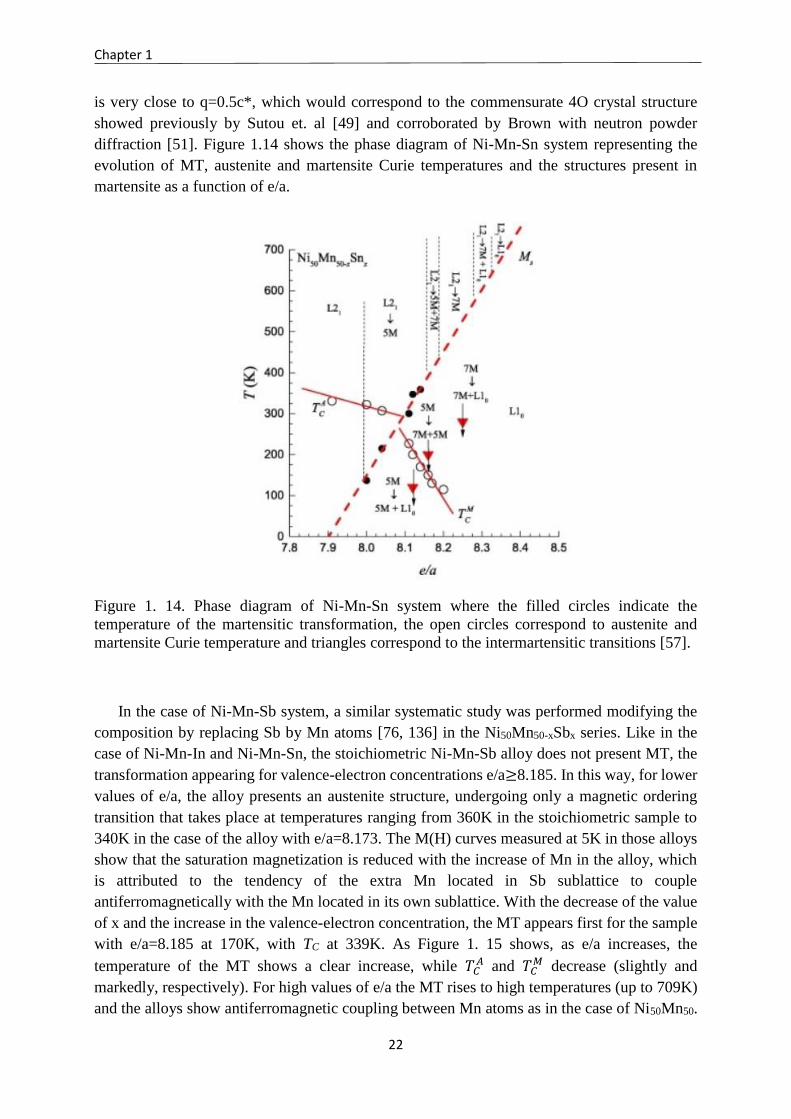
is very close to q=0.5c*, which would correspond to the commensurate 4O crystal structure
showed previously by Sutou et. al [49] and corroborated by Brown with neutron powder
diffraction [51]. Figure 1.14 shows the phase diagram of Ni-Mn-Sn system representing the
evolution of MT, austenite and martensite Curie temperatures and the structures present in
martensite as a function of e/a.
Figure 1. 14. Phase diagram of Ni-Mn-Sn system where the filled circles indicate the
temperature of the martensitic transformation, the open circles correspond to austenite and
martensite Curie temperature and triangles correspond to the intermartensitic transitions [57].
In the case of Ni-Mn-Sb system, a similar systematic study was performed modifying the
composition by replacing Sb by Mn atoms [76, 136] in the Ni50Mn50-xSbx series. Like in the
case of Ni-Mn-In and Ni-Mn-Sn, the stoichiometric Ni-Mn-Sb alloy does not present MT, the
transformation appearing for valence-electron concentrations e/a≥8.185. In this way, for lower
values of e/a, the alloy presents an austenite structure, undergoing only a magnetic ordering
transition that takes place at temperatures ranging from 360K in the stoichiometric sample to
340K in the case of the alloy with e/a=8.173. The M(H) curves measured at 5K in those alloys
show that the saturation magnetization is reduced with the increase of Mn in the alloy, which
is attributed to the tendency of the extra Mn located in Sb sublattice to couple
antiferromagnetically with the Mn located in its own sublattice. With the decrease of the value
of x and the increase in the valence-electron concentration, the MT appears first for the sample
with e/a=8.185 at 170K, with TC at 339K. As Figure 1. 15 shows, as e/a increases, the
temperature of the MT shows a clear increase, while 𝑇𝐶𝐴 and 𝑇𝐶
𝑀 decrease (slightly and
markedly, respectively). For high values of e/a the MT rises to high temperatures (up to 709K)
and the alloys show antiferromagnetic coupling between Mn atoms as in the case of Ni50Mn50.
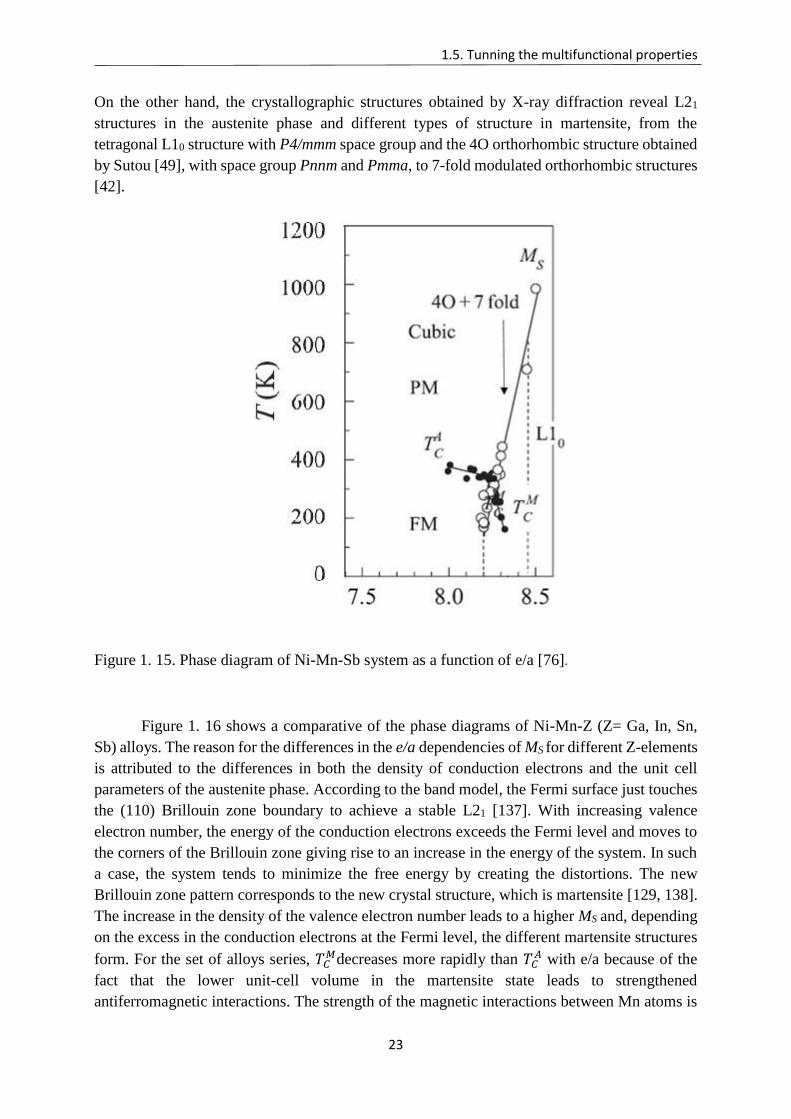
1.5. Tunning the multifunctional properties
23
On the other hand, the crystallographic structures obtained by X-ray diffraction reveal L21
structures in the austenite phase and different types of structure in martensite, from the
tetragonal L10 structure with P4/mmm space group and the 4O orthorhombic structure obtained
by Sutou [49], with space group Pnnm and Pmma, to 7-fold modulated orthorhombic structures
[42].
Figure 1. 15. Phase diagram of Ni-Mn-Sb system as a function of e/a [76].
Figure 1. 16 shows a comparative of the phase diagrams of Ni-Mn-Z (Z= Ga, In, Sn,
Sb) alloys. The reason for the differences in the e/a dependencies of MS for different Z-elements
is attributed to the differences in both the density of conduction electrons and the unit cell
parameters of the austenite phase. According to the band model, the Fermi surface just touches
the (110) Brillouin zone boundary to achieve a stable L21 [137]. With increasing valence
electron number, the energy of the conduction electrons exceeds the Fermi level and moves to
the corners of the Brillouin zone giving rise to an increase in the energy of the system. In such
a case, the system tends to minimize the free energy by creating the distortions. The new
Brillouin zone pattern corresponds to the new crystal structure, which is martensite [129, 138].
The increase in the density of the valence electron number leads to a higher MS and, depending
on the excess in the conduction electrons at the Fermi level, the different martensite structures
form. For the set of alloys series, 𝑇𝐶𝑀decreases more rapidly than 𝑇𝐶
𝐴 with e/a because of the
fact that the lower unit-cell volume in the martensite state leads to strengthened
antiferromagnetic interactions. The strength of the magnetic interactions between Mn atoms is
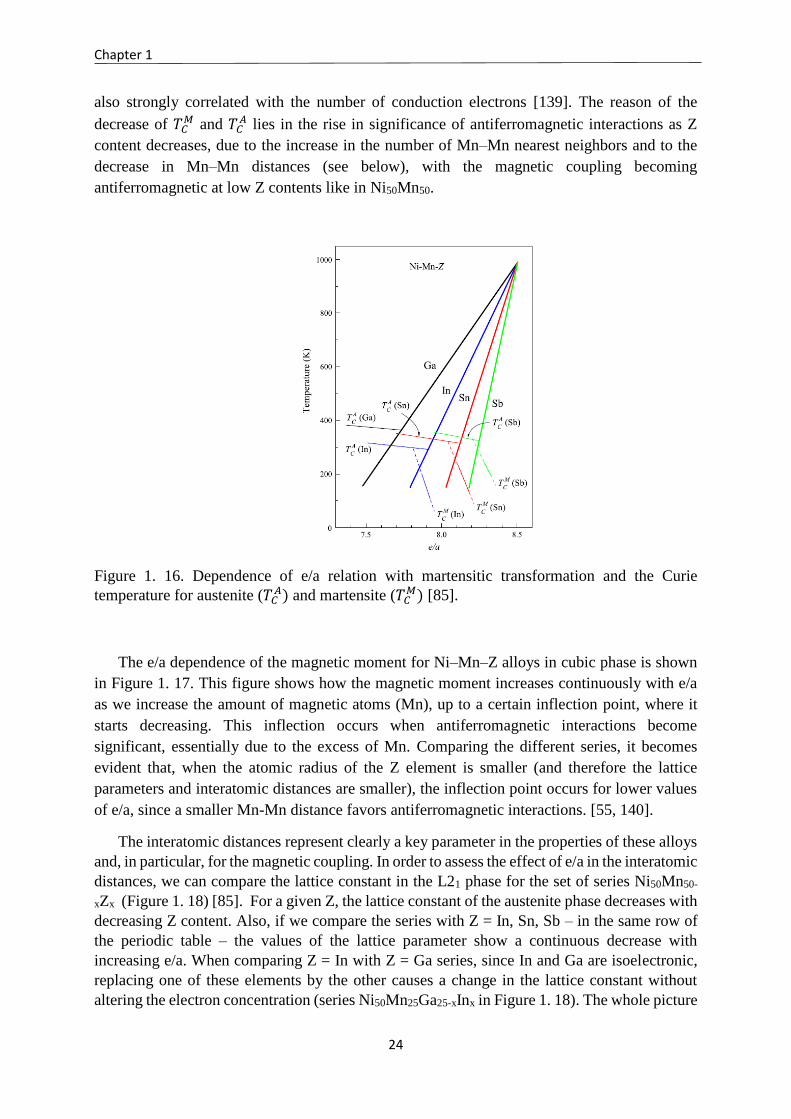
Chapter 1
24
also strongly correlated with the number of conduction electrons [139]. The reason of the
decrease of 𝑇𝐶𝑀 and 𝑇𝐶
𝐴 lies in the rise in significance of antiferromagnetic interactions as Z
content decreases, due to the increase in the number of Mn–Mn nearest neighbors and to the
decrease in Mn–Mn distances (see below), with the magnetic coupling becoming
antiferromagnetic at low Z contents like in Ni50Mn50.
Figure 1. 16. Dependence of e/a relation with martensitic transformation and the Curie
temperature for austenite (𝑇𝐶𝐴) and martensite (𝑇𝐶
𝑀) [85].
The e/a dependence of the magnetic moment for Ni–Mn–Z alloys in cubic phase is shown
in Figure 1. 17. This figure shows how the magnetic moment increases continuously with e/a
as we increase the amount of magnetic atoms (Mn), up to a certain inflection point, where it
starts decreasing. This inflection occurs when antiferromagnetic interactions become
significant, essentially due to the excess of Mn. Comparing the different series, it becomes
evident that, when the atomic radius of the Z element is smaller (and therefore the lattice
parameters and interatomic distances are smaller), the inflection point occurs for lower values
of e/a, since a smaller Mn-Mn distance favors antiferromagnetic interactions. [55, 140].
The interatomic distances represent clearly a key parameter in the properties of these alloys
and, in particular, for the magnetic coupling. In order to assess the effect of e/a in the interatomic
distances, we can compare the lattice constant in the L21 phase for the set of series Ni50Mn50-
xZx (Figure 1. 18) [85]. For a given Z, the lattice constant of the austenite phase decreases with
decreasing Z content. Also, if we compare the series with Z = In, Sn, Sb – in the same row of
the periodic table – the values of the lattice parameter show a continuous decrease with
increasing e/a. When comparing Z = In with Z = Ga series, since In and Ga are isoelectronic,
replacing one of these elements by the other causes a change in the lattice constant without
altering the electron concentration (series Ni50Mn25Ga25-xInx in Figure 1. 18). The whole picture
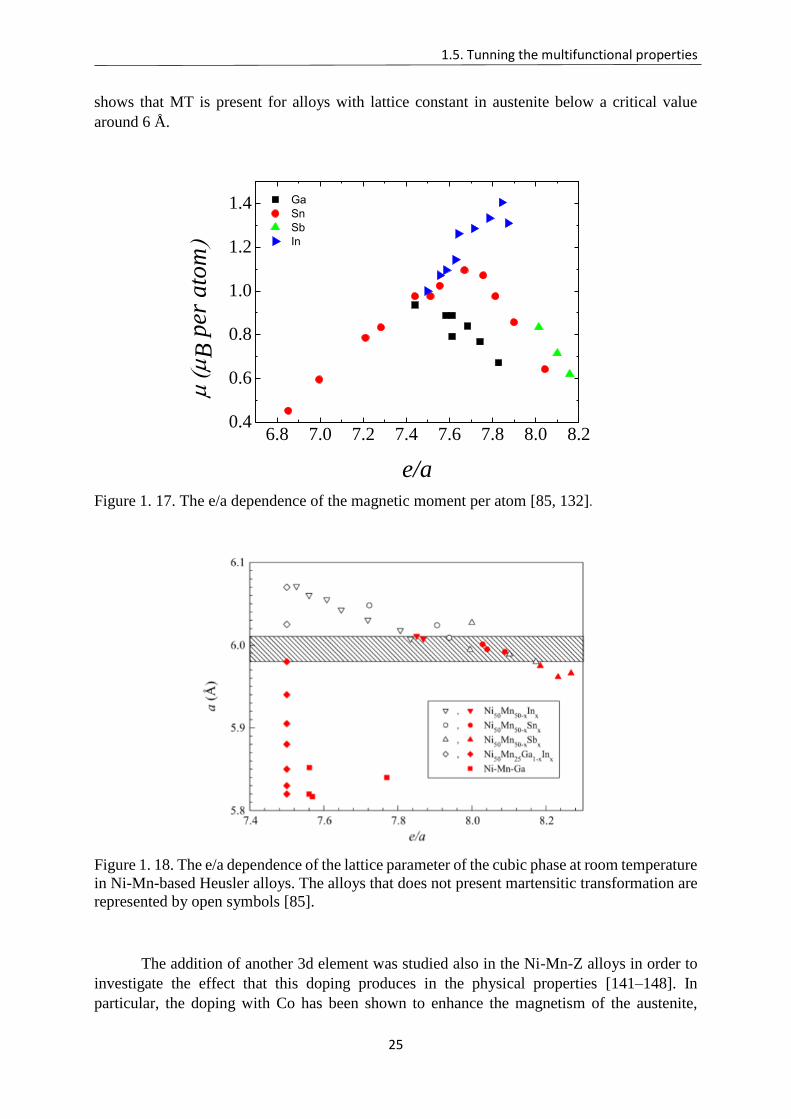
1.5. Tunning the multifunctional properties
25
shows that MT is present for alloys with lattice constant in austenite below a critical value
around 6 Å.
6.8 7.0 7.2 7.4 7.6 7.8 8.0 8.20.4
0.6
0.8
1.0
1.2
1.4
Ga
Sn
Sb
In
B p
er a
tom
e/a
Figure 1. 17. The e/a dependence of the magnetic moment per atom [85, 132].
Figure 1. 18. The e/a dependence of the lattice parameter of the cubic phase at room temperature
in Ni-Mn-based Heusler alloys. The alloys that does not present martensitic transformation are
represented by open symbols [85].
The addition of another 3d element was studied also in the Ni-Mn-Z alloys in order to
investigate the effect that this doping produces in the physical properties [141–148]. In
particular, the doping with Co has been shown to enhance the magnetism of the austenite,
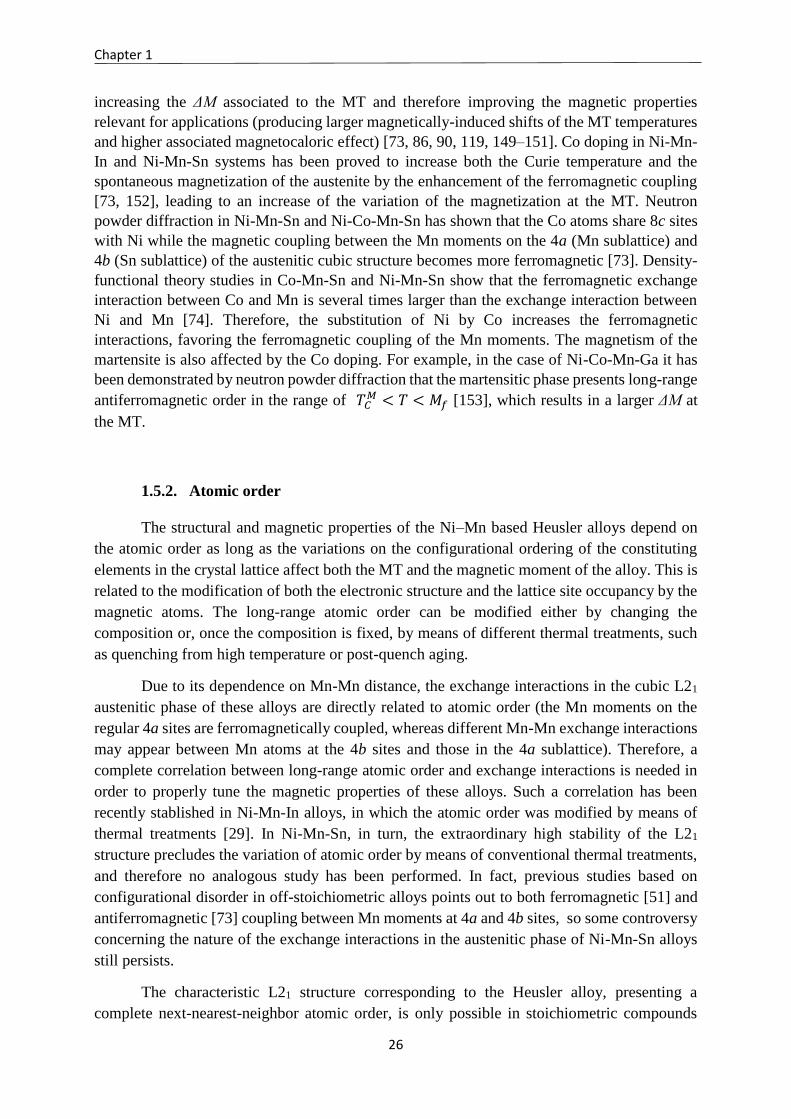
Chapter 1
26
increasing the ΔM associated to the MT and therefore improving the magnetic properties
relevant for applications (producing larger magnetically-induced shifts of the MT temperatures
and higher associated magnetocaloric effect) [73, 86, 90, 119, 149–151]. Co doping in Ni-Mn-
In and Ni-Mn-Sn systems has been proved to increase both the Curie temperature and the
spontaneous magnetization of the austenite by the enhancement of the ferromagnetic coupling
[73, 152], leading to an increase of the variation of the magnetization at the MT. Neutron
powder diffraction in Ni-Mn-Sn and Ni-Co-Mn-Sn has shown that the Co atoms share 8c sites
with Ni while the magnetic coupling between the Mn moments on the 4a (Mn sublattice) and
4b (Sn sublattice) of the austenitic cubic structure becomes more ferromagnetic [73]. Density-
functional theory studies in Co-Mn-Sn and Ni-Mn-Sn show that the ferromagnetic exchange
interaction between Co and Mn is several times larger than the exchange interaction between
Ni and Mn [74]. Therefore, the substitution of Ni by Co increases the ferromagnetic
interactions, favoring the ferromagnetic coupling of the Mn moments. The magnetism of the
martensite is also affected by the Co doping. For example, in the case of Ni-Co-Mn-Ga it has
been demonstrated by neutron powder diffraction that the martensitic phase presents long-range
antiferromagnetic order in the range of 𝑇𝐶𝑀 < 𝑇 < 𝑀𝑓 [153], which results in a larger ΔM at
the MT.
1.5.2. Atomic order
The structural and magnetic properties of the Ni–Mn based Heusler alloys depend on
the atomic order as long as the variations on the configurational ordering of the constituting
elements in the crystal lattice affect both the MT and the magnetic moment of the alloy. This is
related to the modification of both the electronic structure and the lattice site occupancy by the
magnetic atoms. The long-range atomic order can be modified either by changing the
composition or, once the composition is fixed, by means of different thermal treatments, such
as quenching from high temperature or post-quench aging.
Due to its dependence on Mn-Mn distance, the exchange interactions in the cubic L21
austenitic phase of these alloys are directly related to atomic order (the Mn moments on the
regular 4a sites are ferromagnetically coupled, whereas different Mn-Mn exchange interactions
may appear between Mn atoms at the 4b sites and those in the 4a sublattice). Therefore, a
complete correlation between long-range atomic order and exchange interactions is needed in
order to properly tune the magnetic properties of these alloys. Such a correlation has been
recently stablished in Ni-Mn-In alloys, in which the atomic order was modified by means of
thermal treatments [29]. In Ni-Mn-Sn, in turn, the extraordinary high stability of the L21
structure precludes the variation of atomic order by means of conventional thermal treatments,
and therefore no analogous study has been performed. In fact, previous studies based on
configurational disorder in off-stoichiometric alloys points out to both ferromagnetic [51] and
antiferromagnetic [73] coupling between Mn moments at 4a and 4b sites, so some controversy
concerning the nature of the exchange interactions in the austenitic phase of Ni-Mn-Sn alloys
still persists.
The characteristic L21 structure corresponding to the Heusler alloy, presenting a
complete next-nearest-neighbor atomic order, is only possible in stoichiometric compounds
1.5. Tunning the multifunctional properties
27
Ni2-Mn-Z (Z= Ga, In, Sn, Sb), in which all atoms are located in its own sublattice. The first
studies on the influence of the atomic order on the MT were carried out by Kreissl et. al. on the
Ni2MnGa compound. In this analysis they quenched the alloy from 1073 K and 1273K showing
a shift of ~100K to lower temperature in the MT temperature for the alloy quenched from higher
temperature, accompanied by a reduction in the ferromagnetic moment [21, 154].
Several systematic studies have been performed in Ni-Mn-Z alloys out of the stoichiometry,
aiming at determining the long-range atomic order and its dependence on thermal treatments.
In this sense, neutron powder thermo-diffraction measurements have been proven to be a
powerful tool to quantify the atomic order from the analysis of the integrated intensity of the
(111) and (200) reflections, which correspond to L21 and B2 structure, respectively [155]. In
fact, the order parameter corresponding to the L21 structure, L21 (which ranges from 0, for the
B2 structure, to 1, for the maximum next-nearest-neighbor atomic order), can be assumed as
L21 (I(111))1/2 [155].
In the case of Ni-Mn-Ga, Sanchez-Alarcos et. al. [26, 28, 156] analyzed the effect of the
thermal treatments and its relation with the atomic order in two different ways: i) by quenching
the alloy from different temperatures and ii) by post-quenching aging treatments at moderate
temperatures. Both types of thermal treatment produce changes in the long-range atomic order
of the alloy, retaining different degrees of disorder by quenching or recovering the order by
aging. Both kinds of treatments are equivalent since the final parameter, which controls the MT
and magnetic properties, is the degree of long-range atomic order. It was found that the MT and
Curie temperatures shift to lower temperatures after quenching from high temperatures, where
the atomic order degree is low. In the case of the post-quench aging, both critical temperatures
increase as a consequence of the recovery of atomic order. The calorimetric measurements
carried on the quenched samples have shown the presence of an exothermic peak at
temperatures around 600K linked to the recovery of the metastable quenched state. In the
second heating, this peak does not appear again, what implies the irreversibility of this process.
Neutron experiments were carried out starting from the as quenched state at room temperature
and heating up to 1173K (Figure 1. 19). A slight increase in the integrated intensity of the peak
(111), linked to L21 order, is observed in the temperature range where the exothermic process
takes place. At higher temperature, the order L21 disappears according to the order-disorder
transition L21-B2. During the second heating ramp, the integrated intensity shows the maximum
degree of long-range atomic order allowed by the stoichiometry at each temperature.
Rietveld refinement in paramagnetic austenite was carried out in both states, before and
after heating the alloy to 1173K, and the result revealed a small amount of Ga atoms ~0.5% in
Mn sublattice displacing the same amount of Mn to the Ga sublattice for the as-quench sample;
this disorder induced by quenching treatments is recovered on further heating. The migration
of Mn – the main responsible of the magnetic behavior – to its own sublattice produces an
increment in the ferromagnetic coupling. This increment in the ferromagnetic coupling is the
cause of the increment of the saturation magnetization and the shift of the magnetic ordering to
higher temperatures. In the case of Ni-Mn-Ga, the effect of atomic order is particularly
pronounced for the martensitic structure, stabilizing this structure with respect to austenite. The
final result is an increase of the MT temperature as consequence of the atomic ordering [20, 26,
140, 157].
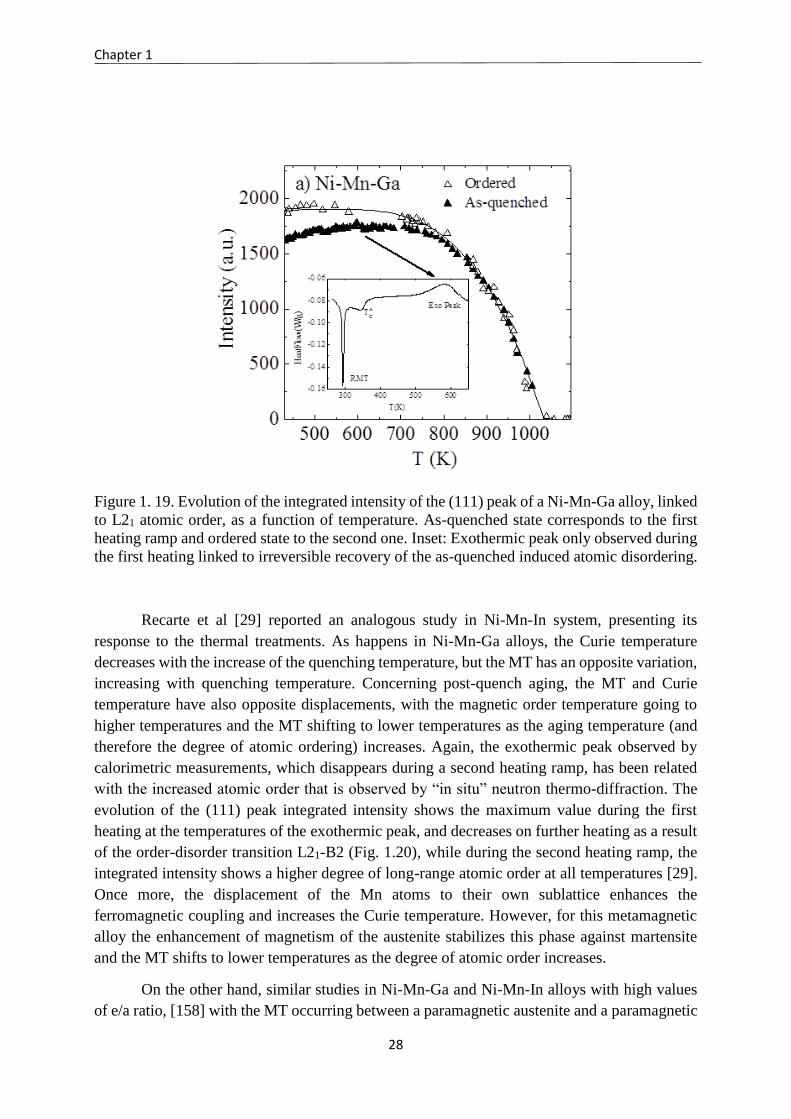
Chapter 1
28
Figure 1. 19. Evolution of the integrated intensity of the (111) peak of a Ni-Mn-Ga alloy, linked
to L21 atomic order, as a function of temperature. As-quenched state corresponds to the first
heating ramp and ordered state to the second one. Inset: Exothermic peak only observed during
the first heating linked to irreversible recovery of the as-quenched induced atomic disordering.
Recarte et al [29] reported an analogous study in Ni-Mn-In system, presenting its
response to the thermal treatments. As happens in Ni-Mn-Ga alloys, the Curie temperature
decreases with the increase of the quenching temperature, but the MT has an opposite variation,
increasing with quenching temperature. Concerning post-quench aging, the MT and Curie
temperature have also opposite displacements, with the magnetic order temperature going to
higher temperatures and the MT shifting to lower temperatures as the aging temperature (and
therefore the degree of atomic ordering) increases. Again, the exothermic peak observed by
calorimetric measurements, which disappears during a second heating ramp, has been related
with the increased atomic order that is observed by “in situ” neutron thermo-diffraction. The
evolution of the (111) peak integrated intensity shows the maximum value during the first
heating at the temperatures of the exothermic peak, and decreases on further heating as a result
of the order-disorder transition L21-B2 (Fig. 1.20), while during the second heating ramp, the
integrated intensity shows a higher degree of long-range atomic order at all temperatures [29].
Once more, the displacement of the Mn atoms to their own sublattice enhances the
ferromagnetic coupling and increases the Curie temperature. However, for this metamagnetic
alloy the enhancement of magnetism of the austenite stabilizes this phase against martensite
and the MT shifts to lower temperatures as the degree of atomic order increases.
On the other hand, similar studies in Ni-Mn-Ga and Ni-Mn-In alloys with high values
of e/a ratio, [158] with the MT occurring between a paramagnetic austenite and a paramagnetic
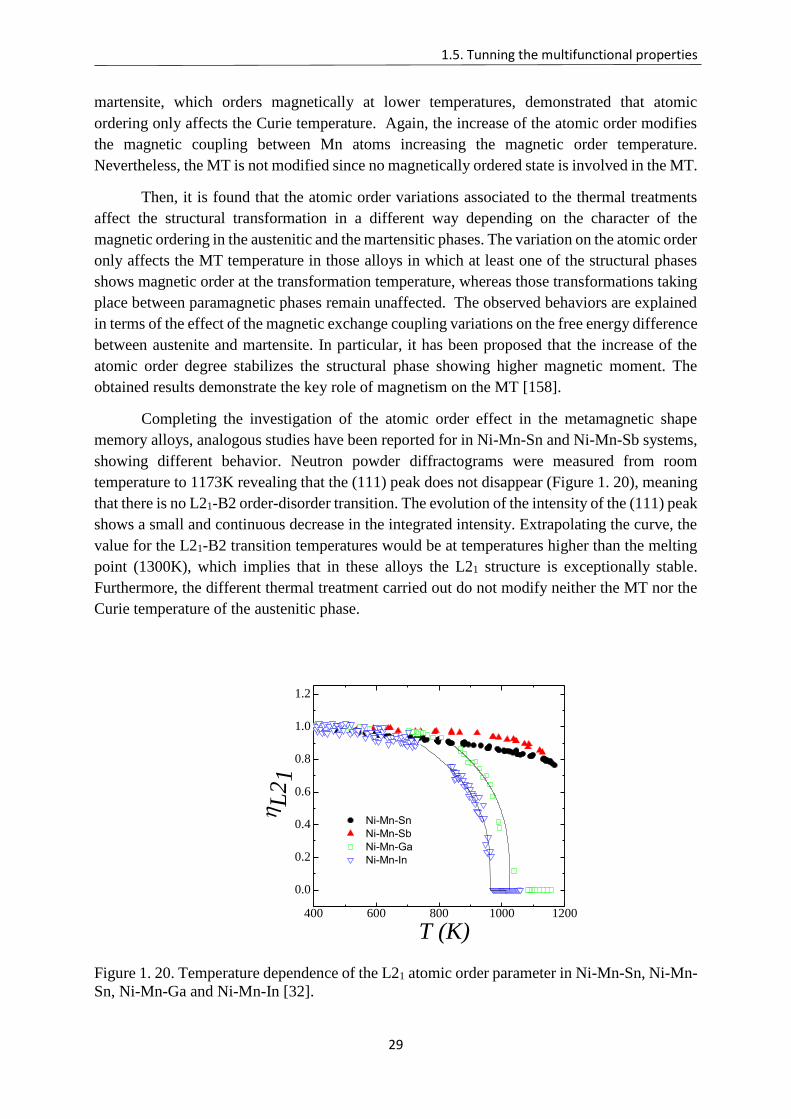
1.5. Tunning the multifunctional properties
29
martensite, which orders magnetically at lower temperatures, demonstrated that atomic
ordering only affects the Curie temperature. Again, the increase of the atomic order modifies
the magnetic coupling between Mn atoms increasing the magnetic order temperature.
Nevertheless, the MT is not modified since no magnetically ordered state is involved in the MT.
Then, it is found that the atomic order variations associated to the thermal treatments
affect the structural transformation in a different way depending on the character of the
magnetic ordering in the austenitic and the martensitic phases. The variation on the atomic order
only affects the MT temperature in those alloys in which at least one of the structural phases
shows magnetic order at the transformation temperature, whereas those transformations taking
place between paramagnetic phases remain unaffected. The observed behaviors are explained
in terms of the effect of the magnetic exchange coupling variations on the free energy difference
between austenite and martensite. In particular, it has been proposed that the increase of the
atomic order degree stabilizes the structural phase showing higher magnetic moment. The
obtained results demonstrate the key role of magnetism on the MT [158].
Completing the investigation of the atomic order effect in the metamagnetic shape
memory alloys, analogous studies have been reported for in Ni-Mn-Sn and Ni-Mn-Sb systems,
showing different behavior. Neutron powder diffractograms were measured from room
temperature to 1173K revealing that the (111) peak does not disappear (Figure 1. 20), meaning
that there is no L21-B2 order-disorder transition. The evolution of the intensity of the (111) peak
shows a small and continuous decrease in the integrated intensity. Extrapolating the curve, the
value for the L21-B2 transition temperatures would be at temperatures higher than the melting
point (1300K), which implies that in these alloys the L21 structure is exceptionally stable.
Furthermore, the different thermal treatment carried out do not modify neither the MT nor the
Curie temperature of the austenitic phase.
400 600 800 1000 1200
0.0
0.2
0.4
0.6
0.8
1.0
1.2
Ni-Mn-Sn
Ni-Mn-Sb
Ni-Mn-Ga
Ni-Mn-In
L
21
T (K)
Figure 1. 20. Temperature dependence of the L21 atomic order parameter in Ni-Mn-Sn, Ni-Mn-
Sn, Ni-Mn-Ga and Ni-Mn-In [32].
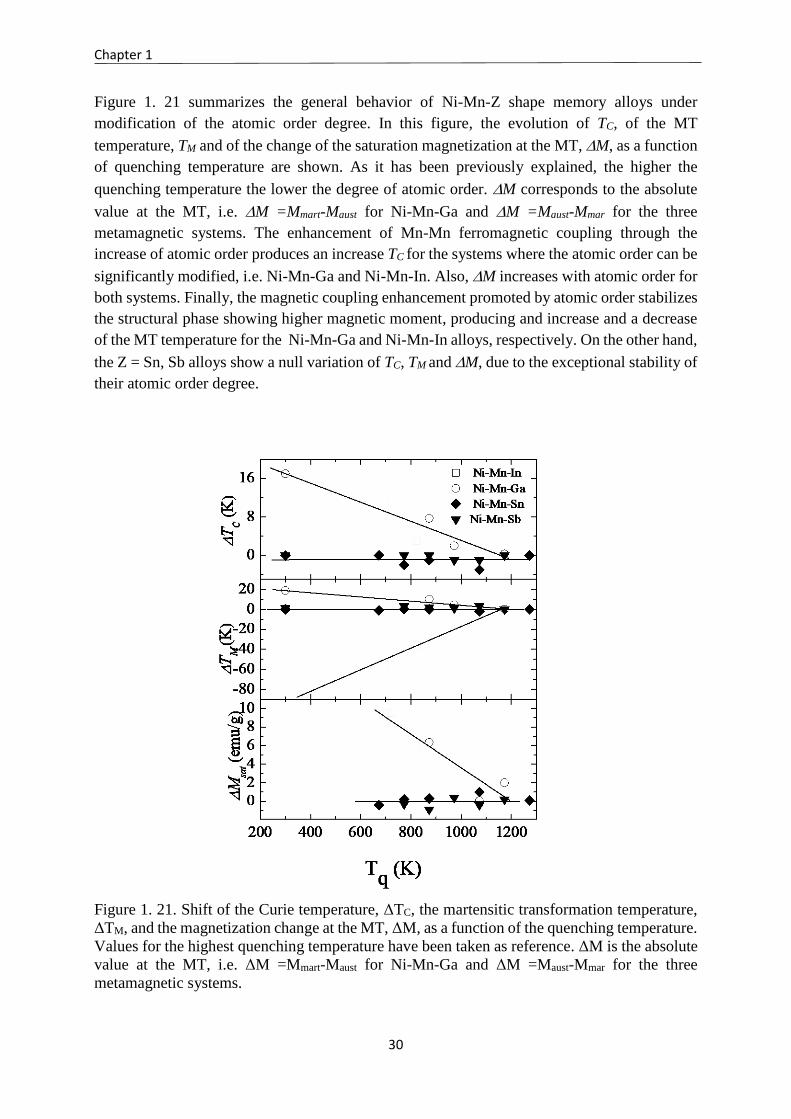
Chapter 1
30
Figure 1. 21 summarizes the general behavior of Ni-Mn-Z shape memory alloys under
modification of the atomic order degree. In this figure, the evolution of TC, of the MT
temperature, TM and of the change of the saturation magnetization at the MT, M, as a function
of quenching temperature are shown. As it has been previously explained, the higher the
quenching temperature the lower the degree of atomic order. M corresponds to the absolute
value at the MT, i.e. M =Mmart-Maust for Ni-Mn-Ga and M =Maust-Mmar for the three
metamagnetic systems. The enhancement of Mn-Mn ferromagnetic coupling through the
increase of atomic order produces an increase TC for the systems where the atomic order can be
significantly modified, i.e. Ni-Mn-Ga and Ni-Mn-In. Also, M increases with atomic order for
both systems. Finally, the magnetic coupling enhancement promoted by atomic order stabilizes
the structural phase showing higher magnetic moment, producing and increase and a decrease
of the MT temperature for the Ni-Mn-Ga and Ni-Mn-In alloys, respectively. On the other hand,
the Z = Sn, Sb alloys show a null variation of TC, TM and M, due to the exceptional stability of
their atomic order degree.
Figure 1. 21. Shift of the Curie temperature, ΔTC, the martensitic transformation temperature,
ΔTM, and the magnetization change at the MT, ΔM, as a function of the quenching temperature.
Values for the highest quenching temperature have been taken as reference. ΔM is the absolute
value at the MT, i.e. ΔM =Mmart-Maust for Ni-Mn-Ga and ΔM =Maust-Mmar for the three
metamagnetic systems.
1.5. Tunning the multifunctional properties
31
1.5.3. Microstructure
The microstructure of the alloy may also affect the magnetostructural properties of
metamagnetic shape memory alloys as long as the variations in the microstructural parameters
(grain size, vacancies, grain boundaries, dislocations, internal stresses, precipitates, antiphase
boundaries, etc …) may result in a local modification of composition, interatomic distances or
atomic order. The influence of microstructure is especially interesting in Ni-Mn-Sn and Ni-Mn-
Sb alloys, in which the L21 structure is highly stable and the atomic order is then hardly
modifiable by means of conventional thermal treatments [32]. In these alloys, the modification
of the microstructural parameters appears as the only way to modify the functional properties
for a selected alloy composition.
Mechanical milling and subsequent annealing treatments are among the simplest and
most used methods to modify the microstructure. Typically, the grain size reduction and the
presence of defects and internal stresses induced by milling degrade the MT and the magnetic
properties, which can be then partially restored upon microstructural recovery processes
brought by subsequent annealing [68, 83, 159–162]. Even though the grain size and the state of
internal tensions are known to be two parameters highly influencing the characteristics of the
MT through the variation of the elastic energy term [163], up to now, less work has been
devoted to the analysis of the MT and the magnetic properties at reduced sizes tending to
nanoscale. In this sense, it has been recently proposed that below a critical size, shape memory
alloy nanoparticles show non hysteretic behavior [164]. Taking into account that the
transformation hysteresis linked to a first order transition is an important drawback for
magnetocaloric applications, nanoparticle alloys seem to be a promising alternative procedure
to improve simultaneously the mechanical behavior (see below) and the MCE required for
refrigeration systems.
On the other hand, one of the main drawbacks of the metamagnetic shape memory alloys is
the poor mechanical properties they show. These alloys are very brittle and difficult to handle,
and cracks form very easily when the crystal is being thermally cycled through the phase
transformation [165, 166]. Alloys in form of films, ribbons, wires or foams [167–170] have
been studied as an alternative to overcome the mechanical limitations of the bulk material. In
particular, the integration of powder alloys into a polymer to form composites has been found
to be especially interesting for the development of magnetically-controlled dampers and
actuators. Such composites may show low cost, large mechanical energy absorption and good
mechanical properties [171, 172]. In this case, a previous complete characterization of the
powder alloy is needed in order to properly tune the response of the composites.
Ball milling technique is one of the simplest and cheapest methods to produce
nanostructured materials. The use of ball milling as a reduction method to nanoscale size has
been studied in multiple systems, and interesting physical and chemical phenomena have been
Chapter 1
32
found to appear. A considerable modification of the magnetic behavior and the synthesis of new
phases have been reported [173–175]. For instance, the reduction in the size of particles by ball
milling may optimize the MCE in different magnetic systems, either by increasing the
temperature range [176] or by reducing the hysteretic losses linked to a magnetostructural first
order transformation [177]. On the other hand, together with grain size reduction, ball milling
produces a huge amount of defects (vacancies, dislocations, chemical disorder, strains…) in the
material. A proper analysis of the milled powder may therefore provide valuable information
concerning the influence of those defects on both the MT and the magnetic properties.
The effect of ball milling on the magnetostructural properties has been studied in Ni-Mn-
Ga, where the effect of thermal treatments has been widely characterized and different
sequences of structural transition (different from those in the corresponding bulk) have been
found in the achieved nanoparticles [178–181]. Likewise, nanoparticles of Ni-Mn-Sn and Ni-
Mn-In have been recently obtained by ball milling [159, 161, 182, 183]. As in Ni-Mn-Ga,
atomic disorder and lattice strain inhibit the MT in the as-milled alloys, while post-mill
annealing treatments are needed to restore the MT. A significant influence of annealing on the
ferromagnetic exchange interaction, exchange bias and MCE, has been also reported in these
alloys. In any case, a systematic study of the effect of mechanically-induced microstructural
defects on the structural and magnetic properties of metamagnetic shape memory alloys is still
absent.
1.6. OBJECTIVES AND THESIS STRUCTURE
The aim of this thesis is the study of routes to obtain improved magnetostructural properties
in metamagnetic shape memory alloys, mainly through the modification of the microstructural
parameters. This thesis is organized in seven chapters including an introduction, the techniques
used and all the results. In this way, Chapter 1 provides a general introduction to the main
concepts and a summary of the most relevant work related with the topic of the thesis published
up to the present date. Chapter 2 explains the different experimental techniques employed
during this thesis, starting from the synthesis of the alloys and the mechanical and thermal
treatments performed in the samples, following with the macroscopic (calorimetric and
magnetic) characterization, and finishing with the microscopic study, mainly through
diffraction experiments. The results obtained during this research are reported in Chapters 3, 4,
5 and 6, structured as follows:
Correlation between microstructure and magnetostructural properties in Ni-Mn-Sn
system. Characterization of the microstructure induced by thermo-mechanical
treatments and its relation with the properties of the alloys (particularly the magneto-
caloric effect). (Chapter 3)
Improvement of magnetostructural properties by Co addition. Correlation between
microstructure and magnetostructural properties in Ni-Mn-Sn-Co system. Improvement
of magnetocaloric effect in a Ni-Mn-Sn-Co alloy subjected to soft milling. Evolution of
1.6. Objectives and thesis structures
33
the microstructural parameters and the magnetostructural properties with the milling
time. (Chapter 4)
Understanding the effect of Co-doping in the magnetic coupling using the Ni-Mn-In
system as case study. (Chapter 5)
Study of the recrystallization process in Co doped Ni-Mn-In and Ni-Mn-Sn alloys
amorphized by milling. (Chapter 6)
Chapter 3 is divided in three parts. The first part consists in obtaining the microstructural
parameters of a Ni50Mn35Sn15 alloy subjected to different thermal treatments after hand-milling
in agate mortar by using laboratory X-rays and its magnetic characterization, relating the defects
on the sample with the internal strains state induced by the milling and annealing processes. In
the second part, the crystal and magnetic structures of the alloys were obtained by powder
neutron diffraction, allowing relating the magnetocaloric effect with the magnetic coupling in
austenite and martensite. In the last part, Mössbauer spectroscopy was used to complete the
magnetic characterization on the sample set, showing that it is possible to use this technique to
characterize the microstructure. In Chapter 4, the magnetostructural properties were studied in
Ni45Co5Mn35Sn15 alloy in milled and in annealed samples, showing an improvement of the
magnetostructural properties by Co addition and an improved magnetocaloric effect in the soft-
milled alloy. Due to this unconventional result, a systematic study on the microstructure was
undergone by mechanical ball-milling, showing the evolution of the microstructural parameters
and the magnetostructural properties with the milling time. The microstructure parameters were
analyzed by powder diffraction using synchrotron radiation. In Chapter 5, the atomic order and
the magnetic structure for Ni50Mn34In16 and Ni45Co5Mn37In13 alloys with two different thermal
treatments were studied by neutron diffraction in order to understand the effect of thermal
treatments and Co-doping on the austenite magnetism. Polarized neutron single-crystal
diffraction in Ni45Co5Mn37In13 contributes to clarify the interaction pathways between the
different atomic positions in the high temperature phase. Since long milling times lead to
amorphous states, the recrystallization processes have been studied in Chapter 6, with the
analysis of the evolution of the different phases, the cell parameters and the parameters as grain
size, micro and macrostrains. Finally, a summary of the main conclusions is presented in
Chapter 7.
Chapter 1
34
Bibliography.
[1] C. M. Wayman, Introduction to the crystallography of martensitic transformations. New
York: Macmillan, 1964.
[2] M. Cohen, Proceedings of the International Conference on Martensitic Transformations:
ICOMAT 1979 : Cambridge, Massachusetts, 24-29 June, 1979. Department of Materials
Science and Engineering, MIT, 1979.
[3] Z. Nishiyama, Martensitic Transformation. Elsevier, 2012.
[4] K. Otsuka, C. M. Wayman, Shape Memory Materials-Cambridge University Press (1998)
| Shape Memory Alloy | Crystal Structure.
[5] C. M. Wayman, Physical Metallurgy, Elsevier Science publisher BV. R. W. Cahn, P.
Haasen, 1983.
[6] C. M. Wayman, Engineering Aspects of Shape Memory Alloys, Butterworth-Heinemann
Ldt. T. W, Duering, K.N Melton, D. Stöckel, C. M. Wayman, 1990.
[7] K Bhattacharya, Microstructure of Martensite, Oxford University Press. A. P. Sutton, R. E.
Rudd, 2003.
[8] J. W. Christian, The theory of transformations in metals and alloys, Pergarmon Press.
Oxford, 1975.
[9] Q.-P. Sun, IUTAM Symposium on Mechanics of Martensitic Phase Transformation in
Solids. Springer Science & Business Media, 2013.
[10] A. A. Cherechukin, V. V. Khovailo, R. V. Koposov, E. P. Krasnoperov, T. Takagi, and
J. Tani, “Training of the Ni–Mn–Fe–Ga ferromagnetic shape-memory alloys due cycling
in high magnetic field,” J. Magn. Magn. Mater., vol. 258–259, pp. 523–525, Mar. 2003.
[11] L. Contardo and G. Guénin, “Training and two way memory effect in Cu-Zn-Al alloy,”
Acta Metall. Mater., vol. 38, no. 7, pp. 1267–1272, Jul. 1990.
[12] M. Kohl, Shape Memory Microactuators. Springer Science & Business Media, 2013.
[13] N. B. Morgan, “Medical shape memory alloy applications—the market and its
products,” Mater. Sci. Eng. A, vol. 378, no. 1, pp. 16–23, Jul. 2004.
[14] S. A. Shabalovskaya, “On the nature of the biocompatibility and on medical applications
of NiTi shape memory and superelastic alloys,” Biomed. Mater. Eng., vol. 6, no. 4, pp. 267–
289, Jan. 1996.
[15] L. G. Machado and M. A. Savi, “Medical applications of shape memory alloys,” Braz.
J. Med. Biol. Res., vol. 36, no. 6, pp. 683–691, Jun. 2003.
[16] G. Song, N. Ma, and H.-N. Li, “Applications of shape memory alloys in civil structures,”
Eng. Struct., vol. 28, no. 9, pp. 1266–1274, Jul. 2006.
Bibliography
35
[17] T. W. Duerig, K. N. Melton, and D. Stöckel, Engineering Aspects of Shape Memory
Alloys. Butterworth-Heinemann, 2013.
[18] H. Fu, S. Song, L. Zhuo, Z. Zhang, and J. Xie, “Enhanced mechanical properties of
polycrystalline Cu–Al–Ni alloy through grain boundary orientation and composition
control,” Mater. Sci. Eng. A, vol. 650, pp. 218–224, Jan. 2016.
[19] F. A. Hames, “Ferromagnetic-Alloy Phases Near the Compositions Ni2MnIn,
Ni2MnGa, Co2MnGa, Pd2MnSb, and PdMnSb,” J. Appl. Phys., vol. 31, no. 5, pp. S370–
S371, May 1960.
[20] M. L. Richard et al., “Chemical order in off-stoichiometric Ni–Mn–Ga ferromagnetic
shape-memory alloys studied with neutron diffraction,” Philos. Mag., vol. 87, no. 23, pp.
3437–3447, Aug. 2007.
[21] M. Kreissl, K.-U. Neumann, T. Stephens, and K. R. A. Ziebeck, “The influence of
atomic order on the magnetic and structural properties of the ferromagnetic shape memory
compound Ni 2 MnGa,” J. Phys. Condens. Matter, vol. 15, no. 22, p. 3831, 2003.
[22] W. Ito, M. Nagasako, R. Y. Umetsu, R. Kainuma, T. Kanomata, and K. Ishida, “Atomic
ordering and magnetic properties in the Ni45Co5Mn36.7In13.3 metamagnetic shape
memory alloy,” Appl. Phys. Lett., vol. 93, no. 23, p. 232503, Dec. 2008.
[23] R. W. Overholser, M. Wuttig, and D. A. Neumann, “Chemical ordering in Ni-Mn-Ga
Heusler alloys,” Scr. Mater., vol. 40, no. 10, pp. 1095–1102, Apr. 1999.
[24] D. L. Schlagel, R. W. McCallum, and T. A. Lograsso, “Influence of solidification
microstructure on the magnetic properties of Ni–Mn–Sn Heusler alloys,” J. Alloys Compd.,
vol. 463, no. 1, pp. 38–46, Sep. 2008.
[25] V. V. Khovailo, T. Takagi, A. N. Vasilev, H. Miki, M. Matsumoto, and R. Kainuma,
“On Order–Disorder (L21 → B2′) Phase Transition in Ni2+xMn1—xGa Heusler Alloys,”
Phys. Status Solidi A, vol. 183, no. 2, pp. R1–R3, 2001.
[26] V. Sánchez-Alarcos, V. Recarte, J. I. Pérez-Landazábal, and G. J. Cuello, “Correlation
between atomic order and the characteristics of the structural and magnetic transformations
in Ni–Mn–Ga shape memory alloys,” Acta Mater., vol. 55, no. 11, pp. 3883–3889, Jun.
2007.
[27] T. Miyamoto, W. Ito, R. Y. Umetsu, R. Kainuma, T. Kanomata, and K. Ishida, “Phase
stability and magnetic properties of Ni50Mn50−xInx Heusler-type alloys,” Scr. Mater., vol.
62, no. 3, pp. 151–154, Feb. 2010.
[28] V. Sánchez-Alarcos, J. I. Pérez-Landazábal, and V. Recarte, “Influence of Long-Range
Atomic Order on the Structural and Magnetic Properties of Ni-Mn-Ga Ferromagnetic Shape
Memory Alloys,” Materials Science Forum, Vol. 684, pp. 85-103, 2011.
[29] V. Recarte, J. Pérez-Landazábal, V. Sánchez-Alarcos, and J. A. Rodriguez-Velamazán,
“Dependence of the martensitic transformation and magnetic transition on the atomic order
36
in Ni–Mn–In metamagnetic shape memory alloys,” Acta Mater., vol. 60, pp. 1937–1945,
Mar. 2012.
[30] V. Sánchez-Alarcos, V. Recarte, J.I. Pérez-Landazábal, S. Larumbe, R. Caballero-
Flores, I. Unzueta, J.A. García, F. Plazaola, J.A. Rodríguez-Velamazán, “Mechanically
induced disorder and crystallization process in Ni-Mn-In ball-milled alloys,” J. Alloys
Compd., vol. 689, pp. 983–991, Dec. 2016.
[31] V. Sánchez-Alarcos, V. Recarte, J. I. Pérez-Landazábal, E. Cesari, and J. A. Rodríguez-
Velamazán, “Long-Range Atomic Order and Entropy Change at the Martensitic
Transformation in a Ni-Mn-In-Co Metamagnetic Shape Memory Alloy,” Entropy, vol. 16,
no. 5, pp. 2756–2767, May 2014.
[32] V. Sánchez-Alarcos, J. I. Pérez-Landazábal, V. Recarte, I. Lucia, J. Vélez, and J. A.
Rodríguez-Velamazán, “Effect of high-temperature quenching on the magnetostructural
transformations and the long-range atomic order of Ni–Mn–Sn and Ni–Mn–Sb
metamagnetic shape memory alloys,” Acta Mater., vol. 61, no. 12, pp. 4676–4682, Jul.
2013.
[33] P. J. Webster, K. R. A. Ziebeck, S. L. Town, and M. S. Peak, “Magnetic order and phase
transformation in Ni2MnGa,” Philos. Mag. B, vol. 49, no. 3, pp. 295–310, Mar. 1984.
[34] A. Planes and L. Mañosa, “Vibrational properties of shape-memory alloys,” in Solid
State Physics, vol. 55, H. Ehrenreich and F. Spaepen, Eds. Academic Press, 2001, pp. 159–
267.
[35] S. Fujii, S. Ishida, and S. Asano, “Electronic Structure and Lattice Transformation in
Ni2MnGa and Co2NbSn,” J. Phys. Soc. Jpn., vol. 58, no. 10, pp. 3657–3665, Oct. 1989.
[36] P. J. Brown, A. Y. Bargawi, J. Crangle, K.-U. Neumann, and K. R. A. Ziebeck, “Direct
observation of a band Jahn-Teller effect in the martensitic phase transition of Ni2MnGa,”
J. Phys. Condens. Matter, vol. 11, no. 24, pp. 4715–4722, Jan. 1999.
[37] P. A. Bhobe, K. R. Priolkar, and P. R. Sarode, “Local atomic arrangement and
martensitic transformation in Ni 50 Mn 35 In 15 : an EXAFS study,” J. Phys. Appl. Phys.,
vol. 41, no. 4, p. 045004, 2008.
[38] P. A. Bhobe, K. R. Priolkar, and P. R. Sarode, “Factors influencing the martensitic
transformation in Ni 50 Mn 35 Sn 15 : an EXAFS study,” J. Phys. Condens. Matter, vol.
20, no. 1, p. 015219, 2008.
[39] A. Zheludev, S. M. Shapiro, P. Wochner, A. Schwartz, M. Wall, and L. E. Tanner,
“Phonon anomaly, central peak, and microstructures in Ni2MnGa,” Phys. Rev. B, vol. 51,
no. 17, pp. 11310–11314, May 1995.
[40] J. I. Pérez-Landazábal, V. Recarte, V. Sánchez-Alarcos, J. A. Rodríguez-Velamazán,
M. Jiménez-Ruiz, P. Link, E. Cesari, and Y. I. Chumlyakov, “Lattice dynamics and external
magnetic-field effects in Ni-Fe-Ga alloys,” Phys. Rev. B, vol. 80, no. 14, p. 144301, Oct.
2009.
Bibliography
37
[41] X. Moya, D. González-Alonso, L. Mañosa, A. Planes, V.O. Garlea, T.A. Lograsso, D.
L. Schlagel, J.L. Zarestky, S. Aksoy and M. Acet, “Lattice dynamics in magnetic
superelastic Ni-Mn-In alloys: Neutron scattering and ultrasonic experiments,” Phys. Rev.
B, vol. 79, no. 21, p. 214118, Jun. 2009.
[42] P. J. Brown, J. Crangle, T. Kanomata, M. Matsumoto, K-U. Neumann, B. Oularddiaf
and K. R. A. Ziebekck et al., “The crystal structure and phase transitions of the magnetic
shape memory compound Ni 2 MnGa,” J. Phys. Condens. Matter, vol. 14, no. 43, p. 10159,
2002.
[43] V. V. Martynov and V. V. Kokorin, “The crystal structure of thermally- and stress-
induced Martensites in Ni2MnGa single crystals,” J. Phys. III, vol. 2, no. 5, pp. 739–749,
May 1992.
[44] S. Singh, J. Bednarcik, S. R. Barman, C. Felser, and D. Pandey, “Premartensite to
martensite transition and its implications for the origin of modulation in Ni2MnGa
ferromagnetic shape-memory alloy,” Phys. Rev. B, vol. 92, no. 5, p. 054112, Aug. 2015.
[45] S. Singh, V. Petricek, Parasmani Rajput, Adrian H. Hill, E. Suard, S. R. Barman and
Dhananjai Pandey, “High-resolution synchrotron x-ray powder diffraction study of the
incommensurate modulation in the martensite phase of Ni2MnGa: Evidence for nearly 7M
modulation and phason broadening,” Phys. Rev. B, vol. 90, no. 1, p. 014109, Jul. 2014.
[46] S. Singh, J Nayak, Abhishek Rai, Parasmani Rajput, Adrian H Hill, S R Barman and
Dhananjai Pandey, “(3 + 1)D superspace description of the incommensurate modulation in
the premartensite phase of Ni2MnGa: a high resolution synchrotron x-ray powder
diffraction study,” J. Phys. Condens. Matter, vol. 25, no. 21, p. 212203, May 2013.
[47] L. Righi, F. Albertini, G. Calestani, L. Pareti, A. Paoluzi, C. Ritter, P.A. Algarabel, L.
Morellon, M. R. Ibarra, “Incommensurate modulated structure of the ferromagnetic shape-
memory Ni2MnGa martensite,” J. Solid State Chem., vol. 179, no. 11, pp. 3525–3533, Nov.
2006.
[48] L. Righi, F. Albertini, L. Pareti, A. Paoluzi, and G. Calestani, “Commensurate and
incommensurate ‘5M’ modulated crystal structures in Ni–Mn–Ga martensitic phases,” Acta
Mater., vol. 55, no. 15, pp. 5237–5245, Sep. 2007.
[49] Y. Sutou, Y. Imano, N. Koeda, T. Omori, R. Kainuma, K. Ishida and K. Oikawa.,
“Magnetic and martensitic transformations of NiMnX(X=In,Sn,Sb) ferromagnetic shape
memory alloys,” Appl. Phys. Lett., vol. 85, no. 19, pp. 4358–4360, Nov. 2004.
[50] P. J. Brown, A.P. Gandy, K. Ishida, W. Ito, R. Kainuma, T. Kanomata, K. U. Neumann,
K. Oikawa, B. Ouladdiaf, A. Sheikh, and K. R. A. Ziebeck, “Magnetic and structural
properties of the magnetic shape memory compound Ni 2 Mn 1.48 Sb 0.52,” J. Phys.
Condens. Matter, vol. 22, no. 9, p. 096002, 2010.
[51] P. J. Brown, A.P. Gandy, K. Ishida, R. Kainuma, T. Kanomata, K. U. Neumann, K.
Oikawa, B. Ouladdiaf, and K. R. A. Ziebeck, “The magnetic and structural properties of
the magnetic shape memory compound Ni 2 Mn 1.44 Sn 0.56,” J. Phys. Condens. Matter,
vol. 18, no. 7, p. 2249, 2006.
38
[52] N. V. Rama Rao, J. A. Chelvane, V. Chandrasekaran, A. V. Morozkin, J. Lamsal, W.
B. Yelon, R. Nirmala, K. G. Suresh, and S.K. Malik, “Neutron diffraction studies on the
Heusler alloy Ni50Mn37Sb13,” J. Appl. Phys., vol. 109, no. 7, p. 07A907, Mar. 2011.
[53] T. Krenke, E. F. Wassermann, X. Moya, L. Manosa, and A. Planes, E. Suard, and B.
Oularddiaf, “Magnetic superelasticity and inverse magnetocaloric effect in Ni-Mn-In,”
Phys. Rev. B, vol. 75, no. 10, p. 104414, Mar. 2007.
[54] P. J. Brown, A.P. Gandy, R. Kainuma, T. Kanomata, K. U. Neumann, K. Oikawa, B.
Ouladdiaf, A. Sheikh, and K. R. A. Ziebeck, “The field and temperature dependence of the
magnetic and structural properties of the shape memory compound Ni 1.84 Mn 1.64 In
0.52,” J. Phys. Condens. Matter, vol. 23, no. 45, p. 456004, 2011.
[55] T. Krenke, M. Acet, E. F. Wassermann, X. Moya, L. Manosa, and A. Planes,
“Martensitic transitions and the nature of ferromagnetism in the austenitic and martensitic
states of Ni-Mn-Sn alloys,” Phys. Rev. B, vol. 72, no. 1, p. 014412, Jul. 2005.
[56] T. Krenke, M. Acet, E. F. Wassermann, X. Moya, L. Manosa, and A. Planes,
“Ferromagnetism in the austenitic and martensitic states of Ni-Mn-In alloys,” Phys. Rev. B,
vol. 73, no. 17, p. 174413, May 2006.
[57] A. Çakır, L. Righi, F. Albertini, M. Acet, and M. Farle, “Intermartensitic transitions and
phase stability in Ni50Mn50−xSnx Heusler alloys,” Acta Mater., vol. 99, pp. 140–149, Oct.
2015.
[58] B. Wedel, M. Suzuki, Y. Murakami, C. Wedel, T. Suzuki, D. Shindo, and K. Itagaki,
“Low temperature crystal structure of Ni–Mn–Ga alloys,” J. Alloys Compd., vol. 290, no.
1, pp. 137–143, Aug. 1999.
[59] D. Y. Cong, Y. D. Zhang, Y. D. Wang, M. Humbert, X. Zhao, T. Watanabe, L. Zuo, and
C. Esling, “Experiment and theoretical prediction of martensitic transformation
crystallography in a Ni–Mn–Ga ferromagnetic shape memory alloy,” Acta Mater., vol. 55,
no. 14, pp. 4731–4740, Aug. 2007.
[60] V. Sanchez-Alarcos, Perez-Landazabal, V. Recarte, C. Gomez-Polo, and J. A.
Rodriguez-Velamazan, “Correlation between composition and phase transformation
temperatures in Ni–Mn–Ga–Co ferromagnetic shape memory alloys,” Acta Mater., vol. 56,
no. 19, pp. 5370–5376, Nov. 2008.
[61] R. Ranjan, S. Banik, S. R. Barman, U. Kumar, P. K. Mukhopadhyay, and D. Pandey,
“Powder x-ray diffraction study of the thermoelastic martensitic transition in
Ni2Mn1.05Ga0.95,” Phys. Rev. B, vol. 74, no. 22, p. 224443, Dec. 2006.
[62] K. Fukushima, K. Sano, T. Kanomata, H. Nishihara, Y. Furutani, T. Shishido, W. Ito,
R. Y. Umetsu, R. Kainuma, K. Oikawa, and K. Ishida, “Phase diagram of Fe-substituted
Ni–Mn–Sn shape memory alloys,” Scr. Mater., vol. 61, no. 8, pp. 813–816, Oct. 2009.
Bibliography
39
[63] H. Yan, Y. Zhang, A. Senyshyn, H-G. Brokmeier, C. Esling, X. Zhao, and L. Zuo,
“Crystal structure determination of incommensurate modulated martensite in Ni–Mn–In
Heusler alloys,” Acta Mater., vol. 88, pp. 375–388, Apr. 2015.
[64] V. Recarte, J. I. Pérez-Landazábal, V. Sánchez-Alarcos, and J. A. Rodríguez-
Velamazán, “Study of the transformation sequence on a high temperature martensitic
transformation Ni-Mn-Ga-Co shape memory alloy,” J. Phys. Conf. Ser., vol. 549, no. 1, p.
012017, 2014.
[65] D. Y. Cong, S. Wang, Y. D. Wang, Y. Ren, L. Zuo, and C. Esling, “Martensitic and
magnetic transformation in Ni–Mn–Ga–Co ferromagnetic shape memory alloys,” Mater.
Sci. Eng. A, vol. 473, no. 1, pp. 213–218, Jan. 2008.
[66] A. K. Nayak, K. G. Suresh, and A. K. Nigam, “Correlation between reentrant spin glass
behavior and the magnetic order–disorder transition of the martensite phase in Ni–Co–Mn–
Sb Heusler alloys,” J. Phys. Condens. Matter, vol. 23, no. 41, p. 416004, Sep. 2011.
[67] S. C. Ma, C.W. shih et al., “Wheel speed-dependent martensitic transformation and
magnetocaloric effect in Ni–Co–Mn–Sn ferromagnetic shape memory alloy ribbons,” Acta
Mater., vol. 90, pp. 292–302, May 2015.
[68] X. Wang, F. Sun, J. Wang, Q. Yu, Y. Wu, H. Hua, and C. Jiang, “Influence of annealing
temperatures on the magnetostructural transition and magnetocaloric effect of
Ni40Co10Mn40Sn10 powders,” J. Alloys Compd., vol. 691, pp. 215–219, Jan. 2017.
[69] H. Yan, C Zhang, Y. Zhang, X. Wang, C. Sling, X. Xhao, and L. Zuo, “Crystallographic
insights into Ni–Co–Mn–In metamagnetic shape memory alloys,” J. Appl. Crystallogr.,
vol. 49, no. 5, pp. 1585–1592, Oct. 2016.
[70] P. J. Webster and K. R. A. Ziebeck, “1.5.5.1.2.2 Antiferromagnetic order,” in Alloys and
Compounds of d-Elements with Main Group Elements. Part 2, H. P. J. Wijn, Ed. Berlin,
Heidelberg: Springer Berlin Heidelberg, 1988, pp. 86–86.
[71] Z. Islam, D. Haskel, J.C. Lang, G. Srajer, Y. Lee, B.N. Harmon, A.I. Goldman, D.L.
Schlagel and T.A. Lograsso, “An X-ray study of non-zero nickel moment in a ferromagnetic
shape-memory alloy,” J. Magn. Magn. Mater., vol. 303, no. 1, pp. 20–25, Aug. 2006.
[72] E. Şaşıoğlu, L. M. Sandratskii, and P. Bruno, “First-principles calculation of the
intersublattice exchange interactions and Curie temperatures of the full Heusler alloys
Ni2MnX (X=Ga, In, Sn, Sb,” Phys. Rev. B, vol. 70, no. 2, p. 024427, Jul. 2004.
[73] Umetsu, R. Y, A. Sheikh, B. Ouladdiaf, K. R. A. Ziebeck, T. Kanomata, and R.
Kainuma, “The effect of Co substitution on the magnetic properties of the Heusler alloy
Ni50Mn33Sn17,” Appl. Phys. Lett., vol. 98, no. 4, p. 042507, Jan. 2011.
[74] Y. Kurtulus, R. Dronskowski, G. D. Samolyuk, and V. P. Antropov, “Electronic
structure and magnetic exchange coupling in ferromagnetic full Heusler alloys,” Phys. Rev.
B, vol. 71, no. 1, Jan. 2005.
40
[75] S. Aksoy, M. Acet, P. P. Deen, L. Mañosa, and A. Planes, “Magnetic correlations in
martensitic Ni-Mn-based Heusler shape-memory alloys: Neutron polarization analysis,”
Phys. Rev. B, vol. 79, no. 21, p. 212401, Jun. 2009.
[76] S. Aksoy, M. Acet, E. Wassermann, T. Krenke, X. Moya, L. Mañosa, A. Planes, and P.
P. Deen, “Structural properties and magnetic interactions in martensitic Ni-Mn-Sb alloys,”
Philos. Mag., vol. 89, no. 22–24, pp. 2093–2109, Aug. 2009.
[77] M. Khan, I. Dubenko, S. Stadler, and N. Ali, “Exchange bias in bulk Mn rich Ni–Mn–
Sn Heusler alloys,” J. Appl. Phys., vol. 102, no. 11, p. 113914, Dec. 2007.
[78] M. Khan, I. Dubenko, S. Stadler, and N. Ali, “Exchange bias behavior in Ni–Mn–Sb
Heusler alloys,” Appl. Phys. Lett., vol. 91, no. 7, p. 072510, Aug. 2007.
[79] Z. Li, C. Jing, J. Chen, S. Yuan, S. Cao, and J. Zhang, “Observation of exchange bias in
the martensitic state of Ni50Mn36Sn14 Heusler alloy,” Appl. Phys. Lett., vol. 91, no. 11, p.
112505, Sep. 2007.
[80] J. L. S. Llamazares, B. Hernando, J. J. Suñol, C. García, and C. A. Ross, “Kinetic arrest
of direct and reverse martensitic transformation and exchange bias effect in
Mn49.5Ni40.4In10.1 melt spun ribbons,” J. Appl. Phys., vol. 107, no. 9, p. 09A956, May
2010.
[81] J. Sharma and K. G. Suresh, “Martensitic transition, magnetic, magnetocaloric and
exchange bias properties of Fe-substituted Mn-Ni-Sn Heusler alloys,” Solid State
Commun., vol. 248, pp. 1–5, Dec. 2016.
[82] B. M. Wang, Y. Liu, L. Wang, S.L. Huang, Y. Zhao, Y. Yang, and H. Zhang, “Exchange
bias and its training effect in the martensitic state of bulk polycrystalline
Ni49.5Mn34.5In16,” J. Appl. Phys., vol. 104, no. 4, p. 043916, Aug. 2008.
[83] P. Czaja, J. Przewoźnik, M. Fitta, M. Bałanda, A. Chrobak, B. Kania, P. Zackiewicz, A.
Wójcik, M.Szlezynger, and W. Maziarz, “Effect of ball milling and thermal treatment on
exchange bias and magnetocaloric properties of Ni48Mn39.5Sn10.5Al2 ribbons,” J. Magn.
Magn. Mater., vol. 401, pp. 223–230, Mar. 2016.
[84] R. Y. Umetsu, R. Kainuma, Y. Amako, Y. Taniguchi, T. Kanomata, K. Fukushima, A.
Fujita, K. Oikawa, and K. Ishida, “Mössbauer study on martensite phase in
Ni50Mn36.5Fe0.557Sn13 metamagnetic shape memory alloy,” Appl. Phys. Lett., vol. 93,
no. 4, p. 042509, Jul. 2008.
[85] A. Planes, L. Mañosa, and M. Acet, “Magnetocaloric effect and its relation to shape-
memory properties in ferromagnetic Heusler alloys,” J. Phys. Condens. Matter, vol. 21, no.
23, p. 233201, 2009.
[86] R. Kainuma, Y. Imano, W. Ito, Y. Sutou, H. Morito, S. Okamoto, O. Kitakami, K.
Oikawa, A. Fujita, T. Kanomata, and K. Ishida, “Magnetic-field-induced shape recovery
by reverse phase transformation,” Nature, vol. 439, no. 7079, pp. 957–960, Feb. 2006.
Bibliography
41
[87] K. Oikawa, W. Ito, Y. Imano, Y. Sutou, R. Kainuma, K. Ishida, S. Okamoto, O.
Kitakami, and T. Kanomata, “Effect of magnetic field on martensitic transition of
Ni46Mn41In13 Heusler alloy,” Appl. Phys. Lett., vol. 88, no. 12, p. 122507, Mar. 2006.
[88] T. Krenke, E. Duman, M. Acet, X. Moya, L. Mañosa, and A. Planes, “Inverse
magnetocaloric effect in ferromagnetic Ni–Mn–Sn alloys,” Nat. Mater., vol. 4, no. 6, pp.
450–454, Jun. 2005.
[89] J. Du, Q. Zheng, W. J. Ren, W. J. Feng, X. G. Liu, and Z. D. Zhang, “Magnetocaloric
effect and magnetic-field-induced shape recovery effect at room temperature in
ferromagnetic Heusler alloy Ni–Mn–Sb,” J. Phys. Appl. Phys., vol. 40, no. 18, p. 5523,
2007.
[90] R. Kainuma, Y. Imano, W. Ito, H. Morito, Y. Sutou, K. Oikawa, A. Fujita, K. Ishida, S.
Okamoto, O. Kitakami, and T. Kanomata, “Metamagnetic shape memory effect in a
Heusler-type Ni43Co7Mn39Sn11 polycrystalline alloy,” Appl. Phys. Lett., vol. 88, no. 19,
p. 192513, May 2006.
[91] R. Kainuma, W. Ito, R. Y. Umetsu, K. Oikawa, and K. Ishida, “Magnetic field-induced
reverse transformation in B2-type NiCoMnAl shape memory alloys,” Appl. Phys. Lett., vol.
93, no. 9, p. 091906, Sep. 2008.
[92] G. Porcari, S. Fabbrici, C. êrnechele, F. Albertini, M. Buzzi, A. Paoluzi, J. Kamarad, Z.
Arnold, and M. Solzi, “Reverse magnetostructural transformation and adiabatic
temperature change in Co- and In-substituted Ni-Mn-Ga alloys,” Phys. Rev. B, vol. 85, no.
2, p. 024414, Jan. 2012.
[93] V. Recarte, J. I. Pérez-Landazábal, C. Gómez-Polo, E. Cesari, and J. Dutkiewicz,
“Magnetocaloric effect in Ni–Fe–Ga shape memory alloys,” Appl. Phys. Lett., vol. 88, no.
13, p. 132503, Mar. 2006.
[94] A. Tishin, A.V. Derkach, Y.I. Spichkin, M.D. Kuz´min, A. Chernyshov, K.A.
Gschneidner, and V.K. Pecharsky, “Magnetocaloric effect near a second-order magnetic
phase transition,” J. Magn. Magn. Mater., vol. 310, pp. 2800–2804, Mar. 2007.
[95] V. D. Buchelnikov and V. V. Sokolovskiy, “Magnetocaloric effect in Ni-Mn-X (X =
Ga, In, Sn, Sb) Heusler alloys,” Phys. Met. Metallogr., vol. 112, no. 7, pp. 633–665, Dec.
2011.
[96] A. Aliev, A. Batdalov, S. Bosko, V. Buchelnikov, I. Dikstein, V. Kovailo, V. Koledov,
R. Levitin, V. Shavrov, and T. Takagi, “Magnetocaloric effect and magnetization in a Ni–
Mn–Ga Heusler alloy in the vicinity of magnetostructural transition,” J. Magn. Magn.
Mater., vol. 272–276, pp. 2040–2042, May 2004.
[97] M. Khan, A. K. Pathak, M. R. Paudel, I. Dubenko, S. Stadler, and N. Ali,
“Magnetoresistance and field-induced structural transitions in Ni50Mn50−xSnx Heusler
alloys,” J. Magn. Magn. Mater., vol. 320, no. 3, pp. L21–L25, Feb. 2008.
[98] A. K. Pathak, I. Dubenko, C. Pueblo, S. Stadler, and N. Ali, “Magnetoresistance and
magnetocaloric effect at a structural phase transition from a paramagnetic martensitic state
42
to a paramagnetic austenitic state in Ni50Mn36.5In13.5 Heusler alloys,” Appl. Phys. Lett.,
vol. 96, no. 17, p. 172503, Apr. 2010.
[99] S. Singh and C. Biswas, “Magnetoresistance origin in martensitic and austenitic phases
of Ni2Mn1+xSn1−x,” Appl. Phys. Lett., vol. 98, no. 21, p. 212101, May 2011.
[100] V. K. Pecharsky and K. A. Gschneidner Jr, “Magnetocaloric effect and magnetic
refrigeration,” J. Magn. Magn. Mater., vol. 200, no. 1, pp. 44–56, Oct. 1999.
[101] S. M. Benford and G. V. Brown, “T‐S diagram for gadolinium near the Curie
temperature,” J. Appl. Phys., vol. 52, pp. 2110–2112, Apr. 1981.
[102] S. Yu. Dan’kov, A. M. Tishin, V. K. Pecharsky, and K. A. Gschneidner, “Magnetic
phase transitions and the magnetothermal properties of gadolinium,” Phys. Rev. B, vol. 57,
no. 6, pp. 3478–3490, Feb. 1998.
[103] V. K. Pecharsky and K. A. Gschneidner, Jr., “Giant Magnetocaloric Effect in Gd 5 ( Si
2 Ge 2 ),” Phys. Rev. Lett., vol. 78, no. 23, pp. 4494–4497, Jun. 1997.
[104] L. Morellon, Z. Arnold, P. A. Algarabel, C. Magen, M. R. Ibarra, and Y. Skorokhod,
“Pressure effects in the giant magnetocaloric compounds Gd 5 (Si x Ge 1− x ) 4,” J. Phys.
Condens. Matter, vol. 16, no. 9, p. 1623, 2004.
[105] P. J. von Ranke, N. A. de Oliveira, and S. Gama, “Understanding the influence of the
first-order magnetic phase transition on the magnetocaloric effect: application to
Gd5(SixGe1−x)4,” J. Magn. Magn. Mater., vol. 277, no. 1, pp. 78–83, Jun. 2004.
[106] L. Morellon, P. A. Algarabel, C. Magen, and M. R. Ibarra, “Giant magnetoresistance in
the Ge-rich magnetocaloric compound, Gd5(Si0.1Ge0.9)4,” J. Magn. Magn. Mater., vol.
237, no. 2, pp. 119–123, Dec. 2001.
[107] Z. Li, Y. Zhang, C. F. Sánchez-Valdés, J.L. Sánchez-Llamazares, C. Esling, X. Zhao,
and L. Zuo, “Giant magnetocaloric effect in melt-spun Ni-Mn-Ga ribbons with magneto-
multistructural transformation,” Appl. Phys. Lett., vol. 104, no. 4, p. 044101, Jan. 2014.
[108] J. Marcos, L. Mañosa, A. Planes, F. Casanova, X. Batlle, and A. Labarta, “Multiscale
origin of the magnetocaloric effect in Ni-Mn-Ga shape-memory alloys,” Phys. Rev. B, vol.
68, no. 9, p. 094401, Sep. 2003.
[109] X. Zhou, W. Li, H. P. Kunkel, and G. Williams, “A criterion for enhancing the giant
magnetocaloric effect: (Ni–Mn–Ga)—a promising new system for magnetic refrigeration,”
J. Phys. Condens. Matter, vol. 16, no. 6, pp. L39–L44, Feb. 2004.
[110] A. Ghosh and K. Mandal, “Effect of structural disorder on the magnetocaloric properties
of Ni-Mn-Sn alloy,” Appl. Phys. Lett., vol. 104, no. 3, p. 031905, Jan. 2014.
[111] Z. D. Han, D. H. Wang, C. L. Zhang, H. C. Xuan, B. X. Gu, and Y. W. Du, “Low-field
inverse magnetocaloric effect in Ni50−xMn39+xSn11 Heusler alloys,” Appl. Phys. Lett.,
vol. 90, no. 4, p. 042507, Jan. 2007.
Bibliography
43
[112] P. A. Bhobe, K. R. Priolkar, and A. K. Nigam, “Room temperature magnetocaloric
effect in Ni–Mn–In,” Appl. Phys. Lett., vol. 91, no. 24, p. 242503, Dec. 2007.
[113] M. Khan, N. Ali, and S. Stadler, “Inverse magnetocaloric effect in ferromagnetic
Ni50Mn37+xSb13−x Heusler alloys,” J. Appl. Phys., vol. 101, no. 5, p. 053919, Mar. 2007.
[114] Z. D. Han, D.H. Wang, C.L. Zhang, H.C. Xuan, J.R. Zhang, B.X. Gu, and Y.W. Du,
“The phase transitions, magnetocaloric effect, and magnetoresistance in Co doped Ni–Mn–
Sb ferromagnetic shape memory alloys,” J. Appl. Phys., vol. 104, no. 5, p. 053906, Sep.
2008.
[115] D. Pal and K. Mandal, “Magnetocaloric effect and magnetoresistance of Ni–Fe–Ga
alloys,” J. Phys. Appl. Phys., vol. 43, no. 45, p. 455002, 2010.
[116] L. Pareti, M. Solzi, F. Albertini, and A. Paoluzi, “Giant entropy change at the co-
occurrence of structural and magnetic transitions in the Ni Mn Ga Heusler alloy,” Eur.
Phys. J. B - Condens. Matter Complex Syst., vol. 32, no. 3, pp. 303–307, Apr. 2003.
[117] V. K. Sharma, M. K. Chattopadhyay, and S. B. Roy, “Large inverse magnetocaloric
effect in Ni50Mn34In16,” J. Phys. Appl. Phys., vol. 40, no. 7, p. 1869, Mar. 2007.
[118] L. Huang, D. Y. Cong, L. Ma, Z. H. Nie, M. G. Wamg. Z. L. Wang, H. L. Suo, Y. Ren,
Y. D. Wang, “Large magnetic entropy change and magnetoresistance in a
Ni41Co9Mn40Sn10 magnetic shape memory alloy,” J. Alloys Compd., vol. 647, pp. 1081–
1085, Oct. 2015.
[119] A. K. Nayak, K. G. Suresh, and A. K. Nigam, “Giant inverse magnetocaloric effect near
room temperature in Co substituted NiMnSb Heusler alloys,” J. Phys. Appl. Phys., vol. 42,
no. 3, p. 035009, Jan. 2009.
[120] D. Bourgault, J. Tillier, P. Courtois, D. Maillard, and X. Chaud, “Large inverse
magnetocaloric effect in Ni45Co5Mn37.5In12.5 single crystal above 300 K,” Appl. Phys.
Lett., vol. 96, no. 13, p. 132501, Mar. 2010.
[121] A. J. Millis, B. I. Shraiman, and R. Mueller, “Dynamic Jahn-Teller Effect and Colossal
Magnetoresistance in La1-xSrxMnO,” Phys. Rev. Lett., vol. 77, no. 1, pp. 175–178, Jul.
1996.
[122] M. Uehara, S. Mori, C. H. Chen, and S.-W. Cheong, “Percolative phase separation
underlies colossal magnetoresistance in mixed-valent manganites,” Nature, vol. 399, no.
6736, pp. 560–563, Jun. 1999.
[123] S. Jin, T. H. Tiefel, M. McCormack, R. A. Fastnacht, R. Ramesh, and L. H. Chen,
“Thousandfold Change in Resistivity in Magnetoresistive La-Ca-Mn-O Films,” Science,
vol. 264, no. 5157, pp. 413–415, Apr. 1994.
[124] P. M. Levy, S. Zhang, and A. Fert, “Electrical conductivity of magnetic multilayered
structures,” Phys. Rev. Lett., vol. 65, no. 13, pp. 1643–1646, Sep. 1990.

44
[125] Z. H. Liu, H. Liu, X.X. Zhang, X. K. Zhang, J.Q. Xiao, Z.Y. Zhu, X.F. Dai, G.D. Liu,
J.L. Chen, and G.H. Wu, “Large negative magnetoresistance in quaternary Heusler alloy
Ni50Mn8Fe17Ga25 melt-spun ribbons,” Appl. Phys. Lett., vol. 86, no. 18, p. 182507, Apr.
2005.
[126] S. Y. Yu, Z.G. Liu, G.D. Liu, J.L. Chen, Z.X. Cao, G.H. Wu, B. Zhang, and X.X. Zhang,
“Large magnetoresistance in single-crystalline Ni50Mn50−xInx alloys (x=14–16) upon
martensitic transformation,” Appl. Phys. Lett., vol. 89, no. 16, p. 162503, Oct. 2006.
[127] S. Chatterjee, S. Giri, S. Majumdar, and S. K. De, “Giant magnetoresistance and large
inverse magnetocaloric effect in Ni2Mn1.36Sn0.64alloy,” J. Phys. Appl. Phys., vol. 42, no.
6, p. 065001, Feb. 2009.
[128] M. Pugacheva and A. Jezierski, “Dependence of the magnetic moment on the local
atomic order in Rh2MnX Heusler alloys,” J. Magn. Magn. Mater., vol. 151, no. 1, pp. 202–
206, Nov. 1995.
[129] V. A. Chernenko, “Compositional instability of β-phase in Ni-Mn-Ga alloys,” Scr.
Mater., vol. 40, no. 5, pp. 523–527, Feb. 1999.
[130] V. V. Khovailo, K. Oikawa, T. Abe, and T. Takagi, “Entropy change at the martensitic
transformation in ferromagnetic shape memory alloys Ni2+xMn1−xGa,” J. Appl. Phys.,
vol. 93, no. 10, pp. 8483–8485, May 2003.
[131] J. Pons, V. A. Chernenko, R. Santamarta, and E. Cesari, “Crystal structure of martensitic
phases in Ni–Mn–Ga shape memory alloys,” Acta Mater., vol. 48, no. 12, pp. 3027–3038,
Jul. 2000.
[132] A. Cakir, L. Righi, F. Albertini, M. Acet, M. Farle, and S. Akturk, “Extended
investigation of intermartensitic transitions in Ni-Mn-Ga magnetic shape memory alloys:
A detailed phase diagram determination,” J. Appl. Phys., vol. 114, no. 18, p. 183912, Nov.
2013.
[133] K. R. Priolkar, P.A. Bhobe, D.N. Lobo, S.W. D´Souza, S.R. Barman, A. Chakrabarti,
and S. Emura, “Antiferromagnetic exchange interactions in the Ni2Mn1.4In0.6
ferromagnetic Heusler alloy,” Phys. Rev. B, vol. 87, no. 14, p. 144412, Apr. 2013.
[134] T. Kanomata, T. Yasuda, S. Sasaki, H. Nishihara, R. Kainuma, W. Ito, K. Oikawa, K.
Ishida, K-U. Neumann, and K.R.A. Ziebeck, “Magnetic properties on shape memory alloys
Ni2Mn1+xIn1−x,” J. Magn. Magn. Mater., vol. 321, no. 7, pp. 773–776, Apr. 2009.
[135] E. Krén, E. Nagy, I. Nagy, L. Pál, and P. Szabó, “Structures and phase transformations
in the Mn-Ni system near equiatomic concentration,” J. Phys. Chem. Solids, vol. 29, no. 1,
pp. 101–108, Jan. 1968.
[136] M. Khan, I. Dubenko, S. Stadler, and N. Ali, “Magnetostructural phase transitions in
Ni50Mn25+xSb25-x Heusler alloys,” J. Phys. Condens. Matter, vol. 20, no. 23, p. 235204, Apr.
2008.
Bibliography
45
[137] J. Smit, “Magnetism in Hume-Rothery alloys,” J. Phys. F Met. Phys., vol. 8, no. 10, pp.
2139–2143, Oct. 1978.
[138] X. Q. Chen, F. J. Yang, X. Lu, and Z. X. Qin, “The way composition affects martensitic
transformation temperatures of Ni–Mn–Ga Heusler alloys,” Phys. Status Solidi B, vol. 244,
no. 3, pp. 1047–1053, 2007.
[139] E. Şaşıoğlu, L. M. Sandratskii, and P. Bruno, “Role of conduction electrons in mediating
exchange interactions in Mn-based Heusler alloys,” Phys. Rev. B, vol. 77, no. 6, p. 064417,
Feb. 2008.
[140] J. Enkovaara, O. Heczko, A. Ayuela, and R. M. Nieminen, “Coexistence of
ferromagnetic and antiferromagnetic order in Mn-doped Ni2MnGa,” Phys. Rev. B, vol. 67,
no. 21, p. 212405, Jun. 2003.
[141] T. Krenke, E. Duman, M. Acet, X. Moya, L. Mañosa, and A. Planes, “Effect of Co and
Fe on the inverse magnetocaloric properties of Ni-Mn-Sn,” J. Appl. Phys., vol. 102, no. 3,
p. 033903, Aug. 2007.
[142] V. K. Sharma, M. K. Chattopadhyay, A. Khandelwal, and S. B. Roy, “Martensitic
transition near room temperature and the temperature- and magnetic-field-induced
multifunctional properties of Ni49CuMn34In16 alloy,” Phys. Rev. B, vol. 82, no. 17, p.
172411, Nov. 2010.
[143] C. O. Aguilar-Ortiz, D. Soto-Parra, P. Álvarez-Alonso, P. Lázpita, D. Salazar, P.O.
Castillo-Villa, H. Flores-Zúñiga, and V.A. Chernenko, “Influence of Fe doping and
magnetic field on martensitic transition in Ni–Mn–Sn melt-spun ribbons,” Acta Mater., vol.
107, pp. 9–16, Apr. 2016.
[144] Z. Li, C. Jing, H.L. Zhang, Y. F. Qiao, S.X. Cao, J.C. Zhang, and L. Sun, “A
considerable metamagnetic shape memory effect without any prestrain in
Ni46Cu4Mn38Sn12 Heusler alloy,” J. Appl. Phys., vol. 106, no. 8, p. 083908, Oct. 2009.
[145] B. Gao, J. Shen, F. X. Hu, J. Wang, J. R. Sun, and B. G. Shen, “Magnetic properties and
magnetic entropy change in Heusler alloys Ni50Mn35−xCuxSn15,” Appl. Phys. A, vol. 97,
no. 2, p. 443, May 2009.
[146] C.-M. Li, H.-B. Luo, Q.-M. Hu, R. Yang, B. Johansson, and L. Vitos, “Site preference
and elastic properties of Fe-, Co-, and Cu-doped Ni2MnGa shape memory alloys from first
principles,” Phys. Rev. B, vol. 84, no. 2, p. 024206, Jul. 2011.
[147] Z. H. Liu, M. Zhang, W.Q. Wang, W.H. Wang, J.L. Chen, G.H. Wu, F.B. Meng, H.Y.
Liu, B.D. Liu, J.P. Qu, and Y.X. Li, “Magnetic properties and martensitic transformation
in quaternary Heusler alloy of NiMnFeGa,” J. Appl. Phys., vol. 92, no. 9, pp. 5006–5010,
Oct. 2002.
[148] D. E. Soto-Parra, X. Moya, L. Mañosa, A. Planes, H. Flores-Zúñiga, F. Alvarado-
Hernández, R.A. Ochoa-Gamboa, J.A. Matutes-Aquino and D. Ríos-Jara, “Fe and Co
selective substitution in Ni2MnGa: Effect of magnetism on relative phase stability,” Philos.
Mag., vol. 90, no. 20, pp. 2771–2792, Jul. 2010.
46
[149] Y. Murakami, T. Yano, R. Y. Umetsu, R. Kainuma, and D. Shindo, “Suppression of
ferromagnetism within antiphase boundaries in Ni50Mn25Al12.5Ga12.5 alloy,” Scr.
Mater., vol. 65, no. 10, pp. 895–898, Nov. 2011.
[150] L. Huang, D. Y. Cong, H. L. Suo, and Y. D. Wang, “Giant magnetic refrigeration
capacity near room temperature in Ni40Co10Mn40Sn10 multifunctional alloy,” Appl.
Phys. Lett., vol. 104, no. 13, p. 132407, Mar. 2014.
[151] V. Recarte, J. I. Pérez-Landazábal, S. Kustov, and E. Cesari, “Entropy change linked to
the magnetic field induced martensitic transformation in a Ni–Mn–In–Co shape memory
alloy,” J. Appl. Phys., vol. 107, no. 5, p. 053501, Mar. 2010.
[152] Metamagnetic shape memory effect in a Heusler-type Ni43Co7Mn39Sn11
polycrystalline alloy “Magnetic ordering in magnetic shape memory alloy Ni-Mn-In-Co,”
Phys. Rev. B, vol. 92, no. 22, p. 224429, Dec. 2015.
[153] F. Orlandi, S. Fabbrici, F. Albertini, P. Manuel, D. D. Khalyavin, and L. Righi, “Long-
range antiferromagnetic interactions in Ni-Co-Mn-Ga metamagnetic Heusler alloys: A two-
step ordering studied by neutron diffraction,” Phys. Rev. B, vol. 94, no. 14, p. 140409, Oct.
2016.
[154] M. Kreissl et al., “The influence of atomic order and residual strain on the magnetic and
structural properties of Ni2MnGa,” J. Magn. Magn. Mater., vol. 272–276, pp. 2033–2034,
May 2004.
[155] A. Planes, L. Mañosa, E. Vives, J. Rodríguez-Carvajal, M. Morin, G. Guenin, and J.L.
Macqueron, “Neutron diffraction study of long-range atomic order in Cu-Zn-Al shape
memory alloys,” J. Phys. Condens. Matter, vol. 4, no. 2, p. 553, 1992.
[156] V. Sánchez-Alarcos, J. I. Pérez-Landazábal, V. Recarte, J. A. Rodríguez-Velamazán,
and V. A. Chernenko, “Effect of atomic order on the martensitic and magnetic
transformations in Ni–Mn–Ga ferromagnetic shape memory alloys,” J. Phys. Condens.
Matter, vol. 22, no. 16, p. 166001, 2010.
[157] Sanchez-Alarcos, Perez-Landazabal, Cristina Gómez-Polo, and V. Recarte, “Influence
of the atomic order on the magnetic characteristics of a Ni–Mn–Ga ferromagnetic shape
memory alloy,” J. Magn. Magn. Mater., vol. 320, no. 14, pp. 160–163, Jul. 2008.
[158] V. Sánchez-Alarcos, V. Recarte, J. I. Pérez-Landazábal, C. Gómez-Polo, and J. A.
Rodríguez-Velamazán, “Role of magnetism on the martensitic transformation in Ni–Mn-
based magnetic shape memory alloys,” Acta Mater., vol. 60, no. 2, pp. 459–468, Jan. 2012.
[159] A. L. Alves, E. C. Passamani, V. P. Nascimento, A. Y. Takeuchi, and C. Larica,
“Influence of grain refinement and induced crystal defects on the magnetic properties of Ni
50 Mn 36 Sn 14 Heusler alloy,” J. Phys. Appl. Phys., vol. 43, no. 34, p. 345001, 2010.
Bibliography
47
[160] E. C. Passamani, V.P. Nasimento, C. Larica, A.Y. Takeuchi, A.L. Alves, J.R. Proveri,
M.C. Pereira, and J.D. Favris, “The influence of chemical disorder enhancement on the
martensitic transformation of the Ni50Mn36Sn14 Heusler-type alloy,” J. Alloys Compd.,
vol. 509, no. 30, pp. 7826–7832, Jul. 2011.
[161] A. Ghotbi Varzaneh, P. Kameli, V. R. Zahedi, F. Karimzadeh, and H. Salamati, “Effect
of heat treatment on martensitic transformation of Ni47Mn40Sn13 ferromagnetic shape
memory alloy prepared by mechanical alloying,” Met. Mater. Int., vol. 21, no. 4, pp. 758–
764, Jul. 2015.
[162] I. Unzueta, J. López-García, V. Sánchez-Alarcos, V. Recarte, J.I. Pérez-Landazábal,
J.A. Rodríguez-Velamazán, J.S. Garitaonandia, J.A. García, and F. Plazaola, “119Sn
Mössbauer spectroscopy in the study of metamagnetic shape memory alloys,” Hyperfine
Interact., vol. 239, no. 1, p. 34, Aug. 2018.
[163] J. Ortín and A. Planes, “Thermodynamic analysis of thermal measurements in
thermoelastic martensitic transformations,” Acta Metall., vol. 36, no. 8, pp. 1873–1889,
Aug. 1988.
[164] Z. Zhang, X. Ding, J. Sun, T. Suzuki, T. Lookman, K. Otsuka, and X. Ren,
“Nonhysteretic Superelasticity of Shape Memory Alloys at the Nanoscale,” Phys. Rev.
Lett., vol. 111, no. 14, p. 145701, Sep. 2013.
[165] G. B. Rao, J. Q. Wang, E. H. Han, and W. Ke, “Study of residual stress accumulation
in TiNi shape memory alloy during fatigue using EBSD technique,” Mater. Lett., vol. 6,
no. 60, pp. 779–782, 2006.
[166] H. Scherngell and A. C. Kneissl, “Generation, development and degradation of the
intrinsic two-way shape memory effect in different alloy systems,” Acta Mater., vol. 2, no.
50, pp. 327–341, 2002.
[167] R. Niemann, O. Heczko, L. Schultz, and S. Fähler, “Metamagnetic transitions and
magnetocaloric effect in epitaxial Ni–Co–Mn–In films,” Appl. Phys. Lett., vol. 97, no. 22,
p. 222507, Nov. 2010.
[168] R. Caballero-Flores, T. Sánchez, W.O. Rosa, J. García, L. González-Lagarreta, D.
Serantes, V.M. Prida, L. Escoda, JJ. Suñol, and B. Hernando, “On tuning the
magnetocaloric effect in Ni–Mn–In Heusler alloy ribbons with thermal treatment,” J. Alloys
Compd., vol. 545, pp. 216–221, Dec. 2012.
[169] C. Gómez-Polo, J. I. Pérez-Landazábal, V. Recarte, V. Sánchez-Alarcos, G. Badini-
Confalonieri, and M. Vázquez, “Ni–Mn–Ga ferromagnetic shape memory wires,” J. Appl.
Phys., vol. 107, no. 12, p. 123908, Jun. 2010.
48
[170] M. Acet, “Magnetic shape memory: Magnetoelastic sponges,” Nat. Mater., vol. 8, no.
11, pp. 854–855, Nov. 2009.
[171] J. Liu, N. Scheerbaum, S. Kauffmann-Weiss, and O. Gutfleisch, “NiMn-Based Alloys
and Composites for Magnetically Controlled Dampers and Actuators,” Adv. Eng. Mater.,
vol. 14, no. 8, pp. 653–667, Aug. 2012.
[172] J. Feuchtwanger, M. L. Richard, Y. J. Tang, A. E. Berkowitz, R. C. O’Handley, and S.
M. Allen, “Large energy absorption in Ni–Mn–Ga/polymer composites,” J. Appl. Phys.,
vol. 97, no. 10, p. 10M319, May 2005.
[173] C. Suryanarayana, “Mechanical alloying and milling,” Prog. Mater. Sci., vol. 46, no. 1,
pp. 1–184, Jan. 2001.
[174] M. E. McHenry and D. E. Laughlin, “Nano-scale materials development for future
magnetic applications,” Acta Mater., vol. 48, no. 1, pp. 223–238, Jan. 2000.
[175] A. Calka and D. Wexler, “Mechanical milling assisted by electrical discharge,” Nature,
vol. 419, no. 6903, pp. 147–151, Sep. 2002.
[176] P. Gorria, P. Álvarez, J. S. Marcos, J. L. Sánchez Llamazares, M. J. Pérez, and J. A.
Blanco, “Crystal structure, magnetocaloric effect and magnetovolume anomalies in
nanostructured Pr2Fe17,” Acta Mater., vol. 57, no. 6, pp. 1724–1733, Apr. 2009.
[177] W. Dagula, O. Tegus, X.W. Li, L. Song, E. Brück, D.T. Cam Thanh, F.R. de Boer, and
K.H.J. Buschow, “Magnetic properties and magnetic-entropy change of
MnFeP0.5As0.5−xSix(x=0–0.3) compounds,” J. Appl. Phys., vol. 99, no. 8, p. 08Q105,
Apr. 2006.
[178] Y. D. Wang, Y. Ren, Z.H. Nie, D.M. Liu, L. Zuo, H. Choo, H. Li, P.K. Liaw, J.Q. Yan,
R.K. McQueeney, J.W. Richardson, and A. Huq, “Structural transition of ferromagnetic
Ni2MnGa nanoparticles,” J. Appl. Phys., vol. 101, no. 6, p. 063530, Mar. 2007.
[179] B. Tian, F. Chen, Y. Liu, and Y. F. Zheng, “Structural transition and atomic ordering of
Ni49.8Mn28.5Ga21.7 ferromagnetic shape memory alloy powders prepared by ball
milling,” Mater. Lett., vol. 62, no. 17–18, pp. 2851–2854, Jun. 2008.
[180] Y. V. B. de Santanna, M. A. C. de Melo, I. A. Santos, A. A. Coelho, S. Gama, and L. F.
Cótica, “Structural, microstructural and magnetocaloric investigations in high-energy ball
milled Ni2.18Mn0.82Ga powders,” Solid State Commun., vol. 148, no. 7, pp. 289–292,
Nov. 2008.
Bibliography
49
[181] K. V. Peruman, R. Chokkalingam, and M. Mahendran, “Annealing effect on phase
transformation in nano structured Ni–Mn–Ga ferromagnetic shape memory alloy,” Phase
Transit., vol. 83, no. 7, pp. 509–517, Jul. 2010.
[182] D. M. Liu, Z.H. Nie,Y. Rien, Y. D. Wang, J. Pearson, P.K. Liaw, and D.E. Brown,
“Structural Transitions and Magnetic Properties of Ni50Mn36.7In13.3 Particles with
Amorphous-Like Phase,” Metall. Mater. Trans. A, vol. 42, no. 10, p. 3062, May 2011.
[183] X. P. Fei, W. Li, J. Liu, F. Xu, G.D. Tang, W.S. Tan, and S.D. Li et al., “Phase Transition
of Ball-Milled Ni50-xMn37In13Cox (x=0,5) Alloy Powders,” Materials Science Forum,
vol. 809-810, pp. 377-383, 2015.

50
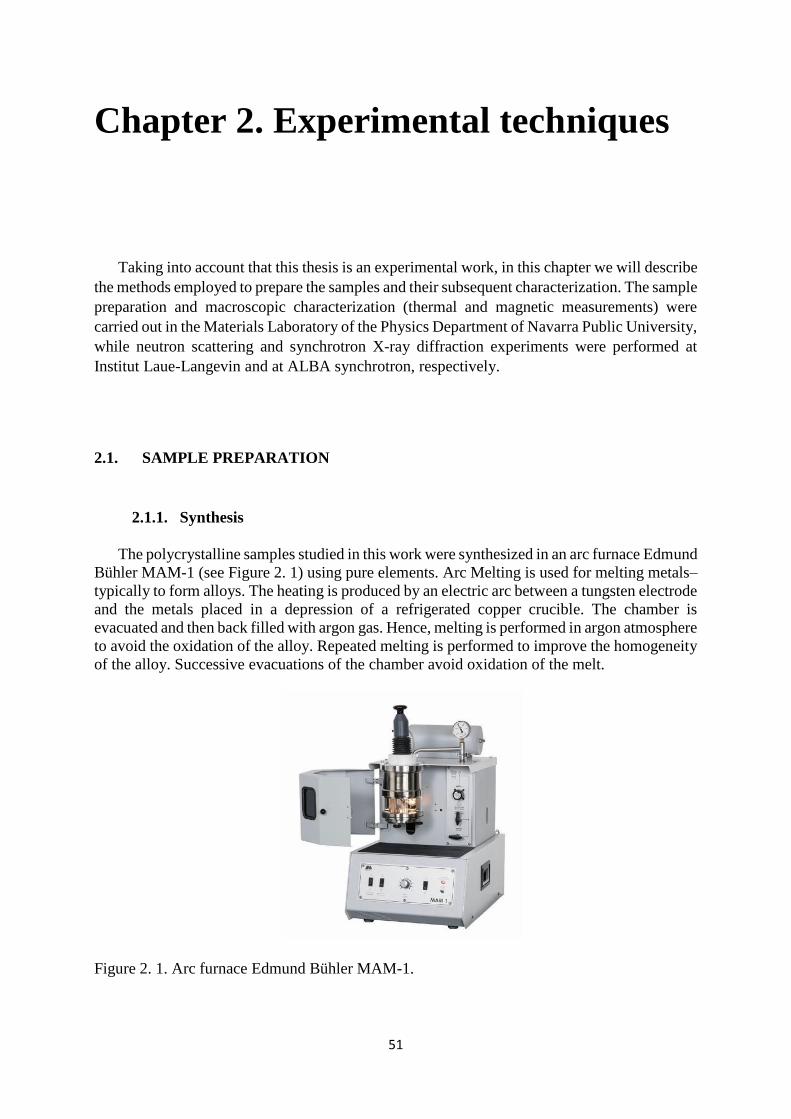
51
Chapter 2. Experimental techniques
Taking into account that this thesis is an experimental work, in this chapter we will describe
the methods employed to prepare the samples and their subsequent characterization. The sample
preparation and macroscopic characterization (thermal and magnetic measurements) were
carried out in the Materials Laboratory of the Physics Department of Navarra Public University,
while neutron scattering and synchrotron X-ray diffraction experiments were performed at
Institut Laue-Langevin and at ALBA synchrotron, respectively.
2.1. SAMPLE PREPARATION
2.1.1. Synthesis
The polycrystalline samples studied in this work were synthesized in an arc furnace Edmund
Bühler MAM-1 (see Figure 2. 1) using pure elements. Arc Melting is used for melting metals–
typically to form alloys. The heating is produced by an electric arc between a tungsten electrode
and the metals placed in a depression of a refrigerated copper crucible. The chamber is
evacuated and then back filled with argon gas. Hence, melting is performed in argon atmosphere
to avoid the oxidation of the alloy. Repeated melting is performed to improve the homogeneity
of the alloy. Successive evacuations of the chamber avoid oxidation of the melt.
Figure 2. 1. Arc furnace Edmund Bühler MAM-1.
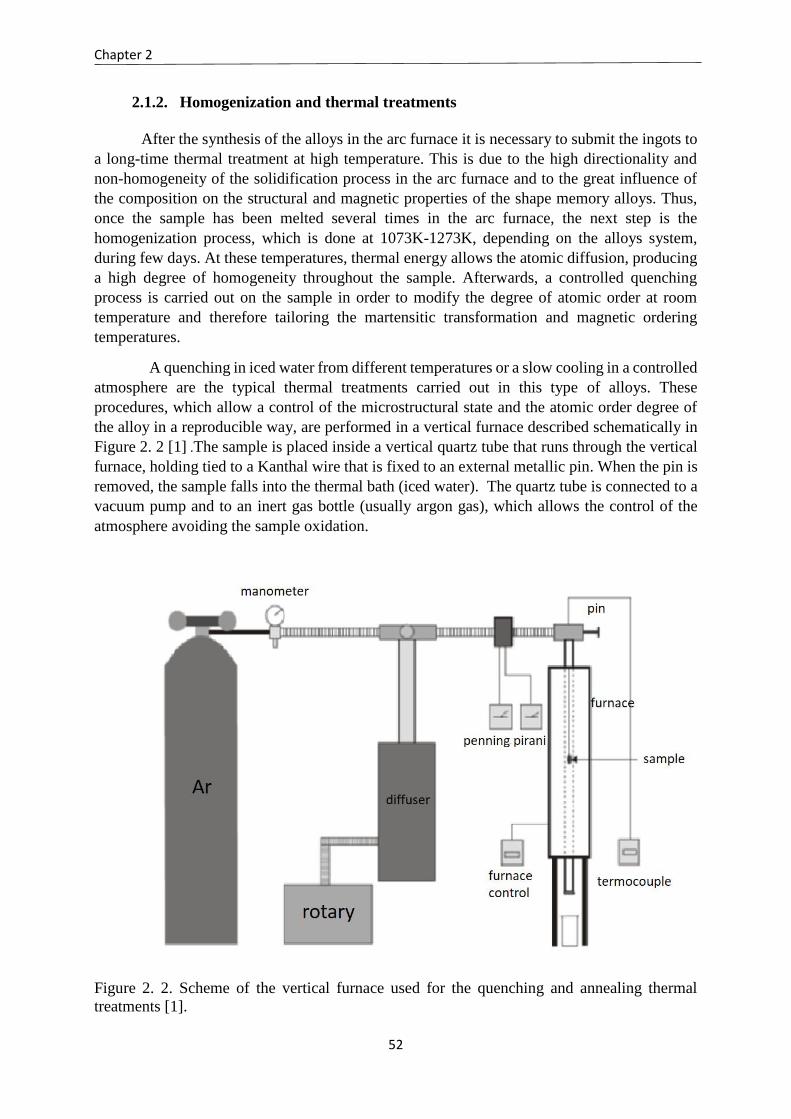
Chapter 2
52
2.1.2. Homogenization and thermal treatments
After the synthesis of the alloys in the arc furnace it is necessary to submit the ingots to
a long-time thermal treatment at high temperature. This is due to the high directionality and
non-homogeneity of the solidification process in the arc furnace and to the great influence of
the composition on the structural and magnetic properties of the shape memory alloys. Thus,
once the sample has been melted several times in the arc furnace, the next step is the
homogenization process, which is done at 1073K-1273K, depending on the alloys system,
during few days. At these temperatures, thermal energy allows the atomic diffusion, producing
a high degree of homogeneity throughout the sample. Afterwards, a controlled quenching
process is carried out on the sample in order to modify the degree of atomic order at room
temperature and therefore tailoring the martensitic transformation and magnetic ordering
temperatures.
A quenching in iced water from different temperatures or a slow cooling in a controlled
atmosphere are the typical thermal treatments carried out in this type of alloys. These
procedures, which allow a control of the microstructural state and the atomic order degree of
the alloy in a reproducible way, are performed in a vertical furnace described schematically in
Figure 2. 2 [1] .The sample is placed inside a vertical quartz tube that runs through the vertical
furnace, holding tied to a Kanthal wire that is fixed to an external metallic pin. When the pin is
removed, the sample falls into the thermal bath (iced water). The quartz tube is connected to a
vacuum pump and to an inert gas bottle (usually argon gas), which allows the control of the
atmosphere avoiding the sample oxidation.
Figure 2. 2. Scheme of the vertical furnace used for the quenching and annealing thermal
treatments [1].
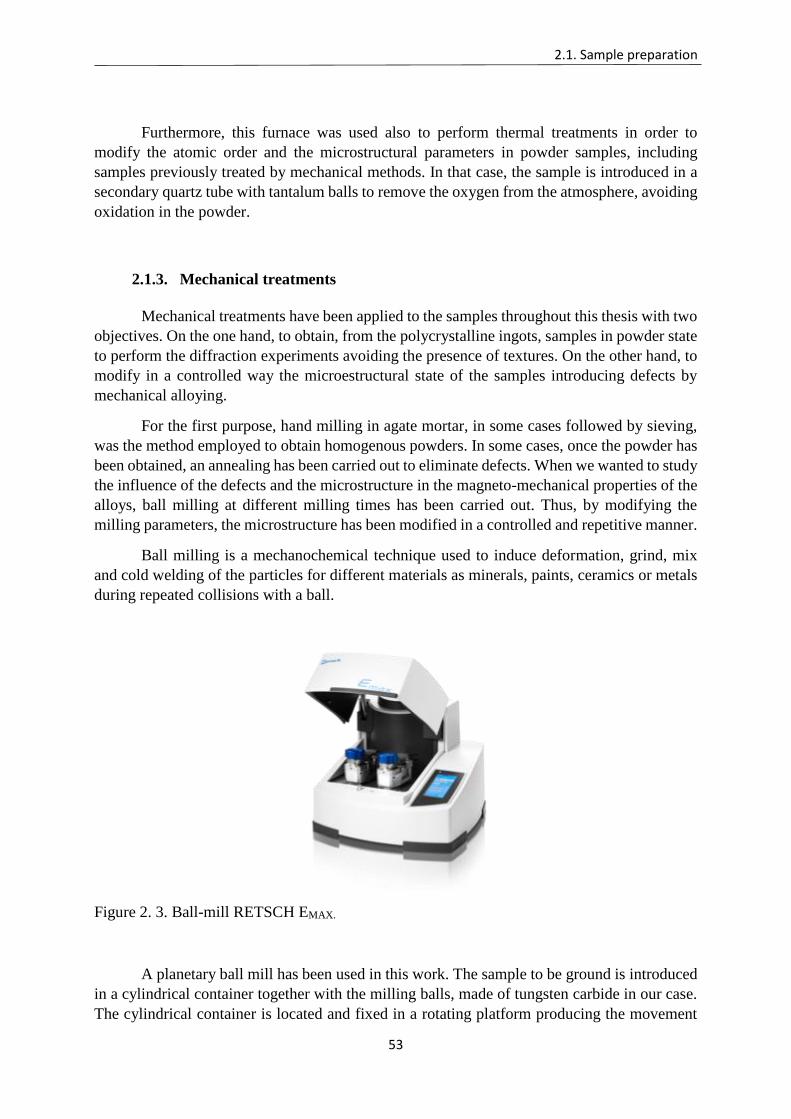
2.1. Sample preparation
53
Furthermore, this furnace was used also to perform thermal treatments in order to
modify the atomic order and the microstructural parameters in powder samples, including
samples previously treated by mechanical methods. In that case, the sample is introduced in a
secondary quartz tube with tantalum balls to remove the oxygen from the atmosphere, avoiding
oxidation in the powder.
2.1.3. Mechanical treatments
Mechanical treatments have been applied to the samples throughout this thesis with two
objectives. On the one hand, to obtain, from the polycrystalline ingots, samples in powder state
to perform the diffraction experiments avoiding the presence of textures. On the other hand, to
modify in a controlled way the microestructural state of the samples introducing defects by
mechanical alloying.
For the first purpose, hand milling in agate mortar, in some cases followed by sieving,
was the method employed to obtain homogenous powders. In some cases, once the powder has
been obtained, an annealing has been carried out to eliminate defects. When we wanted to study
the influence of the defects and the microstructure in the magneto-mechanical properties of the
alloys, ball milling at different milling times has been carried out. Thus, by modifying the
milling parameters, the microstructure has been modified in a controlled and repetitive manner.
Ball milling is a mechanochemical technique used to induce deformation, grind, mix
and cold welding of the particles for different materials as minerals, paints, ceramics or metals
during repeated collisions with a ball.
Figure 2. 3. Ball-mill RETSCH EMAX.
A planetary ball mill has been used in this work. The sample to be ground is introduced
in a cylindrical container together with the milling balls, made of tungsten carbide in our case.
The cylindrical container is located and fixed in a rotating platform producing the movement
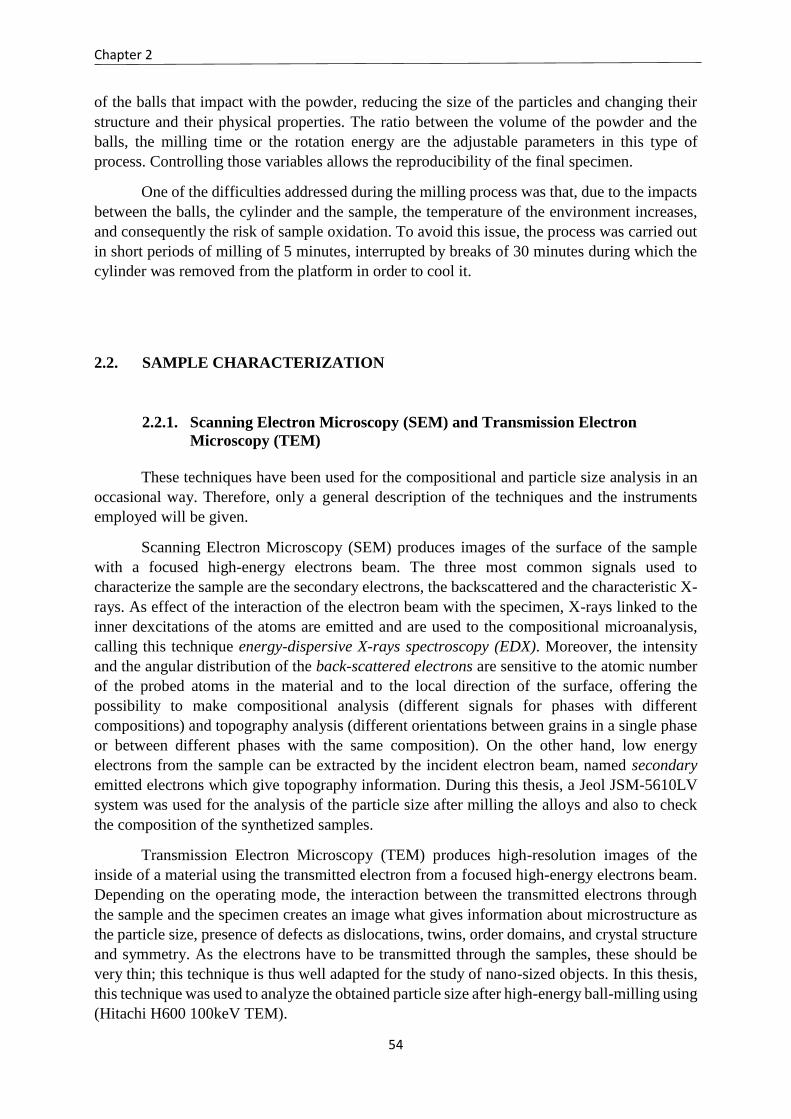
Chapter 2
54
of the balls that impact with the powder, reducing the size of the particles and changing their
structure and their physical properties. The ratio between the volume of the powder and the
balls, the milling time or the rotation energy are the adjustable parameters in this type of
process. Controlling those variables allows the reproducibility of the final specimen.
One of the difficulties addressed during the milling process was that, due to the impacts
between the balls, the cylinder and the sample, the temperature of the environment increases,
and consequently the risk of sample oxidation. To avoid this issue, the process was carried out
in short periods of milling of 5 minutes, interrupted by breaks of 30 minutes during which the
cylinder was removed from the platform in order to cool it.
2.2. SAMPLE CHARACTERIZATION
2.2.1. Scanning Electron Microscopy (SEM) and Transmission Electron
Microscopy (TEM)
These techniques have been used for the compositional and particle size analysis in an
occasional way. Therefore, only a general description of the techniques and the instruments
employed will be given.
Scanning Electron Microscopy (SEM) produces images of the surface of the sample
with a focused high-energy electrons beam. The three most common signals used to
characterize the sample are the secondary electrons, the backscattered and the characteristic X-
rays. As effect of the interaction of the electron beam with the specimen, X-rays linked to the
inner dexcitations of the atoms are emitted and are used to the compositional microanalysis,
calling this technique energy-dispersive X-rays spectroscopy (EDX). Moreover, the intensity
and the angular distribution of the back-scattered electrons are sensitive to the atomic number
of the probed atoms in the material and to the local direction of the surface, offering the
possibility to make compositional analysis (different signals for phases with different
compositions) and topography analysis (different orientations between grains in a single phase
or between different phases with the same composition). On the other hand, low energy
electrons from the sample can be extracted by the incident electron beam, named secondary
emitted electrons which give topography information. During this thesis, a Jeol JSM-5610LV
system was used for the analysis of the particle size after milling the alloys and also to check
the composition of the synthetized samples.
Transmission Electron Microscopy (TEM) produces high-resolution images of the
inside of a material using the transmitted electron from a focused high-energy electrons beam.
Depending on the operating mode, the interaction between the transmitted electrons through
the sample and the specimen creates an image what gives information about microstructure as
the particle size, presence of defects as dislocations, twins, order domains, and crystal structure
and symmetry. As the electrons have to be transmitted through the samples, these should be
very thin; this technique is thus well adapted for the study of nano-sized objects. In this thesis,
this technique was used to analyze the obtained particle size after high-energy ball-milling using
(Hitachi H600 100keV TEM).
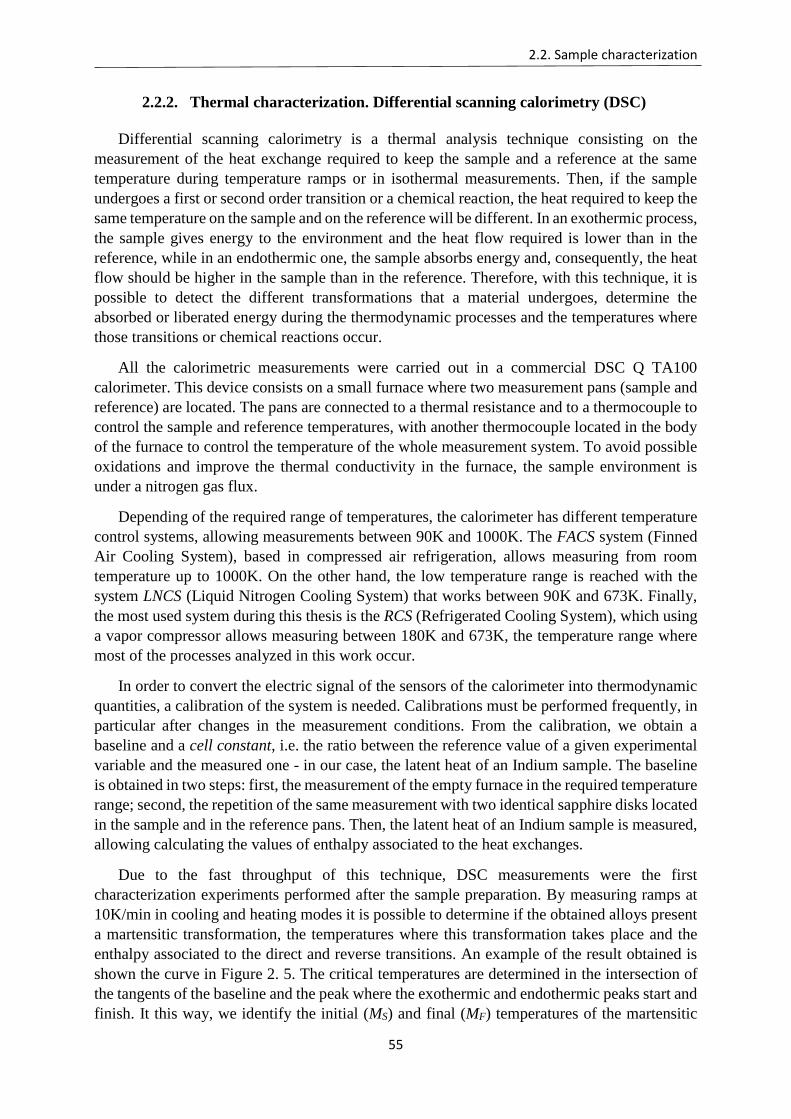
2.2. Sample characterization
55
2.2.2. Thermal characterization. Differential scanning calorimetry (DSC)
Differential scanning calorimetry is a thermal analysis technique consisting on the
measurement of the heat exchange required to keep the sample and a reference at the same
temperature during temperature ramps or in isothermal measurements. Then, if the sample
undergoes a first or second order transition or a chemical reaction, the heat required to keep the
same temperature on the sample and on the reference will be different. In an exothermic process,
the sample gives energy to the environment and the heat flow required is lower than in the
reference, while in an endothermic one, the sample absorbs energy and, consequently, the heat
flow should be higher in the sample than in the reference. Therefore, with this technique, it is
possible to detect the different transformations that a material undergoes, determine the
absorbed or liberated energy during the thermodynamic processes and the temperatures where
those transitions or chemical reactions occur.
All the calorimetric measurements were carried out in a commercial DSC Q TA100
calorimeter. This device consists on a small furnace where two measurement pans (sample and
reference) are located. The pans are connected to a thermal resistance and to a thermocouple to
control the sample and reference temperatures, with another thermocouple located in the body
of the furnace to control the temperature of the whole measurement system. To avoid possible
oxidations and improve the thermal conductivity in the furnace, the sample environment is
under a nitrogen gas flux.
Depending of the required range of temperatures, the calorimeter has different temperature
control systems, allowing measurements between 90K and 1000K. The FACS system (Finned
Air Cooling System), based in compressed air refrigeration, allows measuring from room
temperature up to 1000K. On the other hand, the low temperature range is reached with the
system LNCS (Liquid Nitrogen Cooling System) that works between 90K and 673K. Finally,
the most used system during this thesis is the RCS (Refrigerated Cooling System), which using
a vapor compressor allows measuring between 180K and 673K, the temperature range where
most of the processes analyzed in this work occur.
In order to convert the electric signal of the sensors of the calorimeter into thermodynamic
quantities, a calibration of the system is needed. Calibrations must be performed frequently, in
particular after changes in the measurement conditions. From the calibration, we obtain a
baseline and a cell constant, i.e. the ratio between the reference value of a given experimental
variable and the measured one - in our case, the latent heat of an Indium sample. The baseline
is obtained in two steps: first, the measurement of the empty furnace in the required temperature
range; second, the repetition of the same measurement with two identical sapphire disks located
in the sample and in the reference pans. Then, the latent heat of an Indium sample is measured,
allowing calculating the values of enthalpy associated to the heat exchanges.
Due to the fast throughput of this technique, DSC measurements were the first
characterization experiments performed after the sample preparation. By measuring ramps at
10K/min in cooling and heating modes it is possible to determine if the obtained alloys present
a martensitic transformation, the temperatures where this transformation takes place and the
enthalpy associated to the direct and reverse transitions. An example of the result obtained is
shown the curve in Figure 2. 5. The critical temperatures are determined in the intersection of
the tangents of the baseline and the peak where the exothermic and endothermic peaks start and
finish. It this way, we identify the initial (MS) and final (MF) temperatures of the martensitic
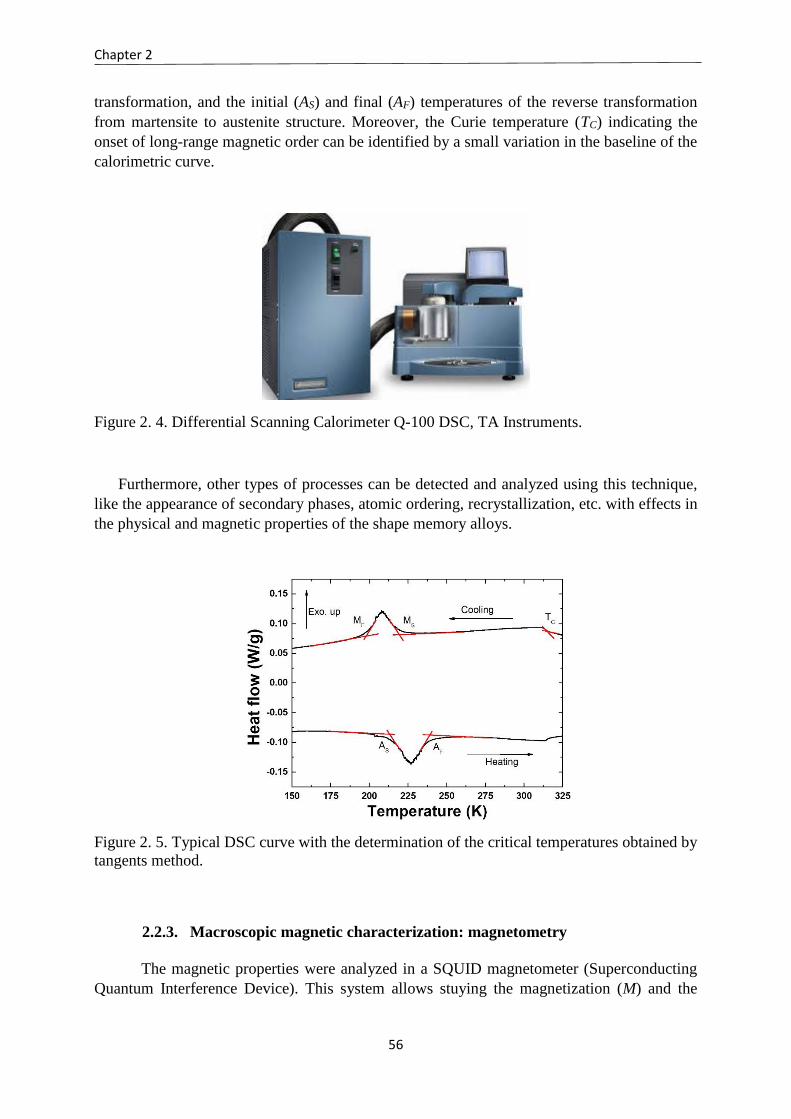
Chapter 2
56
transformation, and the initial (AS) and final (AF) temperatures of the reverse transformation
from martensite to austenite structure. Moreover, the Curie temperature (TC) indicating the
onset of long-range magnetic order can be identified by a small variation in the baseline of the
calorimetric curve.
Figure 2. 4. Differential Scanning Calorimeter Q-100 DSC, TA Instruments.
Furthermore, other types of processes can be detected and analyzed using this technique,
like the appearance of secondary phases, atomic ordering, recrystallization, etc. with effects in
the physical and magnetic properties of the shape memory alloys.
Figure 2. 5. Typical DSC curve with the determination of the critical temperatures obtained by
tangents method.
2.2.3. Macroscopic magnetic characterization: magnetometry
The magnetic properties were analyzed in a SQUID magnetometer (Superconducting
Quantum Interference Device). This system allows stuying the magnetization (M) and the
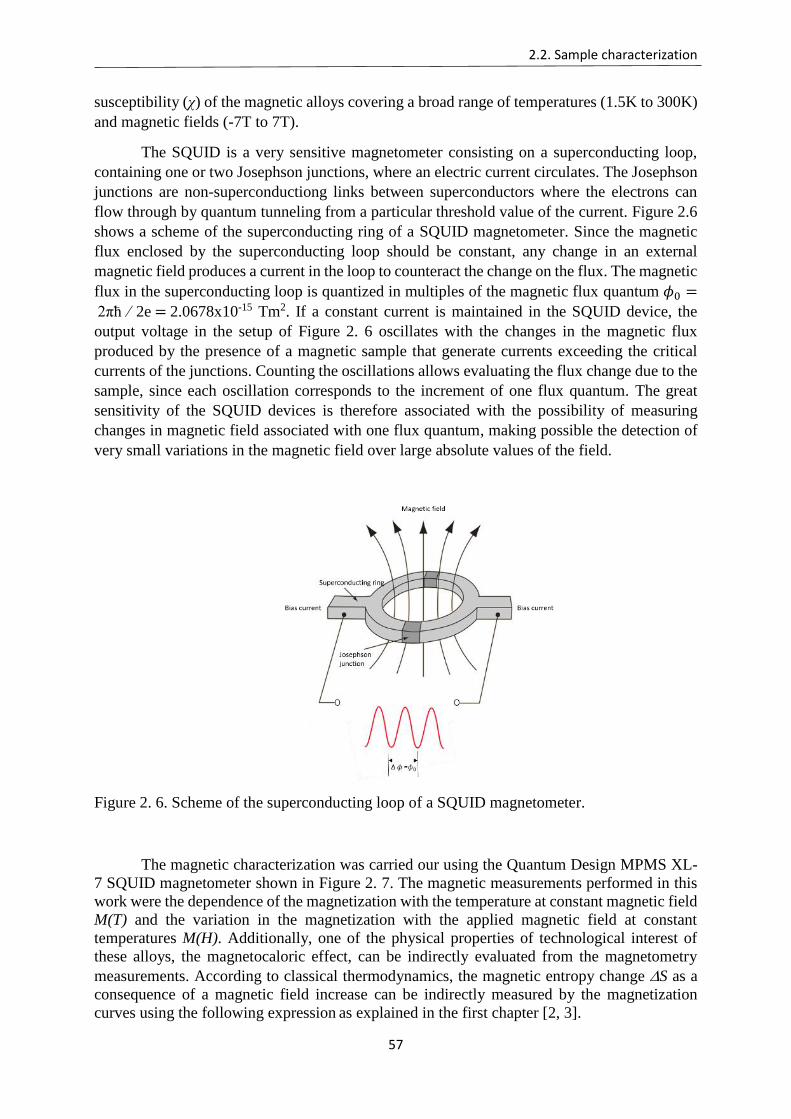
2.2. Sample characterization
57
susceptibility (χ) of the magnetic alloys covering a broad range of temperatures (1.5K to 300K)
and magnetic fields (-7T to 7T).
The SQUID is a very sensitive magnetometer consisting on a superconducting loop,
containing one or two Josephson junctions, where an electric current circulates. The Josephson
junctions are non-superconductiong links between superconductors where the electrons can
flow through by quantum tunneling from a particular threshold value of the current. Figure 2.6
shows a scheme of the superconducting ring of a SQUID magnetometer. Since the magnetic
flux enclosed by the superconducting loop should be constant, any change in an external
magnetic field produces a current in the loop to counteract the change on the flux. The magnetic
flux in the superconducting loop is quantized in multiples of the magnetic flux quantum 𝜙0 =
2πћ ⁄ 2e = 2.0678x10⁻¹⁵ Tm2. If a constant current is maintained in the SQUID device, the
output voltage in the setup of Figure 2. 6 oscillates with the changes in the magnetic flux
produced by the presence of a magnetic sample that generate currents exceeding the critical
currents of the junctions. Counting the oscillations allows evaluating the flux change due to the
sample, since each oscillation corresponds to the increment of one flux quantum. The great
sensitivity of the SQUID devices is therefore associated with the possibility of measuring
changes in magnetic field associated with one flux quantum, making possible the detection of
very small variations in the magnetic field over large absolute values of the field.
Figure 2. 6. Scheme of the superconducting loop of a SQUID magnetometer.
The magnetic characterization was carried our using the Quantum Design MPMS XL-
7 SQUID magnetometer shown in Figure 2. 7. The magnetic measurements performed in this
work were the dependence of the magnetization with the temperature at constant magnetic field
M(T) and the variation in the magnetization with the applied magnetic field at constant
temperatures M(H). Additionally, one of the physical properties of technological interest of
these alloys, the magnetocaloric effect, can be indirectly evaluated from the magnetometry
measurements. According to classical thermodynamics, the magnetic entropy change S as a
consequence of a magnetic field increase can be indirectly measured by the magnetization
curves using the following expression as explained in the first chapter [2, 3].
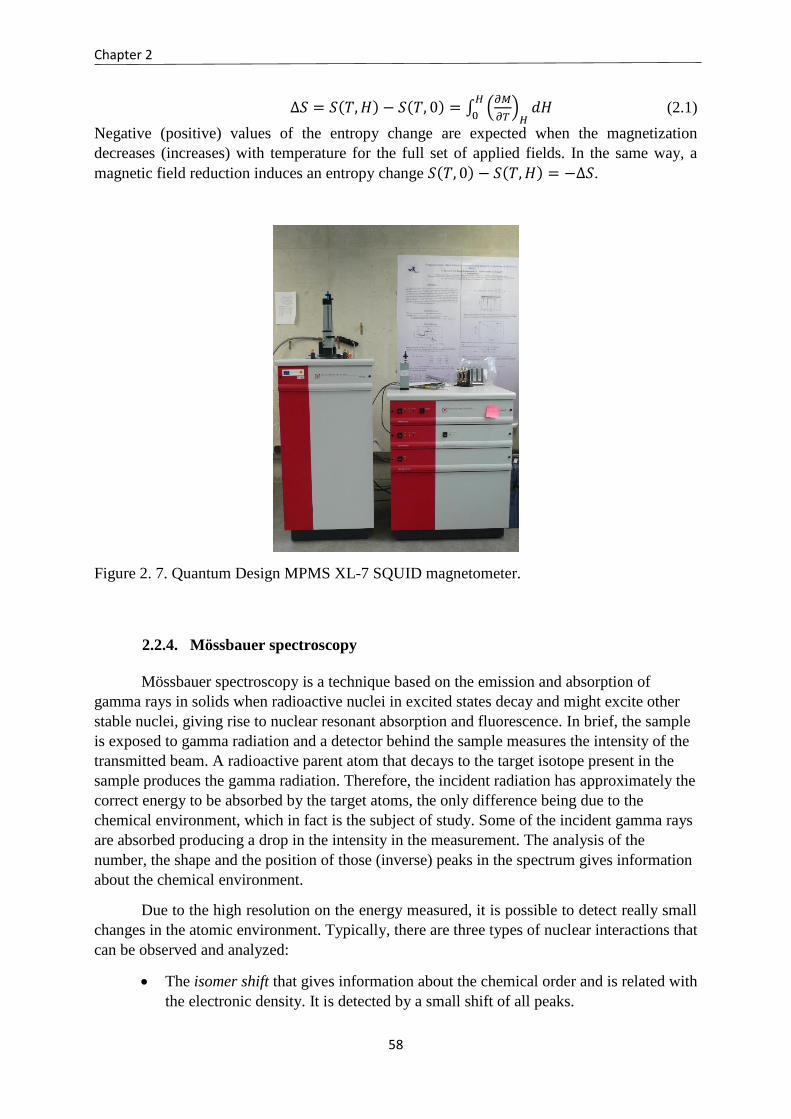
Chapter 2
58
∆𝑆 = 𝑆(𝑇, 𝐻) − 𝑆(𝑇, 0) = ∫ (𝜕𝑀
𝜕𝑇)
𝐻𝑑𝐻
𝐻
0 (2.1)
Negative (positive) values of the entropy change are expected when the magnetization
decreases (increases) with temperature for the full set of applied fields. In the same way, a
magnetic field reduction induces an entropy change 𝑆(𝑇, 0) − 𝑆(𝑇, 𝐻) = −∆𝑆.
Figure 2. 7. Quantum Design MPMS XL-7 SQUID magnetometer.
2.2.4. Mössbauer spectroscopy
Mössbauer spectroscopy is a technique based on the emission and absorption of
gamma rays in solids when radioactive nuclei in excited states decay and might excite other
stable nuclei, giving rise to nuclear resonant absorption and fluorescence. In brief, the sample
is exposed to gamma radiation and a detector behind the sample measures the intensity of the
transmitted beam. A radioactive parent atom that decays to the target isotope present in the
sample produces the gamma radiation. Therefore, the incident radiation has approximately the
correct energy to be absorbed by the target atoms, the only difference being due to the
chemical environment, which in fact is the subject of study. Some of the incident gamma rays
are absorbed producing a drop in the intensity in the measurement. The analysis of the
number, the shape and the position of those (inverse) peaks in the spectrum gives information
about the chemical environment.
Due to the high resolution on the energy measured, it is possible to detect really small
changes in the atomic environment. Typically, there are three types of nuclear interactions that
can be observed and analyzed:
The isomer shift that gives information about the chemical order and is related with
the electronic density. It is detected by a small shift of all peaks.
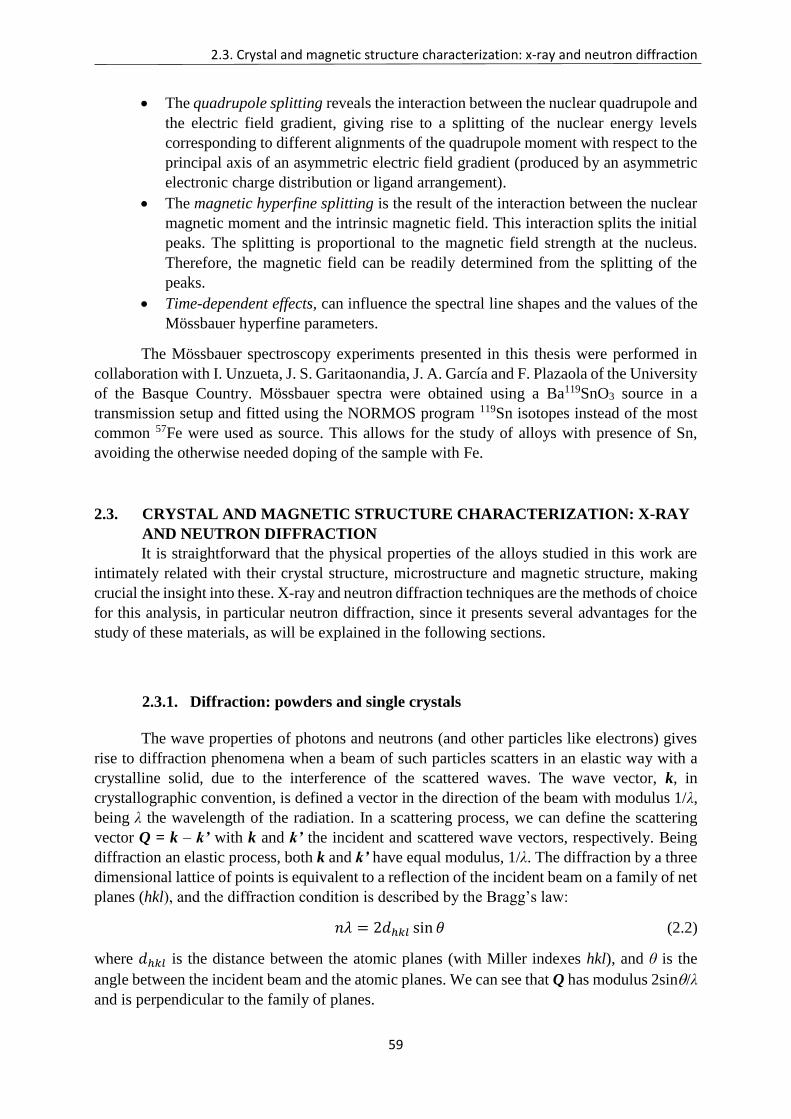
2.3. Crystal and magnetic structure characterization: x-ray and neutron diffraction
59
The quadrupole splitting reveals the interaction between the nuclear quadrupole and
the electric field gradient, giving rise to a splitting of the nuclear energy levels
corresponding to different alignments of the quadrupole moment with respect to the
principal axis of an asymmetric electric field gradient (produced by an asymmetric
electronic charge distribution or ligand arrangement).
The magnetic hyperfine splitting is the result of the interaction between the nuclear
magnetic moment and the intrinsic magnetic field. This interaction splits the initial
peaks. The splitting is proportional to the magnetic field strength at the nucleus.
Therefore, the magnetic field can be readily determined from the splitting of the
peaks.
Time-dependent effects, can influence the spectral line shapes and the values of the
Mössbauer hyperfine parameters.
The Mössbauer spectroscopy experiments presented in this thesis were performed in
collaboration with I. Unzueta, J. S. Garitaonandia, J. A. García and F. Plazaola of the University
of the Basque Country. Mössbauer spectra were obtained using a Ba119SnO3 source in a
transmission setup and fitted using the NORMOS program 119Sn isotopes instead of the most
common 57Fe were used as source. This allows for the study of alloys with presence of Sn,
avoiding the otherwise needed doping of the sample with Fe.
2.3. CRYSTAL AND MAGNETIC STRUCTURE CHARACTERIZATION: X-RAY
AND NEUTRON DIFFRACTION
It is straightforward that the physical properties of the alloys studied in this work are
intimately related with their crystal structure, microstructure and magnetic structure, making
crucial the insight into these. X-ray and neutron diffraction techniques are the methods of choice
for this analysis, in particular neutron diffraction, since it presents several advantages for the
study of these materials, as will be explained in the following sections.
2.3.1. Diffraction: powders and single crystals
The wave properties of photons and neutrons (and other particles like electrons) gives
rise to diffraction phenomena when a beam of such particles scatters in an elastic way with a
crystalline solid, due to the interference of the scattered waves. The wave vector, k, in
crystallographic convention, is defined a vector in the direction of the beam with modulus 1/λ,
being λ the wavelength of the radiation. In a scattering process, we can define the scattering
vector Q = k – k’ with k and k’ the incident and scattered wave vectors, respectively. Being
diffraction an elastic process, both k and k’ have equal modulus, 1/λ. The diffraction by a three
dimensional lattice of points is equivalent to a reflection of the incident beam on a family of net
planes (hkl), and the diffraction condition is described by the Bragg’s law:
𝑛𝜆 = 2𝑑ℎ𝑘𝑙 sin 𝜃 (2.2)
where 𝑑ℎ𝑘𝑙 is the distance between the atomic planes (with Miller indexes hkl), and θ is the
angle between the incident beam and the atomic planes. We can see that Q has modulus 2sin/λ
and is perpendicular to the family of planes.
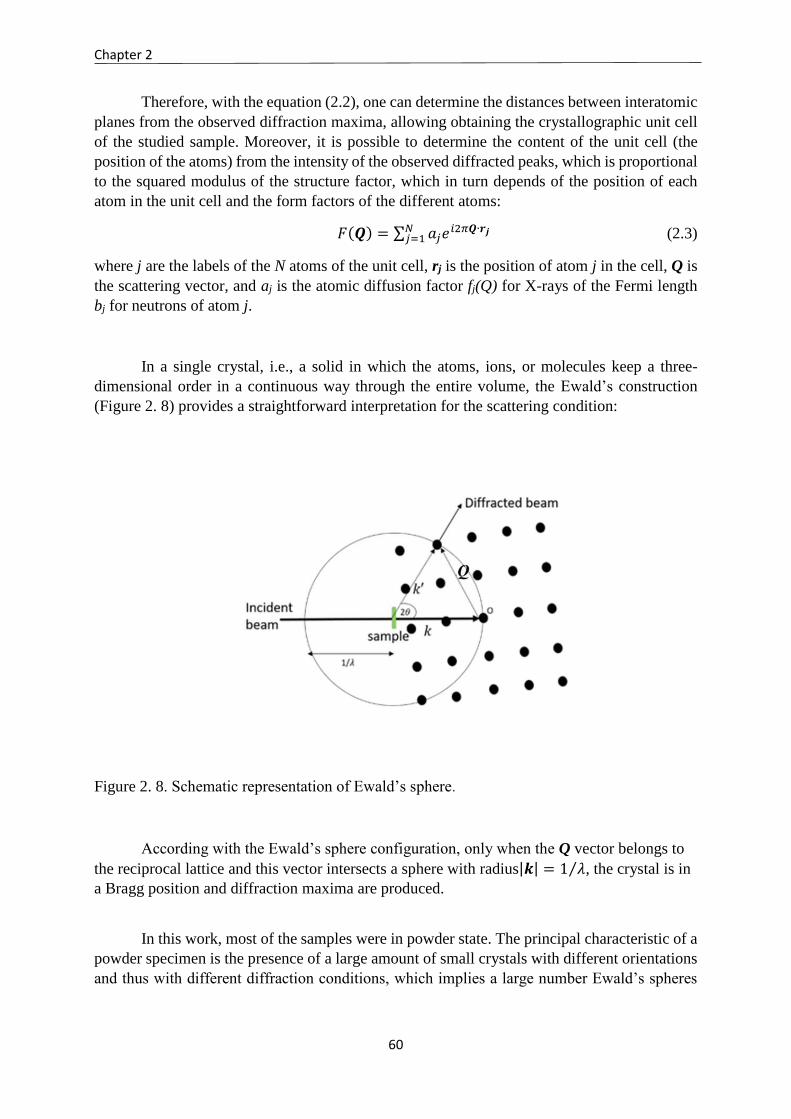
Chapter 2
60
Therefore, with the equation (2.2), one can determine the distances between interatomic
planes from the observed diffraction maxima, allowing obtaining the crystallographic unit cell
of the studied sample. Moreover, it is possible to determine the content of the unit cell (the
position of the atoms) from the intensity of the observed diffracted peaks, which is proportional
to the squared modulus of the structure factor, which in turn depends of the position of each
atom in the unit cell and the form factors of the different atoms:
𝐹(𝑸) = ∑ 𝑎𝑗𝑒𝑖2𝜋𝑸∙𝒓𝒋𝑁𝑗=1 (2.3)
where j are the labels of the N atoms of the unit cell, rj is the position of atom j in the cell, Q is
the scattering vector, and aj is the atomic diffusion factor fj(Q) for X-rays of the Fermi length
bj for neutrons of atom j.
In a single crystal, i.e., a solid in which the atoms, ions, or molecules keep a three-
dimensional order in a continuous way through the entire volume, the Ewald’s construction
(Figure 2. 8) provides a straightforward interpretation for the scattering condition:
Figure 2. 8. Schematic representation of Ewald’s sphere.
According with the Ewald’s sphere configuration, only when the Q vector belongs to
the reciprocal lattice and this vector intersects a sphere with radius|𝒌| = 1 𝜆⁄ , the crystal is in
a Bragg position and diffraction maxima are produced.
In this work, most of the samples were in powder state. The principal characteristic of a
powder specimen is the presence of a large amount of small crystals with different orientations
and thus with different diffraction conditions, which implies a large number Ewald’s spheres
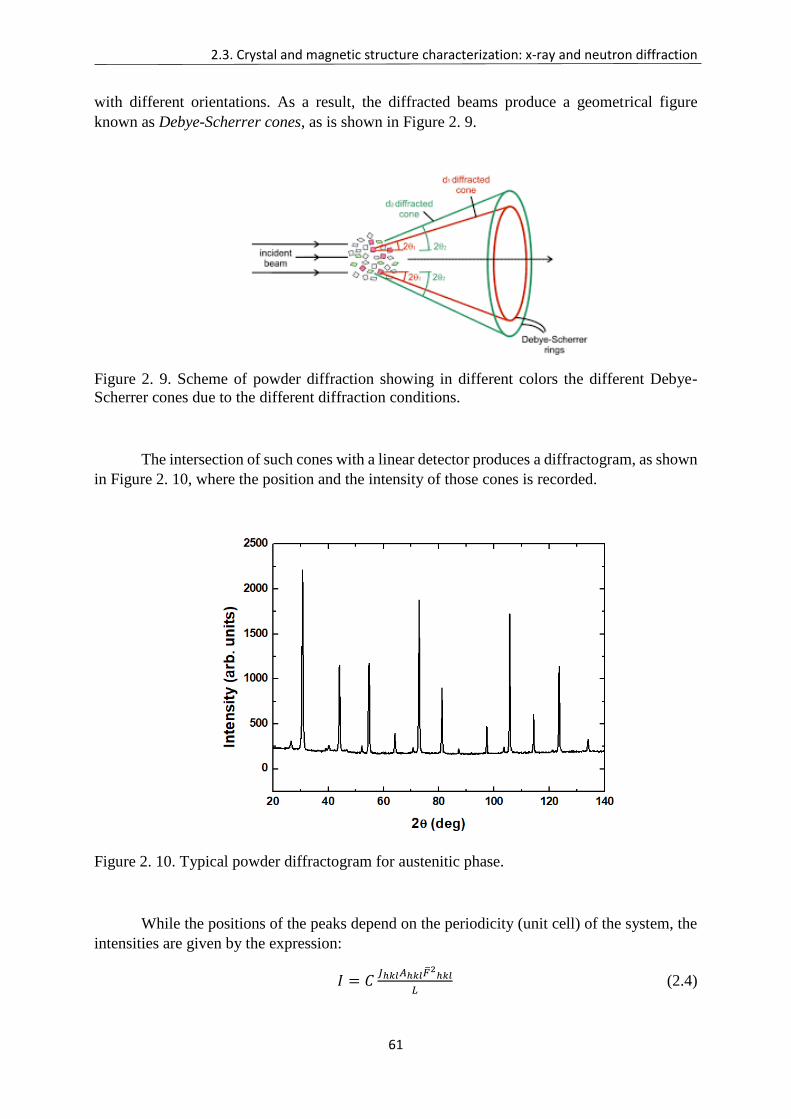
2.3. Crystal and magnetic structure characterization: x-ray and neutron diffraction
61
with different orientations. As a result, the diffracted beams produce a geometrical figure
known as Debye-Scherrer cones, as is shown in Figure 2. 9.
Figure 2. 9. Scheme of powder diffraction showing in different colors the different Debye-
Scherrer cones due to the different diffraction conditions.
The intersection of such cones with a linear detector produces a diffractogram, as shown
in Figure 2. 10, where the position and the intensity of those cones is recorded.
Figure 2. 10. Typical powder diffractogram for austenitic phase.
While the positions of the peaks depend on the periodicity (unit cell) of the system, the
intensities are given by the expression:
𝐼 = 𝐶𝐽ℎ𝑘𝑙𝐴ℎ𝑘𝑙𝐹2
ℎ𝑘𝑙
𝐿 (2.4)
Chapter 2
62
where:
C is an instrumental constant depending on the instrument characteristics, the beam
intensity, the wavelength, the sample dimensions or its density.
𝐽ℎ𝑘𝑙 is the multiplicity of the plane hkl, that is, the number of the reflections that
participate in the intensity of the peak.
𝐴ℎ𝑘𝑙 is the absorption factor, that accounts for the absorption effects produced in
the sample
𝐹(𝑸) = 𝐹(ℎ𝑘𝑙) = ∑ 𝑎𝑗𝑒2𝜋𝑖(ℎ𝑥𝑗+𝑘𝑦𝑗+𝑙𝑧𝑗)𝑒−𝐵𝑗
(𝑠𝑖𝑛2𝜃)𝜆2
⁄𝑗 is the structure factor, as
deduced from eq. (2.3), that contains information about the position of the atoms in
the unit cell, where hkl are the Miller indices that identify a family of planes; 𝑥𝑗 , 𝑦𝑗, 𝑧𝑗
are the coordinates of the atom j in the unit cell, and 𝑒−𝐵𝑗
(𝑠𝑖𝑛2𝜃)𝜆2
⁄ is the Debye-
Waller factor, with Bj the atomic displacement parameter, that accounts for the
decrease of intensity at high angles produced by displacement of the atoms from
their positions of equilibrium (because of thermal agitation, for example).
L is the Lorentz factor, a geometric factor accounting for the length of time that a
moving crystal remains in the diffracting position for any particular scattered beam.
2.3.2. Rietveld refinement
The analysis of the structures from the collected powder diffractograms is carried out
by the Rietveld method, which consists on refining the crystal structure by fitting the entire
profile of the diffraction pattern to a calculated profile using a least-squares approach. There is
no intermediate step of extracting structure factors, and so patterns containing overlapping
Bragg peaks can be analyzed. The equation to minimize is
𝜒2 = ∑ 𝑤𝑖{𝑦𝑖 − 𝑦𝑐,𝑖(𝜷)}2𝑛
𝑖=1 (2.5)
where i runs for the number of observations, 𝑦𝑖 is the observed intensity and 𝑦𝑐,𝑖(𝜷) is the
intensity calculated by the model as a function of the parameter vector (12p,
with the weight factor, 𝑤𝑖, given by the inverse of the square of the variance of the experimental
observation, 𝑤𝑖 = 1𝜎𝑖
2⁄ . The optimization of the parameters is performed by imposing the
condition 𝜕𝜒2
𝜕𝜷 𝑖= 0. A Taylor expansion of 𝑦𝑐,𝑖(𝜷) around 𝜷𝟎 allows the application of an
iterative process. Several agreement factors allow assessing the quality of the refinement (the
lower, the better), like the R-profile factor (Rp), R-weighted profile factor (Rwp) and the expected
R-weighted profile factor (Rexp), or the R-Bragg factor (RB), which are obtained as follows:
𝑅𝑝 = 100∑ |𝑦𝑖−𝑦𝑐,𝑖|𝑛
𝑖=1
∑ 𝑦𝑖𝑛𝑖=1
(2.6)
2.3. Crystal and magnetic structure characterization: x-ray and neutron diffraction
63
𝑅𝑤𝑝 = 100 [∑ 𝑤𝑖|𝑦𝑖−𝑦𝑐,𝑖|
2𝑛𝑖=1
∑ 𝑤𝑖|𝑦𝑖|2𝑛𝑖=1
]1/2
(2.7)
𝑅𝑒𝑥𝑝 = 100 [𝑁−𝑃
∑ 𝑤𝑖|𝑦𝑖|2𝑛𝑖=1
]1/2
(2.8)
𝑅𝐵 = 100∑ |𝐼𝑜𝑏𝑠,ℎ𝑘𝑙−𝐼𝑐𝑎𝑙𝑐,ℎ𝑘𝑙|ℎ𝑘𝑙
∑ |𝐼𝑜𝑏𝑠,ℎ𝑘𝑙|ℎ (2.9)
being the goodness of fit indicator 𝑆 =𝑅𝑤𝑝
𝑅𝑒𝑥𝑝⁄ or, most commonly used, the reduced chi-
square 𝜒2 = (𝑅𝑤𝑝
𝑅𝑒𝑥𝑝⁄ )
2
= 𝑆2. N in the expression of Rexp is the total number of points used
in the refinement, P is the number of refined parameters and N-P is the number of degrees
freedom. The Bragg factor, 𝑅𝐵, is calculated from the observed and calculated integrated
intensities (𝐼𝑜𝑏𝑠,ℎ𝑘𝑙and 𝐼𝑐𝑎𝑙𝑐,ℎ𝑘𝑙, respectively) of the Bragg reflections (hkl) in the pattern. When
different reflections contribute to a region in the pattern, the observed integrated intensity is
calculated by a proportional sharing between the different contributions according to the actual
model.
All the nuclear and magnetic structures calculated during this thesis where refined using the
programs of the Fullprof Suite [4].
2.3.3. Microstructural analysis
The combination of the Rietveld method together with a modeling of the shape of the
peak is useful for the study of the microstructure of the samples. Dislocations, anti-phase
domains, micro-strains and small crystallite sizes are structural defects that manifest in a
broadening of the Bragg peaks in powder diffractograms.
The Voigt approximation is one of the most useful ways for modeling the peak shape
and analyze the microstructural effects. Within this approximation, the instrument and sample
intrinsic profiles are described as a convolution of Lorentzian and Gaussian components.
Parameters as the volume averages of sizes and strains are derived from the integral breadths
of the peaks. The normalized Gaussian and Lorentzian functions are defined as:
𝐺(𝑥) = 𝑎𝐺𝑒−𝑏𝐺𝑥2 (2.10)
𝐿(𝑥) =𝑎𝐿
1+𝑏𝐿𝑥2 (2.11)
where aG, bG, aL and bL are determined from the full width at half maximum value, H:
𝑎𝐺 =2
𝐻√
𝑙𝑛2
𝜋 𝑏𝐺 =
4 𝑙𝑛2
𝐻2 𝑎𝐿 =2
𝜋𝐻 𝑏𝐿 =
4
𝐻2
The integral breadths of the Gaussian and Lorentzian functions are described by the expressions
𝛽𝐺 =1
𝑎𝐺=
𝐻
2√
𝜋
𝑙𝑛2 ; 𝛽𝐿 =
1
𝑎𝐿=
𝜋𝐻
2
Chapter 2
64
The psedo-Voigt function, pV(x), is an approximation of the Voigt function in the form of a
linear combination of a Lorentzian and a Gaussian function with the same full width at half
maximum parameter, H, instead of two parameters coming from each contribution:
pV(x) = L’(x)+ (1-)G’(x) (2.12)
The integral breadth of a normalized pseudo-Voight function is the inverse of the maximum
value, as described by the following expression, since when the function is multiplied by a
constant (integrated intensity) the integral breadth does not change:
𝛽𝑝𝑉 =∫ 𝐼𝑖𝑝𝑉(𝑥)𝑑𝑥
𝐼𝑖𝑝𝑉(0)=
1
𝑝𝑉(0)=
𝜋𝐻/2
𝜂+(1−𝜂)√𝜋 𝑙𝑛2 (2.13)
The Scherrer formula relates the integral breadth of a particular reflection due to size effect, 𝛽𝑆 , with the volume-average of the apparent size of the crystallites in the direction normal to the
scattering planes:
⟨𝐷⟩𝑉 =𝜆
𝛽𝑆 cos 𝜃 (2.14)
In a diffraction pattern, the peak broadening due to size effects increases with 2 as (cos)-1.
Except for spherical particles, the width depends on the direction in reciprocal space.
It is worth noting that the ‘crystalline size’ ere refers to the coherent-diffraction domains, which
does not necessarily have to coincide with the ‘particle size’ observed by other techniques like
electron microscopy. Moreover, the relation of the apparent size with physical dimensions of
the coherent domains is not direct. We should normally assume a particular average shape of
the crystallite (e.g. spheres) in order to relate the apparent sizes obtained for different Bragg
reflections with characteristics dimensions (e.g. diameter).
The apparent size can be expressed in terms of a normalized column-length distribution pv(l):
⟨𝐷⟩𝑉 = ∫ 𝑝𝑉(𝑙) · 𝑙 · 𝑑𝑙
∞0
(2.15)
where l is the length (column-length) normal to the scattering planes for each crystallite. The
distribution pv(l) can be derived from the Gaussian and Lorentzian integral breadths:
𝑝𝑉(𝑙) = 2𝑙[2𝛽𝐿2 − 𝜋𝛽𝐺
2 + 4𝜋𝛽𝐿𝛽𝐺2𝑙 + 2𝜋2𝛽𝐺
4𝑙2]𝑒𝑥𝑝{−2𝑙𝛽𝐿 − 𝜋𝛽𝐺2𝑙2} (2.16)
Concerning the strain, the peak shape and width depend on both the particular reflection and
the direction in reciprocal space, with the width of the peaks increasing with 2 as tan. The
so-called maximum strain, e, is related with the integral breadth of a particular reflection due to
strain effect, 𝛽𝐷, by:
𝑒 = 𝛽𝐷 /4 𝑡𝑎𝑛𝜃 (2.17)
Therefore, from the analysis and deconvolution of the integral breaths of the peaks in a
diffractogram as implemented in Fullprof [4], microstructural parameters as the sizes and
strains can be derived.
When the structure factors and the associated structural parameters (unit cell content)
are not know or their knowledge is not the objective of the analysis, a lighter method, the so-
called Le Bail fit, can be used as an alternative to the Rietveld method. The algorithm involves
refining the unit cell and the profile parameters, with the peak intensities being also adjustable
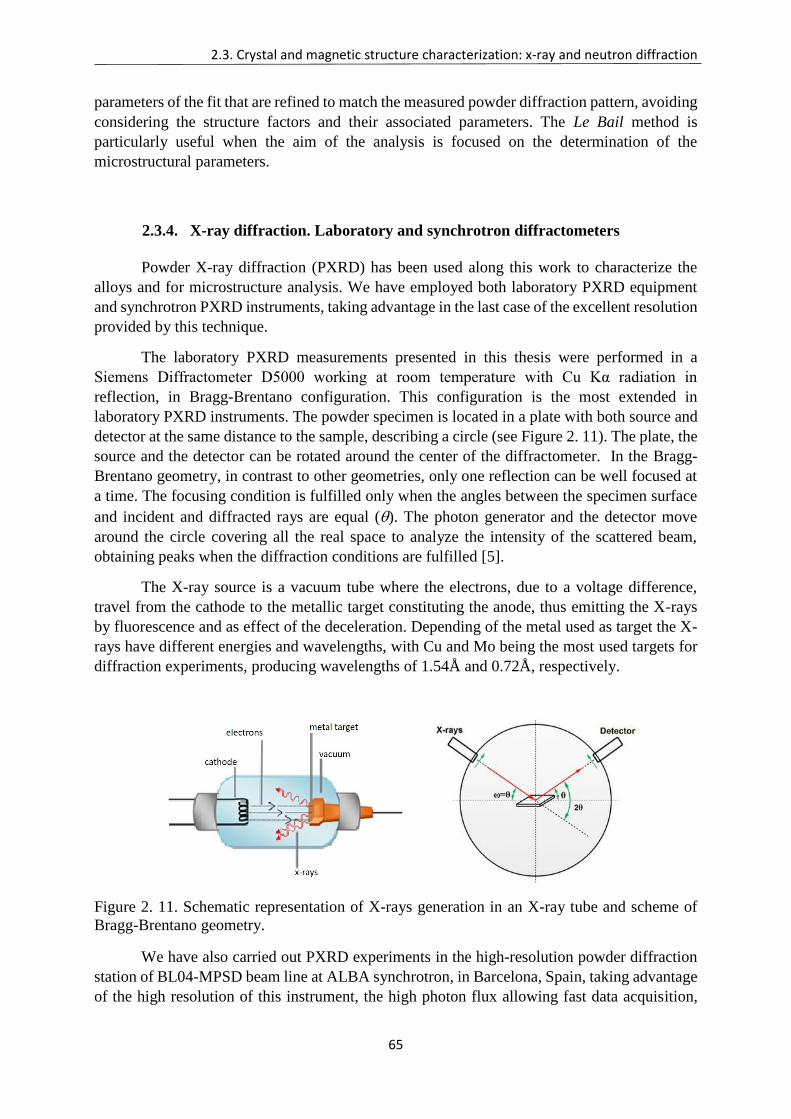
2.3. Crystal and magnetic structure characterization: x-ray and neutron diffraction
65
parameters of the fit that are refined to match the measured powder diffraction pattern, avoiding
considering the structure factors and their associated parameters. The Le Bail method is
particularly useful when the aim of the analysis is focused on the determination of the
microstructural parameters.
2.3.4. X-ray diffraction. Laboratory and synchrotron diffractometers
Powder X-ray diffraction (PXRD) has been used along this work to characterize the
alloys and for microstructure analysis. We have employed both laboratory PXRD equipment
and synchrotron PXRD instruments, taking advantage in the last case of the excellent resolution
provided by this technique.
The laboratory PXRD measurements presented in this thesis were performed in a
Siemens Diffractometer D5000 working at room temperature with Cu Kα radiation in
reflection, in Bragg-Brentano configuration. This configuration is the most extended in
laboratory PXRD instruments. The powder specimen is located in a plate with both source and
detector at the same distance to the sample, describing a circle (see Figure 2. 11). The plate, the
source and the detector can be rotated around the center of the diffractometer. In the Bragg-
Brentano geometry, in contrast to other geometries, only one reflection can be well focused at
a time. The focusing condition is fulfilled only when the angles between the specimen surface
and incident and diffracted rays are equal (). The photon generator and the detector move
around the circle covering all the real space to analyze the intensity of the scattered beam,
obtaining peaks when the diffraction conditions are fulfilled [5].
The X-ray source is a vacuum tube where the electrons, due to a voltage difference,
travel from the cathode to the metallic target constituting the anode, thus emitting the X-rays
by fluorescence and as effect of the deceleration. Depending of the metal used as target the X-
rays have different energies and wavelengths, with Cu and Mo being the most used targets for
diffraction experiments, producing wavelengths of 1.54Å and 0.72Å, respectively.
Figure 2. 11. Schematic representation of X-rays generation in an X-ray tube and scheme of
Bragg-Brentano geometry.
We have also carried out PXRD experiments in the high-resolution powder diffraction
station of BL04-MPSD beam line at ALBA synchrotron, in Barcelona, Spain, taking advantage
of the high resolution of this instrument, the high photon flux allowing fast data acquisition,
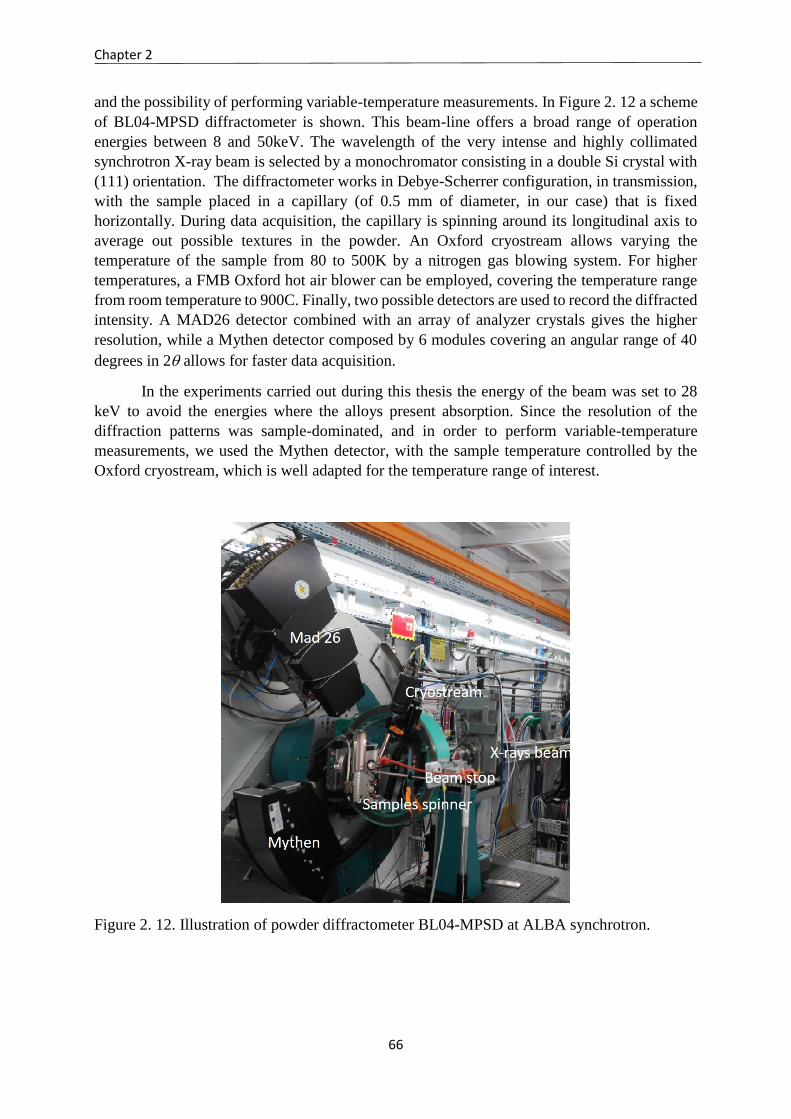
Chapter 2
66
and the possibility of performing variable-temperature measurements. In Figure 2. 12 a scheme
of BL04-MPSD diffractometer is shown. This beam-line offers a broad range of operation
energies between 8 and 50keV. The wavelength of the very intense and highly collimated
synchrotron X-ray beam is selected by a monochromator consisting in a double Si crystal with
(111) orientation. The diffractometer works in Debye-Scherrer configuration, in transmission,
with the sample placed in a capillary (of 0.5 mm of diameter, in our case) that is fixed
horizontally. During data acquisition, the capillary is spinning around its longitudinal axis to
average out possible textures in the powder. An Oxford cryostream allows varying the
temperature of the sample from 80 to 500K by a nitrogen gas blowing system. For higher
temperatures, a FMB Oxford hot air blower can be employed, covering the temperature range
from room temperature to 900C. Finally, two possible detectors are used to record the diffracted
intensity. A MAD26 detector combined with an array of analyzer crystals gives the higher
resolution, while a Mythen detector composed by 6 modules covering an angular range of 40
degrees in 2 allows for faster data acquisition.
In the experiments carried out during this thesis the energy of the beam was set to 28
keV to avoid the energies where the alloys present absorption. Since the resolution of the
diffraction patterns was sample-dominated, and in order to perform variable-temperature
measurements, we used the Mythen detector, with the sample temperature controlled by the
Oxford cryostream, which is well adapted for the temperature range of interest.
Figure 2. 12. Illustration of powder diffractometer BL04-MPSD at ALBA synchrotron.
2.3. Crystal and magnetic structure characterization: x-ray and neutron diffraction
67
2.3.5. Neutron properties and basic concepts on neutron scattering
Neutrons are heavy subatomic particles, which, together with protons, form the nuclei
of the atoms. They were discovered in 1932 by Chadwick, and it was four years later, in 1936,
when it was discovered that they can be diffracted, corroborating their wave-particle duality.
The appearance of the first nuclear reactors in 1942, with the consequent increase of the
available neutron flux, made possible their use for neutron scattering experiments. At present,
neutron scattering experiments are carried out in nuclear reactors, where neutrons come from
the fission of 235U, or in spallation sources, where neutrons are produced by the incidence of
accelerated protons in heavy elements as W, Pb or Hg.
The excellent properties that neutrons present for the study of condensed matter make
of them an exceptional experimental tool for the study of the alloys addressed in this thesis:
The wavelengths of the neutrons are of the same order of magnitude that the
interatomic distances in the samples, and the energies of the neutrons are of the same
order of the thermal excitations in solids and liquids. Therefore, neutrons can probe
the structural and dynamical properties of the alloys.
The neutron has no charge, the interaction with matter is weak, and consequently
can penetrate more deeply in the matter than other probes like X-rays. That allows
studying materials in bulk, and the use of different environments as cryostats,
furnaces or pressure cells. The drawback is the need for relatively big samples to
compensate for the low scattering probability.
The scattering of neutrons is mainly produced in the nuclei, which can be considered
as point object in comparison with the wavelength of the neutrons. Therefore, the
scattering amplitude for neutrons, called scattering length or fermi length, b, is
constant in the reciprocal space and there is no decay of the scattering amplitude
with Q, which makes neutrons particularly adapted for precise structural
determinations, since very small atomic displacements can be identified.
The neutron has a magnetic moment (spin s=1/2), which means that it interacts with
unpaired electrons in magnetic atoms. Therefore, the elastic scattering gives
information about the arrangement of electron spins and the density of the
distribution of unpaired neutrons. In the case of the inelastic scattering, the energy
change in the neutron gives information about the magnetic excitations.
The scattering cross section is not proportional to Z, which makes neutrons
particularly advantageous for the investigation of materials with light atoms in
presence of heavier elements in their composition and, as in the present case, for the
study of alloys with elements that are neighbors in the periodic table. Moreover, they
can distinguish isotopes of the same atom allowing the analysis of materials by
isotopic substitution.
The basic quantity to describe a scattering process is the scattering cross section, ,
defined as the ratio between the number of neutrons scattered per second and the incident flux,
Φ (number of neutrons per area and time unit). During a scattering process, a neutron with mass
m, initial wavevector, k, energy, E, and spin , is scattered by the sample into a small solid
angle, dΩ, in the direction θ, , given by the vector r, with final wavevector, k’, energy, E’ and
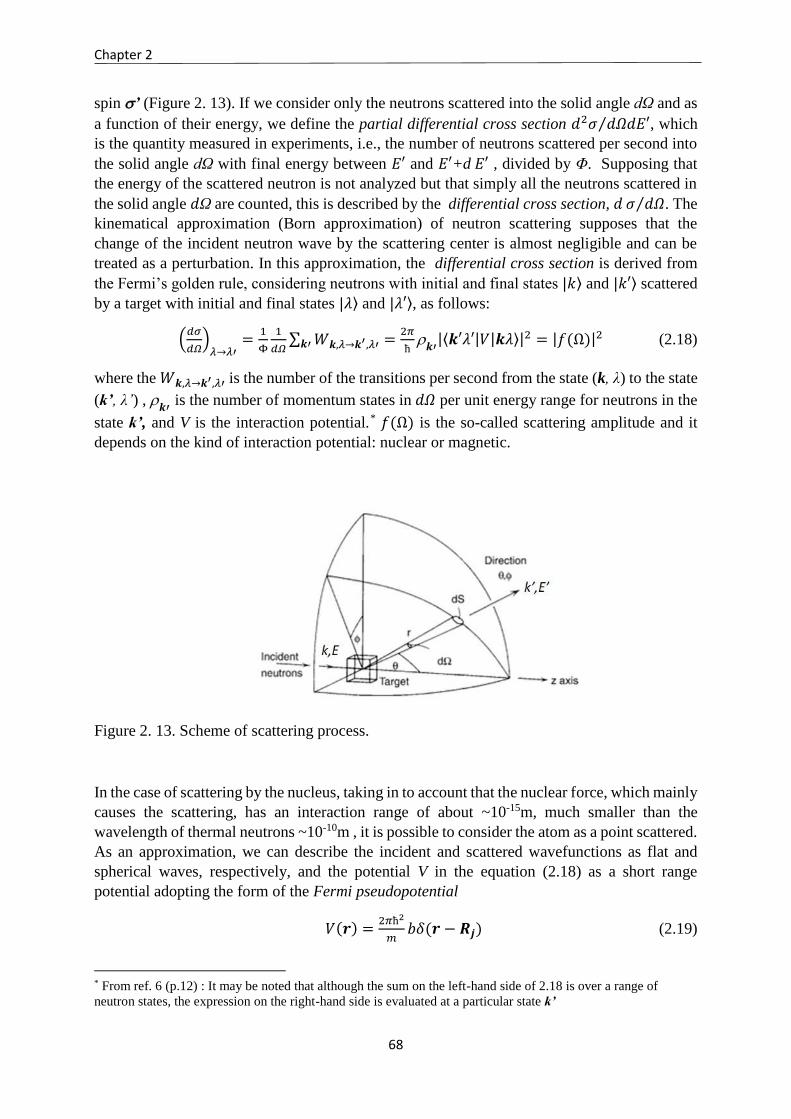
Chapter 2
68
spin ’ (Figure 2. 13). If we consider only the neutrons scattered into the solid angle dΩ and as
a function of their energy, we define the partial differential cross section 𝑑2𝜎 𝑑𝛺𝑑𝐸′⁄ , which
is the quantity measured in experiments, i.e., the number of neutrons scattered per second into
the solid angle dΩ with final energy between 𝐸′ and 𝐸′+d 𝐸′ , divided by Φ. Supposing that
the energy of the scattered neutron is not analyzed but that simply all the neutrons scattered in
the solid angle 𝑑Ω are counted, this is described by the differential cross section, 𝑑 𝜎 𝑑𝛺⁄ . The
kinematical approximation (Born approximation) of neutron scattering supposes that the
change of the incident neutron wave by the scattering center is almost negligible and can be
treated as a perturbation. In this approximation, the differential cross section is derived from
the Fermi’s golden rule, considering neutrons with initial and final states |𝑘⟩ and |𝑘′⟩ scattered
by a target with initial and final states |𝜆⟩ and |𝜆′⟩, as follows:
(𝑑𝜎
𝑑𝛺)
𝜆→𝜆′=
1
Φ
1
𝑑𝛺∑ 𝑊𝒌,𝜆→𝒌′,𝜆′ =
2𝜋
ћ
𝒌′|⟨𝒌′𝜆′|𝑉|𝒌𝜆⟩|2 = |𝑓(Ω)|2
𝒌′ (2.18)
where the 𝑊𝒌,𝜆→𝒌′,𝜆′ is the number of the transitions per second from the state (k, λ) to the state
(k’, λ’) , 𝒌′
is the number of momentum states in 𝑑𝛺 per unit energy range for neutrons in the
state k’, and V is the interaction potential.* 𝑓(Ω) is the so-called scattering amplitude and it
depends on the kind of interaction potential: nuclear or magnetic.
Figure 2. 13. Scheme of scattering process.
In the case of scattering by the nucleus, taking in to account that the nuclear force, which mainly
causes the scattering, has an interaction range of about ~10-15m, much smaller than the
wavelength of thermal neutrons ~10-10m , it is possible to consider the atom as a point scattered.
As an approximation, we can describe the incident and scattered wavefunctions as flat and
spherical waves, respectively, and the potential V in the equation (2.18) as a short range
potential adopting the form of the Fermi pseudopotential
𝑉(𝒓) =2𝜋ћ2
𝑚𝑏𝛿(𝒓 − 𝑹𝒋) (2.19)
* From ref. 6 (p.12) : It may be noted that although the sum on the left-hand side of 2.18 is over a range of
neutron states, the expression on the right-hand side is evaluated at a particular state k’
2.3. Crystal and magnetic structure characterization: x-ray and neutron diffraction
69
where 𝛿(𝒓 − 𝑹𝒋) is a three-dimensional Dirac delta function with r, the neutron position and
𝑹𝑗, the position of the scattering center j. b is the scattering length, a complex number with
dimensions of length, where the real part accounts for the nuclear scattering and the imaginary
one is related to the absorption. By convention, b is positive for repulsive potentials. The
incident and scattered wavefunctions can be expressed as:
|𝑘⟩ = 𝑒𝑖𝑘𝑧 (2.20)
|𝑘′⟩ = −𝑏
𝑟𝑒𝑖𝒌′𝒓 (2.21)
In the case of the scattering by a single nucleus, 𝑑𝜎 𝑑𝛺⁄ = 𝑏2 and 𝜎𝑡𝑜𝑡 = 4𝜋𝑏2, which means
that the cross section can be considered as the effective area of the nucleus.
Replacing Fermi’s pseudopotential in eq. (2.18), applying the conservation of the energy,
adding in λ’ and averaging over λ, the expression for the cross section per energy unit becomes
[6]:
𝑑2𝜎
𝑑𝛺𝑑𝐸′= ∑ 𝑝𝜆 (
𝑑2𝜎
𝑑𝛺𝑑𝐸′)
𝜆→𝜆′=𝜆𝜆′
𝑘′
𝑘
1
2𝜋ћ∑ 𝑏𝑗𝑏𝑗′𝑗𝑗′ ∫ ⟨𝑒−𝑖𝑸∙𝑹𝒋′(0)𝑒𝑖𝑸∙𝑹𝒋′(𝑡)⟩
∞
−∞𝑒−𝑖𝜔𝑡𝑑𝑡 (2.22)
where 𝑝𝜆is the probability that the target (sample) has initial state λ, 𝑸 is the scattering vector
(𝑸 = 𝒌 − 𝒌′) and is defined as ћ𝜔 = 𝐸 − 𝐸′ . 𝑝𝜆 is given by the Boltzmann distribution
𝑝𝜆 =1
𝑍𝑒
(−𝐸𝜆
𝑘𝐵𝑇) where Z is the partition function introduced to ensure that ∑ 𝑝𝜆 = 1𝜆 .
For a system of N scattering centers, the sum in 𝑏𝑗𝑏𝑗′ gives a term in (�̅�)2 related with the
coherent scattering , implying correlation between the positions of different nuclei, j and j’, and
a term in 𝑏2̅̅ ̅ − (�̅�)2 related with the incoherent scattering , accounting for the correlation
between the position of the same nucleus at time 0 and at time t:
(𝑑2𝜎
𝑑𝛺𝑑𝐸′)𝑐𝑜ℎ
= (�̅�)2 𝑘′
𝑘
1
2𝜋ћ∑ ∫ ⟨𝑒−𝑖𝑸∙𝑹𝒋′(0)𝑒𝑖𝑸∙𝑹𝒋(𝑡)⟩
∞
−∞𝑒−𝑖𝜔𝑡𝑑𝑡𝑗𝑗′ (2.23)
(𝑑2𝜎
𝑑𝛺𝑑𝐸′)𝑖𝑛𝑐
= {𝑏2̅̅ ̅ − (�̅�)2
}𝑘′
𝑘
1
2𝜋ћ∑ ∫ ⟨𝑒−𝑖𝑸∙𝑹𝒋(0)𝑒𝑖𝑸∙𝑹𝒋(𝑡)⟩
∞
−∞𝑒−𝑖𝜔𝑡𝑑𝑡𝑗 (2.24)
The coherent scattering depends on the direction of the scattering and can give interference
effects between the waves dispersed by the different nuclei. The elastic ( = 0) coherent
scattering contains information about structures in equilibrium whereas inelastic ( ≠ 0)
coherent scattering provides information about the collective motions of the atoms. Incoherent
scattering is isotropic and gives no interference effect and, since it depends on the correlation
between the position of the same nucleus at different times, can give information about atomic
motion.
When elastic coherent scattering gives interference effects between the waves dispersed
by the different scattering centers, diffraction phenomena occur. In a periodic system, such as
a crystalline solid, the partial differential cross section for elastic coherent scattering becomes:
(𝑑2𝜎
𝑑𝛺𝑑𝐸′)𝑐𝑜ℎ𝑒𝑙
= (�̅�)2 𝑘′
𝑘
𝑁
2𝜋ћ𝑒(−𝑖𝑸∙𝒖)2
∑ 𝑒𝑖𝑸∙𝒍 ∫ 𝑒−𝑖𝜔𝑡∞
−∞𝑑𝑡𝒍 (2.25)
Chapter 2
70
where we have considered the crystal as a Bravais lattice with N nodes with positions described
by 𝒍 + 𝒖, where l is the position of the cell in the lattice and 𝒖 is the atomic displacement with
respect to l (only one atom per unit cell).
The integral with respect to t is ∫ 𝑒−𝑖𝜔𝑡∞
−∞𝑑𝑡 = 2𝜋ћ𝛿(ћ𝜔) and since ћ𝜔 is the change in the
energy of the neutron we see that the scattering is elastic and thus |𝒌| = |𝒌′|
Integrating in energy, that is, counting all the neutrons scattered in a given direction regardless
of their energy, we obtain
(𝑑𝜎
𝑑𝛺)
𝑐𝑜ℎ𝑒𝑙
= ∫ (𝑑2𝜎
𝑑𝛺𝑑𝐸′)𝑐𝑜ℎ𝑒𝑙
∞
0𝑑𝐸′ = (�̅�)
2 𝑁
2𝜋ћ𝑒(−𝑖𝑸∙𝒖)2
∑ 𝑒𝑖𝑸∙𝒍𝑙 (2.26)
The lattice sum ∑ 𝑒𝑖𝑸∙𝒍𝑙 implies that diffraction maxima will occur when the interference of the
waves is constructive, that is, when 𝑒𝑖𝑸∙𝒍 = 1, which occurs when 𝑸 = 𝒌 − 𝒌’ = 𝝉, with 𝝉 a
reciprocal lattice vector. This condition is the same as Bragg’s law (see section 2.5.1).
If we consider that we can have different scattering centers inside the unit cell of the lattice with
position vector d with respect to l, then
(𝑑2𝜎
𝑑𝛺)
𝑐𝑜ℎ𝑒𝑙
= 𝑁(∑ 𝑏𝑑𝑒𝑖𝑸∙𝒅𝑑 𝑒−𝑖𝑸∙𝒖)
2∑ 𝑒𝑖𝑸∙𝒍
𝑙 = 𝑁|𝐹𝑁(𝑄)|2 ∑ 𝑒𝑖𝑸∙𝒍𝑙 (2.27)
where 𝐹𝑁(𝑄) is the nuclear structure factor, in a description equivalent to the one in section
2.5.1.
2.3.6. Magnetic diffraction
As mentioned before, the magnetic moment of the neutrons makes possible the
interaction with the magnetic field produced by unpaired electrons of the atoms, since they
present a magnetic dipole moment. Therefore, the coherent elastic scattering contains
information about magnetic structures, while the coherent inelastic scattering provides
information about the collective magnetic excitations (magnons).
Both, the neutron and the unpaired electron, present magnetic dipole moments that are
given by:
𝝁𝒏 = −𝛾𝜇𝑁𝝈 (2.28)
𝝁𝒆 = −2𝜇𝐵𝒔 (2.29)
where 𝜇𝑁 = 𝑒ћ 2𝑚𝑝⁄ is the nuclear magneton, determined by the proton mass 𝑚𝑝 , its charge
𝑒 and a positive constant 𝛾 = 1.913 (gyromagnetic constant); 𝜇𝐵 = 𝑒ћ 2𝑚𝑒⁄ is the Bohr
magneton, determined by the electron mass 𝑚𝑒, and charge 𝑒; 𝝈 is the Pauli spin operator for
the neutron, with eigenvalues ±1 and 𝒔 is the spin angular momentum operator for the electron
with eigenvalues ±1/2. An important consequence of the dipolar nature of the magnetic
interaction is that the scattering is not isotropic, and only the component of the magnetization
of the sample that is perpendicular to the scattering vector Q is effective in scattering neutrons.
2.3. Crystal and magnetic structure characterization: x-ray and neutron diffraction
71
The magnetic interaction potential, Vm, between the neutron dipole moment and the magnetic
field, H, produced by a system of n unpaired electrons at ri positions with spins si and momenta
pi is
𝑉𝑚(𝒓) = 𝝁𝒏𝑯 = −𝛾𝜇𝑁𝝈2𝜇𝐵 ∙ [∑ ∇𝑛𝑖 × (
𝒔𝒊×𝑹𝒊
𝑅𝑖3 ) −
1
ћ
𝒑𝒊×𝑹𝒊
𝑅𝑖3 ] (2.30)
where Ri = r - ri . The first term inside the brackets accounts for the dipolar interaction of the
spin of the neutron with those of the electrons, while the second term comes from the spin-orbit
coupling between the neutron spin and the orbital motion of the electrons. The Fourier
transform of Vm can be expressed as:
𝑉𝑚(𝑸) =2𝜋ћ2
𝑚𝑝𝝈𝑸⊥(𝑸) (2.31)
where p is a constant (2.696 10-13 cm/𝜇𝑁𝐵) and 𝑸⊥(𝑸) is defined as:
𝑸⊥(𝑸) = ∑ 𝑒𝑸𝒓𝒊𝑛𝑖
1
𝑄2(𝑸 × 𝒔𝒊 × 𝑸 −
𝑖
ћ 𝑸 × 𝒑𝒊) (2.32)
If we define the spin and orbital magnetization densities Ms(r) and ML(r) as follows:
𝑴𝑆(𝒓) = −2𝜇𝐵 ∑ 𝒔𝒊𝑛𝑖 𝛿(𝒓 − 𝒓𝒊) (2.33)
∇ × 𝑴𝐿(𝒓) = −𝑒
𝑚𝑐∑ 𝒑𝒊
𝑛𝑖 𝛿(𝒓 − 𝒓𝒊) (2.34)
we can write 𝑸⊥(𝑸) as:
𝑸⊥(𝑸) = 1
2𝜇𝐵∫ 𝑒𝑸𝒓 1
𝑄2(𝑸 × 𝑴(𝒓) × 𝑸) (2.35)
where 𝑴(𝒓) = 𝑴𝑆(𝒓) + 𝑴𝐿(𝒓) is the total magnetization density.
We can define a magnetic structure factor for the neutron diffraction by the magnetic field
generated by the electrons, which is the Fourier transform of the magnetization, M:
𝑭𝑴(𝑸) = 𝑝 ∑ 𝑴𝑖𝑖 𝑒𝑖𝑸𝒓𝒊 (2.36)
(the Debye-Waller factor has been omitted for simplicity) and
𝑭𝑴⊥(𝑸) =1
𝑄2 (𝑸 × 𝑭𝑴 × 𝑸) (2.37)
which is the quantity that plays the role of the nuclear structure factor in nuclear diffraction but
that has a vector and not a scalar character.
The magnetic structures can have a periodicity that is different to the one of the nuclear
structure. To describe it, we use the magnetic propagation vector q (denoted also often as k),
which relates the nuclear unit cell with the magnetic one. q describes the relation between a
magnetic moment and its equivalent in the unit cell, the magnetic moment of an atom j in the
nuclear unit cell being:
𝒎𝑗𝑙 = − ∑ 𝒎𝑗𝑞𝑞 𝑒𝑖𝒒𝒍 (2.38)
with l a lattice vector. Then, in the magnetic case, diffraction maxima will occur when 𝑸 = 𝝉 +
𝒒, with 𝝉 a reciprocal lattice vector. A magnetic structure can have several propagation vectors,
but the most common case is the situation with only one. When the magnetic and the nuclear
Chapter 2
72
cell are the same, as in the case of ferromagnetic structures, q = 0 and the magnetic and nuclear
diffraction peaks are superimposed.
Therefore, we can treat the magnetic diffraction in an analogous way to the case of
nuclear scattering by using 𝑭𝑴⊥(𝑸) in the place of 𝐹𝑁(𝑸) and introducing the magnetic
propagation vectors to describe the periodicity. However, there are important differences that
arise from the different nature of the interactions. As mentioned before, the magnetic scattering
is not isotropic, and only the component of the magnetization of the sample that is perpendicular
to the scattering vector Q can be probed. Also, contrarily to the case of nuclear scattering, the
magnetic scattering amplitude decays with Q (or, equivalently, with 2) due to the fact that the
interaction potential is not a delta function, but is spread in the space, and therefore its Fourier
transform is not a constant in Q-space but decays at high Q. Moreover, the magnetic scattering
is proportional to the ordered magnetic moment, and thus temperature-dependent (going to zero
at temperatures higher than the magnetic ordering temperature)
In the general case, there may be nuclear and magnetic diffraction. If the incident
neutron beam is not polarized, the nuclear and magnetic intensities simply add up. Nevertheless
if we consider the possible polarization of the incident and scattered beams, there are
interference terms between the nuclear and magnetic structure factors.
2.3.7. Polarized neutron diffraction
As seen in the previous section, the magnetic structure factors are the Fourier transform
of the magnetization density. Then, the magnetization density distribution can be determined
from the precise measurement of the magnetic structure factors. Polarized neutron diffraction
[7] by the classical polarized beam technique is an experimental method that allows measuring
magnetic structure factors in a precise way.
For unpolarized neutrons, when both magnetic and nuclear scattering are present, the
diffracted intensity is simply the sum of the squared nuclear and magnetic structure factors:
𝐼 = |𝐹𝑁|2 + |𝑭𝑴⊥|2 = |𝐹𝑁|2(1 + 𝛾2) (2.39)
where 𝛾 is the ratio between the magnetic and nuclear structure factors. The fact that neutrons
have spin can be used to polarize a neutron beam. In a polarized neutron diffraction experiment
using the classical polarized beam technique, the incident neutron beam is polarized along the
vertical axis, Z, and no polarization analysis is performed for the scattered neutrons. A vertical
magnetic field is applied to the sample in order to have a net component of the magnetization
in the vertical direction. Then, the diffracted intensity can be written, for the simplest cases (see
below):
𝐼± = |𝐹𝑁 ± 𝐹𝑀⊥|2 = |𝐹𝑁|2(1 ± 2𝛾 + 𝛾2) (2.40)
where the superscript indicates that the incident neutron beam is polarized parallel (+) or
antiparallel (-) to the vertical axis. Since in eq. 2.40 𝛾 appears as a first order term, in polarized
neutron diffraction the sensitivity in the measurement of magnetic structure factors is improved
thanks to the interference term between the nuclear and magnetic structure factors, compared
with unpolarized neutrons diffraction, where 𝛾 appears as a second order term. Eq. 2.40 is only
2.3. Crystal and magnetic structure characterization: x-ray and neutron diffraction
73
valid when the magnetic structure is non chiral, the nuclear and magnetic diffraction peaks are
superposed and the magnetization is parallel to the vertical direction. This condition is fulfilled
by ferromagnetic materials (as the ones studied in this work), but also by ferromagnetic,
antiferromagnetic and paramagnetic materials with a ferromagnetic component induced by an
applied magnetic field.
In the experimental setup of a polarized neutron diffraction experiment using the
classical polarized beam technique, the neutron beam is at the same time monochromated and
polarized by a polarizing monochromator, which is a single crystal with a Bragg reflection for
which 𝐹𝑁 = ±𝐹𝑀𝑧, where 𝐹𝑀𝑧
is the component of the magnetic structure factor in z direction.
In this way, the interference between the nuclear and the magnetic terms of the scattering
amplitude is constructive for one polarization state and destructive for the opposite. Once the
neutrons are polarized, magnetic guide fields are used to maintain the polarization of the
neutron beam, which can be reversed with a cryoflipper. A high magnetic field is applied to the
sample in the vertical direction order to obtain a vertical magnetization component. This
configuration introduces the limitation that only reflections close to the horizontal plane can be
measured. The temperature of the sample can also be varied to choose the appropriate
experimental conditions.
In this technique, the ratio, R, between the intensities detected for incoming beam
polarized parallel or antiparallel to the vertical axis is measured instead of the integrated
intensity; this method is called flipping-ratio method. This technique presents several
advantages. Apart from the aforementioned increase in the sensitivity to the magnetic signal,
several corrections in the intensity, like the absorption, are canceled out in the flipping-ratio
expression. Finally, it is not necessary to measure all the diffracted intensity of a reflection, but
only to compare the intensities for both neutron-spin polarizations for the same crystal position,
avoiding the problems related to the integration of Bragg peaks and simplifying the
measurements.
In the general case (for non chiral magnetic structures), the expression of the flipping
ratio is:
𝑅 =𝐼+
𝐼−=
|𝐹𝑁|2+(𝐹𝑁𝐹𝑀⊥𝑧∗ + 𝐹𝑁
∗ 𝐹𝑀⊥𝑧)+|𝑭𝑴⊥|2
|𝐹𝑁|2−(𝐹𝑁𝐹𝑀⊥𝑧∗ + 𝐹𝑁
∗ 𝐹𝑀⊥𝑧)+|𝑭𝑴⊥|2 (2.41)
This expression is much simplified if the magnetization is perfectly parallel to the
vertical axis and if the structure is centrosymmetric (both nuclear and magnetic structure factors
are real), as is the case for the alloys studied in this thesis. Considering the angle 𝛼 between the
scattering vector and the vertical axis, the flipping-ratio is written as
𝑅 =𝐼+
𝐼−=
|𝐹𝑁|2+2𝑠𝑖𝑛2𝛼𝐹𝑁𝐹𝑀+𝑠𝑖𝑛2𝛼|𝐹𝑀|2
|𝐹𝑁|2+2𝑠𝑖𝑛2𝛼𝐹𝑁𝐹𝑀+𝑠𝑖𝑛2𝛼|𝐹𝑀|2 (2.42)
where both FN and FM are now scalar and real quantities. Therefore, if the nuclear structure
factors are known from a different unpolarized neutron diffraction experiment at the same
temperature, the magnetic structure factors can be extracted from the measured flipping ratios
and their Fourier inversion gives directly the spin density distribution. Another important
advantage of the flipping ratio method can be remarked at this point: the previous equation,
valid for centrosymmetric structures, gives not only the amplitude of the magnetic structure
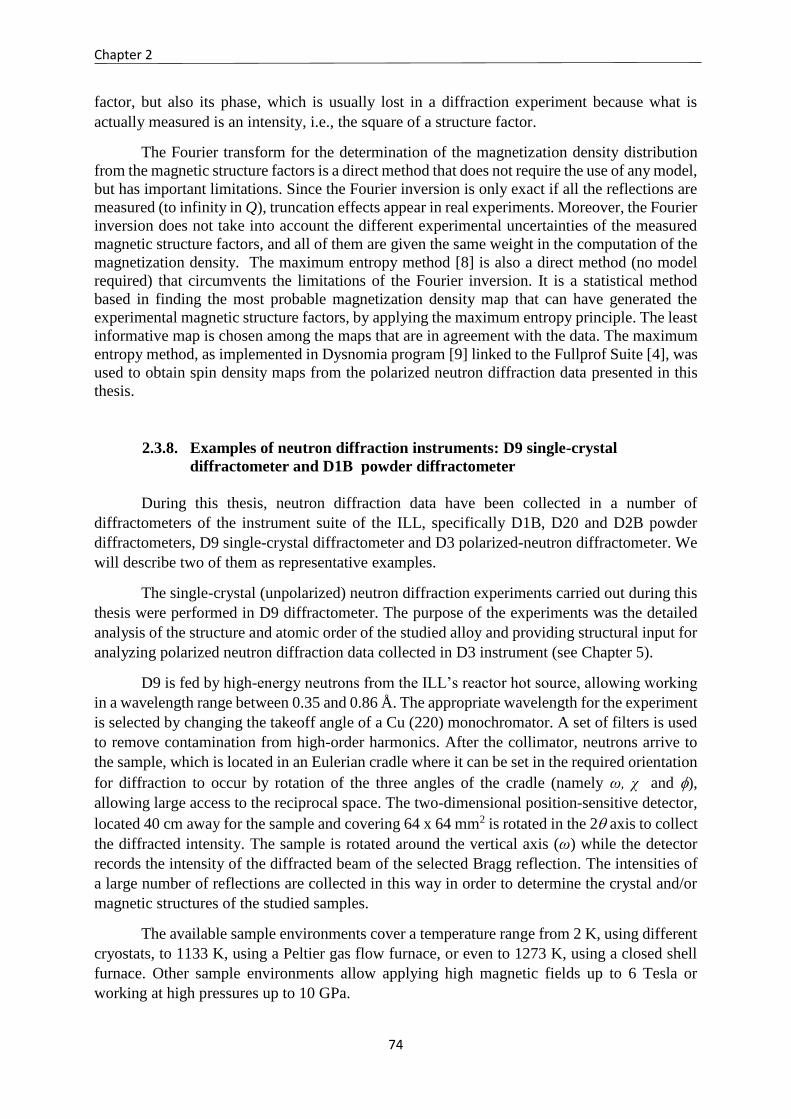
Chapter 2
74
factor, but also its phase, which is usually lost in a diffraction experiment because what is
actually measured is an intensity, i.e., the square of a structure factor.
The Fourier transform for the determination of the magnetization density distribution
from the magnetic structure factors is a direct method that does not require the use of any model,
but has important limitations. Since the Fourier inversion is only exact if all the reflections are
measured (to infinity in Q), truncation effects appear in real experiments. Moreover, the Fourier
inversion does not take into account the different experimental uncertainties of the measured
magnetic structure factors, and all of them are given the same weight in the computation of the
magnetization density. The maximum entropy method [8] is also a direct method (no model
required) that circumvents the limitations of the Fourier inversion. It is a statistical method
based in finding the most probable magnetization density map that can have generated the
experimental magnetic structure factors, by applying the maximum entropy principle. The least
informative map is chosen among the maps that are in agreement with the data. The maximum
entropy method, as implemented in Dysnomia program [9] linked to the Fullprof Suite [4], was
used to obtain spin density maps from the polarized neutron diffraction data presented in this
thesis.
2.3.8. Examples of neutron diffraction instruments: D9 single-crystal
diffractometer and D1B powder diffractometer
During this thesis, neutron diffraction data have been collected in a number of
diffractometers of the instrument suite of the ILL, specifically D1B, D20 and D2B powder
diffractometers, D9 single-crystal diffractometer and D3 polarized-neutron diffractometer. We
will describe two of them as representative examples.
The single-crystal (unpolarized) neutron diffraction experiments carried out during this
thesis were performed in D9 diffractometer. The purpose of the experiments was the detailed
analysis of the structure and atomic order of the studied alloy and providing structural input for
analyzing polarized neutron diffraction data collected in D3 instrument (see Chapter 5).
D9 is fed by high-energy neutrons from the ILL’s reactor hot source, allowing working
in a wavelength range between 0.35 and 0.86 Å. The appropriate wavelength for the experiment
is selected by changing the takeoff angle of a Cu (220) monochromator. A set of filters is used
to remove contamination from high-order harmonics. After the collimator, neutrons arrive to
the sample, which is located in an Eulerian cradle where it can be set in the required orientation
for diffraction to occur by rotation of the three angles of the cradle (namely ω, χ and ),
allowing large access to the reciprocal space. The two-dimensional position-sensitive detector,
located 40 cm away for the sample and covering 64 x 64 mm2 is rotated in the 2 axis to collect
the diffracted intensity. The sample is rotated around the vertical axis (ω) while the detector
records the intensity of the diffracted beam of the selected Bragg reflection. The intensities of
a large number of reflections are collected in this way in order to determine the crystal and/or
magnetic structures of the studied samples.
The available sample environments cover a temperature range from 2 K, using different
cryostats, to 1133 K, using a Peltier gas flow furnace, or even to 1273 K, using a closed shell
furnace. Other sample environments allow applying high magnetic fields up to 6 Tesla or
working at high pressures up to 10 GPa.
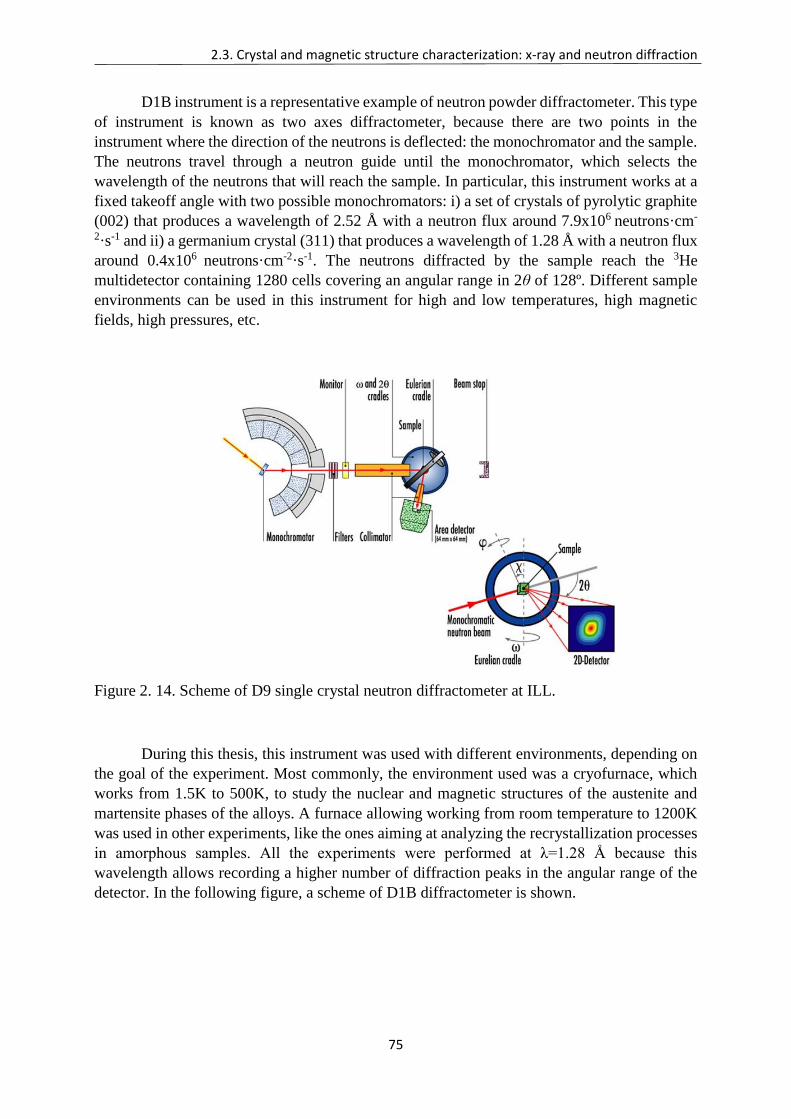
2.3. Crystal and magnetic structure characterization: x-ray and neutron diffraction
75
D1B instrument is a representative example of neutron powder diffractometer. This type
of instrument is known as two axes diffractometer, because there are two points in the
instrument where the direction of the neutrons is deflected: the monochromator and the sample.
The neutrons travel through a neutron guide until the monochromator, which selects the
wavelength of the neutrons that will reach the sample. In particular, this instrument works at a
fixed takeoff angle with two possible monochromators: i) a set of crystals of pyrolytic graphite
(002) that produces a wavelength of 2.52 Å with a neutron flux around 7.9x10⁶ neutrons·cm-
2·s-1 and ii) a germanium crystal (311) that produces a wavelength of 1.28 Å with a neutron flux
around 0.4x10⁶ neutrons·cm-2·s-1. The neutrons diffracted by the sample reach the 3He
multidetector containing 1280 cells covering an angular range in 2θ of 128º. Different sample
environments can be used in this instrument for high and low temperatures, high magnetic
fields, high pressures, etc.
Figure 2. 14. Scheme of D9 single crystal neutron diffractometer at ILL.
During this thesis, this instrument was used with different environments, depending on
the goal of the experiment. Most commonly, the environment used was a cryofurnace, which
works from 1.5K to 500K, to study the nuclear and magnetic structures of the austenite and
martensite phases of the alloys. A furnace allowing working from room temperature to 1200K
was used in other experiments, like the ones aiming at analyzing the recrystallization processes
in amorphous samples. All the experiments were performed at λ=1.28 Å because this
wavelength allows recording a higher number of diffraction peaks in the angular range of the
detector. In the following figure, a scheme of D1B diffractometer is shown.
Chapter 2
76
Figure 2. 15. Scheme of the powder diffractometer D1B at ILL.
Bibliography
77
Bibliography
[1] Vicente Recarte, “Estudio de los parámetros microstructurales que controlan la
transformación martensítica en las aleaciones de Cu-Al-Ni con memoria de forma.,”
Universidad del País Vasco UPV/EHU, 1997.
[2] V. K. Pecharsky, K. A. Gschneidner, A. O. Pecharsky, and A. M. Tishin,
“Thermodynamics of the magnetocaloric effect,” Phys. Rev. B, vol. 64, no. 14, p. 144406,
Sep. 2001.
[3] X. Moya, S. Kar-Narayan, and N. D. Mathur, “Caloric materials near ferroic phase
transitions,” Nat. Mater., vol. 13, no. 5, pp. 439–450, May 2014.
[4] J. Rodríguez-Carvajal, “Recent advances in magnetic structure determination by neutron
powder diffraction,” Phys. B Condens. Matter, vol. 192, no. 1, pp. 55–69, Oct. 1993.
[5] L. A. Aslanov, G. V. Fetisov, and J. A. K. Howard, Crystallographic Instrumentation.
International Union of Crystallography, 1998.
[6] G. L. Squires, Introduction to the Theory of Thermal Neutron Scattering. Mineola, N.Y:
Dover Publications, 1997.
[7] E. Ressouche, “Polarized neutron diffraction,” Éc. Thématique Société Fr. Neutron., vol.
13, p. 2002, 2014.
[8] R. J. Papoular and B. Gillon, “Maximum Entropy Reconstruction of Spin Density Maps in
Crystals from Polarized Neutron Diffraction Data,” EPL Europhys. Lett., vol. 13, no. 5, p.
429, 1990.
[9] K. Momma, T. Ikeda, A. A. Belik, and F. Izumi, “Dysnomia, a computer program for
maximum-entropy method (MEM) analysis and its performance in the MEM-based
pattern fitting,” Powder Diffr., vol. 28, no. 3, pp. 184–193, Sep. 2013.

78
79
Chapter 3. Relation between
microstructure, atomic order and
magneto-structural properties in Ni-
Mn-Sn system
3.1. INTRODUCTION
As explained in the general introduction, the Ni-Mn-Sn (and Ni-Mn-Sb) systems present
a very high stability of the L21 structure. Therefore, standard thermal treatments (annealing and
quenching) are unable to modify the atomic order [1], contrarily to what happens in Ni-Mn-In
and its quaternary systems, where the long-range atomic order can be modified by those
conventional thermal treatments and large shifts of the MT temperature can be achieved [2–4].
In Ni-Mn-Sn alloys, then, it appears that the only way to tune the functional properties is the
modification of the microstructure, which can be controlled using thermo-mechanical
treatments such as milling and post-milling annealing. Here, we undertake a systematic study
of the different microstructural states caused by such thermo-mechanical treatments in the
Ni50Mn35Sn15 system, aiming at quantitatively correlate them with the magnetostructural
properties of the alloy.
In order to create different microstructural states in a controlled way, a Ni50Mn35Sn15
alloy has been mechanically milled and then annealed at different temperatures. The analysis
of the microstructural parameters (crystallite size and internal stresses) was performed by means
of X-rays diffraction at room temperature, while neutron diffraction has been used to establish
the atomic order and the magnetic coupling between Mn atoms, determining the reason of the
observed variations in the magnetization. Further insight into the magnetism of the alloys and
the local environment of the Sn atoms has been obtained by 119Sn-Mössbauer spectroscopy.
The evolution of the microstructural parameters has been quantified and correlated to the
evolution of the MT features and the magnetic properties, characterized by means of DSC and
magnetometry measurements, in order to explain the observation that the relaxation processes
brought by annealing leads to recovery of the MT and the enhancement of the magnetism at
both macroscopic and local levels.
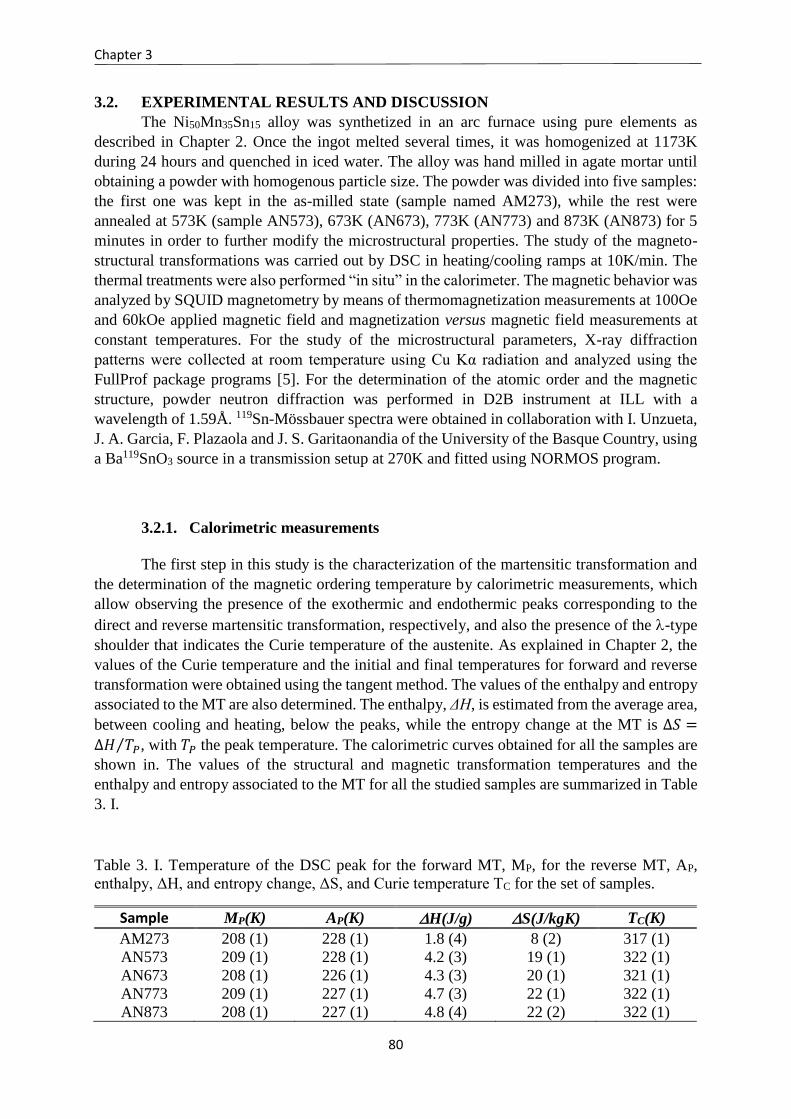
Chapter 3
80
3.2. EXPERIMENTAL RESULTS AND DISCUSSION
The Ni50Mn35Sn15 alloy was synthetized in an arc furnace using pure elements as
described in Chapter 2. Once the ingot melted several times, it was homogenized at 1173K
during 24 hours and quenched in iced water. The alloy was hand milled in agate mortar until
obtaining a powder with homogenous particle size. The powder was divided into five samples:
the first one was kept in the as-milled state (sample named AM273), while the rest were
annealed at 573K (sample AN573), 673K (AN673), 773K (AN773) and 873K (AN873) for 5
minutes in order to further modify the microstructural properties. The study of the magneto-
structural transformations was carried out by DSC in heating/cooling ramps at 10K/min. The
thermal treatments were also performed “in situ” in the calorimeter. The magnetic behavior was
analyzed by SQUID magnetometry by means of thermomagnetization measurements at 100Oe
and 60kOe applied magnetic field and magnetization versus magnetic field measurements at
constant temperatures. For the study of the microstructural parameters, X-ray diffraction
patterns were collected at room temperature using Cu Kα radiation and analyzed using the
FullProf package programs [5]. For the determination of the atomic order and the magnetic
structure, powder neutron diffraction was performed in D2B instrument at ILL with a
wavelength of 1.59Å. 119Sn-Mössbauer spectra were obtained in collaboration with I. Unzueta,
J. A. Garcia, F. Plazaola and J. S. Garitaonandia of the University of the Basque Country, using
a Ba119SnO3 source in a transmission setup at 270K and fitted using NORMOS program.
3.2.1. Calorimetric measurements
The first step in this study is the characterization of the martensitic transformation and
the determination of the magnetic ordering temperature by calorimetric measurements, which
allow observing the presence of the exothermic and endothermic peaks corresponding to the
direct and reverse martensitic transformation, respectively, and also the presence of the -type
shoulder that indicates the Curie temperature of the austenite. As explained in Chapter 2, the
values of the Curie temperature and the initial and final temperatures for forward and reverse
transformation were obtained using the tangent method. The values of the enthalpy and entropy
associated to the MT are also determined. The enthalpy, ΔH, is estimated from the average area,
between cooling and heating, below the peaks, while the entropy change at the MT is ∆𝑆 =
∆𝐻 𝑇𝑃⁄ , with 𝑇𝑃 the peak temperature. The calorimetric curves obtained for all the samples are
shown in. The values of the structural and magnetic transformation temperatures and the
enthalpy and entropy associated to the MT for all the studied samples are summarized in Table
3. I.
Table 3. I. Temperature of the DSC peak for the forward MT, MP, for the reverse MT, AP,
enthalpy, ΔH, and entropy change, ΔS, and Curie temperature TC for the set of samples.
Sample MP(K) AP(K) H(J/g) S(J/kgK) TC(K)
AM273 208 (1) 228 (1) 1.8 (4) 8 (2) 317 (1)
AN573 209 (1) 228 (1) 4.2 (3) 19 (1) 322 (1)
AN673 208 (1) 226 (1) 4.3 (3) 20 (1) 321 (1)
AN773 209 (1) 227 (1) 4.7 (3) 22 (1) 322 (1)
AN873 208 (1) 227 (1) 4.8 (4) 22 (2) 322 (1)
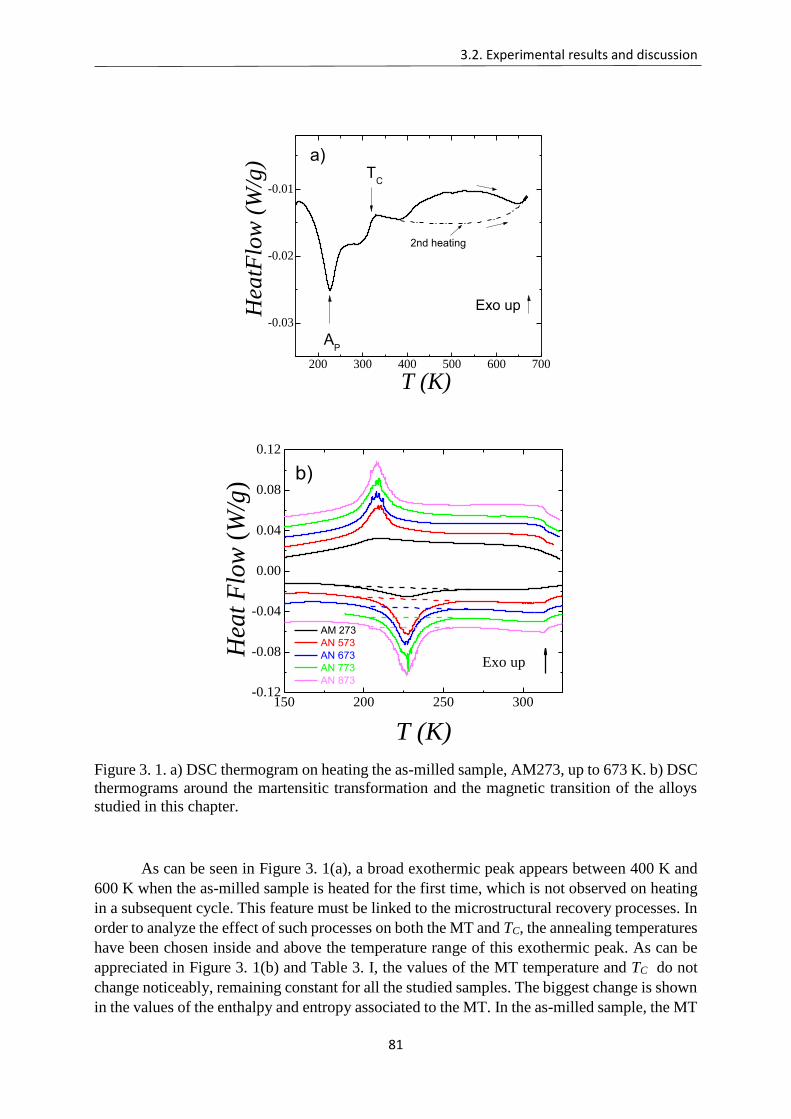
3.2. Experimental results and discussion
81
200 300 400 500 600 700
-0.03
-0.02
-0.01
TC
Hea
tFlo
w (
W/g
)
T (K)
Exo up
AP
a)
2nd heating
150 200 250 300-0.12
-0.08
-0.04
0.00
0.04
0.08
0.12
b)
Hea
t F
low
(W
/g)
T (K)
AM 273
AN 573
AN 673
AN 773
AN 873
Exo up
Figure 3. 1. a) DSC thermogram on heating the as-milled sample, AM273, up to 673 K. b) DSC
thermograms around the martensitic transformation and the magnetic transition of the alloys
studied in this chapter.
As can be seen in Figure 3. 1(a), a broad exothermic peak appears between 400 K and
600 K when the as-milled sample is heated for the first time, which is not observed on heating
in a subsequent cycle. This feature must be linked to the microstructural recovery processes. In
order to analyze the effect of such processes on both the MT and TC, the annealing temperatures
have been chosen inside and above the temperature range of this exothermic peak. As can be
appreciated in Figure 3. 1(b) and Table 3. I, the values of the MT temperature and TC do not
change noticeably, remaining constant for all the studied samples. The biggest change is shown
in the values of the enthalpy and entropy associated to the MT. In the as-milled sample, the MT
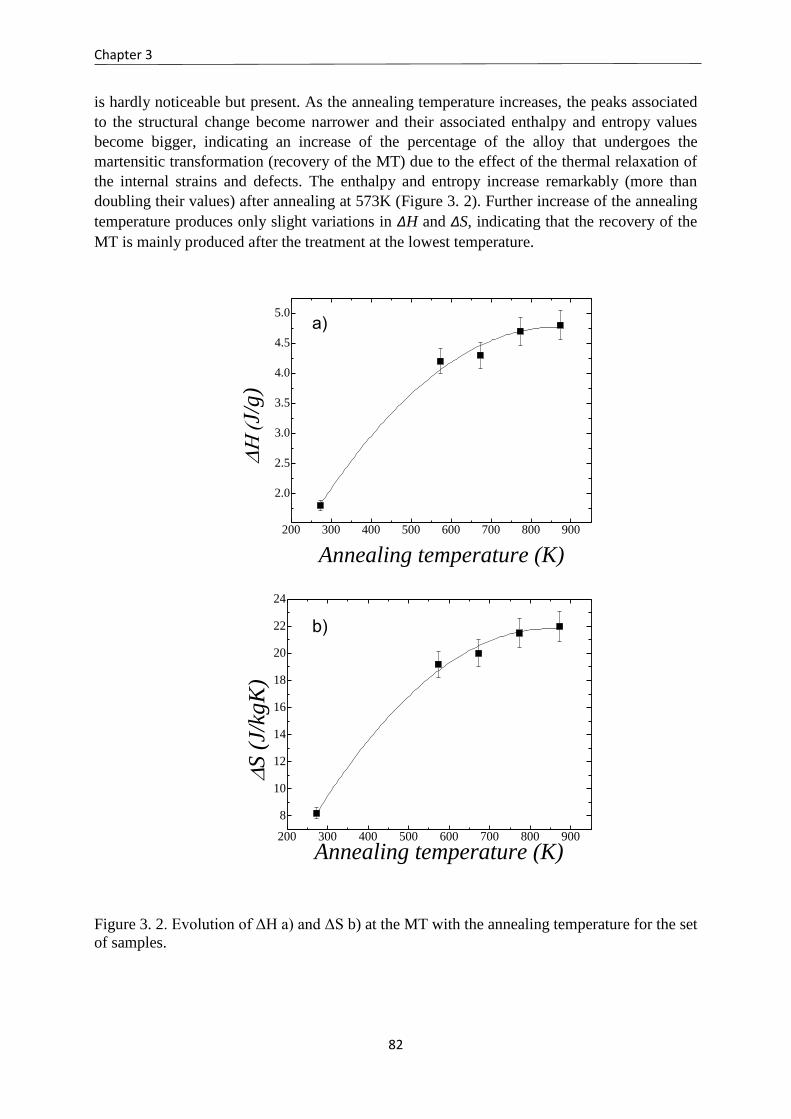
Chapter 3
82
is hardly noticeable but present. As the annealing temperature increases, the peaks associated
to the structural change become narrower and their associated enthalpy and entropy values
become bigger, indicating an increase of the percentage of the alloy that undergoes the
martensitic transformation (recovery of the MT) due to the effect of the thermal relaxation of
the internal strains and defects. The enthalpy and entropy increase remarkably (more than
doubling their values) after annealing at 573K (Figure 3. 2). Further increase of the annealing
temperature produces only slight variations in ΔH and ΔS, indicating that the recovery of the
MT is mainly produced after the treatment at the lowest temperature.
200 300 400 500 600 700 800 900
2.0
2.5
3.0
3.5
4.0
4.5
5.0
Annealing temperature (K)
J/g
)
a)
200 300 400 500 600 700 800 900
8
10
12
14
16
18
20
22
24
b)
S
(J/
kgK
)
Annealing temperature (K)
Figure 3. 2. Evolution of ΔH a) and ΔS b) at the MT with the annealing temperature for the set
of samples.
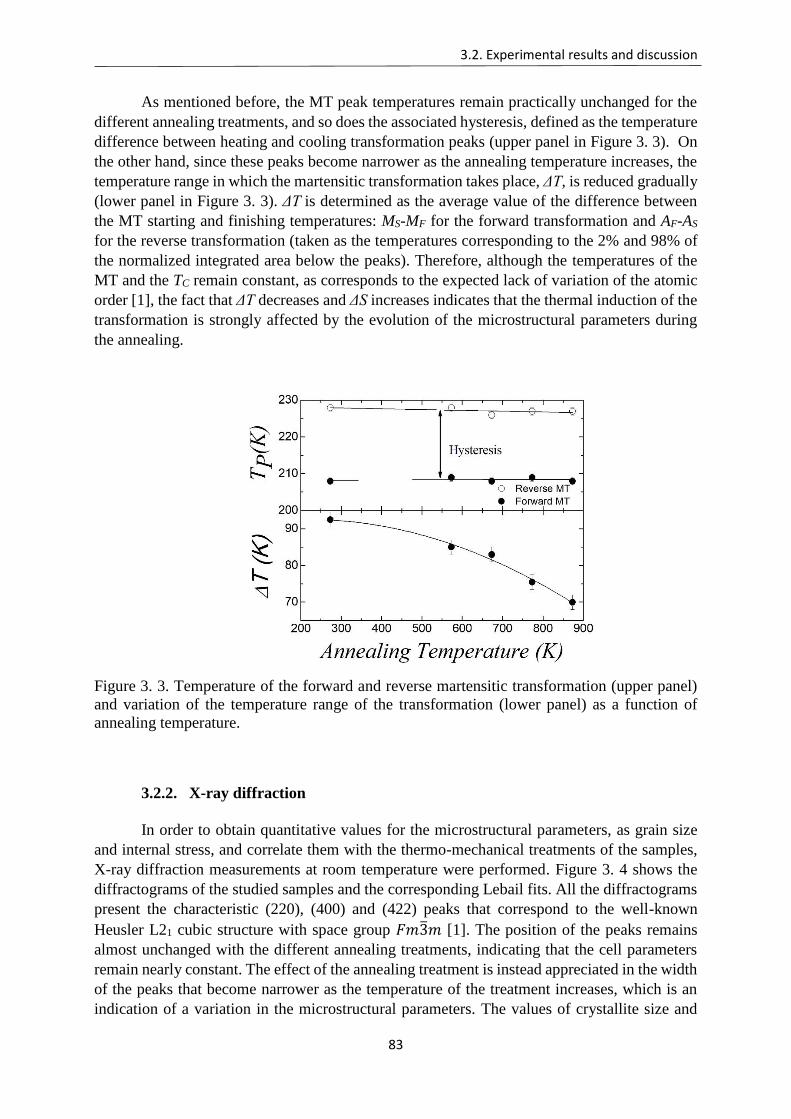
3.2. Experimental results and discussion
83
As mentioned before, the MT peak temperatures remain practically unchanged for the
different annealing treatments, and so does the associated hysteresis, defined as the temperature
difference between heating and cooling transformation peaks (upper panel in Figure 3. 3). On
the other hand, since these peaks become narrower as the annealing temperature increases, the
temperature range in which the martensitic transformation takes place, ΔT, is reduced gradually
(lower panel in Figure 3. 3). ΔT is determined as the average value of the difference between
the MT starting and finishing temperatures: MS-MF for the forward transformation and AF-AS
for the reverse transformation (taken as the temperatures corresponding to the 2% and 98% of
the normalized integrated area below the peaks). Therefore, although the temperatures of the
MT and the TC remain constant, as corresponds to the expected lack of variation of the atomic
order [1], the fact that ΔT decreases and ΔS increases indicates that the thermal induction of the
transformation is strongly affected by the evolution of the microstructural parameters during
the annealing.
Figure 3. 3. Temperature of the forward and reverse martensitic transformation (upper panel)
and variation of the temperature range of the transformation (lower panel) as a function of
annealing temperature.
3.2.2. X-ray diffraction
In order to obtain quantitative values for the microstructural parameters, as grain size
and internal stress, and correlate them with the thermo-mechanical treatments of the samples,
X-ray diffraction measurements at room temperature were performed. Figure 3. 4 shows the
diffractograms of the studied samples and the corresponding Lebail fits. All the diffractograms
present the characteristic (220), (400) and (422) peaks that correspond to the well-known
Heusler L21 cubic structure with space group 𝐹𝑚3̅𝑚 [1]. The position of the peaks remains
almost unchanged with the different annealing treatments, indicating that the cell parameters
remain nearly constant. The effect of the annealing treatment is instead appreciated in the width
of the peaks that become narrower as the temperature of the treatment increases, which is an
indication of a variation in the microstructural parameters. The values of crystallite size and
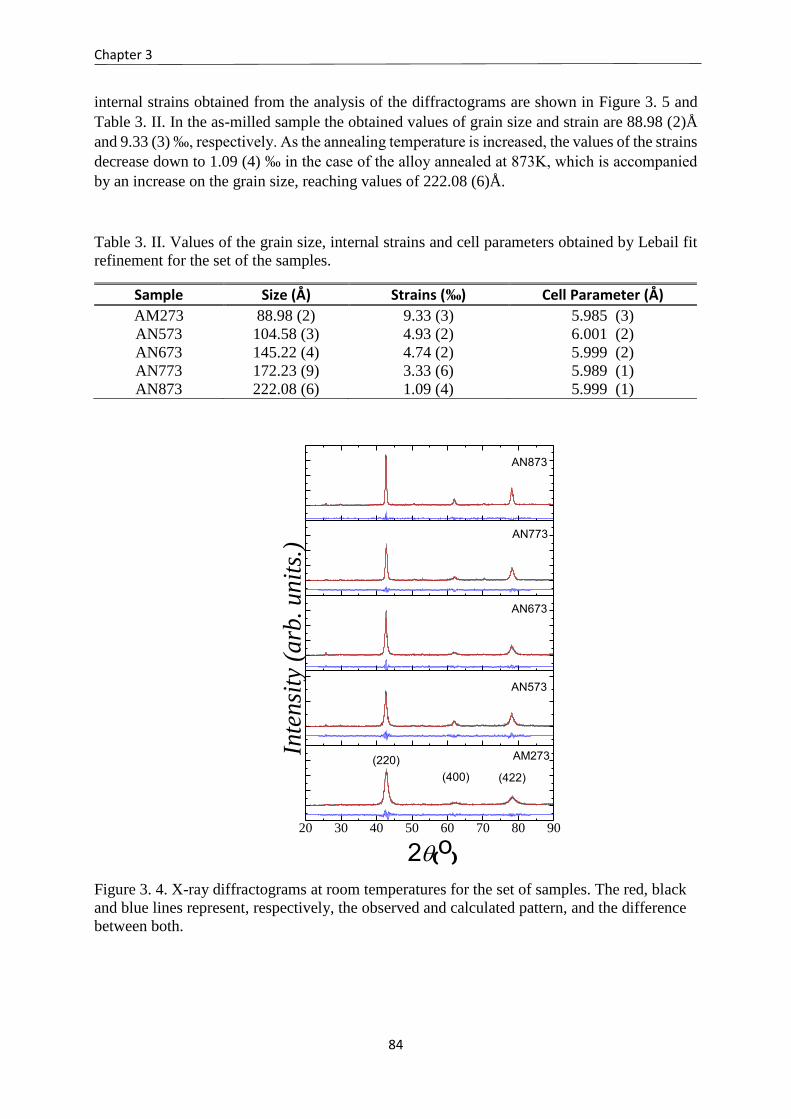
Chapter 3
84
internal strains obtained from the analysis of the diffractograms are shown in Figure 3. 5 and
Table 3. II. In the as-milled sample the obtained values of grain size and strain are 88.98 (2)Å
and 9.33 (3) ‰, respectively. As the annealing temperature is increased, the values of the strains
decrease down to 1.09 (4) ‰ in the case of the alloy annealed at 873K, which is accompanied
by an increase on the grain size, reaching values of 222.08 (6)Å.
Table 3. II. Values of the grain size, internal strains and cell parameters obtained by Lebail fit
refinement for the set of the samples.
Sample Size (Å) Strains (‰) Cell Parameter (Å)
AM273 88.98 (2) 9.33 (3) 5.985 (3)
AN573 104.58 (3) 4.93 (2) 6.001 (2)
AN673 145.22 (4) 4.74 (2) 5.999 (2)
AN773 172.23 (9) 3.33 (6) 5.989 (1)
AN873 222.08 (6) 1.09 (4) 5.999 (1)
20 30 40 50 60 70 80 90
Inte
nsi
ty (
arb
. u
nit
s.)
2o
AM273(220)
(400) (422)
AN573
AN673
AN773
AN873
Figure 3. 4. X-ray diffractograms at room temperatures for the set of samples. The red, black
and blue lines represent, respectively, the observed and calculated pattern, and the difference
between both.
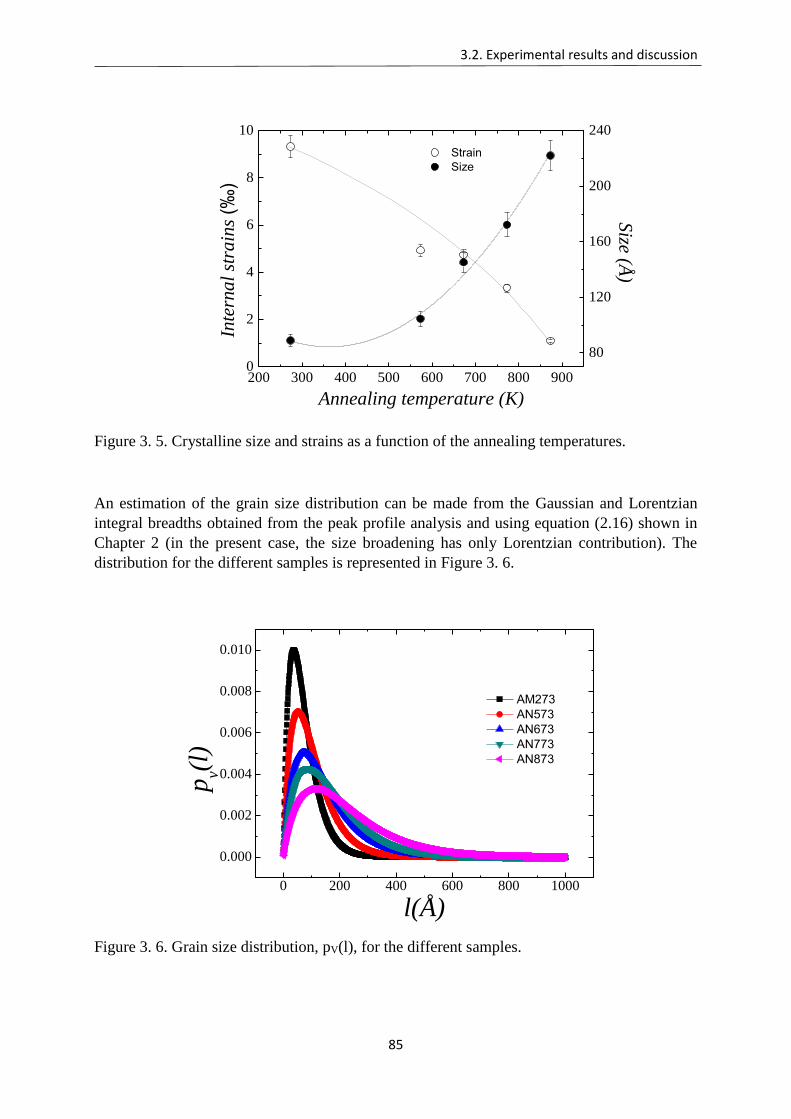
3.2. Experimental results and discussion
85
200 300 400 500 600 700 800 9000
2
4
6
8
10
Strain
Size
Annealing temperature (K)
Inte
rnal
stra
ins
(‰)
80
120
160
200
240
Size (Å
)
Figure 3. 5. Crystalline size and strains as a function of the annealing temperatures.
An estimation of the grain size distribution can be made from the Gaussian and Lorentzian
integral breadths obtained from the peak profile analysis and using equation (2.16) shown in
Chapter 2 (in the present case, the size broadening has only Lorentzian contribution). The
distribution for the different samples is represented in Figure 3. 6.
0 200 400 600 800 1000
0.000
0.002
0.004
0.006
0.008
0.010
AM273
AN573
AN673
AN773
AN873
pv(l
)
l(Å)
Figure 3. 6. Grain size distribution, pV(l), for the different samples.
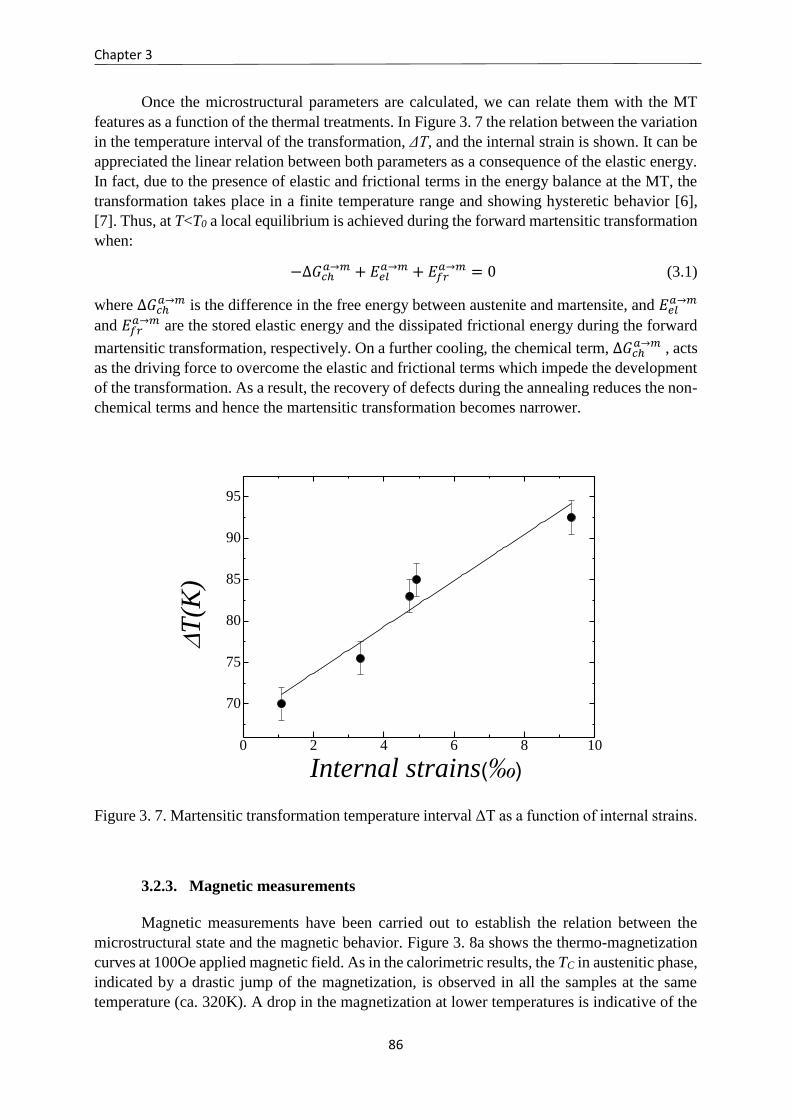
Chapter 3
86
Once the microstructural parameters are calculated, we can relate them with the MT
features as a function of the thermal treatments. In Figure 3. 7 the relation between the variation
in the temperature interval of the transformation, ΔT, and the internal strain is shown. It can be
appreciated the linear relation between both parameters as a consequence of the elastic energy.
In fact, due to the presence of elastic and frictional terms in the energy balance at the MT, the
transformation takes place in a finite temperature range and showing hysteretic behavior [6],
[7]. Thus, at T<T0 a local equilibrium is achieved during the forward martensitic transformation
when:
−∆𝐺𝑐ℎ𝑎→𝑚 + 𝐸𝑒𝑙
𝑎→𝑚 + 𝐸𝑓𝑟𝑎→𝑚 = 0 (3.1)
where ∆𝐺𝑐ℎ𝑎→𝑚 is the difference in the free energy between austenite and martensite, and 𝐸𝑒𝑙
𝑎→𝑚
and 𝐸𝑓𝑟𝑎→𝑚 are the stored elastic energy and the dissipated frictional energy during the forward
martensitic transformation, respectively. On a further cooling, the chemical term, ∆𝐺𝑐ℎ𝑎→𝑚 , acts
as the driving force to overcome the elastic and frictional terms which impede the development
of the transformation. As a result, the recovery of defects during the annealing reduces the non-
chemical terms and hence the martensitic transformation becomes narrower.
0 2 4 6 8 10
70
75
80
85
90
95
Internal strains(‰)
T
(K)
Figure 3. 7. Martensitic transformation temperature interval ΔT as a function of internal strains.
3.2.3. Magnetic measurements
Magnetic measurements have been carried out to establish the relation between the
microstructural state and the magnetic behavior. Figure 3. 8a shows the thermo-magnetization
curves at 100Oe applied magnetic field. As in the calorimetric results, the TC in austenitic phase,
indicated by a drastic jump of the magnetization, is observed in all the samples at the same
temperature (ca. 320K). A drop in the magnetization at lower temperatures is indicative of the
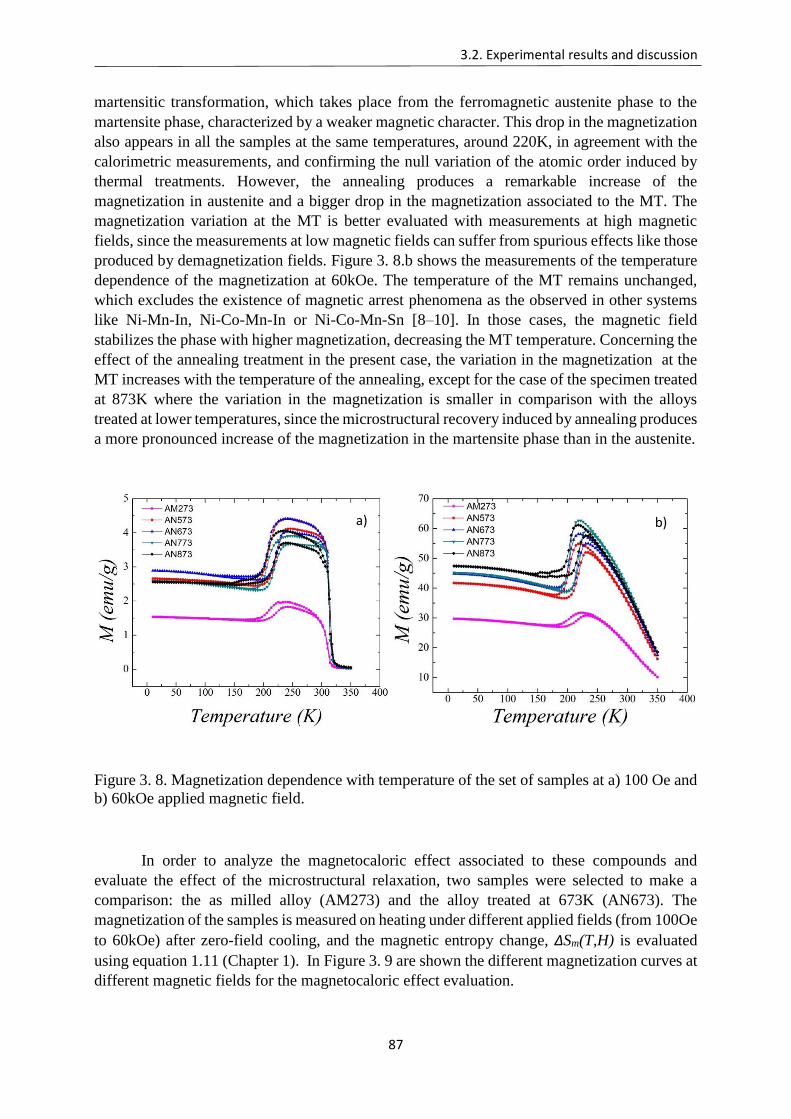
3.2. Experimental results and discussion
87
martensitic transformation, which takes place from the ferromagnetic austenite phase to the
martensite phase, characterized by a weaker magnetic character. This drop in the magnetization
also appears in all the samples at the same temperatures, around 220K, in agreement with the
calorimetric measurements, and confirming the null variation of the atomic order induced by
thermal treatments. However, the annealing produces a remarkable increase of the
magnetization in austenite and a bigger drop in the magnetization associated to the MT. The
magnetization variation at the MT is better evaluated with measurements at high magnetic
fields, since the measurements at low magnetic fields can suffer from spurious effects like those
produced by demagnetization fields. Figure 3. 8.b shows the measurements of the temperature
dependence of the magnetization at 60kOe. The temperature of the MT remains unchanged,
which excludes the existence of magnetic arrest phenomena as the observed in other systems
like Ni-Mn-In, Ni-Co-Mn-In or Ni-Co-Mn-Sn [8–10]. In those cases, the magnetic field
stabilizes the phase with higher magnetization, decreasing the MT temperature. Concerning the
effect of the annealing treatment in the present case, the variation in the magnetization at the
MT increases with the temperature of the annealing, except for the case of the specimen treated
at 873K where the variation in the magnetization is smaller in comparison with the alloys
treated at lower temperatures, since the microstructural recovery induced by annealing produces
a more pronounced increase of the magnetization in the martensite phase than in the austenite.
Figure 3. 8. Magnetization dependence with temperature of the set of samples at a) 100 Oe and
b) 60kOe applied magnetic field.
In order to analyze the magnetocaloric effect associated to these compounds and
evaluate the effect of the microstructural relaxation, two samples were selected to make a
comparison: the as milled alloy (AM273) and the alloy treated at 673K (AN673). The
magnetization of the samples is measured on heating under different applied fields (from 100Oe
to 60kOe) after zero-field cooling, and the magnetic entropy change, ΔSm(T,H) is evaluated
using equation 1.11 (Chapter 1). In Figure 3. 9 are shown the different magnetization curves at
different magnetic fields for the magnetocaloric effect evaluation.
a) b)
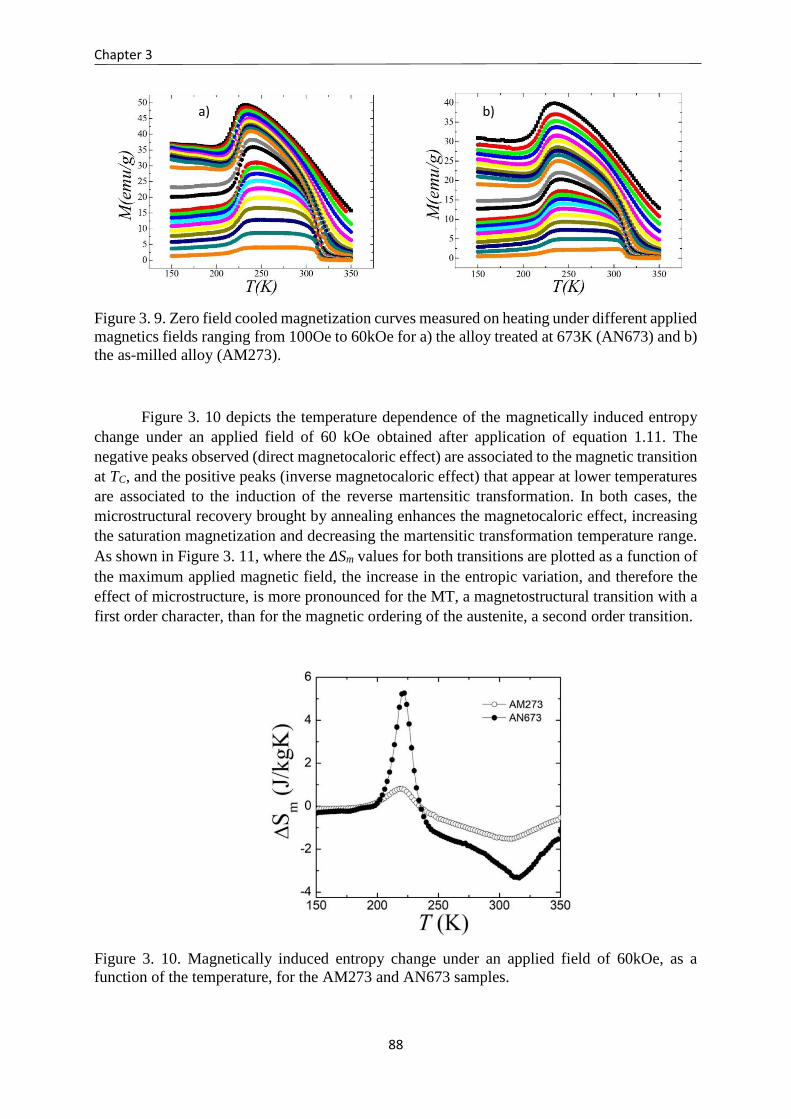
Chapter 3
88
Figure 3. 9. Zero field cooled magnetization curves measured on heating under different applied
magnetics fields ranging from 100Oe to 60kOe for a) the alloy treated at 673K (AN673) and b)
the as-milled alloy (AM273).
Figure 3. 10 depicts the temperature dependence of the magnetically induced entropy
change under an applied field of 60 kOe obtained after application of equation 1.11. The
negative peaks observed (direct magnetocaloric effect) are associated to the magnetic transition
at TC, and the positive peaks (inverse magnetocaloric effect) that appear at lower temperatures
are associated to the induction of the reverse martensitic transformation. In both cases, the
microstructural recovery brought by annealing enhances the magnetocaloric effect, increasing
the saturation magnetization and decreasing the martensitic transformation temperature range.
As shown in Figure 3. 11, where the ΔSm values for both transitions are plotted as a function of
the maximum applied magnetic field, the increase in the entropic variation, and therefore the
effect of microstructure, is more pronounced for the MT, a magnetostructural transition with a
first order character, than for the magnetic ordering of the austenite, a second order transition.
Figure 3. 10. Magnetically induced entropy change under an applied field of 60kOe, as a
function of the temperature, for the AM273 and AN673 samples.
a) b)
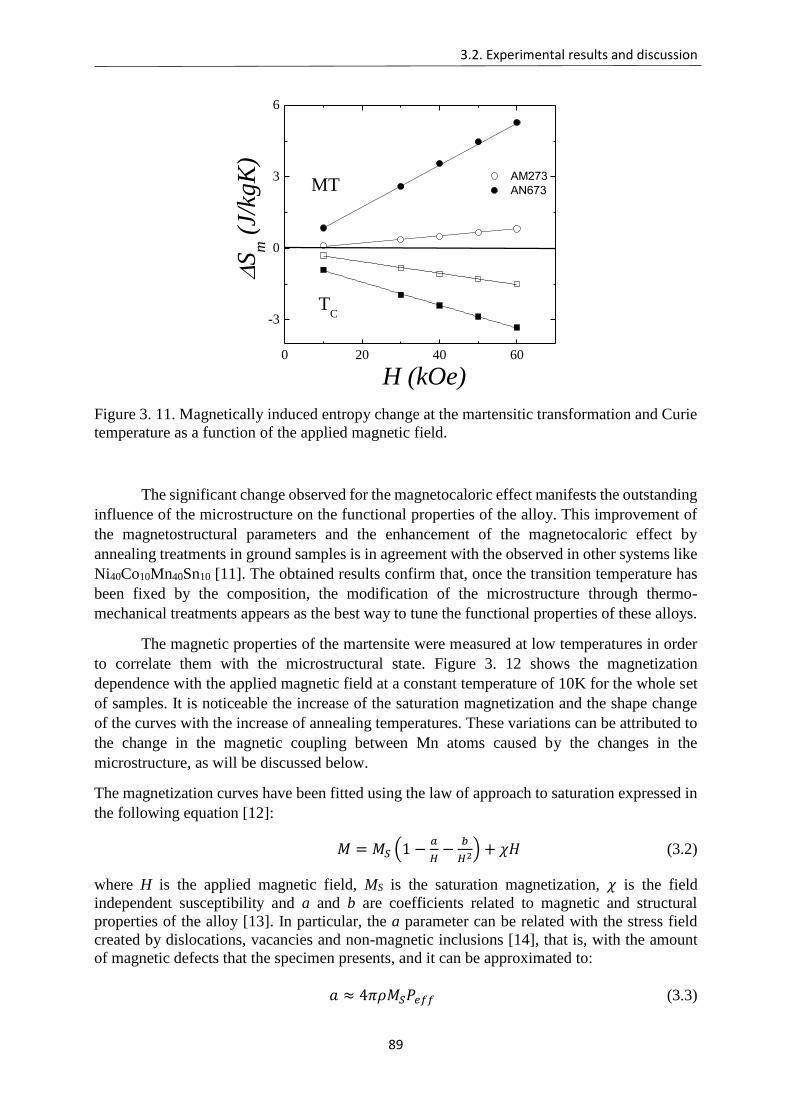
3.2. Experimental results and discussion
89
0 20 40 60
-3
0
3
6
AM273
AN673
S
m (
J/kg
K)
H (kOe)
MT
TC
Figure 3. 11. Magnetically induced entropy change at the martensitic transformation and Curie
temperature as a function of the applied magnetic field.
The significant change observed for the magnetocaloric effect manifests the outstanding
influence of the microstructure on the functional properties of the alloy. This improvement of
the magnetostructural parameters and the enhancement of the magnetocaloric effect by
annealing treatments in ground samples is in agreement with the observed in other systems like
Ni40Co10Mn40Sn10 [11]. The obtained results confirm that, once the transition temperature has
been fixed by the composition, the modification of the microstructure through thermo-
mechanical treatments appears as the best way to tune the functional properties of these alloys.
The magnetic properties of the martensite were measured at low temperatures in order
to correlate them with the microstructural state. Figure 3. 12 shows the magnetization
dependence with the applied magnetic field at a constant temperature of 10K for the whole set
of samples. It is noticeable the increase of the saturation magnetization and the shape change
of the curves with the increase of annealing temperatures. These variations can be attributed to
the change in the magnetic coupling between Mn atoms caused by the changes in the
microstructure, as will be discussed below.
The magnetization curves have been fitted using the law of approach to saturation expressed in
the following equation [12]:
𝑀 = 𝑀𝑆 (1 −𝑎
𝐻−
𝑏
𝐻2) + 𝜒𝐻 (3.2)
where H is the applied magnetic field, MS is the saturation magnetization, 𝜒 is the field
independent susceptibility and a and b are coefficients related to magnetic and structural
properties of the alloy [13]. In particular, the a parameter can be related with the stress field
created by dislocations, vacancies and non-magnetic inclusions [14], that is, with the amount
of magnetic defects that the specimen presents, and it can be approximated to:
𝑎 ≈ 4𝜋𝜌𝑀𝑆𝑃𝑒𝑓𝑓 (3.3)
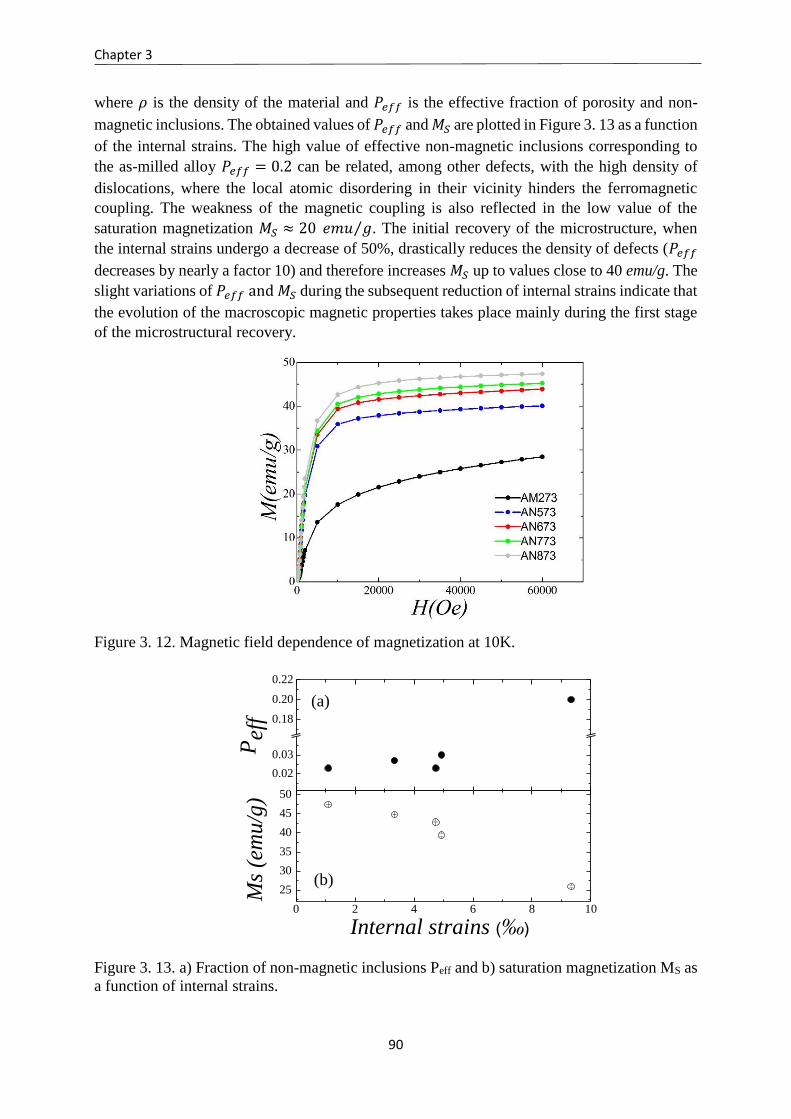
Chapter 3
90
where 𝜌 is the density of the material and 𝑃𝑒𝑓𝑓 is the effective fraction of porosity and non-
magnetic inclusions. The obtained values of 𝑃𝑒𝑓𝑓 and 𝑀𝑆 are plotted in Figure 3. 13 as a function
of the internal strains. The high value of effective non-magnetic inclusions corresponding to
the as-milled alloy 𝑃𝑒𝑓𝑓 = 0.2 can be related, among other defects, with the high density of
dislocations, where the local atomic disordering in their vicinity hinders the ferromagnetic
coupling. The weakness of the magnetic coupling is also reflected in the low value of the
saturation magnetization 𝑀𝑆 ≈ 20 𝑒𝑚𝑢 𝑔⁄ . The initial recovery of the microstructure, when
the internal strains undergo a decrease of 50%, drastically reduces the density of defects (𝑃𝑒𝑓𝑓
decreases by nearly a factor 10) and therefore increases 𝑀𝑆 up to values close to 40 emu/g. The
slight variations of 𝑃𝑒𝑓𝑓 and 𝑀𝑆 during the subsequent reduction of internal strains indicate that
the evolution of the macroscopic magnetic properties takes place mainly during the first stage
of the microstructural recovery.
Figure 3. 12. Magnetic field dependence of magnetization at 10K.
0.02
0.03
0.18
0.20
0.22
0 2 4 6 8 10
25
30
35
40
45
50
Pef
f
(a)
Internal strains (‰)
Ms
(em
u/g
)
(b)
Figure 3. 13. a) Fraction of non-magnetic inclusions Peff and b) saturation magnetization MS as
a function of internal strains.
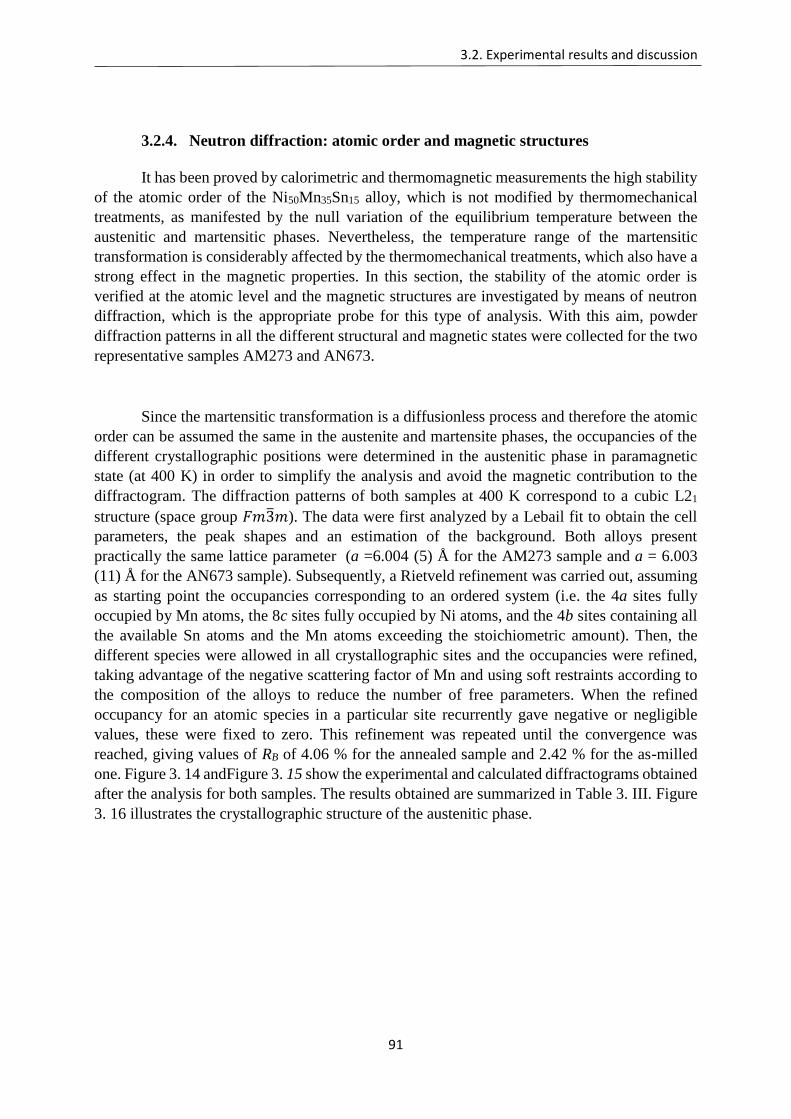
3.2. Experimental results and discussion
91
3.2.4. Neutron diffraction: atomic order and magnetic structures
It has been proved by calorimetric and thermomagnetic measurements the high stability
of the atomic order of the Ni50Mn35Sn15 alloy, which is not modified by thermomechanical
treatments, as manifested by the null variation of the equilibrium temperature between the
austenitic and martensitic phases. Nevertheless, the temperature range of the martensitic
transformation is considerably affected by the thermomechanical treatments, which also have a
strong effect in the magnetic properties. In this section, the stability of the atomic order is
verified at the atomic level and the magnetic structures are investigated by means of neutron
diffraction, which is the appropriate probe for this type of analysis. With this aim, powder
diffraction patterns in all the different structural and magnetic states were collected for the two
representative samples AM273 and AN673.
Since the martensitic transformation is a diffusionless process and therefore the atomic
order can be assumed the same in the austenite and martensite phases, the occupancies of the
different crystallographic positions were determined in the austenitic phase in paramagnetic
state (at 400 K) in order to simplify the analysis and avoid the magnetic contribution to the
diffractogram. The diffraction patterns of both samples at 400 K correspond to a cubic L21
structure (space group 𝐹𝑚3̅𝑚). The data were first analyzed by a Lebail fit to obtain the cell
parameters, the peak shapes and an estimation of the background. Both alloys present
practically the same lattice parameter (a =6.004 (5) Å for the AM273 sample and a = 6.003
(11) Å for the AN673 sample). Subsequently, a Rietveld refinement was carried out, assuming
as starting point the occupancies corresponding to an ordered system (i.e. the 4a sites fully
occupied by Mn atoms, the 8c sites fully occupied by Ni atoms, and the 4b sites containing all
the available Sn atoms and the Mn atoms exceeding the stoichiometric amount). Then, the
different species were allowed in all crystallographic sites and the occupancies were refined,
taking advantage of the negative scattering factor of Mn and using soft restraints according to
the composition of the alloys to reduce the number of free parameters. When the refined
occupancy for an atomic species in a particular site recurrently gave negative or negligible
values, these were fixed to zero. This refinement was repeated until the convergence was
reached, giving values of RB of 4.06 % for the annealed sample and 2.42 % for the as-milled
one. Figure 3. 14 andFigure 3. 15 show the experimental and calculated diffractograms obtained
after the analysis for both samples. The results obtained are summarized in Table 3. III. Figure
3. 16 illustrates the crystallographic structure of the austenitic phase.
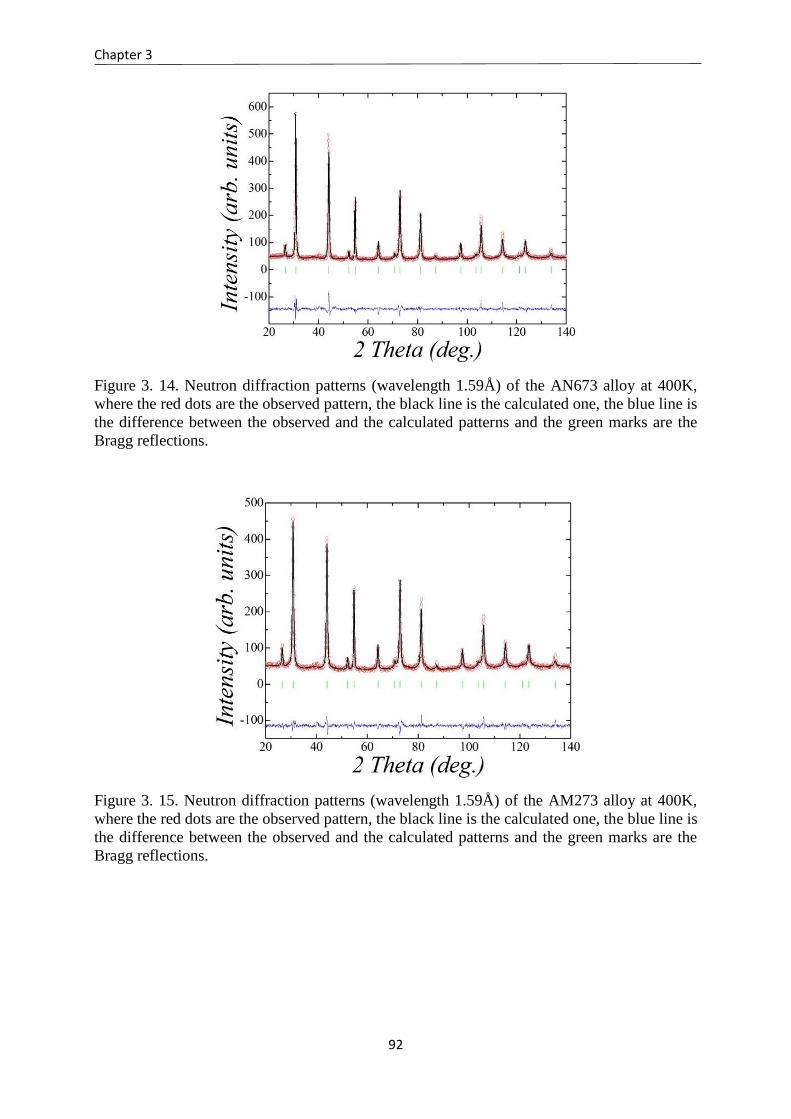
Chapter 3
92
Figure 3. 14. Neutron diffraction patterns (wavelength 1.59Å) of the AN673 alloy at 400K,
where the red dots are the observed pattern, the black line is the calculated one, the blue line is
the difference between the observed and the calculated patterns and the green marks are the
Bragg reflections.
Figure 3. 15. Neutron diffraction patterns (wavelength 1.59Å) of the AM273 alloy at 400K,
where the red dots are the observed pattern, the black line is the calculated one, the blue line is
the difference between the observed and the calculated patterns and the green marks are the
Bragg reflections.
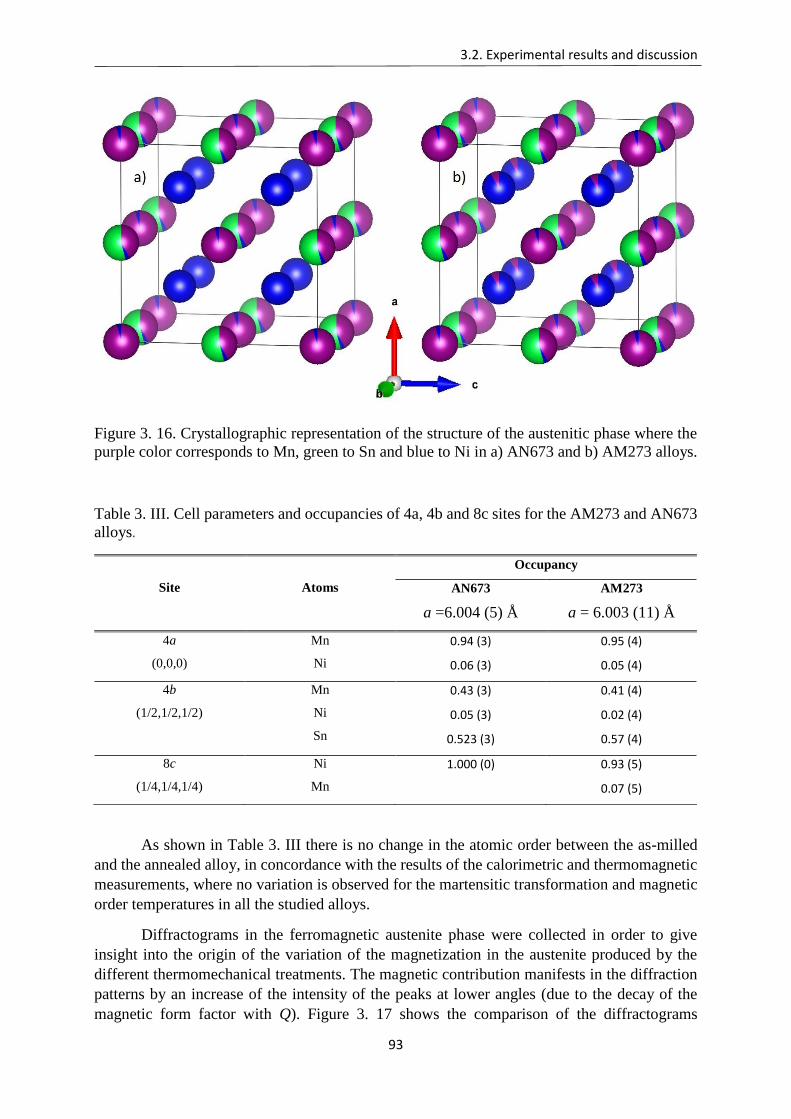
3.2. Experimental results and discussion
93
Figure 3. 16. Crystallographic representation of the structure of the austenitic phase where the
purple color corresponds to Mn, green to Sn and blue to Ni in a) AN673 and b) AM273 alloys.
Table 3. III. Cell parameters and occupancies of 4a, 4b and 8c sites for the AM273 and AN673
alloys.
Site
Atoms
Occupancy
AN673
a =6.004 (5) Å
AM273
a = 6.003 (11) Å
4a
(0,0,0)
Mn
Ni
0.94 (3)
0.06 (3)
0.95 (4)
0.05 (4)
4b
(1/2,1/2,1/2)
Mn
Ni
Sn
0.43 (3)
0.05 (3)
0.523 (3)
0.41 (4)
0.02 (4)
0.57 (4)
8c
(1/4,1/4,1/4)
Ni
Mn
1.000 (0)
0.93 (5)
0.07 (5)
As shown in Table 3. III there is no change in the atomic order between the as-milled
and the annealed alloy, in concordance with the results of the calorimetric and thermomagnetic
measurements, where no variation is observed for the martensitic transformation and magnetic
order temperatures in all the studied alloys.
Diffractograms in the ferromagnetic austenite phase were collected in order to give
insight into the origin of the variation of the magnetization in the austenite produced by the
different thermomechanical treatments. The magnetic contribution manifests in the diffraction
patterns by an increase of the intensity of the peaks at lower angles (due to the decay of the
magnetic form factor with Q). Figure 3. 17 shows the comparison of the diffractograms
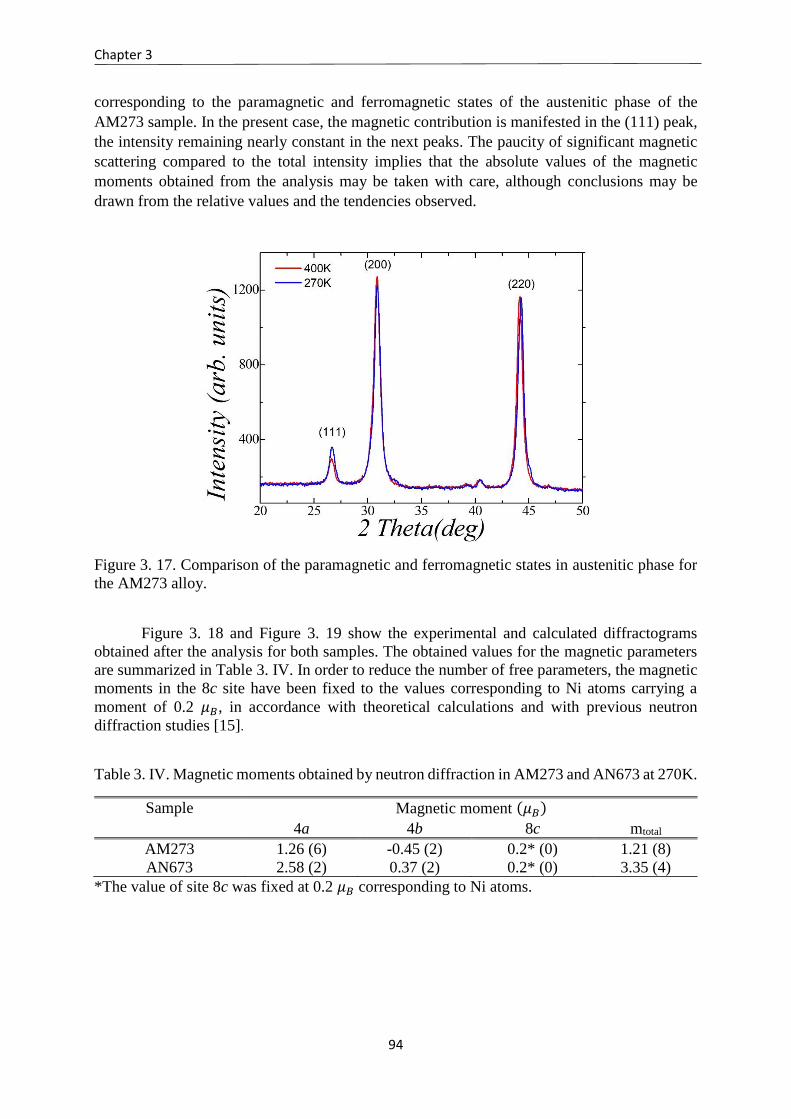
Chapter 3
94
corresponding to the paramagnetic and ferromagnetic states of the austenitic phase of the
AM273 sample. In the present case, the magnetic contribution is manifested in the (111) peak,
the intensity remaining nearly constant in the next peaks. The paucity of significant magnetic
scattering compared to the total intensity implies that the absolute values of the magnetic
moments obtained from the analysis may be taken with care, although conclusions may be
drawn from the relative values and the tendencies observed.
Figure 3. 17. Comparison of the paramagnetic and ferromagnetic states in austenitic phase for
the AM273 alloy.
Figure 3. 18 and Figure 3. 19 show the experimental and calculated diffractograms
obtained after the analysis for both samples. The obtained values for the magnetic parameters
are summarized in Table 3. IV. In order to reduce the number of free parameters, the magnetic
moments in the 8c site have been fixed to the values corresponding to Ni atoms carrying a
moment of 0.2 𝜇𝐵, in accordance with theoretical calculations and with previous neutron
diffraction studies [15].
Table 3. IV. Magnetic moments obtained by neutron diffraction in AM273 and AN673 at 270K.
Sample Magnetic moment (𝜇𝐵)
4a 4b 8c mtotal
AM273 1.26 (6) -0.45 (2) 0.2* (0) 1.21 (8)
AN673 2.58 (2) 0.37 (2) 0.2* (0) 3.35 (4)
*The value of site 8c was fixed at 0.2 𝜇𝐵 corresponding to Ni atoms.
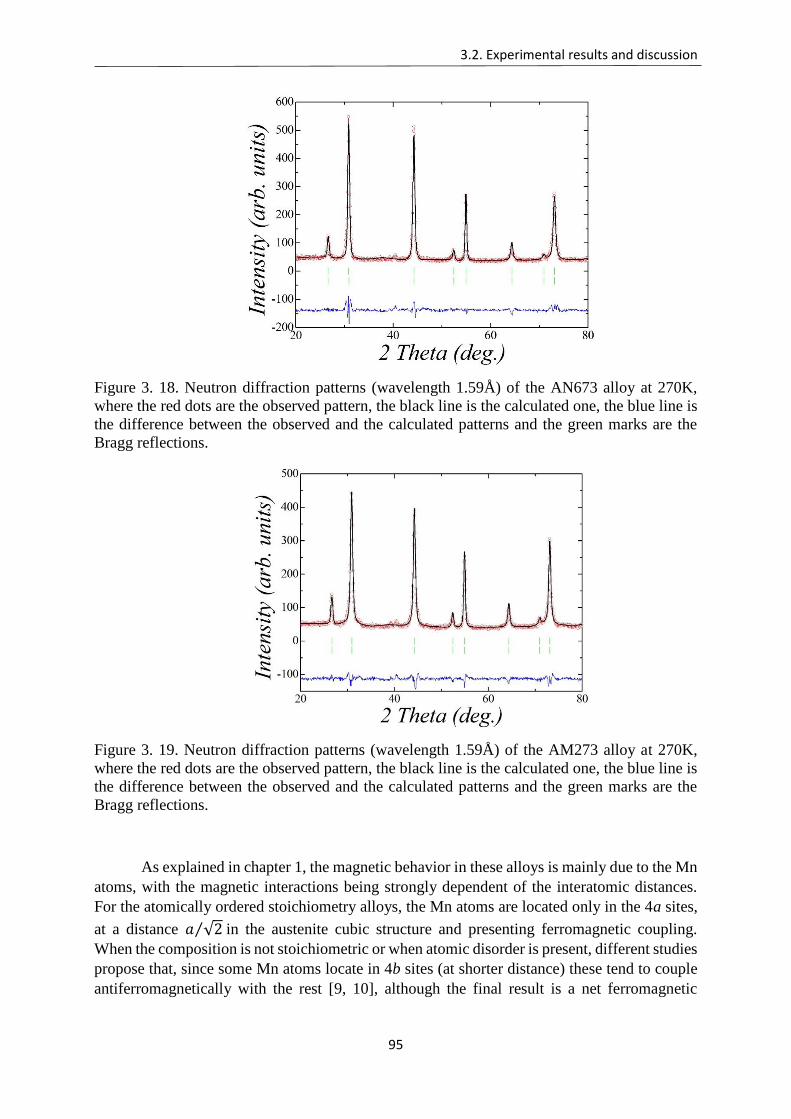
3.2. Experimental results and discussion
95
Figure 3. 18. Neutron diffraction patterns (wavelength 1.59Å) of the AN673 alloy at 270K,
where the red dots are the observed pattern, the black line is the calculated one, the blue line is
the difference between the observed and the calculated patterns and the green marks are the
Bragg reflections.
Figure 3. 19. Neutron diffraction patterns (wavelength 1.59Å) of the AM273 alloy at 270K,
where the red dots are the observed pattern, the black line is the calculated one, the blue line is
the difference between the observed and the calculated patterns and the green marks are the
Bragg reflections.
As explained in chapter 1, the magnetic behavior in these alloys is mainly due to the Mn
atoms, with the magnetic interactions being strongly dependent of the interatomic distances.
For the atomically ordered stoichiometry alloys, the Mn atoms are located only in the 4a sites,
at a distance 𝑎 √2⁄ in the austenite cubic structure and presenting ferromagnetic coupling.
When the composition is not stoichiometric or when atomic disorder is present, different studies
propose that, since some Mn atoms locate in 4b sites (at shorter distance) these tend to couple
antiferromagnetically with the rest [9, 10], although the final result is a net ferromagnetic
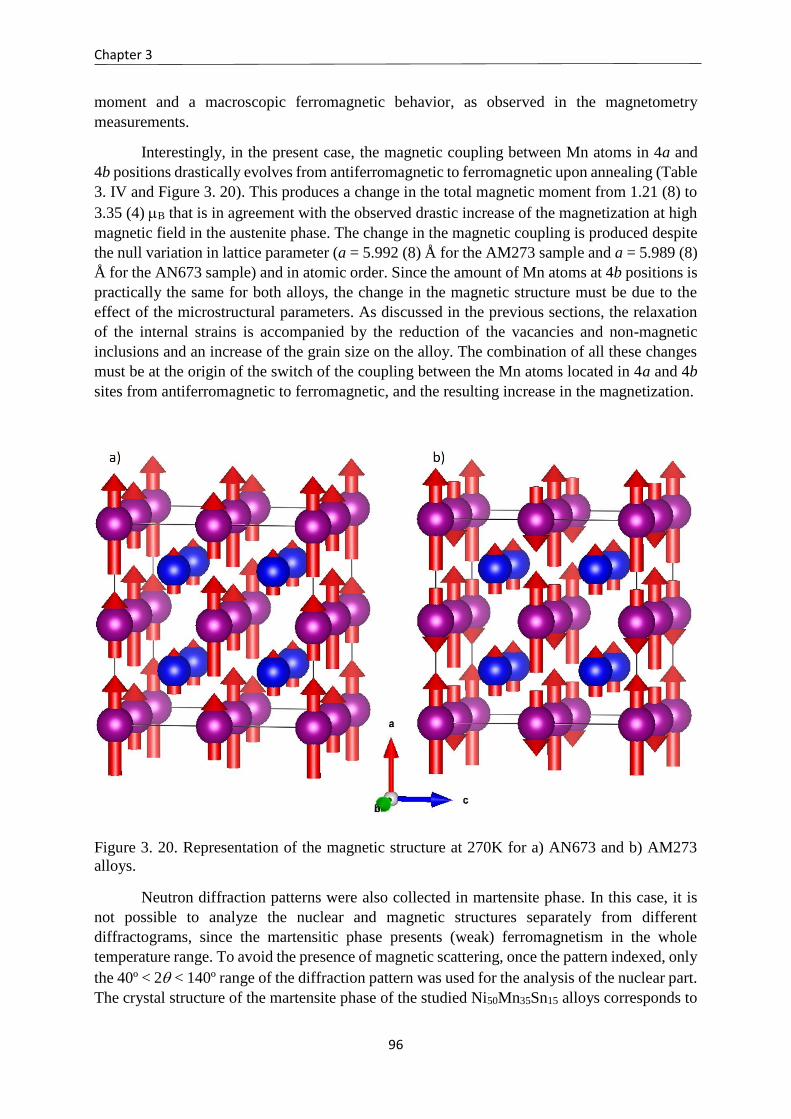
Chapter 3
96
moment and a macroscopic ferromagnetic behavior, as observed in the magnetometry
measurements.
Interestingly, in the present case, the magnetic coupling between Mn atoms in 4a and
4b positions drastically evolves from antiferromagnetic to ferromagnetic upon annealing (Table
3. IV and Figure 3. 20). This produces a change in the total magnetic moment from 1.21 (8) to
3.35 (4) B that is in agreement with the observed drastic increase of the magnetization at high
magnetic field in the austenite phase. The change in the magnetic coupling is produced despite
the null variation in lattice parameter (a = 5.992 (8) Å for the AM273 sample and a = 5.989 (8)
Å for the AN673 sample) and in atomic order. Since the amount of Mn atoms at 4b positions is
practically the same for both alloys, the change in the magnetic structure must be due to the
effect of the microstructural parameters. As discussed in the previous sections, the relaxation
of the internal strains is accompanied by the reduction of the vacancies and non-magnetic
inclusions and an increase of the grain size on the alloy. The combination of all these changes
must be at the origin of the switch of the coupling between the Mn atoms located in 4a and 4b
sites from antiferromagnetic to ferromagnetic, and the resulting increase in the magnetization.
Figure 3. 20. Representation of the magnetic structure at 270K for a) AN673 and b) AM273
alloys.
Neutron diffraction patterns were also collected in martensite phase. In this case, it is
not possible to analyze the nuclear and magnetic structures separately from different
diffractograms, since the martensitic phase presents (weak) ferromagnetism in the whole
temperature range. To avoid the presence of magnetic scattering, once the pattern indexed, only
the 40º < 2< 140º range of the diffraction pattern was used for the analysis of the nuclear part.
The crystal structure of the martensite phase of the studied Ni50Mn35Sn15 alloys corresponds to
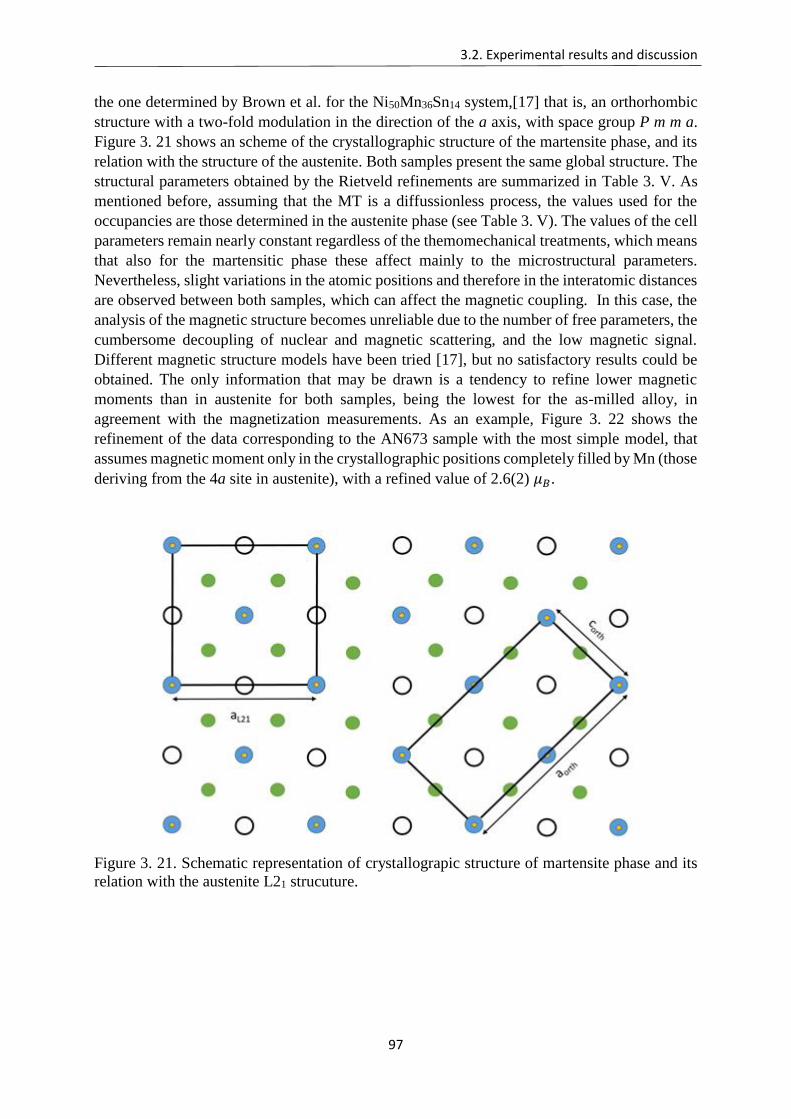
3.2. Experimental results and discussion
97
the one determined by Brown et al. for the Ni50Mn36Sn14 system,[17] that is, an orthorhombic
structure with a two-fold modulation in the direction of the a axis, with space group P m m a.
Figure 3. 21 shows an scheme of the crystallographic structure of the martensite phase, and its
relation with the structure of the austenite. Both samples present the same global structure. The
structural parameters obtained by the Rietveld refinements are summarized in Table 3. V. As
mentioned before, assuming that the MT is a diffussionless process, the values used for the
occupancies are those determined in the austenite phase (see Table 3. V). The values of the cell
parameters remain nearly constant regardless of the themomechanical treatments, which means
that also for the martensitic phase these affect mainly to the microstructural parameters.
Nevertheless, slight variations in the atomic positions and therefore in the interatomic distances
are observed between both samples, which can affect the magnetic coupling. In this case, the
analysis of the magnetic structure becomes unreliable due to the number of free parameters, the
cumbersome decoupling of nuclear and magnetic scattering, and the low magnetic signal.
Different magnetic structure models have been tried [17], but no satisfactory results could be
obtained. The only information that may be drawn is a tendency to refine lower magnetic
moments than in austenite for both samples, being the lowest for the as-milled alloy, in
agreement with the magnetization measurements. As an example, Figure 3. 22 shows the
refinement of the data corresponding to the AN673 sample with the most simple model, that
assumes magnetic moment only in the crystallographic positions completely filled by Mn (those
deriving from the 4a site in austenite), with a refined value of 2.6(2) 𝜇𝐵.
Figure 3. 21. Schematic representation of crystallograpic structure of martensite phase and its
relation with the austenite L21 strucuture.
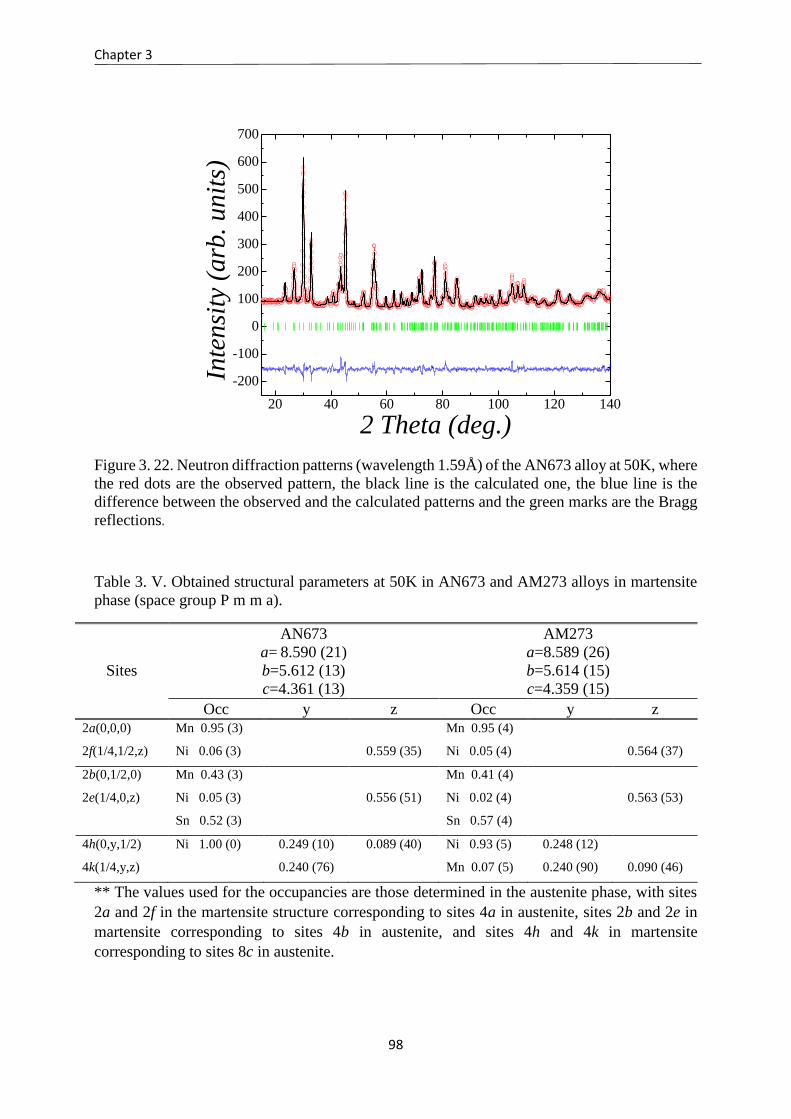
Chapter 3
98
20 40 60 80 100 120 140
-200
-100
0
100
200
300
400
500
600
700
Inte
nsi
ty (
arb
. un
its)
2 Theta (deg.)
Figure 3. 22. Neutron diffraction patterns (wavelength 1.59Å) of the AN673 alloy at 50K, where
the red dots are the observed pattern, the black line is the calculated one, the blue line is the
difference between the observed and the calculated patterns and the green marks are the Bragg
reflections.
Table 3. V. Obtained structural parameters at 50K in AN673 and AM273 alloys in martensite
phase (space group P m m a).
Sites
AN673
a= 8.590 (21)
b=5.612 (13)
c=4.361 (13)
AM273
a=8.589 (26)
b=5.614 (15)
c=4.359 (15)
Occ y z Occ y z 2a(0,0,0)
2f(1/4,1/2,z)
Mn 0.95 (3)
Ni 0.06 (3)
0.559 (35)
Mn 0.95 (4)
Ni 0.05 (4)
0.564 (37)
2b(0,1/2,0)
2e(1/4,0,z)
Mn 0.43 (3)
Ni 0.05 (3)
Sn 0.52 (3)
0.556 (51)
Mn 0.41 (4)
Ni 0.02 (4)
Sn 0.57 (4)
0.563 (53)
4h(0,y,1/2)
4k(1/4,y,z)
Ni 1.00 (0) 0.249 (10)
0.240 (76)
0.089 (40) Ni 0.93 (5)
Mn 0.07 (5)
0.248 (12)
0.240 (90)
0.090 (46)
** The values used for the occupancies are those determined in the austenite phase, with sites
2a and 2f in the martensite structure corresponding to sites 4a in austenite, sites 2b and 2e in
martensite corresponding to sites 4b in austenite, and sites 4h and 4k in martensite
corresponding to sites 8c in austenite.
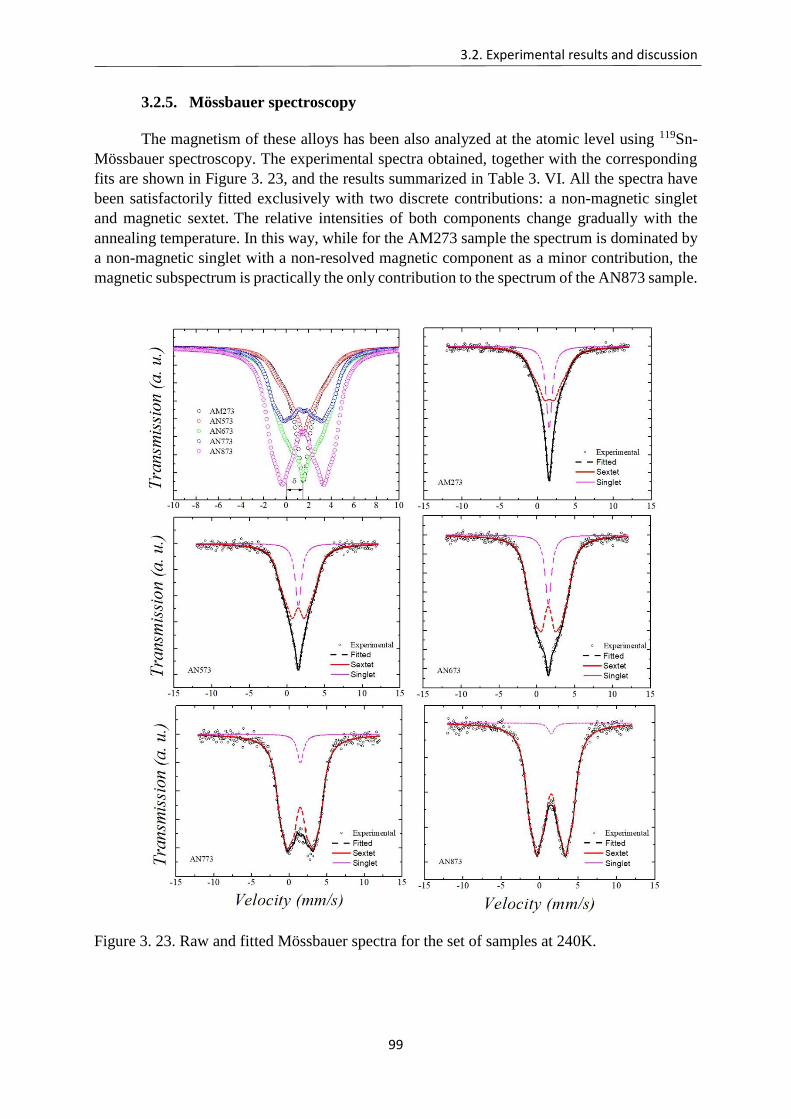
3.2. Experimental results and discussion
99
3.2.5. Mössbauer spectroscopy
The magnetism of these alloys has been also analyzed at the atomic level using 119Sn- Mössbauer spectroscopy. The experimental spectra obtained, together with the corresponding
fits are shown in Figure 3. 23, and the results summarized in Table 3. VI. All the spectra have
been satisfactorily fitted exclusively with two discrete contributions: a non-magnetic singlet
and magnetic sextet. The relative intensities of both components change gradually with the
annealing temperature. In this way, while for the AM273 sample the spectrum is dominated by
a non-magnetic singlet with a non-resolved magnetic component as a minor contribution, the
magnetic subspectrum is practically the only contribution to the spectrum of the AN873 sample.
Figure 3. 23. Raw and fitted Mössbauer spectra for the set of samples at 240K.
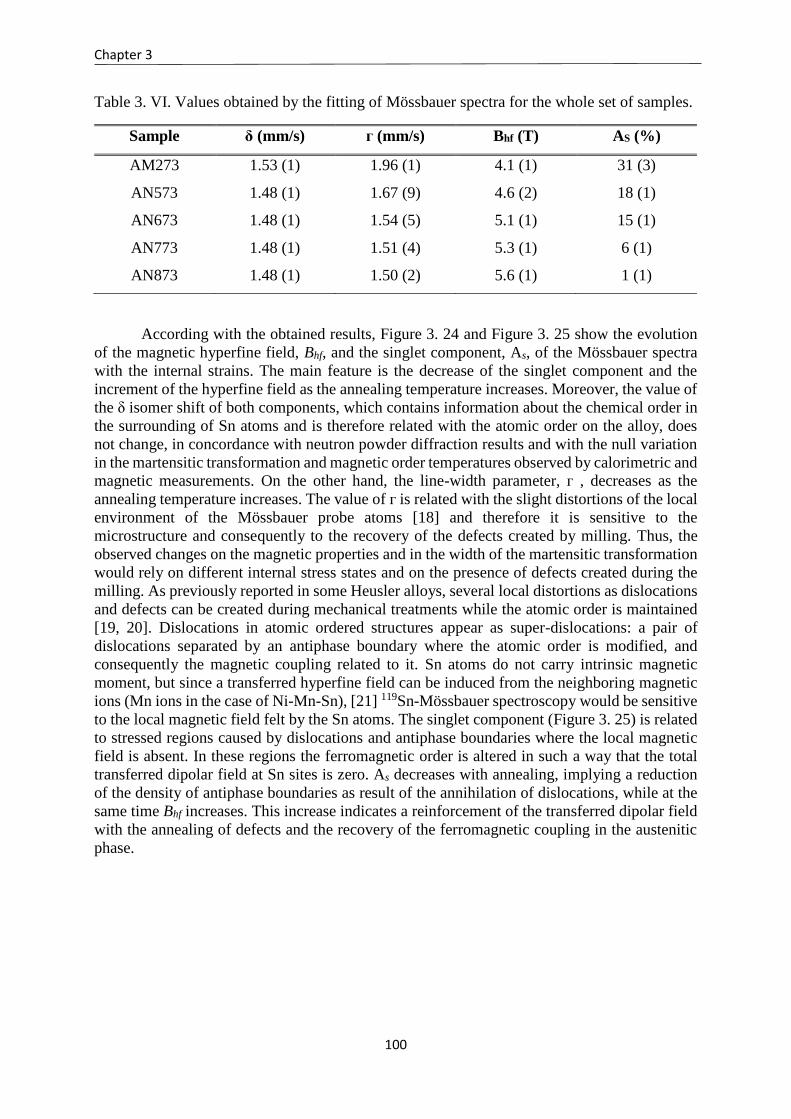
Chapter 3
100
Table 3. VI. Values obtained by the fitting of Mössbauer spectra for the whole set of samples.
Sample ẟ (mm/s) ᴦ (mm/s) Bhf (T) AS (%)
AM273 1.53 (1) 1.96 (1) 4.1 (1) 31 (3)
AN573 1.48 (1) 1.67 (9) 4.6 (2) 18 (1)
AN673 1.48 (1) 1.54 (5) 5.1 (1) 15 (1)
AN773 1.48 (1) 1.51 (4) 5.3 (1) 6 (1)
AN873 1.48 (1) 1.50 (2) 5.6 (1) 1 (1)
According with the obtained results, Figure 3. 24 and Figure 3. 25 show the evolution
of the magnetic hyperfine field, Bhf, and the singlet component, As, of the Mössbauer spectra
with the internal strains. The main feature is the decrease of the singlet component and the
increment of the hyperfine field as the annealing temperature increases. Moreover, the value of
the ẟ isomer shift of both components, which contains information about the chemical order in
the surrounding of Sn atoms and is therefore related with the atomic order on the alloy, does
not change, in concordance with neutron powder diffraction results and with the null variation
in the martensitic transformation and magnetic order temperatures observed by calorimetric and
magnetic measurements. On the other hand, the line-width parameter, ᴦ , decreases as the
annealing temperature increases. The value of ᴦ is related with the slight distortions of the local
environment of the Mössbauer probe atoms [18] and therefore it is sensitive to the
microstructure and consequently to the recovery of the defects created by milling. Thus, the
observed changes on the magnetic properties and in the width of the martensitic transformation
would rely on different internal stress states and on the presence of defects created during the
milling. As previously reported in some Heusler alloys, several local distortions as dislocations
and defects can be created during mechanical treatments while the atomic order is maintained
[19, 20]. Dislocations in atomic ordered structures appear as super-dislocations: a pair of
dislocations separated by an antiphase boundary where the atomic order is modified, and
consequently the magnetic coupling related to it. Sn atoms do not carry intrinsic magnetic
moment, but since a transferred hyperfine field can be induced from the neighboring magnetic
ions (Mn ions in the case of Ni-Mn-Sn), [21] 119Sn-Mössbauer spectroscopy would be sensitive
to the local magnetic field felt by the Sn atoms. The singlet component (Figure 3. 25) is related
to stressed regions caused by dislocations and antiphase boundaries where the local magnetic
field is absent. In these regions the ferromagnetic order is altered in such a way that the total
transferred dipolar field at Sn sites is zero. As decreases with annealing, implying a reduction
of the density of antiphase boundaries as result of the annihilation of dislocations, while at the
same time Bhf increases. This increase indicates a reinforcement of the transferred dipolar field
with the annealing of defects and the recovery of the ferromagnetic coupling in the austenitic
phase.
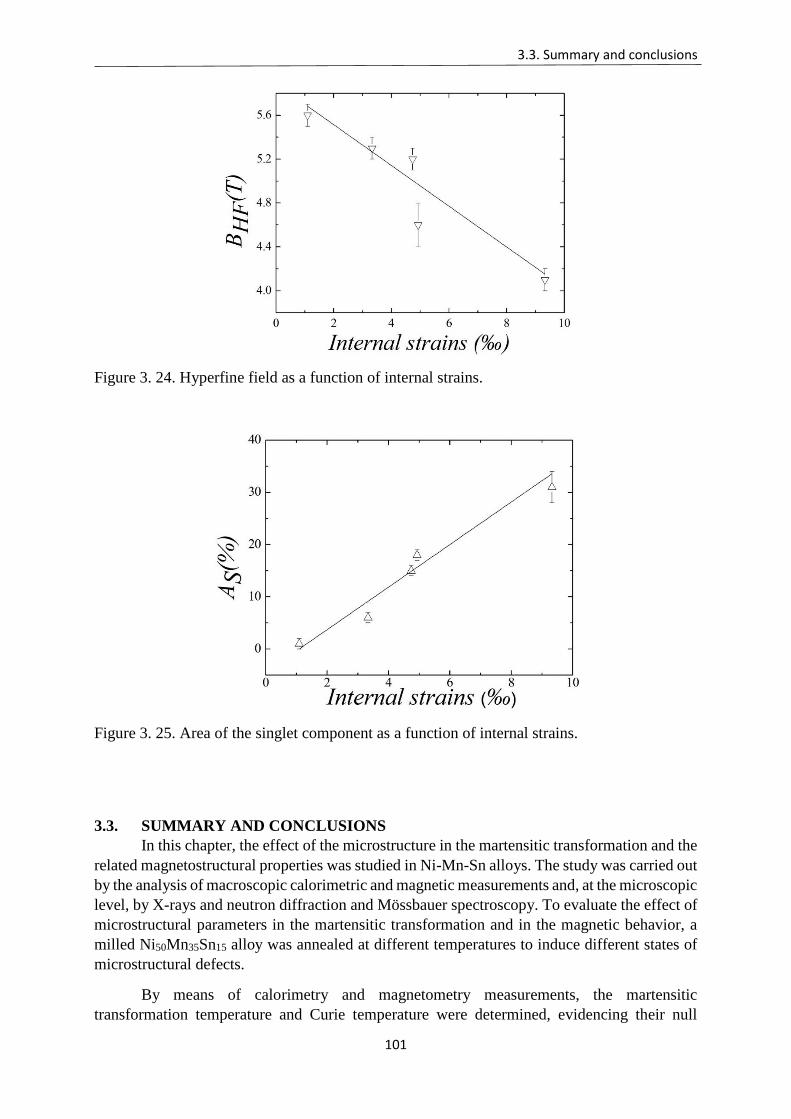
3.3. Summary and conclusions
101
Figure 3. 24. Hyperfine field as a function of internal strains.
Figure 3. 25. Area of the singlet component as a function of internal strains.
3.3. SUMMARY AND CONCLUSIONS
In this chapter, the effect of the microstructure in the martensitic transformation and the
related magnetostructural properties was studied in Ni-Mn-Sn alloys. The study was carried out
by the analysis of macroscopic calorimetric and magnetic measurements and, at the microscopic
level, by X-rays and neutron diffraction and Mössbauer spectroscopy. To evaluate the effect of
microstructural parameters in the martensitic transformation and in the magnetic behavior, a
milled Ni50Mn35Sn15 alloy was annealed at different temperatures to induce different states of
microstructural defects.
By means of calorimetry and magnetometry measurements, the martensitic
transformation temperature and Curie temperature were determined, evidencing their null
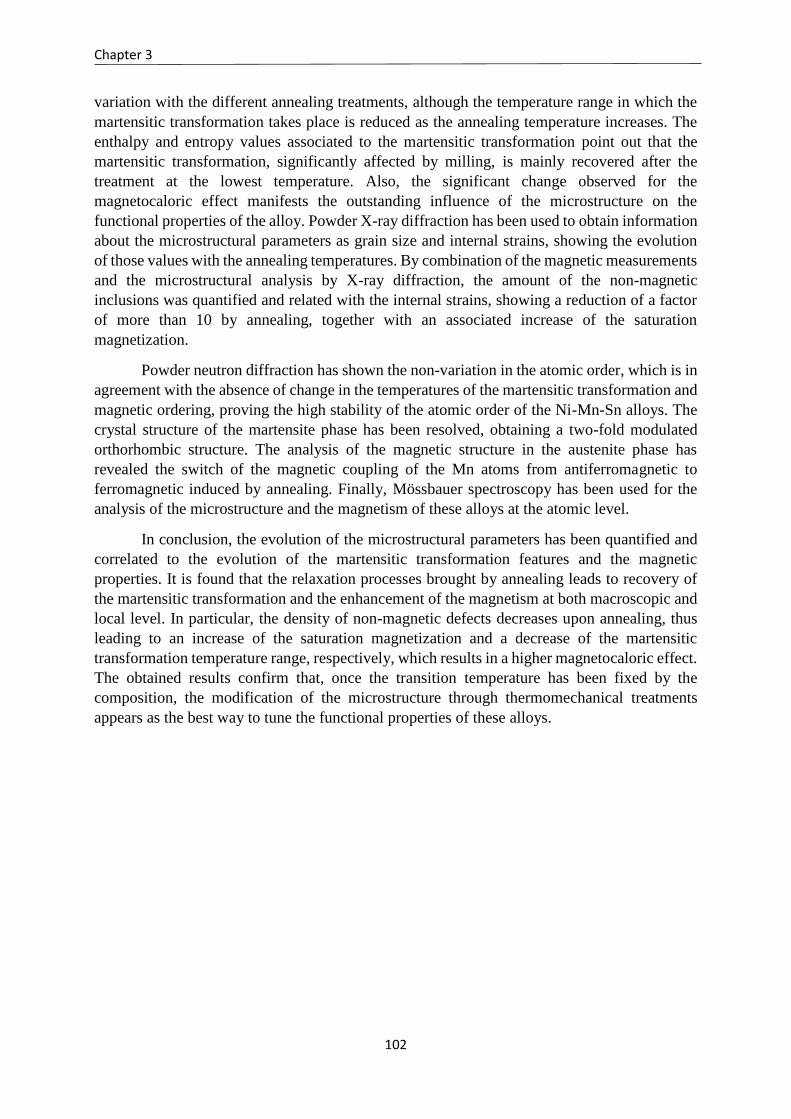
Chapter 3
102
variation with the different annealing treatments, although the temperature range in which the
martensitic transformation takes place is reduced as the annealing temperature increases. The
enthalpy and entropy values associated to the martensitic transformation point out that the
martensitic transformation, significantly affected by milling, is mainly recovered after the
treatment at the lowest temperature. Also, the significant change observed for the
magnetocaloric effect manifests the outstanding influence of the microstructure on the
functional properties of the alloy. Powder X-ray diffraction has been used to obtain information
about the microstructural parameters as grain size and internal strains, showing the evolution
of those values with the annealing temperatures. By combination of the magnetic measurements
and the microstructural analysis by X-ray diffraction, the amount of the non-magnetic
inclusions was quantified and related with the internal strains, showing a reduction of a factor
of more than 10 by annealing, together with an associated increase of the saturation
magnetization.
Powder neutron diffraction has shown the non-variation in the atomic order, which is in
agreement with the absence of change in the temperatures of the martensitic transformation and
magnetic ordering, proving the high stability of the atomic order of the Ni-Mn-Sn alloys. The
crystal structure of the martensite phase has been resolved, obtaining a two-fold modulated
orthorhombic structure. The analysis of the magnetic structure in the austenite phase has
revealed the switch of the magnetic coupling of the Mn atoms from antiferromagnetic to
ferromagnetic induced by annealing. Finally, Mössbauer spectroscopy has been used for the
analysis of the microstructure and the magnetism of these alloys at the atomic level.
In conclusion, the evolution of the microstructural parameters has been quantified and
correlated to the evolution of the martensitic transformation features and the magnetic
properties. It is found that the relaxation processes brought by annealing leads to recovery of
the martensitic transformation and the enhancement of the magnetism at both macroscopic and
local level. In particular, the density of non-magnetic defects decreases upon annealing, thus
leading to an increase of the saturation magnetization and a decrease of the martensitic
transformation temperature range, respectively, which results in a higher magnetocaloric effect.
The obtained results confirm that, once the transition temperature has been fixed by the
composition, the modification of the microstructure through thermomechanical treatments
appears as the best way to tune the functional properties of these alloys.
Bibliography
103
Bibliography.
[1] V. Sánchez-Alarcos, J. I. Pérez-Landazábal, V. Recarte, I. Lucia, J. Vélez, and J. A.
Rodríguez-Velamazán, “Effect of high-temperature quenching on the magnetostructural
transformations and the long-range atomic order of Ni–Mn–Sn and Ni–Mn–Sb
metamagnetic shape memory alloys,” Acta Mater., vol. 61, no. 12, pp. 4676–4682, Jul.
2013.
[2] V. Recarte, J. Pérez-Landazábal, V. Sánchez-Alarcos, and J. A. Rodriguez-Velamazán,
“Dependence of the martensitic transformation and magnetic transition on the atomic order
in Ni–Mn–In metamagnetic shape memory alloys,” Acta Mater., vol. 60, pp. 1937–1945,
Mar. 2012.
[3] V. Sánchez-Alarcos, V. Recarte, J. I. Pérez-Landazábal, E. Cesari, and J. A. Rodríguez-
Velamazán, “Long-Range Atomic Order and Entropy Change at the Martensitic
Transformation in a Ni-Mn-In-Co Metamagnetic Shape Memory Alloy,” Entropy, vol. 16,
no. 5, pp. 2756–2767, May 2014.
[4] S. Kustov, M. L. Corró, J. Pons, and E. Cesari, “Entropy change and effect of magnetic
field on martensitic transformation in a metamagnetic Ni–Co–Mn–In shape memory alloy,”
Appl. Phys. Lett., vol. 94, no. 19, p. 191901, May 2009.
[5] J. Rodríguez-Carvajal, “Recent advances in magnetic structure determination by neutron
powder diffraction,” Phys. B Condens. Matter, vol. 192, no. 1, pp. 55–69, Oct. 1993.
[6] J. Ortín and A. Planes, “Thermodynamics of thermoelastic martensitic transformations,”
Acta Metall., vol. 37, no. 5, pp. 1433–1441, May 1989.
[7] J. Ortín and A. Planes, “Thermodynamic analysis of thermal measurements in thermoelastic
martensitic transformations,” Acta Metall., vol. 36, no. 8, pp. 1873–1889, Aug. 1988.
[8] J. L. S. Llamazares, B. Hernando, J. J. Suñol, C. García, and C. A. Ross, “Kinetic arrest of
direct and reverse martensitic transformation and exchange bias effect in
Mn49.5Ni40.4In10.1 melt spun ribbons,” J. Appl. Phys., vol. 107, no. 9, p. 09A956, May
2010.
[9] R. Y. Umetsu, K. Ito, W. Ito, K. Koyama, T. Kanomata, K. Ishida, and R. Kainuma,
“Kinetic arrest behavior in martensitic transformation of NiCoMnSn metamagnetic shape
memory alloy,” J. Alloys Compd., vol. 509, no. 5, pp. 1389–1393, Feb. 2011.
[10] J. I. Pérez-Landazábal, V. Recarte, V. Sánchez-Alarcos, C. Gómez-Polo, S. Kustov, and
E. Cesari, “Magnetic field induced martensitic transformation linked to the arrested
austenite in a Ni-Mn-In-Co shape memory alloy,” J. Appl. Phys., vol. 109, no. 9, p. 093515,
May 2011.
Chapter 3
104
[11] X. Wang, F. Sung, J. Wang, Q. Yu, Y. Wu, H. Hua, and C. Jiang, “Influence of annealing
temperatures on the magnetostructural transition and magnetocaloric effect of
Ni40Co10Mn40Sn10 powders,” J. Alloys Compd., vol. 691, pp. 215–219, Jan. 2017.
[12] S. Chikazumi and C. D. Graham, Physics of Ferromagnetism 2e. OUP Oxford, 2009.
[13] E. Schlömann, “Properties of Magnetic Materials with a Nonuniform Saturation
Magnetization. I. General Theory and Calculation of the Static Magnetization,” J. Appl.
Phys., vol. 38, no. 13, pp. 5027–5034, Dec. 1967.
[14] G. F. Dionne, J. A. Weiss, and G. A. Allen, “Hysteresis loops modeled from coercivity,
anisotropy, and microstructure parameters,” J. Appl. Phys., vol. 61, pp. 3862–3864, Apr.
1987.
[15] Umetsu, R. Y, A. Sheikh, B. Ouladdiaf, K. R. A. Ziebeck, T. Kanomata, and R.
Kainuma, “The effect of Co substitution on the magnetic properties of the Heusler alloy
Ni50Mn33Sn17,” Appl. Phys. Lett., vol. 98, no. 4, p. 042507, Jan. 2011.
[16] T. Krenke, M. Acet, E. F. Wassermann, X. Moya, L. Mañosa, and A. Planes,
“Ferromagnetism in the austenitic and martensitic states of Ni-Mn-In alloys,” Phys. Rev. B,
vol. 73, no. 17, p. 174413, May 2006.
[17] P. J. Brown, A.P. Gandy, K. Ishida, R. Kainuma, T. Kanomata, K. U. Neumann, K.
Oikawa, B. Ouladdiaf, and K. R. A. Ziebeck, “The magnetic and structural properties of
the magnetic shape memory compound Ni2Mn1.44Sn0.56,” J. Phys. Condens. Matter, vol. 18,
no. 7, p. 2249, 2006.
[18] D. P. E. Dickson and F. J. Berry, Mössbauer Spectroscopy. Cambridge University Press,
2005.
[19] J. Schaf, K. L. Dang, P. Veillet, and I. A. Campbell, “Extended and local effects of cold
work in Heusler alloys,” J. Phys. F Met. Phys., vol. 13, no. 6, pp. 1311–1316, Jun. 1983.
[20] T. Shinohara, K. Sasaki, H. Yamauchi, H. Watanabe, H. Sekizawa, and T. Okada, “On
the Reduction in Magnetization by Clod Working on the Ferromagnetic Heusler Alloy
Pd2MnSn,” J. Phys. Soc. Jpn., vol. 50, no. 9, pp. 2904–2908, Sep. 1981.
[21] M. Kalvius and P. Kienle, The Rudolf Mössbauer Story: His Scientific Work and Its
Impact on Science and History. Springer Science & Business Media, 2012.
105
Chapter 4. Enhancement of
magnetocaloric effect by intrinsic
defects and microstructure evolution
by ball-milling in Ni45Co5Mn35Sn15
shape memory alloy
4.1. INTRODUCTION
As explained previously in the introduction chapter, the metamagnetic alloys based in
the Ni-Mn-Z (Z=In, Sn, and Sb) systems in which the martensitic transformation (MT) takes
place between a ferromagnetic austenite and a weak-magnetic martensite are among the most
promising alloys for magnetocaloric applications. The MT characteristics and the magnetic
properties of these alloys depend on composition, atomic order and, in principle to a lesser
extent, on microstructure. The compositional dependence has been widely studied, being the
complete phase diagrams of the appearing structural and magnetic phases well stablished [1–
4]. Atomic order has been also systematically studied. In Ni-Mn-In and Ni-Mn-In-Co alloys it
has been shown that the magnetostructural properties can be properly tuned varying the long-
range atomic order, which can be easily controlled by means of thermal treatments [5–7]. In
Ni-Mn-Sn and Ni-Mn-Sb alloys, in turn, the L21 structure is highly stable and the atomic order
is then hardly modifiable by means of conventional thermal treatments [8]. In these alloys, the
modification of the microstructural parameters (grain size, defects, internal stresses…) is the
only way to modify the functional properties for a selected alloy composition. Mechanical
milling and subsequent annealing treatments are one of the simplest and most used method to
modify the microstructure. Typically, the grain size reduction and the presence of defects and
internal stresses induced by milling degrade the MT and the magnetic properties, which can be
then partially restored upon microstructural recovery processes brought by subsequent
annealing [9–13]. In this respect, by comparing a Ni-Mn-Sn alloy in both the as-milled and the
annealed states, we have shown that, even though no appreciable long-range atomic disorder
was induced by milling, the saturation magnetization of both martensitic and austenitic phases
are considerably higher after annealing, due to the reduction of the density of the anti-phase
boundaries (linked to dislocations), which promote the antiferromagnetic coupling between Mn
moments, as it was explained in Chapter 3. A similar magnetic deterioration at anti-phase
boundaries was indeed evaluated in Ni-Mn-Al-Ga alloys by electron holography, and explained
as a consequence of a local atomic disordering in the boundary region [14].
4.3. Summary and conclusions
106
On the other hand, the addition of cobalt has been shown to enhance the magnetism of the
austenite and to hinder ferromagnetic ordering in martensite in Ni-Mn-Z alloys, thus leading to
an increase of ΔM and therefore to larger magnetically-induced shifts of the MT temperature
and higher associated magnetocaloric effects [15–20]. In particular, in Ni-Mn-Sn alloys it has
been also shown that the magnetic coupling between the Mn moments on the 4a (Mn sublattice)
and 4b sites (Sn sublattice) of the austenitic cubic structure changes from being
antiferromagnetic to ferromagnetic as a consequence of the substitution of Ni by Co [19] (the
magnetic coupling between Mn atoms on the 4a sites is ferromagnetic both in the ternary and
the quaternary alloys). In this regard, it could be thought that the influence of the presence of
anti-phase boundaries (and any other microstructural defect resulting in local atomic
disordering) on the magnetic properties will be different in the quaternary Co-doped alloys to
that in the ternary ones. In this sense, in the first part of this chapter the effect of mechanically-
induced defects on the magnetostructural properties, and in particular on the magnetocaloric
effect, is analyzed on a quaternary Ni-Co-Mn-Sn alloy subjected to soft milling and subsequent
annealing. It is found that the presence of microstructural defects, far for worsening, can make
the magnetocaloric effect to be higher in the as-milled state than after subsequent annealing.
This unusual beneficial presence of defects is explained as the result of the combination of the
effect of defects on the Mn-Mn distance, the Co effect on the magnetic exchange coupling
between Mn atoms, and the effect of defects on the vibrational entropy change at the martensitic
transformation.
Due to this unconventional result, in a further step, ball milling has been used as a suitable way
to induce a large amount of defects in the studied Ni-Co-Mn-Sn alloy in a controlled way,
allowing a systematic study on the evolution of the microstructure. This technique provides
some advantages like simplicity, high productivity, and cost-effectiveness in fabrication
metallic particles compared with other methods. On the other hand, the high energy involved
in the process modifies the characteristics of the MT as consequence of inducing a disordered
phase. In addition, the null variation in the atomic order degree by thermal treatments those Ni-
Mn-Sn systems present make them suitable to understand the effects of ball milling on the
properties of the alloys. Therefore, the effect of high-energy ball milling has been analyzed in
the Ni-Co-Mn-Sn alloy, quantifying the evolution of the microstructural parameters and the
magnetostructural properties with the milling time.
4.2. EXPERIMENTAL RESULTS
A Ni45Co5Mn35Sn15 alloy was synthetized, as described in Chapter 2, from high purity
elements by arc-melting under protective argon atmosphere. The obtained bulk was remelted
several times and homogenized at 1173K during 24h and slowly cooled to room temperature.
The composition was analyzed by EDS in a Jeol JSM-5610LV Scanning Electron Microscope
(SEM). In order to induce defects, the alloy was subjected to hand milling in an agate mortar
until reaching a uniform particle-size distribution. The mean particle size of the powder,
estimated from SEM images, was 60 ± 20 𝜇𝑚. A part of the obtained powder was then
subjected to a 5 min annealing at 673K in order to remove some of the defects induced by
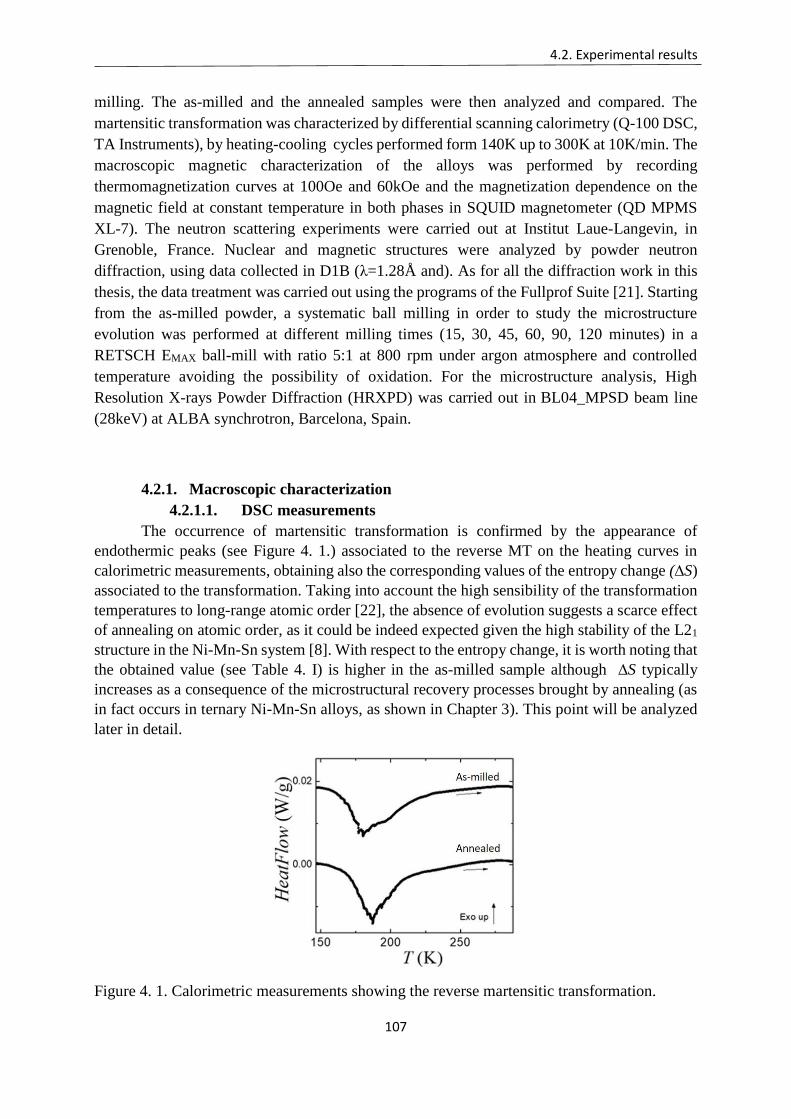
4.2. Experimental results
107
milling. The as-milled and the annealed samples were then analyzed and compared. The
martensitic transformation was characterized by differential scanning calorimetry (Q-100 DSC,
TA Instruments), by heating-cooling cycles performed form 140K up to 300K at 10K/min. The
macroscopic magnetic characterization of the alloys was performed by recording
thermomagnetization curves at 100Oe and 60kOe and the magnetization dependence on the
magnetic field at constant temperature in both phases in SQUID magnetometer (QD MPMS
XL-7). The neutron scattering experiments were carried out at Institut Laue-Langevin, in
Grenoble, France. Nuclear and magnetic structures were analyzed by powder neutron
diffraction, using data collected in D1B (λ=1.28Å and). As for all the diffraction work in this
thesis, the data treatment was carried out using the programs of the Fullprof Suite [21]. Starting
from the as-milled powder, a systematic ball milling in order to study the microstructure
evolution was performed at different milling times (15, 30, 45, 60, 90, 120 minutes) in a
RETSCH EMAX ball-mill with ratio 5:1 at 800 rpm under argon atmosphere and controlled
temperature avoiding the possibility of oxidation. For the microstructure analysis, High
Resolution X-rays Powder Diffraction (HRXPD) was carried out in BL04_MPSD beam line
(28keV) at ALBA synchrotron, Barcelona, Spain.
4.2.1. Macroscopic characterization
4.2.1.1. DSC measurements
The occurrence of martensitic transformation is confirmed by the appearance of
endothermic peaks (see Figure 4. 1.) associated to the reverse MT on the heating curves in
calorimetric measurements, obtaining also the corresponding values of the entropy change (∆S)
associated to the transformation. Taking into account the high sensibility of the transformation
temperatures to long-range atomic order [22], the absence of evolution suggests a scarce effect
of annealing on atomic order, as it could be indeed expected given the high stability of the L21
structure in the Ni-Mn-Sn system [8]. With respect to the entropy change, it is worth noting that
the obtained value (see Table 4. I) is higher in the as-milled sample although ∆S typically
increases as a consequence of the microstructural recovery processes brought by annealing (as
in fact occurs in ternary Ni-Mn-Sn alloys, as shown in Chapter 3). This point will be analyzed
later in detail.
Figure 4. 1. Calorimetric measurements showing the reverse martensitic transformation.
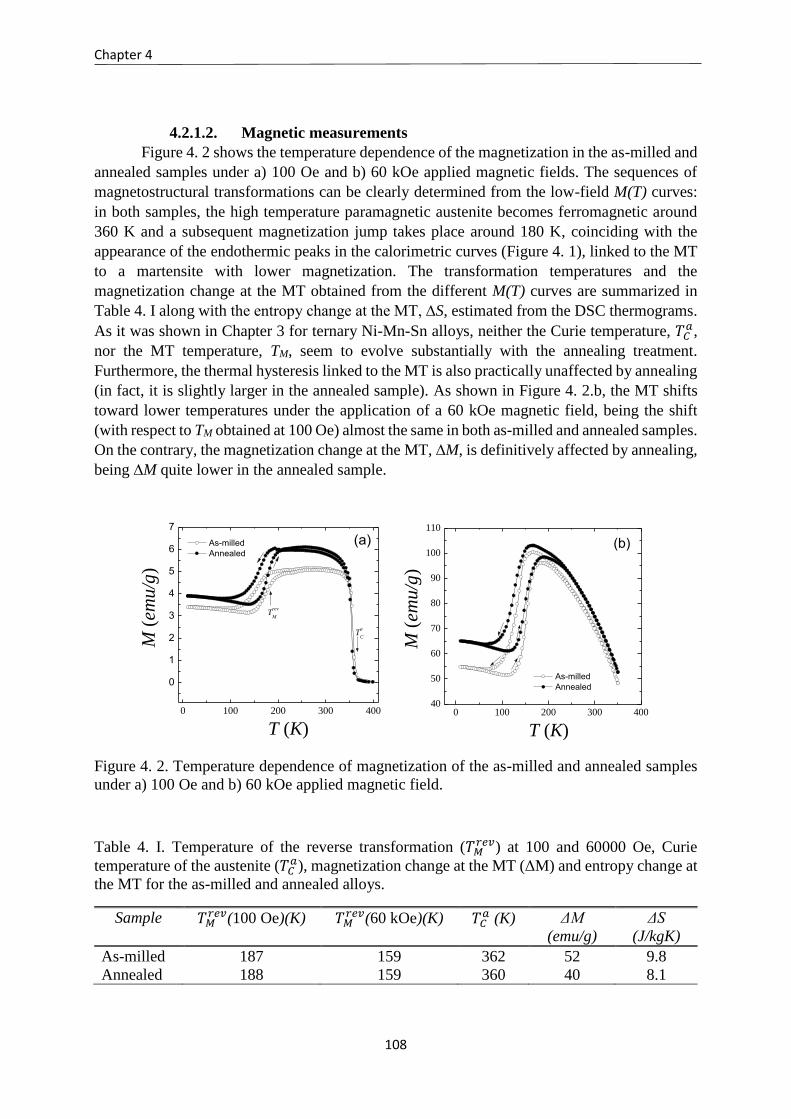
Chapter 4
108
4.2.1.2. Magnetic measurements
Figure 4. 2 shows the temperature dependence of the magnetization in the as-milled and
annealed samples under a) 100 Oe and b) 60 kOe applied magnetic fields. The sequences of
magnetostructural transformations can be clearly determined from the low-field M(T) curves:
in both samples, the high temperature paramagnetic austenite becomes ferromagnetic around
360 K and a subsequent magnetization jump takes place around 180 K, coinciding with the
appearance of the endothermic peaks in the calorimetric curves (Figure 4. 1), linked to the MT
to a martensite with lower magnetization. The transformation temperatures and the
magnetization change at the MT obtained from the different M(T) curves are summarized in
Table 4. I along with the entropy change at the MT, ∆S, estimated from the DSC thermograms.
As it was shown in Chapter 3 for ternary Ni-Mn-Sn alloys, neither the Curie temperature, 𝑇𝐶𝑎,
nor the MT temperature, TM, seem to evolve substantially with the annealing treatment.
Furthermore, the thermal hysteresis linked to the MT is also practically unaffected by annealing
(in fact, it is slightly larger in the annealed sample). As shown in Figure 4. 2.b, the MT shifts
toward lower temperatures under the application of a 60 kOe magnetic field, being the shift
(with respect to TM obtained at 100 Oe) almost the same in both as-milled and annealed samples.
On the contrary, the magnetization change at the MT, ∆M, is definitively affected by annealing,
being ∆M quite lower in the annealed sample.
0 100 200 300 400
0
1
2
3
4
5
6
7
Ta
C
As-milled
Annealed
M (
emu/g
)
T (K)
(a)
Trev
M
0 100 200 300 40040
50
60
70
80
90
100
110
As-milled
Annealed
M (
emu/g
)
T (K)
(b)
Figure 4. 2. Temperature dependence of magnetization of the as-milled and annealed samples
under a) 100 Oe and b) 60 kOe applied magnetic field.
Table 4. I. Temperature of the reverse transformation (𝑇𝑀𝑟𝑒𝑣) at 100 and 60000 Oe, Curie
temperature of the austenite (𝑇𝐶𝑎), magnetization change at the MT (ΔM) and entropy change at
the MT for the as-milled and annealed alloys.
Sample 𝑇𝑀𝑟𝑒𝑣(100 Oe)(K) 𝑇𝑀
𝑟𝑒𝑣(60 kOe)(K) 𝑇𝐶𝑎 (K) ΔM
(emu/g)
ΔS
(J/kgK)
As-milled 187 159 362 52 9.8
Annealed 188 159 360 40 8.1
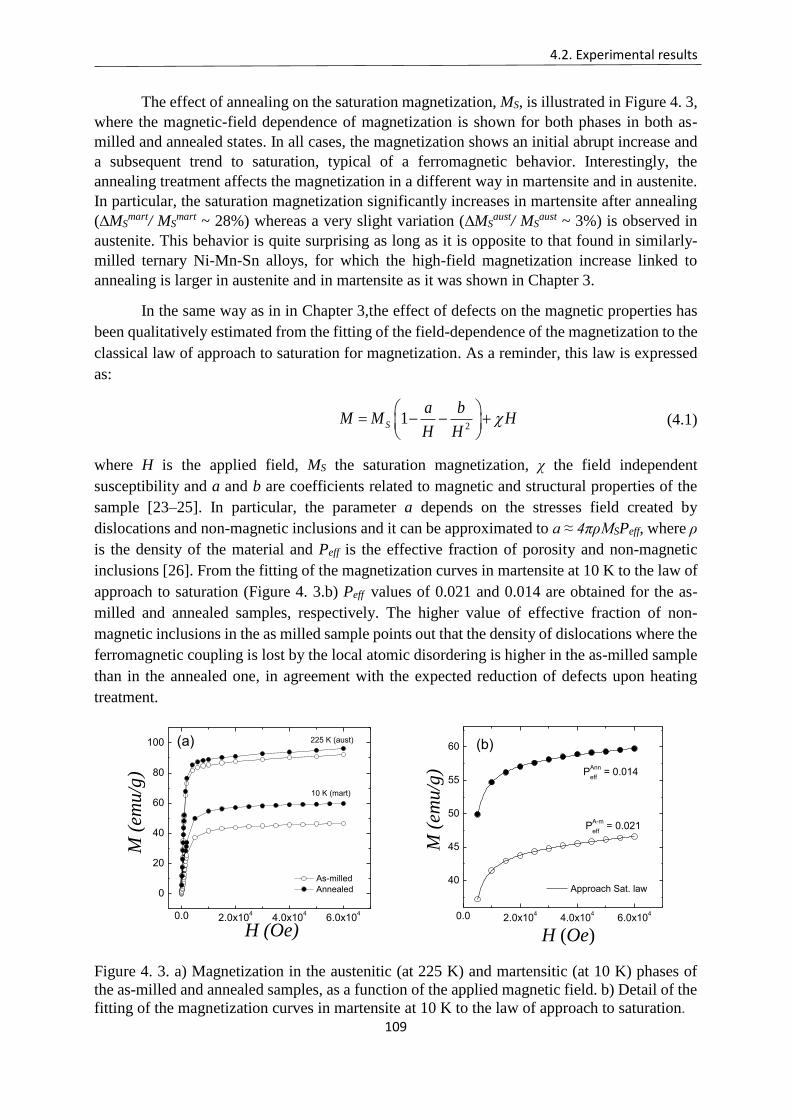
4.2. Experimental results
109
The effect of annealing on the saturation magnetization, MS, is illustrated in Figure 4. 3,
where the magnetic-field dependence of magnetization is shown for both phases in both as-
milled and annealed states. In all cases, the magnetization shows an initial abrupt increase and
a subsequent trend to saturation, typical of a ferromagnetic behavior. Interestingly, the
annealing treatment affects the magnetization in a different way in martensite and in austenite.
In particular, the saturation magnetization significantly increases in martensite after annealing
(∆MSmart/ MS
mart ~ 28%) whereas a very slight variation (∆MSaust/ MS
aust ~ 3%) is observed in
austenite. This behavior is quite surprising as long as it is opposite to that found in similarly-
milled ternary Ni-Mn-Sn alloys, for which the high-field magnetization increase linked to
annealing is larger in austenite and in martensite as it was shown in Chapter 3.
In the same way as in in Chapter 3,the effect of defects on the magnetic properties has
been qualitatively estimated from the fitting of the field-dependence of the magnetization to the
classical law of approach to saturation for magnetization. As a reminder, this law is expressed
as:
21S
a bM M H
H H
(4.1)
where H is the applied field, MS the saturation magnetization, χ the field independent
susceptibility and a and b are coefficients related to magnetic and structural properties of the
sample [23–25]. In particular, the parameter a depends on the stresses field created by
dislocations and non-magnetic inclusions and it can be approximated to a ≈ 4πρMSPeff, where ρ
is the density of the material and Peff is the effective fraction of porosity and non-magnetic
inclusions [26]. From the fitting of the magnetization curves in martensite at 10 K to the law of
approach to saturation (Figure 4. 3.b) Peff values of 0.021 and 0.014 are obtained for the as-
milled and annealed samples, respectively. The higher value of effective fraction of non-
magnetic inclusions in the as milled sample points out that the density of dislocations where the
ferromagnetic coupling is lost by the local atomic disordering is higher in the as-milled sample
than in the annealed one, in agreement with the expected reduction of defects upon heating
treatment.
0.0 2.0x10⁴
4.0x10⁴
6.0x10⁴
0
20
40
60
80
100
10 K (mart)
225 K (aust)
As-milled
Annealed
M (
emu/g
)
H (Oe)
(a)
0.0 2.0x10⁴
4.0x10⁴
6.0x10⁴
40
45
50
55
60
M (
emu/g
)
H (Oe)
PA-m
eff = 0.021
Approach Sat. law
PAnn
eff = 0.014
(b)
Figure 4. 3. a) Magnetization in the austenitic (at 225 K) and martensitic (at 10 K) phases of
the as-milled and annealed samples, as a function of the applied magnetic field. b) Detail of the
fitting of the magnetization curves in martensite at 10 K to the law of approach to saturation.
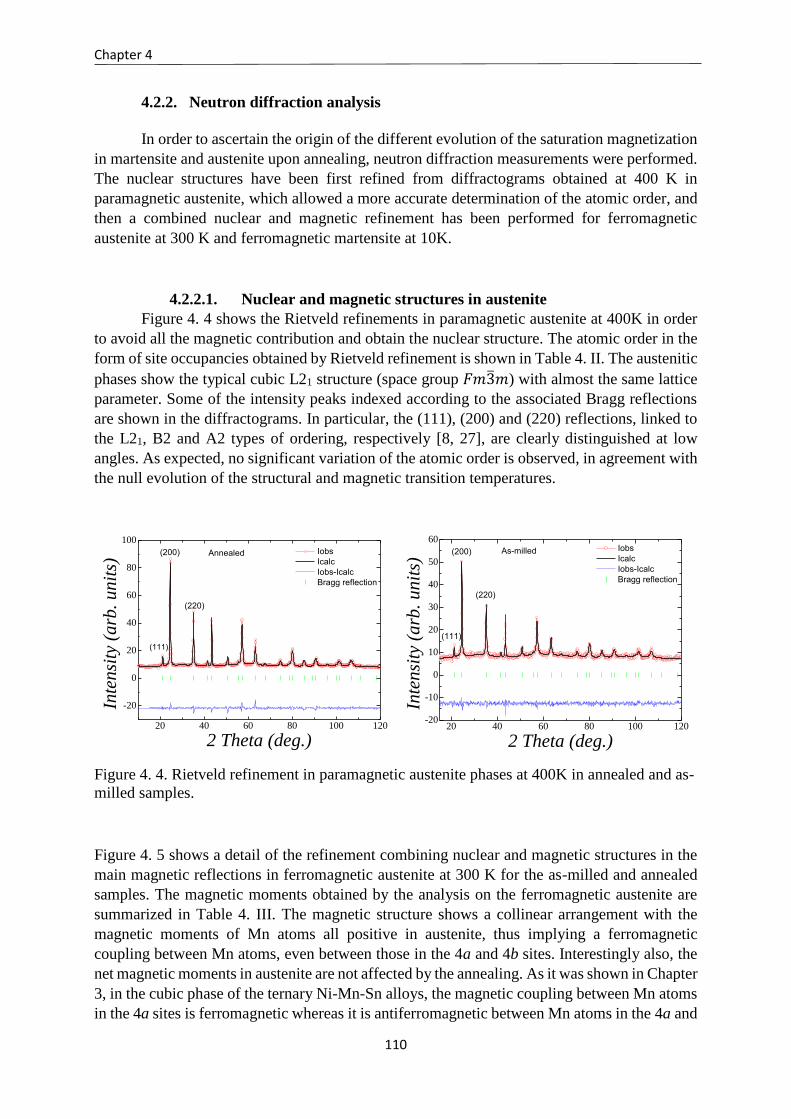
Chapter 4
110
4.2.2. Neutron diffraction analysis
In order to ascertain the origin of the different evolution of the saturation magnetization
in martensite and austenite upon annealing, neutron diffraction measurements were performed.
The nuclear structures have been first refined from diffractograms obtained at 400 K in
paramagnetic austenite, which allowed a more accurate determination of the atomic order, and
then a combined nuclear and magnetic refinement has been performed for ferromagnetic
austenite at 300 K and ferromagnetic martensite at 10K.
4.2.2.1. Nuclear and magnetic structures in austenite
Figure 4. 4 shows the Rietveld refinements in paramagnetic austenite at 400K in order
to avoid all the magnetic contribution and obtain the nuclear structure. The atomic order in the
form of site occupancies obtained by Rietveld refinement is shown in Table 4. II. The austenitic
phases show the typical cubic L21 structure (space group 𝐹𝑚3̅𝑚) with almost the same lattice
parameter. Some of the intensity peaks indexed according to the associated Bragg reflections
are shown in the diffractograms. In particular, the (111), (200) and (220) reflections, linked to
the L21, B2 and A2 types of ordering, respectively [8, 27], are clearly distinguished at low
angles. As expected, no significant variation of the atomic order is observed, in agreement with
the null evolution of the structural and magnetic transition temperatures.
20 40 60 80 100 120
-20
0
20
40
60
80
100
Annealed Iobs
Icalc
Iobs-Icalc
Bragg reflection
Inte
nsi
ty (
arb
. unit
s)
2 Theta (deg.)
(111)
(200)
(220)
20 40 60 80 100 120-20
-10
0
10
20
30
40
50
60
(200)
(220)
Iobs
Icalc
Iobs-Icalc
Bragg reflection
Inte
nsi
ty (
arb
. unit
s)
2 Theta (deg.)
As-milled
(111)
Figure 4. 4. Rietveld refinement in paramagnetic austenite phases at 400K in annealed and as-
milled samples.
Figure 4. 5 shows a detail of the refinement combining nuclear and magnetic structures in the
main magnetic reflections in ferromagnetic austenite at 300 K for the as-milled and annealed
samples. The magnetic moments obtained by the analysis on the ferromagnetic austenite are
summarized in Table 4. III. The magnetic structure shows a collinear arrangement with the
magnetic moments of Mn atoms all positive in austenite, thus implying a ferromagnetic
coupling between Mn atoms, even between those in the 4a and 4b sites. Interestingly also, the
net magnetic moments in austenite are not affected by the annealing. As it was shown in Chapter
3, in the cubic phase of the ternary Ni-Mn-Sn alloys, the magnetic coupling between Mn atoms
in the 4a sites is ferromagnetic whereas it is antiferromagnetic between Mn atoms in the 4a and
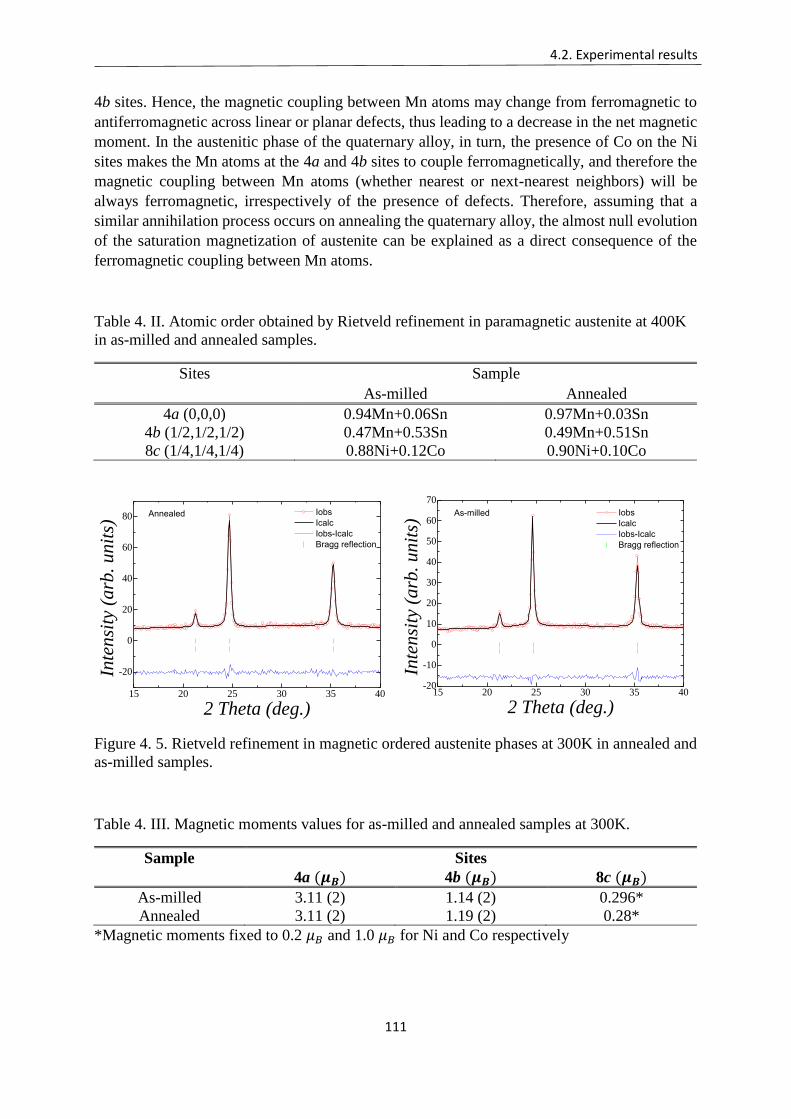
4.2. Experimental results
111
4b sites. Hence, the magnetic coupling between Mn atoms may change from ferromagnetic to
antiferromagnetic across linear or planar defects, thus leading to a decrease in the net magnetic
moment. In the austenitic phase of the quaternary alloy, in turn, the presence of Co on the Ni
sites makes the Mn atoms at the 4a and 4b sites to couple ferromagnetically, and therefore the
magnetic coupling between Mn atoms (whether nearest or next-nearest neighbors) will be
always ferromagnetic, irrespectively of the presence of defects. Therefore, assuming that a
similar annihilation process occurs on annealing the quaternary alloy, the almost null evolution
of the saturation magnetization of austenite can be explained as a direct consequence of the
ferromagnetic coupling between Mn atoms.
Table 4. II. Atomic order obtained by Rietveld refinement in paramagnetic austenite at 400K
in as-milled and annealed samples.
Sites Sample
As-milled Annealed
4a (0,0,0) 0.94Mn+0.06Sn 0.97Mn+0.03Sn
4b (1/2,1/2,1/2) 0.47Mn+0.53Sn 0.49Mn+0.51Sn
8c (1/4,1/4,1/4) 0.88Ni+0.12Co 0.90Ni+0.10Co
15 20 25 30 35 40
-20
0
20
40
60
80 Annealed Iobs
Icalc
Iobs-Icalc
Bragg reflection
Inte
nsi
ty (
arb
. unit
s)
2 Theta (deg.)
15 20 25 30 35 40-20
-10
0
10
20
30
40
50
60
70
Iobs
Icalc
Iobs-Icalc
Bragg reflection
Inte
nsi
ty (
arb
. u
nit
s)
2 Theta (deg.)
As-milled
Figure 4. 5. Rietveld refinement in magnetic ordered austenite phases at 300K in annealed and
as-milled samples.
Table 4. III. Magnetic moments values for as-milled and annealed samples at 300K.
Sample Sites
4a (𝝁𝑩) 4b (𝝁𝑩) 8c (𝝁𝑩)
As-milled 3.11 (2) 1.14 (2) 0.296*
Annealed 3.11 (2) 1.19 (2) 0.28*
*Magnetic moments fixed to 0.2 𝜇𝐵 and 1.0 𝜇𝐵 for Ni and Co respectively
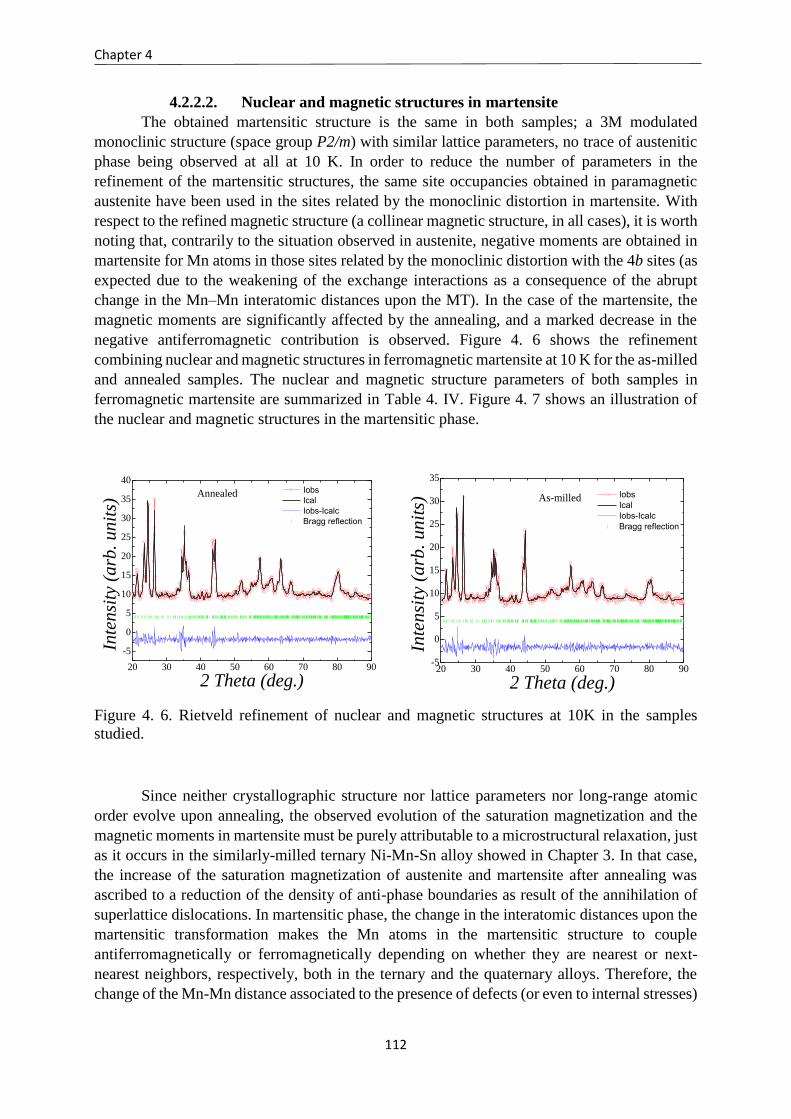
Chapter 4
112
4.2.2.2. Nuclear and magnetic structures in martensite
The obtained martensitic structure is the same in both samples; a 3M modulated
monoclinic structure (space group P2/m) with similar lattice parameters, no trace of austenitic
phase being observed at all at 10 K. In order to reduce the number of parameters in the
refinement of the martensitic structures, the same site occupancies obtained in paramagnetic
austenite have been used in the sites related by the monoclinic distortion in martensite. With
respect to the refined magnetic structure (a collinear magnetic structure, in all cases), it is worth
noting that, contrarily to the situation observed in austenite, negative moments are obtained in
martensite for Mn atoms in those sites related by the monoclinic distortion with the 4b sites (as
expected due to the weakening of the exchange interactions as a consequence of the abrupt
change in the Mn–Mn interatomic distances upon the MT). In the case of the martensite, the
magnetic moments are significantly affected by the annealing, and a marked decrease in the
negative antiferromagnetic contribution is observed. Figure 4. 6 shows the refinement
combining nuclear and magnetic structures in ferromagnetic martensite at 10 K for the as-milled
and annealed samples. The nuclear and magnetic structure parameters of both samples in
ferromagnetic martensite are summarized in Table 4. IV. Figure 4. 7 shows an illustration of
the nuclear and magnetic structures in the martensitic phase.
20 30 40 50 60 70 80 90
-5
0
5
10
15
20
25
30
35
40 Iobs
Ical
Iobs-Icalc
Bragg reflection
Inte
nsi
ty (
arb
. unit
s)
2 Theta (deg.)
Annealed
20 30 40 50 60 70 80 90-5
0
5
10
15
20
25
30
35
Iobs
Ical
Iobs-Icalc
Bragg reflection
As-milled
Inte
nsi
ty (
arb
. unit
s)
2 Theta (deg.)
Figure 4. 6. Rietveld refinement of nuclear and magnetic structures at 10K in the samples
studied.
Since neither crystallographic structure nor lattice parameters nor long-range atomic
order evolve upon annealing, the observed evolution of the saturation magnetization and the
magnetic moments in martensite must be purely attributable to a microstructural relaxation, just
as it occurs in the similarly-milled ternary Ni-Mn-Sn alloy showed in Chapter 3. In that case,
the increase of the saturation magnetization of austenite and martensite after annealing was
ascribed to a reduction of the density of anti-phase boundaries as result of the annihilation of
superlattice dislocations. In martensitic phase, the change in the interatomic distances upon the
martensitic transformation makes the Mn atoms in the martensitic structure to couple
antiferromagnetically or ferromagnetically depending on whether they are nearest or next-
nearest neighbors, respectively, both in the ternary and the quaternary alloys. Therefore, the
change of the Mn-Mn distance associated to the presence of defects (or even to internal stresses)
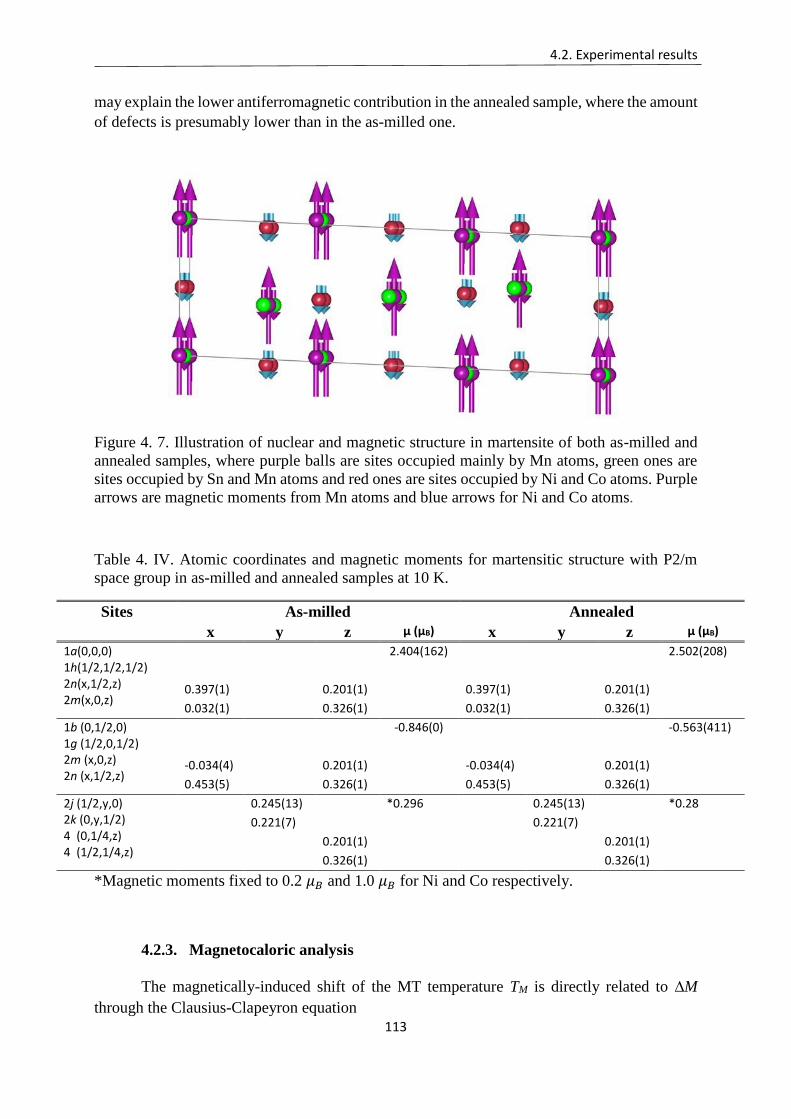
4.2. Experimental results
113
may explain the lower antiferromagnetic contribution in the annealed sample, where the amount
of defects is presumably lower than in the as-milled one.
Figure 4. 7. Illustration of nuclear and magnetic structure in martensite of both as-milled and
annealed samples, where purple balls are sites occupied mainly by Mn atoms, green ones are
sites occupied by Sn and Mn atoms and red ones are sites occupied by Ni and Co atoms. Purple
arrows are magnetic moments from Mn atoms and blue arrows for Ni and Co atoms.
Table 4. IV. Atomic coordinates and magnetic moments for martensitic structure with P2/m
space group in as-milled and annealed samples at 10 K.
Sites As-milled Annealed
x y z µ (µB) x y z µ (µB)
1a(0,0,0) 1h(1/2,1/2,1/2) 2n(x,1/2,z) 2m(x,0,z)
2.404(162) 2.502(208)
0.397(1) 0.201(1) 0.397(1) 0.201(1) 0.032(1) 0.326(1) 0.032(1) 0.326(1)
1b (0,1/2,0) 1g (1/2,0,1/2) 2m (x,0,z) 2n (x,1/2,z)
-0.846(0) -0.563(411)
-0.034(4) 0.201(1) -0.034(4) 0.201(1) 0.453(5) 0.326(1) 0.453(5) 0.326(1)
2j (1/2,y,0) 2k (0,y,1/2) 4 (0,1/4,z) 4 (1/2,1/4,z)
0.245(13) *0.296 0.245(13) *0.28
0.221(7) 0.221(7)
0.201(1) 0.201(1)
0.326(1) 0.326(1)
*Magnetic moments fixed to 0.2 𝜇𝐵 and 1.0 𝜇𝐵 for Ni and Co respectively.
4.2.3. Magnetocaloric analysis
The magnetically-induced shift of the MT temperature TM is directly related to ∆M
through the Clausius-Clapeyron equation
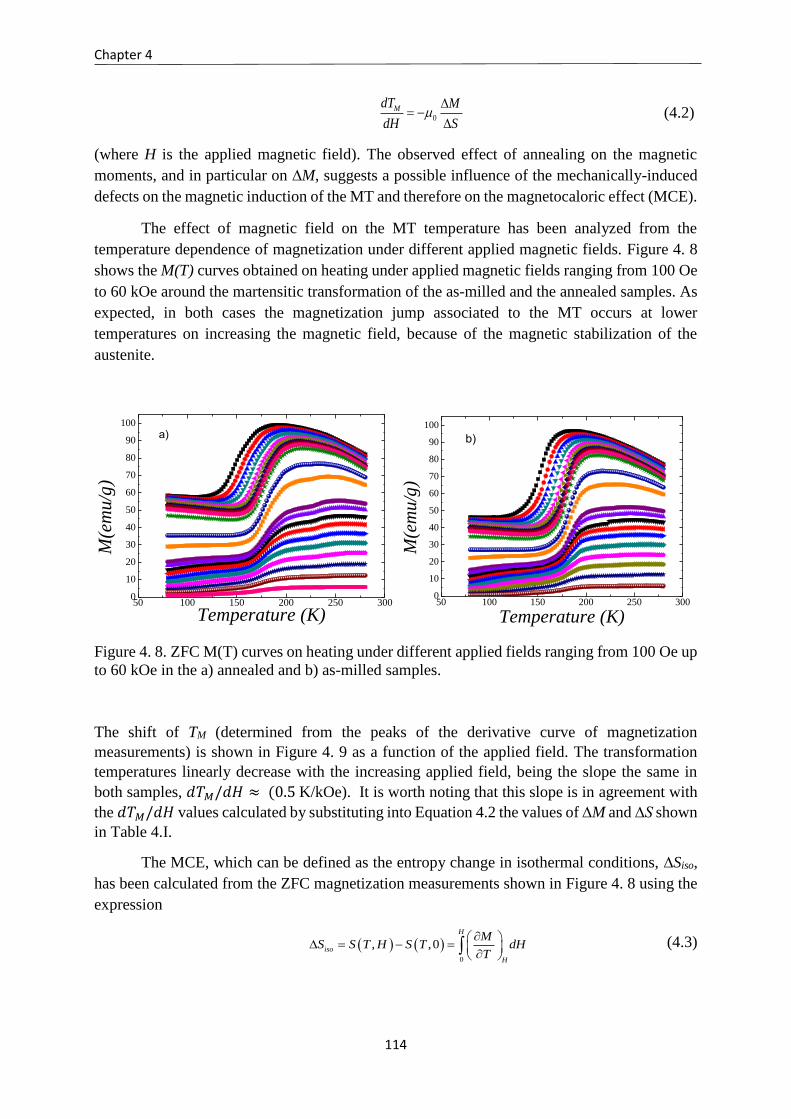
Chapter 4
114
0
MdT M
dH S
(4.2)
(where H is the applied magnetic field). The observed effect of annealing on the magnetic
moments, and in particular on ∆M, suggests a possible influence of the mechanically-induced
defects on the magnetic induction of the MT and therefore on the magnetocaloric effect (MCE).
The effect of magnetic field on the MT temperature has been analyzed from the
temperature dependence of magnetization under different applied magnetic fields. Figure 4. 8
shows the M(T) curves obtained on heating under applied magnetic fields ranging from 100 Oe
to 60 kOe around the martensitic transformation of the as-milled and the annealed samples. As
expected, in both cases the magnetization jump associated to the MT occurs at lower
temperatures on increasing the magnetic field, because of the magnetic stabilization of the
austenite.
50 100 150 200 250 3000
10
20
30
40
50
60
70
80
90
100
M(e
mu/g
)
Temperature (K)
a)
50 100 150 200 250 3000
10
20
30
40
50
60
70
80
90
100
M
(em
u/g
)
Temperature (K)
b)
Figure 4. 8. ZFC M(T) curves on heating under different applied fields ranging from 100 Oe up
to 60 kOe in the a) annealed and b) as-milled samples.
The shift of TM (determined from the peaks of the derivative curve of magnetization
measurements) is shown in Figure 4. 9 as a function of the applied field. The transformation
temperatures linearly decrease with the increasing applied field, being the slope the same in
both samples, 𝑑𝑇𝑀/𝑑𝐻 ≈ (0.5 K/kOe). It is worth noting that this slope is in agreement with
the 𝑑𝑇𝑀/𝑑𝐻 values calculated by substituting into Equation 4.2 the values of ∆M and ∆S shown
in Table 4.I.
The MCE, which can be defined as the entropy change in isothermal conditions, ∆Siso,
has been calculated from the ZFC magnetization measurements shown in Figure 4. 8 using the
expression
0
, ,0
H
iso
H
MS S T H S T dH
T
(4.3)
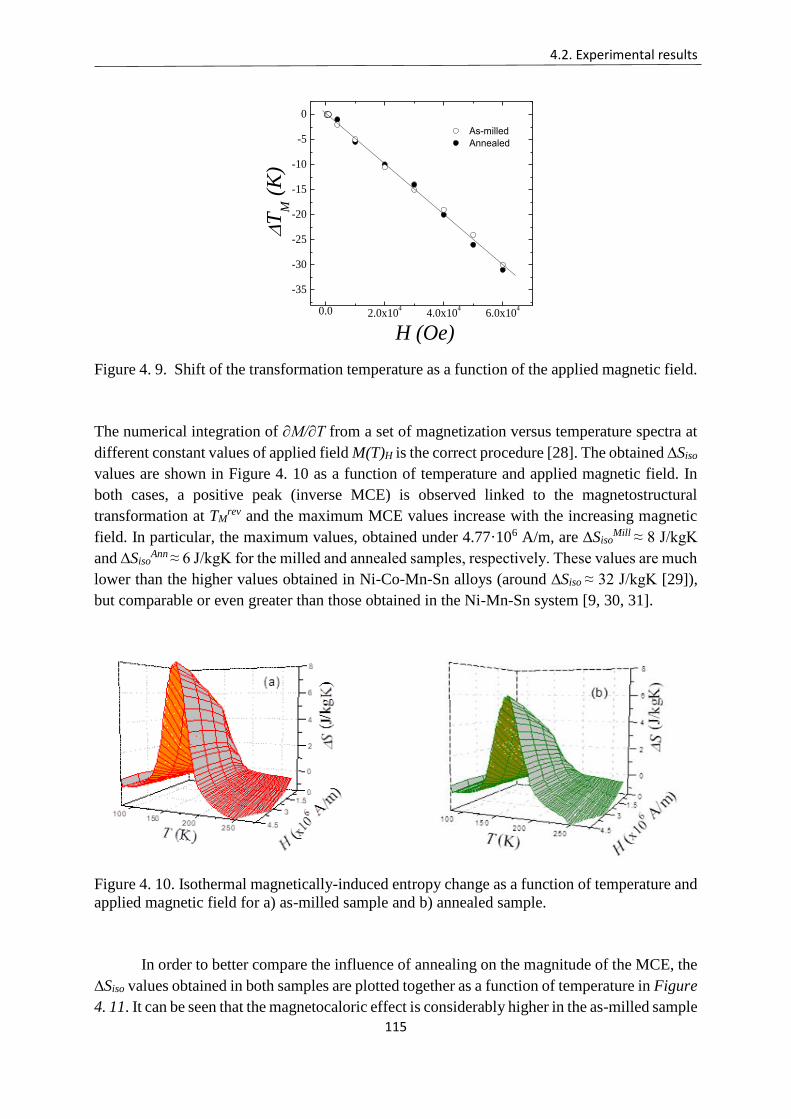
4.2. Experimental results
115
0.0 2.0x10⁴
4.0x10⁴
6.0x10⁴
-35
-30
-25
-20
-15
-10
-5
0
As-milled
Annealed
T
M (
K)
H (Oe)
Figure 4. 9. Shift of the transformation temperature as a function of the applied magnetic field.
The numerical integration of ∂M/∂T from a set of magnetization versus temperature spectra at
different constant values of applied field M(T)H is the correct procedure [28]. The obtained ∆Siso
values are shown in Figure 4. 10 as a function of temperature and applied magnetic field. In
both cases, a positive peak (inverse MCE) is observed linked to the magnetostructural
transformation at TMrev and the maximum MCE values increase with the increasing magnetic
field. In particular, the maximum values, obtained under 4.77·106 A/m, are ∆SisoMill ≈ 8 J/kgK
and ∆SisoAnn ≈ 6 J/kgK for the milled and annealed samples, respectively. These values are much
lower than the higher values obtained in Ni-Co-Mn-Sn alloys (around ∆Siso ≈ 32 J/kgK [29]),
but comparable or even greater than those obtained in the Ni-Mn-Sn system [9, 30, 31].
Figure 4. 10. Isothermal magnetically-induced entropy change as a function of temperature and
applied magnetic field for a) as-milled sample and b) annealed sample.
In order to better compare the influence of annealing on the magnitude of the MCE, the
∆Siso values obtained in both samples are plotted together as a function of temperature in Figure
4. 11. It can be seen that the magnetocaloric effect is considerably higher in the as-milled sample
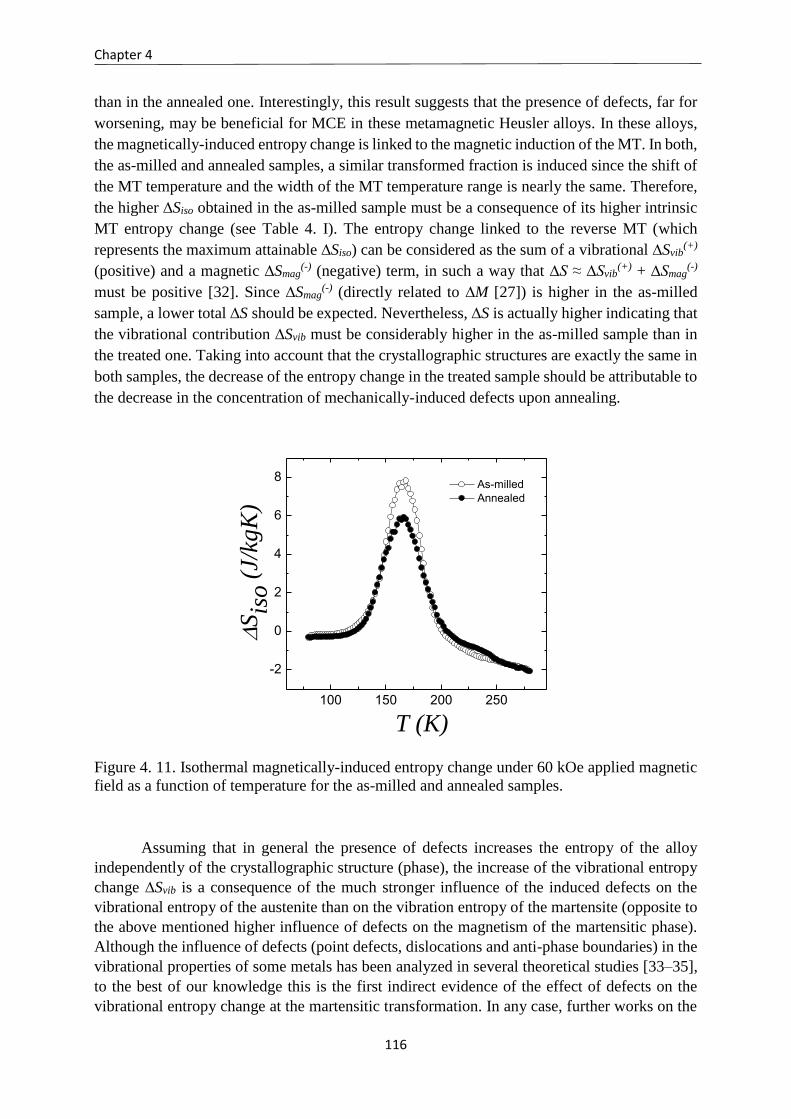
Chapter 4
116
than in the annealed one. Interestingly, this result suggests that the presence of defects, far for
worsening, may be beneficial for MCE in these metamagnetic Heusler alloys. In these alloys,
the magnetically-induced entropy change is linked to the magnetic induction of the MT. In both,
the as-milled and annealed samples, a similar transformed fraction is induced since the shift of
the MT temperature and the width of the MT temperature range is nearly the same. Therefore,
the higher ∆Siso obtained in the as-milled sample must be a consequence of its higher intrinsic
MT entropy change (see Table 4. I). The entropy change linked to the reverse MT (which
represents the maximum attainable ∆Siso) can be considered as the sum of a vibrational ∆Svib(+)
(positive) and a magnetic ∆Smag(-) (negative) term, in such a way that ∆S ≈ ∆Svib
(+) + ∆Smag(-)
must be positive [32]. Since ∆Smag(-) (directly related to ∆M [27]) is higher in the as-milled
sample, a lower total ∆S should be expected. Nevertheless, ∆S is actually higher indicating that
the vibrational contribution ∆Svib must be considerably higher in the as-milled sample than in
the treated one. Taking into account that the crystallographic structures are exactly the same in
both samples, the decrease of the entropy change in the treated sample should be attributable to
the decrease in the concentration of mechanically-induced defects upon annealing.
100 150 200 250
-2
0
2
4
6
8 As-milled
Annealed
S
iso
(J/
kgK
)
T (K)
Figure 4. 11. Isothermal magnetically-induced entropy change under 60 kOe applied magnetic
field as a function of temperature for the as-milled and annealed samples.
Assuming that in general the presence of defects increases the entropy of the alloy
independently of the crystallographic structure (phase), the increase of the vibrational entropy
change ∆Svib is a consequence of the much stronger influence of the induced defects on the
vibrational entropy of the austenite than on the vibration entropy of the martensite (opposite to
the above mentioned higher influence of defects on the magnetism of the martensitic phase).
Although the influence of defects (point defects, dislocations and anti-phase boundaries) in the
vibrational properties of some metals has been analyzed in several theoretical studies [33–35],
to the best of our knowledge this is the first indirect evidence of the effect of defects on the
vibrational entropy change at the martensitic transformation. In any case, further works on the
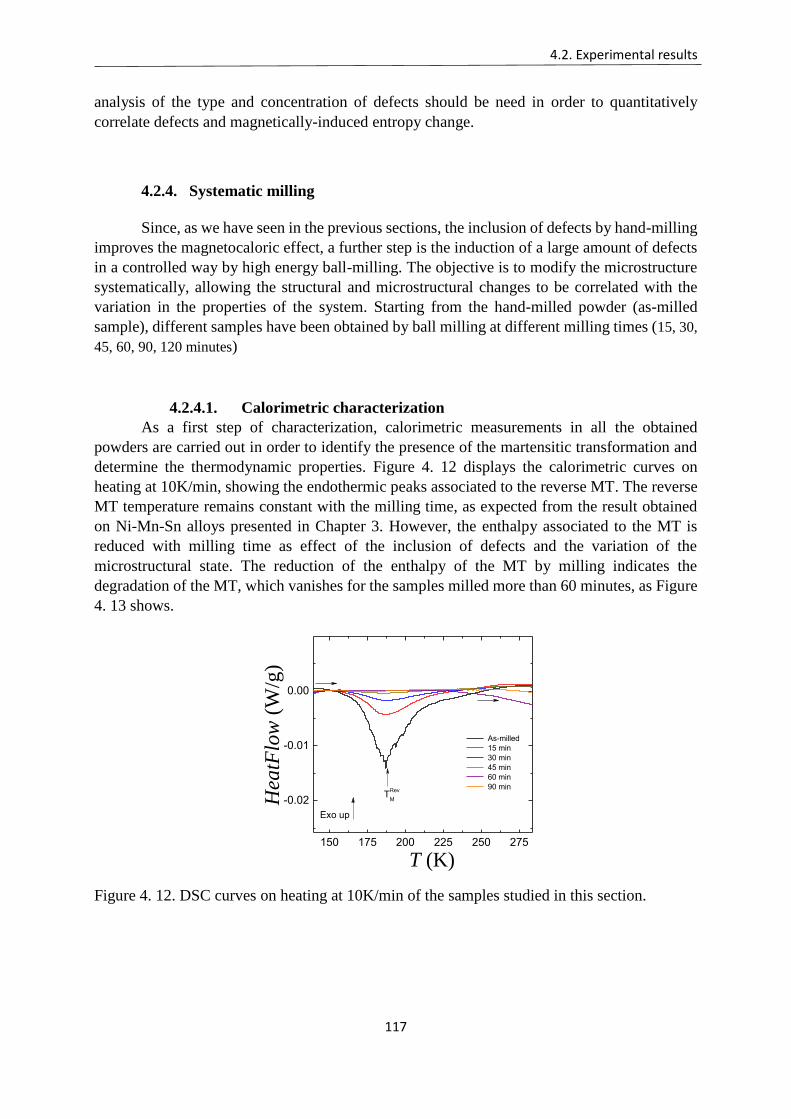
4.2. Experimental results
117
analysis of the type and concentration of defects should be need in order to quantitatively
correlate defects and magnetically-induced entropy change.
4.2.4. Systematic milling
Since, as we have seen in the previous sections, the inclusion of defects by hand-milling
improves the magnetocaloric effect, a further step is the induction of a large amount of defects
in a controlled way by high energy ball-milling. The objective is to modify the microstructure
systematically, allowing the structural and microstructural changes to be correlated with the
variation in the properties of the system. Starting from the hand-milled powder (as-milled
sample), different samples have been obtained by ball milling at different milling times (15, 30,
45, 60, 90, 120 minutes)
4.2.4.1. Calorimetric characterization
As a first step of characterization, calorimetric measurements in all the obtained
powders are carried out in order to identify the presence of the martensitic transformation and
determine the thermodynamic properties. Figure 4. 12 displays the calorimetric curves on
heating at 10K/min, showing the endothermic peaks associated to the reverse MT. The reverse
MT temperature remains constant with the milling time, as expected from the result obtained
on Ni-Mn-Sn alloys presented in Chapter 3. However, the enthalpy associated to the MT is
reduced with milling time as effect of the inclusion of defects and the variation of the
microstructural state. The reduction of the enthalpy of the MT by milling indicates the
degradation of the MT, which vanishes for the samples milled more than 60 minutes, as Figure
4. 13 shows.
150 175 200 225 250 275
-0.02
-0.01
0.00
As-milled
15 min
30 min
45 min
60 min
90 min
Hea
tFlo
w (
W/g
)
T (K)
Exo up
TRev
M
Figure 4. 12. DSC curves on heating at 10K/min of the samples studied in this section.
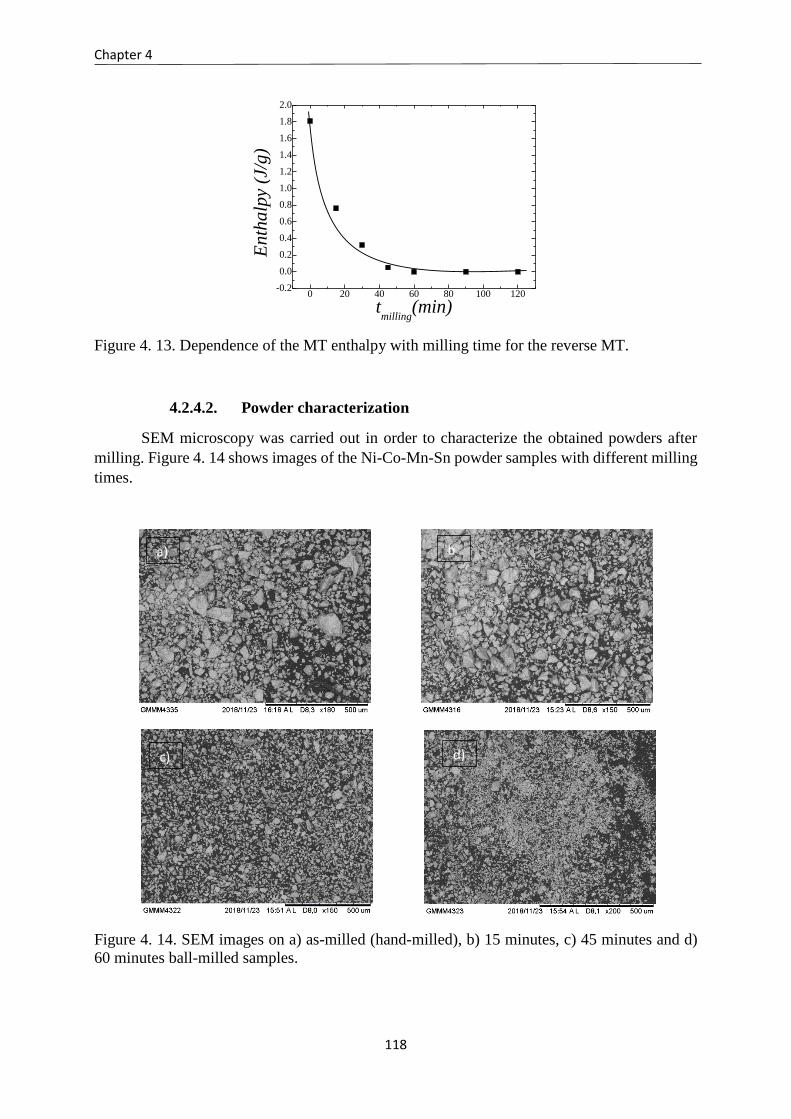
Chapter 4
118
0 20 40 60 80 100 120-0.2
0.0
0.2
0.4
0.6
0.8
1.0
1.2
1.4
1.6
1.8
2.0
En
tha
lpy
(J/g
)
tmilling
(min)
Figure 4. 13. Dependence of the MT enthalpy with milling time for the reverse MT.
4.2.4.2. Powder characterization
SEM microscopy was carried out in order to characterize the obtained powders after
milling. Figure 4. 14 shows images of the Ni-Co-Mn-Sn powder samples with different milling
times.
Figure 4. 14. SEM images on a) as-milled (hand-milled), b) 15 minutes, c) 45 minutes and d)
60 minutes ball-milled samples.
a) b
)
c) d)
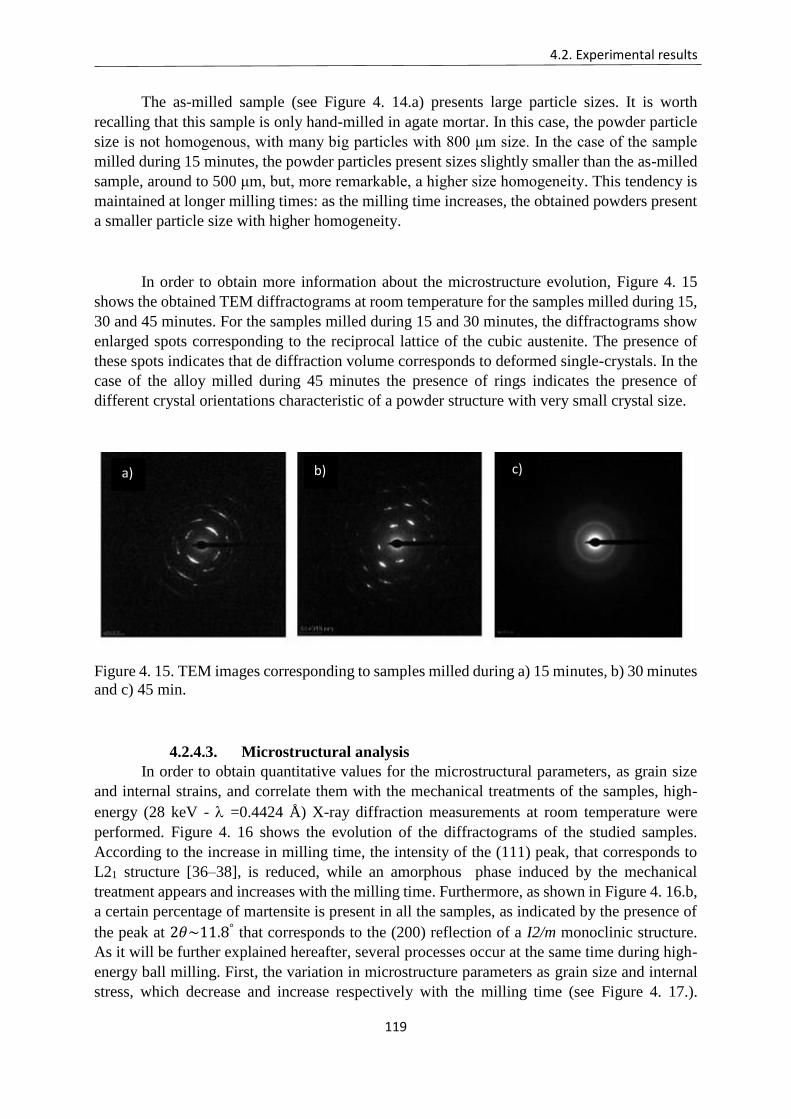
4.2. Experimental results
119
The as-milled sample (see Figure 4. 14.a) presents large particle sizes. It is worth
recalling that this sample is only hand-milled in agate mortar. In this case, the powder particle
size is not homogenous, with many big particles with 800 μm size. In the case of the sample
milled during 15 minutes, the powder particles present sizes slightly smaller than the as-milled
sample, around to 500 μm, but, more remarkable, a higher size homogeneity. This tendency is
maintained at longer milling times: as the milling time increases, the obtained powders present
a smaller particle size with higher homogeneity.
In order to obtain more information about the microstructure evolution, Figure 4. 15
shows the obtained TEM diffractograms at room temperature for the samples milled during 15,
30 and 45 minutes. For the samples milled during 15 and 30 minutes, the diffractograms show
enlarged spots corresponding to the reciprocal lattice of the cubic austenite. The presence of
these spots indicates that de diffraction volume corresponds to deformed single-crystals. In the
case of the alloy milled during 45 minutes the presence of rings indicates the presence of
different crystal orientations characteristic of a powder structure with very small crystal size.
Figure 4. 15. TEM images corresponding to samples milled during a) 15 minutes, b) 30 minutes
and c) 45 min.
4.2.4.3. Microstructural analysis
In order to obtain quantitative values for the microstructural parameters, as grain size
and internal strains, and correlate them with the mechanical treatments of the samples, high-
energy (28 keV - =0.4424 Å) X-ray diffraction measurements at room temperature were
performed. Figure 4. 16 shows the evolution of the diffractograms of the studied samples.
According to the increase in milling time, the intensity of the (111) peak, that corresponds to
L21 structure [36–38], is reduced, while an amorphous phase induced by the mechanical
treatment appears and increases with the milling time. Furthermore, as shown in Figure 4. 16.b,
a certain percentage of martensite is present in all the samples, as indicated by the presence of
the peak at 2𝜃~11.8° that corresponds to the (200) reflection of a I2/m monoclinic structure.
As it will be further explained hereafter, several processes occur at the same time during high-
energy ball milling. First, the variation in microstructure parameters as grain size and internal
stress, which decrease and increase respectively with the milling time (see Figure 4. 17.).
a) b) c)
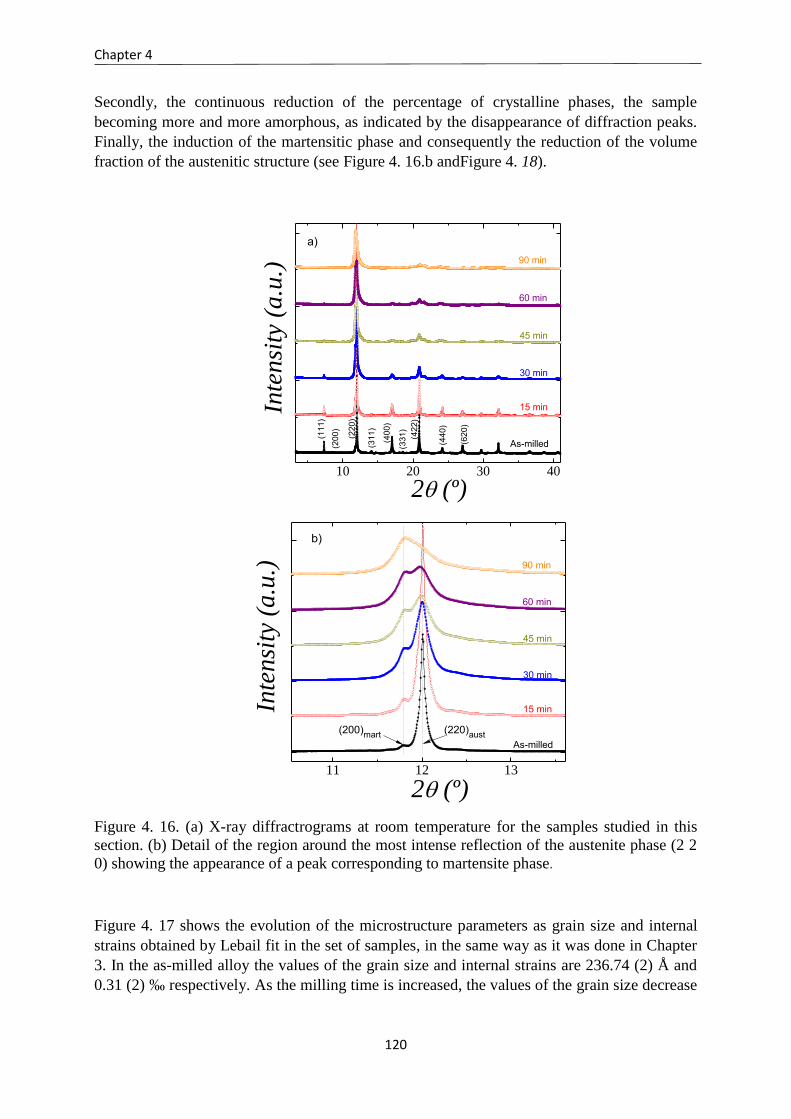
Chapter 4
120
Secondly, the continuous reduction of the percentage of crystalline phases, the sample
becoming more and more amorphous, as indicated by the disappearance of diffraction peaks.
Finally, the induction of the martensitic phase and consequently the reduction of the volume
fraction of the austenitic structure (see Figure 4. 16.b andFigure 4. 18).
10 20 30 40(6
20)
(440)
90 min
60 min
45 min
30 min
15 minInte
nsi
ty (
a.u
.)
2 (º)
As-milled
(422)
(331)
(400)
(311)
(220)
(200)
(111)
a)
11 12 13
(200)mart
90 min
60 min
45 min
30 min
15 minInte
nsi
ty (
a.u
.)
2 (º)
As-milled
(220)aust
b)
Figure 4. 16. (a) X-ray diffractrograms at room temperature for the samples studied in this
section. (b) Detail of the region around the most intense reflection of the austenite phase (2 2
0) showing the appearance of a peak corresponding to martensite phase.
Figure 4. 17 shows the evolution of the microstructure parameters as grain size and internal
strains obtained by Lebail fit in the set of samples, in the same way as it was done in Chapter
3. In the as-milled alloy the values of the grain size and internal strains are 236.74 (2) Å and
0.31 (2) ‰ respectively. As the milling time is increased, the values of the grain size decrease
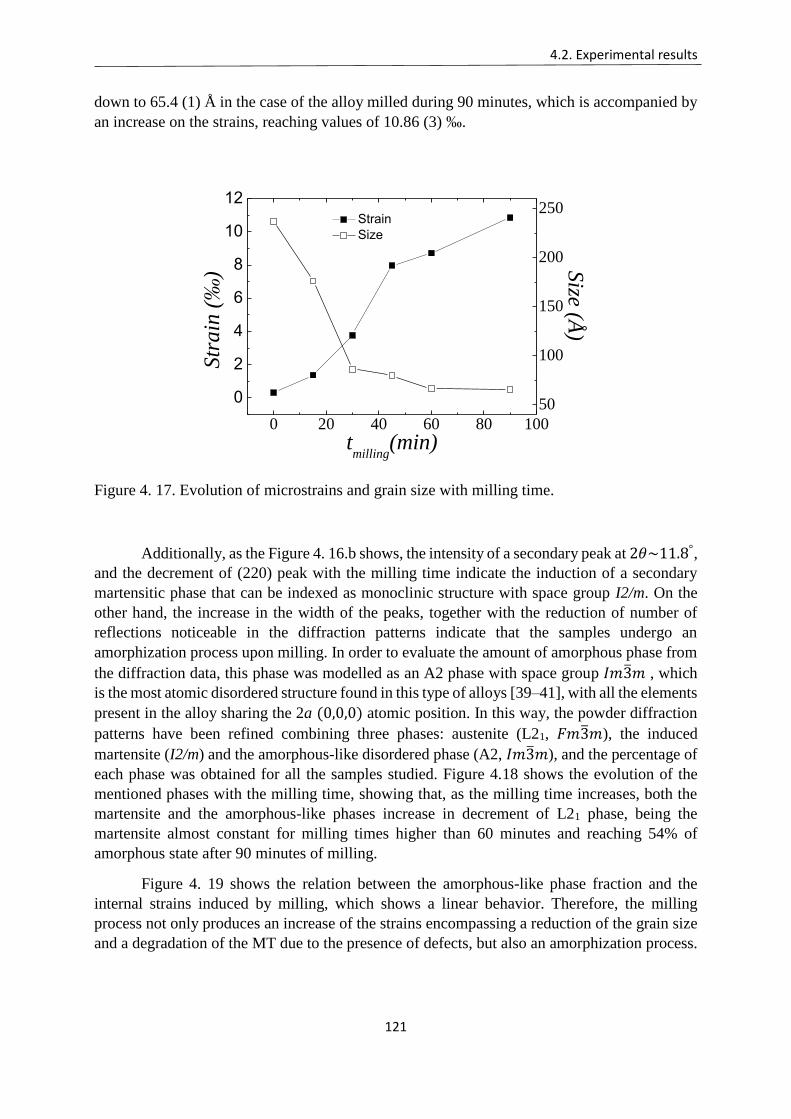
4.2. Experimental results
121
down to 65.4 (1) Å in the case of the alloy milled during 90 minutes, which is accompanied by
an increase on the strains, reaching values of 10.86 (3) ‰.
0 20 40 60 80 100
0
2
4
6
8
10
12
Strain
Size
tmilling
(min)
Str
ain
(‰
)
50
100
150
200
250Size (Å
)
Figure 4. 17. Evolution of microstrains and grain size with milling time.
Additionally, as the Figure 4. 16.b shows, the intensity of a secondary peak at 2𝜃~11.8°,
and the decrement of (220) peak with the milling time indicate the induction of a secondary
martensitic phase that can be indexed as monoclinic structure with space group I2/m. On the
other hand, the increase in the width of the peaks, together with the reduction of number of
reflections noticeable in the diffraction patterns indicate that the samples undergo an
amorphization process upon milling. In order to evaluate the amount of amorphous phase from
the diffraction data, this phase was modelled as an A2 phase with space group 𝐼𝑚3̅𝑚 , which
is the most atomic disordered structure found in this type of alloys [39–41], with all the elements
present in the alloy sharing the 2a (0,0,0) atomic position. In this way, the powder diffraction
patterns have been refined combining three phases: austenite (L21, 𝐹𝑚3̅𝑚), the induced
martensite (I2/m) and the amorphous-like disordered phase (A2, 𝐼𝑚3̅𝑚), and the percentage of
each phase was obtained for all the samples studied. Figure 4.18 shows the evolution of the
mentioned phases with the milling time, showing that, as the milling time increases, both the
martensite and the amorphous-like phases increase in decrement of L21 phase, being the
martensite almost constant for milling times higher than 60 minutes and reaching 54% of
amorphous state after 90 minutes of milling.
Figure 4. 19 shows the relation between the amorphous-like phase fraction and the
internal strains induced by milling, which shows a linear behavior. Therefore, the milling
process not only produces an increase of the strains encompassing a reduction of the grain size
and a degradation of the MT due to the presence of defects, but also an amorphization process.
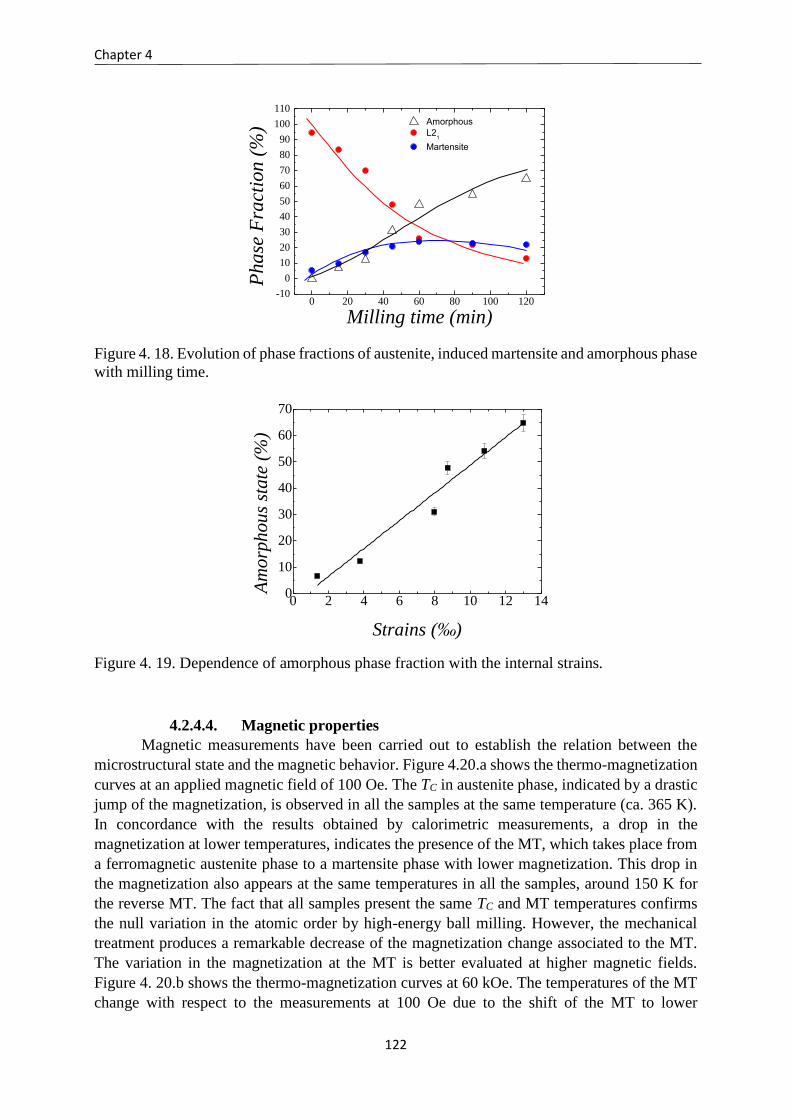
Chapter 4
122
0 20 40 60 80 100 120-10
0
10
20
30
40
50
60
70
80
90
100
110
Amorphous
L21
Martensite
Pha
se F
ract
ion
(%
)
Milling time (min)
Figure 4. 18. Evolution of phase fractions of austenite, induced martensite and amorphous phase
with milling time.
0 2 4 6 8 10 12 140
10
20
30
40
50
60
70
Am
orp
ho
us
sta
te (
%)
Strains (‰)
Figure 4. 19. Dependence of amorphous phase fraction with the internal strains.
4.2.4.4. Magnetic properties
Magnetic measurements have been carried out to establish the relation between the
microstructural state and the magnetic behavior. Figure 4.20.a shows the thermo-magnetization
curves at an applied magnetic field of 100 Oe. The TC in austenite phase, indicated by a drastic
jump of the magnetization, is observed in all the samples at the same temperature (ca. 365 K).
In concordance with the results obtained by calorimetric measurements, a drop in the
magnetization at lower temperatures, indicates the presence of the MT, which takes place from
a ferromagnetic austenite phase to a martensite phase with lower magnetization. This drop in
the magnetization also appears at the same temperatures in all the samples, around 150 K for
the reverse MT. The fact that all samples present the same TC and MT temperatures confirms
the null variation in the atomic order by high-energy ball milling. However, the mechanical
treatment produces a remarkable decrease of the magnetization change associated to the MT.
The variation in the magnetization at the MT is better evaluated at higher magnetic fields.
Figure 4. 20.b shows the thermo-magnetization curves at 60 kOe. The temperatures of the MT
change with respect to the measurements at 100 Oe due to the shift of the MT to lower
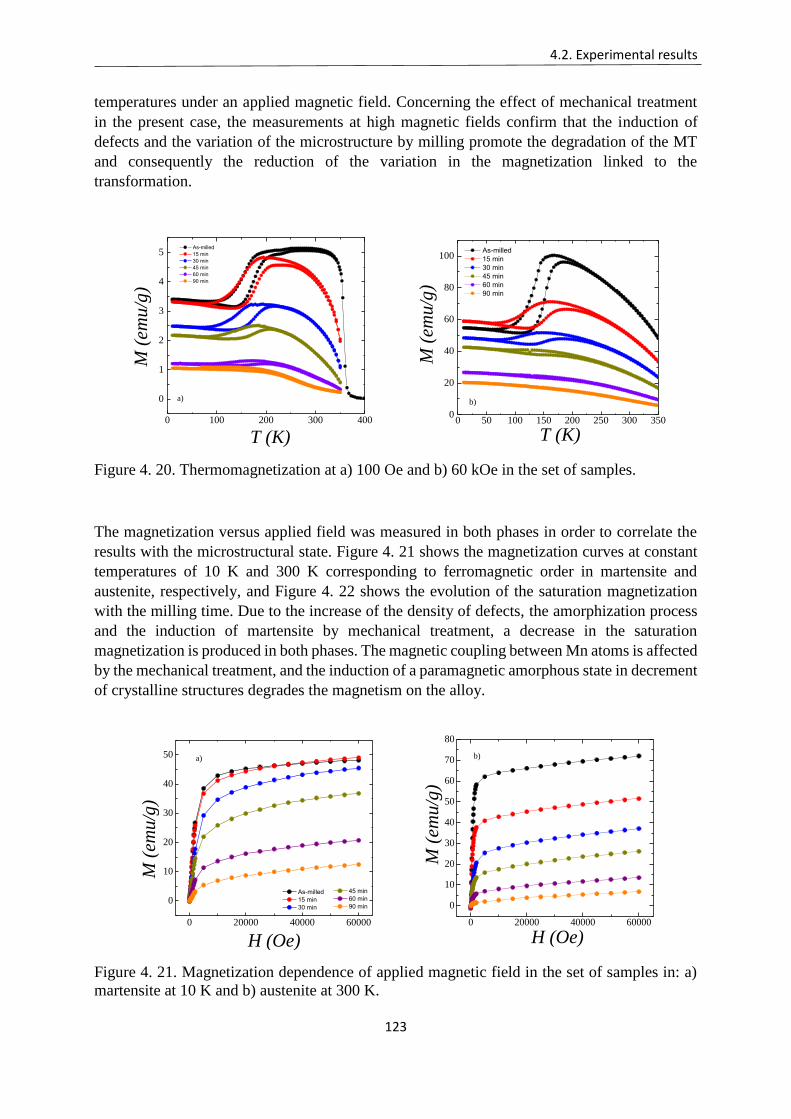
4.2. Experimental results
123
temperatures under an applied magnetic field. Concerning the effect of mechanical treatment
in the present case, the measurements at high magnetic fields confirm that the induction of
defects and the variation of the microstructure by milling promote the degradation of the MT
and consequently the reduction of the variation in the magnetization linked to the
transformation.
0 100 200 300 400
0
1
2
3
4
5
As-milled
15 min
30 min
45 min
60 min
90 min
T (K)
M (
emu
/g)
a)
0 50 100 150 200 250 300 3500
20
40
60
80
100 As-milled
15 min
30 min
45 min
60 min
90 min
M (
emu/g
)T (K)
b)
Figure 4. 20. Thermomagnetization at a) 100 Oe and b) 60 kOe in the set of samples.
The magnetization versus applied field was measured in both phases in order to correlate the
results with the microstructural state. Figure 4. 21 shows the magnetization curves at constant
temperatures of 10 K and 300 K corresponding to ferromagnetic order in martensite and
austenite, respectively, and Figure 4. 22 shows the evolution of the saturation magnetization
with the milling time. Due to the increase of the density of defects, the amorphization process
and the induction of martensite by mechanical treatment, a decrease in the saturation
magnetization is produced in both phases. The magnetic coupling between Mn atoms is affected
by the mechanical treatment, and the induction of a paramagnetic amorphous state in decrement
of crystalline structures degrades the magnetism on the alloy.
0 20000 40000 60000
0
10
20
30
40
50 a)
45 min
60 min
90 min
As-milled
15 min
30 min
M (
emu/g
)
H (Oe)
0 20000 40000 60000
0
10
20
30
40
50
60
70
80
b)
M (
emu
/g)
H (Oe)
Figure 4. 21. Magnetization dependence of applied magnetic field in the set of samples in: a)
martensite at 10 K and b) austenite at 300 K.
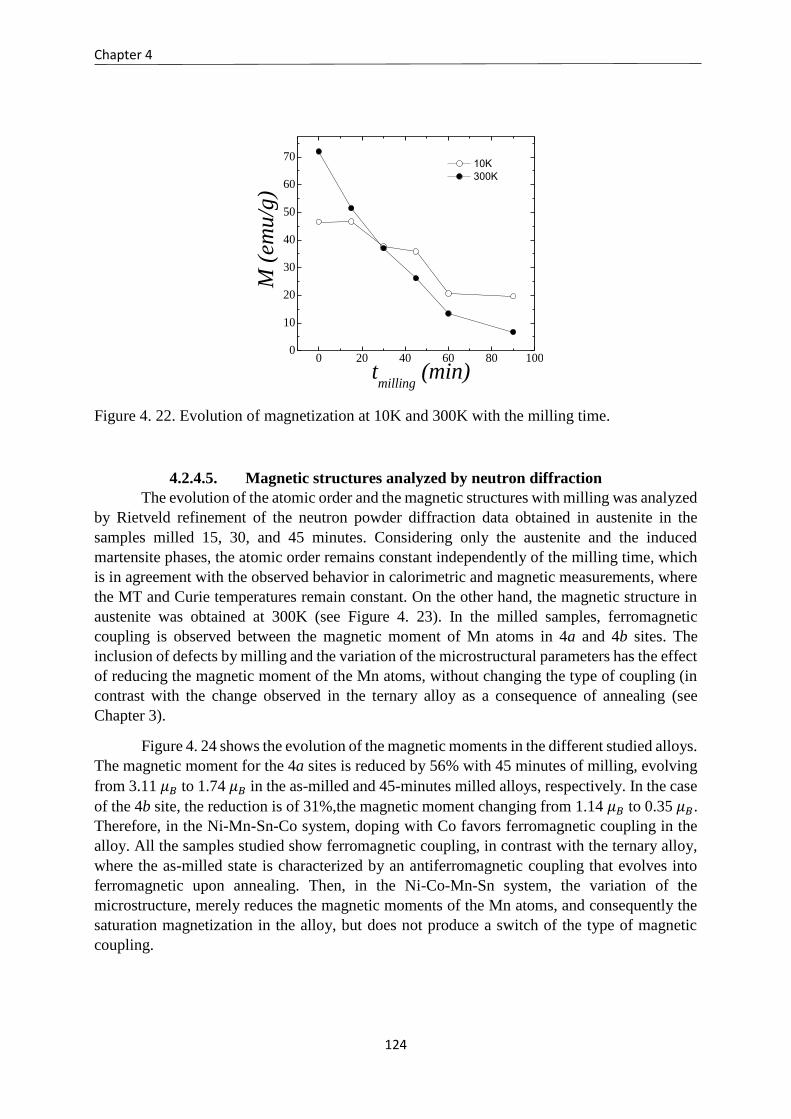
Chapter 4
124
0 20 40 60 80 1000
10
20
30
40
50
60
70 10K
300K
M (
emu
/g)
tmilling
(min)
Figure 4. 22. Evolution of magnetization at 10K and 300K with the milling time.
4.2.4.5. Magnetic structures analyzed by neutron diffraction
The evolution of the atomic order and the magnetic structures with milling was analyzed
by Rietveld refinement of the neutron powder diffraction data obtained in austenite in the
samples milled 15, 30, and 45 minutes. Considering only the austenite and the induced
martensite phases, the atomic order remains constant independently of the milling time, which
is in agreement with the observed behavior in calorimetric and magnetic measurements, where
the MT and Curie temperatures remain constant. On the other hand, the magnetic structure in
austenite was obtained at 300K (see Figure 4. 23). In the milled samples, ferromagnetic
coupling is observed between the magnetic moment of Mn atoms in 4a and 4b sites. The
inclusion of defects by milling and the variation of the microstructural parameters has the effect
of reducing the magnetic moment of the Mn atoms, without changing the type of coupling (in
contrast with the change observed in the ternary alloy as a consequence of annealing (see
Chapter 3).
Figure 4. 24 shows the evolution of the magnetic moments in the different studied alloys.
The magnetic moment for the 4a sites is reduced by 56% with 45 minutes of milling, evolving
from 3.11 𝜇𝐵 to 1.74 𝜇𝐵 in the as-milled and 45-minutes milled alloys, respectively. In the case
of the 4b site, the reduction is of 31%,the magnetic moment changing from 1.14 𝜇𝐵 to 0.35 𝜇𝐵.
Therefore, in the Ni-Mn-Sn-Co system, doping with Co favors ferromagnetic coupling in the
alloy. All the samples studied show ferromagnetic coupling, in contrast with the ternary alloy,
where the as-milled state is characterized by an antiferromagnetic coupling that evolves into
ferromagnetic upon annealing. Then, in the Ni-Co-Mn-Sn system, the variation of the
microstructure, merely reduces the magnetic moments of the Mn atoms, and consequently the
saturation magnetization in the alloy, but does not produce a switch of the type of magnetic
coupling.
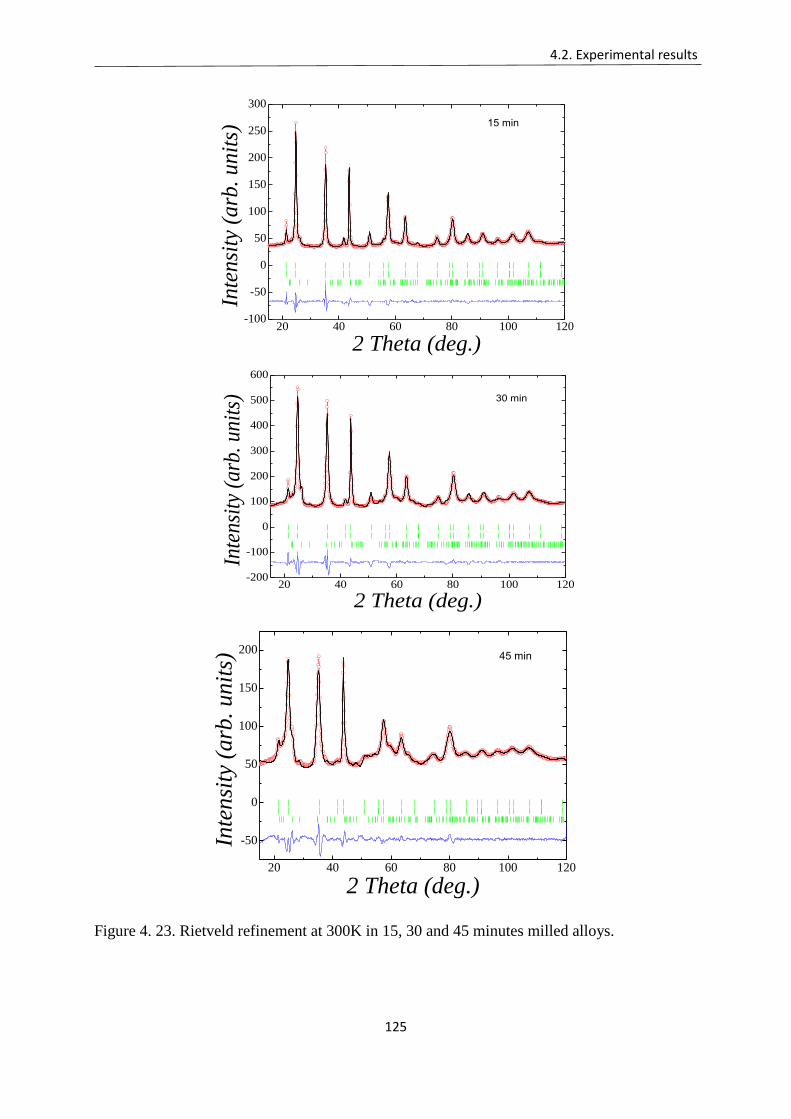
4.2. Experimental results
125
20 40 60 80 100 120-100
-50
0
50
100
150
200
250
300
Inte
nsi
ty (
arb
. u
nit
s)
2 Theta (deg.)
15 min
20 40 60 80 100 120-200
-100
0
100
200
300
400
500
600
Inte
nsi
ty (
arb
. u
nit
s)
2 Theta (deg.)
30 min
20 40 60 80 100 120
-50
0
50
100
150
200
Inte
nsi
ty (
arb
. unit
s)
2 Theta (deg.)
45 min
Figure 4. 23. Rietveld refinement at 300K in 15, 30 and 45 minutes milled alloys.
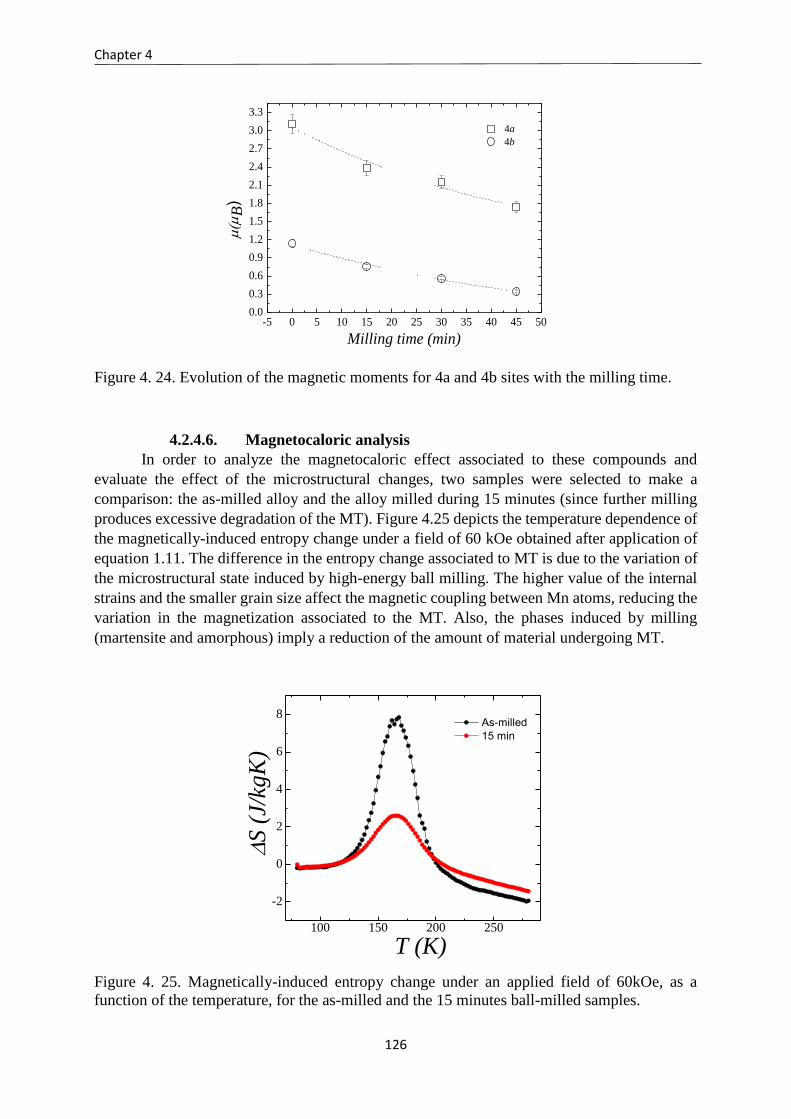
Chapter 4
126
-5 0 5 10 15 20 25 30 35 40 45 500.0
0.3
0.6
0.9
1.2
1.5
1.8
2.1
2.4
2.7
3.0
3.3
4a
4b
B)
Milling time (min)
Figure 4. 24. Evolution of the magnetic moments for 4a and 4b sites with the milling time.
4.2.4.6. Magnetocaloric analysis
In order to analyze the magnetocaloric effect associated to these compounds and
evaluate the effect of the microstructural changes, two samples were selected to make a
comparison: the as-milled alloy and the alloy milled during 15 minutes (since further milling
produces excessive degradation of the MT). Figure 4.25 depicts the temperature dependence of
the magnetically-induced entropy change under a field of 60 kOe obtained after application of
equation 1.11. The difference in the entropy change associated to MT is due to the variation of
the microstructural state induced by high-energy ball milling. The higher value of the internal
strains and the smaller grain size affect the magnetic coupling between Mn atoms, reducing the
variation in the magnetization associated to the MT. Also, the phases induced by milling
(martensite and amorphous) imply a reduction of the amount of material undergoing MT.
100 150 200 250
-2
0
2
4
6
8 As-milled
15 min
S (
J/kg
K)
T (K)
Figure 4. 25. Magnetically-induced entropy change under an applied field of 60kOe, as a
function of the temperature, for the as-milled and the 15 minutes ball-milled samples.
4.3. Summary and conclusions
127
4.3. SUMMARY AND CONCLUSIONS
In this chapter, the influence of mechanically-induced defects on the magnetostructural
properties was analyzed in a non-stoichiometric Ni45Co5Mn35Sn15 alloy. The first part of the
study was centered on the study of the influence of a hand-milling process, a mechanical “soft”
method, and subsequent annealing, while the second part deals with the effect of a more severe
milling process carried out on by ball-milling at increasing milling times. The first study was
performed by combining macroscopic calorimetric and magnetic measurements with powder
neutron diffraction. In the second part, synchrotron radiation diffraction was used for the
microstructural characterization.
The comparative analysis of neutron powder diffractograms carried out on the as-milled
(hand-milled) and annealed samples reveal no changes in the atomic order induced by these
treatments and shows a ferromagnetic coupling of Mn atoms in austenite favored by the
presence of Co in the Ni positions. Both samples present the same modulated monoclinic
crystallographic structure with P2/m space group with antiferromagnetic coupling as
consequence of the shorter distance between Mn-Mn atoms, although this antiferromagnetic
coupling is weaker in the less defective annealed sample. As consequence of the lower
magnetization in martensite and the null variation in the magnetization of the austenitic phase,
the variation of the magnetization associated to the MT is larger in the as-milled alloy. Thus,
the presence of the defects increases the magnetocaloric effect associated to the MT.
After the evidence of the enhancement of the magnetocaloric effect by hand-milling, a
systematic ball-milling was performed in the same alloy. By means of calorimetry and
magnetometry measurements, the martensitic transformation and Curie temperature were
determined, evidencing their null variation with the milling time. The enthalpy values
associated to the MT point out that the MT is affected by mechanical treatments and
significantly reduced with the milling time. Powder X-ray diffraction has been used to obtain
information about the microstructural parameters as grain size and internal strains, showing the
evolution of those values, and the induction with the milling time of secondary phases identified
as a non-modulated monoclinic martensitic structure (I2/m) and an amorphous phase. The
amount of amorphous phase induced by milling was estimated. By combination of the magnetic
measurements and the microstructural analysis by X-ray diffraction, the amount of the non-
magnetic inclusion was quantified an related with the internal strains, showing an increment of
a factor of more than 10 by milling, together with an associated reduction of the saturation
magnetization. The magnetic structure was obtained by neutron diffraction in the samples
milled during 15, 30 and 45 minutes showing the reduction of the magnetic moment when the
milling time increases, while keeping ferromagnetic the coupling of the Mn atoms in 4a and
4b sites.
Magnetocaloric measurements carried out on the as-milled sample and the alloy milled
during 15 minutes have revealed the drastic reduction by ball milling of the entropy change
associated to the martensitic transformation, which is reduced by 33%.
In conclusion, the evolution of the microstructural parameters has been quantified and
correlated to the evolution of the martensitic transformation features and the magnetic
Chapter 4
128
properties. It is found that the inclusion of small amount of defects can improve the
magnetocaloric properties on the alloy due to the variation in the magnetism of the martensite.
On the other hand, high-energy milling creates a big amount of defects that reduce drastically
the saturation magnetization and the variation in the magnetic entropy associated to the
martensitic transformation. Additionally, it was found that milling not only produces variations
in the microstructure, but also entails the induction of martensite, while keeping the atomic
order invariant.
Bibliography
129
Bibliography
[1] Y. Sutou, Y. Imano, N. Koeda, T. Omori, R. Kainuma, K. Ishida and K. Oikawa, “Magnetic
and martensitic transformations of NiMnX(X=In,Sn,Sb) ferromagnetic shape memory
alloys,” Appl. Phys. Lett., vol. 85, no. 19, pp. 4358–4360, Nov. 2004.
[2] T. Krenke, M. Acet, E. F. Wassermann, X. Moya, L. Manosa, and A. Planes, “Martensitic
transitions and the nature of ferromagnetism in the austenitic and martensitic states of Ni-
Mn-Sn alloys,” Phys. Rev. B, vol. 72, no. 1, p. 014412, Jul. 2005.
[3] T. Krenke, M. Acet, E. F. Wassermann, X. Moya, L. Manosa, and A. Planes,
“Ferromagnetism in the austenitic and martensitic states of Ni-Mn-In alloys,” Phys. Rev. B,
vol. 73, no. 17, p. 174413, May 2006.
[4] M. Khan, I. Dubenko, S. Stadler, and N. Ali, “Magnetostructural phase transitions in
Ni50Mn25+xSb25-x Heusler alloys,” J. Phys. Condens. Matter, vol. 20, no. 23, p. 235204, Apr.
2008.
[5] V. Recarte, J. Pérez-Landazábal, V. Sánchez-Alarcos, and J. A. Rodriguez-Velamazán,
“Dependence of the martensitic transformation and magnetic transition on the atomic order
in Ni–Mn–In metamagnetic shape memory alloys,” Acta Mater., vol. 60, pp. 1937–1945,
Mar. 2012.
[6] V. Recarte, J. I. Pérez-Landazábal, and V. Sánchez-Alarcos, “Dependence of the relative
stability between austenite and martensite phases on the atomic order in a Ni–Mn–In
Metamagnetic Shape Memory Alloy,” J. Alloys Compd., vol. 536, pp. S308–S311, Sep.
2012.
[7] V. Sánchez-Alarcos, V. Recarte, J. I. Pérez-Landazábal, E. Cesari, and J. A. Rodríguez-
Velamazán, “Long-Range Atomic Order and Entropy Change at the Martensitic
Transformation in a Ni-Mn-In-Co Metamagnetic Shape Memory Alloy,” Entropy, vol. 16,
no. 5, pp. 2756–2767, May 2014.
[8] V. Sánchez-Alarcos, J. I. Pérez-Landazábal, V. Recarte, I. Lucia, J. Vélez, and J. A.
Rodríguez-Velamazán, “Effect of high-temperature quenching on the magnetostructural
transformations and the long-range atomic order of Ni–Mn–Sn and Ni–Mn–Sb
metamagnetic shape memory alloys,” Acta Mater., vol. 61, no. 12, pp. 4676–4682, Jul.
2013.
[9] A. L. Alves, E. C. Passamani, V. P. Nascimento, A. Y. Takeuchi, and C. Larica, “Influence
of grain refinement and induced crystal defects on the magnetic properties of Ni 50 Mn 36
Sn 14 Heusler alloy,” J. Phys. Appl. Phys., vol. 43, no. 34, p. 345001, 2010.
[10] E. C. Passamani, V.P. Nasimento, C. Larica, A.Y. Takeuchi, A.L. Alves, J.R. Proveri,
M.C. Pereira, and J.D. Favris, “The influence of chemical disorder enhancement on the
Chapter 4
130
martensitic transformation of the Ni50Mn36Sn14 Heusler-type alloy,” J. Alloys Compd., vol.
509, no. 30, pp. 7826–7832, Jul. 2011.
[11] A. Ghotbi Varzaneh, P. Kameli, V. R. Zahedi, F. Karimzadeh, and H. Salamati, “Effect
of heat treatment on martensitic transformation of Ni47Mn40Sn13 ferromagnetic shape
memory alloy prepared by mechanical alloying,” Met. Mater. Int., vol. 21, no. 4, pp. 758–
764, Jul. 2015.
[12] P. Czaja, J. Przewoźnik, M. Fitta, M. Bałanda, A. Chrobak, B. Kania, P. Zackiewicz, A.
Wójcik, M.Szlezynger, and W. Maziarz, “Effect of ball milling and thermal treatment on
exchange bias and magnetocaloric properties of Ni48Mn39.5Sn10.5Al2 ribbons,” J. Magn.
Magn. Mater., vol. 401, pp. 223–230, Mar. 2016.
[13] X. Wang, F. Sun, J. Wang, Q. Yu, Y. Wu, H. Hua, and C. Jiang, “Influence of annealing
temperatures on the magnetostructural transition and magnetocaloric effect of
Ni40Co10Mn40Sn10 powders,” J. Alloys Compd., vol. 691, pp. 215–219, Jan. 2017.
[14] Y. Murakami, T. Yano, R. Y. Umetsu, R. Kainuma, and D. Shindo, “Suppression of
ferromagnetism within antiphase boundaries in Ni50Mn25Al12.5Ga12.5 alloy,” Scr. Mater.,
vol. 65, no. 10, pp. 895–898, Nov. 2011.
[15] R. Kainuma, Y. Imano, W. Ito, Y. Sutou, H. Morito, S. Okamoto, O. Kitakami, K.
Oikawa, A. Fujita, T. Kanomata, and K. Ishida, “Magnetic-field-induced shape recovery
by reverse phase transformation,” Nature, vol. 439, no. 7079, pp. 957–960, Feb. 2006.
[16] R. Kainuma, Y. Imano, W. Ito, H. Morito, Y. Sutou, K. Oikawa, A. Fujita, K. Ishida, S.
Okamoto, O. Kitakami, and T. Kanomata, “Metamagnetic shape memory effect in a
Heusler-type Ni43Co7Mn39Sn11 polycrystalline alloy,” Appl. Phys. Lett., vol. 88, no. 19, p.
192513, May 2006.
[17] A. K. Nayak, K. G. Suresh, and A. K. Nigam, “Giant inverse magnetocaloric effect near
room temperature in Co substituted NiMnSb Heusler alloys,” J. Phys. Appl. Phys., vol. 42,
no. 3, p. 035009, Jan. 2009.
[18] L. Huang, D. Y. Cong, H. L. Suo, and Y. D. Wang, “Giant magnetic refrigeration
capacity near room temperature in Ni40Co10Mn40Sn10 multifunctional alloy,” Appl. Phys.
Lett., vol. 104, no. 13, p. 132407, Mar. 2014.
[19] Umetsu, R. Y, A. Sheikh, B. Ouladdiaf, K. R. A. Ziebeck, T. Kanomata, and R.
Kainuma, “The effect of Co substitution on the magnetic properties of the Heusler alloy
Ni50Mn33Sn17,” Appl. Phys. Lett., vol. 98, no. 4, p. 042507, Jan. 2011.
Bibliography
131
[20] S. Pandey, Z. Quetz, A. Aryal, I. Dubenko, D. Mazumdar, S. Stadler, and N. Ali, “Large
Inverse Magnetocaloric Effects and Giant Magnetoresistance in Ni-Mn-Cr-Sn Heusler
Alloys,” Magnetochemistry, vol. 3, no. 1, p. 3, Mar. 2017.
[21] J. Rodríguez-Carvajal, “Recent advances in magnetic structure determination by
neutron powder diffraction,” Phys. B Condens. Matter, vol. 192, no. 1, pp. 55–69, Oct.
1993.
[22] V. Sánchez-Alarcos, V. Recarte, J. I. Pérez-Landazábal, C. Gómez-Polo, and J. A.
Rodríguez-Velamazán, “Role of magnetism on the martensitic transformation in Ni–Mn-
based magnetic shape memory alloys,” Acta Mater., vol. 60, no. 2, pp. 459–468, Jan. 2012.
[23] S. Chikazumi and C. D. Graham, Physics of Ferromagnetism 2e. OUP Oxford, 2009.
[24] E. Schlömann, “Properties of Magnetic Materials with a Nonuniform Saturation
Magnetization. I. General Theory and Calculation of the Static Magnetization,” J. Appl.
Phys., vol. 38, no. 13, pp. 5027–5034, Dec. 1967.
[25] H. Zhang, D. Zeng, and Z. Liu, “The law of approach to saturation in ferromagnets
originating from the magnetocrystalline anisotropy,” J. Magn. Magn. Mater., vol. 322, no.
16, pp. 2375–2380, Aug. 2010.
[26] G. F. Dionne, J. A. Weiss, and G. A. Allen, “Hysteresis loops modeled from coercivity,
anisotropy, and microstructure parameters,” J. Appl. Phys., vol. 61, pp. 3862–3864, Apr.
1987.
[27] V. Sánchez-Alarcos, J. I. Pérez-Landazábal, and V. Recarte, “Influence of Long-Range
Atomic Order on the Structural and Magnetic Properties of Ni-Mn-Ga Ferromagnetic Shape
Memory Alloys,” Mater. Sci. Forum, vol. 684, pp. 85–103, 2011.
[28] L. Tocado, E. Palacios, and R. Burriel, “Entropy determinations and magnetocaloric
parameters in systems with first-order transitions: Study of MnAs,” J. Appl. Phys., vol. 105,
no. 9, p. 093918, May 2009.
[29] L. Huang, D. Y. Cong, L. Ma, Z. H. Nie, M. G. Wamg. Z. L. Wang, H. L. Suo, Y. Ren,
Y. D. Wang, “Large magnetic entropy change and magnetoresistance in a Ni41Co9Mn40Sn10
magnetic shape memory alloy,” J. Alloys Compd., vol. 647, pp. 1081–1085, Oct. 2015.
[30] T. Krenke, E. Duman, M. Acet, X. Moya, L. Mañosa, and A. Planes, “Inverse
magnetocaloric effect in ferromagnetic Ni–Mn–Sn alloys,” Nat. Mater., vol. 4, no. 6, pp.
450–454, Jun. 2005.
Chapter 4
132
[31] A. Aryal, A. Quetz, S. Pandey, I. Dubenko, S. Stadler, and N. Ali, “Magnetocaloric
effects and transport properties of rare-earth (R= La, Pr, Sm) doped Ni50-xRxMn35Sn15
Heusler alloys,” J. Alloys Compd., vol. 717, pp. 254–259, Sep. 2017.
[32] V. Recarte, J. I. Pérez-Landazábal, S. Kustov, and E. Cesari, “Entropy change linked to
the magnetic field induced martensitic transformation in a Ni–Mn–In–Co shape memory
alloy,” J. Appl. Phys., vol. 107, no. 5, p. 053501, Mar. 2010.
[33] M. Forsblom, N. Sandberg, and G. Grimvall , “Vibrational entropy of dislocations in
Al,” Philos. Mag., vol. 84, no. 6, pp. 521–532, Feb. 2004.
[34] P. C. Schuck, J. Marian, J. B. Adams, and B. Sadigh, “Vibrational properties of straight
dislocations in bcc and fcc metals within the harmonic approximation,” Philos. Mag., vol.
89, no. 31, pp. 2861–2882, Nov. 2009.
[35] V. R. Manga, S. L. Shang,, W. Y. Wang, Y. Wang, J. Liang, V. H. Crespi, Z. K. Liu,
“Anomalous phonon stiffening associated with the (111) antiphase boundary in L12
Ni3Al,” Acta Mater., vol. 82, pp. 287–294, Jan. 2015.
[36] A. Planes, L. Mañosa, E. Vives, J. Rodríguez-Carvajal, M. Morin, G. Guenin, and J.L.
Macqueron, “Neutron diffraction study of long-range atomic order in Cu-Zn-Al shape
memory alloys,” J. Phys. Condens. Matter, vol. 4, no. 2, p. 553, 1992.
[37] V. Sánchez-Alarcos, V. Recarte, J. I. Pérez-Landazábal, and G. J. Cuello, “Correlation
between atomic order and the characteristics of the structural and magnetic transformations
in Ni–Mn–Ga shape memory alloys,” Acta Mater., vol. 55, no. 11, pp. 3883–3889, Jun.
2007.
[38] V. Sánchez-Alarcos, J. I. Pérez-Landazábal, V. Recarte, J. A. Rodríguez-Velamazán,
and V. A. Chernenko, “Effect of atomic order on the martensitic and magnetic
transformations in Ni–Mn–Ga ferromagnetic shape memory alloys,” J. Phys. Condens.
Matter, vol. 22, no. 16, p. 166001, 2010.
[39] R. Kainuma, F. Gejima, Y. Sutou, I. Ohnuma, and K. Ishida, “Ordering, Martensitic and
Ferromagnetic Transformations in Ni–Al–Mn Heusler Shape Memory Alloys,” Mater.
Trans. JIM, vol. 41, no. 8, pp. 943–949, 2000.
[40] T. Omori, K. Ando, M. Okando, X. Xu, Y. Tanaka, I. Ohnuma, R. Kainuma, K. Ishida,
“Superelastic Effect in Polycrystalline Ferrous Alloys,” Science, vol. 333, no. 6038, pp. 68–
71, Jul. 2011.
[41] P. Entel, V. D. Buchelnikov, M. E. Gruner, A. Hucht, V. V. Khovailo, S. K. Nayak, A.
T. Zayak, “Shape Memory Alloys: A Summary of Recent Achievements,” Materials
Science Forum, Vol. 583, pp21-41, May 2008.
133
Chapter 5. Analysis of the
improvement of the magnetic
properties in Ni-Mn-In alloys by
thermal treatment and cobalt doping
5.1. INTRODUCTION
As explained in the general introduction, the so-called metamagnetic shape memory
alloys – Ni2MnX (X=In, Sn, Sb) – present a particularly large variation in the magnetization
(ΔM) associated to the MT, which allows inducing the reverse MT with moderate magnetic
fields [1–3]. Their applicability in areas like magnetic refrigeration – based on magnetocaloric
effect [4–6] – or in sensing – based on giant magnetoresistance [7, 8] – is therefore significantly
improved. It appears straightforward that the control of the magneto-structural properties and
the comprehensive understanding of the physics of the system is crucial to develop these
materials. In this chapter, we focus in the magnetic coupling between magnetic atoms in the
different crystallographic sites in the austenite phase, and how this coupling can be modified to
produce improved magnetic properties.
As a reminder, in magnetic SMAs the magnetic moments are mainly confined to the Mn
atoms, which are not nearest neighbors, the indirect exchange interactions being strongly
dependent on the interatomic distances [9, 10]. In ordered stoichiometric Ni50Mn25X25 all the
Mn atoms locate in the 4a sites of the austenite, with the moments aligned parallel. In off-
stoichiometry compositions and/or disordered structures, the ferromagnetic coupling is in
principle reduced by the presence of Mn moments at 4b sites that tend to couple
antiferromagnetically. As regards the martensitic phase, the change of the interatomic distances
occurring in the MT gives rise to a magnetic phase showing different behaviors ranging from
weak ferromagnetism to antiferromagnetism or superparamagnetism and spin-glass-like
behavior [11–14].
Composition and atomic order are therefore key parameters that govern the
magnetostructural properties of these systems. In particular, Co doping in Ni-Mn-In and Ni-
Mn-Sn metamagnetic SMAs has been shown to increase both the Curie temperature (TC) and
the spontaneous magnetization of the austenite by the enhancement of the ferromagnetic
coupling [11, 15] while hindering the ferromagnetic ordering in martensite, thus leading to an
increase of the change ΔM at the MT and consequently improving the magnetic properties
relevant for applications [1, 13, 16, 17]. On the other hand, the Curie and MT temperatures, as
well as the spontaneous magnetization, are particularly sensitive to the long-range atomic order,
Chapter 5
134
[18–21] thermal treatments being one of the most direct ways to tune such a parameter. We
have selected the Ni50Mn34In16 and Ni45Co5Mn37In13 alloys in two different states induced by
thermal treatments (water quenching, WQ, and slow cooling, SC) to study in detail the effect
of cobalt doping and atomic order in the magnetic properties of these metamagnetic SMAs in
terms of the magnetic coupling between the different magnetic moments. These alloys have
been chosen by balancing compositional similarity, transforming character (occurrence of MT),
and available temperature range in both paramagnetic and ferromagnetic austenitic phases.
Besides, both specific compositions have been extensively studied in the literature. Following
the characterization of the macroscopic magnetic behavior by magnetometry measurements, we
have employed neutron powder diffraction and single-crystal polarized neutron diffraction to
study in detail the atomic order and magnetic structures in the austenitic phases of the alloys.
Atomically-ordered and, particularly, cobalt-doped samples show an increase of the
ferromagnetic coupling between the magnetic moments located in 4a and 4b sites, which
explains the increase of the magnetization. We have delved into this point by means of polarized
neutron diffraction on a single-crystal of atomically-ordered Ni45Co5Mn37In13 alloy, a technique
that allows studying in detail the coupling between magnetic moments [22] and obtaining spin
density maps that reveal the magnetic interaction pathways responsible for this coupling
scheme.
5.2. EXPERIMENTAL RESULTS
The Ni50Mn36In14 and Ni45Co5Mn37In13 alloys were synthetized from high purity
elements by arc-melting under protective argon atmosphere. The obtained bulks were remelted
several times and homogenized at 1173K during 24h and quenched in ice water or slow cooled
in order to induce different atomic order degrees. A single crystal of slow-cooled Ni45-
Co5Mn37In13 alloy, grown by the Bridgman method and cut into a small cube of 3x3x3mm was
used for the single-crystal neutron diffraction experiments. The macroscopic magnetic
characterization of the alloys was performed by recording thermomagnetization curves at
100Oe and the magnetization dependence with the magnetic field at constant temperature. All
the neutron scattering experiments were carried out at Institut Laue-Langevin, in Grenoble,
France. Nuclear and magnetic structures were analyzed by powder neutron diffraction, using
data collected in D1A (λ=1.9Å), D1B (λ=1.28Å and 2.52Å) and D2B (λ=1.59Å) instruments
(D2B data were used in the final refinements). Additionally, single-crystal neutron diffraction
data were taken in D9 (λ=0.8Å and 0.5Å) instrument for the quaternary SC alloy and combined
with powder diffraction data to improve the reliability of the atomic order analysis results. The
polarized neutron single-crystal diffraction experiment was carried out in D3 (λ=0.8Å)
instrument with an applied magnetic field of 8T along the c-axis. As for all the diffraction work
in this thesis, the data treatment was carried out using the programs of the Fullprof Suite [23].
The maximum entropy method [24], as implemented in Dysnomia program [25], was used to
obtain spin density maps from the polarized neutron diffraction data.
5.2.1. Macroscopic magnetic characterization
Figure 5. 1 and Figure 5. 2 show the magnetic measurements. The temperatures
associated to the MT and magnetic ordering have been determined from the temperature
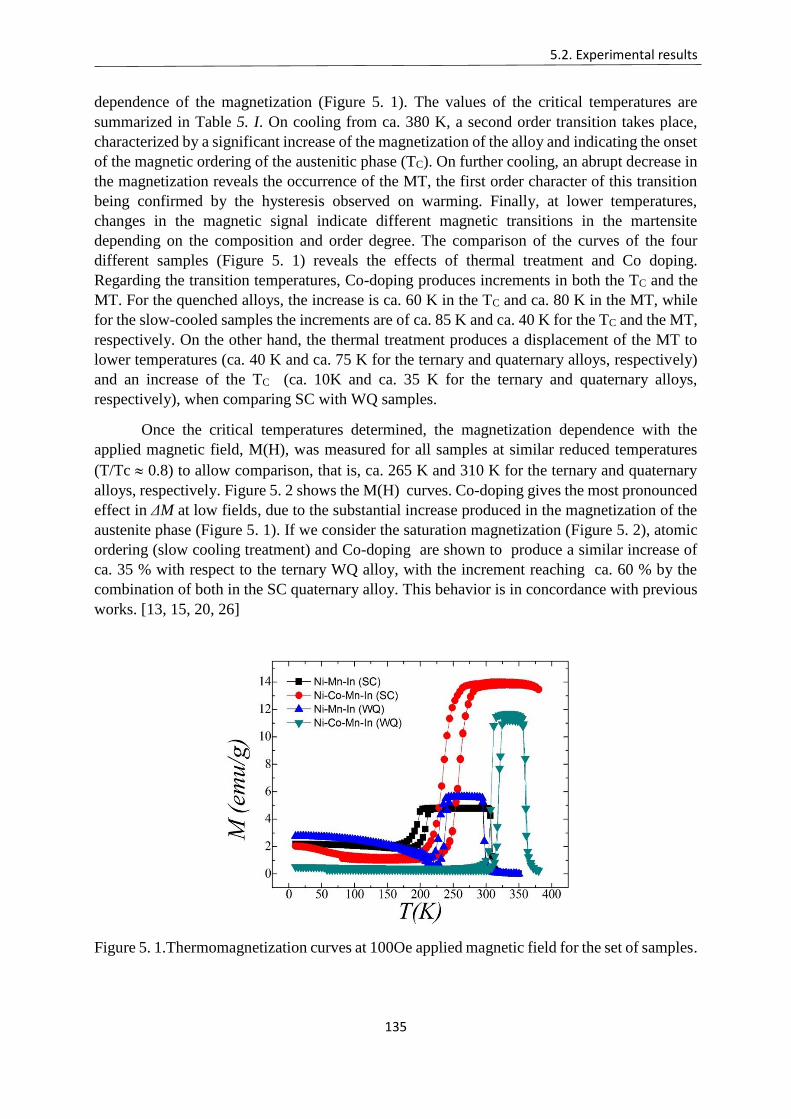
5.2. Experimental results
135
dependence of the magnetization (Figure 5. 1). The values of the critical temperatures are
summarized in Table 5. I. On cooling from ca. 380 K, a second order transition takes place,
characterized by a significant increase of the magnetization of the alloy and indicating the onset
of the magnetic ordering of the austenitic phase (TC). On further cooling, an abrupt decrease in
the magnetization reveals the occurrence of the MT, the first order character of this transition
being confirmed by the hysteresis observed on warming. Finally, at lower temperatures,
changes in the magnetic signal indicate different magnetic transitions in the martensite
depending on the composition and order degree. The comparison of the curves of the four
different samples (Figure 5. 1) reveals the effects of thermal treatment and Co doping.
Regarding the transition temperatures, Co-doping produces increments in both the TC and the
MT. For the quenched alloys, the increase is ca. 60 K in the TC and ca. 80 K in the MT, while
for the slow-cooled samples the increments are of ca. 85 K and ca. 40 K for the TC and the MT,
respectively. On the other hand, the thermal treatment produces a displacement of the MT to
lower temperatures (ca. 40 K and ca. 75 K for the ternary and quaternary alloys, respectively)
and an increase of the TC (ca. 10K and ca. 35 K for the ternary and quaternary alloys,
respectively), when comparing SC with WQ samples.
Once the critical temperatures determined, the magnetization dependence with the
applied magnetic field, M(H), was measured for all samples at similar reduced temperatures
(T/Tc 0.8) to allow comparison, that is, ca. 265 K and 310 K for the ternary and quaternary
alloys, respectively. Figure 5. 2 shows the M(H) curves. Co-doping gives the most pronounced
effect in ΔM at low fields, due to the substantial increase produced in the magnetization of the
austenite phase (Figure 5. 1). If we consider the saturation magnetization (Figure 5. 2), atomic
ordering (slow cooling treatment) and Co-doping are shown to produce a similar increase of
ca. 35 % with respect to the ternary WQ alloy, with the increment reaching ca. 60 % by the
combination of both in the SC quaternary alloy. This behavior is in concordance with previous
works. [13, 15, 20, 26]
Figure 5. 1.Thermomagnetization curves at 100Oe applied magnetic field for the set of samples.
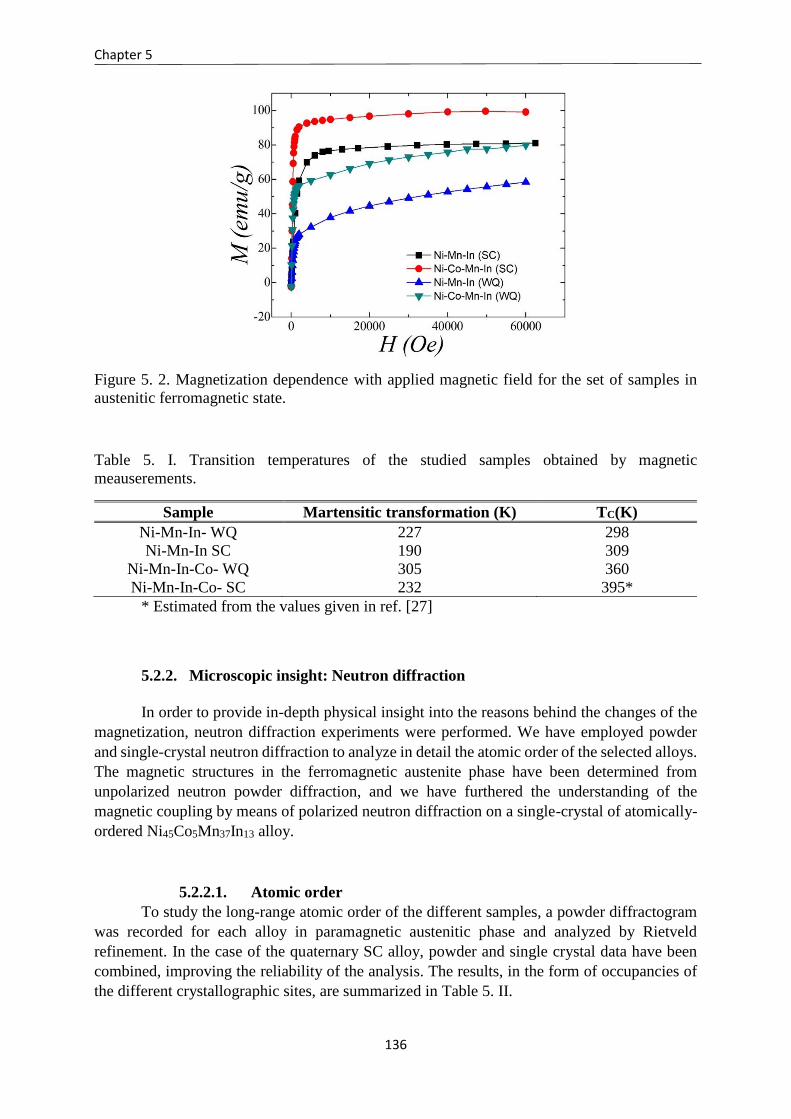
Chapter 5
136
Figure 5. 2. Magnetization dependence with applied magnetic field for the set of samples in
austenitic ferromagnetic state.
Table 5. I. Transition temperatures of the studied samples obtained by magnetic
meauserements.
Sample Martensitic transformation (K) TC(K)
Ni-Mn-In- WQ 227 298
Ni-Mn-In SC 190 309
Ni-Mn-In-Co- WQ 305 360
Ni-Mn-In-Co- SC 232 395*
* Estimated from the values given in ref. [27]
5.2.2. Microscopic insight: Neutron diffraction
In order to provide in-depth physical insight into the reasons behind the changes of the
magnetization, neutron diffraction experiments were performed. We have employed powder
and single-crystal neutron diffraction to analyze in detail the atomic order of the selected alloys.
The magnetic structures in the ferromagnetic austenite phase have been determined from
unpolarized neutron powder diffraction, and we have furthered the understanding of the
magnetic coupling by means of polarized neutron diffraction on a single-crystal of atomically-
ordered Ni45Co5Mn37In13 alloy.
5.2.2.1. Atomic order
To study the long-range atomic order of the different samples, a powder diffractogram
was recorded for each alloy in paramagnetic austenitic phase and analyzed by Rietveld
refinement. In the case of the quaternary SC alloy, powder and single crystal data have been
combined, improving the reliability of the analysis. The results, in the form of occupancies of
the different crystallographic sites, are summarized in Table 5. II.
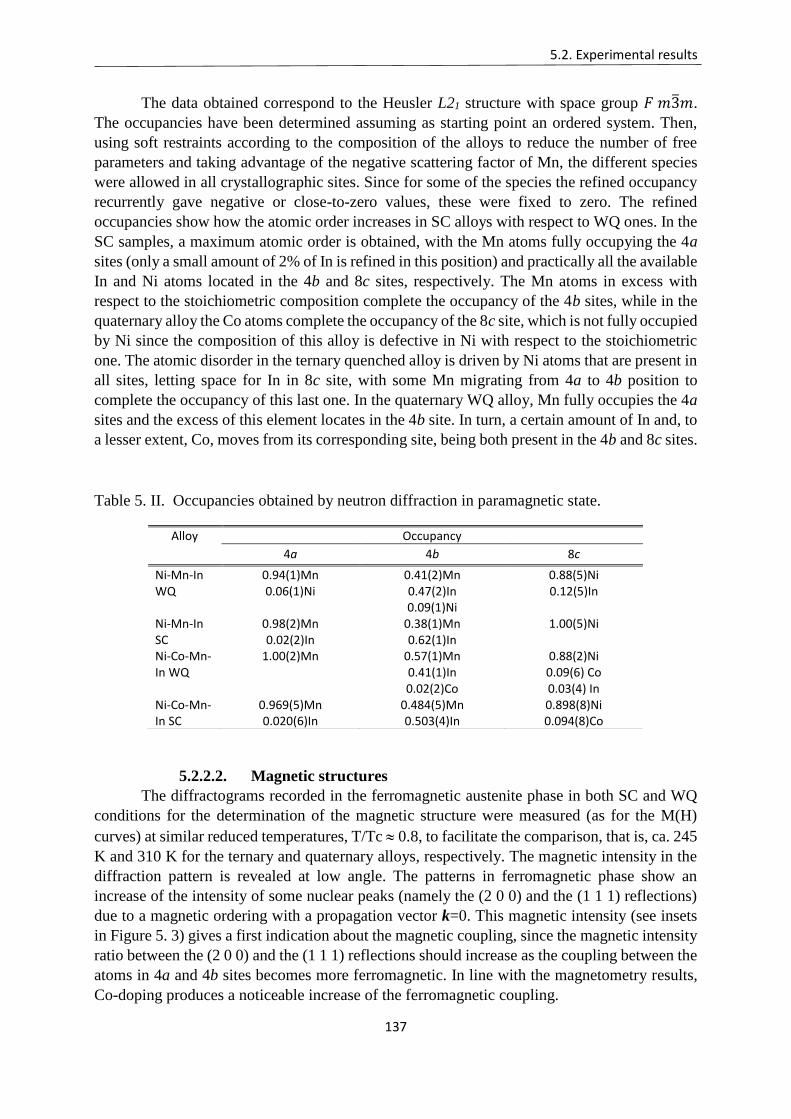
5.2. Experimental results
137
The data obtained correspond to the Heusler L21 structure with space group 𝐹 𝑚3̅𝑚.
The occupancies have been determined assuming as starting point an ordered system. Then,
using soft restraints according to the composition of the alloys to reduce the number of free
parameters and taking advantage of the negative scattering factor of Mn, the different species
were allowed in all crystallographic sites. Since for some of the species the refined occupancy
recurrently gave negative or close-to-zero values, these were fixed to zero. The refined
occupancies show how the atomic order increases in SC alloys with respect to WQ ones. In the
SC samples, a maximum atomic order is obtained, with the Mn atoms fully occupying the 4a
sites (only a small amount of 2% of In is refined in this position) and practically all the available
In and Ni atoms located in the 4b and 8c sites, respectively. The Mn atoms in excess with
respect to the stoichiometric composition complete the occupancy of the 4b sites, while in the
quaternary alloy the Co atoms complete the occupancy of the 8c site, which is not fully occupied
by Ni since the composition of this alloy is defective in Ni with respect to the stoichiometric
one. The atomic disorder in the ternary quenched alloy is driven by Ni atoms that are present in
all sites, letting space for In in 8c site, with some Mn migrating from 4a to 4b position to
complete the occupancy of this last one. In the quaternary WQ alloy, Mn fully occupies the 4a
sites and the excess of this element locates in the 4b site. In turn, a certain amount of In and, to
a lesser extent, Co, moves from its corresponding site, being both present in the 4b and 8c sites.
Table 5. II. Occupancies obtained by neutron diffraction in paramagnetic state.
5.2.2.2. Magnetic structures
The diffractograms recorded in the ferromagnetic austenite phase in both SC and WQ
conditions for the determination of the magnetic structure were measured (as for the M(H)
curves) at similar reduced temperatures, T/Tc 0.8, to facilitate the comparison, that is, ca. 245
K and 310 K for the ternary and quaternary alloys, respectively. The magnetic intensity in the
diffraction pattern is revealed at low angle. The patterns in ferromagnetic phase show an
increase of the intensity of some nuclear peaks (namely the (2 0 0) and the (1 1 1) reflections)
due to a magnetic ordering with a propagation vector k=0. This magnetic intensity (see insets
in Figure 5. 3) gives a first indication about the magnetic coupling, since the magnetic intensity
ratio between the (2 0 0) and the (1 1 1) reflections should increase as the coupling between the
atoms in 4a and 4b sites becomes more ferromagnetic. In line with the magnetometry results,
Co-doping produces a noticeable increase of the ferromagnetic coupling.
Alloy Occupancy
4a 4b 8c
Ni-Mn-In WQ
0.94(1)Mn 0.06(1)Ni
0.41(2)Mn 0.47(2)In 0.09(1)Ni
0.88(5)Ni 0.12(5)In
Ni-Mn-In SC
0.98(2)Mn 0.02(2)In
0.38(1)Mn 0.62(1)In
1.00(5)Ni
Ni-Co-Mn-In WQ
1.00(2)Mn 0.57(1)Mn 0.41(1)In 0.02(2)Co
0.88(2)Ni 0.09(6) Co 0.03(4) In
Ni-Co-Mn-In SC
0.969(5)Mn 0.020(6)In
0.484(5)Mn 0.503(4)In
0.898(8)Ni 0.094(8)Co
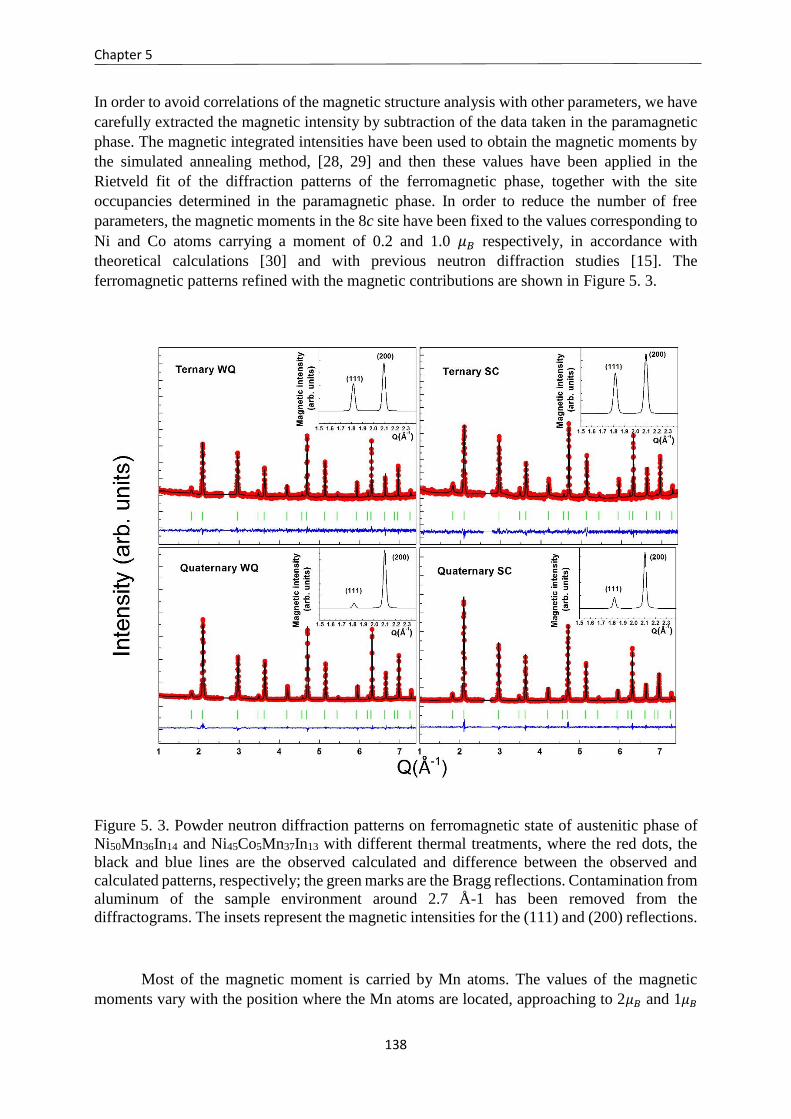
Chapter 5
138
In order to avoid correlations of the magnetic structure analysis with other parameters, we have
carefully extracted the magnetic intensity by subtraction of the data taken in the paramagnetic
phase. The magnetic integrated intensities have been used to obtain the magnetic moments by
the simulated annealing method, [28, 29] and then these values have been applied in the
Rietveld fit of the diffraction patterns of the ferromagnetic phase, together with the site
occupancies determined in the paramagnetic phase. In order to reduce the number of free
parameters, the magnetic moments in the 8c site have been fixed to the values corresponding to
Ni and Co atoms carrying a moment of 0.2 and 1.0 𝜇𝐵 respectively, in accordance with
theoretical calculations [30] and with previous neutron diffraction studies [15]. The
ferromagnetic patterns refined with the magnetic contributions are shown in Figure 5. 3.
Figure 5. 3. Powder neutron diffraction patterns on ferromagnetic state of austenitic phase of
Ni50Mn36In14 and Ni45Co5Mn37In13 with different thermal treatments, where the red dots, the
black and blue lines are the observed calculated and difference between the observed and
calculated patterns, respectively; the green marks are the Bragg reflections. Contamination from
aluminum of the sample environment around 2.7 Å-1 has been removed from the
diffractograms. The insets represent the magnetic intensities for the (111) and (200) reflections.
Most of the magnetic moment is carried by Mn atoms. The values of the magnetic
moments vary with the position where the Mn atoms are located, approaching to 2𝜇𝐵 and 1𝜇𝐵
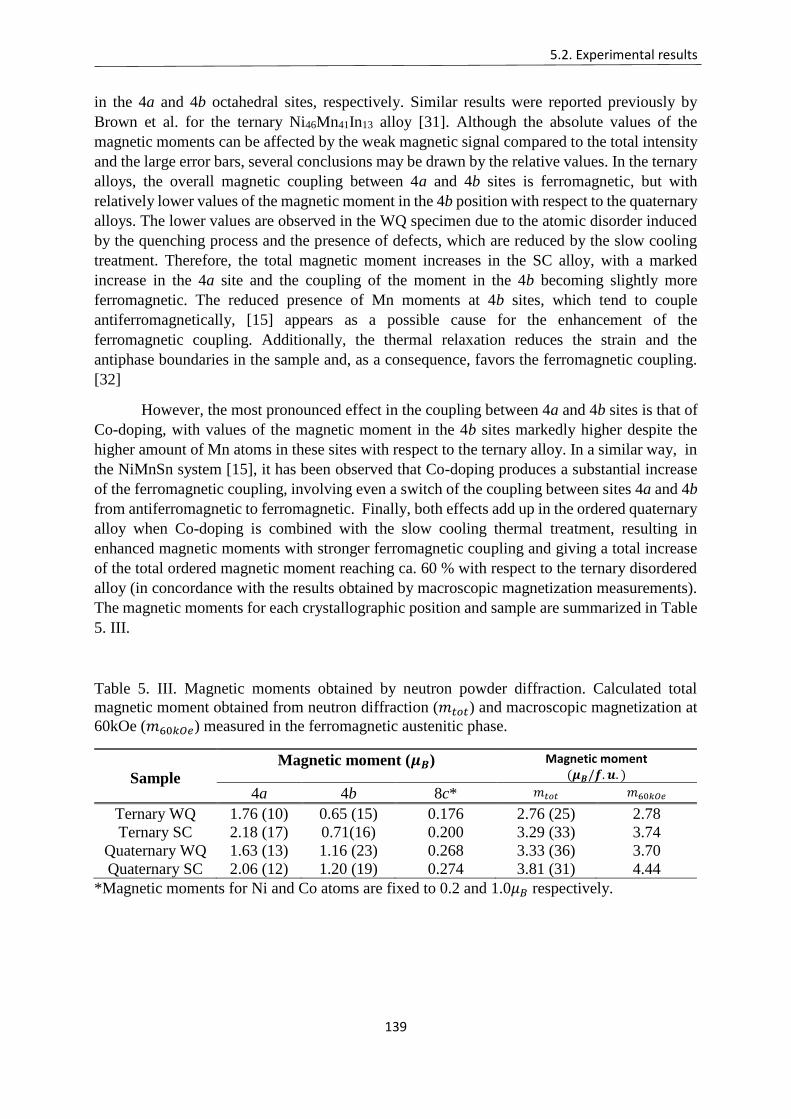
5.2. Experimental results
139
in the 4a and 4b octahedral sites, respectively. Similar results were reported previously by
Brown et al. for the ternary Ni46Mn41In13 alloy [31]. Although the absolute values of the
magnetic moments can be affected by the weak magnetic signal compared to the total intensity
and the large error bars, several conclusions may be drawn by the relative values. In the ternary
alloys, the overall magnetic coupling between 4a and 4b sites is ferromagnetic, but with
relatively lower values of the magnetic moment in the 4b position with respect to the quaternary
alloys. The lower values are observed in the WQ specimen due to the atomic disorder induced
by the quenching process and the presence of defects, which are reduced by the slow cooling
treatment. Therefore, the total magnetic moment increases in the SC alloy, with a marked
increase in the 4a site and the coupling of the moment in the 4b becoming slightly more
ferromagnetic. The reduced presence of Mn moments at 4b sites, which tend to couple
antiferromagnetically, [15] appears as a possible cause for the enhancement of the
ferromagnetic coupling. Additionally, the thermal relaxation reduces the strain and the
antiphase boundaries in the sample and, as a consequence, favors the ferromagnetic coupling.
[32]
However, the most pronounced effect in the coupling between 4a and 4b sites is that of
Co-doping, with values of the magnetic moment in the 4b sites markedly higher despite the
higher amount of Mn atoms in these sites with respect to the ternary alloy. In a similar way, in
the NiMnSn system [15], it has been observed that Co-doping produces a substantial increase
of the ferromagnetic coupling, involving even a switch of the coupling between sites 4a and 4b
from antiferromagnetic to ferromagnetic. Finally, both effects add up in the ordered quaternary
alloy when Co-doping is combined with the slow cooling thermal treatment, resulting in
enhanced magnetic moments with stronger ferromagnetic coupling and giving a total increase
of the total ordered magnetic moment reaching ca. 60 % with respect to the ternary disordered
alloy (in concordance with the results obtained by macroscopic magnetization measurements).
The magnetic moments for each crystallographic position and sample are summarized in Table
5. III.
Table 5. III. Magnetic moments obtained by neutron powder diffraction. Calculated total
magnetic moment obtained from neutron diffraction (𝑚𝑡𝑜𝑡) and macroscopic magnetization at
60kOe (𝑚60𝑘𝑂𝑒) measured in the ferromagnetic austenitic phase.
Sample
Magnetic moment (𝝁𝑩) Magnetic moment (𝝁𝑩/𝒇. 𝒖. )
4a 4b 8c* 𝑚𝑡𝑜𝑡 𝑚60𝑘𝑂𝑒
Ternary WQ 1.76 (10) 0.65 (15) 0.176 2.76 (25) 2.78
Ternary SC 2.18 (17) 0.71(16) 0.200 3.29 (33) 3.74
Quaternary WQ 1.63 (13) 1.16 (23) 0.268 3.33 (36) 3.70
Quaternary SC 2.06 (12) 1.20 (19) 0.274 3.81 (31) 4.44
*Magnetic moments for Ni and Co atoms are fixed to 0.2 and 1.0𝜇𝐵 respectively.
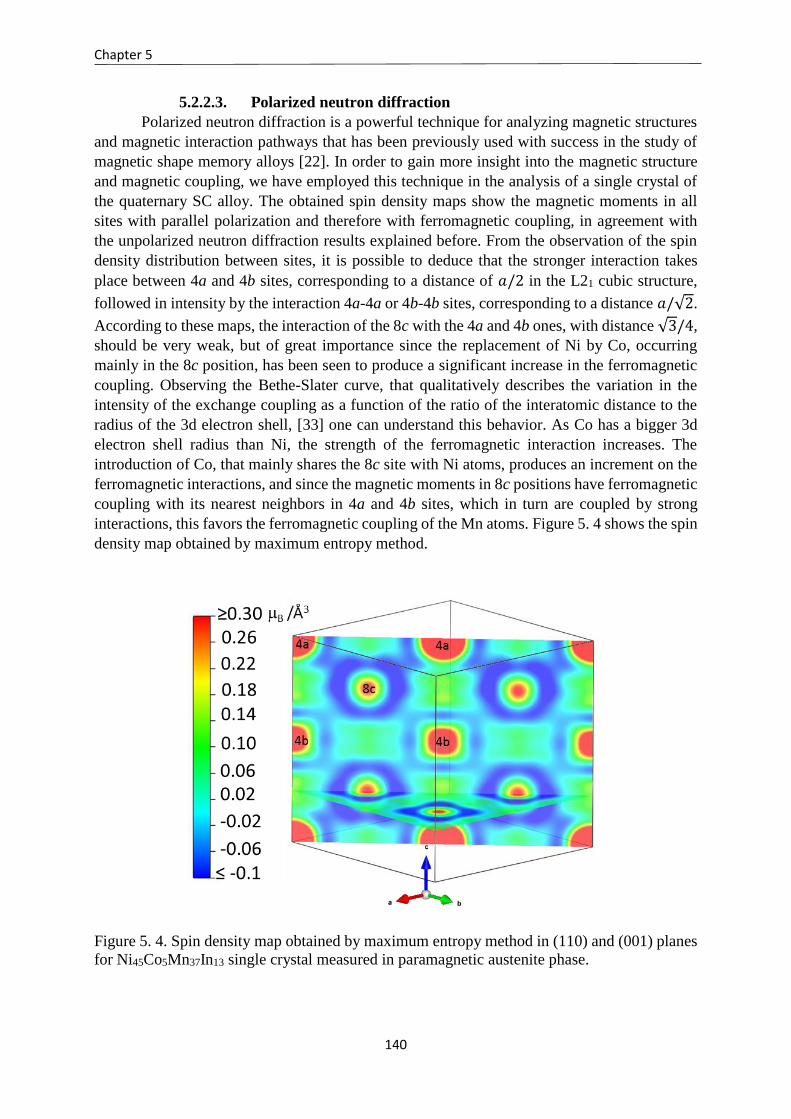
Chapter 5
140
5.2.2.3. Polarized neutron diffraction
Polarized neutron diffraction is a powerful technique for analyzing magnetic structures
and magnetic interaction pathways that has been previously used with success in the study of
magnetic shape memory alloys [22]. In order to gain more insight into the magnetic structure
and magnetic coupling, we have employed this technique in the analysis of a single crystal of
the quaternary SC alloy. The obtained spin density maps show the magnetic moments in all
sites with parallel polarization and therefore with ferromagnetic coupling, in agreement with
the unpolarized neutron diffraction results explained before. From the observation of the spin
density distribution between sites, it is possible to deduce that the stronger interaction takes
place between 4a and 4b sites, corresponding to a distance of 𝑎/2 in the L21 cubic structure,
followed in intensity by the interaction 4a-4a or 4b-4b sites, corresponding to a distance 𝑎/√2.
According to these maps, the interaction of the 8c with the 4a and 4b ones, with distance √3/4,
should be very weak, but of great importance since the replacement of Ni by Co, occurring
mainly in the 8c position, has been seen to produce a significant increase in the ferromagnetic
coupling. Observing the Bethe-Slater curve, that qualitatively describes the variation in the
intensity of the exchange coupling as a function of the ratio of the interatomic distance to the
radius of the 3d electron shell, [33] one can understand this behavior. As Co has a bigger 3d
electron shell radius than Ni, the strength of the ferromagnetic interaction increases. The
introduction of Co, that mainly shares the 8c site with Ni atoms, produces an increment on the
ferromagnetic interactions, and since the magnetic moments in 8c positions have ferromagnetic
coupling with its nearest neighbors in 4a and 4b sites, which in turn are coupled by strong
interactions, this favors the ferromagnetic coupling of the Mn atoms. Figure 5. 4 shows the spin
density map obtained by maximum entropy method.
Figure 5. 4. Spin density map obtained by maximum entropy method in (110) and (001) planes
for Ni45Co5Mn37In13 single crystal measured in paramagnetic austenite phase.
5.2. Experimental results
141
5.3. SUMMARY AND CONCLUSIONS
In this chapter, the macroscopic magnetic properties, together with the atomic order and
magnetic structure in austenitic phase were analyzed in non-stoichiometric Ni50Mn36In14 and
Ni45Co5Mn37In13 alloys with two different thermal treatments, namely water quenching and
slow cooling. The study was performed by means of macroscopic magnetometry
measurements, unpolarized powder and single-crystal neutron diffraction and polarized single-
crystal neutron diffraction.
Thermomagnetization curves reveal the variation in the Curie and martensitic
transformation temperatures due to the different thermal treatment and Co doping. Thermal
treatment by slow cooling produces a shift to higher temperatures in TC with respect to WQ
samples, while the martensitic transformation moves to lower temperatures. On the other hand,
Co-doping produces an increment in both transition temperatures. Both slow cooling thermal
treatment and Co-doping produce an increase in the saturation magnetization of the austenite
phase, reaching ca. 60% of increase when both methods are combined.
Neutron diffraction has been used to investigate the microscopic origin of these effects
by analyzing the atomic order and magnetic arrangement in the austenite phase. The higher
degree of atomic order, together with the reduction of strains and defects induced by slow
cooling thermal treatments produces an increase in the total ordered magnetic moment and a
slight enhancement of the ferromagnetic coupling between the magnetic moments located in
octahedral sites, while cobalt doping has a stronger effect in increasing the ferromagnetic
coupling, which explains the noticeable effect in the magnetization.
The spin density maps obtained from polarized neutron diffraction reveal the magnetic
interactions responsible for this coupling scheme. Despite the weak interaction of the moments
in 8c sites with the rest of the magnetic moments, Co, that mainly replace Ni in 8c positions,
tends to couple ferromagnetically with its nearest neighbors in 4a and 4b sites, where the
magnetic atoms are mainly Mn, which in turn are coupled by strong interactions, favoring the
overall ferromagnetic coupling.
Chapter 5
142
Bibliography.
[1] R. Kainuma, Y. Imano, W. Ito, Y. Sutou, H. Morito, S. Okamoto, O. Kitakami, K. Oikawa,
A. Fujita, T. Kanomata, and K. Ishida, “Magnetic-field-induced shape recovery by reverse
phase transformation,” Nature, vol. 439, no. 7079, pp. 957–960, Feb. 2006.
[2] K. Koyama, K. Watanabe, T. Kanomata, R. Kainuma, K. Oikawa, and K. Ishida,
“Observation of field-induced reverse transformation in ferromagnetic shape memory alloy
Ni50Mn36Sn14,” Appl. Phys. Lett., vol. 88, no. 13, p. 132505, Mar. 2006.
[3] K. Oikawa, W. Ito, Y. Imano, Y. Sutou, R. Kainuma, K. Ishida, S. Okamoto, O. Kitakami,
and T. Kanomata, “Effect of magnetic field on martensitic transition of Ni46Mn41In13
Heusler alloy,” Appl. Phys. Lett., vol. 88, no. 12, p. 122507, Mar. 2006.
[4] A. Planes, L. Mañosa, and M. Acet, “Magnetocaloric effect and its relation to shape-
memory properties in ferromagnetic Heusler alloys,” J. Phys. Condens. Matter, vol. 21, no.
23, p. 233201, 2009.
[5] J. Liu, T. Gottschall, K. P. Skokov, J. D. Moore, and O. Gutfleisch, “Giant magnetocaloric
effect driven by structural transitions,” Nat. Mater., vol. 11, no. 7, pp. 620–626, Jul. 2012.
[6] J. I. Perez-Landazabal, V. Recarte, V. Sanchez-Alarcos, J.J. Beato-Lopez, J.A. Rodríguez-
Velamazán, J. Sánchez-Marcos, C. Gómez-Polo, and E. Cesari, “Giant direct and inverse
magnetocaloric effect linked to the same forward martensitic transformation,” Sci. Rep.,
vol. 7, p. 13328, Oct. 2017.
[7] Z. Li, W. Hu, F. Chen, M. Zhang, Z. Li, B. Yang, X. Zhao, L. Zuo, “Large
magnetoresistance in a directionally solidified Ni44.5Co5.1Mn37.1In13.3 magnetic shape
memory alloy,” J. Magn. Magn. Mater., vol. 452, pp. 249–252, Apr. 2018.
[8] S. Pandey, Z. Quetz, A. Aryal, I. Dubenko, D. Mazumdar, S. Stadler, and N. Ali, “Large
Inverse Magnetocaloric Effects and Giant Magnetoresistance in Ni-Mn-Cr-Sn Heusler
Alloys,” Magnetochemistry, vol. 3, no. 1, p. 3, Mar. 2017.
[9] E. Şaşıoğlu, L. M. Sandratskii, and P. Bruno, “First-principles calculation of the
intersublattice exchange interactions and Curie temperatures of the full Heusler alloys
Ni2MnX (X=Ga, In, Sn, Sb),” Phys. Rev. B, vol. 70, no. 2, p. 024427, Jul. 2004.
[10] E. Şaşıoğlu, L. M. Sandratskii, and P. Bruno, “Role of conduction electrons in mediating
exchange interactions in Mn-based Heusler alloys,” Phys. Rev. B, vol. 77, no. 6, p. 064417,
Feb. 2008.
Bibliography
143
[11] K. Ollefs, C. Schöppner,I. Titov, R. Meckenstock, F. Wilhelm, A. Rogalev, J. Liu, O.
Gutfleisch, M. Farle, H. Wende, and M. Acet, “Magnetic ordering in magnetic shape
memory alloy Ni-Mn-In-Co,” Phys. Rev. B, vol. 92, no. 22, p. 224429, Dec. 2015.
[12] S. Aksoy, M. Acet, P. P. Deen, L. Mañosa, and A. Planes, “Magnetic correlations in
martensitic Ni-Mn-based Heusler shape-memory alloys: Neutron polarization analysis,”
Phys. Rev. B, vol. 79, no. 21, p. 212401, Jun. 2009.
[13] R. Kainuma, Y. Imano, W. Ito, H. Morito, Y. Sutou, K. Oikawa, A. Fujita, K. Ishida, S.
Okamoto, O. Kitakami, and T. Kanomata, “Metamagnetic shape memory effect in a
Heusler-type Ni43Co7Mn39Sn11 polycrystalline alloy,” Appl. Phys. Lett., vol. 88, no. 19, p.
192513, May 2006.
[14] J. I. Pérez-Landazábal, V. Recarte, V. Sánchez-Alarcos, C. Gómez-Polo, and E. Cesari,
“Magnetic properties of the martensitic phase in Ni-Mn-In-Co metamagnetic shape
memory alloys,” Appl. Phys. Lett., vol. 102, no. 10, p. 101908, Mar. 2013.
[15] Umetsu, R. Y, A. Sheikh, B. Ouladdiaf, K. R. A. Ziebeck, T. Kanomata, and R.
Kainuma, “The effect of Co substitution on the magnetic properties of the Heusler alloy
Ni50Mn33Sn17,” Appl. Phys. Lett., vol. 98, no. 4, p. 042507, Jan. 2011.
[16] V. Recarte, J. I. Pérez-Landazábal, S. Kustov, and E. Cesari, “Entropy change linked to
the magnetic field induced martensitic transformation in a Ni–Mn–In–Co shape memory
alloy,” J. Appl. Phys., vol. 107, no. 5, p. 053501, Mar. 2010.
[17] L. Huang, D. Y. Cong, H. L. Suo, and Y. D. Wang, “Giant magnetic refrigeration
capacity near room temperature in Ni40Co10Mn40Sn10 multifunctional alloy,” Appl. Phys.
Lett., vol. 104, no. 13, p. 132407, Mar. 2014.
[18] V. Sánchez-Alarcos, V. Recarte, J. I. Pérez-Landazábal, and G. J. Cuello, “Correlation
between atomic order and the characteristics of the structural and magnetic transformations
in Ni–Mn–Ga shape memory alloys,” Acta Mater., vol. 55, no. 11, pp. 3883–3889, Jun.
2007.
[19] W. Ito, M. Nagasako, R. Y. Umetsu, R. Kainuma, T. Kanomata, and K. Ishida, “Atomic
ordering and magnetic properties in the Ni45Co5Mn36.7In13.3 metamagnetic shape memory
alloy,” Appl. Phys. Lett., vol. 93, no. 23, p. 232503, Dec. 2008.
[20] V. Recarte, J. I. Pérez-Landazábal, and V. Sánchez-Alarcos, “Dependence of the
relative stability between austenite and martensite phases on the atomic order in a Ni–Mn–
In Metamagnetic Shape Memory Alloy,” J. Alloys Compd., vol. 536, pp. S308–S311, Sep.
2012.
Chapter 5
144
[21] S. Kustov, M. L. Corró, J. Pons, and E. Cesari, “Entropy change and effect of magnetic
field on martensitic transformation in a metamagnetic Ni–Co–Mn–In shape memory alloy,”
Appl. Phys. Lett., vol. 94, no. 19, p. 191901, May 2009.
[22] P. Lázpita, J. M. Barandiarán, J. Gutiérrez, C. Mondelli, A. Sozinov, and V. A.
Chernenko, “Polarized Neutron Study of Ni-Mn-Ga Alloys: Site-Specific Spin Density
Affected by Martensitic Transformation,” Phys. Rev. Lett., vol. 119, no. 15, p. 155701, Oct.
2017.
[23] J. Rodríguez-Carvajal, “Recent advances in magnetic structure determination by
neutron powder diffraction,” Phys. B Condens. Matter, vol. 192, no. 1, pp. 55–69, Oct.
1993.
[24] R. J. Papoular and B. Gillon, “Maximum Entropy Reconstruction of Spin Density Maps
in Crystals from Polarized Neutron Diffraction Data,” EPL Europhys. Lett., vol. 13, no. 5,
p. 429, 1990.
[25] K. Momma, T. Ikeda, A. A. Belik, and F. Izumi, “Dysnomia, a computer program for
maximum-entropy method (MEM) analysis and its performance in the MEM-based pattern
fitting,” Powder Diffr., vol. 28, no. 3, pp. 184–193, Sep. 2013.
[26] S. Singh, I. Glavatskyy, and C. Biswas, “The influence of quench atomic disorder on
the magnetocaloric properties of Ni–Co–Mn–In alloys,” J. Alloys Compd., vol. 601, pp.
108–111, Jul. 2014.
[27] V. Sánchez-Alarcos, V. Recarte, J. I. Pérez-Landazábal, E. Cesari, and J. A. Rodríguez-
Velamazán, “Long-Range Atomic Order and Entropy Change at the Martensitic
Transformation in a Ni-Mn-In-Co Metamagnetic Shape Memory Alloy,” Entropy, vol. 16,
no. 5, pp. 2756–2767, May 2014.
[28] J. Rodríquez-Carvajal, “Magnetic Structure Determination from Powder Diffraction
Symmetry Analysis and Simulated Annealing,” Mater. Sci. Forum, vol. 378–381, pp. 268–
273, Oct. 2001.
[29] S. Kirkpatrick, C. D. Gelatt, and M. P. Vecchi, “Optimization by Simulated Annealing,”
Science, vol. 220, no. 4598, pp. 671–680, May 1983.
[30] Y. Kurtulus, R. Dronskowski, G. D. Samolyuk, and V. P. Antropov, “Electronic
structure and magnetic exchange coupling in ferromagnetic full Heusler alloys,” Phys. Rev.
B, vol. 71, no. 1, Jan. 2005.
Bibliography
145
[31] P. J. Brown, A.P. Gandy, R. Kainuma, T. Kanomata, K. U. Neumann, K. Oikawa, B.
Ouladdiaf, A. Sheikh, and K. R. A. Ziebeck, “The field and temperature dependence of the
magnetic and structural properties of the shape memory compound Ni1.84Mn1.64In0.52,” J.
Phys. Condens. Matter, vol. 23, no. 45, p. 456004, 2011.
[32] I. Unzueta, J. López-García, V. Sánchez-Alarcos, V. Recarte, J.I. Pérez-Landazábal,
J.A. Rodríguez-Velamazán, J.S. Garitaonandia, J.A. García, and F. Plazaola, “119Sn
Mössbauer spectroscopy for assessing the local stress and defect state towards the tuning
of Ni-Mn-Sn alloys,” Appl. Phys. Lett., vol. 110, no. 18, p. 181908, May 2017.
[33] S. Chikazumi and C. D. Graham, Physics of Ferromagnetism 2e. OUP Oxford, 2009.

146
147
Chapter 6. Recrystallization process
in NiCoMnSn and NiCoMnIn
magnetic shape memory alloys
6.1. INTRODUCTION
The poor mechanical properties of metamagnetic shape memory alloys (brittleness,
cracks after thermal cycling, etc.) constitute one of the main drawbacks for applications[1, 2].
To overcome the mechanical limitations of the bulk material, nanostructuration, processing in
form of ribbons or wires or, in particular, the integration of powder alloys into a polymer to
form composites have been reported as interesting options [3, 4]. Regarding the magnetocaloric
applications, optimum mechanical properties are not necessary since the active material is not
subject to mechanical stresses. However, it is important to optimize the magnetocaloric effect
and the heat exchange between the active material and the transmitting fluid. In principle, the
metamagnetic shape memory alloys in powder form meet the requirements to be used as a
magnetocaloric element for refrigeration systems [5]. Nevertheless, in all cases, a complete
characterization of the powdered alloys is needed in order to properly tune the functional
properties. A proper analysis of the powder may provide valuable information concerning the
influence of microstructure on both the martensitic transformation and the magnetic properties.
As stated in the general introduction (Chapter 1), ball milling is one of the simplest and
cheapest methods to produce nanostructured materials and to modify the properties of alloys by
mechanical treatment, with the appearance of interesting physical and chemical phenomena [6–
8]. For instance, an optimization of the MCE may be produced in different magnetic systems
through the reduction of the particle size by ball milling, either by increasing the temperature
range [9] or by reducing the hysteresis loss when linked to a magnetostructural first order
transformation [10].
The magnetostructural properties of metamagnetic shape memory alloy have been
deeply studied in polycrystalline bulk alloys. Nevertheless, up to now, much less work has been
devoted to the analysis of the martensitic transformation at reducing sizes, even though the
grain size and the state of internal tensions are known to be two parameters highly influencing
the characteristics of the MT through the variation of elastic energy term [11]. The effect of
ball milling on the magnetostructural properties has been studied in Ni-Mn-Ga [12–15] and
nanoparticles of Ni-Mn-Sn and Ni-Mn-In were recently obtained by ball milling [16–18]. In
the previous chapters, we have delved into the effect of milling in ternary metamagnetic shape
memory alloys and in quaternary systems with cobalt. The variations observed in the properties
Chapter 6
148
and the appearance of new phases stimulates the continuation of the investigation with the study
of the recovery and recrystallization processes induced by temperature in the milled alloys.
This chapter is therefore devoted to the study of the influence of the ball milling and the
subsequent microstructural recovery under heating in Ni-Mn-In-Co and Ni-Mn-Sn-Co milled
particles. We have chosen these alloys because mechanical milling in quaternary systems with
Co has been much less studied than in the corresponding ternary systems. Furthermore, as
shown in this thesis work, Co doping is a way to improve the magnetic properties, and
consequently magnetocaloric effect, Ni-Mn-In and Ni-Mn-Sn systems. In previous chapters,
we have studied the influence of milling the magnetostructural properties and the correlation
with the microstructure of these systems, showing also the occurrence of an amorphization
process. Hereafter, by means of neutron thermodiffraction, DSC, SEM and TEM
measurements, the crystallization process taking place on heating the milled alloys and the
properties of the resulting ordered structures have been characterized. A relaxation process
occurs on annealing above 700 K, concurrently with a B2-L21 atomic ordering, in both systems,
while a disordering process takes place at high temperature in the Ni-Mn-In-Co alloy giving
rise to an anomalous two-step thermal expansion.
6.2. EXPERIMENTAL RESULTS
Ni45Co5Mn37In13 and Ni45Co5Mn35Sn15 alloys (In-Co and Sn-Co hereafter) were
prepared from high purity elements by arc melting under protective Ar atmosphere. The as-cast
ingots were homogenized at 1073 K during 24h and then quenched into iced water. The
composition of the elaborated alloy was analyzed by EDS in a Jeol JSM-5610/LV Scanning
Electron Microscope (SEM). The alloys were subjected to a ball milling process in an argon
atmosphere at 800 rpm during an effective time of 2 h at room temperature using a ball:powder
ratio of 5:1 in the ball mill described in Chapter 2. The structural transformations and the
possible recovery processes taking place on annealing the as-milled powder samples were
characterized by differential scanning calorimetry (Q-100 DSC, TA Instruments). The size and
shape of the particles were observed by scanning and transmission electron microscopy (SEM,
Jeol JSM-5610/LV). The evolution of crystal structure, long-range atomic order, crystallite size
and microstrains was determined from in-situ powder neutron diffraction measurements
performed on the high-flux D1B two-axis diffractometer, at the Institute Laue-Langevin
(Grenoble, France). The diffraction patterns were measured on heating from RT up to 1173K
at 1K/min using a neutron wavelength of 1.28 Å. The structures were refined by the Rietveld
method using the Fullprof package programs [19].
6.2.1. Bulk and powder characterization
DSC cooling/heating measurements have been carried out to determine the
transformation cycle of the bulk samples, shown in Figure 6. 1. The occurrence of a first-order
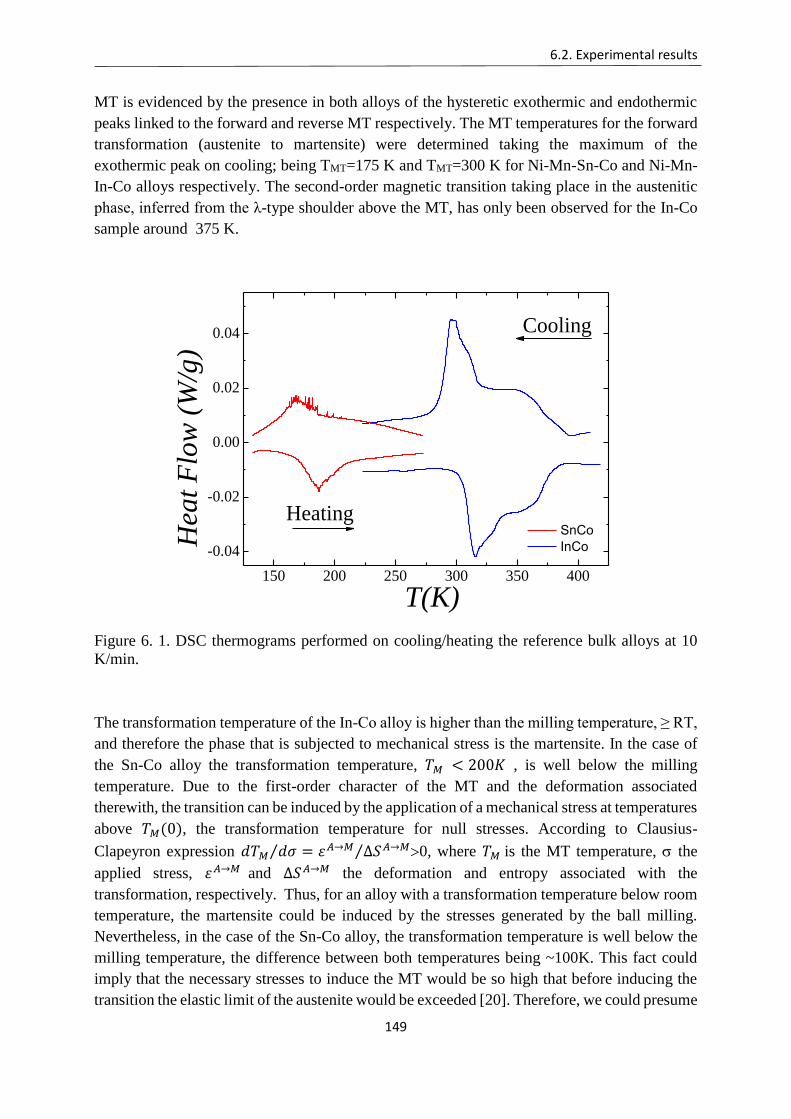
6.2. Experimental results
149
MT is evidenced by the presence in both alloys of the hysteretic exothermic and endothermic
peaks linked to the forward and reverse MT respectively. The MT temperatures for the forward
transformation (austenite to martensite) were determined taking the maximum of the
exothermic peak on cooling; being TMT=175 K and TMT=300 K for Ni-Mn-Sn-Co and Ni-Mn-
In-Co alloys respectively. The second-order magnetic transition taking place in the austenitic
phase, inferred from the λ-type shoulder above the MT, has only been observed for the In-Co
sample around 375 K.
150 200 250 300 350 400
-0.04
-0.02
0.00
0.02
0.04
Heating
Cooling
Hea
t F
low
(W
/g)
SnCo
InCo
T(K)
Figure 6. 1. DSC thermograms performed on cooling/heating the reference bulk alloys at 10
K/min.
The transformation temperature of the In-Co alloy is higher than the milling temperature, ≥ RT,
and therefore the phase that is subjected to mechanical stress is the martensite. In the case of
the Sn-Co alloy the transformation temperature, 𝑇𝑀 < 200𝐾 , is well below the milling
temperature. Due to the first-order character of the MT and the deformation associated
therewith, the transition can be induced by the application of a mechanical stress at temperatures
above 𝑇𝑀(0), the transformation temperature for null stresses. According to Clausius-
Clapeyron expression 𝑑𝑇𝑀 𝑑𝜎⁄ = 휀𝐴→𝑀 ∆𝑆𝐴→𝑀⁄ 0, where 𝑇𝑀 is the MT temperature, the
applied stress, 휀𝐴→𝑀 and ∆𝑆𝐴→𝑀 the deformation and entropy associated with the
transformation, respectively. Thus, for an alloy with a transformation temperature below room
temperature, the martensite could be induced by the stresses generated by the ball milling.
Nevertheless, in the case of the Sn-Co alloy, the transformation temperature is well below the
milling temperature, the difference between both temperatures being ~100K. This fact could
imply that the necessary stresses to induce the MT would be so high that before inducing the
transition the elastic limit of the austenite would be exceeded [20]. Therefore, we could presume
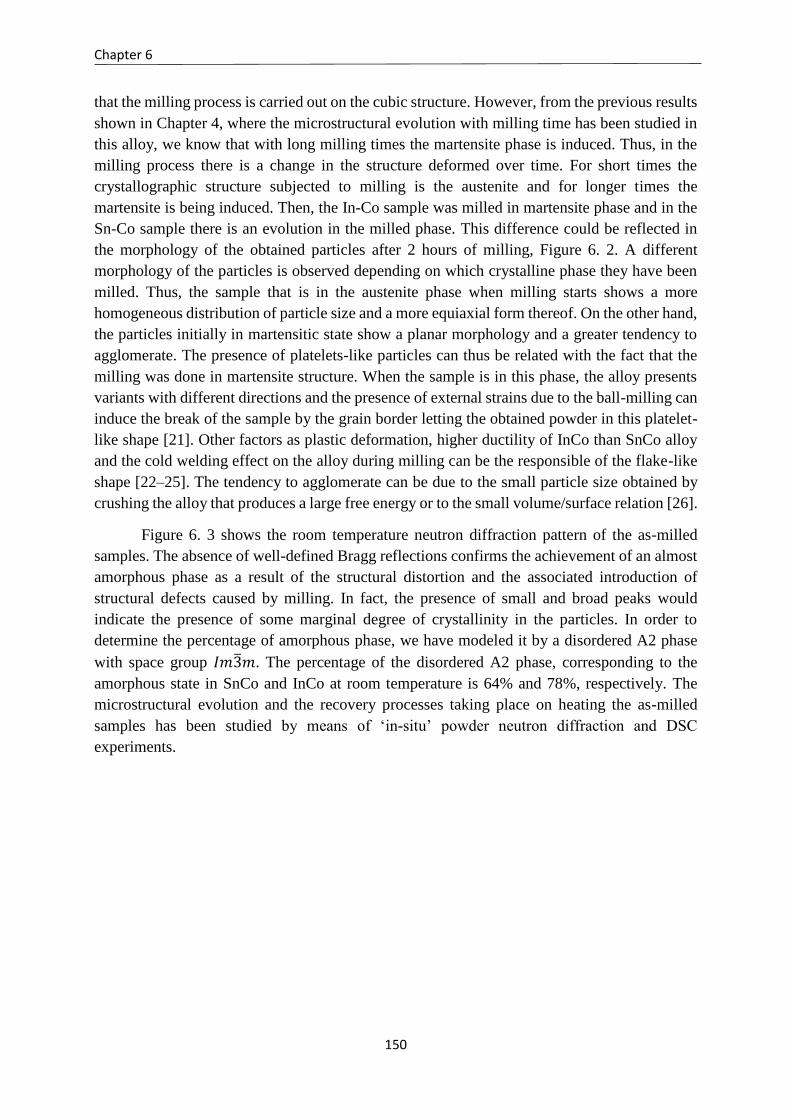
Chapter 6
150
that the milling process is carried out on the cubic structure. However, from the previous results
shown in Chapter 4, where the microstructural evolution with milling time has been studied in
this alloy, we know that with long milling times the martensite phase is induced. Thus, in the
milling process there is a change in the structure deformed over time. For short times the
crystallographic structure subjected to milling is the austenite and for longer times the
martensite is being induced. Then, the In-Co sample was milled in martensite phase and in the
Sn-Co sample there is an evolution in the milled phase. This difference could be reflected in
the morphology of the obtained particles after 2 hours of milling, Figure 6. 2. A different
morphology of the particles is observed depending on which crystalline phase they have been
milled. Thus, the sample that is in the austenite phase when milling starts shows a more
homogeneous distribution of particle size and a more equiaxial form thereof. On the other hand,
the particles initially in martensitic state show a planar morphology and a greater tendency to
agglomerate. The presence of platelets-like particles can thus be related with the fact that the
milling was done in martensite structure. When the sample is in this phase, the alloy presents
variants with different directions and the presence of external strains due to the ball-milling can
induce the break of the sample by the grain border letting the obtained powder in this platelet-
like shape [21]. Other factors as plastic deformation, higher ductility of InCo than SnCo alloy
and the cold welding effect on the alloy during milling can be the responsible of the flake-like
shape [22–25]. The tendency to agglomerate can be due to the small particle size obtained by
crushing the alloy that produces a large free energy or to the small volume/surface relation [26].
Figure 6. 3 shows the room temperature neutron diffraction pattern of the as-milled
samples. The absence of well-defined Bragg reflections confirms the achievement of an almost
amorphous phase as a result of the structural distortion and the associated introduction of
structural defects caused by milling. In fact, the presence of small and broad peaks would
indicate the presence of some marginal degree of crystallinity in the particles. In order to
determine the percentage of amorphous phase, we have modeled it by a disordered A2 phase
with space group 𝐼𝑚3̅𝑚. The percentage of the disordered A2 phase, corresponding to the
amorphous state in SnCo and InCo at room temperature is 64% and 78%, respectively. The
microstructural evolution and the recovery processes taking place on heating the as-milled
samples has been studied by means of ‘in-situ’ powder neutron diffraction and DSC
experiments.
6.2. Experimental results
151
Figure 6. 2. SEM micrographs of the as-milled samples. Left column corresponds to Sn-Co
alloy. Right column corresponds to In-Co alloy.
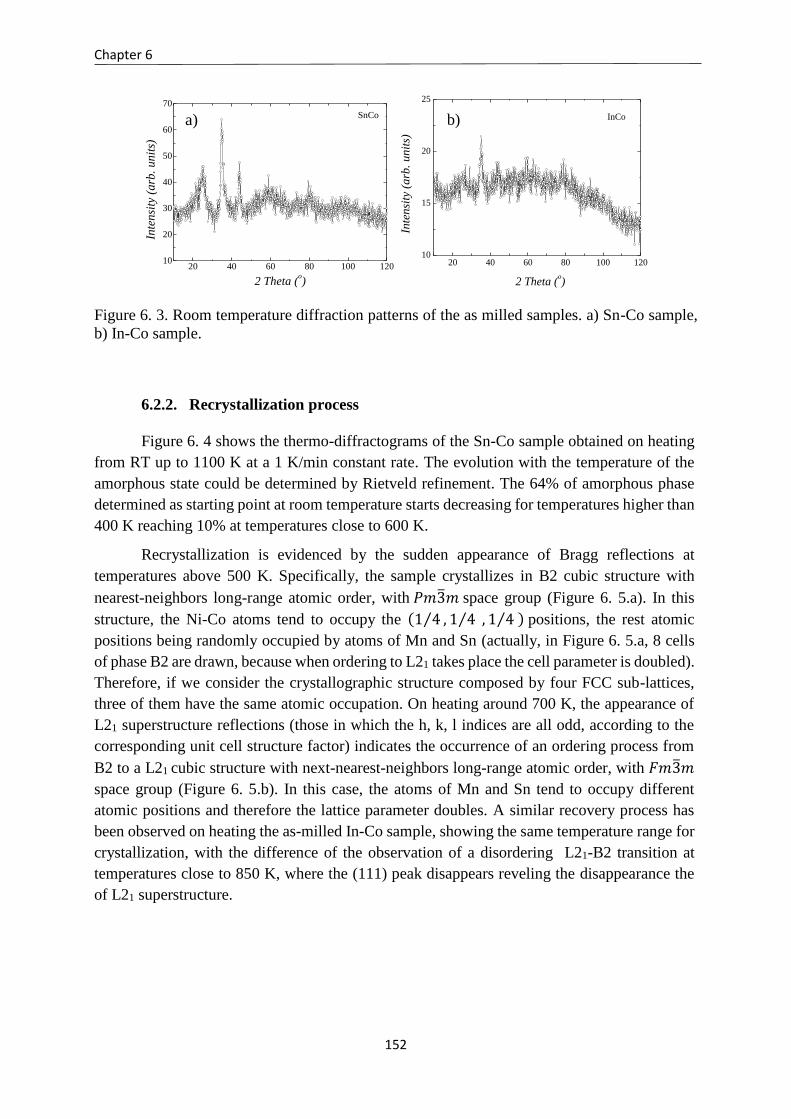
Chapter 6
152
20 40 60 80 100 12010
20
30
40
50
60
70
Inte
nsi
ty (
arb
. unit
s)
2 Theta (o)
SnCoa)
20 40 60 80 100 12010
15
20
25
InCo
Inte
nsi
ty (
arb
. u
nit
s)
2 Theta (o)
b)
Figure 6. 3. Room temperature diffraction patterns of the as milled samples. a) Sn-Co sample,
b) In-Co sample.
6.2.2. Recrystallization process
Figure 6. 4 shows the thermo-diffractograms of the Sn-Co sample obtained on heating
from RT up to 1100 K at a 1 K/min constant rate. The evolution with the temperature of the
amorphous state could be determined by Rietveld refinement. The 64% of amorphous phase
determined as starting point at room temperature starts decreasing for temperatures higher than
400 K reaching 10% at temperatures close to 600 K.
Recrystallization is evidenced by the sudden appearance of Bragg reflections at
temperatures above 500 K. Specifically, the sample crystallizes in B2 cubic structure with
nearest-neighbors long-range atomic order, with 𝑃𝑚3̅𝑚 space group (Figure 6. 5.a). In this
structure, the Ni-Co atoms tend to occupy the (1 4⁄ , 1 4⁄ , 1 4⁄ ) positions, the rest atomic
positions being randomly occupied by atoms of Mn and Sn (actually, in Figure 6. 5.a, 8 cells
of phase B2 are drawn, because when ordering to L21 takes place the cell parameter is doubled).
Therefore, if we consider the crystallographic structure composed by four FCC sub-lattices,
three of them have the same atomic occupation. On heating around 700 K, the appearance of
L21 superstructure reflections (those in which the h, k, l indices are all odd, according to the
corresponding unit cell structure factor) indicates the occurrence of an ordering process from
B2 to a L21 cubic structure with next-nearest-neighbors long-range atomic order, with 𝐹𝑚3̅𝑚
space group (Figure 6. 5.b). In this case, the atoms of Mn and Sn tend to occupy different
atomic positions and therefore the lattice parameter doubles. A similar recovery process has
been observed on heating the as-milled In-Co sample, showing the same temperature range for
crystallization, with the difference of the observation of a disordering L21-B2 transition at
temperatures close to 850 K, where the (111) peak disappears reveling the disappearance the
of L21 superstructure.
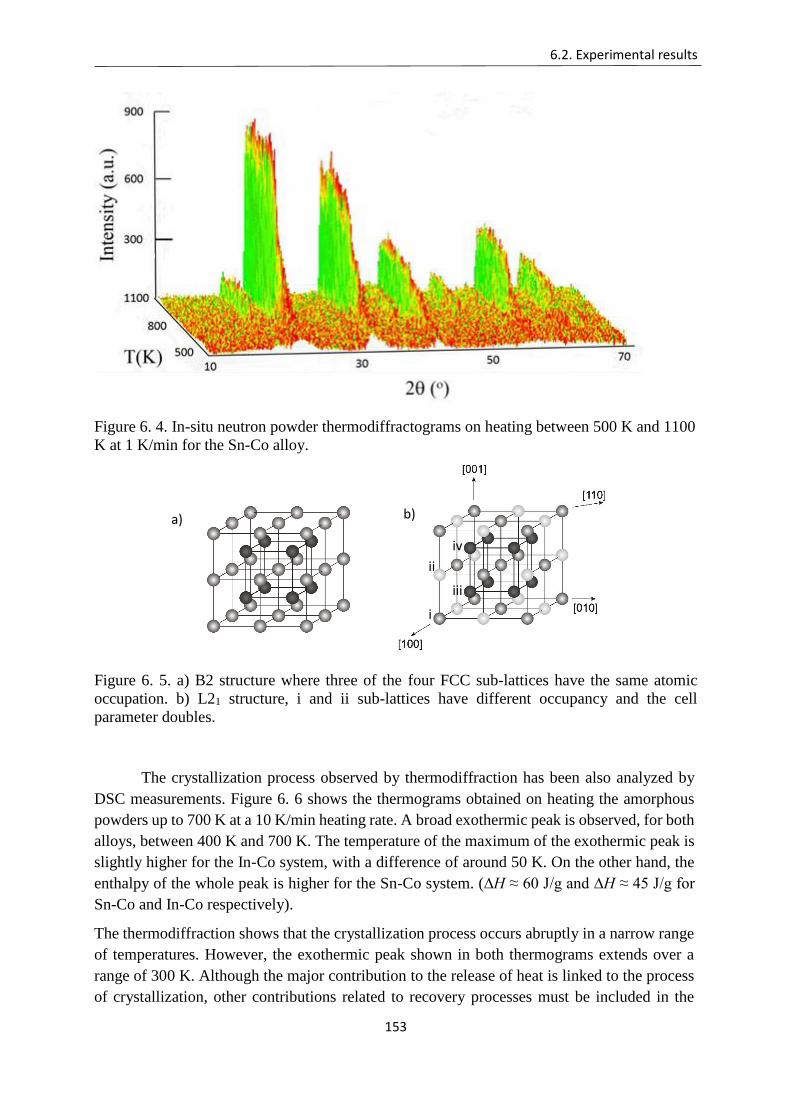
6.2. Experimental results
153
Figure 6. 4. In-situ neutron powder thermodiffractograms on heating between 500 K and 1100
K at 1 K/min for the Sn-Co alloy.
Figure 6. 5. a) B2 structure where three of the four FCC sub-lattices have the same atomic
occupation. b) L21 structure, i and ii sub-lattices have different occupancy and the cell
parameter doubles.
The crystallization process observed by thermodiffraction has been also analyzed by
DSC measurements. Figure 6. 6 shows the thermograms obtained on heating the amorphous
powders up to 700 K at a 10 K/min heating rate. A broad exothermic peak is observed, for both
alloys, between 400 K and 700 K. The temperature of the maximum of the exothermic peak is
slightly higher for the In-Co system, with a difference of around 50 K. On the other hand, the
enthalpy of the whole peak is higher for the Sn-Co system. (∆H ≈ 60 J/g and ∆H ≈ 45 J/g for
Sn-Co and In-Co respectively).
The thermodiffraction shows that the crystallization process occurs abruptly in a narrow range
of temperatures. However, the exothermic peak shown in both thermograms extends over a
range of 300 K. Although the major contribution to the release of heat is linked to the process
of crystallization, other contributions related to recovery processes must be included in the
i
ii
iii
iv
a) b)
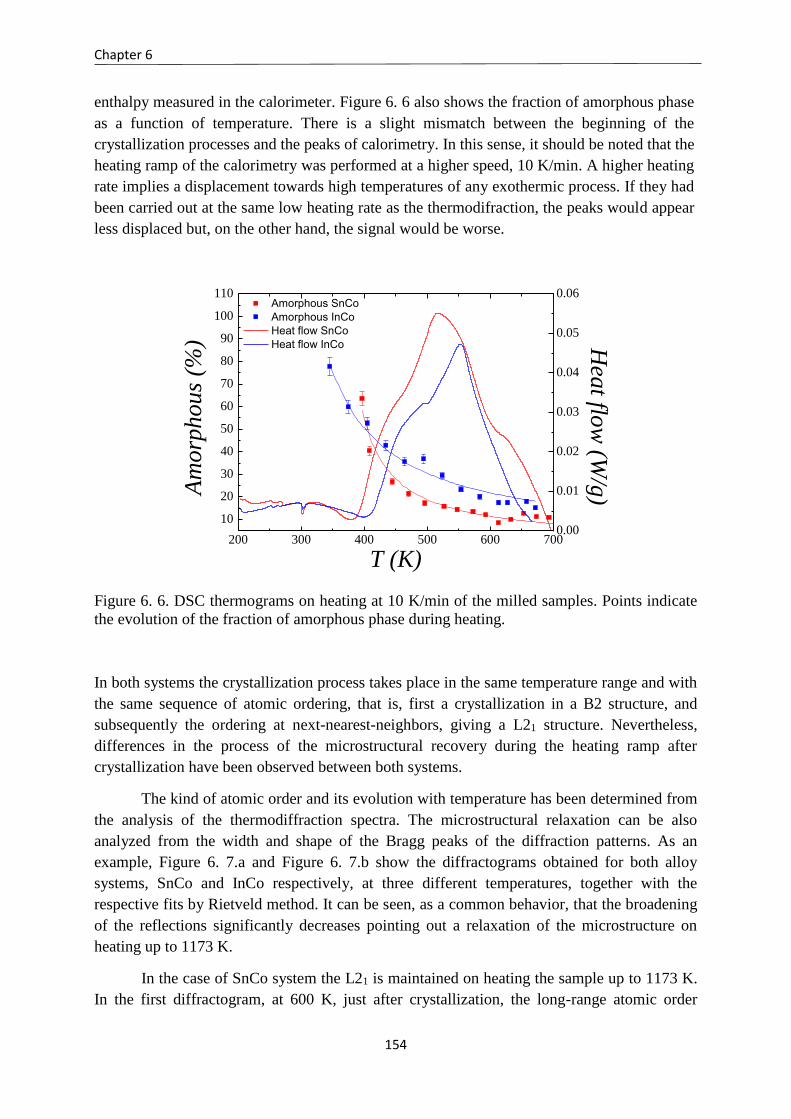
Chapter 6
154
enthalpy measured in the calorimeter. Figure 6. 6 also shows the fraction of amorphous phase
as a function of temperature. There is a slight mismatch between the beginning of the
crystallization processes and the peaks of calorimetry. In this sense, it should be noted that the
heating ramp of the calorimetry was performed at a higher speed, 10 K/min. A higher heating
rate implies a displacement towards high temperatures of any exothermic process. If they had
been carried out at the same low heating rate as the thermodifraction, the peaks would appear
less displaced but, on the other hand, the signal would be worse.
200 300 400 500 600 700
10
20
30
40
50
60
70
80
90
100
110 Amorphous SnCo
Amorphous InCo
Heat flow SnCo
Heat flow InCo
T (K)
Am
orp
hous
(%)
0.00
0.01
0.02
0.03
0.04
0.05
0.06
Hea
t flow
(W/g
)
Figure 6. 6. DSC thermograms on heating at 10 K/min of the milled samples. Points indicate
the evolution of the fraction of amorphous phase during heating.
In both systems the crystallization process takes place in the same temperature range and with
the same sequence of atomic ordering, that is, first a crystallization in a B2 structure, and
subsequently the ordering at next-nearest-neighbors, giving a L21 structure. Nevertheless,
differences in the process of the microstructural recovery during the heating ramp after
crystallization have been observed between both systems.
The kind of atomic order and its evolution with temperature has been determined from
the analysis of the thermodiffraction spectra. The microstructural relaxation can be also
analyzed from the width and shape of the Bragg peaks of the diffraction patterns. As an
example, Figure 6. 7.a and Figure 6. 7.b show the diffractograms obtained for both alloy
systems, SnCo and InCo respectively, at three different temperatures, together with the
respective fits by Rietveld method. It can be seen, as a common behavior, that the broadening
of the reflections significantly decreases pointing out a relaxation of the microstructure on
heating up to 1173 K.
In the case of SnCo system the L21 is maintained on heating the sample up to 1173 K.
In the first diffractogram, at 600 K, just after crystallization, the long-range atomic order
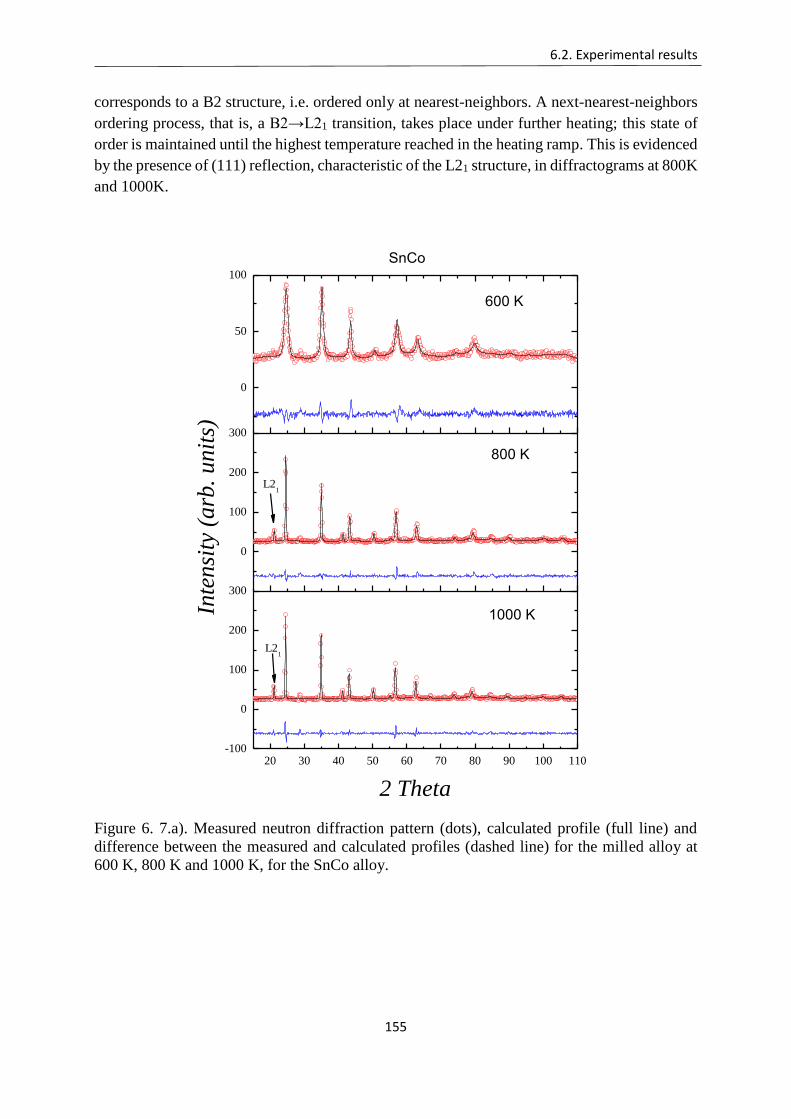
6.2. Experimental results
155
corresponds to a B2 structure, i.e. ordered only at nearest-neighbors. A next-nearest-neighbors
ordering process, that is, a B2→L21 transition, takes place under further heating; this state of
order is maintained until the highest temperature reached in the heating ramp. This is evidenced
by the presence of (111) reflection, characteristic of the L21 structure, in diffractograms at 800K
and 1000K.
20 30 40 50 60 70 80 90 100 110-100
0
100
200
300
0
100
200
300
0
50
100
2 Theta
1000 K
SnCo
L21
Inte
nsi
ty (
arb
. unit
s)
800 K
L21
600 K
Figure 6. 7.a). Measured neutron diffraction pattern (dots), calculated profile (full line) and
difference between the measured and calculated profiles (dashed line) for the milled alloy at
600 K, 800 K and 1000 K, for the SnCo alloy.
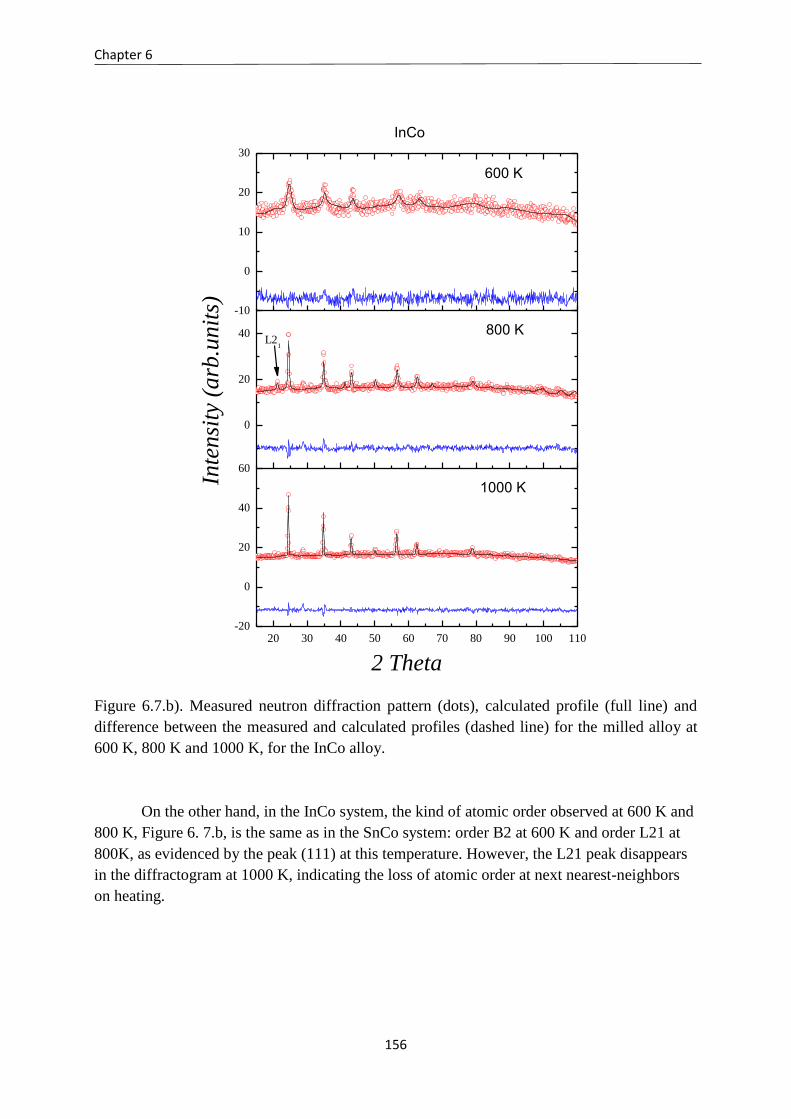
Chapter 6
156
20 30 40 50 60 70 80 90 100 110-20
0
20
40
60
0
20
40
-10
0
10
20
30
Inte
nsi
ty (
arb
.unit
s)
1000 K
800 KL2
1
600 K
2 Theta
InCo
Figure 6.7.b). Measured neutron diffraction pattern (dots), calculated profile (full line) and
difference between the measured and calculated profiles (dashed line) for the milled alloy at
600 K, 800 K and 1000 K, for the InCo alloy.
On the other hand, in the InCo system, the kind of atomic order observed at 600 K and
800 K, Figure 6. 7.b, is the same as in the SnCo system: order B2 at 600 K and order L21 at
800K, as evidenced by the peak (111) at this temperature. However, the L21 peak disappears
in the diffractogram at 1000 K, indicating the loss of atomic order at next nearest-neighbors
on heating.
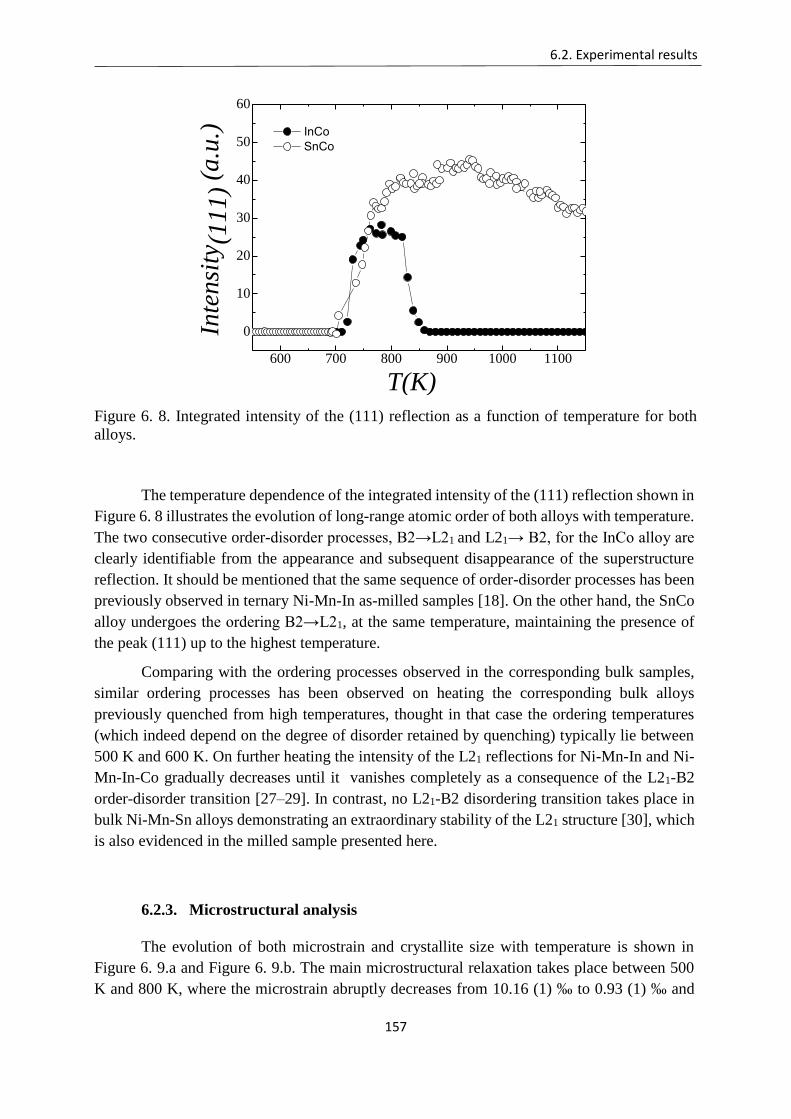
6.2. Experimental results
157
600 700 800 900 1000 1100
0
10
20
30
40
50
60
InCo
SnCo
Inte
nsi
ty(1
11
) (a
.u.)
T(K)
Figure 6. 8. Integrated intensity of the (111) reflection as a function of temperature for both
alloys.
The temperature dependence of the integrated intensity of the (111) reflection shown in
Figure 6. 8 illustrates the evolution of long-range atomic order of both alloys with temperature.
The two consecutive order-disorder processes, B2→L21 and L21→ B2, for the InCo alloy are
clearly identifiable from the appearance and subsequent disappearance of the superstructure
reflection. It should be mentioned that the same sequence of order-disorder processes has been
previously observed in ternary Ni-Mn-In as-milled samples [18]. On the other hand, the SnCo
alloy undergoes the ordering B2→L21, at the same temperature, maintaining the presence of
the peak (111) up to the highest temperature.
Comparing with the ordering processes observed in the corresponding bulk samples,
similar ordering processes has been observed on heating the corresponding bulk alloys
previously quenched from high temperatures, thought in that case the ordering temperatures
(which indeed depend on the degree of disorder retained by quenching) typically lie between
500 K and 600 K. On further heating the intensity of the L21 reflections for Ni-Mn-In and Ni-
Mn-In-Co gradually decreases until it vanishes completely as a consequence of the L21-B2
order-disorder transition [27–29]. In contrast, no L21-B2 disordering transition takes place in
bulk Ni-Mn-Sn alloys demonstrating an extraordinary stability of the L21 structure [30], which
is also evidenced in the milled sample presented here.
6.2.3. Microstructural analysis
The evolution of both microstrain and crystallite size with temperature is shown in
Figure 6. 9.a and Figure 6. 9.b. The main microstructural relaxation takes place between 500
K and 800 K, where the microstrain abruptly decreases from 10.16 (1) ‰ to 0.93 (1) ‰ and
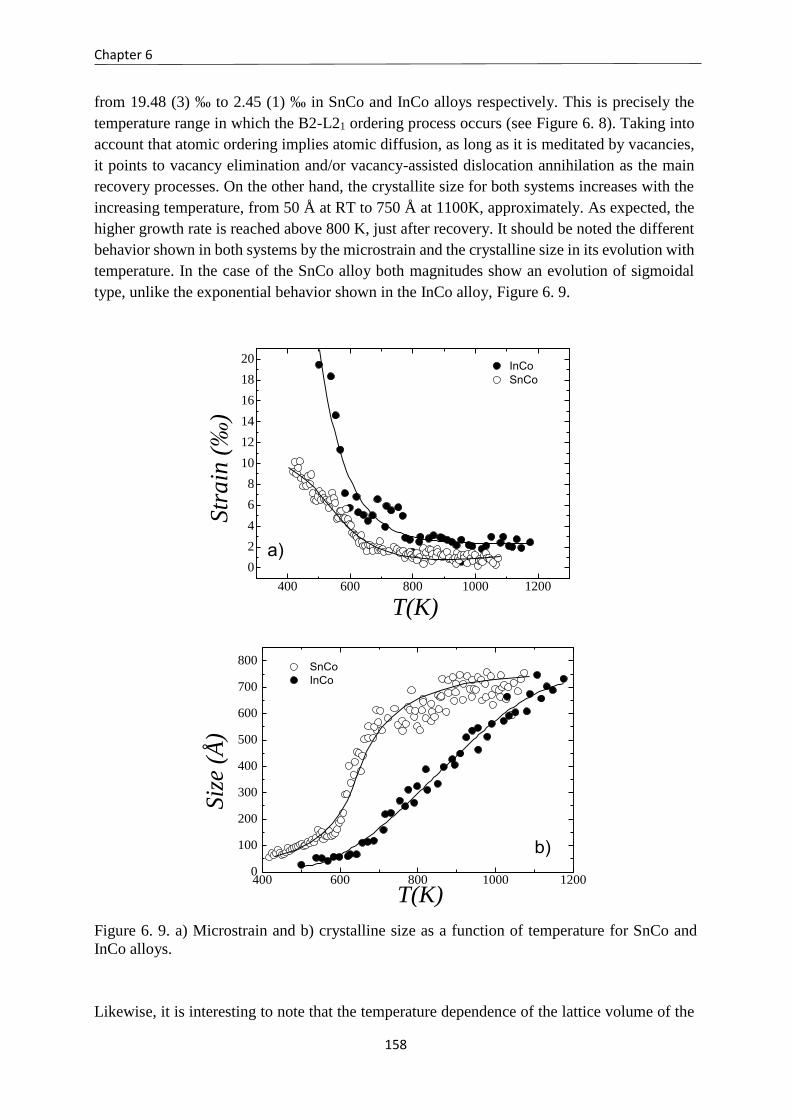
Chapter 6
158
from 19.48 (3) ‰ to 2.45 (1) ‰ in SnCo and InCo alloys respectively. This is precisely the
temperature range in which the B2-L21 ordering process occurs (see Figure 6. 8). Taking into
account that atomic ordering implies atomic diffusion, as long as it is meditated by vacancies,
it points to vacancy elimination and/or vacancy-assisted dislocation annihilation as the main
recovery processes. On the other hand, the crystallite size for both systems increases with the
increasing temperature, from 50 Å at RT to 750 Å at 1100K, approximately. As expected, the
higher growth rate is reached above 800 K, just after recovery. It should be noted the different
behavior shown in both systems by the microstrain and the crystalline size in its evolution with
temperature. In the case of the SnCo alloy both magnitudes show an evolution of sigmoidal
type, unlike the exponential behavior shown in the InCo alloy, Figure 6. 9.
400 600 800 1000 1200
0
2
4
6
8
10
12
14
16
18
20
InCo
SnCo
Str
ain
(‰
)
T(K)
a)
400 600 800 1000 12000
100
200
300
400
500
600
700
800
SnCo
InCo
Siz
e (Å
)
T(K)
b)
Figure 6. 9. a) Microstrain and b) crystalline size as a function of temperature for SnCo and
InCo alloys.
Likewise, it is interesting to note that the temperature dependence of the lattice volume of the
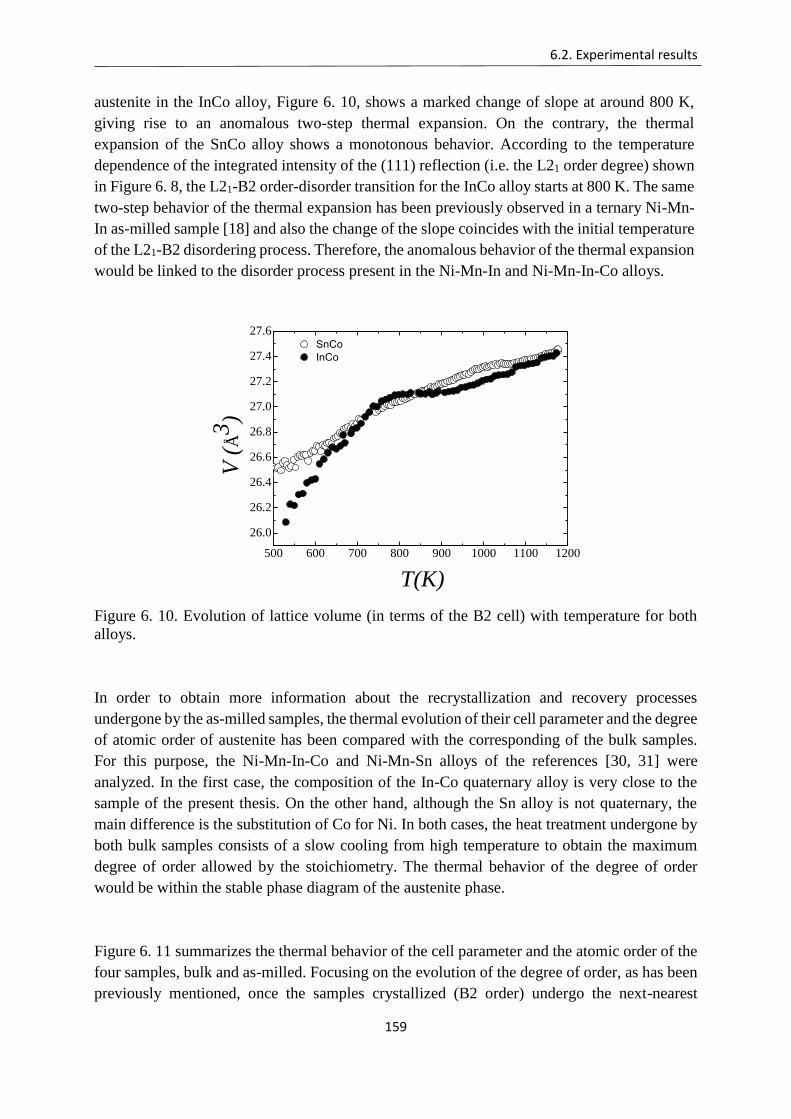
6.2. Experimental results
159
austenite in the InCo alloy, Figure 6. 10, shows a marked change of slope at around 800 K,
giving rise to an anomalous two-step thermal expansion. On the contrary, the thermal
expansion of the SnCo alloy shows a monotonous behavior. According to the temperature
dependence of the integrated intensity of the (111) reflection (i.e. the L21 order degree) shown
in Figure 6. 8, the L21-B2 order-disorder transition for the InCo alloy starts at 800 K. The same
two-step behavior of the thermal expansion has been previously observed in a ternary Ni-Mn-
In as-milled sample [18] and also the change of the slope coincides with the initial temperature
of the L21-B2 disordering process. Therefore, the anomalous behavior of the thermal expansion
would be linked to the disorder process present in the Ni-Mn-In and Ni-Mn-In-Co alloys.
500 600 700 800 900 1000 1100 1200
26.0
26.2
26.4
26.6
26.8
27.0
27.2
27.4
27.6
SnCo
InCo
V (
Å3)
T(K)
Figure 6. 10. Evolution of lattice volume (in terms of the B2 cell) with temperature for both
alloys.
In order to obtain more information about the recrystallization and recovery processes
undergone by the as-milled samples, the thermal evolution of their cell parameter and the degree
of atomic order of austenite has been compared with the corresponding of the bulk samples.
For this purpose, the Ni-Mn-In-Co and Ni-Mn-Sn alloys of the references [30, 31] were
analyzed. In the first case, the composition of the In-Co quaternary alloy is very close to the
sample of the present thesis. On the other hand, although the Sn alloy is not quaternary, the
main difference is the substitution of Co for Ni. In both cases, the heat treatment undergone by
both bulk samples consists of a slow cooling from high temperature to obtain the maximum
degree of order allowed by the stoichiometry. The thermal behavior of the degree of order
would be within the stable phase diagram of the austenite phase.
Figure 6. 11 summarizes the thermal behavior of the cell parameter and the atomic order of the
four samples, bulk and as-milled. Focusing on the evolution of the degree of order, as has been
previously mentioned, once the samples crystallized (B2 order) undergo the next-nearest
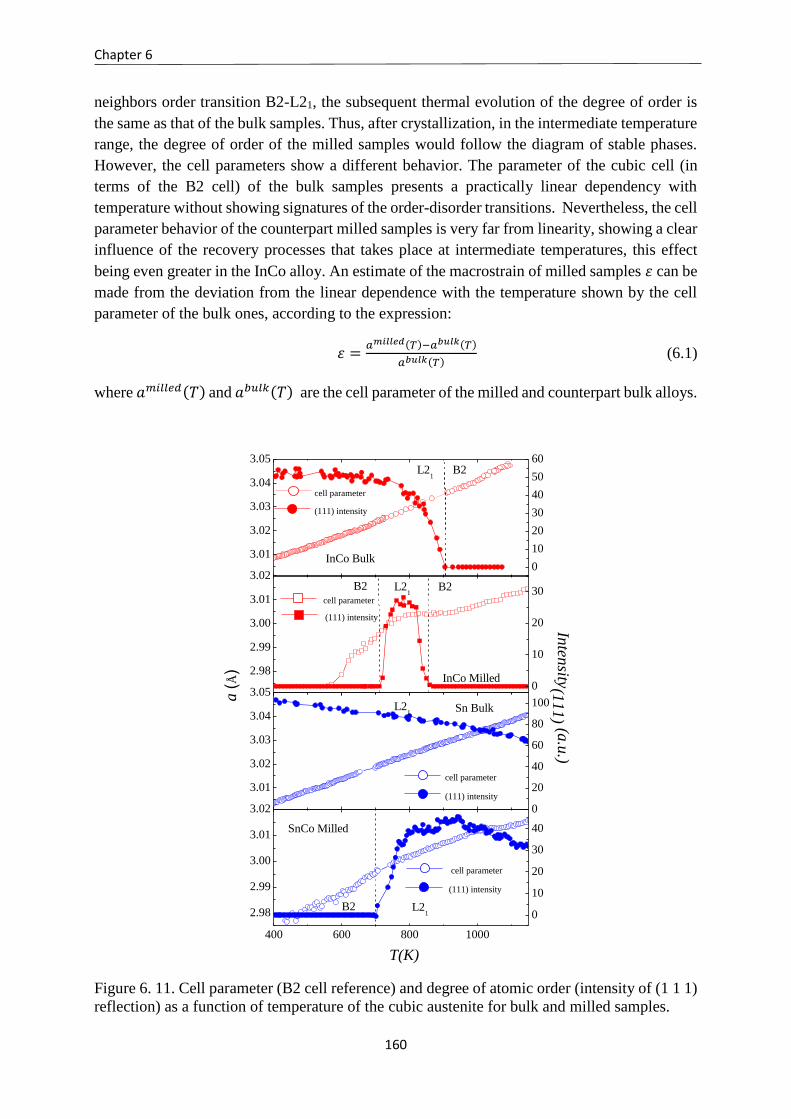
Chapter 6
160
neighbors order transition B2-L21, the subsequent thermal evolution of the degree of order is
the same as that of the bulk samples. Thus, after crystallization, in the intermediate temperature
range, the degree of order of the milled samples would follow the diagram of stable phases.
However, the cell parameters show a different behavior. The parameter of the cubic cell (in
terms of the B2 cell) of the bulk samples presents a practically linear dependency with
temperature without showing signatures of the order-disorder transitions. Nevertheless, the cell
parameter behavior of the counterpart milled samples is very far from linearity, showing a clear
influence of the recovery processes that takes place at intermediate temperatures, this effect
being even greater in the InCo alloy. An estimate of the macrostrain of milled samples 휀 can be
made from the deviation from the linear dependence with the temperature shown by the cell
parameter of the bulk ones, according to the expression:
휀 =𝑎𝑚𝑖𝑙𝑙𝑒𝑑(𝑇)−𝑎𝑏𝑢𝑙𝑘(𝑇)
𝑎𝑏𝑢𝑙𝑘(𝑇) (6.1)
where 𝑎𝑚𝑖𝑙𝑙𝑒𝑑(𝑇) and 𝑎𝑏𝑢𝑙𝑘(𝑇) are the cell parameter of the milled and counterpart bulk alloys.
3.01
3.02
3.03
3.04
3.05
cell parameter
InCo Bulk
L21
B2
0
10
20
30
40
50
60
(111) intensity
2.98
2.99
3.00
3.01
3.02
cell parameter
0
10
20
30
(111) intensity
L21
B2B2
InCo Milled
a (
Å)
3.01
3.02
3.03
3.04
3.05
cell parameter
L21 Sn Bulk
0
20
40
60
80
100
(111) intensity
400 600 800 1000
2.98
2.99
3.00
3.01
3.02
cell parameter
T(K)
B2 L21
SnCo Milled
0
10
20
30
40
(111) intensity
Inten
sity(1
11
) (a.u
.)
Figure 6. 11. Cell parameter (B2 cell reference) and degree of atomic order (intensity of (1 1 1)
reflection) as a function of temperature of the cubic austenite for bulk and milled samples.
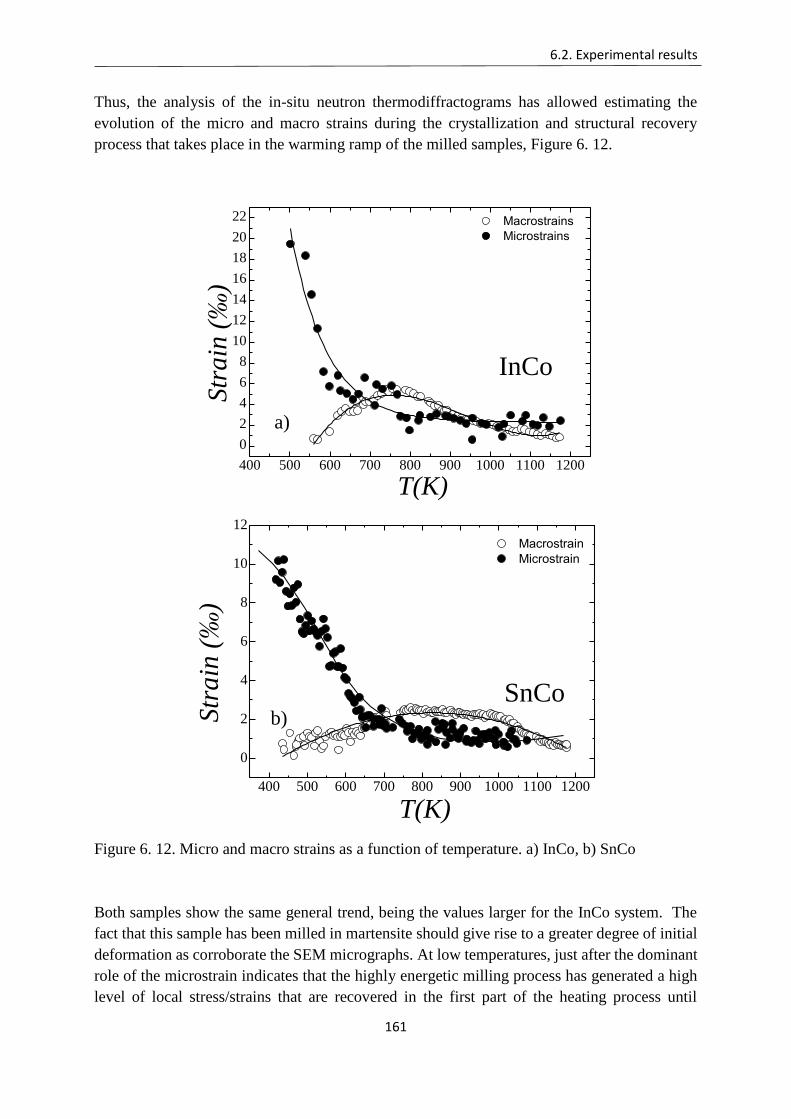
6.2. Experimental results
161
Thus, the analysis of the in-situ neutron thermodiffractograms has allowed estimating the
evolution of the micro and macro strains during the crystallization and structural recovery
process that takes place in the warming ramp of the milled samples, Figure 6. 12.
400 500 600 700 800 900 1000 1100 1200
0
2
4
6
8
10
12
14
16
18
20
22
Macrostrains
Microstrains
Str
ain
(‰
)
T(K)
InCo
a)
400 500 600 700 800 900 1000 1100 1200
0
2
4
6
8
10
12
Macrostrain
Microstrain
Str
ain
(‰
)
T(K)
SnCob)
Figure 6. 12. Micro and macro strains as a function of temperature. a) InCo, b) SnCo
Both samples show the same general trend, being the values larger for the InCo system. The
fact that this sample has been milled in martensite should give rise to a greater degree of initial
deformation as corroborate the SEM micrographs. At low temperatures, just after the dominant
role of the microstrain indicates that the highly energetic milling process has generated a high
level of local stress/strains that are recovered in the first part of the heating process until
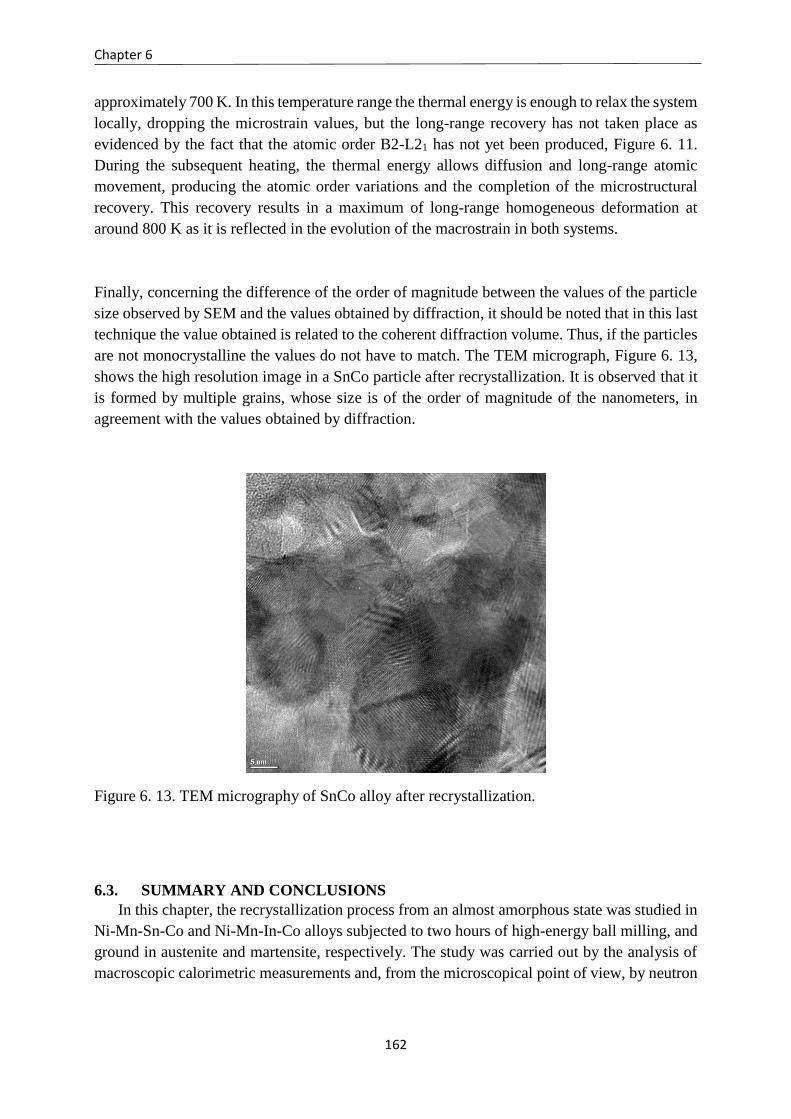
Chapter 6
162
approximately 700 K. In this temperature range the thermal energy is enough to relax the system
locally, dropping the microstrain values, but the long-range recovery has not taken place as
evidenced by the fact that the atomic order B2-L21 has not yet been produced, Figure 6. 11.
During the subsequent heating, the thermal energy allows diffusion and long-range atomic
movement, producing the atomic order variations and the completion of the microstructural
recovery. This recovery results in a maximum of long-range homogeneous deformation at
around 800 K as it is reflected in the evolution of the macrostrain in both systems.
Finally, concerning the difference of the order of magnitude between the values of the particle
size observed by SEM and the values obtained by diffraction, it should be noted that in this last
technique the value obtained is related to the coherent diffraction volume. Thus, if the particles
are not monocrystalline the values do not have to match. The TEM micrograph, Figure 6. 13,
shows the high resolution image in a SnCo particle after recrystallization. It is observed that it
is formed by multiple grains, whose size is of the order of magnitude of the nanometers, in
agreement with the values obtained by diffraction.
Figure 6. 13. TEM micrography of SnCo alloy after recrystallization.
6.3. SUMMARY AND CONCLUSIONS
In this chapter, the recrystallization process from an almost amorphous state was studied in
Ni-Mn-Sn-Co and Ni-Mn-In-Co alloys subjected to two hours of high-energy ball milling, and
ground in austenite and martensite, respectively. The study was carried out by the analysis of
macroscopic calorimetric measurements and, from the microscopical point of view, by neutron
6.3. Summary and conclusions
163
diffraction, SEM and TEM micrography. The evolution of microstructural and cell parameters
was determined by Rietveld refinements during the recrystallization process.
By means of SEM micrography, the particle size of the obtained powder was determined in
both studied specimens, obtaining values close to 100 μm with different morphology associated
to ductility of the alloy and to the phase in which the samples were milled. In this sense, Ni-
Co-Mn-Sn presents polyhedral particles while Ni-Mn-In-Co displays flake-like shaped
particles, as a result of having been milled in martensite and the possible occurrence of cold
welding due to the higher ductility that this last system presents.
Powder neutron diffraction in the initial state has revealed that, together with a prevailing
amorphous phase, the alloys retain some degree of crystallinity after milling, as shown by the
reflections present in the diffractograms. The amount of amorphous phase was estimated by
modelling it by a disordered A2 phase, yielding values close to 64% and 78% for Ni-Mn-Sn-
Co and Ni-Mn-In-Co alloys in the as-milled state, respectively. The higher degree of
amorphization shown by the InCo system is in agreement with the higher strains and lower
grain size determined in the initial state for this alloy. The recrystallization process occurs in
two steps for both alloys. Both evolve from amorphous state to disordered B2 phase at
temperatures close to 500 K and undergo a B2-L21 transition at 700 K. However, the Heusler
L21 structure remains in SnCo up to temperatures as high as 1200 K, while InCo alloy undergoes
a L21-B2 order-disorder transition at 850 K, pointing out the high stability of L21 structure in
the SnCo system. Moreover, the evolution of microstructural parameters as grain size and
internal strains was obtained from the refinement of the diffraction patterns measured during
the recrystallization. An anomalous behavior of the cell parameter as a function of temperature
has been clearly observed in the temperature range where the B2-L21 transition takes place.
Finally, the grain size determined by TEM micrography is in agreement with the values
obtained from Rietveld refinement, corroborating the polycrystalline structure of the particles
after the recrystallization process. Although the particle sizes are large, the order of magnitude
of the size of the recrystallized grains is in agreement with those obtained by neutron diffraction.
Chapter 6
164
Bibliography
[1] G. B. Rao, J. Q. Wang, E. H. Han, and W. Ke, “Study of residual stress accumulation in
TiNi shape memory alloy during fatigue using EBSD technique,” Mater. Lett., vol. 6, no.
60, pp. 779–782, 2006.
[2] H. Scherngell and A. C. Kneissl, “Generation, development and degradation of the intrinsic
two-way shape memory effect in different alloy systems,” Acta Mater., vol. 2, no. 50, pp.
327–341, 2002.
[3] J. Feuchtwanger, M. L. Richard, Y. J. Tang, A. E. Berkowitz, R. C. O’Handley, and S. M.
Allen, “Large energy absorption in Ni–Mn–Ga/polymer composites,” J. Appl. Phys., vol.
97, no. 10, p. 10M319, May 2005.
[4] J. Liu, N. Scheerbaum, S. Kauffmann-Weiss, and O. Gutfleisch, “NiMn-Based Alloys and
Composites for Magnetically Controlled Dampers and Actuators,” Adv. Eng. Mater., vol.
14, no. 8, pp. 653–667, Aug. 2012.
[5] M. Acet, L. Manosa, and A. Planes, Handbook of Magnetic Materials, K. H. J. Buschow.,
vol. 19. Amsterdam: Elsevier, 2011.
[6] C. Suryanarayana, “Mechanical alloying and milling,” Prog. Mater. Sci., vol. 46, no. 1, pp.
1–184, Jan. 2001.
[7] M. E. McHenry and D. E. Laughlin, “Nano-scale materials development for future
magnetic applications,” Acta Mater., vol. 48, no. 1, pp. 223–238, Jan. 2000.
[8] A. Calka and D. Wexler, “Mechanical milling assisted by electrical discharge,” Nature, vol.
419, no. 6903, pp. 147–151, Sep. 2002.
[9] P. Gorria, P. Álvarez, J. S. Marcos, J. L. Sánchez Llamazares, M. J. Pérez, and J. A. Blanco,
“Crystal structure, magnetocaloric effect and magnetovolume anomalies in nanostructured
Pr2Fe17,” Acta Mater., vol. 57, no. 6, pp. 1724–1733, Apr. 2009.
[10] W. Dagula, O. Tegus, X.W. Li, L. Song, E. Brück, D.T. Cam Thanh, F.R. de Boer, and
K.H.J. Buchow, “Magnetic properties and magnetic-entropy change of
MnFeP0.5As0.5−xSix(x=0–0.3) compounds,” J. Appl. Phys., vol. 99, no. 8, p. 08Q105,
Apr. 2006.
[11] J. Ortín and A. Planes, “Thermodynamic analysis of thermal measurements in
thermoelastic martensitic transformations,” Acta Metall., vol. 36, no. 8, pp. 1873–1889,
Aug. 1988.
Bibliography
165
[12] Y. D. Wang, Y. Ren, Z.H. Nie, D.M. Liu, L. Zuo, H. Choo, H. Li, P.K. Liaw, J.Q. Yan,
R.K. McQueeney, J.W. Richardson, and A. Huq, “Structural transition of ferromagnetic
Ni2MnGa nanoparticles,” J. Appl. Phys., vol. 101, no. 6, p. 063530, Mar. 2007.
[13] B. Tian, F. Chen, Y. Liu, and Y. F. Zheng, “Structural transition and atomic ordering of
Ni49.8Mn28.5Ga21.7 ferromagnetic shape memory alloy powders prepared by ball
milling,” Mater. Lett., vol. 62, no. 17–18, pp. 2851–2854, Jun. 2008.
[14] Y. V. B. de Santanna, M. A. C. de Melo, I. A. Santos, A. A. Coelho, S. Gama, and L. F.
Cótica, “Structural, microstructural and magnetocaloric investigations in high-energy ball
milled Ni2.18Mn0.82Ga powders,” Solid State Commun., vol. 148, no. 7, pp. 289–292,
Nov. 2008.
[15] K. V. Peruman, R. Chokkalingam, and M. Mahendran, “Annealing effect on phase
transformation in nano structured Ni–Mn–Ga ferromagnetic shape memory alloy,” Phase
Transit., vol. 83, no. 7, pp. 509–517, Jul. 2010.
[16] A. L. Alves, E. C. Passamani, V. P. Nascimento, A. Y. Takeuchi, and C. Larica,
“Influence of grain refinement and induced crystal defects on the magnetic properties of Ni
50 Mn 36 Sn 14 Heusler alloy,” J. Phys. Appl. Phys., vol. 43, no. 34, p. 345001, 2010.
[17] A. Ghotbi Varzaneh, P. Kameli, V. R. Zahedi, F. Karimzadeh, and H. Salamati, “Effect
of heat treatment on martensitic transformation of Ni47Mn40Sn13 ferromagnetic shape
memory alloy prepared by mechanical alloying,” Met. Mater. Int., vol. 21, no. 4, pp. 758–
764, Jul. 2015.
[18] V. Sánchez-Alarcos, V. Recarte, J.I. Pérez-Landazábal, S. Larumbe, R. Caballero-
Flores, I. Unzueta, J.A. García, F. Plazaola, J.A. Rodríguez-Velamazán, “Mechanically
induced disorder and crystallization process in Ni-Mn-In ball-milled alloys,” J. Alloys
Compd., vol. 689, pp. 983–991, Dec. 2016.
[19] J. Rodríguez-Carvajal, “Recent advances in magnetic structure determination by
neutron powder diffraction,” Phys. B Condens. Matter, vol. 192, no. 1, pp. 55–69, Oct.
1993.
[20] B. Lu and J. Liu, “Elastocaloric effect and superelastic stability in Ni–Mn–In–Co
polycrystalline Heusler alloys: hysteresis and strain-rate effects,” Sci. Rep., vol. 7, no. 1,
Dec. 2017.
[21] B. Tian, F. Chen, Y.X. Tong, L. Li, Y.F. Zheng, Y. Liu, and Q.Z. Li, “Phase transition
of Ni–Mn–Ga alloy powders prepared by vibration ball milling,” J. Alloys Compd., vol.
509, no. 13, pp. 4563–4568, Mar. 2011.
Chapter 6
166
[22] E. Sakher, N. Loudjani, M. Benchiheub, and M. Bououdina, “Influence of Milling Time
on Structural and Microstructural Parameters of Ni50Ti50 Prepared by Mechanical
Alloying Using Rietveld Analysis,” J. Nanomater., p. 2560641, 2018.
[23] O. Güler, T. Varol, Ü. Alver, and A. Çanakçı, “The effect of flake-like morphology on
the coating properties of silver coated copper particles fabricated by electroless plating,” J.
Alloys Compd., vol. 782, pp. 679–688, Apr. 2019.
[24] S. S. Razavi-Tousi and J. A. Szpunar, “Effect of ball size on steady state of aluminum
powder and efficiency of impacts during milling,” Powder Technol., vol. 284, pp. 149–158,
Nov. 2015.
[25] B. Tian, Y. X. Tong, F. Chen, L. Li, and Y. F. Zheng, “Effect of aging and ball milling
on the phase transformation of Ni50Mn25Ga17Cu8−xZrx alloys,” Intermetallics, vol. 58,
pp. 56–61, Mar. 2015.
[26] H. S. Akkera, I. Singh, and D. Kaur, “Martensitic phase transformation of magnetron
sputtered nanostructured Ni–Mn–In ferromagnetic shape memory alloy thin films,” J.
Alloys Compd., vol. 642, pp. 53–62, Sep. 2015.
[27] V. Recarte, J. Pérez-Landazábal, V. Sánchez-Alarcos, and J. A. Rodriguez-Velamazán,
“Dependence of the martensitic transformation and magnetic transition on the atomic order
in Ni–Mn–In metamagnetic shape memory alloys,” Acta Mater., vol. 60, pp. 1937–1945,
Mar. 2012.
[28] V. Sánchez-Alarcos, V. Recarte, J. I. Pérez-Landazábal, C. Gómez-Polo, and J. A.
Rodríguez-Velamazán, “Role of magnetism on the martensitic transformation in Ni–Mn-
based magnetic shape memory alloys,” Acta Mater., vol. 60, no. 2, pp. 459–468, Jan. 2012.
[29] V. Sánchez-Alarcos, V. Recarte, J. I. Pérez-Landazábal, E. Cesari, and J. A. Rodríguez-
Velamazán, “Long-Range Atomic Order and Entropy Change at the Martensitic
Transformation in a Ni-Mn-In-Co Metamagnetic Shape Memory Alloy,” Entropy, vol. 16,
no. 5, pp. 2756–2767, May 2014.
[30] V. Sánchez-Alarcos, J. I. Pérez-Landazábal, V. Recarte, I. Lucia, J. Vélez, and J. A.
Rodríguez-Velamazán, “Effect of high-temperature quenching on the magnetostructural
transformations and the long-range atomic order of Ni–Mn–Sn and Ni–Mn–Sb
metamagnetic shape memory alloys,” Acta Mater., vol. 61, no. 12, pp. 4676–4682, Jul.
2013.
[31] V. Sánchez-Alarcos, V. Recarte, J. I. Pérez-Landazábal, E. Cesari, and J. A. Rodríguez-
Velamazán, “Long-Range Atomic Order and Entropy Change at the Martensitic
Transformation in a Ni-Mn-In-Co Metamagnetic Shape Memory Alloy,” Entropy, vol. 16,
no. 5, pp. 2756–2767, May 2014.
167
Chapter 7. Summary and conclusions
In the so-called metamagnetic shape memory alloys the fact that the martensitic
transformation takes place between a ferromagnetic austenite and a weakly magnetic
martensitic phase gives rise to multifunctional properties of great technical interest for practical
applications, like sensing or magnetic refrigeration. Despite many topics as the compositional
dependence and the effect of the atomic order on the magnetostructural properties have been
deeply analyzed in several previous works, the role of the microstructure, in turn, has been less
investigated, in spite of its potential for tuning the magnetostructural properties of these
systems.
In this work we have focused on the study of the influence of the microstructure in
metamagnetic shape memory alloys (Ni-Mn-In and Ni-Mn-Sn systems) together with the effect
of Co-doping, in order to gain insight into these effects and to control and improve the properties
of these materials. In order to modify their microstructure in a controlled way, the samples were
subjected to thermo-mechanical treatments (hand milling, ball milling, and thermal annealing
at different temperatures). The alloys have been characterized macroscopically by calorimetric
and magnetic measurements, and studied at the microscopic level mainly through X-ray and
neutron diffraction, which provided us information about the crystal structures, the atomic order
in the alloys, the microstructural parameters as grain size and internal strains, and the magnetic
structures. The combination of the results obtained in the microscopic study with the
calorimetric and magnetic macroscopic characterization allowed us to gain a better
understanding of the role of the microstructure and cobalt doping in the magnetostructural
properties of these metamagnetic shape memory alloys and identify routes to obtain improved
functional properties.
As main conclusions of the obtained results we can summarize.
- First, the effect of the microstructure on the martensitic transformation and the related
magnetostructural properties was studied in Ni-Mn-Sn alloys. The study was carried out
macroscopically with calorimetric and magnetic measurements and microscopically by
X-rays and neutron diffraction and by Mössbauer spectroscopy in a milled Ni50Mn35Sn15
alloy annealed at different temperatures. The conclusions drawn are:
Macroscopic measurements have evidenced the null variation in the martensitic
transformation temperature with different annealing treatments, although the
temperature range in which this structural transition takes place is reduced as the
annealing temperature increases. The enthalpy and entropy values associated to the
martensitic transformation point out that the martensitic transformation,
significantly affected by milling, is mainly recovered after the treatment at the
Chapter 7
168
lowest temperature. Moreover, the variation in the magnetocaloric effect manifests
the outstanding influence of the microstructure on the functional properties of the
alloy.
By X-ray diffraction, the evolution of the microstructural parameters as grain size
and internal strains has been analyzed as a function of the annealing temperatures.
The amount of the non-magnetic inclusions was quantified and related with the
internal strains by means of a combination of the magnetic measurements and the
microstructural analysis, showing a reduction of a factor more than 10 by annealing,
together with an associated increase of the saturation magnetization.
The null variation in the atomic order obtained by powder neutron diffraction is
consistent with the absence of change in the temperatures of the martensitic
transformation, proving the high stability of the atomic order of the Ni-Mn-Sn
alloys. The crystal structure of the martensite phase was resolved as a two-fold
modulated orthorhombic structure. On the other hand, the magnetic structure of
austenite reveals the switch of the magnetic coupling of Mn atoms from
antiferromagnetic to ferromagnetic induced by the recovery of the microstructure
induced by the annealing.
Mössbauer spectroscopy has been used for the analysis of the magnetism at the
atomic level and was related with the internal strains, demonstrating the importance
of the microstructure in the hyperfine field, which is reduced with the increment of
the internal strains, and pointing out the usefulness of this technique in the analysis
of the microstructure.
- Doping with Co has proved to be a way to increase the metamagnetic character of the
martensitic transformation in ternary systems. Then, the next step was the study of the
influence of mechanically-induced defects on the magnetostructural properties in non-
stoichiometric Ni45Co5Mn35Sn15 alloy in milled and post-annealed state. In a further
stage, systematic high-energy ball-milling was performed and the samples analyzed by
calorimetry, magnetometry and high-energy X-ray diffraction.
The long-range atomic order was determined in as-milled and annealed samples by
Rietveld refinement of neutron powder diffractograms showing the non-variation
in the atomic occupancies between both states and the presence of Co mainly in 8c
sites. Those results are in good agreement with the observed by calorimetric and
magnetic measurements where the martensitic transformation and Curie
temperatures remain constant in both specimens.
The magnetic structure of austenite in both samples shows a ferromagnetic coupling
between Mn atoms located in 4a and 4b sites due to the presence of Co atoms in 8c
sites sharing occupancy with Ni. The presence of Co in these sites increases the
magnetic interaction between Mn atoms, producing an increment of the
Summary and conclusions
169
ferromagnetism in this phase. On the other hand, the annealing treatment increases
slightly the saturation magnetization of austenite, due to the recovery of defects.
Regarding the martensitic structure, both the as-milled and annealed samples
present the same three-layered modulated monoclinic crystal structure with space
group P2/m and antiferromagnetic coupling between Mn atoms. The annealed alloy
presents weaker antiferromagnetic coupling, which explains the increase of the
saturation magnetization in martensite that reduces the change of magnetization
linked to the martensitic transformation. This fact implies that the as-milled alloy,
with higher density of defects, presents higher magnetocaloric effect. Thus, the
inclusion of a small amount of defects can improve the magnetocaloric properties
on the alloy, due to the variation in the magnetism of the martensite.
High resolution X-rays diffraction shows how the microstructural parameters are
modified with the increase of the milling time: the grain size becomes smaller and
the internal strains increase. We can also observe a degradation to an amorphous
state, together with the induction of a secondary phase during milling identified as
a monoclinic I2/m martensite. Moreover, the magnetic structure of the austenite in
the alloys milled 45 minutes was calculated, determining a progressive reduction on
the magnetic moment and although the ferromagnetic character of the magnetic
coupling is maintained.
SEM and TEM where carried out in order to obtain more information about the
evolution of the microstructure. TEM was performed in a single particle in the
samples that present martensitic transformation, showing how the diffraction
evolves from patterns characteristic of single-crystals to patterns characteristic of
powders, revealing the reduction of the grain size inside the particles.
- In order to get further insight into the influence of Co doping on the magnetic coupling,
the macroscopic magnetic properties, together with the atomic order and magnetic
structure in austenite phase were analyzed in non-stoichiometric Ni50Mn36In14 and Ni45-
Co5Mn37In13 alloys with two different thermal treatments: water quenched and slow
cooled from 1173 K. The combination of macroscopic magnetic measurements with
unpolarized powder and single-crystal neutron diffraction and polarized single-crystal
neutron diffraction allows drawing the following conclusions:
The variation in the thermal treatment and Co-doping modify the atomic order and
as consequence the martensitic transformation and Curie temperatures. In the case
of the slow cooled alloys the TC shifts to higher temperatures with respect to the
water quenched samples, while the martensitic transformation moves to lower
temperatures. On the other hand, Co doping produces an increment in both transition
temperatures. An increase of 60% in the saturation magnetization of the austenite
phase can be reached by the combination of Co doping and slow cooling treatment.
Chapter 7
170
The higher degree of atomic order, together with the reduction of strains and defects
induced by slow cooling thermal treatments produces an increase in the total ordered
magnetic moment and a slight enhancement of the ferromagnetic coupling between
the magnetic moments located in octahedral sites, while cobalt doping has a stronger
effect in increasing the ferromagnetic coupling, which explains the noticeable effect
in the magnetization.
By spin density maps obtained from polarized neutron diffraction, the magnetic
interaction responsible for this coupling was obtained. Despite the weak interaction
of the moments in 8c sites with the rest of the magnetic moments, Co, that mainly
replaces Ni in 8c positions, tends to couple ferromagnetically with its nearest
neighbors in 4a and 4b sites, where the magnetic atoms are mainly Mn, which in
turn are coupled by strong interactions, favoring the overall ferromagnetic coupling.
- Finally, the recrystallization process was studied in Ni-Mn-Sn-Co and Ni-Mn-In-Co
alloys subjected to high-energy ball-milling during two hours in austenite and
martensite, respectively. The evolution of the microstructure during the recrystallization
was deduced from the analysis of parameters as grain size and internal strains from ‘in-
situ’ neutron powder diffraction.
The average particle size was obtained in both alloys in as-milled states, giving
values of ~100 μm. The morphology of the obtained powder changes from
polyhedral in the SnCo alloy to flake-like shape in the InCo one, which is related
with the fact that the second alloy was milled in martensitic phase.
Powder neutron diffractograms in the as-milled state present few reflections,
indicating that, together with a prevailing amorphous phase, the alloys retain some
degree of crystallinity after milling. The amount of amorphous phase in the as-
milled state was estimated by modelling it by a disordered A2 phase, giving values
close to 64% and 78% for Ni-Mn-Sn-Co and Ni-Mn-In-Co alloys, respectively.
Differential scanning calorimetry shows that the crystallization process occurs
between 400 K and 700 K. Neutron powder diffraction experiments have shown that
both samples undergo a first crystallization at 500 K from an amorphous state to a
B2 structure. Besides, at 700 K the appearance of (111) reflection indicates the B2-
L21 transition. This structure remains stable up to 1200 K in SnCo alloy,
corroborating the high stability of this ordered structure in Sn-based systems. In
contrast, in InCo a L21-B2 order-disorder transition is observed at 850 K.
The evolution during the recrystallization of microstructural parameters was
obtained from the refinement of the diffraction patterns measured during the
recrystallization. The evolution of the cell parameter of the austenite, in both
Summary and conclusions
171
systems, was also determined during the crystallization process showing a deviation
from linearity in its dependence at temperatures coinciding with the B2-L21
transition. Finally, the grain size determined by TEM micrography is in agreement
with the values obtained from Rietveld refinement, corroborating the
polycrystalline structure of the particles after the recrystallization process.

172
List of papers published by the author
173
List of papers published by the author
The work developed during this thesis has led to the publication of the following papers in
international peer-reviewed journals:
- I. Unzueta, J. López-García, V. Sánchez-Alarcos, V. Recarte, J. I. Pérez-Landazábal, J.
A. Rodríguez-Velamazán, J. S. Garitaonandia, J. A. García, F. Plazaola, “119Sn
Mösbauer spectroscopy for assessing the local stress and defect state towards the tuning
of Ni-Mn-Sn alloys” Applied Physics Letters 110 (2017) 181908.
- J. López-García, I. Unzueta, V. Sánchez-Alarcos, V. Recarte, J. I. Pérez-Landazábal,
J.A. Rodríguez-Velamazán, J. A. García, F. Plazaola, “Correlation between defects and
magneto-structural properties in Ni-Mn-Sn metamagnetic shape memory alloys”
Intermetallics 94 (2018) 133-137.
- I. Unzueta, J. López-García, V. Sánchez-Alarcos, V. Recarte, J. I. Pérez-Landazábal, J.
A. Rodríguez-Velamazán, J. S. Garitaonandia, J. A. García, F. Plazaola, “119Sn
Mösbauer spectroscopy in the study of metamagnetic shape memory alloys” Hyperfine
Interactions 239 (2018) 34.
- V. Sánchez-Alarcos, J. López-García, I. Unzueta, J. I. Pérez-Landazábal, V. Recarte, J.
J. Beato-López, J. A. García, F. Plazaola, J. A. Rodríguez-Velamazán, “Magnetocaloric
effect enhancement dirven by intrinsic defects in a Ni45Co5Mn35Sn15 alloy” Journal of
Alloys and Compounds 774 (2019) 586-592.
- J. López-García, V. Sánchez-Alarcos, V. Recarte, J. I. Pérez-Landazábal, O. Fabelo, E.
Cesari, J. A. Rodríguez-Velamazán, “Routes for enhanced magnetism in Ni-Mn-In
metamagnetic shape memory alloys” Scripta Materialia 167 (2019) 21-25.

174


![Premium Catalogue...PREMIUM CONNECTIONS CATALOGUE INTRODUCTION TenarisHydril SMYS [ksi] MARTENSITIC MODIFIED MARTENSITIC SUPER MARTENSITIC TN 80Cr13 TN 85Cr13 Martensitic Stainless](https://img.pdfslide.us/doc/110x75/6017b8e739d10b0116239e29/premium-catalogue-premium-connections-catalogue-introduction-tenarishydril-smys.jpg)