Embed Size (px)
Citation preview
VIII International Conference on Fracture Mechanics of Concrete and Concrete Structures
FraMCoS-8
J.G.M. Van Mier, G. Ruiz, C. Andrade, R.C. Yu and X.X. Zhang (Eds)
INFLUENCE OF LOADING RATE ON THE FRACTURE BEHAVIOUR OF
STEEL FIBER-REINFORCED CONCRETE
X. X. ZHANG*, A. M. ABD ELAZIM* G. RUIZ*, H.M. SALLAM¤ and Z. CHANG
†
* Universidad de Castilla-La Mancha (UCLM)
ETS de Ingenieros de Caminos, Canales y Puertos
Avda. Camilo José Cela s/n, 13071 Ciudad Real, Spain Email: [email protected] - Web page: http://www.uclm.es
¤Jazan Univsity
Civil Engineering Department Jazan 706, Kingdom of Saudi Arabia
E-mail: [email protected]
† Harbin Engineering University (HEU) College of Aerospace and Civil Engineering
150001 Harbin, China Email: [email protected] - Web page: http://www.hrbeu.edu.cn
Key words: Steel Fiber-Reinforced Concrete, Loading rates, Drop-weight impact machine,
Fracture energy
Abstract: Three-point bending tests on notched beams of steel fiber-reinforced concrete (SFRC)
have been conducted using both a servo-hydraulic machine and a self-designed drop-weight impact
device. The shape and geometry of the specimen followed the RILEM recommendation, i.e., 150
mm × 150 mm in cross section, 700 mm in length, notch-depth ratio was around 1/6 and span was
kept constant 500 mm. The peak load and the fracture energy were measured over a wide range of
loading rates (loading point displacement rates), spanning six orders of magnitude. Under low
loading rates, from 10-3
mm/s to 100 mm/s, the tests were performed with the servo-hydraulic
machine; from 102 mm/s to 10
3 mm/s, the drop-weight impact machine was used instead. The
results show that the fracture energy and the peak load increase as the loading rate increases.
Furthermore, such a trend is relatively mild under low rates. The gain of the fracture energy and
peak load is around 10% compared with its quasi-static values. However, under high rates the
increases in the fracture energy and the peak load are pronounced due to the inertia effect. The
dynamic increase factor of the peak load and the fracture energy is approximately 3.5 and 2.5, respectively.
1 INTRODUCTION
Steel fiber-reinforced concrete (SFRC) is
concrete made of hydraulic cements
containing fine or fine and coarse aggregate
and discontinuous discrete steel fibers [1].
Addition of randomly distributed steel fibers
improves concrete properties, such as static
flexural strength, ductility and flexural
toughness. Some examples of structural and
nonstructural uses of SFRC are hydraulic
structures, airport and highway paving and
overlays, industrial floors, refractory concrete,
bridge decks, shotcrete linings and coverings,
and thin-shell structures [2].
X. X. Zhang, A. M. Abd elazim , G. Ruiz, H.M. Sallam and Z. Chang
2
Besides bearing quasi-static loads, many
concrete structures are subjected to short
duration loads. Such as the impacts from
missiles and projectiles, wind gusts,
earthquakes, and machine dynamics. Several
techniques have been developed to study the
dynamic fracture behaviour of concrete and
concrete structures, like modified Charpy
impact test, Split Hopkinson pressure bar test,
drop-weight impact test and explosive test [3,
4].
Many researchers have shown that the
impact resistance can be increased
substantially with the addition of randomly
distributed steel fibers to concretes. For
instance, Namman and Gopalaratnam [5] have
used a drop-weight impact machine and an
Instron universal machine to study the bending
properties of steel fiber-reinforced mortar
beams at four different loading rates, 4.23 ×
10-4
mm/s, 8.46 mm/s, 7.0 × 102 mm/s and 1.0
× 103 mm/s, respectively. The dimension of
the beam was 12.5 mm × 75 mm × 300 mm
(width × depth × length) and the span was 254
mm during the tests. Three volume fractions of
fibers (1%, 2% and 3%), three fiber aspect
ratios (47, 62 and 100) were adopted. The
results showed that depending on the fiber
reinforcing parameters the energy absorbed by
the composite at static loading rates can be one
to two orders of magnitude higher than that of
the unreinforced matrix. Moreover, up to a
three times increase was observed in the
modulus of rupture and the energy absorbed
by the composite when the loading rate
increases from 4.23 × 10⁻⁴
mm/s to 1.0 × 10³
mm/s. The similar tendency was also obtained by Gopalaratnam and Shah [6].
Banthia [7] has adopted a drop-weight
impact machine to conduct dynamic tests on
steel fiber-reinforced high-strength concrete
beams at loading rate around 4 m/s, the
specimen was 100 mm in width, 125 mm in
depth and 1200 mm in length over a span 960
mm. The peak bending load and fracture
energy got 498% and 640% increases,
respectively, compared with their quasi-static
values. Later, a modified Charpy impact
machine was designed to test concrete and
SFRC in uniaxial tension [8]. The results
showed that under impact, the higher strength
of the matrix, the less effective the fibers in improving fracture energy absorption.
ACI Committee 544 [3], has proposed
another type of drop-weight impact test for
evaluating the impact resistance of fiber-
reinforced concrete (FRC), i.e., a hammer is
dropped repeatedly to impact a disc specimen,
and the number of blows required to cause the
first visible crack on the top and to cause
ultimate failure are both recorded. This
method is designed to obtain relative
performance of plain concrete and FRC.
Natraja et al. [9] analyzed the statistical
variation of impact resistance of SFRC under
this type of repeated drop impact condition.
The disc samples were 150 mm in diameter
and 64 mm in thickness and containing 0.5%
volume fraction of round crimped steel fibers
with 0.5 mm in diameter and 55 in aspect ratio.
The observed coefficients of variation were 57%
and 46% for the first crack resistance and
ultimate resistance, respectively.
Most studies as cited above were
concentrated on the unnotched specimens,
unlike notched samples, for them, the crack is
located close to the notch plane and the
nonlinear deformation is negligible in the rest
of the specimen. Thus, in 2002, the final
recommendation for the bending test for SFRC
was presented by the RILEM TC 162-TDF
Committee, which improves several aspects of
other standards [10]. The test is conducted on
notched beams (150 mm × 150 mm in cross
section) with central point loading. One of the
greater advantages of such configuration is
that it guarantees the stability during the test
even for FRC with low fiber contents. In 2005,
a similar method was also proposed by EN
14651 standard, two years later, an updated version was available [11].
In order to get additional insights into the
loading rate effect on the fracture properties of
SFRC, in this paper we present three-point
bending tests of notched specimen conducted
at a wide range of loading point displacement
rates (for simplicity, it is substituted by
loading rates), from 10-3
mm/s to 103 mm/s,
X. X. Zhang, A. M. Abd elazim , G. Ruiz, H.M. Sallam and Z. Chang
3
using both a servo-hydraulic testing machine
and a drop-weight impact instrument. The
shape and geometry of the specimen follow RILEM recommendations [10].
The results show that the fracture energy
and the peak load increase as the loading rate
increases. Moreover, such a trend is relatively
mild under low rates. While it is pronounced
under high loading rates due to the inertia effect.
The rest of this paper is structured as
follows: the experimental procedure is given in
Section 2, in Section 3 the results are
presented and discussed. Finally, relevant conclusions are drawn in Section 4.
2 EXPERIMENTAL PROCEDURE
2.1 Material characterization
A single type of SFRC was used throughout
the experiments, made with a siliceous
aggregate of 12 mm in maximum size and
ASTM type II cement, 42.5R. Two types of
super plasticizer (Glenium ACE-325, Glenium
B-255) were used in the concrete composition.
The mixing proportions by weight were shown
in 1: 0.29: 0.1: 0.048: 1.6: 1.2: 0.0066: 0.021
(cement: water: limestone filler: silica fume:
sand: coarse aggregate: nanosilica:
superplasticizer). 64.5 kg/m3 of steel fiber
were added as the reinforcement. The steel
fiber used was hooked-end with 50 mm in
length, 0.75 mm in diameter and 67 in aspect ratio, it has a tensile strength 1900 MPa.
Compressive tests were carried out at an
age of 65 days, following ASTM C39 (which
is analogous to EN 12390-3), cylinders of 150
× 300 mm (diameter × height) were used. To
perform the compressive tests, a Servo-
hydraulic testing machine was adopted. Values
of characteristic parameters: the compressive
strength (fc), the elastic modulus (E) and the
Poisson’s ratio (ν) are listed in Table 1.
Table 1: Properties of the SFRC at an age of 65 days
fc
(MPa)
E
(GPa)
ν ρ
(kg/m3)
Mean 92.1 35.1 0.18 2438
Standard
deviation 5 1 0.01 17
2.2 Three-point bending tests
To study the mechanical properties of the
SFRC prisms, three-point bending tests were
conducted on notched beams over a wide
loading rate range from 10-3
to 103 mm/s. Two
testing machines were adopted to carry out the
tests, one was a servo-hydraulic testing
machine, and the other was a self-designed drop-weight impact instrument.
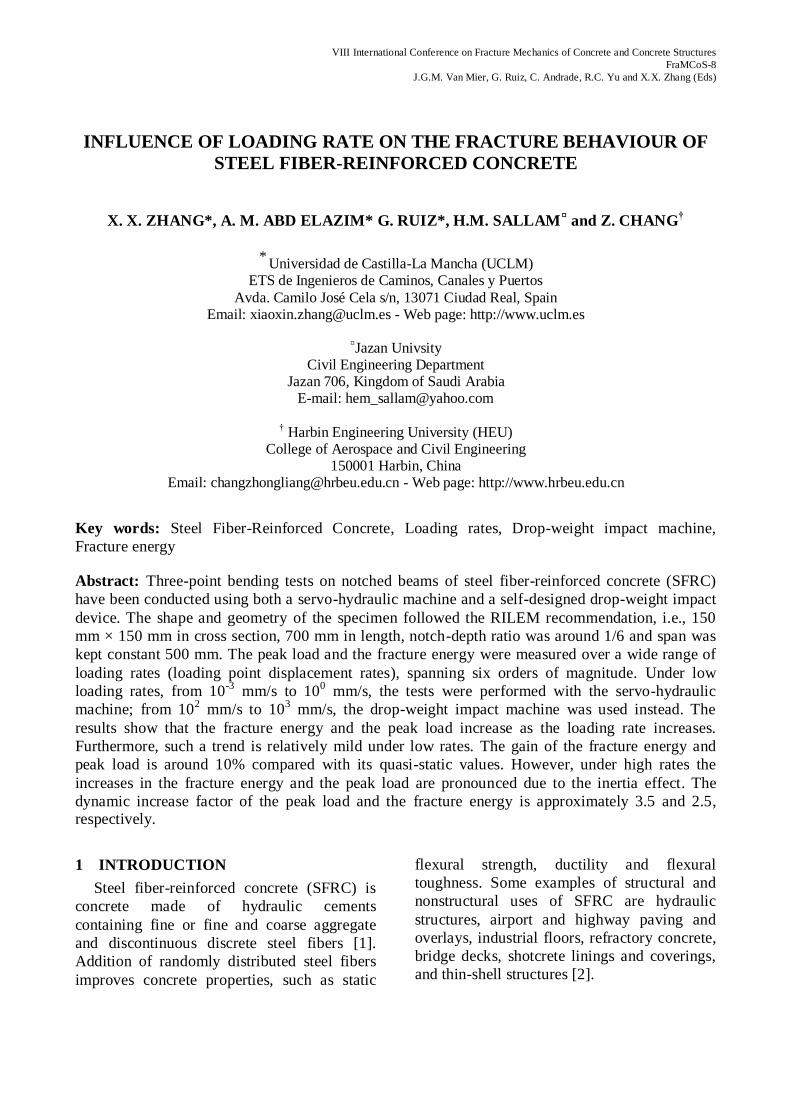
The dimensions of the test beams were
150×150 (B×D) mm in cross-section, and 700
mm in total length (L). The initial notch-depth
ratio (a/D) was approximately 1/6, and the
span (S) was fixed at 500 mm during the tests, see Figure 1.
Figure 1: Schematic diagram of the specimen.
2.2.1 Tests under low loading rates 10-3
to
100 mm s
-1
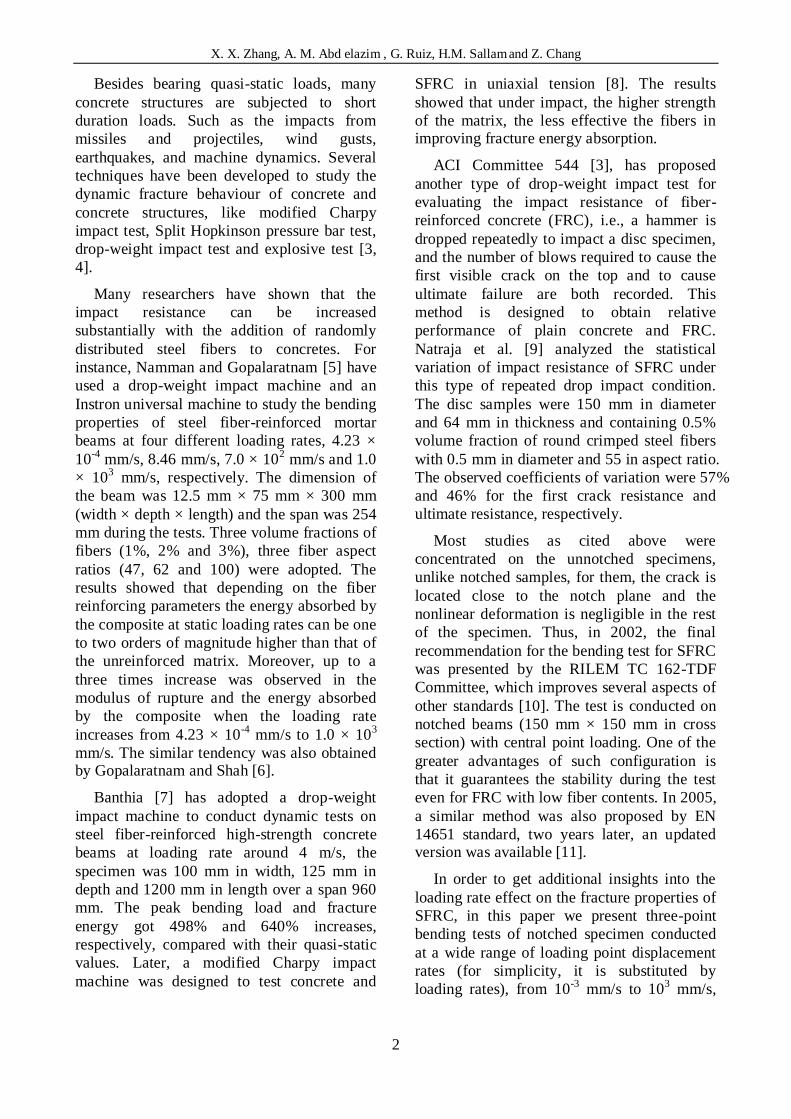
Within this low loading rate range, the tests
were performed using the servo-hydraulic
testing machine under position control coupled
to a robust frame in the Laboratory of
Materials and Structures of the Civil
Engineering School of the University of
Castilla-La Mancha in Ciudad Real as shown
in Figure 2. The alignment of the supports and
the loading line was checked when installing
each specimen. One of the supports was fixed,
whereas the other was free to rotate around the axis of the frame.
Force
X. X. Zhang, A. M. Abd elazim , G. Ruiz, H.M. Sallam and Z. Chang
4
Three loading rates, from quasi-static level
(3.33×10⁻³
mm s-1
) to rate dependent levels
(0.1 mm/s and 3.33 mm/s), were applied. Six
specimens were tested at each loading rate.
(a)
(b)
Figure 2: (a) Schematic diagram and (b) photo of the
experimental set-up of the servo-hydraulic testing
machine.
2.2.2 Tests under loading rates from 102 to
103 mm/s
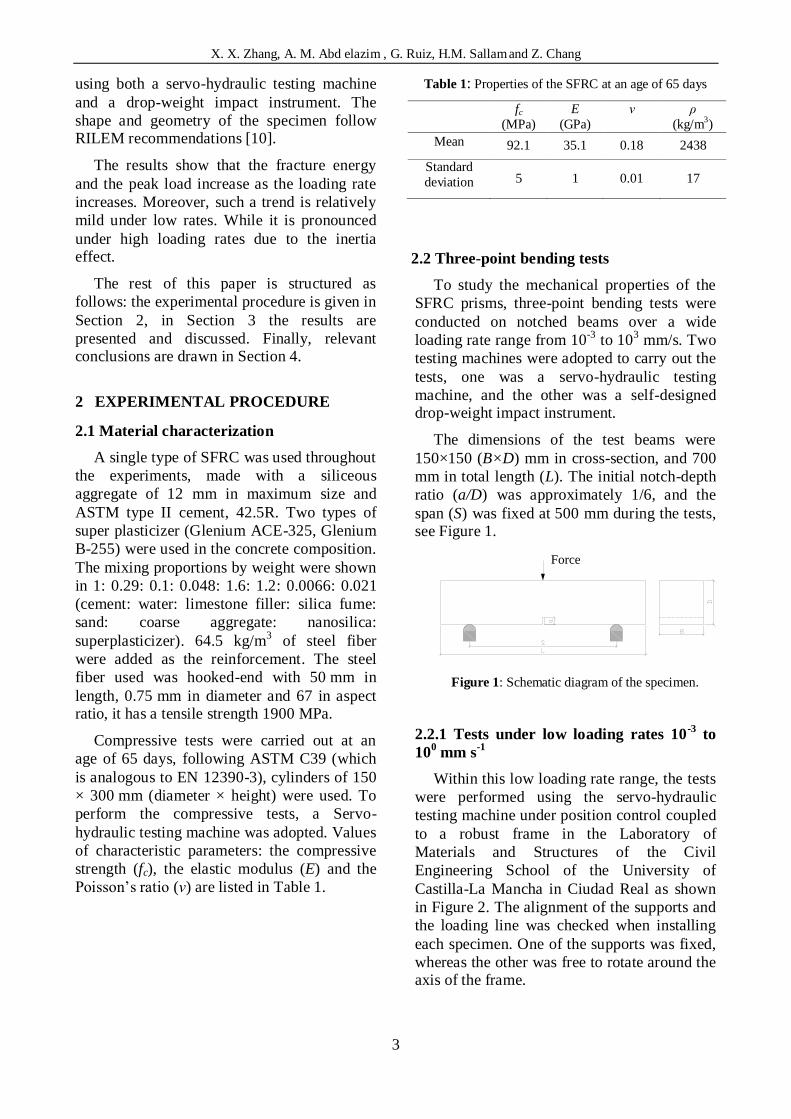
In this high loading-rate range, all tests
were conducted using the instrumented, drop-
weight impact apparatus as shown in Figure 3.
It has the capacity to drop a 316 kg mass from
heights of up to 2.6 m, and can accommodate
flexural specimens with spans of up to
approximately 1.6 m. In this study, an impact
hammer weighing 120.6 kg was employed and
three-drop heights adopted were 40, 160 and
360 mm. The corresponding impact velocities
were 8.81×10²
mm/s, 1.77×103 mm/s and 2.66
×103 mm/s, respectively. Six specimens were
tested at each impact speed. A detailed
description of the instrument is given in
references [4, 12].
The impact force between the hammer tup
and the specimen is measured by a
piezoelectric force sensor. Moreover, the
reaction force is determined by two force
sensors located between the supports and the
specimen. An accelerometer bonded to the
impact hammer was used to measure
acceleration and displacement during the impact process.
(a)
(b)
Figure 3: (a) Schematic diagram and (b) photo of
the drop-weight impact machine.
MACHINE
CONTROLS
MAGNETIC
STRIP
COLUMN
ACCELEROMETER
BEAM
TUP
HOIST
MAGNETIC
SENSOR
DATA
ACQUISITION
SYSTEM
HAMMER
OPTICAL FIBER PHOTOELECTRICSENSOR
STEEL BARCOMPUTER
Rolling supportFixed support
Steel beam
Specimen
Loading bar
Profiled beam
Actuator and Load cell
L = 700 mm
Span =
500 mm
Platens
D = 150 mm
Side view Front view
X. X. Zhang, A. M. Abd elazim , G. Ruiz, H.M. Sallam and Z. Chang
5
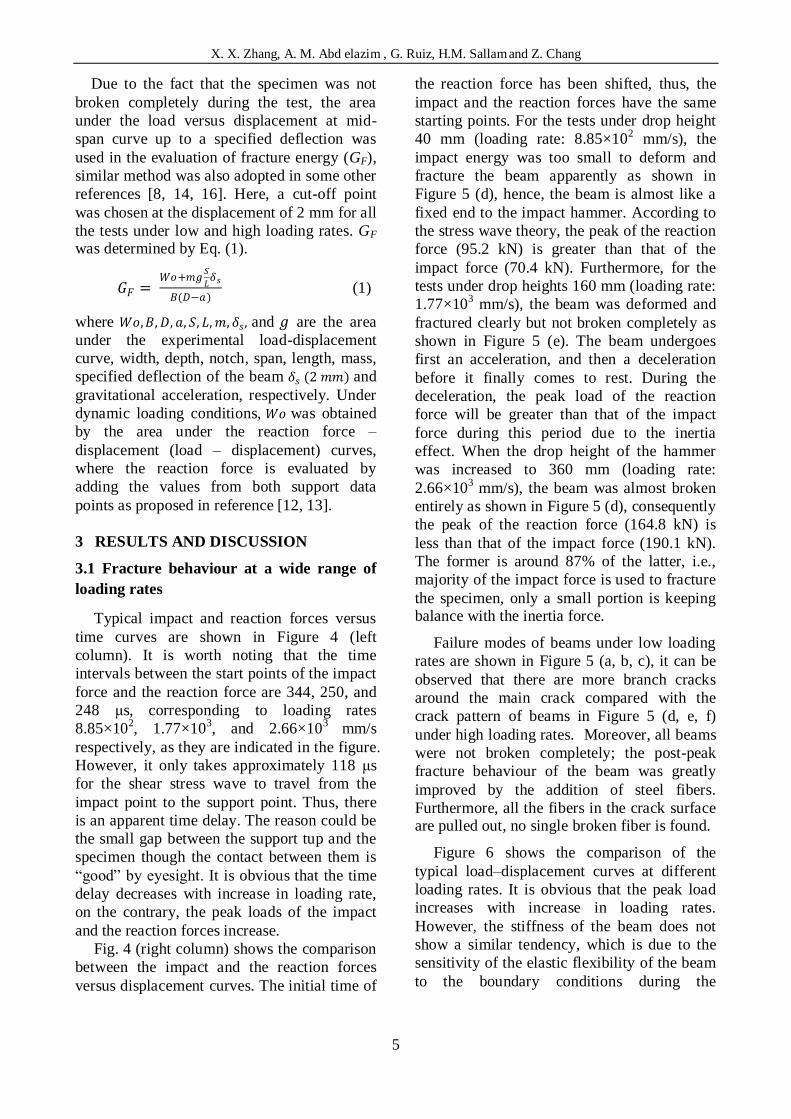
Due to the fact that the specimen was not
broken completely during the test, the area
under the load versus displacement at mid-
span curve up to a specified deflection was
used in the evaluation of fracture energy (GF),
similar method was also adopted in some other
references [8, 14, 16]. Here, a cut-off point
was chosen at the displacement of 2 mm for all
the tests under low and high loading rates. GF
was determined by Eq. (1).
𝐺𝐹 = 𝑊𝑜+𝑚𝑔
𝑆
𝐿𝛿𝑠
𝐵(𝐷−𝑎) (1)
where 𝑊𝑜,𝐵,𝐷, 𝑎, 𝑆, 𝐿,𝑚, 𝛿𝑠, and 𝑔 are the area
under the experimental load-displacement
curve, width, depth, notch, span, length, mass,
specified deflection of the beam 𝛿𝑠 (2 𝑚𝑚) and
gravitational acceleration, respectively. Under
dynamic loading conditions, 𝑊𝑜 was obtained
by the area under the reaction force –
displacement (load – displacement) curves,
where the reaction force is evaluated by
adding the values from both support data
points as proposed in reference [12, 13].
3 RESULTS AND DISCUSSION
3.1 Fracture behaviour at a wide range of
loading rates
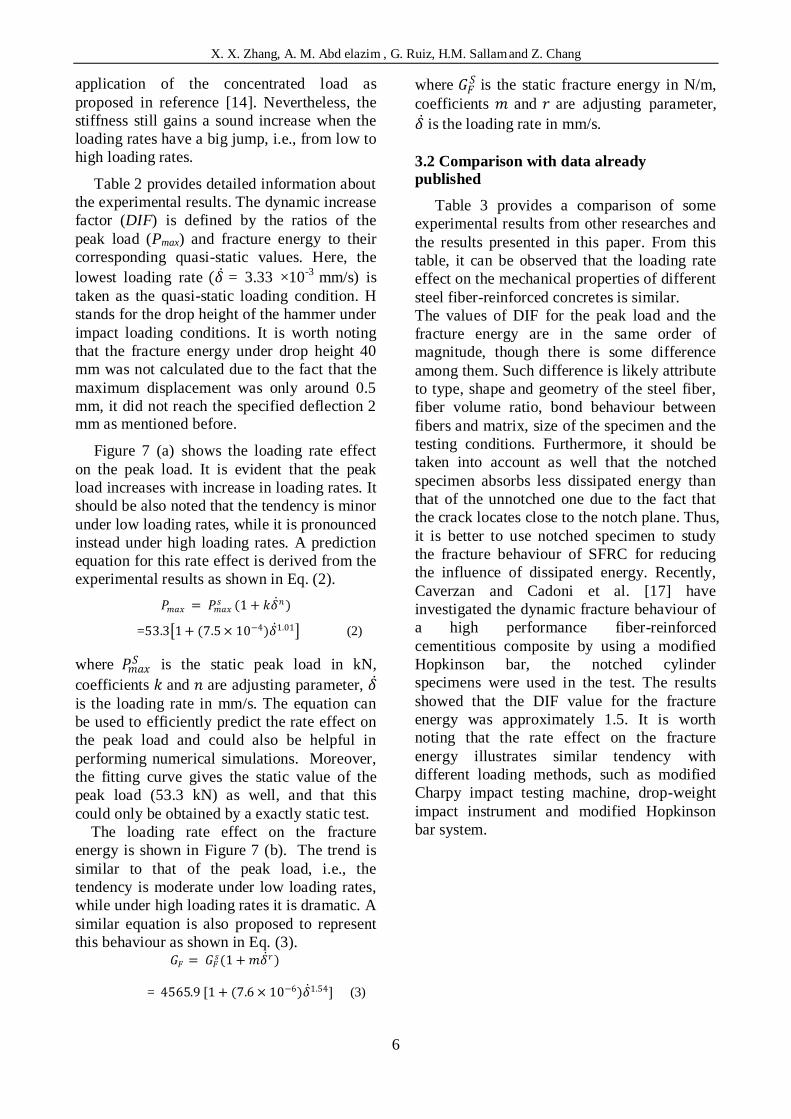
Typical impact and reaction forces versus
time curves are shown in Figure 4 (left
column). It is worth noting that the time
intervals between the start points of the impact
force and the reaction force are 344, 250, and
248 μs, corresponding to loading rates
8.85×10², 1.77×10
3, and 2.66×10
3 mm/s
respectively, as they are indicated in the figure.
However, it only takes approximately 118 μs
for the shear stress wave to travel from the
impact point to the support point. Thus, there
is an apparent time delay. The reason could be
the small gap between the support tup and the
specimen though the contact between them is
“good” by eyesight. It is obvious that the time
delay decreases with increase in loading rate,
on the contrary, the peak loads of the impact
and the reaction forces increase.
Fig. 4 (right column) shows the comparison
between the impact and the reaction forces
versus displacement curves. The initial time of
the reaction force has been shifted, thus, the
impact and the reaction forces have the same
starting points. For the tests under drop height
40 mm (loading rate: 8.85×102 mm/s), the
impact energy was too small to deform and
fracture the beam apparently as shown in
Figure 5 (d), hence, the beam is almost like a
fixed end to the impact hammer. According to
the stress wave theory, the peak of the reaction
force (95.2 kN) is greater than that of the
impact force (70.4 kN). Furthermore, for the
tests under drop heights 160 mm (loading rate:
1.77×103 mm/s), the beam was deformed and
fractured clearly but not broken completely as
shown in Figure 5 (e). The beam undergoes
first an acceleration, and then a deceleration
before it finally comes to rest. During the
deceleration, the peak load of the reaction
force will be greater than that of the impact
force during this period due to the inertia
effect. When the drop height of the hammer
was increased to 360 mm (loading rate:
2.66×103 mm/s), the beam was almost broken
entirely as shown in Figure 5 (d), consequently
the peak of the reaction force (164.8 kN) is
less than that of the impact force (190.1 kN).
The former is around 87% of the latter, i.e.,
majority of the impact force is used to fracture
the specimen, only a small portion is keeping balance with the inertia force.
Failure modes of beams under low loading
rates are shown in Figure 5 (a, b, c), it can be
observed that there are more branch cracks
around the main crack compared with the
crack pattern of beams in Figure 5 (d, e, f)
under high loading rates. Moreover, all beams
were not broken completely; the post-peak
fracture behaviour of the beam was greatly
improved by the addition of steel fibers.
Furthermore, all the fibers in the crack surface are pulled out, no single broken fiber is found.
Figure 6 shows the comparison of the
typical load–displacement curves at different
loading rates. It is obvious that the peak load
increases with increase in loading rates.
However, the stiffness of the beam does not
show a similar tendency, which is due to the
sensitivity of the elastic flexibility of the beam
to the boundary conditions during the
X. X. Zhang, A. M. Abd elazim , G. Ruiz, H.M. Sallam and Z. Chang
6
application of the concentrated load as
proposed in reference [14]. Nevertheless, the
stiffness still gains a sound increase when the
loading rates have a big jump, i.e., from low to
high loading rates.
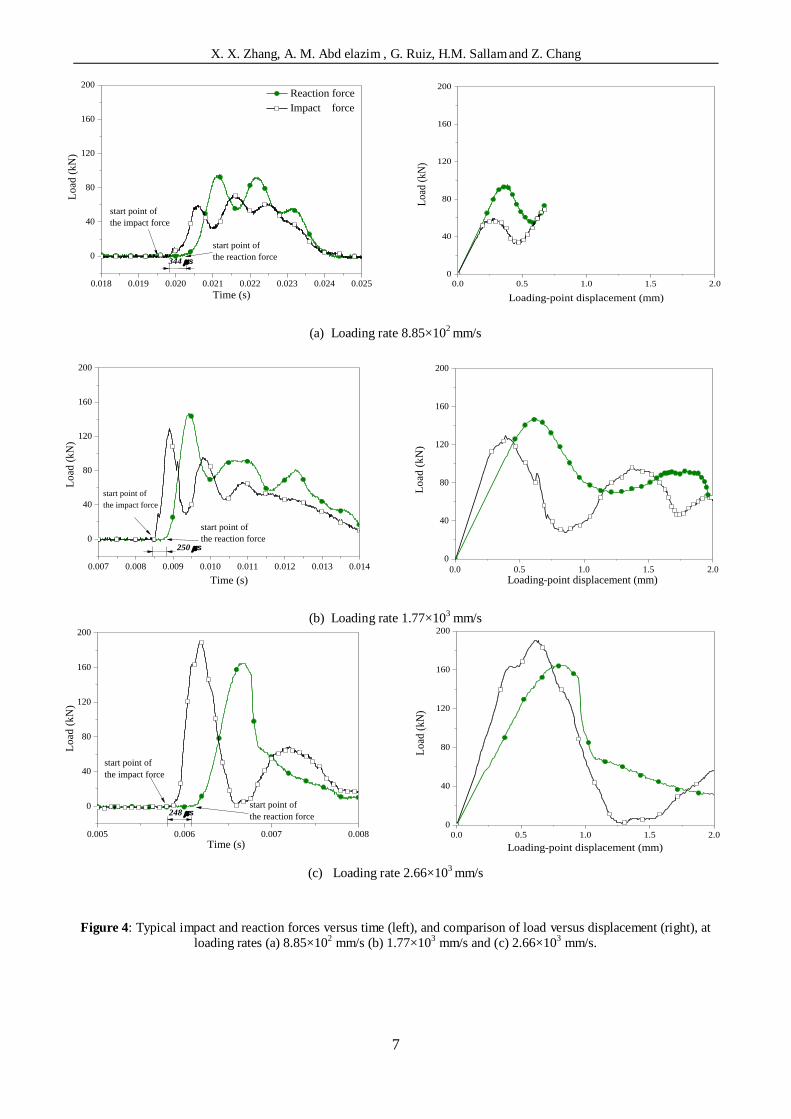
Table 2 provides detailed information about
the experimental results. The dynamic increase
factor (DIF) is defined by the ratios of the
peak load (Pmax) and fracture energy to their
corresponding quasi-static values. Here, the
lowest loading rate (𝛿 = 3.33 ×10⁻³
mm/s) is
taken as the quasi-static loading condition. H
stands for the drop height of the hammer under
impact loading conditions. It is worth noting
that the fracture energy under drop height 40
mm was not calculated due to the fact that the
maximum displacement was only around 0.5
mm, it did not reach the specified deflection 2 mm as mentioned before.
Figure 7 (a) shows the loading rate effect
on the peak load. It is evident that the peak
load increases with increase in loading rates. It
should be also noted that the tendency is minor
under low loading rates, while it is pronounced
instead under high loading rates. A prediction
equation for this rate effect is derived from the
experimental results as shown in Eq. (2).
𝑃𝑚𝑎𝑥 = 𝑃𝑚𝑎𝑥𝑠 (1 + 𝑘𝛿 𝑛)
=53.3 1 + (7.5 × 10⁻⁴)𝛿 1.01 (2)
where 𝑃𝑚𝑎𝑥𝑆 is the static peak load in kN,
coefficients 𝑘 and 𝑛 are adjusting parameter, 𝛿 is the loading rate in mm/s. The equation can
be used to efficiently predict the rate effect on
the peak load and could also be helpful in
performing numerical simulations. Moreover,
the fitting curve gives the static value of the
peak load (53.3 kN) as well, and that this
could only be obtained by a exactly static test.
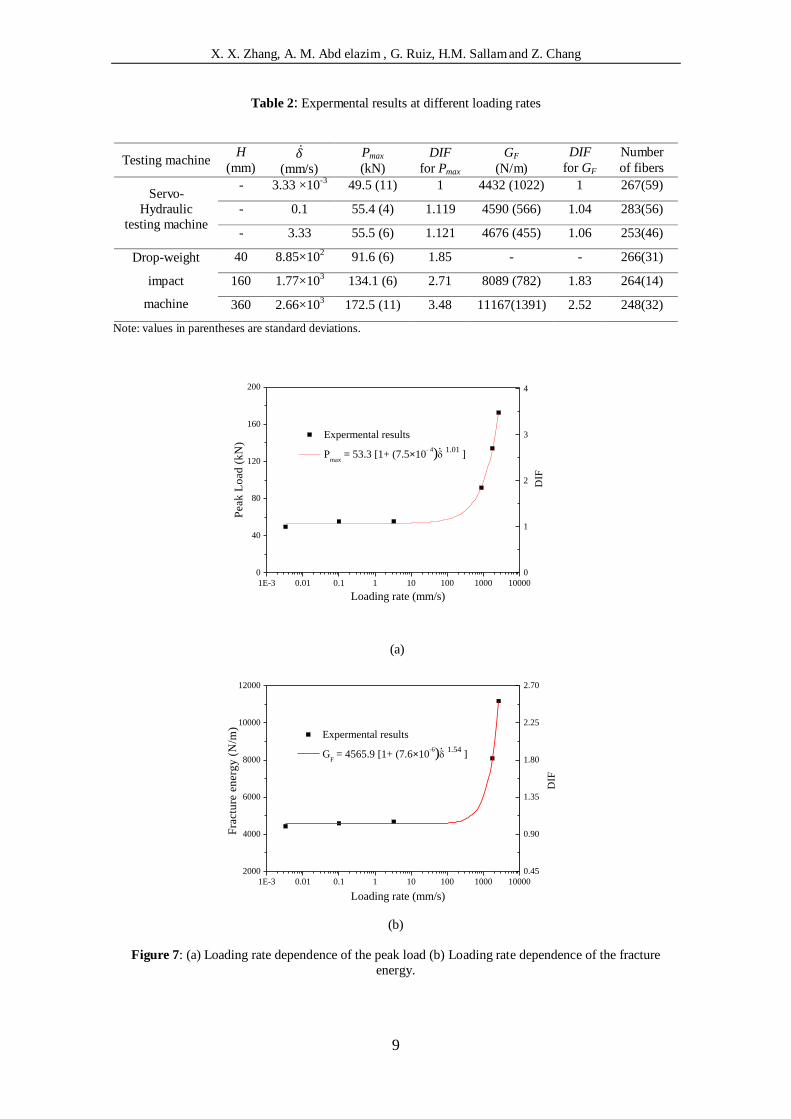
The loading rate effect on the fracture
energy is shown in Figure 7 (b). The trend is
similar to that of the peak load, i.e., the
tendency is moderate under low loading rates,
while under high loading rates it is dramatic. A
similar equation is also proposed to represent
this behaviour as shown in Eq. (3). 𝐺𝐹 = 𝐺𝐹
𝑠(1 + 𝑚𝛿 𝑟)
= 4565.9 [1 + (7.6 × 10⁻⁶)𝛿 1.54] (3)
where 𝐺𝐹𝑆 is the static fracture energy in N/m,
coefficients 𝑚 and 𝑟 are adjusting parameter,
𝛿 is the loading rate in mm/s.
3.2 Comparison with data already
published
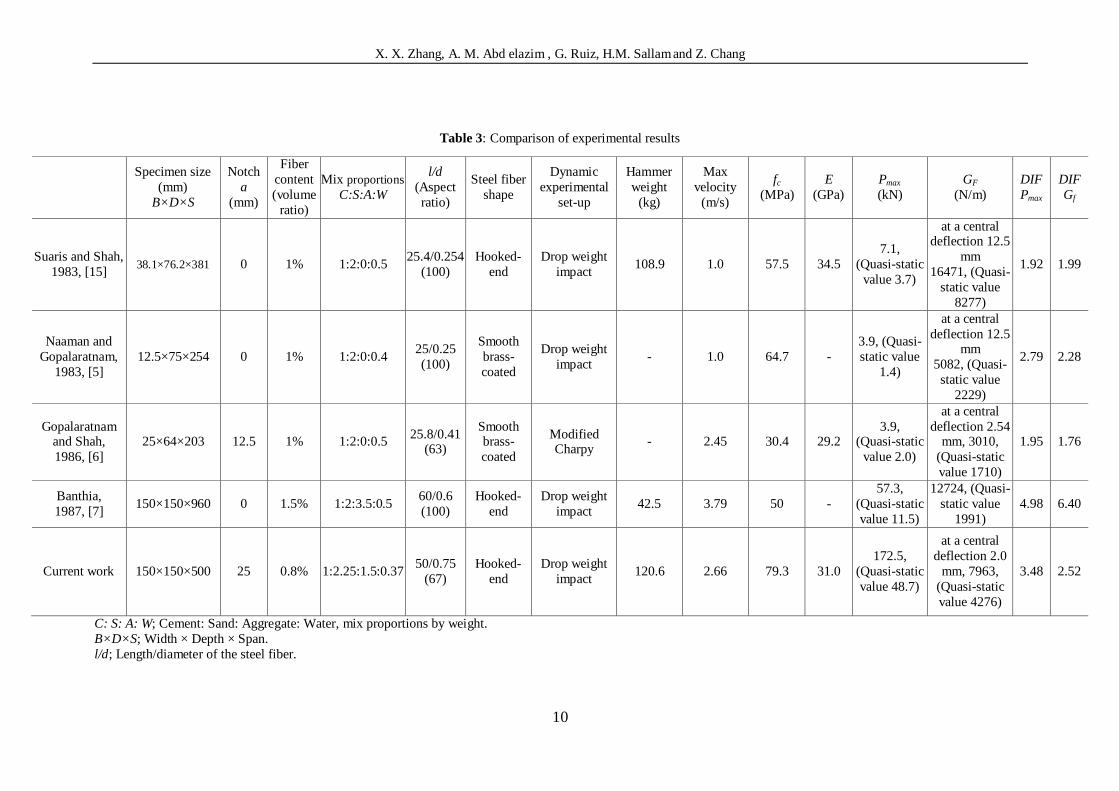
Table 3 provides a comparison of some
experimental results from other researches and
the results presented in this paper. From this
table, it can be observed that the loading rate
effect on the mechanical properties of different
steel fiber-reinforced concretes is similar.
The values of DIF for the peak load and the
fracture energy are in the same order of
magnitude, though there is some difference
among them. Such difference is likely attribute
to type, shape and geometry of the steel fiber,
fiber volume ratio, bond behaviour between
fibers and matrix, size of the specimen and the
testing conditions. Furthermore, it should be
taken into account as well that the notched
specimen absorbs less dissipated energy than
that of the unnotched one due to the fact that
the crack locates close to the notch plane. Thus,
it is better to use notched specimen to study
the fracture behaviour of SFRC for reducing
the influence of dissipated energy. Recently,
Caverzan and Cadoni et al. [17] have
investigated the dynamic fracture behaviour of
a high performance fiber-reinforced
cementitious composite by using a modified
Hopkinson bar, the notched cylinder
specimens were used in the test. The results
showed that the DIF value for the fracture
energy was approximately 1.5. It is worth
noting that the rate effect on the fracture
energy illustrates similar tendency with
different loading methods, such as modified
Charpy impact testing machine, drop-weight
impact instrument and modified Hopkinson
bar system.
X. X. Zhang, A. M. Abd elazim , G. Ruiz, H.M. Sallam and Z. Chang
7
(a) Loading rate 8.85×10²
mm/s
(b) Loading rate 1.77×10³
mm/s
(c) Loading rate 2.66×103 mm/s
Figure 4: Typical impact and reaction forces versus time (left), and comparison of load versus displacement (right), at
loading rates (a) 8.85×102 mm/s (b) 1.77×10
3 mm/s and (c) 2.66×10
3 mm/s.
0.018 0.019 0.020 0.021 0.022 0.023 0.024 0.025
0
40
80
120
160
200
Reaction force
Impact force
344 s
start point of
the reaction force
start point of
the impact force
Lo
ad (
kN
)
Time (s)0.0 0.5 1.0 1.5 2.0
0
40
80
120
160
200
Lo
ad (
kN
)
Loading-point displacement (mm)
0.007 0.008 0.009 0.010 0.011 0.012 0.013 0.014
0
40
80
120
160
200
250 s
start point of
the reaction force
start point of
the impact force
Lo
ad (
kN
)
Time (s)0.0 0.5 1.0 1.5 2.0
0
40
80
120
160
200
Lo
ad
(k
N)
Loading-point displacement (mm)
0.005 0.006 0.007 0.008
0
40
80
120
160
200
248 s
start point of
the impact force
start point of
the reaction force
Lo
ad (
kN
)
Time (s)0.0 0.5 1.0 1.5 2.0
0
40
80
120
160
200
Lo
ad (
kN
)
Loading-point displacement (mm)

X. X. Zhang, A. M. Abd elazim , G. Ruiz, H.M. Sallam and Z. Chang
8
(a) Loading rate 3.33×10⁻³
mm/s
(b) Loading rate 0.1 mm/s
(c) Loading rate 3.33 mm/s
(d) Loading rate 8.85×10²
mm/s
(e) Loading rate 1.77×10³
mm/s
(f) Loading rate 2.66×10³
mm/s
Figure 5: Failure modes of SFRC beams under different loading rates.
Figure 6: Load-displacement curves at different loading rates.
0.0 0.5 1.0 1.5 2.00
20
40
60
80
100
120
140
160
180
200
Lo
ad (
kN
)
Displacement (mm)
3.33×10⁻³mm/s
0.1 mm/s
3.33 mm/s
8.85×102 mm/s
1.77×103 mm/s
2.66×103 mm/s
X. X. Zhang, A. M. Abd elazim , G. Ruiz, H.M. Sallam and Z. Chang
9
1E-3 0.01 0.1 1 10 100 1000 10000
0
40
80
120
160
200
Expermental results
Pmax
= 53.3 [1+ (7.5×10- 4) 1.01
]
DIF
Peak
Lo
ad
(k
N)
Loading rate (mm/s)
.
0
1
2
3
4
Table 2: Expermental results at different loading rates
Testing machine H
(mm) 𝛿
(mm/s)
Pmax
(kN)
DIF
for Pmax
GF
(N/m)
DIF
for GF
Number
of fibers
Servo-
Hydraulic
testing machine
- 3.33 ×10⁻³
49.5 (11) 1 4432 (1022) 1 267(59)
- 0.1 55.4 (4) 1.119 4590 (566) 1.04 283(56)
- 3.33 55.5 (6) 1.121 4676 (455) 1.06 253(46)
Drop-weight
impact
machine
40 8.85×10² 91.6 (6) 1.85 - - 266(31)
160 1.77×10³ 134.1 (6) 2.71 8089 (782) 1.83 264(14)
360 2.66×10³ 172.5 (11) 3.48 11167(1391) 2.52 248(32)
Note: values in parentheses are standard deviations.
(a)
(b)
Figure 7: (a) Loading rate dependence of the peak load (b) Loading rate dependence of the fracture
energy.
1E-3 0.01 0.1 1 10 100 1000 10000
2000
4000
6000
8000
10000
12000
Expermental results
GF = 4565.9 [1+ (7.6×10
-6) 1.54 ]
DIF
Fra
ctu
re e
nerg
y (
N/m
)
Loading rate (mm/s)
.
0.45
0.90
1.35
1.80
2.25
2.70
X. X. Zhang, A. M. Abd elazim , G. Ruiz, H.M. Sallam and Z. Chang
10
Table 3: Comparison of experimental results
Specimen size
(mm)
B×D×S
Notch
a
(mm)
Fiber
content
(volume
ratio)
Mix proportions
C:S:A:W
l/d
(Aspect
ratio)
Steel fiber
shape
Dynamic
experimental
set-up
Hammer
weight
(kg)
Max
velocity
(m/s)
fc
(MPa)
E
(GPa)
Pmax
(kN)
GF
(N/m)
DIF
Pmax
DIF
Gf
Suaris and Shah,
1983, [15] 38.1×76.2×381 0 1% 1:2:0:0.5
25.4/0.254
(100)
Hooked-
end
Drop weight
impact 108.9 1.0 57.5 34.5
7.1,
(Quasi-static
value 3.7)
at a central deflection 12.5
mm
16471, (Quasi-
static value
8277)
1.92 1.99
Naaman and
Gopalaratnam,
1983, [5]
12.5×75×254 0 1% 1:2:0:0.4 25/0.25
(100)
Smooth
brass-
coated
Drop weight
impact - 1.0 64.7 -
3.9, (Quasi-
static value
1.4)
at a central
deflection 12.5 mm
5082, (Quasi-
static value
2229)
2.79 2.28
Gopalaratnam and Shah,
1986, [6]
25×64×203 12.5 1% 1:2:0:0.5 25.8/0.41
(63)
Smooth brass-
coated
Modified Charpy
- 2.45 30.4 29.2 3.9,
(Quasi-static
value 2.0)
at a central
deflection 2.54 mm, 3010,
(Quasi-static
value 1710)
1.95 1.76
Banthia,
1987, [7] 150×150×960 0 1.5% 1:2:3.5:0.5
60/0.6
(100)
Hooked-
end
Drop weight
impact 42.5 3.79 50 -
57.3,
(Quasi-static
value 11.5)
12724, (Quasi-
static value
1991)
4.98 6.40
Current work
150×150×500 25 0.8% 1:2.25:1.5:0.37 50/0.75
(67)
Hooked-
end
Drop weight
impact 120.6 2.66 79.3 31.0
172.5,
(Quasi-static
value 48.7)
at a central
deflection 2.0
mm, 7963,
(Quasi-static
value 4276)
3.48 2.52
C: S: A: W; Cement: Sand: Aggregate: Water, mix proportions by weight.
B×D×S; Width × Depth × Span.
l/d; Length/diameter of the steel fiber.
X. X. Zhang, A. M. Abd elazim , G. Ruiz, H.M. Sallam and Z. Chang
11
4 CONCLUSIONS
The fracture behaviour of a steel fiber
reinforced concrete under dynamic loading
conditions was investigated in this study. The
loading rates varied considerably from a
quasi-static level to a dynamic level, the order
of magnitude changed from 10-3
to 103
mm/s.
As a result of the study, the following
conclusions can be drawn:
For studying dynamic fracture behaviour
of steel fiber-reinforced concrete, it is better
to use notched specimen instead of unnotched
one, thus, less dissipated energy is found in the specimen.
The peak load and the fracture energy are
sensitive to the loading rate. Under low
loading rates, the rate effect is minor, while it
is pronounced under high loading rates. The
dynamic increase factor of the peak load and
the fracture energy is approximately 3.5 and
2.5, respectively. This attributes primarily to
the strain rate sensitivity of the matrix and the
pullout resistance of the fibers.
Two prediction-equations for the rate
sensitivity of the fracture energy and the peak
load are provided. They are helpful in
numerical simulations that evaluate the rate dependence of the fracture behaviour.
Acknowledgements
The authors thank the INCRECYT and the fellowship under grant No BES-2008-008216.
REFERENCES
[1] ACI Committee 544, 1996. State-of-art
report on fiber reinforced concrete. ACI
Committee 544 report 544.1R-96. American
Concrete Institute. Detroit.
[2] ACI Committee 544, 2008. Guide for
Specifying, Proportioning, and Production of
Fiber Reinforcing Concrete. ACI Committee
544 report 544.3R-08. American Concrete
Institute. Detroit.
[3] ACI Committee 544, 1989. Measurement
of properties of fiber reinforced concrete
(Reapproved 2009). ACI Committee 544
report 544.2R-89. American Concrete
Institute. Detroit.
[4] Zhang, X. X., Ruiz, G., and Yu, R. C.,
2010. A new drop-weight impact machine for
studying fracture processes in structural
concrete. Strain. 46: 252-57.
[5] Naaman, A. E., and Gopalaratnamt, V. S.,
1983. Impact properties of steel fiber
reinforced concrete in bending. International
journal of cement composites and lightweight
concrete. 5: 225-33.
[6] Gopalaratnam, V. S., and Shah, S. P.,
1986. Properties of steel fiber reinforced
concrete subjected to impact loading. Journal
of the American Concrete Institute. 83: 117-
26.
[7] Banthia, N., 1987. Impact resistance of
concrete. PhD thesis: Department of Civil
Engineering, the University of British
Columbia, Vancouver, Canada.
[8] Banthia, N., Mindess, S., and Trottier, J.
F., 1996. Impact resistance of steel fiber
reinforced concrete. ACI Materials Journal.
93: 472-79.
[9] Nataraja, M. C., Dhang, N., and Gupta, A.
P., 1999. Statistical variations in impact
resistance of steel fiber-reinforced concrete
subjected to drop weight test. Cement and
Concrete Research. 29: 989-95.
[10] RILEM TC 162-TDF, 2002. Test and
design methods for steel fiber reinforced
concrete - bending test. Materials and
Structures/Materiaux et Constructions. 35:
579-82.
X. X. Zhang, A. M. Abd elazim , G. Ruiz, H.M. Sallam and Z. Chang
12
[11] UNE-EN 14651-2007, Método de
ensayo para hormigón con fibras metálicas –
determinación de la Resistencia a la tracción
por flexion (límite de proporcionalidad (LOP), Resistencia residual).
[12] Zhang, X.X., Ruiz, G., and Yu, R.C. and
Tarifa M., 2009. Fracture behaviour of high-
strength concrete at a wide range of loading
rates. International Journal of Impact
Engineering. 36: 1204-09.
[13] Banthia, N., Mindess, S., Bentur, A., and
Pigeon, M., 1989. Impact testing of concrete
using a drop-weight impact machine.
Experimental Mechanics. 29: 63-9.
[14] Planas, J., Guinea G.V., and Elices M.,
1994. Stiffness associated with quasi-
concentrated loads. Materiaux et constrictions.
27: 311-8.
[15] Suaris, W., and Shah, S., 1983.
Properties of concrete subjected to impact.
Structural engineering. 10: 1727-41.
[16] Akcay, B., and Tasdemir, M. A., 2012.
Mechanical behaviour and fibre dispersion of
hybrid steel fibre reinforced self-compacting
concrete. Construction and Building
Materials. 28: 287-93.
[17] Caverzan, A., Cadoni, E. and Prisco, M.,
2012. Tensile behaviour of high performance
fibre-reinforced cementitious composites at
high strain rates. International Journal of
Impact Engineering. 45: 28-38.