Embed Size (px)
Citation preview
INFLUENCE OF LEADERSHIP ON EMPLOYEE PRODUCTIVITY AT KCB
BANK KENYA LTD, NAIROBI REGION BRANCHES
LILIAN KAGWIRIA
A RESEARCH PROJECT SUBMITTED IN PARTIAL FULFILLMENT OF THE
REQUIREMENT FOR THE AWARD OF MASTER OF SCIENCE IN HUMAN
RESOURCE MANAGEMENT, SCHOOL OF BUSINESS, UNIVERSITY OF
NAIROBI
NOVEMBER, 2016
ii
DECLARATION
This research project is my original work and has never been submitted to any other
college, University or any other institution for the award of a diploma, degree or master‘s
degree.
Signature…………………………. Date……………………………
Lilian Kagwiria
Reg. D64/71115/2014
This research project has been submitted for examination with my approval as the
University supervisor.
Signature…………………………. Date……………………………
Dr. Florence Muindi
School of Business
University of Nairobi
iii
DEDICATION
This research is dedicated to my family for their unprecedented support in my two years
journey in pursuit of this noble accomplishment. I would also like to appreciate my
Colleague –Mr.Robley Ngoje for the encouragement to actually apply and pursue this
course and my Line Manager at work, Mr. Metric Mukhalasie for his support in those
instances that I needed to re-organize my time to attend class and sit the exams.
iv
ACKNOWLEDGEMENT
I wish to acknowledge and thank my Lecturers from the School of Business University of
Nairobi and particularly my supervisor, Dr.Florence Muindi, whose guidance has been
pivotal in this academic achievement. My moderator Professor K‘Obonyo for valuable
input and his candid feedback. My fellow students with whom we strived despite all odds
to achieve this milestone.
Finally I wish to thank my respondents, especially managers at KCB Bank Kenya Ltd,
Nairobi Region Branches who took time to complete my questionnaire.
v
ABSTRACT
This study was founded on the need to establish the influence of leadership on employee
productivity at KCB Bank Kenya Ltd. To achieve the objective of the study, the study
used a descriptive survey research design determine the influence of leadership on
employee productivity. The target population of the study included all the managers and
employees of KCB Bank Kenya Ltd. A sample size of 225 was selected from a
population of 450 managers and employees. The study used primary data which was
collected by a semi-structured questionnaire. The data was collected from managers and
employees of commercial bank using a drop and pick- later method. Data was analyzed
using descriptive statistics and regression analysis. The study found that a unit increase in
transformational leadership style, transactional leadership style and Laissez-faire
leadership style leads to increase in employee productivity. It further established that
employees at KCB bank act in a ways that build each other, display a sense of power and
confidence and they go beyond self-interest for the good of the group. The study also
established that employees do not fail to interfere until problems become serious and they
do not wait for things to go wrong before taking action. It also revealed that employees
direct their attention toward failures to meet standards; they keep track of all mistakes
and focus attention on irregularities, mistakes, exceptions, and deviations from standards.
The study therefore recommends that leaders to be aware of what is important for the
subordinates and the organizations as a whole and encourage the employees to see the
opportunities and challenges around them creatively. The study suggests that a similar
study can be replicated in other banks in the Kenya such as Equity bank. Further research
should also be done involving all the employees at commercial banks.
vi
TABLE OF CONTENTS
DECLARATION............................................................................................................... ii
DEDICATION.................................................................................................................. iii
ACKNOWLEDGEMENT ............................................................................................... iv
ABSTRACT ........................................................................................................................v
LIST OF TABLES ........................................................................................................... ix
CHAPTER ONE ................................................................................................................1
INTRODUCTION..............................................................................................................1
1.1 Background of the Study ...............................................................................................1
1.1.1 Concept of Leadership ..........................................................................................2
1.1.2 Employee Productivity..........................................................................................3
1.1.3 KCB Bank Limited ...............................................................................................4
1.2 Research Problem ..........................................................................................................5
1.3 Objective of the Study ...................................................................................................7
1.4 Value of the Study .........................................................................................................7
CHAPTER TWO ...............................................................................................................9
LITERATURE REVIEW .................................................................................................9
2.1 Introduction ....................................................................................................................9
2.2 Theoretical Foundation ..................................................................................................9
2.2.1 Path Goal Theory ..................................................................................................9
2.2.2 Transformational Leadership Theory .................................................................10
2.3 Leadership Approaches ................................................................................................11
2.3.1 Autocratic Leadership Style ................................................................................11
2.3.2 Democratic Leadership Style ..............................................................................12
2.3.3 Laissez-faire Leadership Style ............................................................................12
2.3.4 Bureaucratic Leadership Style ............................................................................13
2.4 Measures of Leadership ...............................................................................................14
2.5 Measures of Productivity .............................................................................................16
2.6 Leadership and Employee Productivity .......................................................................17
vii
CHAPTER THREE .........................................................................................................20
RESEARCH METHODOLOGY ...................................................................................20
3.1 Introduction ..................................................................................................................20
3.2 Research Design...........................................................................................................20
3.3 Population of the Study ................................................................................................20
3.4 Sampling ......................................................................................................................20
3.5 Data Collection ............................................................................................................21
3.6 Data Analysis ...............................................................................................................22
CHAPTER FOUR ............................................................................................................24
DATA ANALYSIS, PRESENTATIION DISCUSSION AND INTERPRETATION
............................................................................................................................................24
4.1 Introduction ..................................................................................................................24
4.1.1 Response Rate ...........................................................................................................24
4.2 Demographic Information ............................................................................................24
4.2.1 Gender .................................................................................................................24
4.2.2 Age Distribution..................................................................................................25
4.2.3 Educational Level of Respondents ......................................................................25
4.2.4 Period of Service in the bank ..............................................................................26
4.3 Leadership Styles .........................................................................................................26
4.4 Balance Score Card Rating30
4.5 Analysis of data on Leadership and Employee Productivity ......................................31
4.6 Discussion of the findings ............................................................................................34
CHAPTER FIVE .............................................................................................................36
SUMMARY OF FINDINGS CONCLUSION AND RECOMMENDATIONS .........36
5.1 Introduction ..................................................................................................................36
5.2 Summary of findings....................................................................................................36
5.3 Conclusion ...................................................................................................................37
5.4 Policy Recommendations.............................................................................................38
5.5 Limitations of the Study...............................................................................................39
viii
5.6 Recommendation for Further Research .......................................................................39
REFERENCES .................................................................................................................40
APPENDICES ..................................................................................................................46
APPENDIX I: Questionnaire for Managers .....................................................................46
APPENDIX II: Secondary Data for Employees Productivity (Key result areas) ............50
ix
LIST OF TABLES
Table 3.1: Sampling Frame .................................................................................. 21
Table 4.2: gender composition of the respondents .............................................. 24
Table 4.3: Age Distribution ................................................................................. 25
Table 4.4: Level of Education .............................................................................. 25
Table 4.5: Length of Service in the Bank ........................................................... 26
Table 4.6: Leadership Styles ................................................................................ 27
Table 4.7: working style/relationship with subordinates ..................................... 29
Table 4.8: Balance Score Card Rating ................................................................. 31
Table 4.9: Regression Model Summary ............................................................... 32
Table 4.10: Anova a .............................................................................................. 32
Table 4.11: Regression Coefficients .................................................................... 33
1
CHAPTER ONE
INTRODUCTION
1.1 Background of the Study
The magnitude and importance of leadership in different organizations has long been
unnoticed and unobserved from a long period of time. But now its importance has been
realized and has become a burning issue all over the world. Effective leadership enhances
the productivity of employees in all the sectors of the economy in a country. Leadership
skills such as technical skills, conceptual skills, interpersonal skills, emotional
intelligence and social intelligence have an impact on increasing the productivity of
employees (Lewis & Gilman, 2013). According to Graen (2013) leadership impacts
productivity in the following ways; it improves employee morale, it‘s a source of
motivation, forms basis for cooperation, divides work as per capability, gives necessary
guidance and creates effective communication. Leadership is very important to the
survival and effectiveness of organization‘s performance. As organisations grow and
expectations about their performances increase, demand for good leadership tends to
multiply. From every indication, there seems to be a strong link between leadership style
and performance of employees in an organization (Eze, 2011).
Several theories have been proposed by researchers to explain leadership and
productivity in organizations. This study will focus on path goal theory and
transformational leadership theory. Zaccaro (2007) presented path goal theory of
leadership which is one of the contingency theories of leadership. The theory proposed
to describe the way leaders encourage and support their followers in achieving the goals
they have been set by making the path that they should take clear and easy. The theory is
of the suggestion that a leader needs to influence follower‘s perception of work goals,
self-development goals and paths to goal attainment. Burns (1978) developed
transformational leadership theory. The major premise of the transformational
leadership theory is the leader‘s ability to motivate the follower to accomplish more than
what the follower planned to accomplish (Krishnan, 2005). Research has shown that
transformational leadership impacts employee commitment to organizational change and
organizational conditions (Lam, 2002).
2
KCB is an employer of choice with over 7,500 employees in Kenya, Uganda, Tanzania,
Rwanda, Burundi and South Sudan. The bank has been in existence for 120years. The
economic uncertainty makes workers to become more anxious about their safety.
Motivated employees are more productive, happier, and stay with the organization
longer. One of the primary tasks a manager faces is to find out what motivates their
employees. By understanding employee needs, leaders at KCB Bank Kenya Ltd
understand what rewards to use to motivate them to enable them achieve their vision.
This study will focus on the influence of leadership on employee productivity in KCB.
The topic on leadership was chosen as an effort to find out whether productivity of
employees could be attributed to the exercise of leadership styles and thus advice the
management of KCB Bank accordingly. The research is also a deliberate effort to find
out whether there is confidence in banking institutions stewardship.
1.1.1 Concept of Leadership
Leadership is defined as the process of social influence in which one person could enlist
the aid and support of others in the accomplishment of a common goal (Manz, 2006). It
involves using one‘s role and ability to influence others in some way, which delivers
business results and contributes to the organization‘s overall success. True leadership
comes from influence, congruence and integrity. A successful leadership involves the
management of relationships and communications within a team, and drives the team
towards achieving a specific goal. Leadership reflects on the ability of one to ―express a
vision, influence others to achieve results, encourage team cooperation, and be an
example‖. It is important to note, however, that one who is in the formal role of a leader
may not necessarily possess leadership skills nor be capable of leading. Leadership is
essentially related to one‘s skills, abilities and degree of influence, instead of power.
Leadership is generally defined simply as influence, the process of influencing people in
order for them to strive willingly towards the achievement of organizational goals and
objectives (Peelz, 2011). While the word style is closely equivalent to the way in which
the leader influences followers. Therefore, every group of people that perform very close
to its entire culpability has some persons as its head that is definitely skilled in the art of
leadership. Leadership is concerned with the total manner in which a manager influences
3
action of subordinates. It includes the issuing of orders that are clearly accomplished. It
implies a continual training activity in which subordinates are given training activity;
instructions to enable them carry out the particular assignment in the existing situation. It
necessarily involves the motivation of workers to try to meet the expectation of
managers.
1.1.2 Employee Productivity
Employee productivity (sometimes referred to as workforce productivity) is an
assessment of the efficiency of a worker or group of workers. Productivity may be
evaluated in terms of the output of an employee in a specific period of time. According to
Mathis and John (2007) productivity is a measure of the quantity and quality of work
done, considering the cost of the resources used. The more productive an organization,
the better its competitive advantage, because the costs to produce its goods and services
are lower. Better productivity does not necessarily mean more is produced; perhaps fewer
people (or less money or time) was used to produce the same amount. McNamara (2009)
further states that, results are usually the final and specific outputs desired from the
employee. Results are often expressed as products or services for an internal or external
customer, but not always. They may be in terms of financial accomplishments, impact on
a community; and so whose results are expressed in terms of cost, quality, quantity or
time.
Measuring productivity involves determining the length of time that an average worker
needs to generate a given level of production. One can also observe the amount of time
that a group of employees spends on certain activities such as production, travel, or idle
time spent waiting for materials or replacing broken equipment. The method can
determine whether the employees are spending too much time away from production on
other aspects of the job that can be controlled by the business. Employee productivity
may be hard to measure, but it has a direct bearing on a company's profits. An employer
fills his staff with productivity in mind and can get a handle on a worker's capabilities
during the initial job interview. However, there are several factors on the job that help
maximize what an employee does on the job (Lake, 2000).
4
Tierney (2009) state that, perhaps none of the resources used for productivity in
organizations are so closely scrutinized as the human resources. Many of the activities
undertaken in a human resource system are designed to affect employee or organizational
productivity. Pay, appraisal systems, training, selection, job design and compensation are
human resource activities directly concerned with productivity. Voon (2011) continues to
state that controlling labour costs and increasing productivity through the establishment
of clearer linkages between pay and performance are considered to be key human
resource management component of competitive advantage. In addition, increased
concerns over productivity and meeting customer requirements have prompted renewed
interest in methods designed to motivate employees to be more focused on meeting (or
exceeding) customer requirements and increasing productivity.
1.1.3 KCB Bank Limited
KCB Bank Limited (KCB) is a financial service provider headquartered in Nairobi,
Kenya. It is licensed as a commercial bank, by the Central Bank of Kenya (Gakenia,
2008). It is one of the largest commercial banks in Kenya and has the largest branch
network with over 200 branches. It has the widest network of banking outlets comprising
of over 222 branches and over 400 automated teller machines in Kenya, Burundi,
Rwanda, South Sudan, Tanzania and Uganda (Kithinji, 2010). The bank has over 280
automated teller machine outlets spread across the East Africa Region and bank has also
partnered with Pesa Point and Kenswitch to provide more channels for customers to
access their funds. Other channels available to customers include mobile banking (Mobi),
Internet Banking and Agency Banking (KCB Mtaani). Prior to 2015, KCB Bank Ltd was
both a licensed bank and a holding company for its subsidiaries. In compliance with the
Kenya Finance Act No.57 of 2012, KCB Group announced in April 2015 of its intention
to incorporate a new wholly owned subsidiary, KCB Bank Kenya Limited, to which it
would transfer its Kenyan banking business, assets and liabilities. The re-organisation
converted KCB Group into a non-trading holding company that owns both banking and
non-banking subsidiary companies (Warue, 2013).
5
Due to its large network, KCB has the largest management structure with over 4500
employees. The Board and Management reviews its management structure at various
levels from time to time in line with the realities of the business. KCB‘s management
structure employee occupations account for about 25 percent of employment in the
banking industry. Financial managers direct bank branches and departments, resolve
customers' problems, ensure that standards of service are maintained, and administer the
institutions' operations and investments (Anbari, 2003). The Group Chief Operating
officer is responsible for the daily operation of the bank. The primary role of a Chief
Finance Officer makes sure that financial records of the bank are in order (Gong, 2009).
The managers are responsible for the operation, administration, marketing, training,
lending and security of a local bank branch. They may also discuss services, such as
deposit accounts, lines of credit, sales or inventory financing, cash management, stock
investments, or investment services.
1.2 Research Problem
In the recent past years, leadership has engaged as a new effective approach for managing
the employees and organization at large. The traditional concept of personnel
administration has gradually replaced with the human resource management. This give
importance to the strategic integration of new leadership styles into effective
management of employees and to improve the employee productivity (Gong, 2009).
Leaders are accountable for the performance of their organization or the success of the
government, which is dependent on employee‘s productivity. Leadership is an
indispensable requisite for the success of any organization (Lewis, 2013). Since an
organization requires a leader to shape the behavior of employees and lead them to the
desired direction. Research into leadership and employee productivity is becoming more
important because some researchers have examined the relationship between them and
also the relationship between leadership, motivation and productivity (Koopman, 2005).
There is however, still some debate over leadership on whether it facilitates in employee
productivity that further leads to organizational performance.
6
KCB Bank considers employees as the most effective asset in achieving organizational
objectives and goals. Employees in the bank have the tendency to enhance the
organization‗s productivity by utilizing the organizational capital efficiently and
effectively. In order to advantageously utilize this asset, good leadership is considered
being the most important determinant that increases employee productivity (Javaid,
2012). In this case, KCB Bank is chosen since there has been employees' high
productivity which could be attributed to the exercise of desirable leadership. A research
into the influence of leadership on employee performance may be necessary in finding
the type of leadership the bank applies and how it affects the employees.
Various studies have been done in relationship to leadership and productivity. Idowu
(2011) studied on the effects of leadership style on organizational performance: a survey
of selected small scale enterprises in ikosi-ketu council development area of Lagos state,
Nigeria. The findings showed that transformational leadership style had positive but
insignificant effect on performance. The study also stated that transactional leadership
style was more appropriate in inducing performance in small scale enterprises than
transformational leadership style. Halder (2015) did a research on the effect of leadership
styles practiced in an organization and their effect on employee performance. The
findings indicated that the autocratic leadership was useful in the short term and
democratic leadership style was useful in all time horizon. Participation leadership style
was most useful in long term and effect on employees was positive.
Akoth (2015) researched on the transformational leadership on the performance of
employees in Kenya: the case of Kenya wildlife service. The findings indicated that
motivation affects effectiveness of the performance, incentives motivate employees to be
more productive and that Kenya wildlife Service is committed to setting standard goals.
Kitili (2013) did an investigation of the influence of leadership style on employee
performance in Kenya, a case study of coffee research foundation in Ruiru. The study
found out that the leadership style adopted by CRF influenced positively to employee
motivation, commitment and productivity. Kamau (2013) did a research on fringe
benefits effects on employee productivity in the public sector (a case of state department
7
of water, Nairobi County, Kenya). From the study it was established that security benefits
such as meal, transport and house allowances contributed positively to employee
productivity.
Obiwuru (2011) did a study on the effects of leadership style on organizational
performance: a survey of selected small scale enterprises in Ikosi-Ketu council
development area of Lagos state, Nigeria. The result showed that while transactional
leadership style had significant positive effect on performance, transformational
leadership style had positive but insignificant effect on performance.
In this case, KCB Bank is chosen since there has been employees' high productivity
which could be attributed to the exercise of desirable leadership. A research into the
influence of leadership on employee performance may be necessary in finding the type of
leadership the bank applies and how it affects the employees. All the above studies have
covered leadership in relation to employee productivity in different sectors. Some of the
studies have been undertaken in small scale enterprises, in the wildlife service and
different departments, thus, none had been done in banking industry especially in KCB
bank. Therefore, the study sought to answer the question; what is the influence of
leadership on employee productivity at KCB Bank Ltd?
1.3 Objective of the Study
To establish the influence of leadership on employee productivity at KCB Bank Kenya
Ltd.
1.4 Value of the Study
The study findings benefit businesses in the banking industry in appreciating the critical
role played by sound Leadership and Governance structures in improving organization‘s
employee productivity both at national and international fronts. Lately the banking sector
has been experiencing some turbulence emanating from leadership and Governance gaps
and this study assist management of commercial banks to evaluate how employees and
regulator perception of top leadership impacts employee productivity of the respective
bank.
8
The findings from the study is important because they have the capacity of being used to
formulate policy guidelines which are relevant and sensitive to the forces that influence
the banking sector productivity in Kenya.
This study benefit Central Bank of Kenya as the regulator, Kenya Bankers Association
and Ministry of Finance formulate leadership and governance models whose overall
objectives are to restore trust in the banking sector, accelerate rate of growth, build
productive and profitable institutions.
To the academicians the study contribute to the existing literature in the field of
Leadership and Governance. It should also act as a stimulus for further research to refine
and extend the present study especially in Kenya. Findings of the study is useful to
researchers and scholars as it contributes to the body of knowledge in the area of
Leadership and Governance. It also assists other researchers to further their studies on
areas of interest not yet exploited.
9
CHAPTER TWO
LITERATURE REVIEW
2.1 Introduction
This chapter presents a review of the related literature on the influence of leadership on
employee productivity as presented by various researchers, scholars, analysts and
authors. The chapter also provides the theories underpinning the study.
2.2 Theoretical Foundation
This section examines the various theories that were used to inform the study on the
influence of leadership on employee productivity. The study was guided by the following
two theories; path goal theory and transformational leadership theory.
2.2.1 Path Goal Theory
The path-goal theory was first introduced by Martin Evans (1970) and then further
developed by House (1971). It is a theory based on specifying a leader's style or behavior
that best fits the employee and work environment in order to achieve a goal (House,
1971). The goal is to increase employees' motivation, empowerment, and satisfaction so
they become productive members of the organization.
In the field of organizational studies, the path-goal theory considers the impact of a
leader's behavior on workers' job satisfaction, motivation and effectiveness. Also referred
to as the path-goal theory of leader effectiveness. In the 1990s, the theory underwent
subsequent revision from its original 1971 formulation by Robert J. House. The theory is
identified by four leadership behaviors. Each leadership behavior aims to maximize
worker outcomes by recognizing the impact of both environmental factors and worker
characteristics in job performance (Zaccaro, 2007).
The path goal theory is complimentary to transformational theory in as far as this study is
concerned as it describes the way that leaders should encourage and support their
followers in achieving set goals by making their path clearer. The leaders should do this
by clarifying the path for their subordinates to know the way, by removing any
10
roadblocks that hinder performance and finally by increasing their rewards when goals
are achieved. This study therefore seeks to operate within the framework of
transformational theories with path goal theory as a complimentary.
2.2.2 Transformational Leadership Theory
According to Bass (2006) the transformational leadership was coined by Burns (1978).
Transformational leadership theory has evolved from and contains elements of preceding
leadership types, such as trait and behaviour theories, charismatic, situational and
transactional leadership. The Transformational Leadership theory states that this process
is by which a person interacts with others and is able to create a solid relationship that
results in a high percentage of trust, that will later result in an increase of motivation,
both intrinsic and extrinsic, in both leaders and followers.
Transformational theory focus upon the connections formed between leaders and
followers. Transformational leadership is the leader‘s ability to motivate followers to rise
above their own personal goals for the greater good of the organization. Bass (2006)
theorized that the transformational style of leadership comes from deeply held personal
values which cannot be negotiated and appeals to the subordinates‘ sense of moral
obligation and values. Bass declared there were four types of transformational leadership
behavior, namely idealized influence (charisma), inspirational motivation, individualized
consideration, and intellectual stimulation.
According to transformational leadership theory, a leader can make a positive difference
in an employee‘s life and Bass Transformational Leadership Theory may be a solution in
various cases. The theory enhances the motivation, morale, and performance of followers
through a variety of mechanisms (Bushra, 2011). These include connecting the follower's
sense of identity and self to the project and the collective identity of the organization;
being a role model for followers that inspires them and makes them interested;
challenging followers to take greater ownership for their work, and understanding the
strengths and weaknesses of followers, so the leader can align followers with tasks that
enhance their performance.
11
2.3 Leadership Approaches
Because of the wide variety of leadership theories various scholars have used systems for
classifying different leadership styles to help leaders in understanding and choosing the
right leadership style. Four of the most basic leadership styles are: Autocratic,
Bureaucratic, Laissez-faire and Democratic. This research will briefly define each style
and describe the situations in which each one might be used.
2.3.1 Autocratic Leadership Style
Autocratic leadership style which was later named as classical leadership is the extreme
strict principle in which the leader maintains a master-servant relationship with members
of the group. The autocratic leader is task centered and his/her focus is to get a certain
task done quickly. Autocratic leader makes all the decisions and assigns tasks to members
of the group. In organizational environment these leaders are usually powerful CEOs who
hold multiple titles (chairman, CEO, president), receive high compensation, and often
control large shareholdings to dominate companies (Muller, 2007). These leaders are
usually blessed with a charismatic and self-confident personality. Autocratic leaders use
their position to pursue aggressive and visionary goals and their power through
organization culture, press and media to praise their own initial success (Men, 2013).
The main advantage of autocratic leadership style is that it gets things done quickly.
Moreover it ensures that the leader gets listened to and lets team members know when
their behavior is unacceptable. However autocratic leadership style has many
disadvantages and it is considered as a destructive leadership behavior (Sorenson, 2010).
Basically any organization that relies on the ability of a single person is living
dangerously. As suggested by various scholars the major cause of organizational decline
is a top executive who has too much power and some of the main disadvantages of
autocratic leaderships are that it doesn't allow team members to think for themselves and
this limits innovation and employee participation. Moreover, this leadership style can
distance team members from the leader which can cause low level of job satisfaction and
trust in the organization.
12
2.3.2 Democratic Leadership Style
The democratic leadership style is also called the participative style as it encourages
employees to be part of the decision making (Gastil, 2012). The democratic manager
keeps his or her employees informed about everything that affects their work and shares
decision making and problem solving responsibilities. This style requires the leader to be
a coach who has the final say, but gathers information from staff members before making
a decision. Democratic leadership can produce high quality and high quantity work for
long periods of time. Many employees like the trust they receive and respond with
cooperation, team spirit, and high morale. Typically the democratic leader develops plans
to help employees evaluate their own performance, allows employees to establish goals,
encourages employees to grow on the job and be promoted, recognizes and encourages
achievement.
Like the other styles, the democratic style is not always appropriate. It is most successful
when used with highly skilled or experienced employees or when implementing
operational changes or resolving individual or group problems (Leban, 2014). The
democratic leadership style is most effective when the leader wants to keep employees
informed about matters that affect them, the leader wants employees to share in decision-
making and problem-solving duties, and when the leader wants to provide opportunities
for employees to develop a high sense of personal growth and job satisfaction. It is also
effective when there is a large or complex problem that requires lots of input to solve,
changes must be made or problems solved that affect employees or groups of employee
and when one wants to encourage team building and participation (Aronson, 2011).
Democratic leadership should not be used when there is no enough time to get everyone's
input, it's easier and more cost-effective for the manager to make the decision, the
manager feels threatened by this type of leadership and when employee safety is a critical
concern.
2.3.3 Laissez-faire Leadership Style
Laissez-faire leadership, also known as delegative leadership, is a type of leadership style
in which leaders are hands-off and allow group members to make the decisions.
13
Researchers have found that this is generally the leadership style that leads to the lowest
productivity among group members. The laissez-faire leadership is the extreme loose
principle which includes non-interference policy that allows complete freedom to all the
employees and has no particular way of attaining goals (Cummings, 2010). This style of
leadership is people centered and the leaders leave the group to make its own decision
without participating or even setting a deadline for the decision.
In this style leader hopes that the group will make the right decision the main advantage
of this style is that it lets the team members to bond and can lead to successful decisions
if group members take ownership and responsibility of the task. However, the main
disadvantage is that employees will often perceive the leader as indifferent to the
organization and they might make the wrong decision without even realizing it. Since
there is absolutely no control or guidance in this style of leadership wrong decisions can
impose devastating effects on organizations (Stafford, 2010). Laissez-faire can also be
considered as a destructive leadership behavior because in the absence of the leader's
control some individuals can dominate group decisions and bully other members in the
group.
Laissez-faire leadership can be effective in situations where group members are highly
skilled, motivated and capable of working on their own. While the conventional term for
this style is 'laissez-faire' and implies a completely hands-off approach, many leaders still
remain open and available to group members for consultation and feedback. Laissez-faire
leadership is not ideal in situations where group members lack the knowledge or
experience they need to complete tasks and make decisions (Egri, 2011). Some people
are not good at setting their own deadlines, managing their own projects and solving
problems on their own. In such situations, projects can go off-track and deadlines can be
missed when team members do not get enough guidance or feedback from leaders.
2.3.4 Bureaucratic Leadership Style
Bureaucratic leadership is where the manager manages ―by the book‖ everything must be
done according to procedure or policy. If it isn't covered by the book, the manager refers
to the next level above him or her (Blanchard, 2008). This manager is really more of a
14
police officer than a leader. He or she enforces the rules. This style of leadership follows
a close set of standards. Everything is done in an exact, specific way to ensure safety
and/or accuracy.
This style can be effective when employees are performing routine tasks over and over,
employees need to understand certain standards or procedures; employees are working
with dangerous or delicate equipment that requires a definite set of procedures to operate,
safety or security training is being conducted and when employees are performing tasks
that require handling cash. This style is ineffective when employees form work habits
that are hard to break, if especially the managers are no longer useful, employees lose
their interest in their jobs and in their fellow workers and when employees do only what
is expected of them and no more (Gastil, 2012).
In the working world bureaucratic leadership skills would be best utilized in jobs such as
construction work, chemistry-related jobs that involve working with hazardous material,
or jobs that involve working with large amounts of money. A natural bureaucratic leader
will tend to create detailed instructions for other members of a group. This type of leader
would also be very successful working in student government roles (Sosik, 2009).
2.4 Measures of Leadership
The Multifactor Leadership Questionnaire (MLQ-5X) is the standard instrument for
assessing transformational and transactional leadership behavior (Bass & Avolio, 2007).
It has been translated into many languages and used successfully by both researchers and
practitioners around the world. It measures a broad range of leadership types from
passive leaders, to leaders who give contingent rewards to followers, to leaders who
transform their followers into becoming leaders themselves. The MLQ identifies the
characteristics of a transformational leader and helps individuals discover how they
measure up in their own eyes and in the eyes of those with whom they work. Success can
be measured through a retesting program to track changes in leadership style. The
program described in the MLQ Trainer's Guide provides a solid base for leadership
training.
15
In detail, five transformational, three transactional, one laissez-faire, and three outcome
scales are included in the MLQ-5X. The first of the transformational scales is
Inspirational Motivation. Central to this subscale of transformational leadership is the
articulation and representation of a vision by the leader (Bass & Avolio, 2007).
Consequently, by viewing the future with a positive attitude, followers are motivated.
Idealized Influence (attributed) refers to the attribution of charisma to the leader. Because
of the leaders` positive attributes (e. g. perceived power, focusing on higher-order ideals
and values), followers built close emotional ties to the leader. Trust and confidence is
likely to be built in followers. Idealized Influence (behavior) emphasizes a collective
sense of mission and values, as well as acting upon these values. Next, Intellectual
Stimulation includes challenging the assumptions of followers` beliefs, their analysis of
problems they face and solutions they generate. Individualized Consideration is defined
by considering individual needs of followers and developing their individual strengths.
On the side of the transactional leadership scales, Contingent Reward is a leadership
behavior by which the leader focuses on clear defined tasks, while providing followers
with rewards (material or psychological) on the fulfillment of these tasks (Bass & Avolio,
2007). In Active Management-by-Exception, the leader watches and searches actively for
deviations from rules and standards in order to avoid these deviations; if necessary,
corrective actions are taken. In contrast, in Management-by-Exception passive
intervening only occurs after errors have been detected or if standards have not been met.
An even more passive approach is Laissez-Faire, which is basically defined as the
absence of leadership. As such, Laissez-faire is used as a non-leadership contrast to the
more active forms of transformational and transactional leadership approaches.
The three outcome criteria which are included in the MLQ are followers‘ Extra Effort
(EEF), the Effectiveness of leader‘s behavior (EFF), and followers‘ Satisfaction (SAT)
with their respective leader. In combination, these scales form the Full Range of
Leadership, a comprehensive model developed by Avolio and Bass (2007). In addition,
the Full Range of Leadership Development Program (FRLD) has proven its effectiveness
(Bass & Avolio, 2007). Leaders in profit and non-profit organizations around the world
16
enhance their leadership skills by means of the FRLD and thus apply successfully the
transformational - transactional leadership paradigm.
2.5 Measures of Productivity
Productivity is commonly defined as a ratio of a volume measure of output to a volume
measure of input use. While there is no disagreement on this general notion, a look at the
productivity literature and its various applications reveals very quickly that there is
neither a unique purpose for, nor a single measure of productivity (Eagly, 2012). The
need to improve productivity measurement is apparent in both manufacturing and service
industries. Many organizations have used productivity measurement as a primary tool for
communicating future directions, establishing functional and project accountability,
defining the roles and responsibilities, allocating the limited resources, monitoring and
evaluating the activities, linking among key organizational processes, establishing the
targets and benchmarks, and initiating necessary changes to ensure continuous
improvement.
Productivity measurement is used to refer to performance appraisal, management
information systems, production capability assessment, quality control measurement, and
the engineering throughput of a system (Aronson, 2011). From a practical perspective,
the measures should be as cost-effective as possible; they should make use of existing
sources of data insofar as these are reliable and valid. Additionally, the value to the
organisation provided by the measurement should meet or exceed the cost of the
measurement. Productivity measures should be valid and also be perceived as valid by
organisational members in order to gain increased acceptance (Leban, 2014).
There are many different productivity measures. The choice between them depends on
the purpose of productivity measurement and, in many instances, on the availability of
data. Broadly, productivity measures can be classified as single factor productivity
measures (relating a measure of output to a single measure of input) or multifactor
productivity measures (relating a measure of output to a bundle of inputs). Another
distinction, of particular relevance at the industry or firm level is between productivity
17
measures that relate some measure of gross output to one or several inputs and those
which use a value-added concept to capture movements of output (Graen, 2013).
The complexity that characterizes the labour environment requires productivity
improvement in order to influence the quality of life of all human resources (Men, 2013).
This is equally true for the success of most organisations. Deciding how to improve
productivity in the current environment is a great challenge that is only possible to
comprehend within the context of dependency between the various elements. The
manager, in order to be able to decide and act in this context, needs to have the right tools
and understand that the organisation is not a perfectly controllable machine or a lifeless
object, but a thinking, acting being.
Indicators of productivity should be intelligible to the people who must take action on the
measurement (Kendrick, 2004). Finally, productivity indices should span the range of
productivity levels that could be achieved by the person or team. This is usually achieved
by having multiple sub-indices of productivity as components of the measurement
system. Another criterion related to the comprehensiveness of the system is the presence
of an overall index of productivity (David, 2003). The overall index allows the sub-
indices to be captured by a single figure on a common metric, which can then be used to
gauge improvements or decrements in productivity across time. This overall index also
allows better evaluation of the effects of an organisational intervention on productivity.
The overall index should be comparable across teams and organisations. If the
measurement system can quantify the progress towards the organization‘s goals, it can be
far more successful.
2.6 Leadership and Employee Productivity
Hurduzeu (2015) researched on the impact of leadership on organizational performance.
The main objectives of the study were to find out the concepts and types of leadership
behaviors and investigate the impact of leadership behavior on organizational
performance in the case company D&R Cambric Communication. Both the qualitative
and quantitative research method was used in the study. There were 29 respondents out of
a total 54 employees in the company. The results driven from the research showed that
18
there was a strong impact of leadership behaviors on organizational performance. The
leadership behaviors were found out to be very important key factors for the growth of
the companies in the service sectors.
Leng (2014) studied on the impact of leadership styles on employee productivity in retail
industry. Questionnaires were used as the research instrument. A total of 384 sampling
size were chosen for the survey. The 400 questionnaires were distributed to collect the
responses from the employees in the retail industry. The questionnaires were distributed
to the retail employees from three states of Malaysia, including Perak, Johor, and Penang.
The results of the research showed that there was a significant relationship between the
leadership styles and employee productivity, which means there was a significant impact
of leadership styles towards the employee productivity in the retail industry.
Kerario (2013) studied on the impact of transactional leadership on the performance of
employees in Kenya: the case of Mumias Sugar Company. The study aimed at showing
the impacts that this form of leadership had on the employees of an organization in terms
of their performance rate. It was a representative study in design with a cross sectional
component whereby all relevant parties were involved. The study population was specific
employees of Mumias Sugar Company selected for the study. Questionnaires were used
to collect relevant data. The findings indicated that there was a positive relationship
between transactional leadership and subordinate job satisfaction which intern yields
performance.
Bushra (2011) examined the different leadership styles on employees' performance in
Pakistan. The primary focus of the study was to investigate the impact of leadership style
on employees' performance. The study used quantitative approach to measure the impacts
of leadership on performance. Data was collected through structured questionnaire in
which respondents were issued with close-ended questionnaires. The study found out that
the relationship between employees' performance with democratic style was statistically
significant. It concluded that if the leader involves the employees in decision making
process, having friendly relationship with them and decrease their stress at work place, he
can maximize their productivity.
19
Mukui (2011) did a research on the effect of transformational leadership on employee
performance: a survey of five selected faith -based nongovernmental organizations in
Nairobi County. Stratified Random sampling technique was used to draw the sample. A
questionnaire and an interview guide were used for data collection with closed ended
questions designed for the employees while an open ended interview guide was designed
for leaders. A descriptive survey design was used whereby leaders practicing
transformational leadership as well as their subordinates subjected to this type of
leadership formed the population of the study. Findings of this study indicated that
transformational leadership in faith based non-governmental organizations led to
employee performance to some degree.
Rita (2010) measured the impact of leadership style and employee empowerment on
perceived organizational reputation. A quantitative survey method was used in the
present study because it provides a cost-effective and efficient way of collecting data
from large populations (Stacks, 2010). The on-line questionnaire was adopted as the
technique for data collection. An on-line survey was conducted with 700 randomly
selected employees from diverse work units of a Fortune 500 company in the United
States. A total of 166 employees completed the on-line survey with a response rate of
23.7%. The results showed that transformational leadership positively influences
employees ‗perception of organizational reputation, not only directly but also indirectly,
through empowering employees. Transactional leadership represented by contingent
reward behavior has a significant negative direct effect on employees ‗perception of
organizational reputation.
20
CHAPTER THREE
RESEARCH METHODOLOGY
3.1 Introduction
This chapter provides a discussion of the outline of the research methodology that was
used in this study. It focuses on the research design, data collection methods and comes
to a conclusion with the data analysis and data presentation methods that was used in this
study.
3.2 Research Design
The function of a research design is to ensure that the data obtained during the data
collection was adequate in answering the initial question(s) as unambiguously as possible
(Mugenda, 2010). According to Kothari (2004) a good research design must yield
maximum information and provide an opportunity for considering many different aspects
of the problem. The study employed a descriptive survey research design. A descriptive
survey enabled the researcher to describe the characteristics of the variables of interest.
3.3 Population of the Study
Population refers to the entire group of people, events or things of interest that the
researcher wishes to investigate (Sekaran, 2005). According to Ngechu (2004), a
population is a well-defined or set of people, services, elements, and events, group of
things or households that are being investigated. Target population in statistics is the
specific population about which information is desired. This definition ensures that
population of interest is homogeneous. The population was derived from all the managers
and employees of KCB Bank Kenya Ltd.
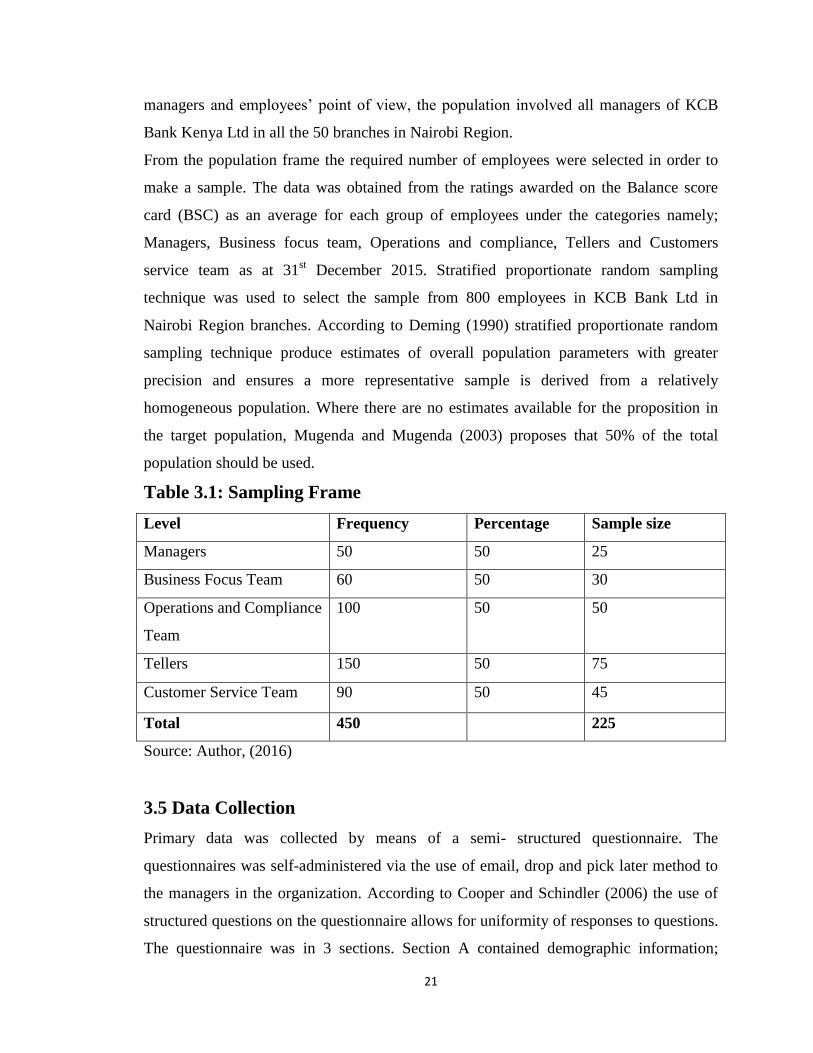
3.4 Sampling
Sampling refers to the process of obtaining information about an entire population by
examining only a part of it. A sample is the segment of the population that is selected for
investigation (Bryman & Bell, 2003). In quantitative research, the need to sample is one
that is almost invariably encountered. Because the research is studied from both the
21
managers and employees‘ point of view, the population involved all managers of KCB
Bank Kenya Ltd in all the 50 branches in Nairobi Region.
From the population frame the required number of employees were selected in order to
make a sample. The data was obtained from the ratings awarded on the Balance score
card (BSC) as an average for each group of employees under the categories namely;
Managers, Business focus team, Operations and compliance, Tellers and Customers
service team as at 31st December 2015. Stratified proportionate random sampling
technique was used to select the sample from 800 employees in KCB Bank Ltd in
Nairobi Region branches. According to Deming (1990) stratified proportionate random
sampling technique produce estimates of overall population parameters with greater
precision and ensures a more representative sample is derived from a relatively
homogeneous population. Where there are no estimates available for the proposition in
the target population, Mugenda and Mugenda (2003) proposes that 50% of the total
population should be used.
Table 3.1: Sampling Frame
Level Frequency Percentage Sample size
Managers 50 50 25
Business Focus Team 60 50 30
Operations and Compliance
Team
100 50 50
Tellers 150 50 75
Customer Service Team 90 50 45
Total 450 225
Source: Author, (2016)
3.5 Data Collection
Primary data was collected by means of a semi- structured questionnaire. The
questionnaires was self-administered via the use of email, drop and pick later method to
the managers in the organization. According to Cooper and Schindler (2006) the use of
structured questions on the questionnaire allows for uniformity of responses to questions.
The questionnaire was in 3 sections. Section A contained demographic information;
22
Section B was a series of statements to capture perception of managers on the leadership
style, and Section C will be for capturing leaders‘ self-rated performance. The key
variables include the independent variables, which are leadership styles namely,
transformational, transactional, and laissez faire The scale used for leadership styles in
order to measure them was the Multi factor Leadership Questionnaire developed by
Avolio and Bass (1995) modified to fit the context of the study. The second variable
measured was the dependent variable which is employee productivity based on a scale of
Yousef (2000).
3.6 Data Analysis
Data analysis according to Kothari (1990) involves a number of closely related operations
which are performed with the purpose of summarizing the collected data and organizing
them in such a manner that they answer the research questions. Before the actual analysis
of data using SPSS, data was cleaned, edited, checked for accuracy and coded. The
completed questionnaires was edited for completeness and consistency; data was checked
for errors and omissions. Quantitative data collected using a questionnaire was analyzed
by the use of descriptive statistics using the Statistical Package for Social Sciences
(SPSS) and presented through percentages, means, standard deviations and frequencies.
A regression model was used to test the influence of leadership on employee
productivity. This helped to evaluate and understand the relationships between the
dependent and independent variables of the study. The two basic types of regression are
linear regression and multiple regressions. Linear regression uses one independent
variable to explain and/or predict the outcome of Y, while multiple regressions use two or
more independent variables to predict the outcome. The general form of each type of
regression is:
Linear Regression: Y = β0 + βX + ɛ (1)
Multiple Regression: Y = β0 + β1X1 + β2X2 + β3X3+ ɛ
Where;
Y = Employee productivity
X1 = Transformational leadership style
X2 = transactional leadership style
23
X3 = Laissez-faire leadership style
β0= Constant Term;
β1, β2, β3= Beta coefficients;
ɛ = Error Term.
24
CHAPTER FOUR
DATA ANALYSIS, PRESENTATIION DISCUSSION AND
INTERPRETATION
4.1 Introduction
This chapter presents the research findings and interpretes them. The chapter presents the
background information of the respondents, findings from the analysis based on the
objectives of the study. Descriptive and inferential statistics have been used to discuss the
findings of the study.
4.1.1 Response Rate
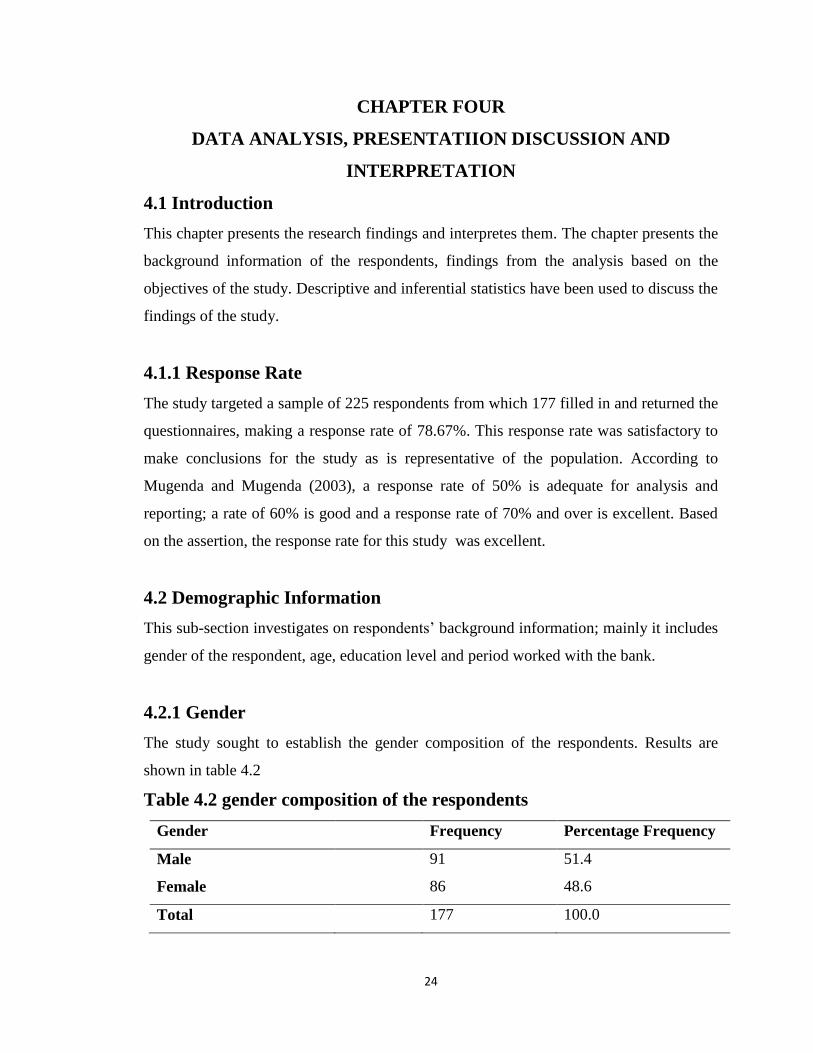
The study targeted a sample of 225 respondents from which 177 filled in and returned the
questionnaires, making a response rate of 78.67%. This response rate was satisfactory to
make conclusions for the study as is representative of the population. According to
Mugenda and Mugenda (2003), a response rate of 50% is adequate for analysis and
reporting; a rate of 60% is good and a response rate of 70% and over is excellent. Based
on the assertion, the response rate for this study was excellent.
4.2 Demographic Information
This sub-section investigates on respondents‘ background information; mainly it includes
gender of the respondent, age, education level and period worked with the bank.
4.2.1 Gender
The study sought to establish the gender composition of the respondents. Results are
shown in table 4.2
Table 4.2 gender composition of the respondents
Gender Frequency Percentage Frequency
Male 91 51.4
Female 86 48.6
Total 177 100.0
25
From the results, it is noted that majority of the respondents as shown by 51.4% were
males whereas 48.6% were females. This shows that the respondents of this study were
mainly dominated by male gender.
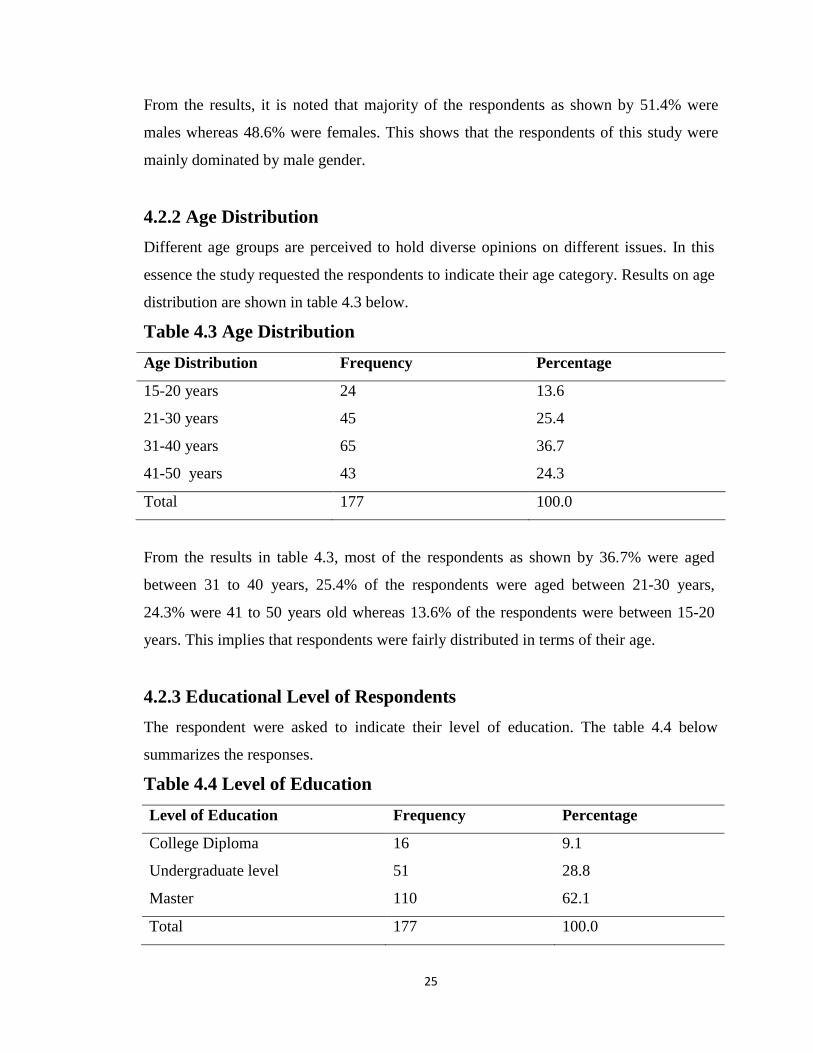
4.2.2 Age Distribution
Different age groups are perceived to hold diverse opinions on different issues. In this
essence the study requested the respondents to indicate their age category. Results on age
distribution are shown in table 4.3 below.
Table 4.3 Age Distribution
Age Distribution Frequency Percentage
15-20 years 24 13.6
21-30 years 45 25.4
31-40 years 65 36.7
41-50 years 43 24.3
Total 177 100.0
From the results in table 4.3, most of the respondents as shown by 36.7% were aged
between 31 to 40 years, 25.4% of the respondents were aged between 21-30 years,
24.3% were 41 to 50 years old whereas 13.6% of the respondents were between 15-20
years. This implies that respondents were fairly distributed in terms of their age.
4.2.3 Educational Level of Respondents
The respondent were asked to indicate their level of education. The table 4.4 below
summarizes the responses.
Table 4.4 Level of Education
Level of Education Frequency Percentage
College Diploma 16 9.1
Undergraduate level 51 28.8
Master 110 62.1
Total 177 100.0
26
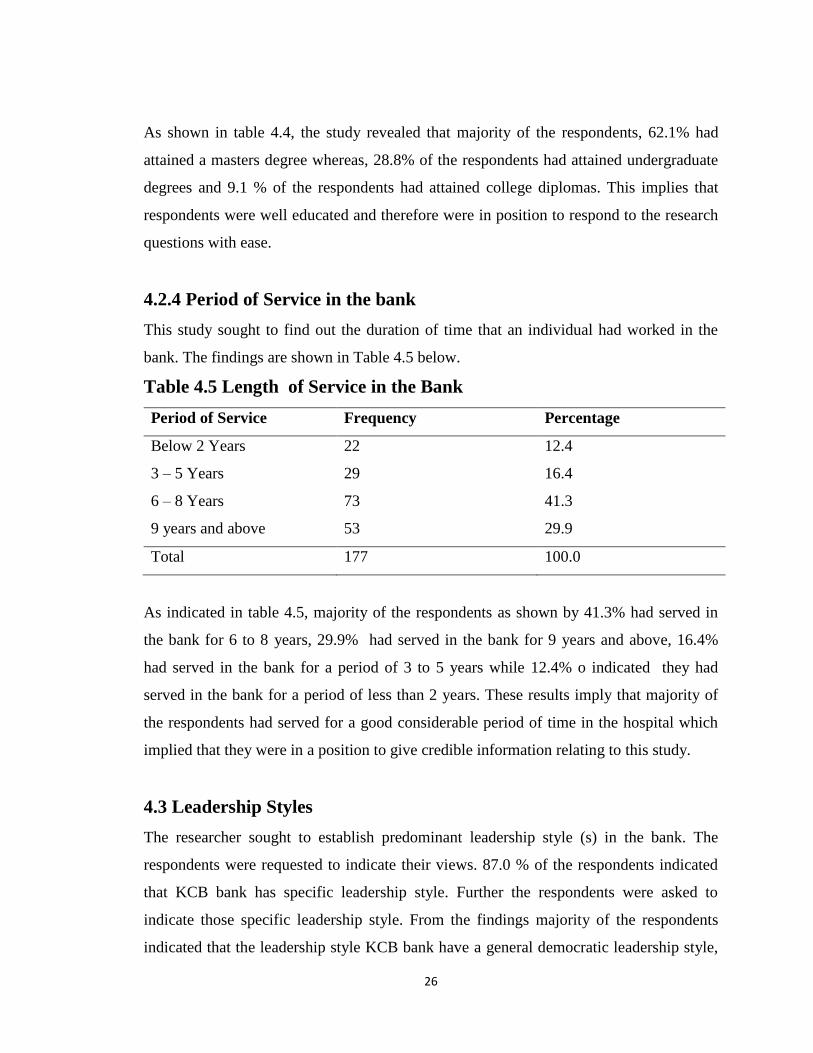
As shown in table 4.4, the study revealed that majority of the respondents, 62.1% had
attained a masters degree whereas, 28.8% of the respondents had attained undergraduate
degrees and 9.1 % of the respondents had attained college diplomas. This implies that
respondents were well educated and therefore were in position to respond to the research
questions with ease.
4.2.4 Period of Service in the bank
This study sought to find out the duration of time that an individual had worked in the
bank. The findings are shown in Table 4.5 below.
Table 4.5 Length of Service in the Bank
Period of Service Frequency Percentage
Below 2 Years 22 12.4
3 – 5 Years 29 16.4
6 – 8 Years 73 41.3
9 years and above 53 29.9
Total 177 100.0
As indicated in table 4.5, majority of the respondents as shown by 41.3% had served in
the bank for 6 to 8 years, 29.9% had served in the bank for 9 years and above, 16.4%
had served in the bank for a period of 3 to 5 years while 12.4% o indicated they had
served in the bank for a period of less than 2 years. These results imply that majority of
the respondents had served for a good considerable period of time in the hospital which
implied that they were in a position to give credible information relating to this study.
4.3 Leadership Styles
The researcher sought to establish predominant leadership style (s) in the bank. The
respondents were requested to indicate their views. 87.0 % of the respondents indicated
that KCB bank has specific leadership style. Further the respondents were asked to
indicate those specific leadership style. From the findings majority of the respondents
indicated that the leadership style KCB bank have a general democratic leadership style,
27
leadership is people driven for purposes of enabling all to realize their dreams. Leaders
lead by example, they are up to date on current business affairs. There are open and clear
lines of communication both horizontally and vertically. Open forums during
meetings/all are given a chance by leaders to express themselves
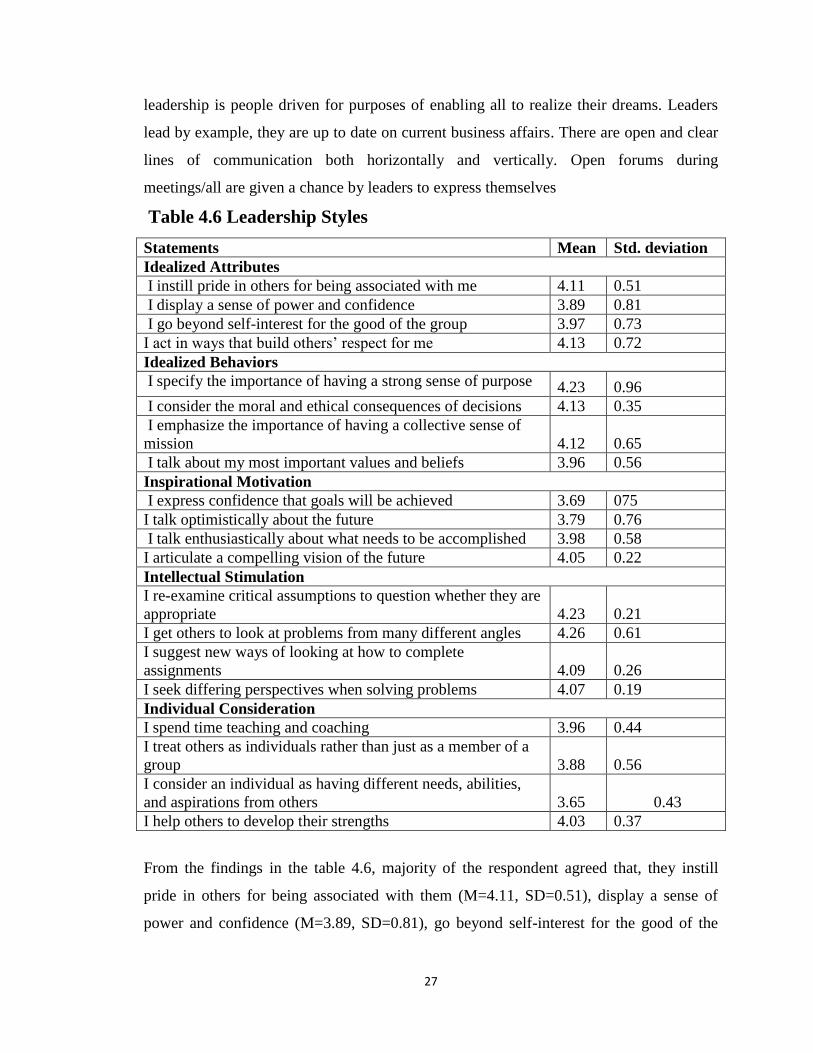
Table 4.6 Leadership Styles
Statements Mean Std. deviation
Idealized Attributes
I instill pride in others for being associated with me 4.11 0.51
I display a sense of power and confidence 3.89 0.81
I go beyond self-interest for the good of the group 3.97 0.73
I act in ways that build others‘ respect for me 4.13 0.72
Idealized Behaviors
I specify the importance of having a strong sense of purpose 4.23 0.96
I consider the moral and ethical consequences of decisions 4.13 0.35
I emphasize the importance of having a collective sense of
mission 4.12 0.65
I talk about my most important values and beliefs 3.96 0.56
Inspirational Motivation
I express confidence that goals will be achieved 3.69 075
I talk optimistically about the future 3.79 0.76
I talk enthusiastically about what needs to be accomplished 3.98 0.58
I articulate a compelling vision of the future 4.05 0.22
Intellectual Stimulation
I re-examine critical assumptions to question whether they are
appropriate 4.23 0.21
I get others to look at problems from many different angles 4.26 0.61
I suggest new ways of looking at how to complete
assignments 4.09 0.26
I seek differing perspectives when solving problems 4.07 0.19
Individual Consideration
I spend time teaching and coaching 3.96 0.44
I treat others as individuals rather than just as a member of a
group 3.88 0.56
I consider an individual as having different needs, abilities,
and aspirations from others 3.65 0.43
I help others to develop their strengths 4.03 0.37
From the findings in the table 4.6, majority of the respondent agreed that, they instill
pride in others for being associated with them (M=4.11, SD=0.51), display a sense of
power and confidence (M=3.89, SD=0.81), go beyond self-interest for the good of the
28
group (M=3.97, SD=0.73) and act in ways that build others‘ respect (M=4.13, SD=0.72).
Further the respondent agreed that, they; specify the importance of having a strong sense
of purpose (M=4.23, SD=0.96), consider the moral and ethical consequences of decisions
(M=4.13, SD=0.35), emphasize the importance of having a collective sense of mission
(M=4.12, SD=0.65) and talk about my most important values and beliefs (M=3.96,
SD=0.56). This finding is in line with (Muller, 2007) that autocratic leaders use their
position to pursue aggressive and visionary goals and their power through organization
culture, press and media to praise their own initial success.
Further the respondents were confident that goals will be achieved (M=3.69, SD=0.75),
talked optimistically about the future (M=3.79, SD=0.76), talked enthusiastically about
what needs to be accomplished (M=3.98, SD=0.58) and articulate a compelling vision of
the future (M=4.05, SD=0.22). They further agreed that they re-examine critical
assumptions to question whether they are appropriate (M=4.23, SD=0.21), get others to
look at problems from many different angles (M=4.26, SD=0.61), suggest new ways of
looking at how to complete assignments (M=4.09, SD=0.26) and seek differing
perspectives when solving problems (M=4.07, SD=0.19). The respondents also agreed
that they spend time teaching and coaching (M=3.96, SD=0.44), treat others as
individuals rather than just as a member of a group (M=3.88, SD=0.56), consider an
individual as having different needs, abilities, and aspirations from others (M=3.65,
SD=0.43) and help others to develop their strengths (M=4.03, SD=0.37). This finding
concurs with that of (Gastil, 2012) that democratic manager keeps his or her employees
informed about everything that affects their work and shares decision making and
problem solving responsibilities.
Further, the respondents were requested to rate the statements in table 4.7 using a scale of
1-5, where 5= strongly agree; 4=Agree; 3=Neutral; 2= Disagree; 1=strongly Disagree.
The average mean and standard deviations are shown in Table 4.7 below.
29
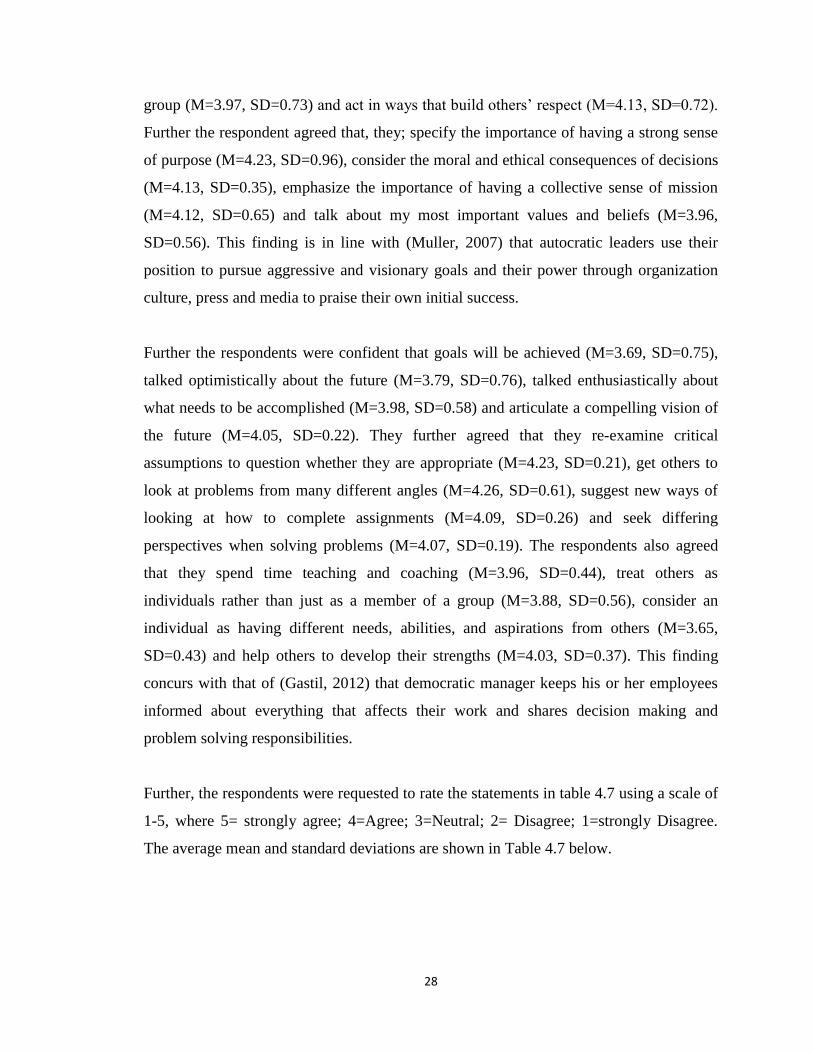
Table 4.7 working style/relationship with Subordinates
Statements Mean Std. deviation
Contingent Reward (CR)
I express satisfaction when others meet expectations 4.08 0.81
I discuss in specific terms who is responsible for achieving
performance targets 3.93 0.14
I make clear what one can expect to receive when
performance goals are achieved 3.68 0.21
I provide others with assistance in exchange for their efforts 4.06 0.65
Management-by-Exception: Active (MBEA)
I direct my attention toward failures to meet standards 3.98 0.56
I keep track of all mistakes 3.95 0.35
I focus attention on irregularities, mistakes, exceptions, and
deviations from standards 4.21 0.28
I concentrate my full attention on dealing with mistakes,
complaints, and failures 4.02 0.69
Management-by-Exception: Passive (MBEP)
I fail to interfere until problems become serious 2.00 0.11
I wait for things to go wrong before taking action 1.61 0.62
I show that I am a firm believer in ―If it ain‘t broke, don‘t fix
it.‖ 2.31 0.20
I demonstrate that problems must become chronic before I
take action 1.98 0.63
I avoid getting involved when important issues arise 1.96 0.26
I am absent when needed 2.01 0.39
I avoid making decisions 1.02 0.32
I delay responding to urgent questions 1.12 1.03
The findings in table 4.7 indicated that most of the respondents agreed that they express
satisfaction when others meet expectations (M=4.08, SD=0.81), they discuss in specific
terms who is responsible for achieving performance targets (M=3.93, SD=0.14), make
clear what one can expect to receive when performance goals are achieved (M=3.68,
SD=0.21) and they provide others with assistance in exchange for their efforts (M=4.06,
SD=0.65). They further agreed that; they direct their attention toward failures to meet
standards (M=3.98, SD=0.56), they keep track of all mistakes (M=3.95, SD=0.35), focus
attention on irregularities, mistakes, exceptions, and deviations from standards (M=4.21,
SD=0.28) and they concentrate my full attention on dealing with mistakes, complaints,
and failures (M=4.02, SD=0.69). This finding is in line with Cummings (2010) that
demonstration of a problem comes before chronic action.
30
Further majority of the respondent disagreed that; they fail to interfere until problems
become serious (M=2.00, SD=0.11), wait for things to go wrong before taking action
(M=1.61, SD=0.62), show that I am a firm believer in ―If it ain‘t broke, don‘t fix it
(M=2.31, SD=0.20) and they demonstrate that problems must become chronic before I
take action (M=1.98, SD=0.63). They further disagreed that they avoid getting involved
when important issues arise (M=1.96, SD=0.26), they are absent when needed (M=2.01,
SD=0.39), they avoid making decisions (M=1.02, SD=0.32) and they delay responding to
urgent questions (M=1.12, SD=1.03). This finding is in line with Aronson,(2011)
productivity measures should be valid and also be perceived as valid by organisational
members in order to gain increased acceptance.
4.4 Balance Score Card Rating
Table 4.8 shows the data obtained from the average weighting / ratings awarded on the
Balance score card (BSC) as an average for each group of employees under the categories
namely; Managers, Business focus team, Operations and compliance, Tellers and
Customers service team as at 31st December 2015,for KCB Bank K Ltd-Nairobi Region
Branches.
31
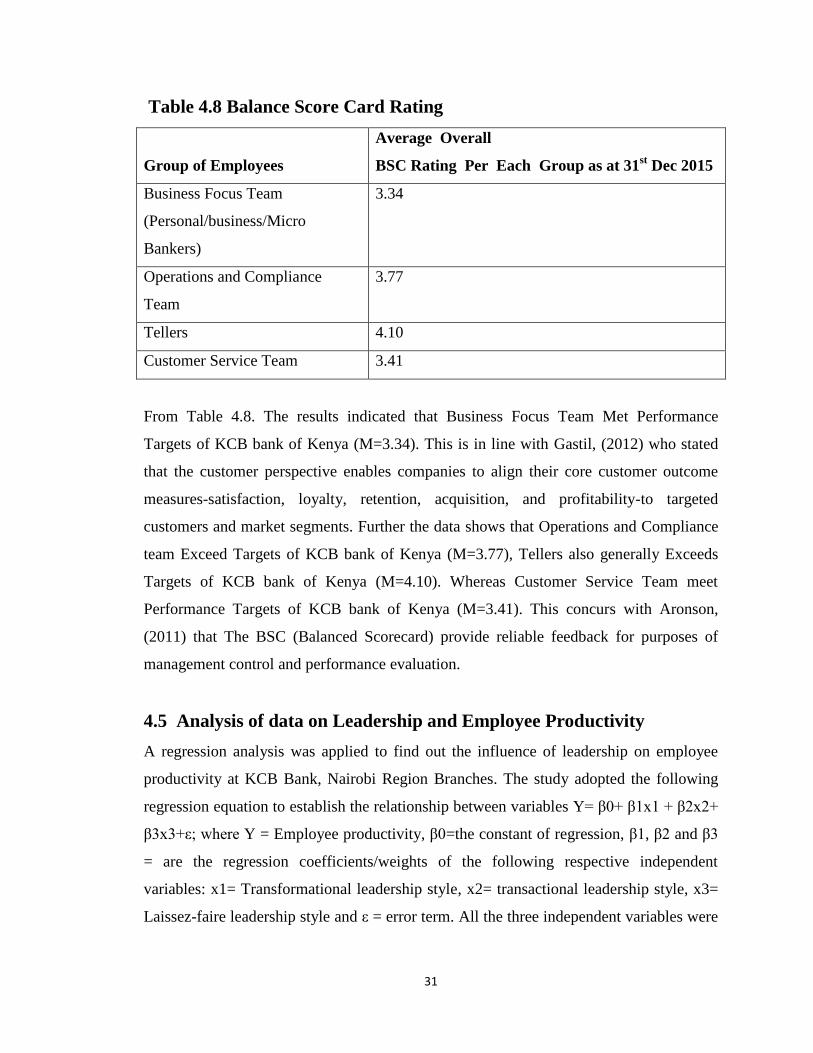
Table 4.8 Balance Score Card Rating
Group of Employees
Average Overall
BSC Rating Per Each Group as at 31st Dec 2015
Business Focus Team
(Personal/business/Micro
Bankers)
3.34
Operations and Compliance
Team
3.77
Tellers 4.10
Customer Service Team 3.41
From Table 4.8. The results indicated that Business Focus Team Met Performance
Targets of KCB bank of Kenya (M=3.34). This is in line with Gastil, (2012) who stated
that the customer perspective enables companies to align their core customer outcome
measures-satisfaction, loyalty, retention, acquisition, and profitability-to targeted
customers and market segments. Further the data shows that Operations and Compliance
team Exceed Targets of KCB bank of Kenya (M=3.77), Tellers also generally Exceeds
Targets of KCB bank of Kenya (M=4.10). Whereas Customer Service Team meet
Performance Targets of KCB bank of Kenya (M=3.41). This concurs with Aronson,
(2011) that The BSC (Balanced Scorecard) provide reliable feedback for purposes of
management control and performance evaluation.
4.5 Analysis of data on Leadership and Employee Productivity
A regression analysis was applied to find out the influence of leadership on employee
productivity at KCB Bank, Nairobi Region Branches. The study adopted the following
regression equation to establish the relationship between variables Y= β0+ β1x1 + β2x2+
β3x3+ε; where Y = Employee productivity, β0=the constant of regression, β1, β2 and β3
= are the regression coefficients/weights of the following respective independent
variables: x1= Transformational leadership style, x2= transactional leadership style, x3=
Laissez-faire leadership style and ε = error term. All the three independent variables were
32
measured using the responses on each of the variables obtained from the respondents.
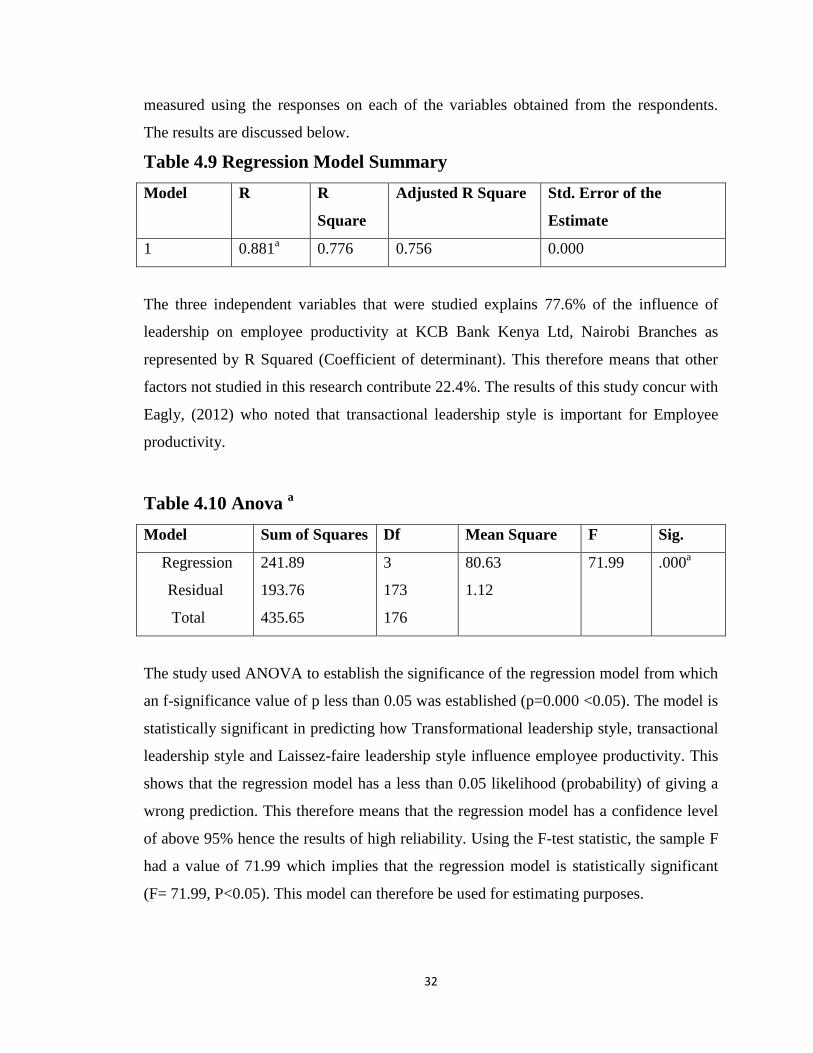
The results are discussed below.
Table 4.9 Regression Model Summary
Model R R
Square
Adjusted R Square Std. Error of the
Estimate
1 0.881a
0.776 0.756 0.000
The three independent variables that were studied explains 77.6% of the influence of
leadership on employee productivity at KCB Bank Kenya Ltd, Nairobi Branches as
represented by R Squared (Coefficient of determinant). This therefore means that other
factors not studied in this research contribute 22.4%. The results of this study concur with
Eagly, (2012) who noted that transactional leadership style is important for Employee
productivity.
Table 4.10 Anova a
Model Sum of Squares Df Mean Square F Sig.
1 Regression
Residual
Total
241.89
193.76
435.65
3
173
176
80.63
1.12
71.99 .000a
The study used ANOVA to establish the significance of the regression model from which
an f-significance value of p less than 0.05 was established (p=0.000 <0.05). The model is
statistically significant in predicting how Transformational leadership style, transactional
leadership style and Laissez-faire leadership style influence employee productivity. This
shows that the regression model has a less than 0.05 likelihood (probability) of giving a
wrong prediction. This therefore means that the regression model has a confidence level
of above 95% hence the results of high reliability. Using the F-test statistic, the sample F
had a value of 71.99 which implies that the regression model is statistically significant
(F= 71.99, P<0.05). This model can therefore be used for estimating purposes.
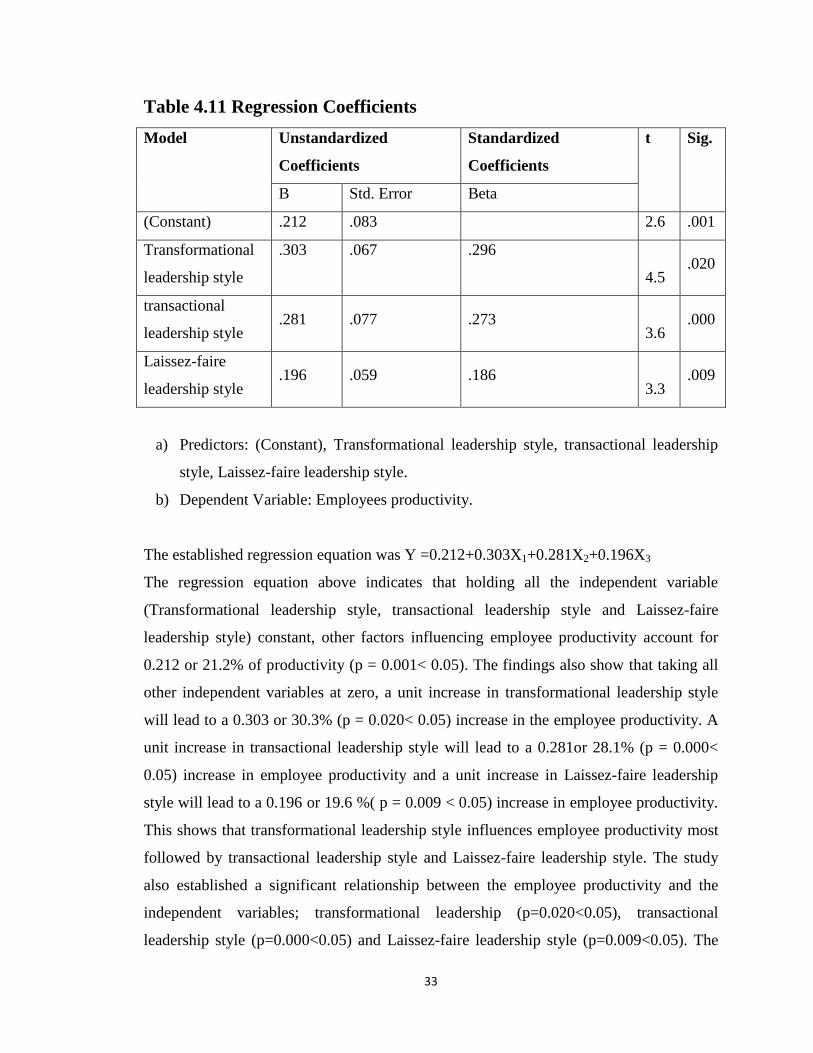
33
Table 4.11 Regression Coefficients
Model Unstandardized
Coefficients
Standardized
Coefficients
t Sig.
B Std. Error Beta
(Constant) .212 .083 2.6 .001
Transformational
leadership style
.303 .067 .296
4.5 .020
transactional
leadership style .281 .077 .273
3.6 .000
Laissez-faire
leadership style .196 .059 .186
3.3 .009
a) Predictors: (Constant), Transformational leadership style, transactional leadership
style, Laissez-faire leadership style.
b) Dependent Variable: Employees productivity.
The established regression equation was Y =0.212+0.303X1+0.281X2+0.196X3
The regression equation above indicates that holding all the independent variable
(Transformational leadership style, transactional leadership style and Laissez-faire
leadership style) constant, other factors influencing employee productivity account for
0.212 or 21.2% of productivity (p = 0.001< 0.05). The findings also show that taking all
other independent variables at zero, a unit increase in transformational leadership style
will lead to a 0.303 or 30.3% (p = 0.020< 0.05) increase in the employee productivity. A
unit increase in transactional leadership style will lead to a 0.281or 28.1% (p = 0.000<
0.05) increase in employee productivity and a unit increase in Laissez-faire leadership
style will lead to a 0.196 or 19.6 %( p = 0.009 < 0.05) increase in employee productivity.
This shows that transformational leadership style influences employee productivity most
followed by transactional leadership style and Laissez-faire leadership style. The study
also established a significant relationship between the employee productivity and the
independent variables; transformational leadership (p=0.020<0.05), transactional
leadership style (p=0.000<0.05) and Laissez-faire leadership style (p=0.009<0.05). The
34
regression coefficients were tested for significance at alfa = 0.05. Significance occurs at
p-values less than 0.05. From the above results, all the predictors are good predictors for
the employee productivity. These findings are consistent with that of Men, (2013) who
found that transformational leadership has a relationship with employee productivity.
4.6 Discussion of the Findings
From prediction by regression model, the study established that a unit increase in
transformational leadership style leads to a 0.303 or 30.3% (p = 0.020< 0.05) increase in
the employee productivity, unit increase in transactional leadership style leads to a
0.281or 28.1% (p = 0.000< 0.05) increase in employee productivity and a unit increase in
Laissez-faire leadership style leads to a 0.196 or 19.6% (p = 0.009 < 0.05) increase in
employee productivity. This finding is in line with Hurduzeu (2015) who established a
significant relationship between the leadership styles and employee productivity, which
meant that there was a significant impact of leadership styles towards the employee
productivity in the retail industry.
The study established that employees act in a ways that build each other, display a sense
of power and confidence and they go beyond self-interest for the good of the group
(M=3.97, SD=0.73). The study further established that employees specified the
importance of having a strong sense of purpose, consider the moral and ethical
consequences of decisions and talk most about important values and beliefs. The study
further revealed that most of employees expresses confidence that goals will be achieved
(M=3.69, SD=0.75). This findings concurs to that of Sorenson (2010) who found that
there was a strong impact of leadership behaviors on organizational performance. The
study also noted that employees talk optimistically about the future and articulate a
compelling vision of the future. Most of the employees talk enthusiastically about needs
to be accomplished (M=3.98, SD=0.58).
The study further established that employees re-examined critical assumptions to
question whether they are appropriate and gets others to look at problems from many
different angles. Most of employees suggest new ways of looking at how to complete
35
assignments and seeks differing perspectives when solving problems (M=4.07, SD=0.19).
Further the study noted that employees at KCB bank spend their time teaching and
coaching (M=3.96, SD=0.44) and they consider other people as having different needs,
abilities, and aspirations. They also help others to develop their strengths. This find was
in line with Kerario (2013) who found a positive relationship between transactional
leadership and subordinate job satisfaction which intern yields performance.
The study further established that most of employees at KCB bank express satisfaction
when others meet expectations (M=4.08, SD=0.81). They discuss in specific terms who is
responsible for achieving performance targets, they make clear what one expect to
receive when performance goals are achieved and they provide others with assistance in
exchange for their efforts. The study further revealed that employees direct their attention
toward failures to meet standards, they keep track of all mistakes and focus attention on
irregularities, mistakes, exceptions, and deviations from standards. Employees also
concentrate their full attention on dealing with mistakes, complaints, and failures
(M=4.02, SD=0.69). This finding is in line with (Aronson, 2011) productivity measures
should be valid and also be perceived as valid by organisational members in order to gain
increased acceptance.
Further the study established that employees do not fail to interfere until problems
become serious (M=2.00, SD=0.11), they do not wait for things to go wrong before
taking action (M=1.61, SD=0.62) and they do not show that they are a firm believer in ―If
it ain‘t broke, don‘t fix it.‖ Further the study revealed that most of employees at KCB
bank do not; demonstrate that problems must become chronic before I take action, avoid
getting involved when important issues arise and avoid making decisions. It wa also
established that they are present when needed they do not delay responding to urgent
questions. This finding conforms to that of Sorenson, (2010) who found leadership
behaviors to be very important key factors for the growth of the companies in the service
sectors.
36
CHAPTER FIVE
SUMMARY OF FINDINGS CONCLUSION AND
RECOMMENDATIONS
5.1 Introduction
This chapter presents the summary of the data findings on the analysis of the influence of
leadership on employee productivity at KCB Bank Kenya Ltd, conclusions and
recommendations are drawn there to. The chapter is structured into summary of findings,
conclusions, recommendations, limitation of the study and areas of further studies.
5.2 Summary of findings
This section presents the key findings as considered under each objective in the study.
The findings on the demographic information of the respondents greatly enhanced the
reliability of the research findings. The study findings indicate that majority of the
respondents had worked with the bank for more than six years, coupled with the relevant
education level needed to enhance the reliability of the information that they provided.
The study revealed that a unit increase in transformational leadership style leads to an
increase in the employee productivity, unit increase in transactional leadership style lead
increase in employee productivity and a unit increase in Laissez-faire leadership style
lead to increase in employee productivity. The independent variables explained 77.6% of
the influence of leadership on employee productivity at KCB Bank Kenya Ltd. The
model was found statistically significant in predicting how Transformational leadership
style, transactional leadership style and Laissez-faire leadership style have influence on
employee productivity.
The study has also established that employees at KCB bank act in a ways that build each
other, display a sense of power and confidence and they go beyond self-interest for the
good of the group. Employees also specify the importance of having a strong sense of
purpose, consider the moral and ethical consequences of decisions and they talk most
about important values and beliefs. The study further revealed that most of employees
37
expresses confidence that goals will be achieved and they talk optimistically about the
future and articulate a compelling vision of the future.
The study has also revealed that employees re-examine critical assumptions to question
whether they are appropriate and gets others to look at problems from many different
angles. Most of employees suggest new ways of looking at how to complete assignments
and seeks differing perspectives when solving problems. Further the study noted has that
employees at KCB bank spend their time teaching and coaching. They also consider other
people as having different needs, abilities, and aspirations and help others to develop
their strengths.
Further the study has established that employees at KCB bank express satisfaction when
others meet expectations and they discuss in specific terms who is responsible for
achieving performance targets, they make clear what one expect to receive when
performance goals are achieved and they provide others with assistance in exchange for
their efforts. The study further revealed that employees direct their attention toward
failures to meet standards, they keep track of all mistakes and focus attention on
irregularities, mistakes, exceptions, and deviations from standards. Employees also
concentrate their full attention on dealing with mistakes, complaints, and failures.
Finally the study revealed that employees do not fail to interfere until problems become
serious and they do not wait for things to go wrong before taking action. Further the
study revealed that most of employees at KCB bank do not; demonstrate that problems
must become chronic before they take action, avoid getting involved when important
issues arise and avoid making decisions. It was also established that they are present
when needed they do not delay responding to urgent questions.
5.3 Conclusion
This study has provided a comprehensive study of the influence of leadership on
employee productivity at KCB Bank Kenya Ltd within Nairobi Branches. Based on the
findings of this study, it is concluded that a unit increase in transformational leadership
style, transactional leadership style and Laissez-faire leadership style leads to increase in
38
employee productivity. The model was found statistically significant in predicting how
the independent variable influence employee productivity.
Further the study concludes that employees at KCB bank act in ways that build each
other, display a sense of power and confidence and they go beyond self-interest for the
good of the group. They specify the importance of having a strong sense of purpose,
consider the moral and ethical consequences of decisions and they talk most about
important values and corresponding behaviors. Most of employees express confidence
that goals will be achieved and they talk optimistically about the future and articulate a
compelling vision of the future. Employees also re-examine critical assumptions to
question whether they are appropriate and gets others to look at problems from many
different angles. They suggest new ways of looking at how to complete assignments and
seeks differing perspectives when solving problems. Supervisors at KCB bank spend
their time teaching and coaching and consider other people as having different needs,
abilities, and aspirations and help them to develop their strengths.
The study also concludes that employees at KCB bank express satisfaction when others
meet expectations and they discuss in specific terms who is responsible for achieving
performance targets, they make clear what one expect to receive when performance goals
are achieved and they provide others with assistance in exchange for their efforts.
Employees direct their attention toward challenges to meet standards, they keep track of
all mistakes and focus attention on irregularities, mistakes, exceptions, and deviations
from standards. Further, the study concludes that employees do not fail to interfere until
problems become serious and they do not wait for things to go wrong before taking
action. Managers at KCB bank do not; demonstrate that problems must become chronic
before taking action, avoid getting involved when important issues arise and avoid
making decisions. They are present when needed and do not delay responding to urgent
questions.
5.4 Policy Recommendations
The study recommends that KCB managements pay more attention to improving
supervisors' management and leadership skills and to monitoring the relationship between
39
managers and employees. Some strategies and managerial plans need to be developed in
KCB bank in order to attain extra ordinary employee productivity.
The leaders should be aware of what is important for the subordinates and the
organizations as a whole and encourage the employees to see the opportunities and
challenges around them creatively. The supervisors should also have their own visions
and development plans for followers, working in groups and champion team work spirit
The supervisors should have sense of innovation and also encourage followers to seek
more opportunities and possibilities, not just achieve performance within expectations.
Supervisors should understand the values of the followers and try to build their
departmental/ unit‘s business strategies, plans, processes and practices that will likely to
improve the wellbeing of staff. Respect for individual is also very key in building a
cohesive relationship between leaders and employees.
5.5 Limitations of the Study
One of the major limitation was confidentiality of the KCB bank information. There was
unwillingness of informants from KCB bank staff to give information and fill
questionnaire. Some respondents feared that the information obtained would be used
against them; this scared away respondents from filling them thus the researcher had to
assure them that the information provided would be confidential to minimize the fear.
Inadequate time and finances also posed challenges in this study.
5.6 Recommendation for Further Research
The study recommends that further studies can be done to determine the relationship
between leadership on employee productivity and performance of KCB Bank Kenya Ltd.
The case study focused on the influence of leadership on employee productivity at KCB
Bank Kenya Ltd, Nairobi Region Branches. It is therefore recommended that a similar
study be replicated in other 5 Regions of KCB bank Kenya Ltd.
Indeed, further research should also be done involving all the employees at commercial
banks.
40
REFERENCES
Akoth, G. (2015). The transformational leadership on the performance of employees in
Kenya: the case of Kenya wildlife service. (Doctoral dissertation).
Anbari, F. T. (2003). Earned value project management method and extensions. Project
Management Journal, 34 (4), 12-23.
Aronson, E. (2011). Integrating leadership styles and ethical perspectives. Canadian
Journal of Administrative Sciences/Revue Canadienne des Sciences de
l'Administration, 18(4), 244-256.
Bass, B. M., & Avolio, B. J. (2006). Full range leadership development: Manual for the
Multifactor Leadership Questionnaire (pp. 43-44). Palo Alto, CA: Mind Garden.
Blanchard, K., & Hersey, P. (2008). Situational leadership. Leadership Excellence, 25(5),
19.
Bryman, P. N., & Bell K. (2003). Research methods in business studies: A practical
guide. Pearson Education.
Burns, A. (1978). Transformational theory: Grounded theory after the postmodern turn.
Sage.
Burns, G. (1978). The micropolitics of educational leadership: From control to
empowerment. Teachers College Press, Columbia University, 1234 Amsterdam
Ave., New York, NY 10027.
Bushra, F., Ahmad, U., & Naveed, A. (2011). Effect of transformational leadership on
employees' job satisfaction and organizational commitment in banking sector of
Lahore (Pakistan). International journal of Business and Social science, 2(18).
Cooper, D.R & Schindler, P.S. (2006). Business Research Methods (8th edn) McGraw-
Hill: New York.
Creswell, J.W. & Clark, V.P. (2007). Designing and conducting mixed methods research.
Thousand Oaks: Sage Publications Inc
Cummings, G. G., & Stafford, E. (2010). Leadership styles and outcome patterns for the
nursing workforce and work environment: a systematic review. International
journal of nursing studies, 47(3), 363-385.
41
David, P. (2003). The effect of organisational culture and leadership style on job
satisfaction and organisational commitment: A cross-national comparison.
Journal of management development, 23(4), 321-338.
Deming, C. R. (1990). Research methodology: Methods and techniques. New Age
International.
Eagly, A. H., Johannesen-Schmidt, M. C., & Van Engen, M. L. (2012). Transformational,
transactional, and laissez-faire leadership styles: a meta-analysis comparing
women and men. Psychological bulletin, 129(4), 569.
Egri, C. P., & Herman, S. (2011). Leadership in the North American environmental
sector: Values, leadership styles, and contexts of environmental leaders and their
organizations. Academy of Management journal, 43(4), 571-604.
Evans, M. G. (1970). Extensions of a path-goal theory of motivation.
Eze, J. (2011). Leadership behaviours: effects on job satisfaction, productivity and
organizational commitment. Journal of nursing management, 9(4), 191-204.
Fiedler, F. E. (1998). The contingency model and the dynamics of the leadership process.
Advances in experimental social psychology, 11, 59-112.
Gakenia, C. N. (2008). Strategy implementation in Kenya Commercial Bank (Doctoral
dissertation).
Gastil, J. (2012). A meta-analytic review of the productivity and satisfaction of
democratic and autocratic leadership. Small Group Research, 25(3), 384-410.
Gong, Y., Huang, J. C., & Farh, J. L. (2009). Employee learning orientation,
transformational leadership, and employee creativity: The mediating role of
employee creative self-efficacy. Academy of management Journal, 52(4), 765-
778.
Graen, G., Dansereau, F., & Minami, T. (2013). Dysfunctional leadership styles.
Organizational behavior and human performance, 7(2), 216-236.
Graen, R. J. (2013). The effects of transformational, transactional, and laissez faire
leadership characteristics on subordinate influencing behavior. Basic and Applied
Social Psychology, 11(2), 191-203.
Hadler, W. T. (2015). Effect of leadership styles on employee performance. Academy of
management Journal, 52(4), 765-778.
42
Hurduzeu, R. E. (2015). The impact of leadership on organizational performance. SEA-
Practical Application of Science, (7), 289-294.
Idowu, Y. M. (2011). Effects of leadership style on organizational performance: a survey
of selected small scale enterprises in Ikosi-Ketu council development area of
Lagos state, Nigeria. Lagos University Press. Lagos
Javaid, J. (2012). Leadership behaviours: effects on job satisfaction, productivity and
organizational commitment. Journal of nursing management, 9(4), 191-204.
Kamau, H. N. (2013). Fringe benefits effects on employee productivity in the public
sector (a case of state department of water, Nairobi County, Kenya) (Doctoral
dissertation, Kenyatta University.
Kendrick, E., & Harris, L. C. (2004). Leadership style, organizational culture and
performance: empirical evidence from UK companies. International Journal of
Human Resource Management, 11(4), 766-788.
Kerario, N. B. (2013). The Impact of Transactional Leadership on the Performance of
Employees in Kenya: The Case of Mumias Sugar Company (Doctoral
dissertation).
Kithinji, G. (2010). The effects of leader—member exchange and job design on
productivity and satisfaction: Testing a dual attachment model. Organizational
behavior and human performance, 30(1), 109-131.
Kitili, P. K. (2013). An investigation of the influence of leadership style on employee
performance in Kenya. A case study of Coffee research foundation in Ruiru
(Doctoral dissertation).
Koopman, C., Pelletier, K. R., Murray, J. F., Sharda, C. E., Berger, M. L., Turpin, R. S.,
... & Bendel, T. (2005). Stanford presenteeism scale: health status and employee
productivity. Journal of occupational and environmental medicine, 44(1), 14-20.
Kothari, C. R. (2004). Research methodology: methods and techniques, (2nded.). New
Delhi. New Age International (P) Limited
Krishnan Loke, J. (2005). Leadership behaviours: effects on job satisfaction, productivity
and organizational commitment. Journal of nursing management, 9(4), 191-204.
Lake, D. (2000). Increasing employee productivity, job satisfaction, and organizational
commitment. Journal of Healthcare Management, 41(2), 160.
43
Lam, G. (2002). How leaders influence organizational effectiveness. The leadership
quarterly, 19(6), 708-722.
Leban, W., & Zulauf, C. (2014). Linking emotional intelligence abilities and
transformational leadership styles. Leadership & Organization Development
Journal, 25(7), 554-564.
Leng, P. (2014). The effect of organisational culture and leadership style on job
satisfaction and organisational commitment: A cross-national comparison.
Journal of management development, 23(4), 321-338.
Lewis, C.W. and S.C. Gilman. (2013). The Ethics Challenge in Public Service: A
Problem-solving Guide. Jossey-Bass, San Francisco, CA.
Manz, C. C. (2006). Self-leadership: Toward an expanded theory of self-influence
processes in organizations. Academy of Management review, 11(3), 585-600.
Marete, F. G. (2014). The relationship between manager’s leadership style and employee
engagement in geothermal development company (GDC) (Doctoral dissertation,
University of Nairobi).
Mathias, K. K., & John, T. M. (2007). Impact of employee participation on job
satisfaction, employee commitment and employee productivity. International
Review of Business Research Papers, 3(2), 54-68.
McNamara, R. C. (2009). Perceived organizational support and leader-member exchange:
A social exchange perspective. Academy of Management journal, 40(1), 82-111.
Men, L. R., & Stacks, D. W. (2013). The impact of leadership style and employee
empowerment on perceived organizational reputation. Journal of Communication
Management, 17(2), 171-192.
Mugenda, O. M., & Mugenda, A. G. (2003). Research Methods: Quantitative and
Qualitative Approaches. Nairobi: Acts
Mukui, E. (2011). The effect of transformational leadership on employee performance: a
survey of five selected faith -based nongovernmental organizations in Nairobi
County. (Doctoral dissertation).
Müller, R., & Turner, J. R. (2007). Matching the project manager‘s leadership style to
project type. International journal of project management, 25(1), 21-32.
44
Ngechu, C. R. (2004). Research Methodology: Methods and Techniques
Obiwuru, T. C., Okwu, A. T., Akpa, V. O., & Nwankwere, I. A. (2011). Effects of
leadership style on organizational performance: A survey of selected small scale
enterprises in Ikosi-Ketu council development area of Lagos State, Nigeria.
Australian Journal of Business and Management Research, 1(7), 100.
Pelz, D. C. (2011). Leadership within a hierarchical organization. Journal of Social
Issues, 7(3), 49-55.
Rita, R. J. (2010). The impact of leadership style and employee empowerment on
perceived organizational reputation. Journal of Communication Management,
17(2), 171-192.
Sekaran, D. (2005). A general guide to writing research proposal and report: A
handbook for beginning research: Kisumu: Options Printers and Publishers.
Sorenson, R. L. (2010). The contribution of leadership style and practices to family and
business success. Family Business Review, 13(3), 183-200.
Sosik, J. J., & Godshalk, V. M. (2009). Leadership styles, mentoring functions received,
and job‐related stress: a conceptual model and preliminary study. Journal of
organizational behavior, 21(4), 365-390.
Stacks, D. W. (2010). The impact of leadership style and employee empowerment on
perceived organizational reputation. Journal of Communication Management,
17(2), 171-192.
Stafford, R. J. (2010). The applicability of Bass's model of transformational,
transactional, and laissez-faire leadership in the hospital administrative
environment. Hospital Topics, 84(2), 11-19.
Tierney, P., Farmer, S. M., & Graen, G. B. (2009). An examination of leadership and
employee creativity: The relevance of traits and relationships. Personnel
psychology, 52(3), 591-620.
Voon, M. L., Lo, M. C., Ngui, K. S., & Ayob, N. B. (2011). The influence of leadership
styles on employees‘ job satisfaction in public sector organizations in Malaysia.
International Journal of Business, Management and Social Sciences, 2(1), 24-32.
45
Warue, C. C. (2013). Self-leadership: Toward an expanded theory of self-influence
processes in organizations. Academy of Management review, 11(3), 585-600.
Yousef, G., (2000). Measurement of the top quark mass with the template method in the
channel using ATLAS data. The European Physical Journal C, 72(6), 1-30.
Yukl, G. (2008). How leaders influence organizational effectiveness. The leadership
quarterly, 19(6), 708-722.
Zaccaro, G. J. (2007). Contingency theories of leadership. Organizational Behavior in
Health Care, 191.
Zhang, X., & Bartol, K. M. (2010). Linking empowering leadership and employee
creativity: The influence of psychological empowerment, intrinsic motivation, and
creative process engagement. Academy of management journal, 53(1), 107-128.
46
APPENDICES
APPENDIX I: Questionnaire for Managers
Section: A: Demographic Information
1. Gender (Tick as applicable)
Male [ ] female [ ]
2. Age group of respondents (Tick as applicable)
15-20[ ] 21-30[ ] 31-40 [ ] 41-50 [ ]
3. Please indicate the highest level of education attained? (Tick as applicable)
College Diploma [ ]
Undergraduate [ ]
Master [ ]
Others (specify)
4. Indicate your period of service in this bank (Tick as applicable)
Below 2 years [ ] 3 to 5 years [ ]
6 to 8 years [ ] 9 years and above [ ]
Section B: Leadership Styles
5. Does your organization have a specific leadership style (s)
Yes [ ]
No [ ]
If yes would you please indicate them?
……………………………………………………………………………
……………………………………………………………………………
…………………………..............................................................................
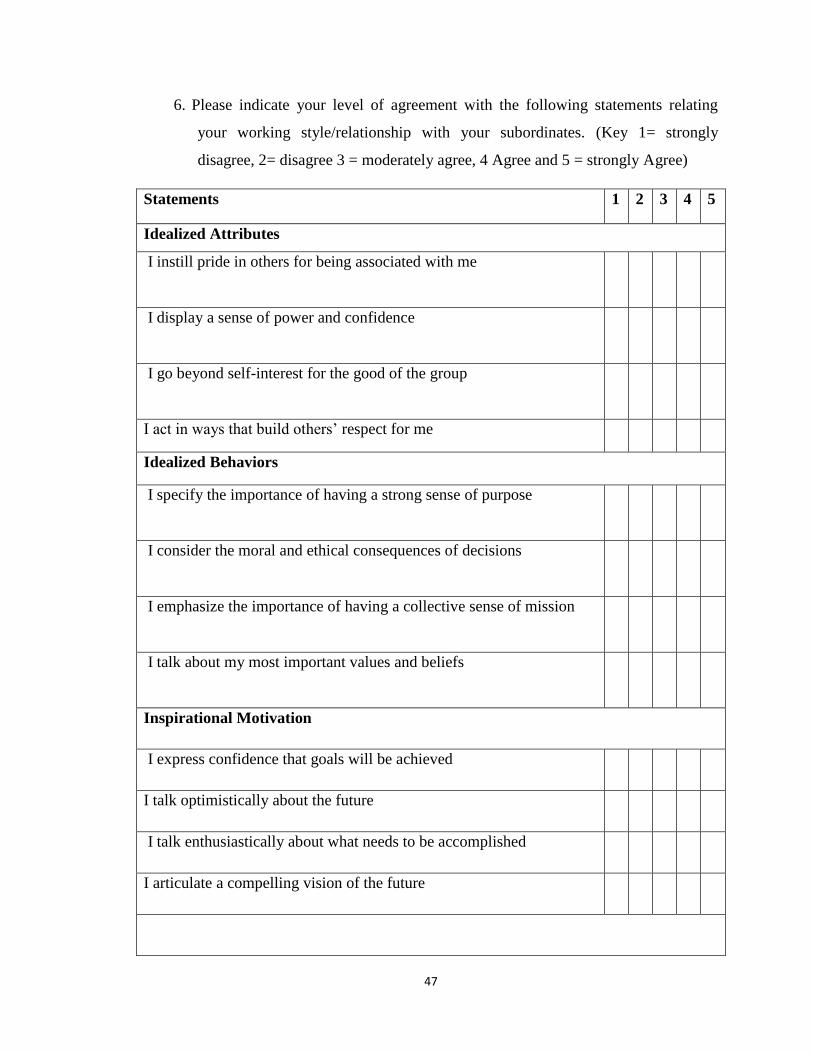
47
6. Please indicate your level of agreement with the following statements relating
your working style/relationship with your subordinates. (Key 1= strongly
disagree, 2= disagree 3 = moderately agree, 4 Agree and 5 = strongly Agree)
Statements 1 2 3 4 5
Idealized Attributes
I instill pride in others for being associated with me
I display a sense of power and confidence
I go beyond self-interest for the good of the group
I act in ways that build others‘ respect for me
Idealized Behaviors
I specify the importance of having a strong sense of purpose
I consider the moral and ethical consequences of decisions
I emphasize the importance of having a collective sense of mission
I talk about my most important values and beliefs
Inspirational Motivation
I express confidence that goals will be achieved
I talk optimistically about the future
I talk enthusiastically about what needs to be accomplished
I articulate a compelling vision of the future
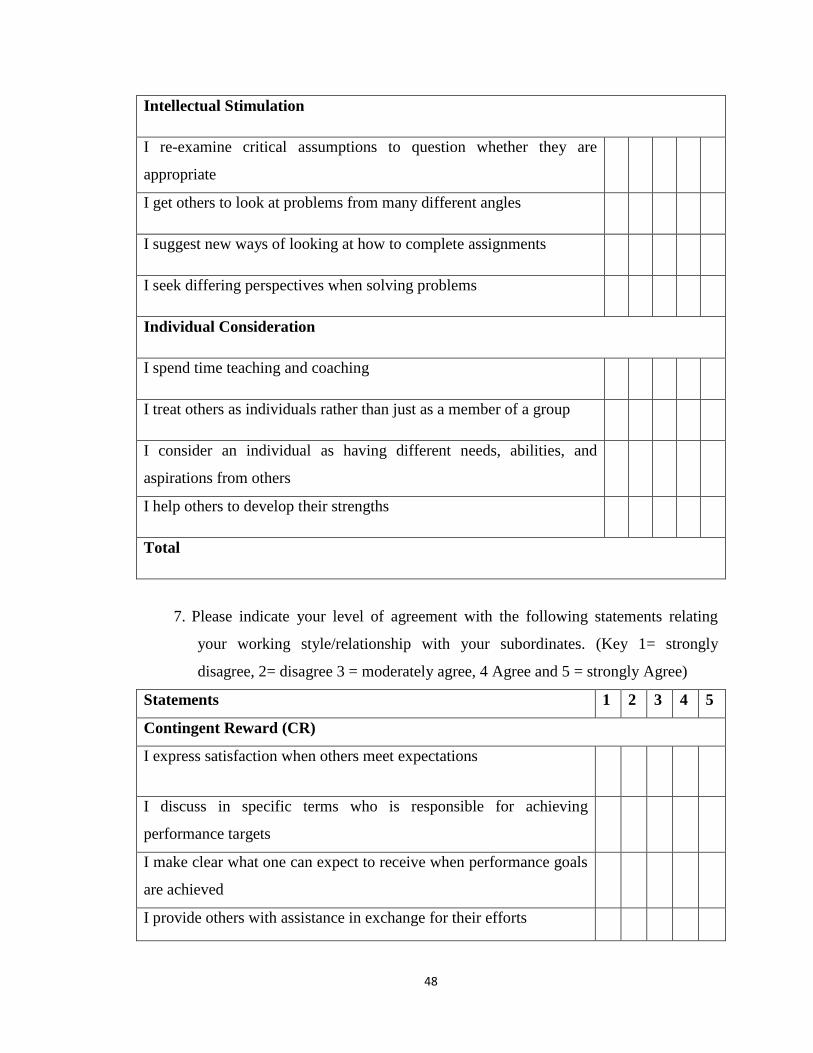
48
Intellectual Stimulation
I re-examine critical assumptions to question whether they are
appropriate
I get others to look at problems from many different angles
I suggest new ways of looking at how to complete assignments
I seek differing perspectives when solving problems
Individual Consideration
I spend time teaching and coaching
I treat others as individuals rather than just as a member of a group
I consider an individual as having different needs, abilities, and
aspirations from others
I help others to develop their strengths
Total
7. Please indicate your level of agreement with the following statements relating
your working style/relationship with your subordinates. (Key 1= strongly
disagree, 2= disagree 3 = moderately agree, 4 Agree and 5 = strongly Agree)
Statements 1 2 3 4 5
Contingent Reward (CR)
I express satisfaction when others meet expectations
I discuss in specific terms who is responsible for achieving
performance targets
I make clear what one can expect to receive when performance goals
are achieved
I provide others with assistance in exchange for their efforts
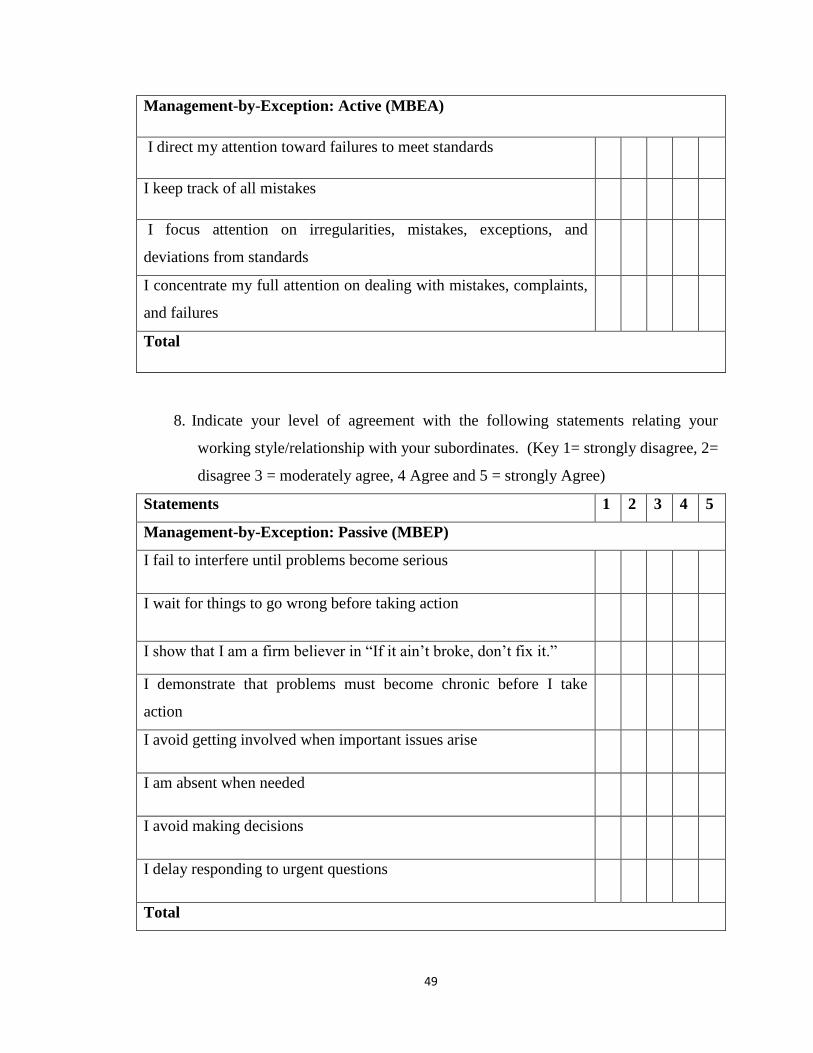
49
Management-by-Exception: Active (MBEA)
I direct my attention toward failures to meet standards
I keep track of all mistakes
I focus attention on irregularities, mistakes, exceptions, and
deviations from standards
I concentrate my full attention on dealing with mistakes, complaints,
and failures
Total
8. Indicate your level of agreement with the following statements relating your
working style/relationship with your subordinates. (Key 1= strongly disagree, 2=
disagree 3 = moderately agree, 4 Agree and 5 = strongly Agree)
Statements 1 2 3 4 5
Management-by-Exception: Passive (MBEP)
I fail to interfere until problems become serious
I wait for things to go wrong before taking action
I show that I am a firm believer in ―If it ain‘t broke, don‘t fix it.‖
I demonstrate that problems must become chronic before I take
action
I avoid getting involved when important issues arise
I am absent when needed
I avoid making decisions
I delay responding to urgent questions
Total
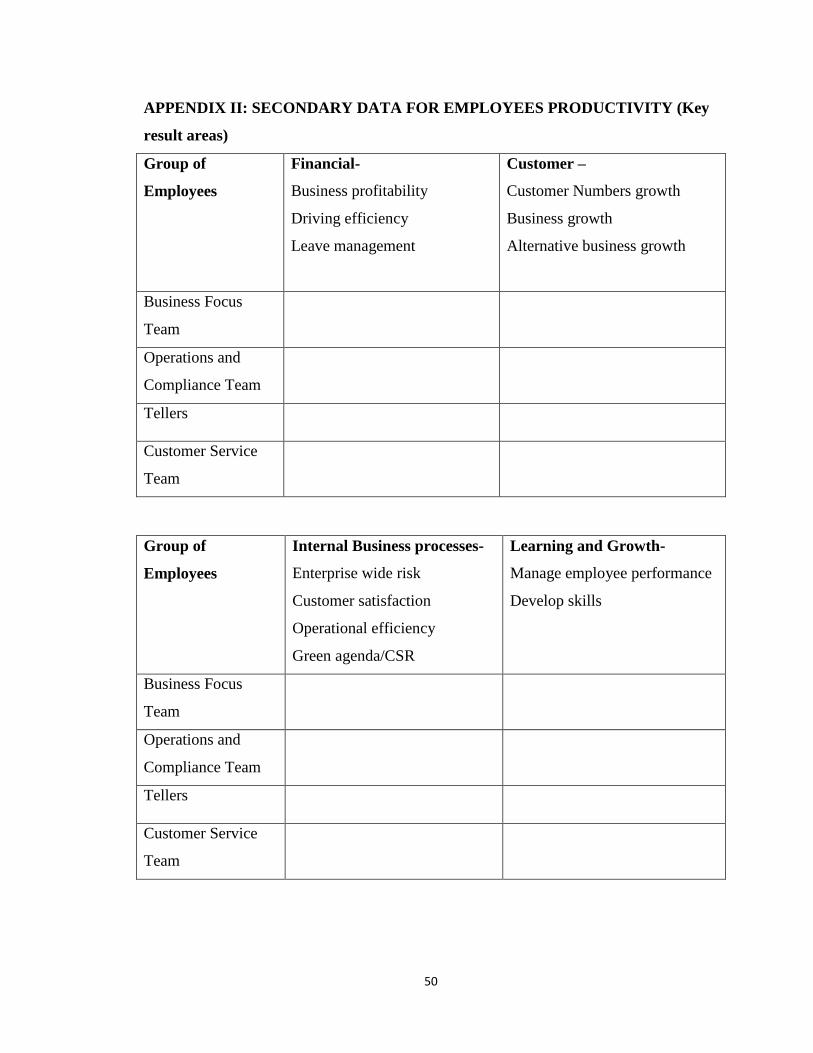
50
APPENDIX II: SECONDARY DATA FOR EMPLOYEES PRODUCTIVITY (Key
result areas)
Group of
Employees
Financial-
Business profitability
Driving efficiency
Leave management
Customer –
Customer Numbers growth
Business growth
Alternative business growth
Business Focus
Team
Operations and
Compliance Team
Tellers
Customer Service
Team
Group of
Employees
Internal Business processes-
Enterprise wide risk
Customer satisfaction
Operational efficiency
Green agenda/CSR
Learning and Growth-
Manage employee performance
Develop skills
Business Focus
Team
Operations and
Compliance Team
Tellers
Customer Service
Team
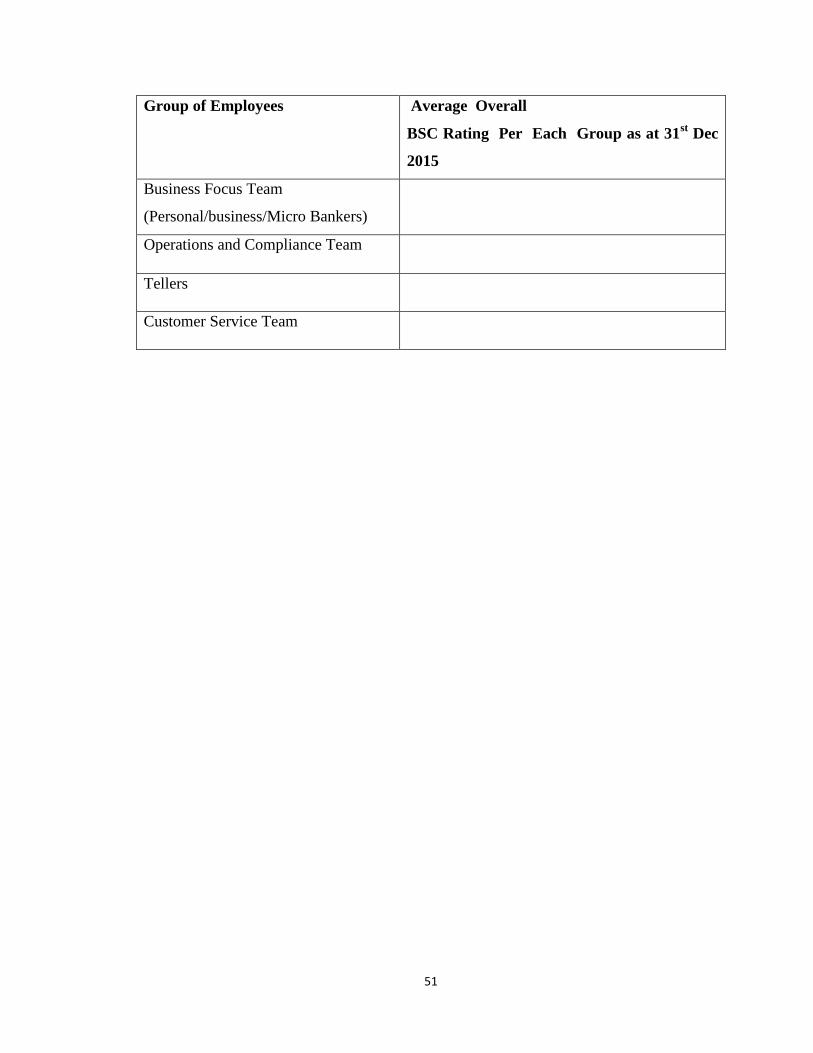
51
Group of Employees Average Overall
BSC Rating Per Each Group as at 31st Dec
2015
Business Focus Team
(Personal/business/Micro Bankers)
Operations and Compliance Team
Tellers
Customer Service Team