Embed Size (px)
Citation preview
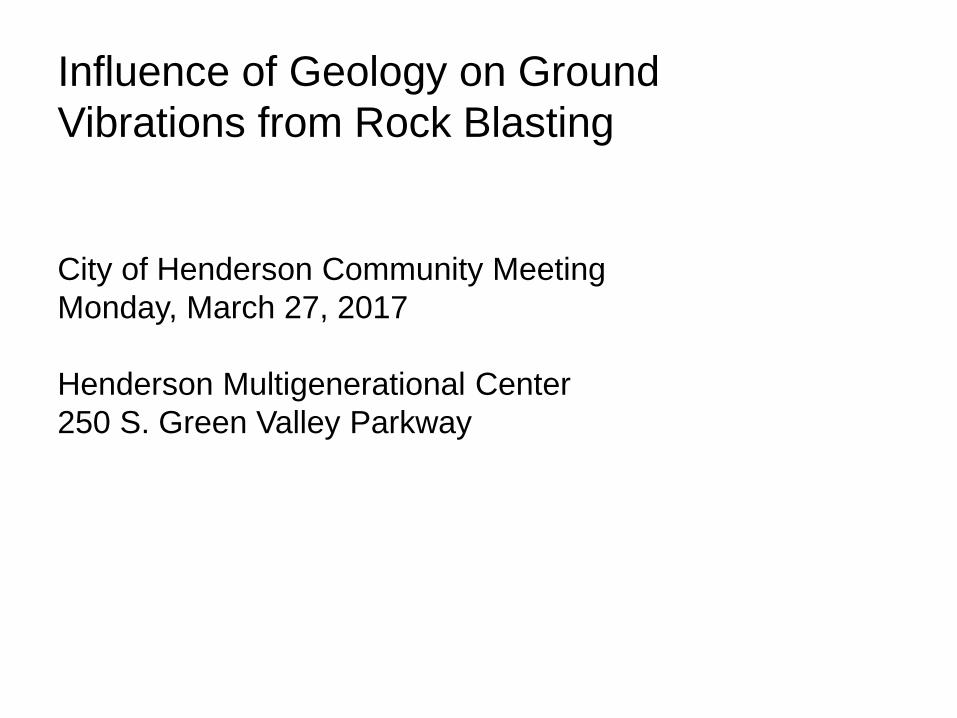
Influence of Geology on Ground Vibrations from Rock Blasting
City of Henderson Community MeetingMonday, March 27, 2017
Henderson Multigenerational Center250 S. Green Valley Parkway
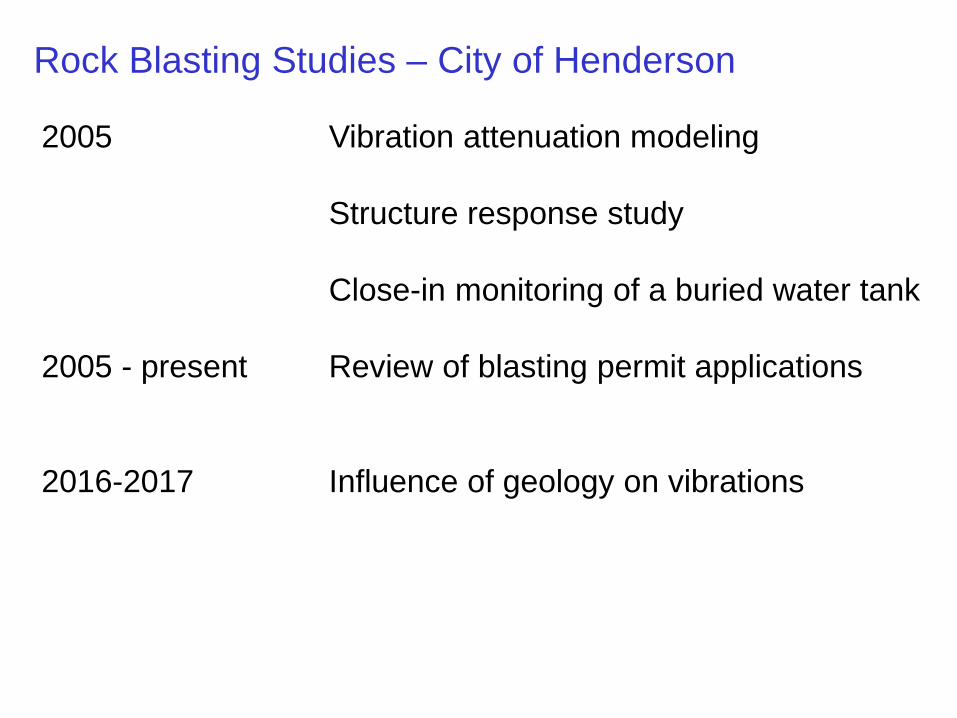
Rock Blasting Studies – City of Henderson
2005 Vibration attenuation modeling
Structure response study
Close-in monitoring of a buried water tank
2005 - present Review of blasting permit applications
2016-2017 Influence of geology on vibrations
Dr. Cathy Aimone-MartinBlasting and Monitoring Consultant to the City of HendersonPresident, Aimone-Martin Associates, LLC
25 years Chair Mining, Civil, Explosive Engineering, NM TechSpecializations in
mining, quarrying, construction blasting oversightinstrumentation and measurementsclose-in vibration and air blast pressure control underwater blasting and aquatic species protectioneducation and training
Projects World Trade Center, 2nd Ave. Panama CanalDam/Spillway reconstruction SFOBB pier demolitionsSkagway Bridge replacement
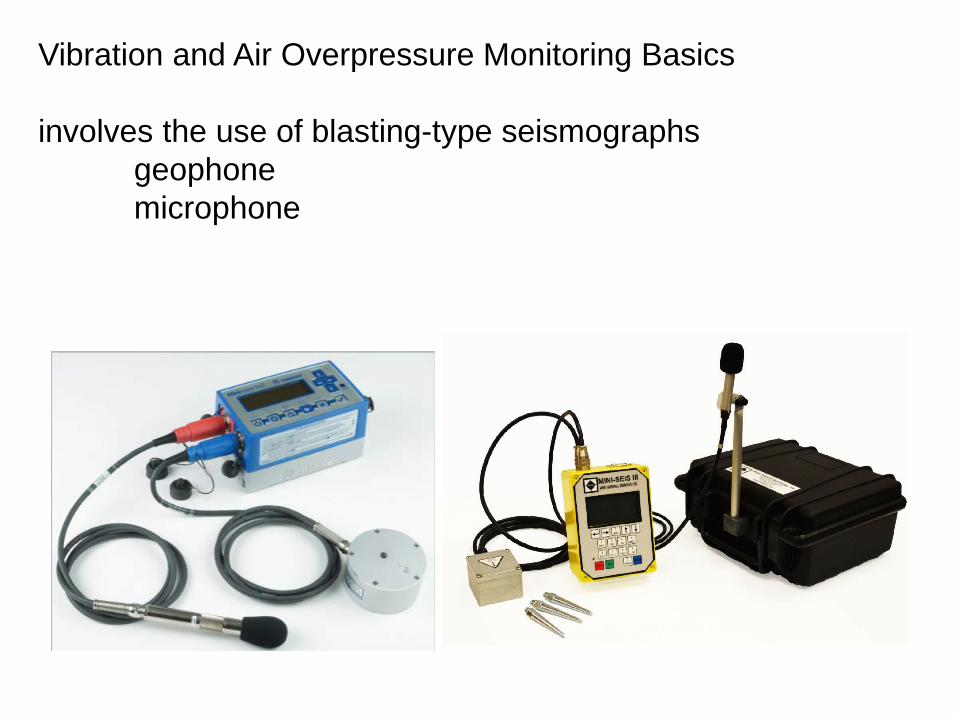
Vibration and Air Overpressure Monitoring Basics
involves the use of blasting-type seismographsgeophone microphone
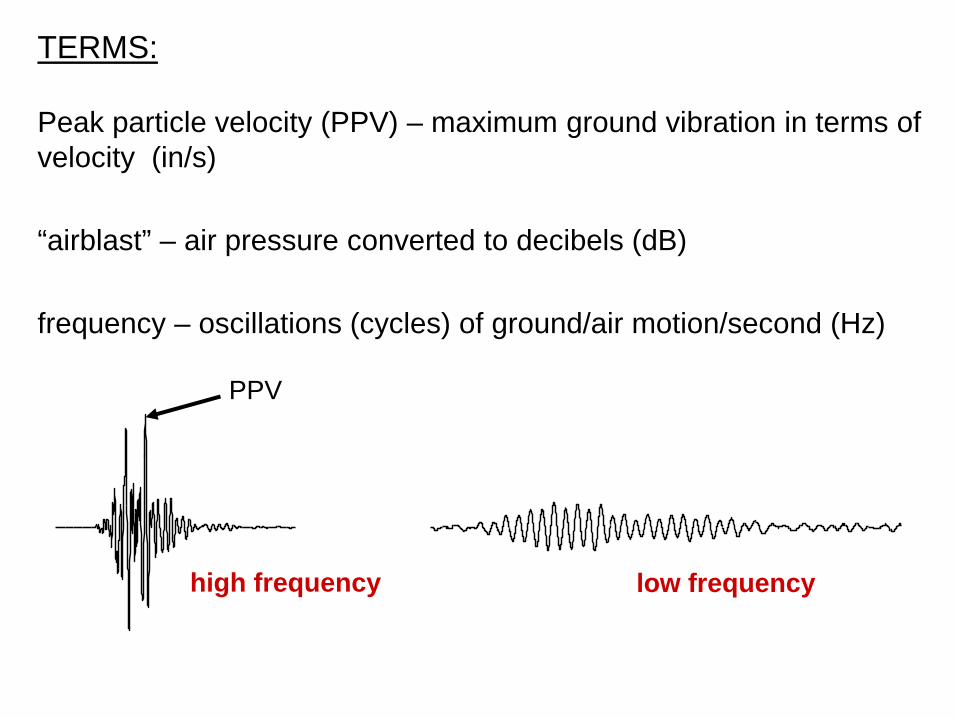
TERMS:
Peak particle velocity (PPV) – maximum ground vibration in terms of velocity (in/s)
“airblast” – air pressure converted to decibels (dB)
frequency – oscillations (cycles) of ground/air motion/second (Hz)
high frequency low frequency
PPV
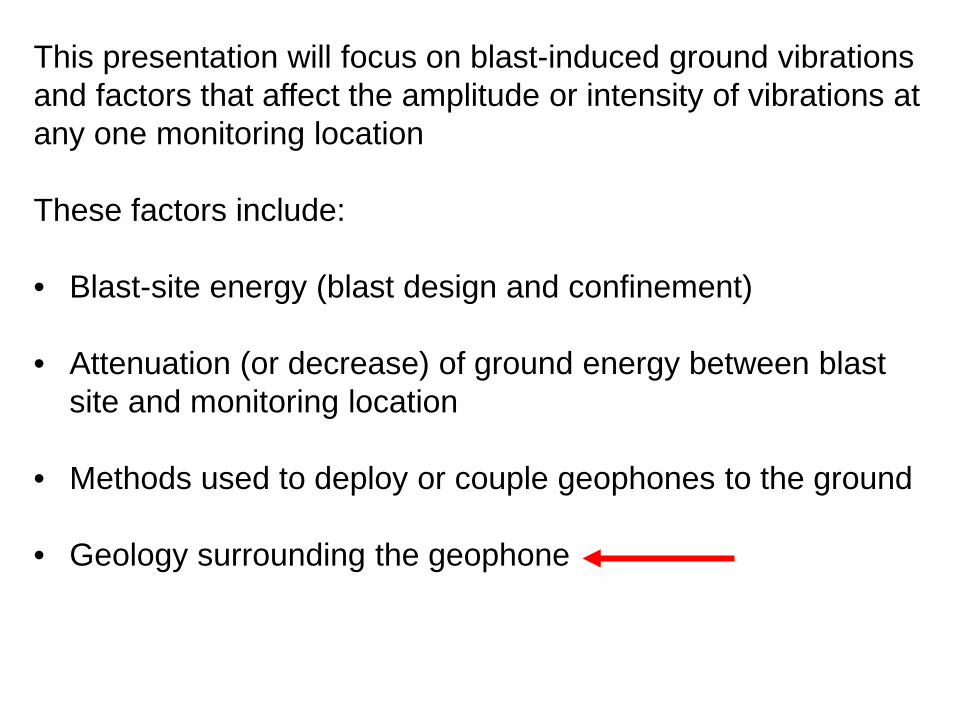
This presentation will focus on blast-induced ground vibrations and factors that affect the amplitude or intensity of vibrations at any one monitoring location
These factors include:
• Blast-site energy (blast design and confinement)
• Attenuation (or decrease) of ground energy between blast site and monitoring location
• Methods used to deploy or couple geophones to the ground
• Geology surrounding the geophone

Recommended standards for the manufacture and use of blasting seismographs are set by the International Society of Explosives Engineers (ISEE)
• Seismograph Committee – Field Practice Guidelines
• Standard Committee – Performance Specifications
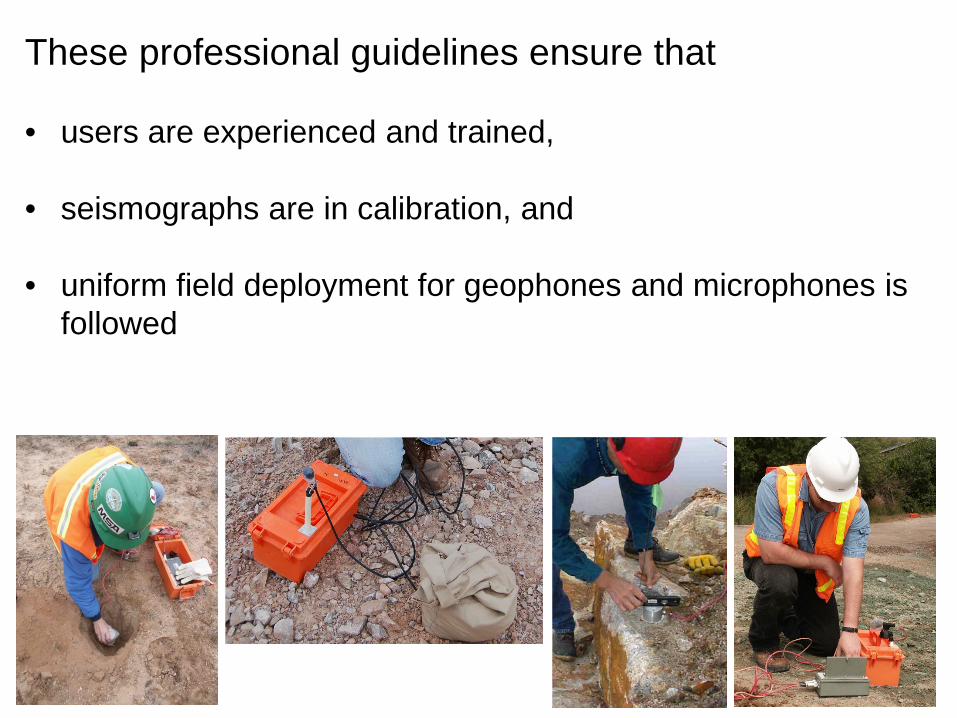
These professional guidelines ensure that
• users are experienced and trained,
• seismographs are in calibration, and
• uniform field deployment for geophones and microphones is followed
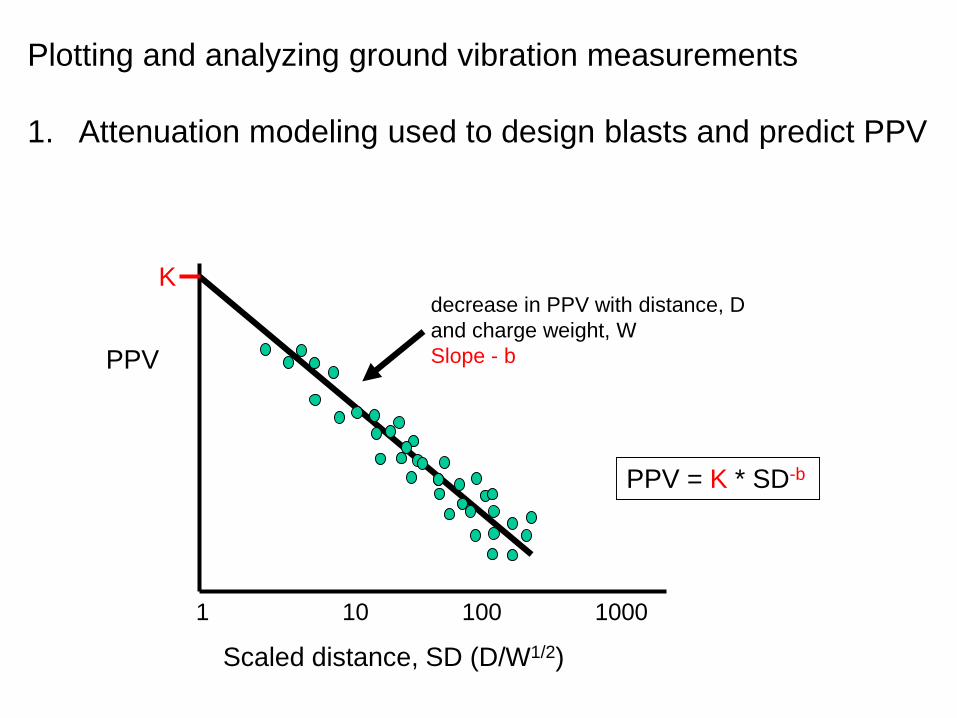
Plotting and analyzing ground vibration measurements
1. Attenuation modeling used to design blasts and predict PPV
PPV
Scaled distance, SD (D/W1/2)
decrease in PPV with distance, D and charge weight, WSlope - b
1 10 100 1000
K
PPV = K * SD-b
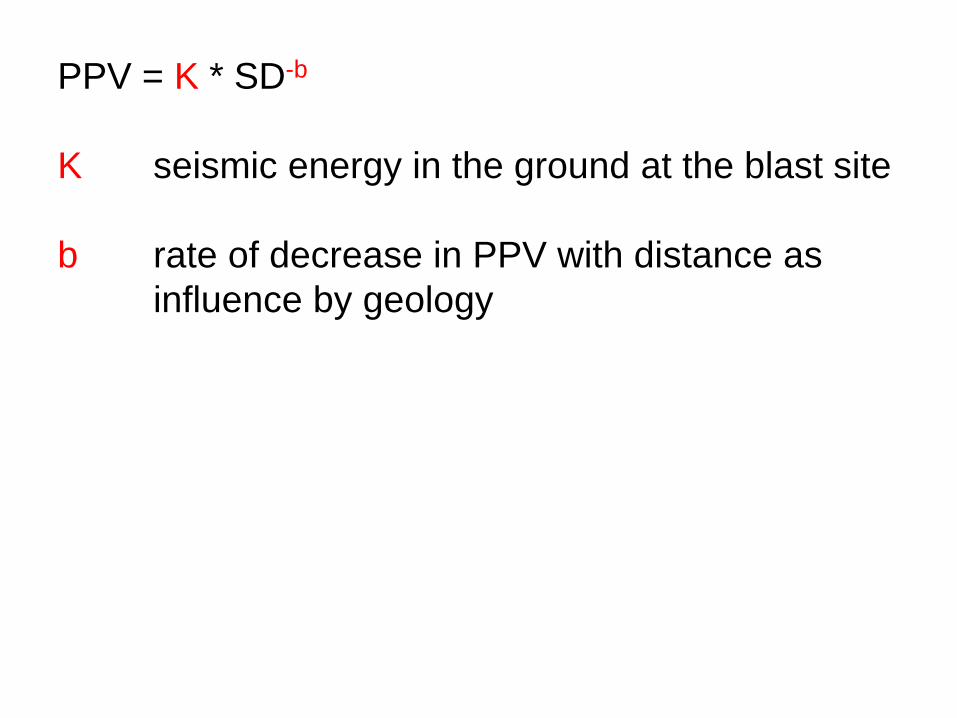
PPV = K * SD-b
K seismic energy in the ground at the blast site
b rate of decrease in PPV with distance asinfluence by geology
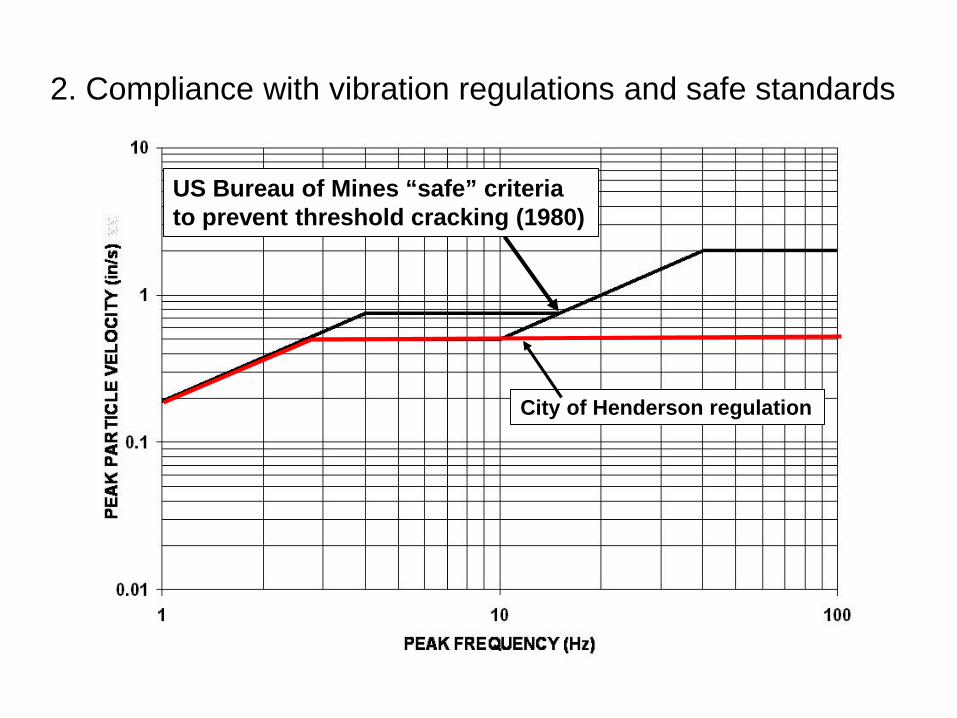
2. Compliance with vibration regulations and safe standards
City of Henderson regulation
US Bureau of Mines “safe” criteriato prevent threshold cracking (1980)
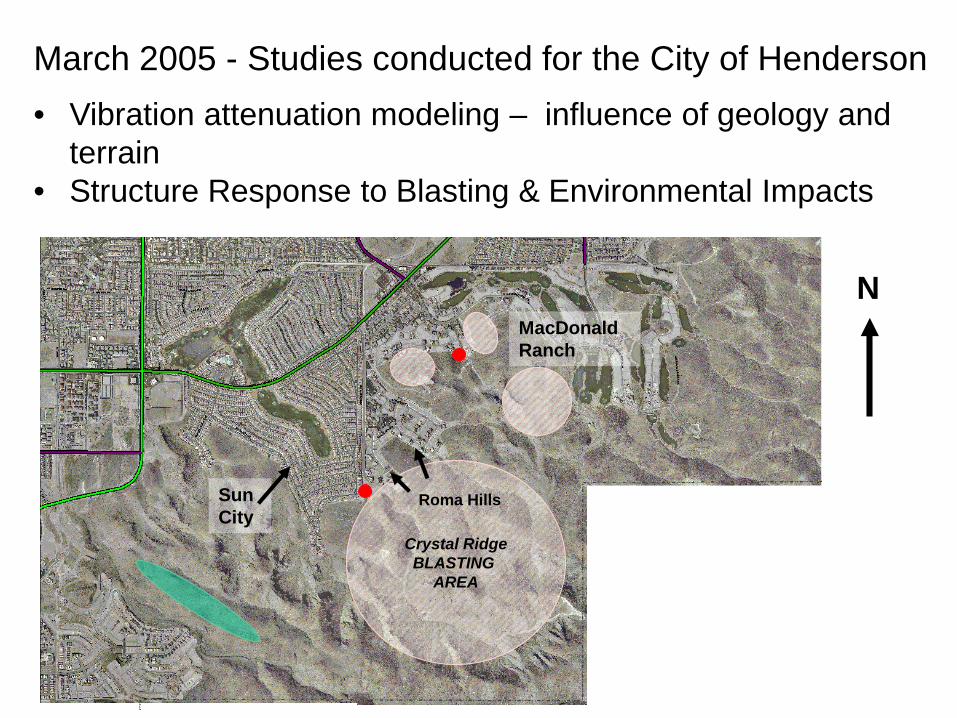
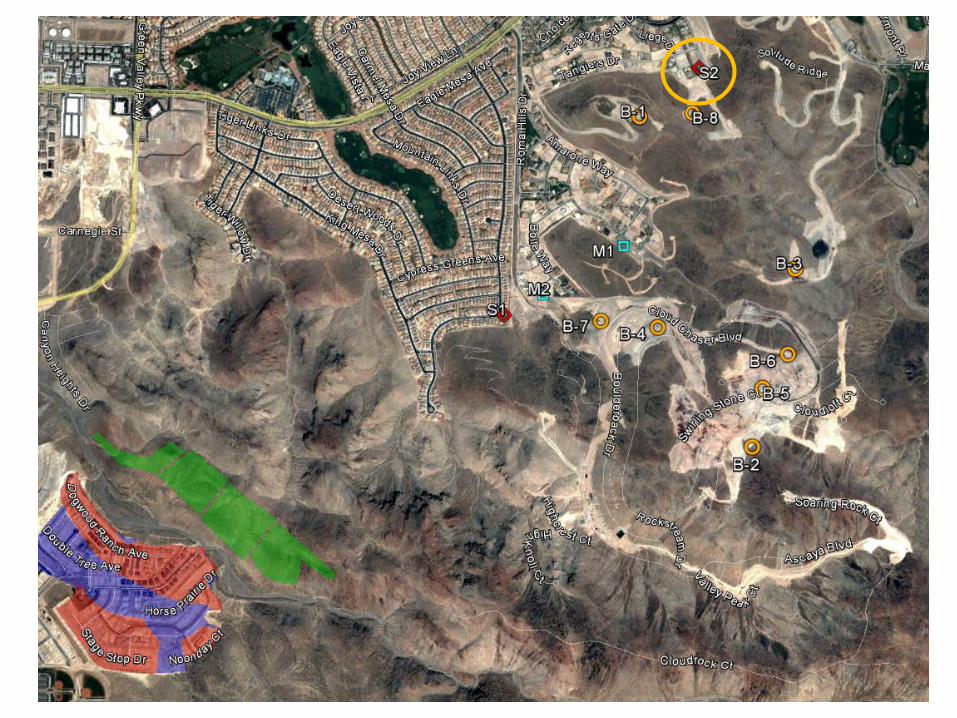
March 2005 - Studies conducted for the City of Henderson• Vibration attenuation modeling – influence of geology and
terrain • Structure Response to Blasting & Environmental Impacts
Crystal RidgeBLASTING
AREA
Roma HillsSun City
MacDonald Ranch
N
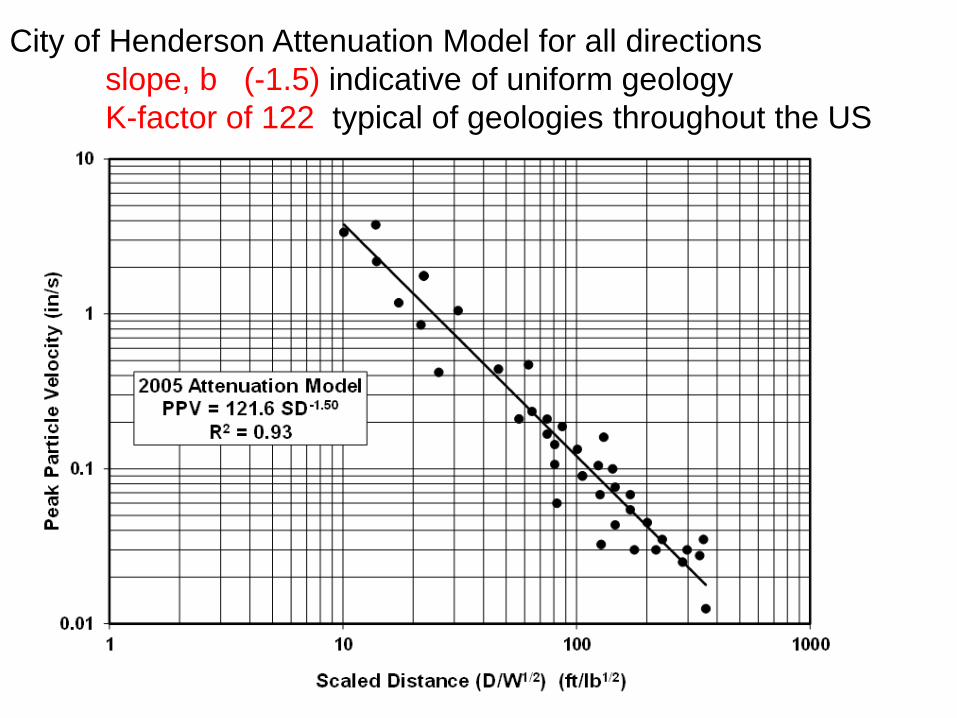
City of Henderson Attenuation Model for all directions slope, b (-1.5) indicative of uniform geologyK-factor of 122 typical of geologies throughout the US
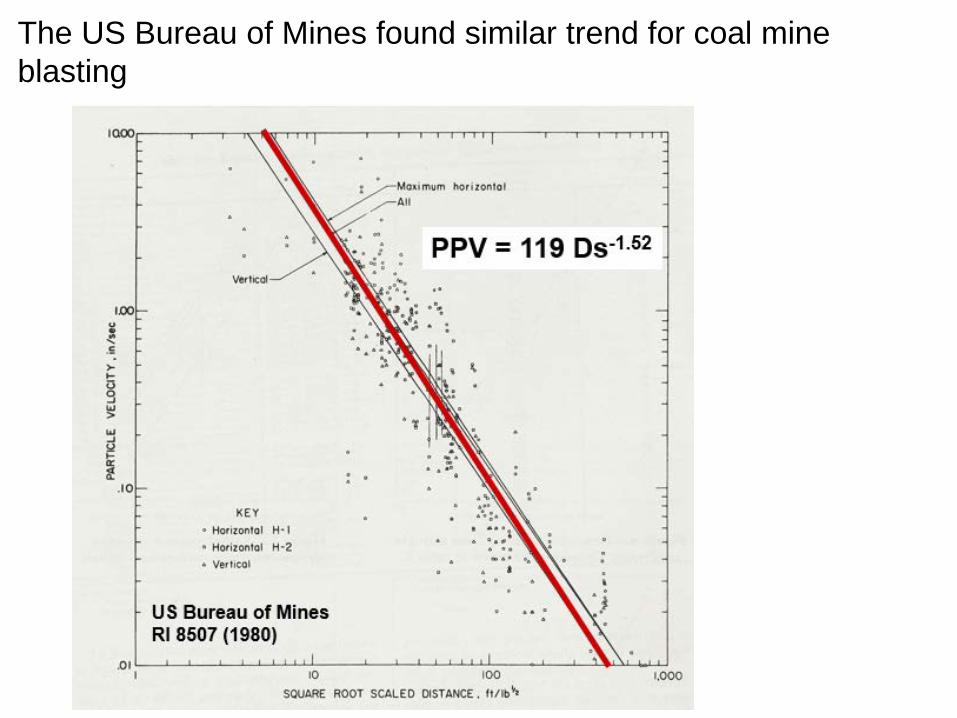
The US Bureau of Mines found similar trend for coal mine blasting
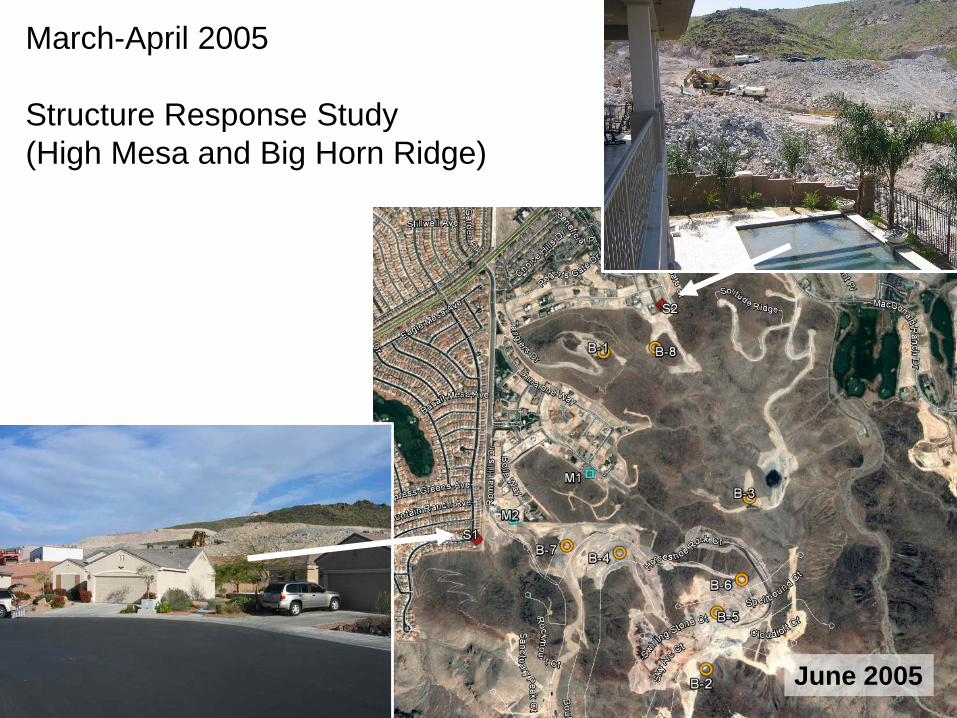
March-April 2005
Structure Response Study(High Mesa and Big Horn Ridge)
June 2005
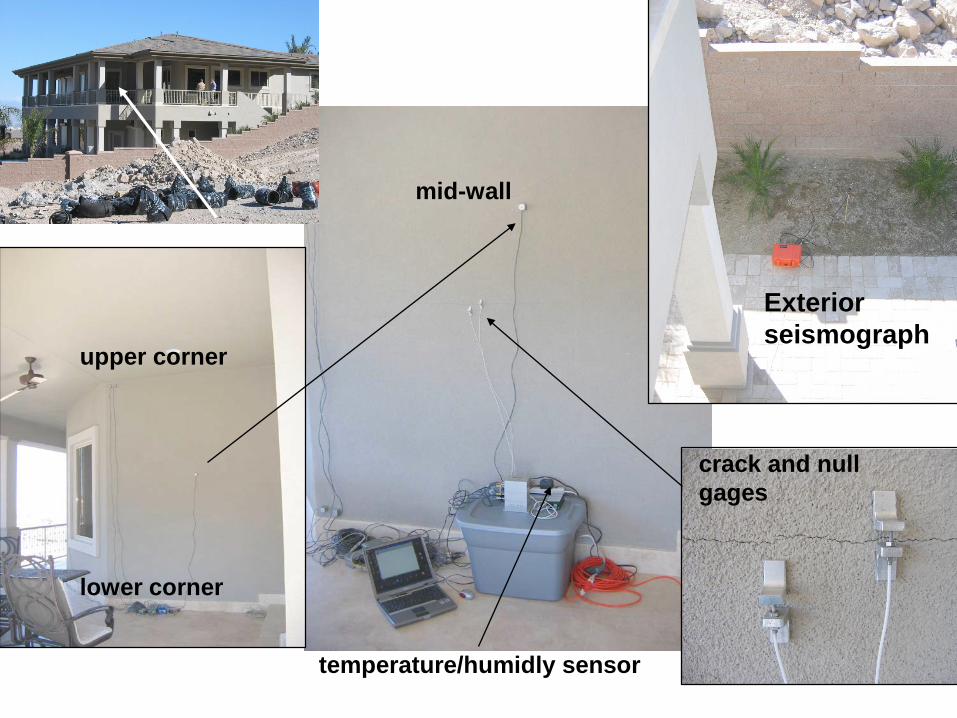
upper corner
lower corner
Exteriorseismograph
mid-wall
temperature/humidly sensor
crack and nullgages
0
20
40
60
80
100
0 100 200 300 400 500 600 700 800
020406080
100
0 100 200 300 400 500 600 700 800
2000
4000
6000
8000
10000
0 100 200 300 400 500 600 700 800
TIME (hr)
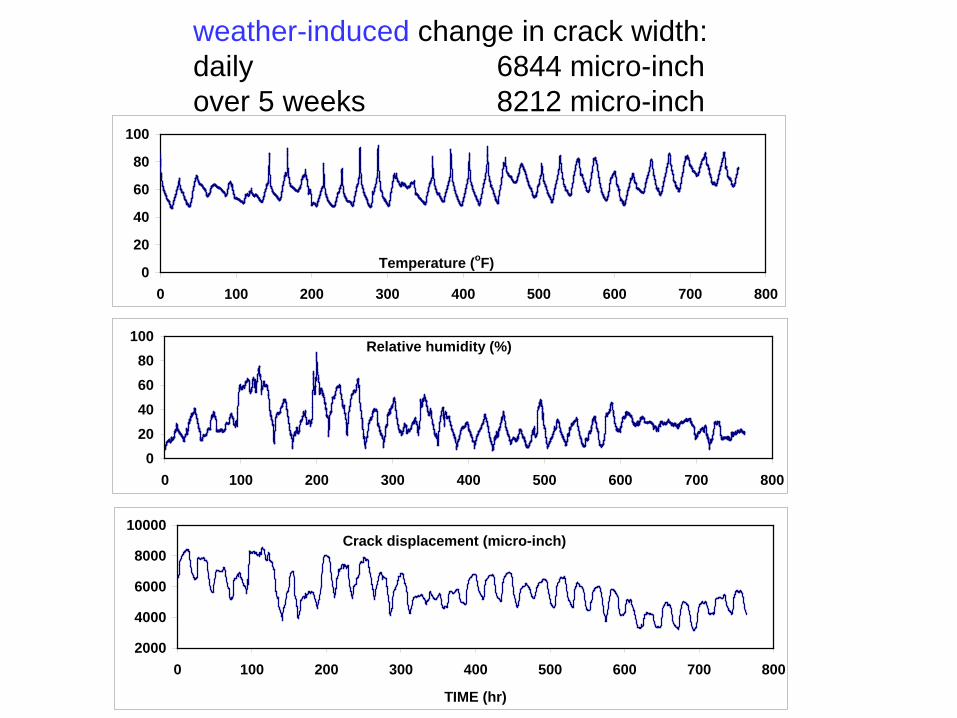
Temperature (oF)
Relative humidity (%)
Crack displacement (micro-inch)
weather-induced change in crack width: daily 6844 micro-inch over 5 weeks 8212 micro-inch
2000
4000
6000
8000
10000
150 160 170 180 190 200 210 220
TIME (hr)
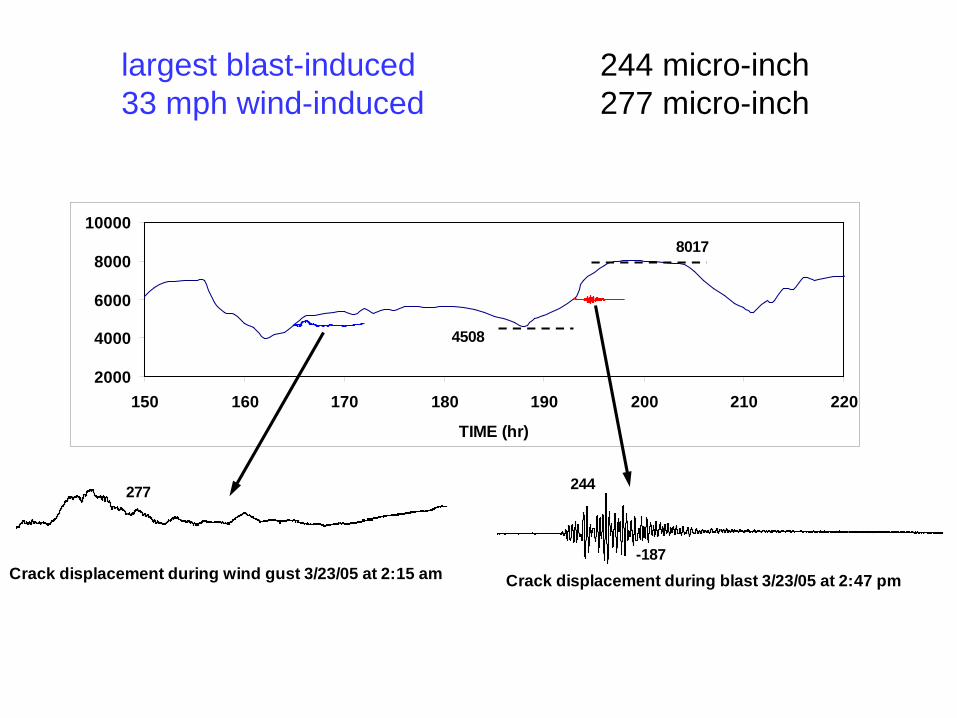
8017
4508
Crack displacement during blast 3/23/05 at 2:47 pm
244
-187Crack displacement during wind gust 3/23/05 at 2:15 am
277
largest blast-induced 244 micro-inch 33 mph wind-induced 277 micro-inch
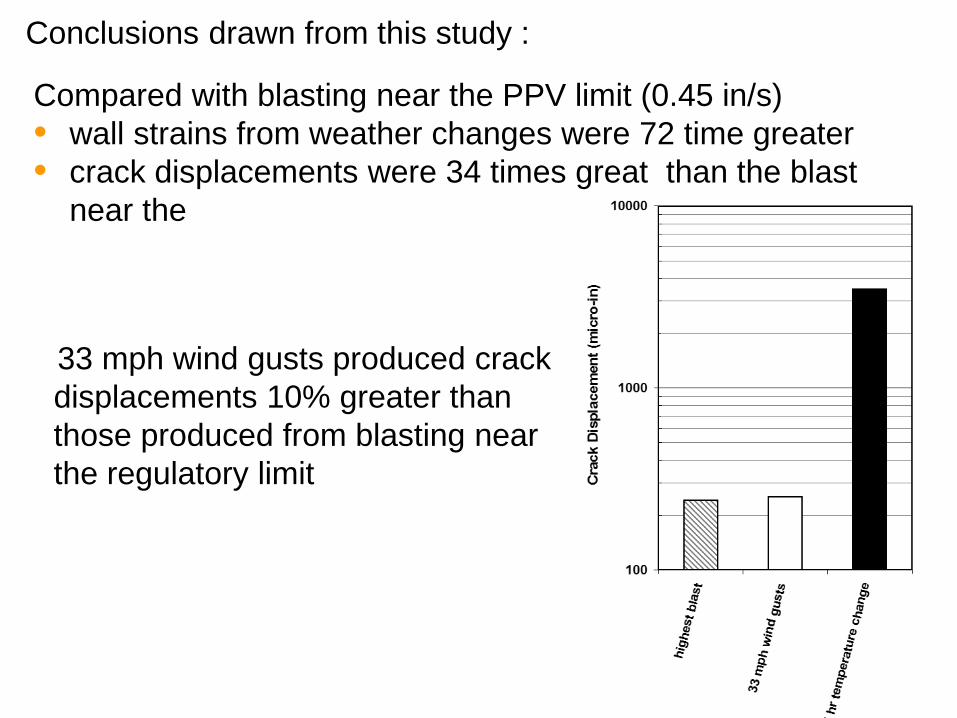
Conclusions drawn from this study :
Compared with blasting near the PPV limit (0.45 in/s) • wall strains from weather changes were 72 time greater• crack displacements were 34 times great than the blast
near the
33 mph wind gusts produced crack displacements 10% greater than those produced from blasting nearthe regulatory limit
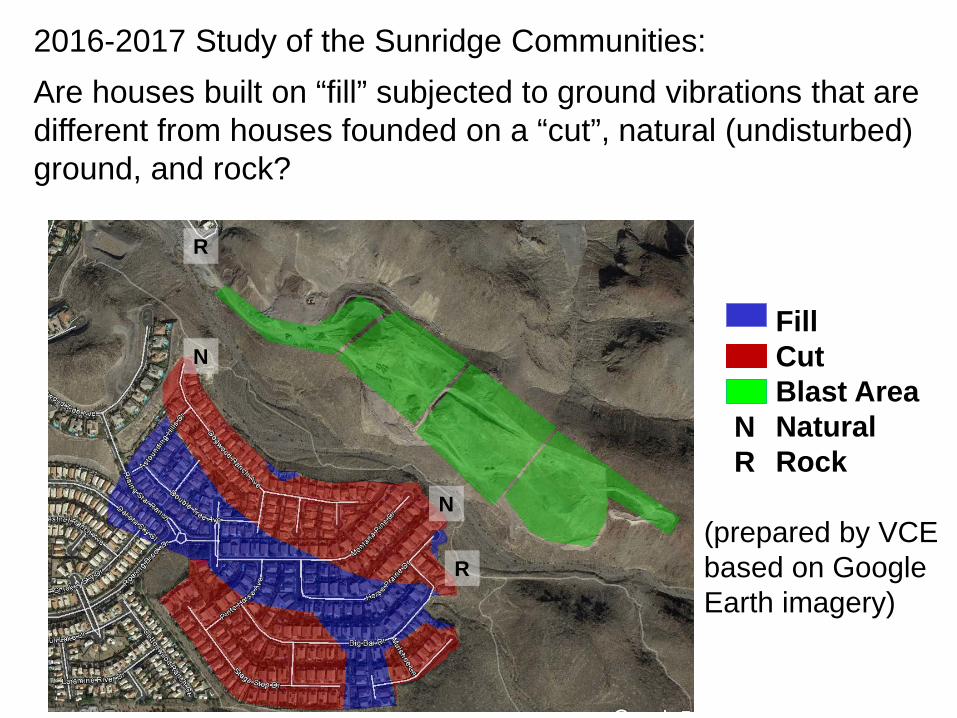
2016-2017 Study of the Sunridge Communities:Are houses built on “fill” subjected to ground vibrations that are different from houses founded on a “cut”, natural (undisturbed) ground, and rock?
FillCutBlast AreaNaturalRock
R
R
N
N
NR
(prepared by VCEbased on Google Earth imagery)
Aimone-Martin was provided
• vibration records from VCE that included blast information
• maps of blast and seismograph locations
• map of cut/fill areas
Measurements were plotted
• with the site attenuation model developed in 2005 and
• within the City of Henderson limit of 0.5 in/s
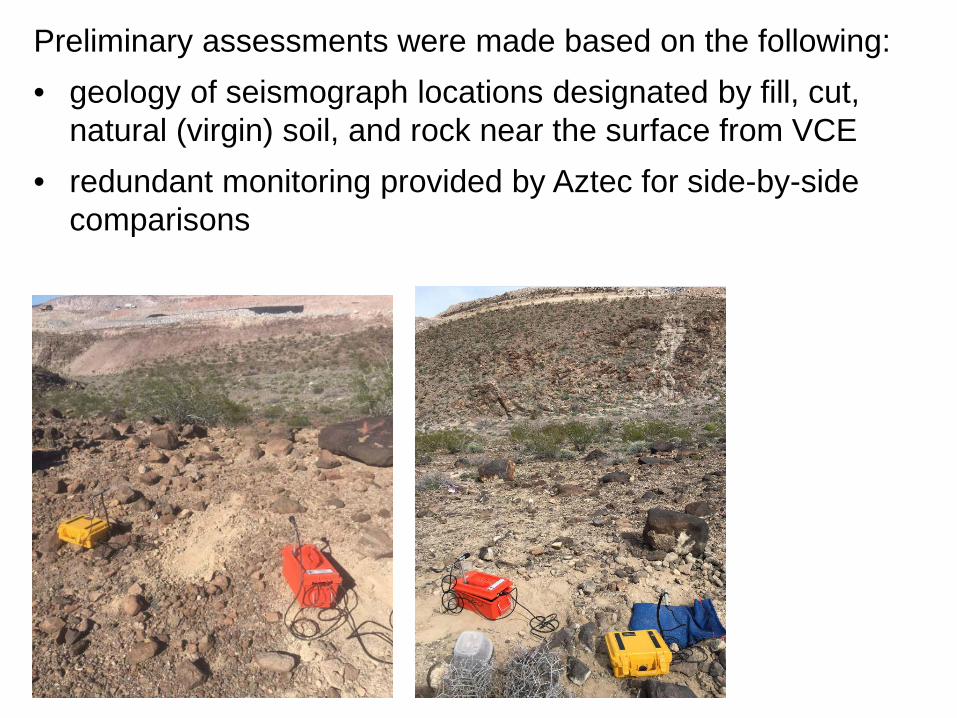
Preliminary assessments were made based on the following:• geology of seismograph locations designated by fill, cut,
natural (virgin) soil, and rock near the surface from VCE• redundant monitoring provided by Aztec for side-by-side
comparisons
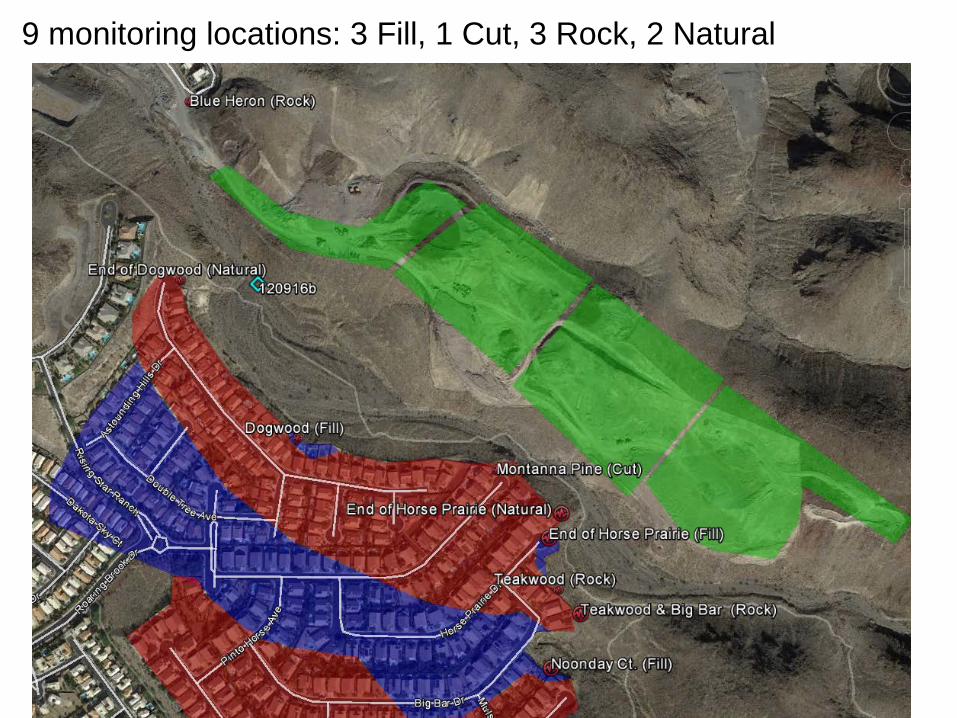
9 monitoring locations: 3 Fill, 1 Cut, 3 Rock, 2 Natural
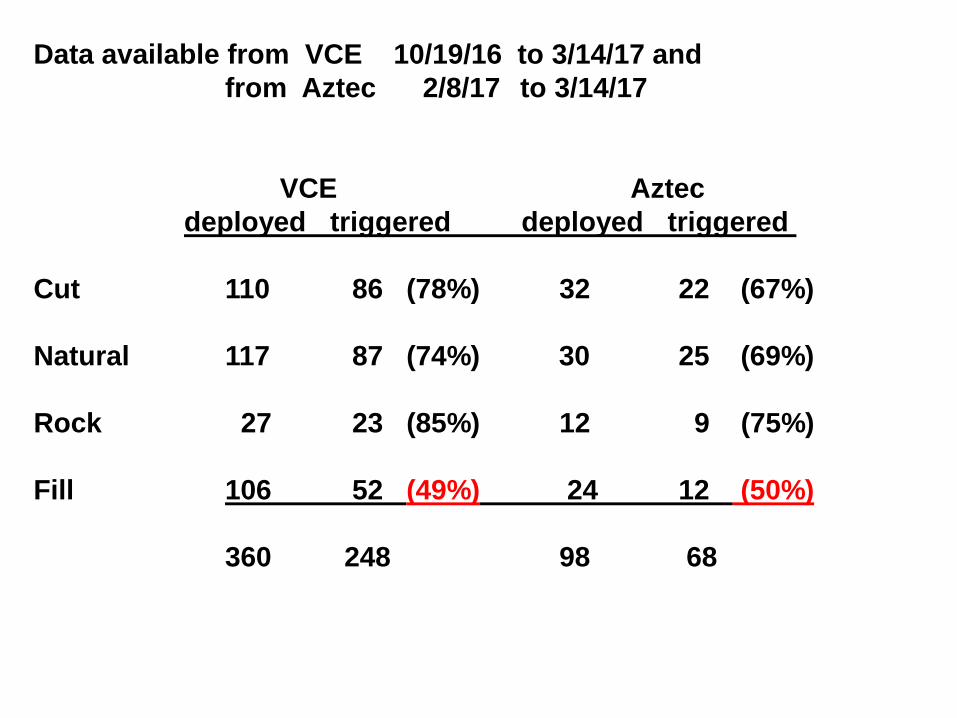
Data available from VCE 10/19/16 to 3/14/17 and from Aztec 2/8/17 to 3/14/17
VCE Aztecdeployed triggered deployed triggered
Cut 110 86 (78%) 32 22 (67%)
Natural 117 87 (74%) 30 25 (69%)
Rock 27 23 (85%) 12 9 (75%)
Fill 106 52 (49%) 24 12 (50%)
360 248 98 68
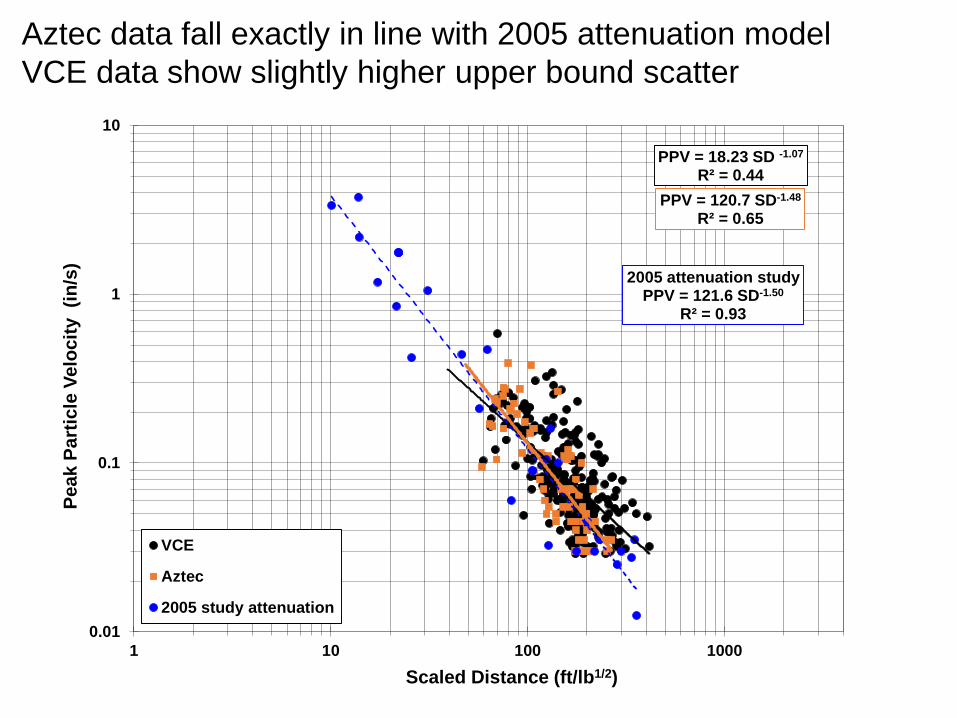
PPV = 18.23 SD -1.07
R² = 0.44 PPV = 120.7 SD-1.48
R² = 0.65
2005 attenuation studyPPV = 121.6 SD-1.50
R² = 0.93
0.01
0.1
1
10
1 10 100 1000
Peak
Par
ticle
Vel
ocity
(in
/s)
Scaled Distance (ft/lb1/2)
VCE
Aztec
2005 study attenuation
Aztec data fall exactly in line with 2005 attenuation modelVCE data show slightly higher upper bound scatter
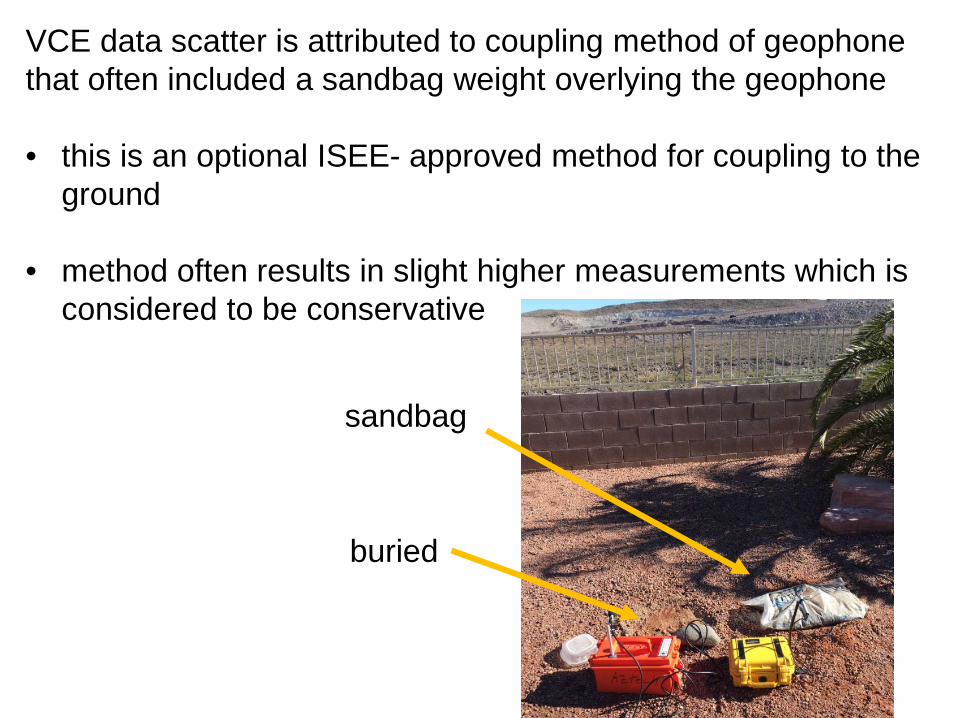
VCE data scatter is attributed to coupling method of geophone that often included a sandbag weight overlying the geophone
• this is an optional ISEE- approved method for coupling to the ground
• method often results in slight higher measurements which is considered to be conservative
sandbag
buried
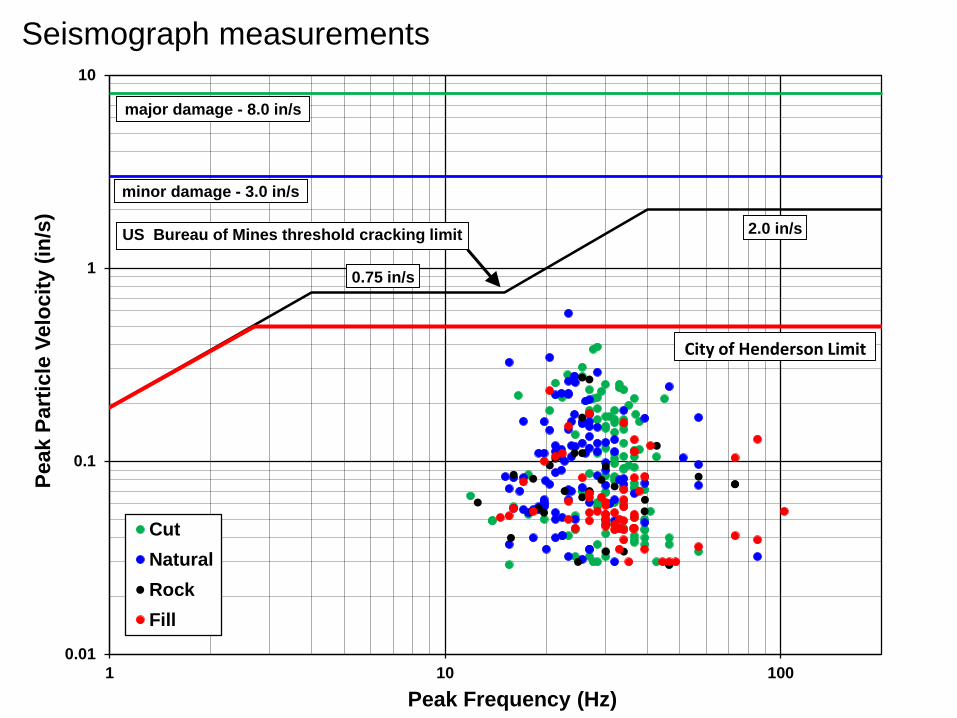
0.01
0.1
1
10
1 10 100
Peak
Par
ticle
Vel
ocity
(in/
s) a
Peak Frequency (Hz)
CutNaturalRockFill
minor damage - 3.0 in/s
major damage - 8.0 in/s
2.0 in/sUS Bureau of Mines threshold cracking limit
0.75 in/s
City of Henderson Limit
Seismograph measurements
Preliminary findings
• Blasting is not the cause of cracking structures
• The presence of fill tends to attenuate vibrations more than cut, rock, and natural soils
There will be a summary White Paper of findings on the website

QUESTIONS