Embed Size (px)
Citation preview

Influence of Frost Action on the Bearing Capacity of Soils H. L. JESSBERGER and D. L. CARBEE, U.S. Army Cold Regions Research and
Engineering Laboratory, Hanover, New Hampshire
During frost melting periods, the bearing capacity of frost-susceptible subgrade soil or subbase mutcrial is reduced. The magnitude of U1is reduction in bearing capacity can be determined by performing CBR tests on soil s amples subjected to several freeze-thaw cycles. Further studies are necessary before the prefrozen CBR values can be directly introduced in road design as a characteristic number for bearing capacity.
The proposed test procedure can be used for testing all soil types except clays and is particularly useful for dirty sands and gravels. For these soil types, the CBR value after several freeze-thaw cycles is controlled by the fraction of particles smaller than 0.02 mm and the coefficient of uniformity. The Casagrande frost criterion can perhaps be modified to include the coefficient of uniformity.
•TWO PHENOMENA must be distinguished in considering frost action in subgrades or ::;uuuai:H:!S ui roads and highways, frost heaving during freezing and loss in bearing capacity during thawing. This paper deals primarily with the latter, i.e ., reduction in bearing capacity during thaw.
The occurrence of several fre eze - thaw cycles during one winter is well established and has been documented by George and Davidson (1), Klengel (2) , and Kubler (3) . The los s in bear i ng capaci ty during m elting has often been determined by observi ng the Benkelman beam deflection or rmming plate b aring t sts (4) . The general behavior during a 1-year period is s hown in F igure 1 (5, p . 47) . -
Yao and Broms (6) considered the pore pressures that develop during thawing as a function of rate of thaw and overburden pressure. The value of the overburden pressure is the upper limit of the pore pressure. The pore pressure dissipates during consolidation, which results in an increased bearing capacity. These considerations have not yet been verified by experiments. The consolidation of thawing soils has also been the subject of some Russian studies (7 , 8); however, the researchers were primarily concer ned with the settlement of struc tures built on permafrost.
A practical analytical solution of the loss in bearing capacity during thawing does not appear to be available at the present or in the foreseeable future. It will, therefore , be useful to look for an approach by which the loss in bearing capacity can be recognized for the purpose of more economic road design.
PROPOSED TEST PROCEDURE
The test procedure proposed uses a combination of three well-known tests with a few modifications. These tests are (a) compaction test, (b) freezing test, and (c) CBR test.
Compaction Test
The samples were compacted according to the modified AASHO compaction procedure at optimum water content in a steel mold with a 6-in. inner diameter and a height
Paper sponsored by Committee on Frost Action and presented at the 49th Annual Meeting.
14

of 7 in. A spacer 2% in. thick was used, so that the height of the sample was 4-Y2 in . (9). The sample was compacted in five layers with 55 blows per layer.
Freezing Test
The following conditions are important in freezing the samples :
1. Design of the sample holder with regard to the temperature distribution and the wall friction,
2. Water supply, and 3. Temperature control.
For normal freezing tests , USACRREL uses polyacrylate (lucite) cylinders as shown in Figure 2 (10). The thermal conductivity of lucite is similar to that of soils. The ta-
0 Thow Lin•
50 under Road Surface
100 (Cm)
90
BO
70
60
50
40
Figure 1. Change of bearing capacity during 1-year period.
15
pered inside wall, in addition to a thin, one-piece, adhesive-backed Teflon liner, allows the sample to heave with a wall fr ic tion cons idered to be insi~ificant compared to the relatively high surcharge of 20 lb (er = 0.81 psi = 0.056 kg/cm ) used in all freezing and CBR tests. The soil was compacted in a steel cylinder with s ide dim ensions equal to those of the lucite cylinder; a spacer 1 in. high was used to make the sample 5 in. high. A duplicate run on each soil is recommended. The water content of the compacted
~1---Woil)>t
11:5:s;:!!~5s=s :S:::< :s:::< ~· :<::::< ~~:!!;::s ::0"---SUJ'Chlrgo Plato
'------Poroua Stone
H ------ --1/U" Tubing Nipple
Figure 2. Freezing cylinder.
sample should be determined. The soaking base plate (Fig. 2,
center) was used only for the first soaking period of 24 hours when the sample, still outside the freezing cabinet, was connected to a free water supply. A filter paper, a coarse porous stone, a copperplate , and a weight to give a total surcharge of 0.81 psi were placed at the top of the sample (Fig. 2) during soaking and freezing.
For the freezing test, the base plate was modified to allow air to escape from the sample (Fig. 2, bottom). The water level was held at the top of the sample during soaking and at the bottom during freezing and thawing.
The normal freezing procedure was modified in that the samples were subjected to several freezethaw cycles. Constant temperatures were maintained in the freezing cabinet during each freeze or thaw period. This modification is similar to the durability test used for soillime and soil-cement mixtures (1, 11, 12) and was introduced to simulate in situ conditions and to produce a more uniform "weakened" sample. In contrast to the durability test, the

-....
16
Figure 3. Temperature recording in freezing cabinet during freeze-thaw cycles.
freeze and thaw temperatures penetrate into the samples only from the top of the samples, which are surrounded by insulation. Factors including soil type can warr::rnt changing the number of freeze-thaw cycles, inasmuch as the number of cycles influences the CBR test results, depending on soil type. In many cases three freeze-thaw cycles were found to be sufficient.
The duration of each freeze and thaw cycle can also be varied. In these experiments, freezing and thawing times were both set at 12 hours and were found suitable for mos t of the samples.
The temperature for freezing and thawing is controlled by the general rule that the samples are almost completely frozen and are completely thawed at the end of each corresponding part of the cycle. Although different samples have a range of thermal diffusivities because of differences in soil type and water content, a fixed cabinet temperature was chosen for all tests. The cabinet temperatures chosen were -15 C at the top and +4 C at the bottom during freezing and +20 C and +4 C respectively during thawing. Figure 3 shows a typical recording of the air temperature in the freezing cabinet durin!!' t.hf! frP.P.7.P.-th~m ,.._v,..lP<>
Recently Kaplar (io)cte~~i~p~Jd-~-;~all freezing unit for four samples, which is recommended if a timer is added.
CBR Test
To determine the bearing capacity of the soil after freeze-thaw cycles, the CBR test was chosen. This test procedui·e is well known (12), and the equipment is available in every soils laboratory. The test can be easily performed, and it works on strong and weak, cohesive and noncohesive soils.
To obtain true penetration loads from the test data, the zero point of the stresspenetration curve has to be adjusted if surface irregularities or the initial concaveupward shape of the curve demands a correction. The correction procedure described elsewhere (!.~) has been modified in the following manner:
1. For the correction of surface irregularities, the new zero point will be found by drawing a straight line through the points at 0.1- and 0.2-in. penetration.
2. For the correction of the initial concave-upward shape of the curve, the new zero point will be found by drawing a straight line through the points at 0.2- and 0.3-in. penetration.
The CBR at 0.2-in. penetration, with or without correction, is the standard value. The surcharge that influences the CBR can be selected according to the weight of
the pavement and other loads if required, but for comparisons among several soils the application of the same load is necessary. It is recommended that a 20-lb load be used for the CBR test as well as for the freezing procedure. After running the CBR test, the water contents of the sample at top and bottom should be determined.
DISCUSSION OF PROPOSED TEST PROCEDURE
Requirements for a Useful Frost-Susceptibility Test
In developing a frost-susceptibility test, the following general factors are to be considered:

1. General soil index properties; 2. In situ conditions of the soil, i.e., water content, density, and the like; and 3. Conditions responsible for the frost action, i.e., temperature, time, number
of cycles, water supply, and surcharge.
The performance of the test itself sets another group of requirements:
4. Results should lead to direct use in road design. 5. Test results must be reproducible with sufficient accuracy.
17
6. The test should be fast and inexpensive; furthermore, the test should be sufficiently simple so that it can be conducted by soils laboratory personnel without special training.
Fulfillment of Requirements by Proposed Test Procedure
In considering factor 1, if coarse mater ial is to be tested, the gradation is scalped so that only material less than % in. is used and the material larger than 3/4 in. is replaced by material between % in. and sieve No. 4. This is the same procedure used in the standard compaction test and CBR test 8.
For factor 2, soil compacted at optimum water content does not always correspond to in situ soil. However, the density is altered by the freeze-thaw cycles, and after several cycles an equilibrium is reached that depends on the freeze-thaw characteristics of the soil rather than on the density and water content of compaction. The sample condition after several freeze-thaw cycles should correlate with the in situ condition in the winter after several frost periods.
The most important factors in 3 are temperature, freezing and thawing time, and number of cycles. The main question, however, is how these factors influence the prefrozen CBR value. The test discussed later shows the influence of these factors on the prefrozen CBR value. The time of freezing and thawing and the dimensions of the sample were chosen in accordance with the Fourier model law of heat flow (13).
Requirement 4 is principally fulfilled because the CBR is still the basis for adesign method of flexible pavements (9). It should be mentioned that the CBR of the prefrozen samples is found after a relatively short consolidation time. It is questionable whether these unfavorable conditions should control the pavement thickness or the thickness of the total road construction.
The possibility of fulfilling requirement 5 depends on the accuracy of the three separate and well-known tests of compaction, freezing, and determination of CBR. The proposed test procedure is expected to be less accurate than each of the separate tests,
TABLE 1
PHYSICAL PROPERTIES OF THE TESTED SOILS
Yd UnUied Dry Unit Particle Uniformity Permeabilityb Soil Spe- Liquid PlUtlc Welsh<
Soil Classi- cilic L1mH3 Limtta p::~!~~ty Wopt Maximum Content Coefficient at Maximum
ii cation Gravity (percent) (percent) (percent) Denelty
0.02 mm u Density
Symbol (lb per (percent) doo/d,. (cm per sec)
cu It)
1 MS! ML 2. 73 26 21 5 11.6 108.3 65 3.0 2 HPG SW-SM 2. 79 16 18 -2 5.3 143.3 5. 5 29.3 7 x 10-• 3 HCS SP 2. 74 11. 2 125. 4 3. 7 1.3 x 10- :.1. 4 HSS SC 2. 72 13. 0 114. 0 7.1 6.3 5 )( 10-• 5 WLT SC 2. 74 14 17 -3 5.0 144.8 12 213.3 6 AFG-3 SP-SM 2. 71 11 15 -4 5.5 144. 0 4.5 67.1 7 AFG-6 SP-SM 2. 75 19 20 -1 5.8 144. 0 3.0 30.0
~ ~6~-lb SP 2.67 15.5 100. 0 2.4 1.5 '10-• SC 2.64 20 26 -6 9.4 11 9.0 8.0 23.3
10 HSI ML 2. 74 24 26 -2 16.5 106.3 42 6. 6 11 WSI ML 2. 72 27 26 1 18.0 105.0 76 4.8 12 sue CL 2.69 33 20 13 15. 0 116.0 75 13 WLT-4b SC 2. 74 14 17 -3 6. 8 134.5 19 33. 3 Ll x 10-• 14 BMS SP 2.64 8.2 108 2.0 2.4 15 TCS SW 2. 73 8.3 133 0.6 29. 0 16 ETS SW- SM 2. 71 8.5 132 9 54.5 17 WLS SW-SM 2.69 6.9 132 3. 7 11.6
LSTC SM -SC 2. 71 21 15 8.2 134 32 500 LFTc ML 2.67 31 24 18.6 104 46 6. 5
aMaterial passing No, 40 sieve, bMaterial passing No. 4 sieve ,
cAverage values for Loring till and Fairbanki silt lested 21t Loring AFB and Fairbanks Ae5earch Area respectively

18
U S Slandord Sieve Sire ... ~ .... ••• No, 10 Ho,1111 0 Nit.200 100
' IH rn:-', I I ~ I I f,\• II
I 111 r1 1 1 1:i: ~n '' 00
' ...,LOt"ll"f Afl I 60
I ... \ I l ' , I~\ --·- ,_
I '•
•o
•o ' •
""" ·-0
100 ;\. I r\. I
' I
I\ I\ \ ,~ .. 00
~ O . ·l
- ·-· AF"ij:;·]. ~
}; 60
,, r-.. \ A I - 6 "' ' · \
' "\ "-
0
100 -.t_ ., ...... 11 '\ ',I OM•
I\. " 80
< s~ TC \ D 60
' - ~ -~tT-" •• 20
I l\. ' 1-'
r.... ... - -0 100 10 i 0 0 I
<li 1~S.. 1 , mm 001 0001
J I• •OO
80
60
<O
0
us. 'HOil'\NI" sr ...,. , .. 3-t..- lf. No 4 No 10 No 40 Hti.2 00
~:;,,. ' ' ';-,.; I \•ss ' I'\ • f"--HCS I .s\
£\. "i-.._ I ~ \
I '\ " -.... ~: t--. i'
100 10 I 0 0 I 001 0001 G.-o.nkt , 111111
I c .. ?iW\\ .. le> ... 1 u,G.tf , . ., I SH. I 1111 C1.n
u s s.1aQD,., t.1 1•1111 s;zc. No 4 No 10 No 40 No 200
100 i"... T
['... l\r-..'1ws1 1 ~ I
80
' ~$\IC
--- '\ •• x ' 60
"Vll "-l ·~ \ ~
I t-. _ \ . :s 1- -·- ...,.
' ' '
40
20
-~ :=,
0 tO IC) 0 , t DOI 0 001
G1aii 11 9ili, rn111
lpH! Hto,!¢~O f ,!tf j SILT or CLAY
Figure 4. Gradation curves.
but it will be shown in the next section that for sandy and silty soils the reproducibility is sufficient, and for gravelly soils it depends on the arrangements of occasional large particles. The variation of the CBR for prefrozen samples is of the same order as for non-prefrozen samples.
The fulfillment of requirement 6 may still be a matter of discussion.
-5
-101.--_L __ _,_ _ _. _ _ _._ __ .__ _ _.
0 12 24 36 48 60 TIME, hours
Figure 5. Temperatures within one sample.
72
4 SAMPLE HEIGHT inches
• 16
Figure 6. within one
-e
To
Soil: MSI Somple: 10-2
,. TEMPERATURE, °C
Temperature distribution sample after freeze-thaw
cycles.
HEAVE inches
0.4
02
0 12 24 36 TIME, hours
48 60
0 .8
HEAVE inches
0 .4
72 36 TIME, hours
48 60
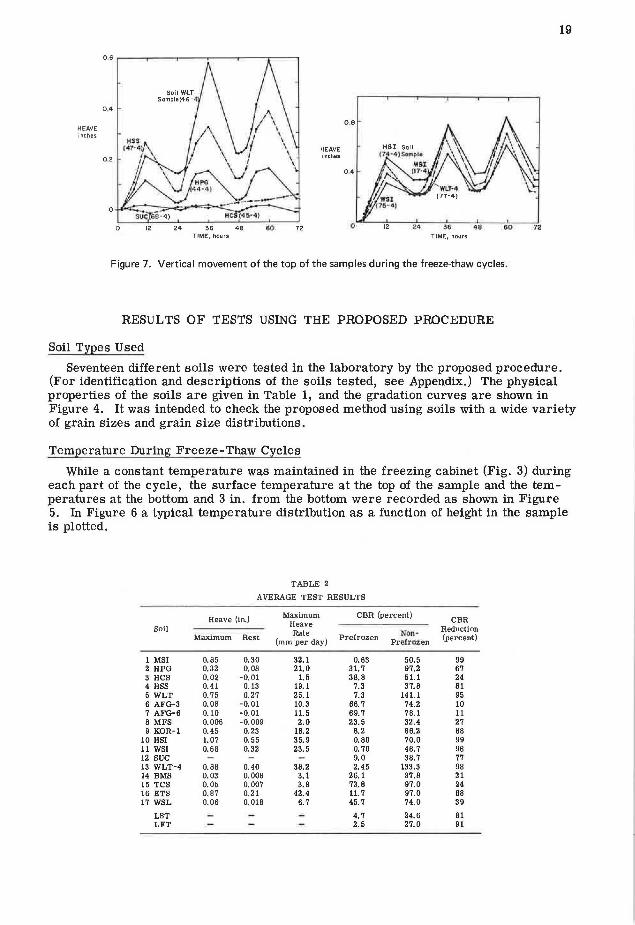
Figure 7. Vertical movement of the top of the samples during the freeze-thaw cycles.
RESULTS OF TESTS USING THE PROPOSED PROCEDURE
Soil Types Used
19
n
Seventeen different soils were tested in the laboratory by the proposed procedure. (For identification and descriptions of the soils tested, see Appendix.) The physical properties of the soils are given in Table 1, and the gradation curves are shown in Figure 4. It was intended to check the proposed method using soils with a wide variety of grain sizes and grain size distributions.
Temperature During Freeze-Thaw Cycles
While a constant temperature was maintained in the freezing cabinet (Fig. 3) during each part of the cycle, the surface temperature at the top of the sample and the temperatures at the bottom and 3 in. from the bottom were recorded as shown in Figure 5. In Figure 6 a typical temperature distribution as a function of height in the sample is plotted.
TABLE 2
AVERAGE TEST RESULTS
Heave (in.) Maximum CBR (percent) CBR
Soil Heave Reduction Maximum Rest Rate Prefrozen NGn-
(percent) (mm per day) Pre!~ozen
1 MSI 0.85 0.30 32.1 0.63 50.5 99 2 HPG 0.32 0.08 21.0 31. 7 97.2 67 3 HCS 0.02 -0.01 1.5 38.8 51.1 24 4 HSS 0.41 0.13 19.1 7.3 37.8 81 5 WLT 0. 75 0.27 25.1 7.3 141.1 95 6 AFG-3 0.08 -0.01 10.3 66. 7 74.2 10 7 AFG-6 0.10 -0.01 11.5 69. 7 78.l 11 8 MFS 0.008 -0. 009 2.0 23.5 32.4 27 9 KOR-1 0.45 0.23 18.2 8.2 66.2 88
10 HSI 1.07 0.55 35. 9 0.80 70.0 99 11 WSI 0.68 0.32 23.5 o. 70 48.7 98 12 sue 9.0 38. 7 77 13 WLT-4 0.88 0.40 38.2 2.45 133.3 98 14 BMS 0.03 0.008 3.1 26.1 37.8 31 15 TCS 0.05 0.007 3. 9 73. 8 97.0 24 16 ETS 0.87 0.21 42.4 11. 7 97.0 88 17 WSL 0.06 0.018 6.7 45. 7 74.0 39
LST 4. 7 24.6 81 LFT 2. 5 27.0 91

20
TABLE 3
DETAILED RESULTS, WITH COMPACTION DATA
~ Compaction Data Prelrozen CBR Nwnber
Soll Sample Corr. CBR or Remarks Ydo Wo Wopt Cycles (lb per cu It) (percent) (percent) (percent)
I MS! o-o 97. 7 10.8 28.1 0.80 1·1 108.3 11.7 11.3 45.5 No surcharge 2-1 104.2 11.0 34. 7 1 day soaking; 0.4 psi 3-1 105.66 12.5 25.55 10.0 1 day soaking; O. 4 psi 4-1 103. 58 12.2 11.7 50.5
19-1 97.1 21.6 22.4 1.80 20-1 96.4 22.1 22.1 1.87 21-1 96.3 22. 3 22.3 1.30 1 day soaking 22-1 95.6 22.8 25.4 1.00 2 days soaking 23·1 98.9 21.4 24.8 1.40 2 days soaking 24·1 98.8 21.2 22.9 1.38 2 rlayR ROOki ng
5-2 99.3 11.7 32.3 (0.13) 3 0. 2 psi surcharge 6-2 102.4 10.9 28.6 (0.90) 3 7-2 103. l 11.3 32.6 0.30 6 O. 4 psi surcharge 8-2 99.8 11.9 28.2 1.16 6 9-2 102. 9 11.6 29.9 0.53 3
10·2 103.0 11.0 29.4 0.47 3 11·2 103.4 11.1 28.6 0.67 6 12-2 103.5 10.8 28.9 o. 75 6 13-3 102.0 12.1 30.1 0.53 3 14·3 102.6 11. 7 30.1 0.58 3 15·3 102.0 12.1 28.9 o. 75 6 16-3 101.8 12.0 29.6 0.69 6 17-4 102.4 11.9 28.6 0.67 3 18-4 102.2 11.9 27.0 o. 75 4 25-4 102. 7 11.2 28.9 0.57 1 39·4 102.5 12.5 31.0 0.55 10 97·4 103.7 16.3 30.2 1. 01 3
101-5 104. 5 11.0 31.4 0.62 3 ·lOC 24-hour freeze cycle 108-4 104.8 11.6 29.6 1.69 3 5-day consoUdation 109-4 104.1 11.6 1.61 3 19-day consolldation 113·6 104.5 11.3 31.5 0.47 3 ·5 C 60-hour freeze cvcle
2 HPG 38·1 143.8 5.0 4.4 97.2 26-4 143.1 5.5 9.2 30.8 3 33-4 142.8 5.4 9.0 32. 7 6 40-4 138. 7 5.2 7.8 30. 0 3 24-hour cycles 44-4 142.2 4.1 8.1 33.3 3
3 HCS 31·1 125.1 9.4 9.1 (24. 7) 37·1 120. 7 12. 7 8. 7 51. l 27-4 125.1 9.9 9.1 42. 7 34·4 123. 0 11.. ! 20.6 40.0 41-4 125.6 9.8 8.4 38.0 24-hour cycles 45-4 122.6 10.5 9.0 34.5
4 HSS 30-1 113.0 13.0 13.0 37. 8 29-4 111.7 13.1 17.0 (18. 2) 3 36-4 111.5 13.2 19.1 9.3 G 43-4 110.9 13.5 17. l 5.0 3 24-hour cycles 47-4 111.5 11.3 18. 4 7. 5 3 96-4 112. 6 12. 6 17. l 12. 9 3
100-5 112.1 13.1 17.2 9. 0 3 ·lOC 24-hour freeze cycle 112-6 111.0 13.5 17.4 8.5 3 ·5 C 60-hour freeze cycle
5 WLT 32-1 145.6 4.7 5.4 141. 1 28-4 143. 9 4. 5 11. 0 7. 9 3 35-4 141.4 5. 7 10.0 6.3 6 42·4 141. 4 5. 7 9.8 6.1 3 24-hour cycles 46·4 144.4 4.3 9.6 8. 7 3
6 AFG-3 52-1 141.3 5.4 6.6 61.3 64- 1 142.7 5.4 5.6 87. 0 40-4 141.3 G.3 5. 9 68.0 56-4 6.5 67.0 60-4 141.1 5.3 6. 7 70.0
7 AFG-6 53 - 1 144.0 6.2 6.4 73 .2 65-1 144.0 5.3 6.3 83 . 0 49-4 142.0 5.5 5. 9 62.0 3 57·4 142.2 5.8 5.4 80.0 3 61·4 142.1 6.0 6.4 67. 2 6
8 MFS 54-1 103.5 15.3 15.6 32.4 50·4 101.3 15. 7 22.2 17.3 58-4 102.1 16.0 20.6 26.8 62-4 102.2 15. 9 20.6 26. 6
9 KOR· ! 55-1 9.8 9.3 66. 2 51·4 119. 7 9.1 14.2 17. 0 3 59-4 118.6 9.5 15.0 7.5 3 63-4 120. 1 9.8 14.8 8. 9 6
(Continued)

21
TABLE 3 (Continued)
DETAILED RESULTS, WITH COMPACTION DATA
Compaction Data Prefrozen CBR Number Soll Sample
Corr. CBR of Remarks Ydo Wo Wopl Cycles (lb per cu ft) (per cent) (percent) (percent)
10 HSI 70-1 107.8 15.5 15.6 70.0 66-4 105. 3 16.4 31.1 0.67 3 74-4 106. 3 16.1 29.2 o. 93 6
11 WSI 71-1 106.1 17.3 17.1 48.7 67-4 104. 4 17. 9 32.0 0.67 3 75-4 104.0 18.8 32.4 0. 73 6
12 sue 72-1 114.2 15. 9 14. 4 38.7 68-4 110. 0 15.4 16.4 26.2 3 76-4 110.2 15.8 18. 0 9.0 6
13 WLT-4 73-1 136. 7 6.2 6.5 133.3 69-4 134.6 6.6 14.4 2. 7 3 77-4 134. 9 6. 7 14.2 2.2 6
14 BMS 86-1 109. 1 7. 9 7.8 37.8 78-4 106.3 7. 9 12.6 (7. 8) 82-4 107. 7 8. 4 12. 1 (15.3) 90-4 108.4 8. 0 12. 9 26. 1
15 TCS 87-1 134.3 8.5 8.5 97. 0 79-4 132. 0 7.4 8.5 80.0 83-4 132.3 7.4 7.8 73.3 91-4 132.4 8.5 9.4 68.0
16 ETS 88-1 130. 9 8.0 8.0 97. 0 80-4 128. 6 8. 1 13. 1 8.8 3 84-4 129.3 8.2 13.3 14. 1 3 92-4 129. 1 8. 3 13. 9 12.3 6 95-4 130.5 7. 8 14. 4 15.3 3 99-5 129. 8 8. 7 14. 9 8. 7 3 - 10 C 24 -hour fr eeze cycle
106-4 130. 1 9.2 14.1 16. 7 3 5-day consolidation 107-4 130. 9 8.5 30.0 3 19-day consolidation 111-6 129. 7 9.3 15. 5 (4.0) 3 -5 C 60-hour freez e cycle
(surface slanted)
17 WLS 89-1 128.2 6. 7 7.2 74.0 81 - 4 132. 0 7.2 10.5 42. 0 3 85-4 128. 0 6.9 10. 8 46. 7 3 93-4 127. 8 6.9 10. 5 48.3 6 94-4 126.2 7. 9 10. 7 53.3 3 98-5 127.2 7.5 10.2 52 .0 3 -1 0 C 24-hour fr eeze cycle
110-6 126. 9 7.1 10.9 42. 7 3 -5 C 60-hour freeze cycle
Frost Heave
During the freeze and thaw cycles, the vertical movement of the sample surface was observed by means of a dial gage. There were no continuous observations so that during nights and weekends only limited data were read. The typical curves shown in Figure 7 plot heave data versus time. From the heave-time curves, the maximum heave rates of several freeze cycles for each sample were calculated, if enough data were available. In Table 2 the average heave rates, the average maximum heave, the remaining heave after thawing (rest heave), and the CBR values are given for each soil.
CBR Values
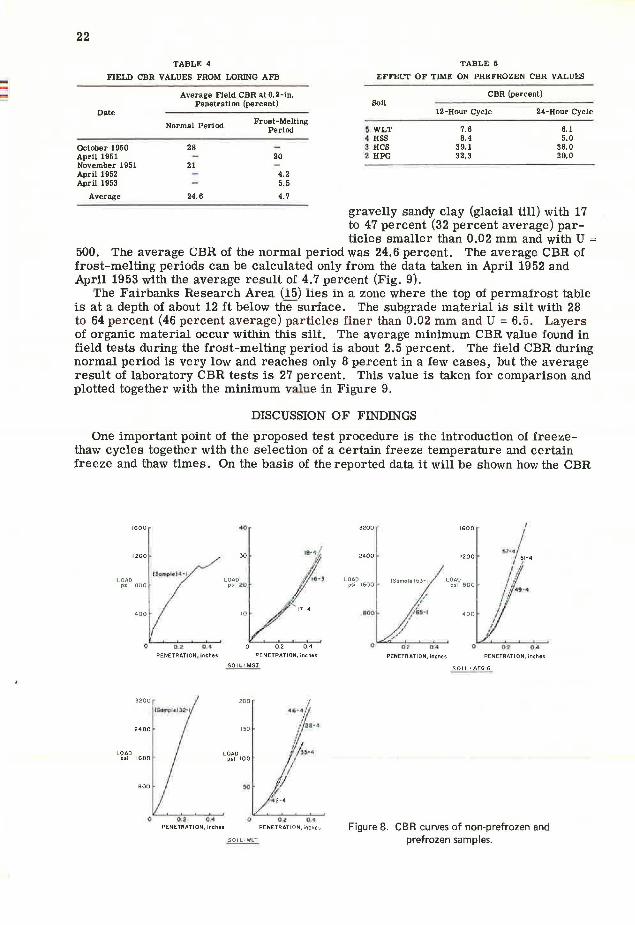
CBR tests were run with the non-prefrozen, as well as with the prefrozen, samples after several freeze-thaw cycles. In Figure 8, CBR curves of three soils are shown. Table 3 gives the compaction data of each sample, the CBR test values, and information about the freeze procedure. In Figure 9 the CBR values are plotted versus the fraction of particles smaller than 0.02 mm.
Comparison With Previous Field Tests
Several USACRREL reports on field investigations contain CBR data taken during the normal and the frost-melting periods. For example, the investigations at Loring AFB, Limestone, Maine (15), give the CBR values at 0.2-in. penetration (Table 4). These tests were performed at the surface of the subgrade, which is described a s
--
22
TABLE 4
FIELD CBR VALUES FROM LORING AFB
Average Field CBR at 0.2-in. Penetration (percent)
Date
Normal Period Frost-Melting Period
October 1950 28 April 1951 20 November 1951 21 April 1952 4.2 April 1953 5.5
Average 24.6 4. 7
TABLE 5
EFFECT OF TIME ON PREFROZEN CBR VALUES
Soil
5 WLT 4 HSS 3 HCS 2 HPG
CBR (percent)
12-Hour Cycle
7.6 8.4
39.1 32.3
24-Hour Cycle
6.1 5.0
38.0 30.0
gravelly sandy clay (glacial till) with 17 to 47 percent (32 percent average) particles smaller than 0.02 mm and with U =
500. The average CBR of the normal period was 24.6 percent. The average CBR of frost-melting periods can be calculated only from the data taken in April 1952 and April 1953 with the average result of 4.7 percent (Fig. 9).
The Fairbanks Research Area (15) lies in a zone where the top of permafrost table is at a depth of about 12 ft below the surface. The subgrade material is silt with 28 to 64 percent (46 percent average) particles finer than 0.02 mm and U = 6. 5. Layers of organic material occur within this silt. The average minimum CBR value found in field tests during the frost-melting period is about 2.5 percent. The field CBR during normal period is very low and reaches only 8 percent in a few cases, but the average result of laboratory CBR tests is 27 percent. This value is taken for comparison and plotted together with the minimum value in Figure 9.
DISCUSSION OF FINDINGS
One important point of the proposed test procedure is the introduction of freezethaw cycles together with the selection of a certain freeze temperature and certain freeze and thaw times. On the basis of the reported data it will be shown how the CBR
1600
1200
LOAD psi BOO
400
3200
2400
LOAD psi IGOO
BOO
40
30
£ 'St:1tl'llP • t1 l ~ ~1 LOAD
psi Z'O
17-4 ,0
0. 2. O• 02 04
PENETRAT I ON~ Inches PENETRATION, inches
~
200
rs°'"'i111ti 1.n·1
150
LOAD l'!.I 100
..,
0.2 0,4 PENETRATION, inches
..... !. I I••·•
I 0···
'I
O,• PENETRATION, inches
3200 1600
2400 1200
LOAD psi 1600
(Somple)53-I LOAD psi 800
400
0 O.> 0 .4
PENETRATION, inches PENETRATION, inches
SOIL; AFG-6
Figure 8. CB R curves of non-prefrozen and prefrozen samples.

Corr CBR (0 2"1 ...
100
BO
60
40
20
0
WLT
! WLT·4 Non-Prehozen +
PrafrozerH ~ •c
l 12 houn o 3cyclu • 6cycles
I 24 hours
I • 3 cycles
I • -1o•c, 24 hr freezing cycle res HPG ETS t a - 5•c, 60 hr fre.rlnQ cycle ' . l' • 5 day con1olidotlon after freezing I •FGo l .~1
,. 19 day consolldollon ofter frHzinQ
j'1' ' •j I :1 I
!.: :fO'.lR I HSI
l~ ! I I l . ' t ' • j .. i I
HCS t I ; 1 ! MSI WSI
I Bi I Hi! i . t t p i:ii ' I I sud 1 ~ I 111 i Lofing AFB :Fairbanks I
t f st l!1 I l imnlone j Alosko
Moine I . "t I lt J : 'i'
d ~ I I I i I
i ' I ' .:. ! .. ' ' - !
0 10 20 30 40 50 60 70 BO Conlent Particles, Percent finer than O 02 mm
Figure 9. CB R values versus content of particles smaller than 0.02 mm.
23
values are influence<i by the number of cycles and the temperature of the freezing test. Even though not all soil types of engineering interest are tested, a pattern can be recognized in the data.
1. With the exception of clay, there is no significant difference between the CBR after 3 and after 6 cycles in the soils tested. The tests with Manchester silt (soil No.
1), for example, show no difference in the CBR values after 1, 3, 4, 6,
Corr. CBR (02")
% 100
BO
60
40
20
T Non-Prefroun
l Pr•troun I AwQ ~md ranQt
•-1o•c ,2 ~ hr truiing cycle o - 5•c , 60 hr rrHzing cycle
doo [290 J •U•
d,o
~ 5 day con s olldol ion oUer h••zlno v 19 doy consolidolion ofler treezlnv
WLT ll 13. 3) • '
I I I
I I i ! I : :
I I i
! Conlenl Particles, Percenl finer than 0 , 02 mm
Figure 10. Average CBR values of soils with less than 15 percent content of particles smaller than 0.02 mm versus
content of particles smaller than 0 .02 mm.
and 10 cycles. 2. For four soils the CBR was
determined after freeze-thaw cycles of 12 and 24 hours' duration, as given in Table 5. The relative influence of the freezing time is higher for soils with lower prefrozen CBR, i.e., a low CBR is influenced more than a medium or high CBR. Even though the absolute reduction of the CBR values is small and lies within the ac -curacy limits, the problem of the influence of the freezing time remains. Further studies must establish the difference between a CBR value with a 12-hour freezing time and values reached after a much longer freezing time. The final values will probably be approached asymptotically.
3. Because all tests were run with the same cabinet temperature, it is not known how the freezing temperature affects the CBR values. For this question, also, further studies

24
are necessary. The reported data es tablish the expec ted difference in the behavior of coarse and fine soils, for prefrozen and for non-prefrozen samples. For soils with a high coefficient of uniformity, the reproducibility is better than for poorly gradated coarse soils. In general, test reproducibility with regard to the differences in the compacting water contents and dry densities is satisfactory.
Figure 10 shows the average values and the range of prefrozen CBR versus the fraction of particles smaller than 0.02 mm for the tested soils having less than 15 percent of this fine fraction. A relationship between the frost action and the bearing capacity during frost -melting periods can be found if both the fine material and the coarse material within a soil are taken into consideration, because the fine material is responsible for the frost effect and the coarse material is mainly responsible for the remaining bearing capacity. Therefore, the coefficient of uniformity is introduced. As shown in Figure 10 the prefrozen CBR v::ihrnA ::ire determined hy the content of particles smaller than 0.02 mm and the coefficient of uniformity. Because these two elements do not completely describe the gradation curve , the given dependence cannot fit exactly, but the general effects clearly emerge.
Based on this finding it may be possible to modify the Casagrande criterion by introducing the coefficient of uniformity. The proposed test procedure must be run only for answering special questions such as es tablishing the influence of a mineral compound or the chemical conditions.
Furthermore, it is possible to use the reduction of the CBR caused by frost action directly as a scale to classify the soils according to frost susceptibility. By using such a frost-susceptibility classification, however, an additional manipulation is needed to translate the sus ceptibility values to the design m ethod . Therefore, the pr efrozen CBR values should be introduced directly, or after some correction, into the design procedure. Further studies are necessary, and the goal of such studies should be the selec-.... ..: __ _ .s: J..1...- "...J--..:~ rtnn11 I~\ -- LL-.,_ __ .:_ -£ .L.L- ----------...l ____ .... ,__..i Al-- J..L- 11~-..l-----l UUH U.l Ult::: Ut::: ~.l~U \...o.1.J.I.\, \ U ) uu Lilt' Ud~l~ U.l l..Ht:' !J.1 U.l:JU~ t:U JJJ. tauuu. .t1...l~U Ult:: .1 t::: UU\; t; U
subgrade strength design method" (17) should be verified or completed. To determine the thickness of rigid pavements it should be possible to find a new approximation to the "modulus of subgrade reaction kf for the frost-melting period" (17).
CONCLUSIONS
Seventeen different soils were tested by subjecting the remolded samples to several freeze-thaw cycles followed by the CBR test. The proposed test procedure is applicable to the most important soil types-dirty sands and gravels. If necessary, the method can also be used for clean sands and gravels as well as for silts, but not fo r clays.
The influence of the duration of the freezing and thawing time as well as the number of cycles is lower than expected, except for clays. The influence of different temperatures is still to be investigated. It is possible to use the proposed test procedure for modifying the Casagrande criterion to take account of grain size above 0.02 mm as well as to verify or complete existing road design methods for frost action.
ACKNOWLEDGMENTS
The senior author wishes to express his appreciation to USACRREL where the present investigations were performed while he held a Deutscher Akademischer Aus taushdienst (DAAD) Fellowship. This support is also gratefully acknowledged.
REFERENCES
1. George, K. P ., and Davidson, D. T. Development of a Freeze-Thaw Test for Design of Soil Cement. Highway Research Record 36, 1963, pp. 77 - 96.
2. Klengel, K. J. Prophylaktische Bekaempfung von Frostschaeden. Strasse 5, No. 10, 1965, pp. 484-489.
3. Klibler, G. Influence of Meteorologic Factors on Frost Damage in Roads. Highway Research Record 33, 1963, pp. 217-261.
4. Sayman, W. C. Plate - Bearing Study of Loss of Pavement Supporting Capacity Due to Frost. HRB Bull. 111, 1965, pp. 99-106.

25
5. Fredrickson, F. C. Frost Considerations in Highway Pavement Design: WestCentral United States. Highway Research Record 33, 1963, pp. 35-60.
6. Yao, L. Y. C., and Broms, B. B. Excess Pore Pressures Which Develop During Thawing of Frozen Fine-Grained Subgrade Soils. Highway Research Record 101, 1965, pp. 39-57.
7. Vodolazkii, V. M. Strength Characteristics of Thawed Clayey Soils in Various Stages of Consolidation. Trudy Severnogo Otdeleniia Inst. Merzlotovedeniia, Vyp. 2, pp. 66-72.
8. Zaretskii, Yu. K. Theory of Consolidation of Soils. Moscow, 1967. 9. Flexible Airfield Pavements. Technical Manual TM 5-824-2, Headquarters, De
partment of the Army, 1958. 10. Kaplar, C. W. New Experiments To Simplify Frost Susceptibility Testing of Soils.
Highway Research Record 215, 1968, pp. 48-59. 11. Hveem, F. N., and Zube, E. California Mix Design for Cement-Treated Bases.
Highway Research Record 36, 1963, pp. 11-55. 12. British Standard Test 1924. 1957. 13. The California Bearing Ratio Test as Applied to the Design of Flexible Pavements
for Airports. U.S. Army Waterways Experiment Station, Vicksburg, Miss., Technical Memo. 213-1, 1945.
14. Ruckli, R. Der Frost im Baugrund. Springer-Verlag, Vienna, 1950. 15. Sayman, W. C., and Gilman, G.D. Field Investigations at Frost Test Area,
Loring AFB, Limestone, Maine, and Supplementary Investigations 1950-1956. USACRREL, Internal Rept. 35, 1967.
16. Kaplar, C. W. Accelerated Heavy-Load Traffic Tests, Fairbanks, Alaska, 1951-1952. USACRREL, Internal Rept. 8, 1954.
17. Pavement Design for Frost Conditions. Technical Manual TM 5-818-2, Headquarters, Department of the Army, 1965.
Appendix BRIEF GEOLOGICAL DESCRIPTION OF THE TESTED SOILS
by
A. Greatorex U.S. Army Cold Regions Research and Engineering Laboratory
1-Manchester Silt A flood plain or glacial lake deposit of felsic, subrounded to subangular silt-sized particles; the original deposit shows fairly uniform graded bedding, which is indicative of seasonal climatic changes in the sedimentation occurring in a glacial lake
2-Hutchinson Pit Gravelly Sand A glaciofluvial deposit, probably a kame or esker deposit, consisting of unsorted igneous and metamorphic rock fragments and grains
3-Hanover Clean Sand A glacial deposit of moderately sorted igneous and metamorphic sand grains with minor amounts of gravel and silt sizes; deposit is probably a kame resulting from a valley glacier during the last glacial period
4-Hanover Silty Sand A glaciofluvial deposit, probably formed as a kame, occurring directly downstream from the clean sand described in 3

26
5-West Labanon Till
6-Afghanistan No. 3 Sand
7-Afghanistan No. 6 Sand 8-Manchester Fine Sand
9-Korean Sand No. 1
10-Hanover Silt
11-Wilder Silt
12-Suffield Clay
13-West Labanon Till
15-Thetford Center Sand
16-East Thetford Red Sand
17-West Lebanon Sand
A glaciofluvial deposit, probably a ground moraine deposited by the Laurentide glacier during the last glacial period Appears to have been obtained from a fluvial deposit of unknown origin in mountainous terrain Similar to the sand described in 6 A fluvial deposit of felsic and micaceous minerals occurring on the flood plain of a meandering river; source areas of these minerals are plutonic igneous and high-grade metamorphic formations Probably a fluvial deposit; however, the geology and the geologic history of the area are unknown to the writer A varved glacial lake deposit containing monomineralic, subrounded to subangular grains from igneous, sedimentary, and metamorphic source areas A fluvial, varved glacial lake deposit of much the same origin as Hanover silt; both deposits are result of seasonal climatic changes causing a change in the size of the particles that settle out of the lake water A silt- and clay-sized aggregate of particles occurring as a flood plain deposit directly over glacial drift Same as that mentioned in 5 but has been scalped above the No. 4 screen of the Tyler sieve series A ..,.,.....,,..,.nll ... .,. ,r:..;1.f.,.,. ""'""" .f!,...n'l'VI 1\/fr'\n,...at::t.f-nu7n 1\.TanT Tn,...nn .. ,.
... -;a. 5.&.Q.Y\J.L.LJ' ,,;;;:J.&..&.1.J QU.&.J.\A .L.LV,L.U, .&.t'.LVV.L.._,~'-VV\1.1..I.' J."1"'-'VY U'-'.&.Q'-.J)'
occurring as a beach or coastal plain deposit; high degree of sorting and subrounded to rounded nature of the felsic grains indicates considerable degree of reworking by sea waves; fines that give the material its unusual color may be the result of washing down from overlying material or sedimentary deposition in seawater at a later date A poorly sorted, fluvial deposit of grains mechanically weathered from metamorphic formations; grains are not yet reduced to monomineralic composition and have been transported only a short distance before being redeposited A glaciofluvial deposit of moderately sorted materials; origin is primarily metamorphic; probably laid down as an esker or kame-like formation A glaciofluvial deposit of metamorphic and igneous grains, some being monomineralic; deposit occurs in post-Laurentide glacier sediments laid down approximately 10,000 years ago