Embed Size (px)
Citation preview

Influence of evaporative demand on aquaporin expressionand root hydraulics of hybrid poplarpce_2331 1318..1331
ADRIANA M. ALMEIDA-RODRIGUEZ, UWE G. HACKE & JOAN LAUR
Department of Renewable Resources, 442 ESB, University of Alberta, Edmonton, AB, Canada T6E 2E3
ABSTRACT
When light levels and evaporative demand increase,dynamic physiological changes in roots may be required torestore the water balance at the whole plant level. Wehypothesized that a dynamic increase in root hydraulic con-ductance (LP) and aquaporin (AQP) expression couldmoderate the transpiration-induced drop in water potential(Y), allowing continued gas exchange in hybrid poplar(Populus trichocarpa ¥ deltoides) saplings. Fifty-six AQPshave been identified in poplar, but little information abouttheir expression patterns in roots is available, especiallyfrom a whole-plant water relations perspective. We mea-sured AQP expression and LP in plants subjected to differ-ent levels of light and evaporative demand. Shaded plantshad only one-tenth the root area of plants growing at higherlight levels. Shade-grown saplings experiencing a suddenincrease in light exhibited a threefold higher LP than plantsremaining in shade. This dynamic increase in LP corre-sponded with increased transcript abundance of 15 AQPsout of a total of 33 genes simultaneously assessed by quan-titative RT-PCR. The tissue-level localization of transcriptsof four AQPs was studied with in situ hybridization.Comprehensive expression profiling in conjunction withphysiological and morphological measurements is a valu-able reference for future studies on AQP function in poplar.
Key-words: hydraulic conductance; in situ hybridization;roots; water uptake.
INTRODUCTION
Plant water loss is a function of stomatal conductance (gs)and atmospheric demand. For a plant to avoid desiccation,it must regulate water loss so that it does not exceed thesupply rate through roots (Jackson, Sperry & Dawson2000). Therefore, uptake and transport of water throughroots pose a constraint on water use. Water flowing throughvarious tissues in fine roots on its way to the xylem canfollow an apoplastic pathway through cell walls and a cell-to-cell route (Steudle & Peterson 1998; Henzler et al. 1999).Studies using inhibitors such as HgCl2 have shown that thelatter transport route can be largely facilitated by a group oftrans-membrane proteins, known as aquaporins (AQPs;Wan & Zwiazek 1999; North, Martre & Nobel 2004). In the
Populus trichocarpa genome, 56 AQPs have been identified(Gupta & Sankararamakrishnan 2009; Almeida-Rodriguezet al. 2010). Based on sequence similarity, these AQPs canbe grouped into five subfamilies: the plasma membraneintrinsic proteins (PIPs), tonoplast intrinsic proteins (TIPs),noduline-26-like intrinsic proteins (NIPs), small basicintrinsic proteins (SIPs) and X-intrinsic proteins (XIPs)(Tuskan et al. 2006; Gupta & Sankararamakrishnan 2009).The PIPs, with their phylogenetic subgroups PIP1 and PIP2,and the TIPs are the most abundant AQPs in the plasmamembrane and vacuolar membrane, respectively (Maurelet al. 2008), whereas the subcellular location of NIPs, SIPsand XIPs is less well established (Katsuhara et al. 2008;Gomes et al. 2009). PIP2 proteins function as water chan-nels (Chaumont et al. 2000; Marjanovic et al. 2005; Secchiet al. 2009; Almeida-Rodriguez et al. 2010) and may interactwith PIP1 members by forming heterooligomer structures(Fetter et al. 2004; Zelazny et al. 2007;Vandeleur et al. 2009).While members of the TIP and SIP subfamilies have shownwater transport capacity (Ishikawa et al. 2005; Li et al. 2008;Maurel et al. 2008), some NIPs and XIPs are involved in thetransport of glycerol, urea, boric acid and other molecules(Bienert et al. 2011; Katsuhara et al. 2008; Gomes et al.2009).
The control of water loss through stomata is influencedby many environmental and plant-specific factors, and thereis accumulating evidence for an equally complex regulationof AQP activity in roots. Diurnal variations in the hydraulicconductance of fine roots have been measured in manyspecies. In roots of Lotus japonicus, for instance, AQP tran-script levels and LP increased markedly during the first 6 hof the photoperiod (Henzler et al. 1999). However, analo-gous to patterns of gs, AQP expression and LP maynot only be strictly governed by an endogenous circadianrhythm (Postaire et al. 2010), but may also be under a morecomplex influence of environmental factors (Gomes et al.2009). AQP-mediated changes in LP have been observedduring exposure to and recovery from environmentalstresses, such as drought (Martre et al. 2002; Siemens &Zwiazek 2003; North & Peterson 2005). While environmen-tal factors such as soil drought usually develop gradually,changes in irradiance can trigger rapid changes in transpi-rational demand.When light levels increase, dynamic physi-ological changes may be required to restore the waterbalance at the whole plant level. Maximizing LP during thetimes of highest water loss would help to keep the stomataCorrespondence: U. Hacke. e-mail: [email protected]
Plant, Cell and Environment (2011) 34, 1318–1331 doi: 10.1111/j.1365-3040.2011.02331.x
© 2011 Blackwell Publishing Ltd1318

open while reducing the drop in xylem pressure (Hill,Shachar-Hill & Shachar-Hill 2004) and thereby preventingxylem cavitation.
According to this reasoning and assuming there is ageneral agreement between patterns of gs and LP
(Kamaluddin & Zwiazek 2003), canopy shading may beexpected to induce a drop in LP. This has indeed beenobserved in deep roots of two tree species, Quercus fusifor-mis and Bumelia lanuginosa (McElrone et al. 2007). McEl-rone et al. hypothesized that such AQP-mediated variabilityin LP in response to changing water demand could repre-sent a universal strategy among higher plants. This intrigu-ing hypothesis awaits further testing, especially in modelplants like poplar. Moreover, changes in LP should belinked with expression profiling to explore which AQPgenes are involved in LP responses.
Despite considerable physiological work in exploringroot hydraulics and the effects of inhibitors in Populustremuloides (Kamaluddin & Zwiazek 2003; Siemens &Zwiazek 2003, 2004; Voicu & Zwiazek 2004), only limitedinformation on AQP gene expression in roots of Populusspecies is available (Marjanovic et al. 2005; Almeida-Rodriguez 2009; Secchi et al. 2009; Cocozza et al. 2010).Even less is known about how AQP expression in poplarroots responds to changing environmental factors. Uncer-tainty also exists about tissue-level localization of AQPtranscripts and protein in roots (and other plant organs forthat matter, Hacke et al. 2010) of poplar.
While stomata and AQPs allow for dynamic ad-justments of water loss and uptake, plants also showdevelopmental plasticity by adjusting xylem traits and theproportion of root area (AR) relative to leaf surface area(AL) to maintain a favourable water status at the whole-plant level. Such morphological adjustments are well docu-mented in response to differences in soil texture (Hackeet al. 2000) and nutrient supply (Ewers, Oren & Sperry2000). Under low irradiance conditions, plants tend toincrease their leaf area in order to maximize light capture,and reduce allocation of carbon to the root system (Reichet al. 1998).
In this study we measured the LP and the expression of 33AQP genes in fine roots of hybrid poplar saplings growingat different light levels. Many studies have shown that regu-lation of AQPs can occur at least to some extent at the levelof transcription (reviewed by Maurel et al. 2008). Accord-ingly, we expected that irradiance-related changes in LP
would be linked to the transcript abundance of individualAQPs. Members of the SIP and NIP subfamilies wereincluded in the gene expression analysis to explore thephysiological role of these understudied AQPs in poplar. Inone experiment, we evaluated the acclimation of LP to threedifferent light levels by growing plants for 1 month in envi-ronments that differed in irradiance and evaporativedemand.We also measured the AR and AL of these plants tostudy the relative roles of morphological and physiologicaladjustments to differences in evaporative demand. Wehypothesized that plants growing in full sun will exhibithigher AR : AL ratios, higher LP, and, to the extent that
individual AQPs are involved in water transport, higherAQP gene expression levels than plants growing at lowerirradiance levels.
In a second experiment, all plants were grown in shadeconditions in a controlled environment. A subset of plantswas then transferred from shade to light, and the dynamicresponses of LP and AQP expression were measured beforesignificant increases in AR could occur. In this experiment,we hypothesized that plants subjected to an increase in lightand evaporative demand will increase LP and the transcriptabundance of individual AQPs to moderate changes inwater potential. Moreover, in situ hybridization (ISH)experiments were conducted to analyse tissue-specific geneexpression patterns of two PIP and two TIP genes in shadedand light-exposed plants.
MATERIALS AND METHODS
Plant material
Saplings of hybrid poplar (P. trichocarpa ¥ deltoides, cloneH11-11) were produced from 4 cm long shoot cuttings con-taining one or two non-flushed buds. The basal ends of thestem segments were immersed in 0.8% Indole-3-butyricacid (IBA) rooting solution and planted in 144 cm3 pots,containing peat moss, vermiculite, and turface calcined clay(2:1:1/2). Shoot cuttings were kept in a high humidity envi-ronment supplied with light for 3 weeks until rooted.
Plant growth conditions in experiment 1
Acclimation of selected traits to different levels of lightintensity was evaluated in experiment 1. Plants weregrowing for 1 month in three environments that differed inlight level. Rooted cuttings were replanted in 4 L pots withthe aforementioned soil composition plus 2.75 g L-1 ofNutricote Total 13–13-13, type 180 controlled release fertil-izer. Cuttings were watered daily and fertilized (2 g L-1
NPK 15–30-15) once a week. Plants were grown for 1 monthin the greenhouse under semi-controlled conditions (22/20 °C day : night cycle, 18/6 h light : dark) before being ran-domly assigned to one out of three light regimes: (1) full sunon the roof of the greenhouse (full sun plants); (2) c. 50% offull sun inside the greenhouse (intermediate plants); and (3)2.5% of full sun which was achieved with shade boxes insidethe greenhouse (shaded plants). Measurements were con-ducted in August 2009.
Plant growth conditions in experiment 2
This experiment was designed to examine changes ofroot hydraulic conductance and AQP gene expression inresponse to a short-term increase in light under controlledconditions. Rooted cuttings were replanted in 4 L pots onlycontaining turface calcined clay plus 2.75 g L-1 of controlledrelease fertilizer. We found that this soil greatly facilitatedthe preparation of root segments and the separation of rootsfrom soil particles compared with soil used in experiment 1.
Aquaporin expression and hydraulic conductance in poplar roots 1319
© 2011 Blackwell Publishing Ltd, Plant, Cell and Environment, 34, 1318–1331
Plants were watered and fertilized as in experiment 1 andwere grown for a month under a 16/8 h photoperiod at200 mmol m-2 s-1 and a temperature cycle of 22/20 °C day/night.A preliminary experiment had shown that LP shows astronger response to a sudden increase in light level than toa decrease (data not shown). Hence, plants were kept inshade boxes for 1 month. Then a subset of plants wasremoved from the shade box in the evening, and exposed tohigher light levels during the entire light period the followingday. This group of plants experienced a nearly fivefoldincrease in photosynthetic photon flux density (PAR) from39 � 4 in shade conditions to 185 � 14 mmol m-2 s-1. Plantswere measured 40–46 h after being removed from the shadebox. This time period was chosen because it is too short toallow for significant changes in root area, but long enough todetect aquaporin-mediated adjustments of LP (McElroneet al. 2007). Plant height above pots at the time of measure-ments was 0.66 � 0.04 and 0.62 � 0.05 m in shaded andtransferred plants, respectively. Measurements were con-ducted in November 2009.
Plant water status and light intensity
Leaf water potential (YL) was measured with a pressurechamber (PMS, Albany, OR, USA) on a total of 4 (experi-ment 1) and 8–10 plants per group (experiment 2), respec-tively. The gs was measured in the growth chamber with asteady state porometer (LI-1600, Li-Cor, Lincoln, NE,USA) on leaves of six plants per group. Photosyntheticphoton flux density was measured at the leaf surface usinga quantum sensor (LI-190, Li-Cor). All measurements wereconducted between 930 and 1100 h.
Root hydraulic conductance
The LP of white root tips was measured by using a modifiedversion of the vacuum method described previously (North& Nobel 1991).LP was measured in eight (experiment 1) andsix plants per group (experiment 2). Distal root segmentswere gently removed from the loosened soil under water.Roots were transferred to a water-filled tray and trimmed toa final length of 5 cm with the tips left intact. The proximalend (1.5 cm) of a root segment was inserted into a 13 mmlength of high density polyethylene (HDPE) tubing (3 mminside diameter).The space between the root and the HDPEtubing was sealed with dental impression material andcyanoacrylate glue. The root segment and HDPE tubingwere fitted to a tubing system. Root segments wereimmersed in a reservoir of filtered (0.2 mm) deionized waterwhich was placed on an electronic balance.The balance wasconnected to a computer and the weight change wasrecorded every 10 s. Water flow through the root segmentwas induced by applying a partial vacuum to the open end ofthe tubing system. Pressure was first decreased to -40 kPa.After the flow rate stabilized, the vacuum pressure wasincreased to -30, -20 and -10 kPa, and the flow rate (Qv,m3 s-1) was recorded at each pressure after it stabilized.After the measurements were completed, the root segment
was photographed using a stereomicroscope and a digitalcamera.The integrity of each individual root was confirmedusing the stereomicroscope, and the surface area of the rootsegment was determined from root length and mean diam-eter using image analysis software. LP was calculated as theslope of the relationship between the volumetric flux density(Jv = Qv per unit surface area of the root segment, m s-1) andthe vacuum pressure (North et al. 2004; Pratt et al. 2010).AllLP measurements were conducted between 1030 and 1600 h.Roots of different plant groups were measured at randomtimes during this time period.
Effect of hydroxyl radicals (•OH) on LP
To assess the contribution of aquaporins to LP, we used•OH (Henzler, Ye & Steudle 2004; McElrone et al. 2007;Boursiac et al. 2008). Hydroxyl radicals were producedusing the Fenton reaction by mixing equal parts of 2 mmH2O2 and 1 mm FeSO4. After measurement of LP in water,the root segments were immersed in a reservoir containingthe Fenton reaction mixture. The vacuum pressure wasdecreased to -40 kPa and LP was measured as before. Theeffect of •OH on Qv was usually apparent within minutes. Insome cases (experiment 1), the root segments were thenrinsed in water, immersed in deionized and filtered water,and LP was measured again after removing •OH to evaluatethe reversibility of the effect of •OH on LP.
Root and leaf areas
Whole plant root (AR) and leaf areas (AL) of four saplingsper group were measured in experiment 1.The root systemswere harvested by carefully sifting the root-containing soilof each pot through a sieve and washing the roots under agentle water jet. To determine AR, specific root surface area(cm2 g-1) was measured on randomly selected sub-samples.Three sub-samples of each root were spread out in water,and the surface area was scanned and measured using aWinRhizo image processing system (Regent, Quebec,Canada). After analysis, roots were dried (48 h, 70 °C) andweighed. Specific root area was determined for plants rep-resenting each light level. The remaining roots were oven-dried and weighed. The relationship between root dryweight and root surface area from the sub-samples was usedto calculate AR. AL was measured with a LI-3100C leaf areameter (Li-Cor).
Tissue collection for molecular assays
After obtaining root samples for the Lp measurements inexperiment 1, the remaining roots of the plants werewashed and root tips with approximately the same length asthe ones used in the Lp measurements were immediatelyfrozen in liquid nitrogen and stored at -80 °C. For experi-ment 2, root tips of four intact plants from each treatmentwere harvested from the turface clay substrate, frozen inliquid nitrogen and stored at -80 °C. Tissue samples for themolecular assays were collected between 9:30 and 14:00 h.
1320 A. M. Almeida-Rodriguez et al.
© 2011 Blackwell Publishing Ltd, Plant, Cell and Environment, 34, 1318–1331

RNA extraction, cDNA preparation,primer design and validation, andefficiencies calculation
Total RNA from roots was extracted using the hexadecylt-rimethylammonium bromide (CTAB) extraction protocol(Chang, Puryear & Cairney 1993). One microgram of totalRNA was treated with Deoxyribonuclease I (Invitrogen,Carlsbad, CA, USA) and used as template for first strandcDNA synthesis using oligo(dT)23VN and SuperScript IIreverse transcriptase (Invitrogen), following the manufac-turer’s instructions. AQP sequences used in this studywere previously identified (Almeida-Rodriguez et al. 2010).Amino acid sequences of reference genes previouslyreported in Arabidopsis (Czechowski et al. 2005) were usedto search for gene candidates in the P. trichocarpa genomedatabase v2.0 (http://www.phytozome.net/poplar) usingBLASTP. Gene-specific qRT-PCR primers [melting tem-perature (Tm) = 60 � 1 °C] were designed mainly in the3′UTR-region using the universal probe library assaydesign center (Roche, Basel, Switzerland) (see SupportingInformation Table S1). Gene-specific primer design forPtXIP1;1 and PtXIP1;2 was not achieved. For each gene,PCR efficiency (E) was determined from a four-pointcDNA serial dilution, according to: E = 10[-1/slope]. Althoughdifferent pairs of primers were tested, either primer valida-tion or efficiency tests of 17 AQPs failed. Therefore, theseAQPs were not included in the qRT-PCR study (data notshown).
cDNA preamplification and microfluid-basedhigh-throughput qRT-PCR
For microfluidics-based qRT-PCR on the FluidigmBiomark, we carried out preamplification of cDNA sampleswith the TaqMan Pre-Amp 2X Master Mix (Applied Bio-systems, Foster City, CA, USA) by following the proceduresrecommended by Fluidigm. High-throughput qRT-PCRwas performed on preamplified cDNA samples and analy-sed on 48.48 dynamic arrays (2304 reactions per run).Assaymixtures were prepared following the manufacturer’s pro-tocol using Fluidigm DA Assay Reagent in combinationwith Roche UPL probes and oligonucleotides (IDT).Sample mixtures were set up according to the manufac-turer’s information using Fluidigm DA Sample Reagent,TaqMan Universal PCR Master Mix and preamplifiedcDNA samples. The microfluidic qRT-PCRs were runaccording to thermal-cycling parameters recommended bythe manufacturer for the TaqMan Universal PCR MasterMix. For each experimental light condition, we tested fourbiological samples in triplicate, including three technicalreplicates for each of the biological replicates. Fourreference genes were included in the plate: ElongationFactor-1 alpha (EF1-a) (POPTR_0016s08780) includedin triplicate; Eukaryotic Translation Initiation Factor(TIF5A) (POPTR_0008s09150) and Ubiquitin-ConjugatingEnzyme-10 (UBC10) (POPTR_0011s17120) both includedin duplicate; and Protein Serine/Threonine Phosphatase
(PP2A) (POPTR_0008s19590) included once. Relativechanges in the gene expression of the AQPs were calculatedbased on the 2-DDCT method. DDCT values were calculatedindividually for each reference gene, and differential geneexpression was calculated as the geometric mean of all theDDCT values (Vandesompele et al. 2002).
In situ hybridization
Digoxigenin-labelled antisense and sense probes for fourAQPs (PtdPIP1;4, PtdPIP2;10, PtdTIP2;1 and PtdTIP2;3)were generated with the DIG RNA labelling kit as recom-mended by the manufacturer (Roche). Probes ranging from272 to 429 bp were designed to target part of the 3′endcoding region and the 3′ untranslated regions specific foreach gene (Supporting Information Table S2). Templateswere synthesized by in vitro transcription of PCR ampli-cons, cloned into pGEM-T Easy vector (Promega, Madison,WI, USA) and sequenced to determine orientation (Sup-porting Information Material S3). Fine roots of shaded andlight-exposed saplings were sampled, fixed in paraformal-dehyde solution [4% paraformaldehyde and 1¥ phosphate-buffered saline (PBS)] under vacuum for 2 h, and processedas described by Brewer et al. (2006). Sense probe hybridiza-tions were used as controls. ISH was performed using anIsHyb In Situ Hybridization Kit (http://www.mediacy.com)following the manufacturer’s protocol. Images were takenusing a Leica DFC420C camera (Wetzlar, Germany)mounted on a Leica DM3000 microscope.
Immunolocalization
Fine roots were fixed in 4% paraformaldehyde, 4% sucroseand 0.25% glutaraldehyde under vacuum for 2 h, processed,embedded in paraffin and sectioned as described previously(Sutton et al. 2007). Cross-sections (8 mm) were prepared at25–30 mm from the root tip using a microtome. Sectionswere mounted on slides and dried overnight. The next day,sections were dewaxed twice for 10 min each in Histochoice(Sigma-Aldrich, St Louis, MO, USA), rehydrated throughan ethanol series, rinsed three times for 10 min in PBS andblocked for 30 min in 1% (w/v) bovine serum albumin(BSA) in PBS. A polyclonal primary antibody directedagainst PIPs previously synthesized by Miyamoto et al.(2005) was used in this study. This antibody was raisedagainst the polypeptides FSA TDP/A KRN/S ARD SH(this motif is conserved in all poplar PIPs except forPtPIP2;8 and PtPIP2;9). Anti-PIP in 1% BSA and 1¥ PBSwas applied overnight at +4 °C. Sections were washed threetimes in blocking solution.Anti-rabbit IgG-FITC secondaryantibody (Sigma-Aldrich) was diluted in 1% BSA and 1¥PBS, and applied for 90 min at room temperature. Sectionswere washed three times in blocking buffer and thenmounted in glycerol. Controls with no primary and/orsecondary antibody were prepared. Images were takenwith a Leica DMRXA fluorescence microscope equippedwith a Nikon DXM1200 (Melville, NY, USA) camera at astandardized exposure time.
Aquaporin expression and hydraulic conductance in poplar roots 1321
© 2011 Blackwell Publishing Ltd, Plant, Cell and Environment, 34, 1318–1331

Statistics
All statistical analyses were carried out using SigmaStat 3.5(Systat, Point Richmond, CA, USA). Differences because ofthe effects of light level were analysed using one-way analy-sis of variance followed by a Tukey’s test (experiment 1),and by unpaired Student’s t-tests (experiment 2). For theqRT-PCR data, differences in AQP gene expression ofplants exposed to light relative to shaded plants wereanalysed using unpaired t-tests and confidence intervals(Willems, Leyns & Vandesompele 2008; Derveaux, Vandes-ompele & Hellemans 2010) (Supporting InformationFig. S1). Data were transformed as necessary to satisfyassumptions of normality. In the case of qRT-PCR data,differences were considered significant if equivalent resultswere obtained with t-tests and confidence intervals. Dataare presented as means � SE. Differences were consideredsignificantly different at P < 0.05.
RESULTS
Acclimation of morphological andphysiological plant traits to threelevels of irradiance (experiment 1)
Values for morphological traits of plants growing underdifferent light conditions are shown in Table 1 and Fig. 1a.Plant height, AL, AR and root-to-leaf area ratio (AR : AL)were similar in plants growing at intermediate and full sun-light. By contrast, shaded plants were almost 50% shorterand maintained only about one-tenth of the AR and one-fifth of the AL of intermediate and full sun treatments. TheAR : AL values of shaded plants were ~50% smaller than inthe two other plant groups. The diameter of the root seg-ments used to measure LP (Droot-tip) was smallest in shadedplants, intermediate in plants growing at intermediate lightand highest in plants growing in full sunlight (Table 1).
Despite differences in Droot-tip, the initial LP was similarin all plant groups (Fig. 1b, black bars). Hydroxyl radicalsreduced LP to 60, 45 and 50% of the initial LP in shaded,intermediate and full sun plants, respectively (Fig. 1b,hatched bars). This reduction in LP was significant at eachlight intensity level (P < 0.05). After removal of •OH, LP
recovered to 88 and 69% of its initial value in shaded andintermediate plants, respectively. However, LP did notrecover in full sun plants. Despite the pronounced differ-ences in light level, all plant groups maintained similar leafwater potentials (YL) (Fig. 1c).
Dynamic adjustments to an increase in lightintensity (experiment 2)
This experiment was conducted to examine whetherselected hydraulic traits and AQP expression wouldchange in response to a sudden increase in light level. One
Table 1. Morphological traits of poplarsaplings growing at three light levels inexperiment 1: plant height above pots, leafarea (AL), root area (AR) and diameter ofroot segments used to measure roothydraulic conductance (Droot-tip)
Light intensity Low Intermediate Full sun
Plant height (m; n = 8) 0.44a (0.02) 0.85b (0.03) 0.87b (0.06)AL (m2; n = 4) 0.060a (0.008) 0.340b (0.016) 0.291b (0.019)AR (m2; n = 4) 0.26a (0.07) 2.81b (0.51) 2.46b (0.27)Droot-tip (mm; n = 8) 0.54a (0.03) 0.80b (0.05) 0.95c (0.04)
Data shown are means and SE in parentheses. Means followed by unique letters are different(one-way analysis of variance followed by a Tukey’s test).
Figure 1. Root-to-leaf area ratio, AR : AL (a), root hydraulicconductance, LP (b) and leaf water potential (c) of hybrid poplarsaplings growing at low, intermediate or full light (experiment 1).All panels in (b) show the initial LP measured in water (filledbars), after treatment with hydroxyl radicals (hatched bars), andafter recovery in water (open bars). Bars labelled with uniqueletters indicate significant differences (one-way analysis ofvariance followed by a Tukey’s test). Differences in AR : AL ratios(P = 0.071), initial LP [filled bars in (b), P = 0.862] and leaf waterpotential were not significant (P = 0.052). Means � SE are shown.
1322 A. M. Almeida-Rodriguez et al.
© 2011 Blackwell Publishing Ltd, Plant, Cell and Environment, 34, 1318–1331

group of plants remained in shade conditions inside agrowth chamber. Another group of plants (subsequentlyreferred to as light-exposed plants) was removed from theshade boxes to experience a ~fivefold increase in irradi-ance (maximum light level in the growth chamber) duringone full light cycle. Plants showed several physiologicaladjustments in response to a sudden increase in light leveland evaporative demand. Roots of light-exposed plantsshowed more than a three-fold increase in LP comparedwith shaded plants (Fig. 2a, black bars). Hydroxyl radicalsinduced a drop in LP to 35 and 29% of the initial LP mea-sured in shaded and light-exposed plants, respectively(Fig. 2a, black versus hatched bars). This drop in LP inresponse to •OH was highly significant in both plantgroups (P < 0.001, paired Student’s t-test). The gs was 33%higher in light-exposed compared with shaded plants(Fig. 2b). The increase in light intensity and gs was associ-ated with a significant drop in YL from -0.81 � 0.06 MPa
in shaded plants to -0.98 � 0.05 MPa in light-exposedplants. The YL of light-exposed plants represents thelowest value of any plant group measured in this study.
AQP gene expression during acclimation tocontrasting levels of irradiance
To examine AQP gene expression in fine roots duringacclimation to contrasting light levels, we performed qRT-PCR on root tip samples from shaded and full sun plants.From the 33 AQP genes whose transcript abundance wasstudied simultaneously, 18 showed higher expression levelsin full sun plants compared with shaded plants (Fig. 3a).Increases in expression level were observed in five of thePIPs and in eight of the TIPs, specifically in PtPIP1;1,PtPIP1;2, PtPIP1;4, PtPIP2;3, PtPIP2;4, PtTIP1;1,PtTIP1;3, PtTIP1;4, PtTIP1;5, PtTIP1;6, PtTIP2;1,PtTIP2;3, and PtTIP4;1. By contrast, two AQPs (PtPIP1;5and PtNIP3;3) showed higher expression levels in shadedplants. Three of the SIPs showed no changes in expression;two were more highly expressed in full sun plants than inshaded plants.
AQP gene expression measured after anincrease in light intensity
Fifteen of the AQP genes measured simultaneously showedsignificantly higher expression levels in root tips of light-exposed plants compared with shaded plants (Fig. 3b). Agreater than twofold increase in expression level was foundin two PIPs (PtPIP1;2 and PtPIP2;3), two TIPs (PtTIP1;1and PtTIP2;3) and one NIP (PtNIP3;4). All of these AQPsalso showed high expression levels in the full sun plantsassessed in experiment 1. However, three PIPs (PtPIP1;4,PtPIP2;5 and PtPIP2;10) showed very low transcript abun-dance in light-exposed plants. PtPIP1;4 showed a fourfolddecrease in expression level in light-exposed plants com-pared with shaded plants; PtPIP2;10 showed a 2.8-folddecrease in expression.
ISH of PtPIP1;4, PtPIP2;10, PtTIP2;3 andPtTIP2;1 mRNA
ISH experiments were conducted to analyse the cell- andtissue-specific gene expression patterns of selected AQPsin roots of the shaded versus light-exposed plants studiedin experiment 2. Four genes with contrasting expressionpatterns (shown in Fig. 3b) were chosen. All sense probecontrols showed no or minimal background signals. Incross-sections, high PtPIP1;4 transcript levels weredetected in the central cylinder (cc) and in the innercortex of shaded plants (Fig. 4a). Transcript levels wereminimal in light-exposed plants (Fig. 4b). In longitudinalsections, PtPIP1;4 transcripts were abundant in the roottip, especially in shaded plants (Fig. 4d). The PtPIP2;10hybridization signal was highly present in the cc of shadedplants (Fig. 4g). Consistent with qRT-PCR expression
L P (
10–6
× m
s–1
MP
a–1)
0
2
4
6
8
10W*OH
**
Shade
YL
(MP
a)
–1.2
–1.0
–0.8
–0.6
–0.4
–0.2
Shade to light
(a)
(b)
*(c)
g s (m
mol
m–2
s–1
)
0
50
100
150
200 **
*
Figure 2. Results from experiment 2, showing root hydraulicconductance, LP (a), stomatal conductance, gs (b), and leaf waterpotential (c) of hybrid poplar saplings growing in shade (leftpanels) and after experiencing a ~fivefold increase in light levelduring the light period in a growth chamber (right panels). (a),LP was measured in water (filled bars) and after treatment withhydroxyl radicals (hatched bars). In both plant groups, LP wassignificantly reduced by hydroxyl radicals (P < 0.001, pairedStudent’s t-test). Asterisks denote light-induced differences ininitial LP, gs, and in leaf water potential (*P < 0.05; **P < 0.01,unpaired Student’s t-test). Means � SE are shown.
Aquaporin expression and hydraulic conductance in poplar roots 1323
© 2011 Blackwell Publishing Ltd, Plant, Cell and Environment, 34, 1318–1331

data, light-exposed plants exhibited only weak expressionof PtPIP2;10 mRNA, which was mainly confined to the cc.
PtTIP2;3 transcripts were predominantly present in thecc and to a lesser extent in the cortex of light-exposedplants (Fig. 4k). ISH with roots of shaded plants yielded aweak signal in the phloem and in the cortex. This patternwas mirrored in longitudinal sections in which strongexpression of PtTIP2;3 mRNA was observed in root tips,in the cc and in the cortex of light-exposed plants (imagenot shown). In shaded plants, the signal was weaker.However, even in shaded plants, PtTIP2;3 mRNA wasclearly visible in the cortex and in the stele, in which thesignal was located in close proximity to vessels (arrows inFig. 4m). PtTIP2;1 expression was only studied in shadedplants. In contrast to the localization pattern of PtPIP2;10(Fig. 4g), PtTIP2;1 was expressed mainly in the inner
cortex and in the epidermis while expression remainedweak in the cc (Fig. 4n). The sense probe control for thisgene showed only minimal background signal (data notshown for the sake of brevity).
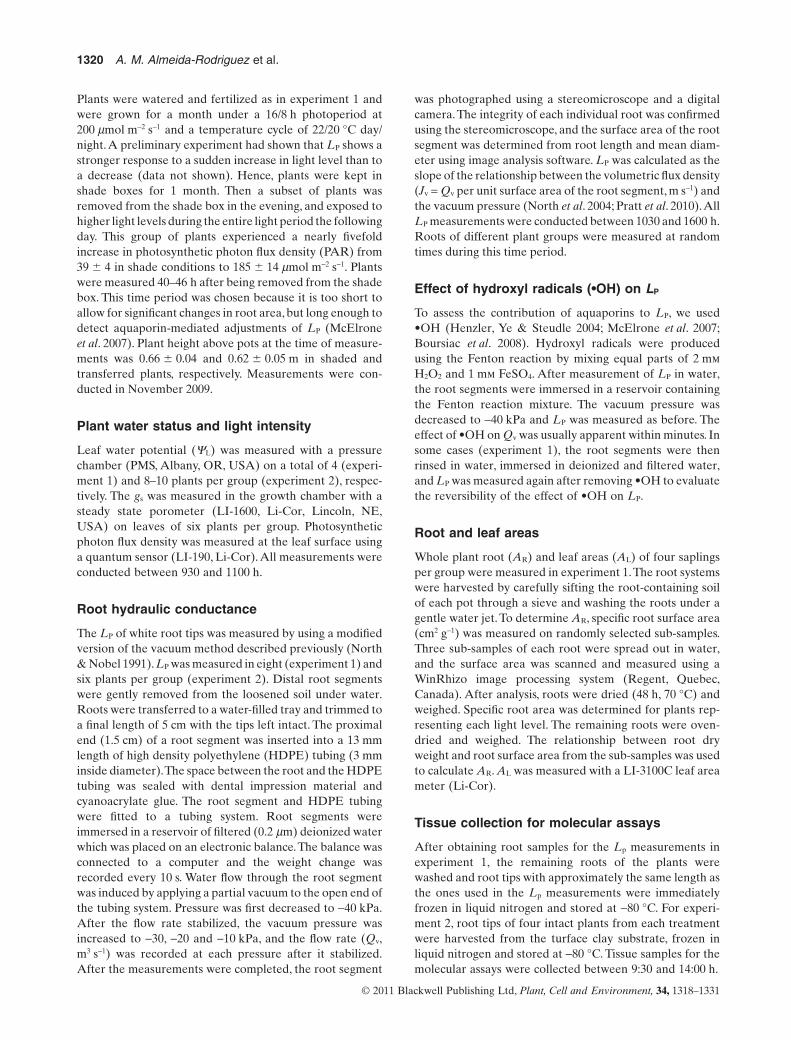
Immunolocalization of PIPs
To determine the localization of PIPs in roots, immunof-luorescence labelling was performed on cross-sectionstaken at 25–30 mm from the root tip (Fig. 5). The intensityof the green colour is equivalent to the abundance ofproteins. In most samples, a strong signal was detectedin the cc; a weaker signal existed in cortex cells and inthe epidermis/hypodermis. Within the cc, a strong signalwas occasionally localized in the phloem (Fig. 5c). Theintensity of the fluorescence signal varied between roots
PIP
1;1
PIP
1;2
PIP
1;4
PIP
1;5
PIP
2;1
PIP
2;2
PIP
2;3
PIP
2;4
PIP
2;5
PIP
2;7
PIP
2;1
00
1
2
3
4
5
6
NIP
1;2
NIP
1;5
NIP
2;1
NIP
3;2
NIP
3;3
NIP
3;4
TIP
1;1
TIP
1;3
TIP
1;4
TIP
1;5
TIP
1;6
TIP
1;7
TIP
2;1
TIP
2;2
TIP
2;3
TIP
2;4
TIP
4;1
SIP
1;1
SIP
1;3
SIP
1;4
SIP
2;1
SIP
2;2
SIP
1;1
SIP
1;3
SIP
1;4
SIP
2;1
SIP
2;2
NIP
1;2
NIP
1;5
NIP
2;1
NIP
3;2
NIP
3;3
NIP
3;4
TIP
1;1
TIP
1;3
TIP
1;4
TIP
1;5
TIP
1;6
TIP
1;7
TIP
2;1
TIP
2;2
TIP
2;3
TIP
2;4
TIP
4;1
PIP
1;1
PIP
1;2
PIP
1;4
PIP
1;5
PIP
2;1
PIP
2;2
PIP
2;3
PIP
2;4
PIP
2;5
PIP
2;7
PIP
2;1
0
Exp
ressio
n (
rela
tive
to
sh
ad
e)
0
1
2
3
4
5
6
(a) Full sun
(b) Lights on
*
*
* *
*
* * *
*
*
*
*
* *
*
*
* *
*
*
*
*
*
*
* *
*
*
**
*
*
*
**
*
* *
**
*
sPISsPINsPITsPIP
sPISsPINsPITsPIP
Figure 3. Gene expression of 33 AQPs in fine roots of hybrid poplar saplings growing in shade or full sunlight (a, experiment 1) and inplants kept in shade versus plants experiencing a ~fivefold increase in light level during one light period in a growth chamber (b,experiment 2). The geometric mean of the expression levels of four reference genes (EF1-a, TIF5A, UBC10 and PP2A) was used tonormalize the results. Mean and SE of four biological samples were tested in triplicate. Asterisks denote significant differences inexpression level (P < 0.05).
1324 A. M. Almeida-Rodriguez et al.
© 2011 Blackwell Publishing Ltd, Plant, Cell and Environment, 34, 1318–1331

of different plants. Controls with only a single antibodydid not differ from controls with no primary and no sec-ondary antibody. Control samples often revealed somebackground fluorescence in the epidermis and in thewalls of xylem vessels (Fig. 5a,d). This background signal
corresponded with the staining pattern seen with bright-field microscopy (Fig. 5b), in which cell walls of theepidermis/hypodermis and vessel walls were stained withtoluidine blue, suggesting the presence of lignin. The fluo-rescence in the vascular tissue of controls was consistently
Shade SenseShade to light
(a) (b) (c)
(d) (e) (f)
(g) (h) (i)
(j) (k)
(m) (n)
(l)
cc
co
Figure 4. In situ localization of PtPIP1;4, PtPIP2;10, PtTIP2;3 and PtTIP2;1 mRNA in hybrid poplar roots. Blue staining indicates thelocation of antisense probes in root sections of shaded (a, d, g and j) and light-exposed plants (b, e, h and k). Control root sectionshybridized with sense probes showing the absence of hybridization signal (c, f, i and l). (m) Longitudinal section showing localization ofPtTIP2;3 mRNA in shaded plants. (n) Localization of PtTIP2;1 mRNA in roots of shaded plants (hybridized with antisense probes).Strong expression of PtPIP1;4 and PtPIP2;10 mRNA was observed in shaded plants while the PtTIP2;3 signal was stronger inlight-exposed than in shaded plants. Cross-sections were taken 25–30 mm from the root tip. Horizontal bars = 100 mm, vertical bars in(d–f) = 1 mm. Arrows point to vessels. co, cortex; cc, central cylinder.
Aquaporin expression and hydraulic conductance in poplar roots 1325
© 2011 Blackwell Publishing Ltd, Plant, Cell and Environment, 34, 1318–1331
weaker than in roots labelled with primary and secondaryantibodies. Samples from different light treatments did notshow clear differences in the PIP localization pattern andin the signal intensity, consistent with the complex geneexpression profile for PIPs (Fig. 3).
DISCUSSION
Our first hypothesis was that plants growing at high lightlevels will exhibit higher AR : AL ratios, higher LP, and, tothe extent that individual AQPs are involved in watertransport, higher AQP gene expression levels than plantsgrowing in shade. This hypothesis was in part supported.Acclimation to different light levels involved profoundmorphological changes (Table 1, Fig. 1a). However, wefailed to detect differences in LP in plants experiencingdifferent light levels. A tentative explanation is that inexperiment 1, roots of shaded plants were much thinnerthan roots of plants growing in full sunlight (Table 1). Ana-tomical differences related to these differences in rootdiameter (e.g. cortex thickness) may have complicated adirect cause-and-effect relationship of AQP expression andLP. We are not aware of studies showing how the diameterof fine roots correlates with LP, but several studies foundlarge variation in LP in different roots of the same species(or even the same plant) (e.g. Huang & Nobel 1992; Coners& Leuschner 2005). It should also be noted that in experi-ment 1, it was sometimes difficult and time consuming toclean roots from soil particles and to prepare root segmentsfor measurements of LP, especially in shaded plants. Weconsequently changed the soil type in experiment 2, whichallowed us to clean and prepare root segments morequickly.
The amount of inhibition produced by •OH is similar toprevious studies in which •OH has been used (Henzler et al.2004; McElrone et al. 2007; Boursiac et al. 2008; Parent et al.2009). There were no systematic differences in the amountLP was reduced by •OH in different plant groups, indicating
a similar contribution of the cell-to-cell pathway to thetotal LP regardless of growing conditions. However, afterremoval of •OH in experiment 1, LP showed some recoveryin shaded and intermediate plants, but not in full sun plants,which may be related to differences in Droot-tip (Table 1).Plants growing at full sun light had thicker root tips thanplants growing at lower light levels, which may have delayedthe removal of •OH. More time may have been required fora more complete recovery of LP in full sun plants.
Dynamic changes in LP in response toincreased water demand
We hypothesized that plants transferred from shade to lightwill dynamically increase LP, and that this will be paralleledby an increase in the transcript abundance of individualAQPs. Such adjustments to an increase in evaporativedemand and light level could be advantageous because theycould contribute to maximizing leaf gas exchange whilekeeping the xylem pressure above the cavitation threshold.This hypothesis was supported by our findings that (1) rootsof light-exposed plants showed more than a threefoldhigher LP than shaded plants, and that (2) the increase in LP
was paralleled by an increase in the expression of 15 AQPs.In experiment 2, roots of shaded and light-exposed plantsdid not differ in their morphology.
Expression profiling using qRT-PCR
The AQP genes included in this study represent four out ofthe five AQP subfamilies identified in poplars (PIPs, TIPs,NIPs and SIPs). Unfortunately, we were unable to includeany of the XIPs because of low efficiencies, primer dimersor failure to identify gene-specific primers for this subfamilywhen qRT-PCR was performed. A comparison of the geneexpression profiles shown in Fig. 3a and b reveals somesimilarities. Eleven AQPs (i.e. a third of all genes measured)exhibited consistent light-induced increases in expression
Figure 5. Immunolocalization of PIPproteins in roots of hybrid poplarsaplings. Plants were growing in fullsunlight. The antibody is specific to allPIPs. Controls with no (a) and no primary(d) antibody indicate backgroundfluorescence. Backgroundautofluorescence was observed in cellwalls of xylem vessels and in theepidermis/hypodermis. This patterncorresponded with toluidine blue stainingobserved with bright-field microscopy (b).While the signal intensity varied betweenroots from different plants, the centralcylinder consistently produced a clearsignal (c,e,f). Cross-sections were taken25–30 mm from the root tip.Bars = 100 mm. co, cortex; cc, centralcylinder.
(a) (b) (c)
(d) (e) (f)
1326 A. M. Almeida-Rodriguez et al.
© 2011 Blackwell Publishing Ltd, Plant, Cell and Environment, 34, 1318–1331

level in both experiments. Examples for these genes arePtPIP1;2, PtPIP2;3 and PtTIP2;3. Most of these 11 AQPsshowed higher expression levels in experiment 1 than inexperiment 2, suggesting that light-exposed plants were stillin the process of dynamically adjusting to the lower waterpotentials and the increased evaporative demand that wasassociated with the sudden increase in light level. Overall,differences in environmental conditions between experi-ments 1 and 2 were clearly reflected in the gene expressiondata. Plants in experiment 2 were kept in a controlled envi-ronment, whereas full sun plants in experiment 1 weregrowing outside.Accordingly, error bars in Fig. 3b tended tobe smaller than in Fig. 3a.
How does the expression profiling data compare withprevious studies? Some interesting patterns in poplar arebeginning to emerge. In the following we are synthesizingsome of the available information while also includingdata from other model systems including Arabidopsis,grapevine, and maize. Following the order of presen-tation in Fig. 3, we begin with PIP1 genes. PtPIP1;2(POPTR_0008s06580, transcript name in P. trichocarpagenome v2.0; http://www.phytozome.net/poplar) consis-tently showed high expression levels in response to light.This gene was also up-regulated in response to droughtin leaves of Populus simonii ¥ balsamifera (Almeida-Rodriguez et al. 2010), in roots of a Populus nigra clone(Cocozza et al. 2010), and in the stem xylem of P. tri-chocarpa (Secchi & Zwieniecki 2010; it is PoptrPIP1;1 intheir terminology). Secchi et al. (2009) found this gene to beone of the most highly expressed members of the PIP1group in the wood and in roots of P. trichocarpa. It was alsoreported to be one of two genes that were up-regulated inresponse to artificial induction of xylem embolism (Secchi& Zwieniecki 2010); the other up-regulated gene in thexylem refilling experiment of Secchi & Zwieniecki wasPtPIP1;1 (PoptrPIP1;3 in their terminology), which alsoshowed high transcript abundance in plants growing in fullsun in this present study (Fig. 3a).
PtPIP2;3 (POPTR_0010s22950) showed high expressionlevels in plants growing in full sun (Fig. 3a) as well as inlight-exposed plants (Fig. 3b). This representative of thePIP2 group was expressed in different vegetative tissues ofpoplar genotypes (Marjanovic et al. 2005; Secchi et al. 2009;Almeida-Rodriguez et al. 2010). This gene corresponds toPoptrPIP2;4 in Secchi et al. (2009), and these authorsshowed that it is a water channel. Interestingly, membranepermeability was synergistically increased when Pop-trPIP2;4 protein was co-expressed with PoptrPIP1;1protein in Xenopus oocytes (Secchi & Zwieniecki 2010,their fig. 6). In that respect, the parallel expression patternsseen in PtPIP1;2 (corresponding to PoptrPIP1;1) andPtPIP2;3 (Fig. 3a,b) may not be coincidental but may pointto functional interaction of these two genes (similar to find-ings in maize; Zelazny et al. 2007).
Further support for a role of PtPIP2;3 in LP responses tolight and increased evaporative demand comes from a studyon walnut leaves (Cochard et al. 2007). Putative orthologsof PtPIP2;3 include JrPIP2;1 and JrPIP2;2. Transcripts of
both genes were increased when the light level wasincreased, and this increase in transcript abundance may befunctionally linked to an increase in leaf LP (Cochard et al.2007). PtPIP2;3 also exhibited increased transcript abun-dance in secondary xylem under conditions of high N avail-ability (Hacke et al. 2010).
Among the TIPs, PtTIP1;1 (POPTR_0001s24200) andPtTIP2;3 (POPTR_0010s21700) transcripts were highlyabundant in roots of plants growing in full sun (Fig. 3a) andin light-exposed plants (Fig. 3b). High expression levels ofthese genes were found in P. trichocarpa roots by Gupta &Sankararamakrishnan (2009). Not much information existsabout TIP expression patterns in poplar roots. Much ofwhat is known about this AQP subfamily comes fromwork on other species. In Zea mays, members of the TIPsubfamily were identified as water channels and were highlyexpressed in roots (Barrieu, Chaumont & Chrispeels 1998).Expression of TIP proteins in Xenopus oocytes showed thatTIPs play a role in water transport in several other speciesincluding Vitis vinifera (Shelden et al. 2009) and Nicotianatabacum (Gerbeau et al. 1999). In Arabidopsis roots, thetissue-specific expression patterns of various TIP membershave recently been studied with in vivo imaging (Gattolinet al. 2009). Expression of some TIPs was confined to spe-cific tissues of the root while other TIP isoforms showeda widespread distribution. The complex tissue-specificexpression patterns and the increased transcript abundanceat high evaporative demand of many TIP members suggestthat this AQP subfamily plays an important role in theacclimation to different environmental conditions.
Among the SIP genes, PtSIP1;4 showed high expressionlevels in full sun and in light-exposed plants. A putativeortholog to this gene is AtSIP1;2 which functions as a waterchannel in the endoplasmic reticulum and which isexpressed in the central cylinder of roots as well as in thedividing cells and elongating regions of Arabidopsis roottips (Ishikawa et al. 2005).
ISH and tissue-level localization ofAQP transcripts
While many AQPs showed high transcript abundance inlight, others did not change their expression, and a fewgenes showed lower transcript abundance in light-exposedplants than in shaded plants. To verify this pattern and tostudy the tissue-level location of individual AQPs, we con-ducted ISH experiments. These experiments revealed somegene-specific and treatment-specific expression patterns.While PtPIP2;10 was mainly confined to the cc, PtPIP1;4and PtTIP2;3 mRNAs were also expressed in the cortexparenchyma and near the epidermis. By contrast, thePtTIP2;1 signal was mainly confined to the cortex and wasminimal in the stele (Fig. 4n). The high expression ofPtPIP1;4, PtTIP2;3 and PtTIP2;1 mRNA in cells of theinner cortex indicates that these AQPs are involved inradial water movement from the cortex into the stele. In thestele, the high expression of many AQPs may facilitatewater movement to xylem vessels from the phloem and
Aquaporin expression and hydraulic conductance in poplar roots 1327
© 2011 Blackwell Publishing Ltd, Plant, Cell and Environment, 34, 1318–1331

from the cortex. PtTIP2;3 mRNA, for example, was foundin close proximity to vessels (Fig. 4m). AQPs in roots mayalso be involved in growth-related processes. Much of thewater required for the growth of root cells comes fromphloem (Boyer, Silk & Watt 2010), and AQPs may play animportant role in facilitating water flow from phloem to thegrowing root tip. Longitudinal sections consistently showedhigh expression of PtPIP1;4 and PtTIP2;3 in growingroot tips. These findings support and complement previousstudies in which high concentrations of PIPs were found inthe endodermis and in vascular parenchyma of root tips inmaize (Hachez et al. 2006), tobacco (Otto & Kaldenhoff2000), and grapevine (Vandeleur et al. 2009).
In the three genes that were tested, the strength of theISH signal corresponded with trends in gene expressionshown in Fig. 3b. qRT-PCR data indicated that PtPIP1;4and PtPIP2;10 showed higher transcript abundance inshaded than in light-exposed plants, and this trend was con-firmed by ISH. The opposite trend was found in PtTIP2;3which showed higher transcript levels in light-exposedplants (Figs 3b and 4).
Conclusions drawn from ISH images were supported byimmunolabelling experiments using PIP antibody. Whilethe signal intensity varied between roots from differentplants, the cc and the epidermis/hypodermis consistentlyproduced a clear signal. In some cases, the entire cc wasfluorescent (Fig. 5f); in other cases, a strong signal seemedto originate from phloem tissue (Fig. 5c). The backgroundfluorescence produced by the epidermis/hypodermis madeit difficult to evaluate the abundance of PIPs in this regionof the root.
Implications of light-induced changes in LP andAR : AL for whole-plant water relations
In experiment 1, all plant groups maintained similar leafwater potentials during acclimation to differences in irradi-ance (Fig. 1c). This water potential homeostasis was appar-ently not achieved by altering LP, but was associated withdramatic differences in AR. Large adjustments of root areaor mass have previously been observed in Arabidopsis.Plants with a reduced abundance of specific AQPs compen-sated for reduced LP by developing more root mass com-pared with controls, thereby maintaining an adequate watersupply to the shoot (Kaldenhoff et al. 1998; Martre et al.2002).
A small AR in shaded plants reduces respiration cost forthese energy-starved plants, and may thereby represent animportant benefit, at least under well-watered conditions.The small AR could, however, predispose these plants to adrop in water potential as a result of soil drought orincreased transpirational demand. The hybrid poplar sap-lings used in this study are very susceptible to xylem cavi-tation (Hacke et al. 2010). Moreover, vulnerability curvesshow a steep increase in embolism over a relatively narrowrange of xylem pressure. Basal stem segments of shade-grown hybrid poplars showed a P50 (50% loss of hydraulicconductivity) of -1.1 MPa and a P12 (12% loss) of
-0.8 MPa (Plavcová, Hacke & Sperry 2011). Distal stemsegments were even more vulnerable. Hence, the leaf waterpotentials measured in experiment 1 (ranging from -0.74 to-0.86 MPa) are close to values associated with a steepincrease in cavitation.
In experiment 2, light-exposed plants showed the lowestYL measured in this study, yet were able to increase gs
after the sudden increase in irradiance (Fig. 2). The three-fold increase in LP seen in these plants (Fig. 2a) may haveprevented an even steeper drop in YL and xylem pressure,which would have required stomatal closure to preventthe development of high embolism levels. The ability toexpress AQPs at times of high hydraulic demands mightbe particularly important in energy-starved saplingsexposed to a sudden increase in irradiance (Cochard et al.2007), as was the case in our study. The treatment inexperiment 2 increased both light level and evaporativedemand, and caused a drop in YL. Future experiments willreveal which of these factors was causing the change in LP.These experiments will also allow a better assessment ofhow changes in LP relate to whole-plant hydraulic conduc-tance. Such work was recently done on chaparral seedlings(Pratt et al. 2010).
In conclusion, hybrid poplar saplings growing at threedifferent light levels showed similar leaf water potentialsand LP, but shaded plants had only one-tenth the AR ofplants growing at intermediate and full light. Plants trans-ferred to a higher light level after being grown under shadeconditions had a threefold higher LP than plants remainingin shade. This dynamic increase in LP was associatedwith higher expression levels of 15 AQPs out of a total of33 genes measured simultaneously. The comprehensiveexpression profiling is a valuable guide for future studies onAQP function in roots of woody plants. ISH and immuno-labelling provided novel insight into the cellular- and tissue-specific location of AQPs in poplar.
ACKNOWLEDGMENTS
We thank Lenka Plavcová for help with root harvesting forthe qRT-PCR analysis in experiment 1. We are grateful toGretchen North, Brandon Pratt, and Anna Jacobsen forhelp and advice in setting up the apparatus to measure rootconductance. Ina Meier provided helpful suggestions formeasuring the root areas. Mineo Shibasaka provided thePIP antibody. Funding was provided by an Alberta Ingenu-ity New Faculty Award to U. H. and the Canada ResearchChair programme.
REFERENCES
Almeida-Rodriguez A.M. (2009) Aquaporins in poplars: character-ization, transcript profiling and drought stress. PhD thesis,University of Alberta, Alberta, Canada.
Almeida-Rodriguez A.M., Cooke J.E.K., Yeh F. & Zwiazek J.J.(2010) Functional characterization of drought-responsive aqua-porins in Populus balsamifera and Populus simonii ¥ balsamiferaclones with different drought resistance strategies. PhysiologiaPlantarum 140, 321–333.
1328 A. M. Almeida-Rodriguez et al.
© 2011 Blackwell Publishing Ltd, Plant, Cell and Environment, 34, 1318–1331

Barrieu F., Chaumont F. & Chrispeels M.J. (1998) High expressionof the tonoplast aquaporin ZmTIP1 in epidermal and conduct-ing tissues of maize. Plant Physiology 117, 1153–1163.
Bienert G.P., Bienert M.D., Jahn T.P., Boutry M. & Chaumont F.(2011) Solanaceae XIPs are plasma membrane aquaporins thatfacilitate the transport of many uncharged substrates. The PlantJournal 66, 306–317.
Boursiac Y., Boudet J., Postaire O., Luu D.T., Tournaire-Roux C. &Maurel C. (2008) Stimulus-induced downregulation of rootwater transport involves reactive oxygen species-activated cellsignalling and plasma membrane intrinsic protein internaliza-tion. The Plant Journal 56, 207–218.
Boyer J.S., Silk W.K. & Watt M. (2010) Path of water for rootgrowth. Functional Plant Biology 37, 1105–1116.
Brewer P.B., Heisler M.G., Hejatko J., Friml J. & Benkova E. (2006)In situ hybridization for mRNA detection in Arabidopsis tissuesections. Nature Protocols 1, 1462–1467.
Chang S.J., Puryear J. & Cairney J. (1993) A simple and efficientmethod for isolating RNA from pine trees. Plant MolecularBiology Reporter 11, 113–116.
Chaumont F., Barrieu F., Jung R. & Chrispeels M.J. (2000) Plasmamembrane intrinsic proteins from maize cluster in two sequencesubgroups with differential aquaporin activity. Plant Physiology122, 1025–1034.
Cochard H., Venisse J.S., Barigah T.S., Brunel N., Herbette S., Guil-liot A., Tyree M.T. & Sakr S. (2007) Putative role of aquaporinsin variable hydraulic conductance of leaves in response to light.Plant Physiology 143, 122–133.
Cocozza C., Cherubini P., Regier N., Saurer M., Frey B. & TognettiR. (2010) Early effects of water deficit on two parental clones ofPopulus nigra grown under different environmental conditions.Functional Plant Biology 37, 244–254.
Coners H. & Leuschner C. (2005) In situ measurement of fine rootwater absorption in three temperate tree species–Temporalvariability and control by soil and atmospheric factors. Basicand Applied Ecology 6, 395–405.
Czechowski T., Stitt M., Altmann T., Udvardi M.K. & ScheibleW.R. (2005) Genome-wide identification and testing of superiorreference genes for transcript normalization in Arabidopsis.Plant Physiology 139, 5–17.
Derveaux S., Vandesompele J. & Hellemans J. (2010) How to dosuccessful gene expression analysis using real-time PCR.Methods 50, 227–230.
Ewers B.E., Oren R. & Sperry J.S. (2000) Influence of nutrientversus water supply on hydraulic architecture and water balancein Pinus taeda. Plant, Cell & Environment 23, 1055–1066.
Fetter K., Van Wilder V., Moshelion M. & Chaumont F. (2004)Interactions between plasma membrane aquaporins modulatetheir water channel activity. The Plant Cell 16, 215–228.
Gattolin S., Sorieul M., Hunter P., Khonsari R. & Frigerio L. (2009)In vivo imaging of the tonoplast intrinsic protein family in Ara-bidopsis roots. BMC Plant Biology 9, 133.
Gerbeau P., Guclu J., Ripoche P. & Maurel C. (1999) AquaporinNt-TIPa can account for the high permeability of tobacco cellvacuolar membrane to small neutral solutes. The Plant Journal18, 577–587.
Gomes D., Agasse A., Thiebaud P., Delrot S., Geros H. & Chau-mont F. (2009) Aquaporins are multifunctional water and solutetransporters highly divergent in living organisms. Biochimica etBiophysica Acta-Biomembranes 1788, 1213–1228.
Gupta A.B. & Sankararamakrishnan R. (2009) Genome-wideanalysis of major intrinsic proteins in the tree plant Populustrichocarpa: characterization of XIP subfamily of aquaporinsfrom evolutionary perspective. BMC Plant Biology 9, 134.
Hachez C., Moshelion M., Zelazny E., Cavez D. & Chaumont F.(2006) Localization and quantification of plasma membrane
aquaporin expression in maize primary root: a clue to under-standing their role as cellular plumbers. Plant Molecular Biology62, 305–323.
Hacke U.G., Sperry J.S., Ewers B.E., Ellsworth D.S., Schäfer K.V.R.& Oren R. (2000) Influence of soil porosity on water use in Pinustaeda. Oecologia 124, 495–505.
Hacke U.G., Plavcová L., Almeida-Rodriguez A., King-Jones S.,Zhou W. & Cooke J.E.K. (2010) Influence of nitrogen fertiliza-tion on xylem traits and aquaporin expression in stems of hybridpoplar. Tree Physiology 30, 1016–1025.
Henzler T., Waterhouse R.N., Smyth A.J., Carvajal M., Cooke D.T.,Schaffner A.R., Steudle E. & Clarkson D.T. (1999) Diurnalvariations in hydraulic conductivity and root pressure can becorrelated with the expression of putative aquaporins in theroots of Lotus japonicus. Planta 210, 50–60.
Henzler T., Ye Q. & Steudle E. (2004) Oxidative gating of waterchannels (aquaporins) in Chara by hydroxyl radicals. Plant, Cell& Environment 27, 1184–1195.
Hill A.E., Shachar-Hill B. & Shachar-Hill Y. (2004) What areaquaporins for? Journal of Membrane Biology 197, 1–32.
Huang B. & Nobel P.S. (1992) Hydraulic conductivity and anatomyfor lateral roots of Agave deserti during root growth anddrought-induced abscission. Journal of Experimental Botany 43,1441–1449.
Ishikawa F., Suga S., Uemura T., Sato M.H. & Maeshima M. (2005)Novel type aquaporin SIPs are mainly localized to the ER mem-brane and show cell-specific expression in Arabidopsis thaliana.FEBS Letters 579, 5814–5820.
Jackson R.B., Sperry J.S. & Dawson T.E. (2000) Root water uptakeand transport: using physiological processes in global predic-tions. Trends in Plant Science 5, 482–488.
Kaldenhoff R., Grote K., Zhu J.J. & Zimmermann U. (1998) Sig-nificance of plasmalemma aquaporins for water-transport inArabidopsis thaliana. The Plant Journal 6, 187–199.
Kamaluddin M. & Zwiazek J.J. (2003) Fluoride inhibits root watertransport and affects leaf expansion and gas exchange in aspen(Populus tremuloides) seedlings. Physiologia Plantarum 117,368–375.
Katsuhara M., Hanba Y.T., Shiratake K. & Maeshima M. (2008)Review: expanding roles of plant aquaporins in plasma mem-branes and cell organelles. Functional Plant Biology 35, 1–14.
Li G.-W., Peng Y.-H., Yu X., Zhang M.-H., Cai W.-M., Sun W.-N. &Su W.-A. (2008) Transport functions and expression analysis ofvacuolar membrane aquaporins in response to various stresses inrice. Journal of Plant Physiology 165, 1879–1888.
McElrone A.J., Bichler J., Pockman W.T., Addington R.N., LinderC.R. & Jackson R.B. (2007) Aquaporin-mediated changes inhydraulic conductivity of deep tree roots accessed via caves.Plant, Cell & Environment 30, 1411–1421.
Marjanovic Z., Uehlein N., Kaldenhoff R., Zwiazek J.J., Weiss M.,Hampp R. & Nehls U. (2005) Aquaporins in poplar: what adifference a symbiont makes! Planta 222, 258–268.
Martre P., Morillon R., Barrieu F., North G.B., Nobel P.S. &Chrispeels M.J. (2002) Plasma membrane aquaporins play a sig-nificant role during recovery from water deficit. Plant Physiology130, 2101–2110.
Maurel C., Verdoucq L., Luu D.T. & Santoni V. (2008) Plant aqua-porins: membrane channels with multiple integrated functions.Annual Review of Plant Biology 59, 595–624.
Miyamoto N., Katsuhara M., Ookawa T., Kasamo K. & Hirasawa T.(2005) Hydraulic conductivity and aquaporins of cortical cells ingravitropically bending roots of Pisum sativum L. Plant Produc-tion Science 8, 515–524.
North G.B. & Nobel P.S. (1991) Changes in hydraulic conductivityand anatomy caused by drying and rewetting roots of Agavedeserti (Agavaceae). American Journal of Botany 78, 906–915.
Aquaporin expression and hydraulic conductance in poplar roots 1329
© 2011 Blackwell Publishing Ltd, Plant, Cell and Environment, 34, 1318–1331

North G.B. & Peterson C.A. (2005) Water flow in roots: structuraland regulatory features. In Vascular Transport in Plants (edsN.M. Holbrook & M.A. Zwieniecki), pp. 131–156. Elsevier,New York, NY, USA.
North G.B., Martre P. & Nobel P.S. (2004) Aquaporins account forvariations in hydraulic conductance for metabolically active rootregions of Agave deserti in wet, dry, and rewetted soil. Plant, Cell& Environment 27, 219–228.
Otto B. & Kaldenhoff R. (2000) Cell-specific expression of themercury-insensitive plasma-membrane aquaporin NtAQP1from Nicotiana tabacum. Planta 211, 167–172.
Parent B., Hachez C., Redondo E., Simonneau T., Chaumont F. &Tardieu F. (2009) Drought and abscisic acid effects on aquaporincontent translate into changes in hydraulic conductivity and leafgrowth rate: a trans-scale approach. Plant Physiology 149, 2000–2012.
Plavcová L., Hacke U.G. & Sperry J.S. (2011) Linking irradiance-induced changes in pit membrane ultrastructure with xylemvulnerability to cavitation. Plant, Cell & Environment 34, 501–513.
Postaire O., Tournaire-Roux C., Grondin A., Boursiac Y., MorillonR., Schäffner A.R. & Maurel C. (2010) A PIP1 aquaporin con-tributes to hydrostatic pressure-induced water transport in boththe root and rosette of Arabidopsis. Plant Physiology 152, 1418–1430.
Pratt R.B., North G.B., Jacobsen A.L., Ewers F.W. & Davis S.D.(2010) Xylem root and shoot hydraulics is linked to life historytype in chaparral seedlings. Functional Ecology 24, 70–81.
Reich P.B., Walters M.B., Tjoelker M.G., Vanderklein D. & Bus-chena C. (1998) Photosynthesis and respiration rates depend onleaf and root morphology and nitrogen concentration in nineboreal tree species differing in relative growth rate. FunctionalEcology 12, 395–405.
Secchi F. & Zwieniecki M.A. (2010) Patterns of PIP gene expres-sion in Populus trichocarpa during recovery from xylem embo-lism suggest a major role for the PIP1 aquaporin subfamily asmoderators of refilling process. Plant, Cell & Environment 33,1285–1297.
Secchi F., Maciver B., Zeidel M.L. & Zwieniecki M.A. (2009) Func-tional analysis of putative genes encoding the PIP2 waterchannel subfamily in Populus trichocarpa. Tree Physiology 29,1467–1477.
Shelden M.C., Howitt S.M., Kaiser B.N. & Tyerman S.D. (2009)Identification and functional characterisation of aquaporins inthe grapevine, Vitis vinifera. Functional Plant Biology 36, 1065–1078.
Siemens J.A. & Zwiazek J.J. (2003) Effects of water deficit stressand recovery on the root water relations of tremblingaspen (Populus tremuloides) seedlings. Plant Science 165, 113–120.
Siemens J.A. & Zwiazek J.J. (2004) Changes in root water flowproperties of solution culture-grown trembling aspen (Populustremuloides) seedlings under different intensities of water-deficitstress. Physiologia Plantarum 121, 44–49.
Steudle E. & Peterson C.A. (1998) How does water get throughroots? Journal of Experimental Botany 49, 775–788.
Sutton T., Baumann U., Hayes J., et al. (2007) Boron-toxicity toler-ance in barley arising from efflux transporter amplification.Science 318, 1446–1449.
Tuskan G.A., DiFazio S., Jansson S., et al. (2006) The genome ofblack cottonwood, Populus trichocarpa (Torr. & Gray). Science313, 1596–1604.
Vandeleur R.K., Mayo G., Shelden M.C., Gilliham M., Kaiser B.N.& Tyerman S.D. (2009) The role of plasma membrane intrinsicprotein aquaporins in water transport through roots: diurnal anddrought stress responses reveal different strategies between
isohydric and anisohydric cultivars of grapevine. Plant Physiol-ogy 149, 445–460.
Vandesompele J., De Preter K., Pattyn F., Poppe B., Van Roy N., DePaepe A. & Speleman F. (2002) Accurate normalization ofreal-time quantitative RT-PCR data by geometric averagingof multiple internal control genes. Genome Biol 3, research0034.1-0034.11.
Voicu M.C. & Zwiazek J.J. (2004) Cycloheximide inhibitsroot water flow and stomatal conductance in aspen (Populustremuloides) seedlings. Plant, Cell & Environment 27, 199–208.
Wan X.C. & Zwiazek J.J. (1999) Mercuric chloride effects on rootwater transport in aspen seedlings. Plant Physiology 121, 939–946.
Willems E., Leyns L. & Vandesompele J. (2008) Standardization ofreal-time PCR gene expression data from independent biologi-cal replicates. Analytical Biochemistry 379, 127–129.
Zelazny E., Borst J.W., Muylaert M., Batoko H., Hemminga M.A.& Chaumont F. (2007) FRET imaging in living maize cellsreveals that plasma membrane aquaporins interact to regulatetheir subcellular localization. Proceedings of the NationalAcademy of Sciences of the United States of America 104, 12359–12364.
Received 20 January 2011; received in revised form 11 March 2011;accepted for publication 22 March 2011
SUPPORTING INFORMATION
Additional Supporting Information may be found in theonline version of this article:
Figure S1. 95% confidence intervals based on the geometricmean of the DDCT values of the gene expression of 33 AQPsin fine roots of Populus trichocarpa ¥ deltoides. (a) AQPgene expression of saplings grown in full sunlight relative toplants grown in shade. (b) AQP gene expression of saplingsexposed to higher light relative to plants kept in shade. Forboth figures, the geometric mean of the expression levels offour reference genes (EF1-a, TIF5A, UBC10 and PP2A)was used to normalize the results. 4 � n � 3 biologicalreplicates.Table S1. Populus trichocarpa reference genes and AQPgene models used for primer and probe design in the qRT-PCR assays. AQP gene models were previously identifiedin version 2.0 of the assembled, annotated P. trichocarpagenome (http://www.phytozome.net/poplar) by Almeida-Rodriguez et al. (2010). The physical location refers to thelocation of the gene model within a given scaffold of theassembled genome sequence. Left, right primer sequences,and TaqMan® probe were designed mainly in the 3′UTRtranscript sequences using the universal ProbeLibrary assaydesign center (Roche). Primers for AQPs and referencegenes were tested for primer validation and efficiencies atleast in two independent plates.Table S2. Populus trichocarpa ¥ deltoides AQP genesselected for in situ hybridization. The sequences corre-sponded to the pair of primers designed (left and right)for cloning purposes and their corresponding ampliconexpected size.
1330 A. M. Almeida-Rodriguez et al.
© 2011 Blackwell Publishing Ltd, Plant, Cell and Environment, 34, 1318–1331

Material S3. Populus trichocarpa ¥ deltoides clonedsequences of four AQP genes selected for the in situ hybrid-ization assays. Digoxigenin-labelled antisense and senseprobes were generated with the DIG RNA labelling kit(Roche Diagnostics).
Please note: Wiley-Blackwell are not responsible for thecontent or functionality of any supporting materials sup-plied by the authors. Any queries (other than missing mate-rial) should be directed to the corresponding author for thearticle.
Aquaporin expression and hydraulic conductance in poplar roots 1331
© 2011 Blackwell Publishing Ltd, Plant, Cell and Environment, 34, 1318–1331