Embed Size (px)
Citation preview

INFLUENCE OF CUSTOMER EXPERIENCE ON CONSUMER
PREFERENCE OF LARGE SUPERMARKETS IN NAIROBI
BY
NZUVE, BEATRICE MWENDE
A RESEARCH PROJECT SUBMITTED IN PARTIAL FULFILLMENT OF
THE REQUIREMENT FOR AWARD OF MASTERS DEGREE OF BUSINESS
ADMINISTRATION, SCHOOL OF BUSINESS, UNIVERSITY OF NAIROBI.
DECEMBER 2018

ii
DECLARATION
I declare that this research is my original work and has not been submitted to any
other university for assessment or award of a degree.
Signature……………………………..…… Date…………………………
Nzuve, Beatrice Mwende
D61/75760/2009
This project has been submitted with my approval as the University supervisor.
Signed………………………………………Date………………………….
Prof. Mary Kinoti
Associate professor,
Department of Business Administration, School of business
University of Nairobi
iii
ACKNOWLEDGEMENT
I wish to express my sincere gratitude to the lecturers and academic staff school of
business university of Nairobi; I appreciate your support and encouragement to make
this project a reality. I particularly thank my supervisor Professor Mary Kinoti for her
proper guidance and dedication of her time to enable me complete my project. I
sincerely thank my parents and entire family for their support financially, morally and
socially to enable me complete my M.B.A (Master of Business Administration
Degree). I also sincerely thank those who enabled me to achieve all these success
without mentioning them individually.

iv
DEDICATION
I dedicate my project to my family, my parents and my friends who have given me the
encouragement to finalize my studies. This work is also dedicated with much love and
due care to my husband Paul Nzuve and children who have dedicated their time to
encourage and support me during my studies.

v
TABLE OF CONTENTS
DECLARATION......................................................................................................... ii
ACKNOWLEDGEMENT ......................................................................................... iii
DEDICATION............................................................................................................ iv
LIST OF TABLES ................................................................................................... viii
ABSTRACT ................................................................................................................ ix
CHAPTER ONE: INTRODUCTION ........................................................................1
1.1 Background of the Study ......................................................................................1
1.1.1 Concept of Customer Experience ..................................................................2
1.1.2 Consumer Preference .....................................................................................4
1.1.3 Retail Sector in Kenya ...................................................................................6
1.1.4 Supermarkets in Nairobi ................................................................................7
1.2 Research Problem .................................................................................................7
1.3 Research Objective .............................................................................................10
1.4 Value of the Study ..............................................................................................10
CHAPTER TWO: LITERATURE REVIEW .........................................................12
2.1 Introduction ........................................................................................................12
2.2 Theoretical foundations of the study ..................................................................12
2.2.1 The Nicosia Model ......................................................................................12
2.2.3 The Theory of Buyer Behaviour ..................................................................14
2.2.4 Fishbein Model ............................................................................................14
2.3 Measures of Customer Experience .....................................................................15
2.4 Measures of Consumer Preferences ...................................................................18
2.5 Relationship between Customer Experience and Consumer Preference ...........19
2.6 Empirical Review ...............................................................................................20

vi
CHAPTER THREE: RESEARCH METHODOLOGY ........................................23
3.1 Introduction ........................................................................................................23
3.2 Research Design .................................................................................................23
3.3 Population of Study ............................................................................................23
3.4 Sample Size ........................................................................................................24
3.5 Data Collection ...................................................................................................24
3.6 Data Analysis .....................................................................................................25
CHAPTER FOUR: DATA ANALYSIS RESULTS, INTERPRETATION AND
DISCUSSION .............................................................................................................26
4.1 Introduction ........................................................................................................26
4.2 Response rate......................................................................................................26
4.3 Demographic Information of Respondents ........................................................27
4.3.1 Gender Distribution .....................................................................................27
4.3.2 Age Distribution ..........................................................................................28
4.3.3 Marital Status ...............................................................................................29
4.3.4 Level of Education .......................................................................................29
4.3.5 Employment Status ......................................................................................30
4.3.6 Income Level ...............................................................................................32
4.3.7 Frequency of Supermarket Visits ................................................................32
4.3.8 Supermarket Preference ...............................................................................33
4.4 Customer Experience .........................................................................................35
4.5 Customer Preference ..........................................................................................36
4.5.1 Store Aspects ...............................................................................................36
4.5.2 Preference Multi Attribute Factors ..............................................................38
4.6 Correlation Analysis ...........................................................................................40
4.7 Regression Analysis ...........................................................................................42
4.7.1 Model Summary ..........................................................................................42

vii
4.7.2 Anova...........................................................................................................43
4.7.3 Coefficient Analysis ....................................................................................43
4.8 Discussion of the Findings .................................................................................44
CHAPTER FIVE: SUMMARY OF FINDINGS, CONCLUSION AND
RECOMMENDATIONS. ..........................................................................................48
5.1 Introduction ........................................................................................................48
5.2 Summary of the Findings ...................................................................................48
5.3 Conclusion ..........................................................................................................50
5.4 Recommendation from the Study .......................................................................51
5.5 Limitations of the Study .....................................................................................51
5.6 Suggestions for Further Research ......................................................................51
REFERENCES ...........................................................................................................53
APPENDICES ............................................................................................................55
Appendix I : Questionnaire ......................................................................................55
Appendix II: List of large supermarkets in Nairobi, Kenya. ....................................60

viii
LIST OF TABLES
Table 4. 1:Response Rate ............................................................................................. 26
Table 4.2: Gender Distribution .................................................................................... 27
Table 4.3 : Age Distribution ........................................................................................ 28
Table 4.4 : Marital Status ............................................................................................. 29
Table 4.5 : Education ................................................................................................... 30
Table 4.6 : Employment Status .................................................................................... 31
Table 4.7 : Income Level ............................................................................................. 32
Table 4.8 : Frequency of Supermarkets Visits ............................................................. 33
Table 4.9 : Supermarket Preference ............................................................................. 34
Table 4.10 : Customer Experience (Non-Store aspects) .............................................. 35
Table 4.11 : Customer Preference ................................................................................ 37
Table 4.12 : Preference Multi Attribute Factors .......................................................... 39
Table 4.13 : Correlations.............................................................................................. 41
Table 4.14 : Regression Model Summary.................................................................... 42
Table 4.15 : Anovaa ..................................................................................................... 43
Table 4.16 : Regression Coefficients ........................................................................... 43

ix
ABSTRACT
Majority of firms excel in customer interactions but fails to pay sufficient attention to
customers’ comprehensive experience on the buying procedures and post purchase
evaluations. Firms that have perfected customer journeys benefit enormously in terms
of rewards, improved customer satisfaction, condensed churn, amplified revenues,
reduced costs and an improved collaboration across the company. The objective of the
study was to investigate the influence of customer experience on customer preference
for the large supermarket in Nairobi County. Study utilized primary data as the main
source of information and questionnaires as the key instrument to collect required
data. The findings indicated various patterns of customer journey in various
supermarkets highlighting various similarities. The findings of the study indicated that
demographic factors played a significant role in the results obtained. It was noted that
gender factor contributed greatly towards preference of particular outlets, income, age
and occupational playing a significant contribution towards the customer experience
noted consisted of satisfied, excited shoppers who had great emotional, social
sentiments during their full shopping period which developed and shaped their
experience in different dimensions. The study identified various elements of the
customer experience like courteous services, enjoyment aspects while shopping,
feeling of goodness, good ambience and self-reputation, recommendation of friends
and likelihood to purchase from the same outlet was highly rated. The study also
noted various preference-oriented factors like convenient, attractiveness, reliability,
fast process of checkout, modern, and existence of good and reputable brands and
competitive prices as key to preference of particular supermarket. The study found
strong relationship between experience and preference. The study indicated that future
research need be undertaken using a case study approach focus on one supermarket to
get detailed insights into the nature of customer experience and preference factors.
The study also noted that similar studies be undertaken in other retail outlets other
than large supermarkets, like middle sized and small sized supermarkets to identify
their customer experience and preferences.

1
CHAPTER ONE
INTRODUCTION
1.1 Background of the Study
Understanding customer experience is critical for firms’ success and contributes to
high patronage and consumer preferences. Changing lifestyles and environmental
influences have enabled customers to interact with organizations through a series of
touch points in multichannel and media hence making customer experience more
social in context. Companies are confronted with fast-tracking media and channel
fragmentation and Omni channel management (Kannan and Inman, 2015). Customer
experience contains of individual contacts between the company and the customer at
discrete points in the experience known as touch points (Homburg et al., 2015).
Customer experience encompasses of every service exchange involving the customer
emotional, cognitive, sensory, spiritual and social responses to all dealings with the
firm (Bolton et al 2014). Various contributions have notable contributions towards
development of customer experience, these include customer purchasing behavior
process models, customer loyalty and satisfaction, service quality to the firm’s
offerings, especially the customer attitudes and perceptions, through customer
satisfaction surveys (Verhoef & Lemon, 2015).
The following theories will be used to support this study: the Fishbein model theory,
consumer behaviour and Nicosia theory. The theory of buyer behaviour is an upgrade
of the customer decision making model, developed by Howard and Sheth (1969). The
theory has various main elements referred as inputs, the perceptual constructs,
learning constructs and outputs: The second theory is the Nicosia Model developed by
Nicosia (1966) explaining the three stages sequence which a consumer undertakes
starting from consumer awareness, purchase, post purchase evaluation and feedback.
2
The third theory Fishbein model hypothesizes that attitude towards objects, products,
services as a function of attributes and the person’s evaluative aspects of these beliefs
dictate the outcome of the decision.
The retail sector locally is dominated by a wide variety of establishments undertaking,
retailing practices. The retail trade subsector retail in goods and services without
transforming the physical nature of the product except bulk breaking. These
enterprises comprise of small, medium and large enterprises. The modern retail trade
includes hypermarkets, grocery stores, convenience stores and independent
specialized stores. The local retail subsector has great potential employment creation
due to its relative ease of entry. Retailing accounts for 4% of all sales within the
economy (vision 2030 Kenya October, 2013).
1.1.1 Concept of Customer Experience
Customer experience involves every service exchange, irrespective of its form and
nature (Zorantonello, 2015). Customer experience incorporates customers’ emotional,
cognitive, sensory, spiritual and social responses to all dealings with a business
organization (Bolton et al., 2014). Customer experience is a broad view of human
behavior as related to our emotional feelings and decision making and experience.
Customer experience is contained of the cognitive emotional sensorial, physical,
social and spiritual elements that mark the customers indirect or direct interactions
with other actors in the market; raw information through these encounters combine to
create an experience. Other elements that enable customers to elaborate on technology
as an experience include the carnal, the emotional, the compositional and the spatial-
temporal (De- Keyser et al., 2015).

3
An experience can relate to particular aspects of the offering such as technology or
brand and it contains of individual contacts between the company and the customer at
discrete points in the experience known as touch points (Homburget et al., 2015).
Roots of customer experience in marketing is integrated in multiple marketing
philosophies and tends to depreciate or disregard strong recognized concepts in
marketing like service quality, relationship marketing, customer satisfaction, and
customer equity.
Critical understanding of the customer experience is better understood through
identification of contributions of established research and scholarly works to customer
experience. Including customer purchasing process models, customer loyalty and
satisfaction, service quality relationship marketing, customer relationship
management (CRM), customer critic and focus, customer engagement. The process
model for customer experience consist of pre-purchased stage whereby need
recognition consideration and search is predominant, purchase stage whereby choice,
ordering and payments take place and finally the post purchase stage characterized by
consumption, engagement, usage, service requests (Baxendale et al., 2015).
The common measure of customer quality is Servqual which evaluates the functional
delivery of service during a lone episode, this conceptualization enables service
improvement based on traditional quality management principles. The customer
experience exposure EXQ Scale measures the customer experience. EXQ explains
better and in detail behavioral intentions and recommendation than customer
satisfaction (Rawson et al., 2013).

4
1.1.2 Consumer Preference
Consumer preference has been defined as the subjective views of individual
consumers, assessed by their gratification with products they have bought. This
gratification is often considered. Consumer value if computed by comparing utility
between various items. Consumer preferences may be evaluated by their gratification
with a particular item, related to the opportunity cost of that item since whenever you
purchase one item, you forfeit the opportunity to purchase a competing item. The
preferences of particular consumers are not included in the economics field (Dancan,
Rawson and Jones, 2013).
These preferences are influenced by personal culture, taste, education as well as other
factors like external pressure from neighbors and friends. For instance, an individual
who prefers to purchase a particular brand of a phone because all his friends own the
same type of a phone. This means that the customer buying behavior has been
influenced by his friends. Quality products, wide range of products and provided out
of stock goods attracted lots of customers who later patronized the store. Surprisingly
home delivery of goods and delivery of goods to the parking area did not capture the
attention of many customers in the Town (Karumba & Ngigi, 2018). It was
established that a significant association between all the shopper characteristics with
attitude towards store brands existed. All the shopper characteristics had a large and
positive magnitude of association with attitude toward store brand (Ogutu & Peter,
2017).
Customer preferences originates from the evaluative criteria utilized by the
consumer’s perceptual process; the outlet and individual attributes contributes
towards development of the ‘image’, image is a complex of meanings, relationships
serving to characterize the store for people. A number store preference. Mostly

5
utilized techniques include semantic differential, multi attribute, attitude measures,
and dimensional scaling. Semantic differential involves repeated measurements of a
concept such as (store / outlet) on a series of descriptive adjectives such as friendly /
unfriendly. Semantic differential for patronage research using general characteristics
of the campaigns comprises of general characteristics of the company. Physical
characteristics of the firm, convenience of reaching the store from customer’s
location, and products offered. The method is simple to administer and simple to
tabulate using mean and medians(s). Multi-attribute attitude measures focus on the
importance of perceived characteristics of a store as well as perceived characteristics
(Robert et al., 2013).
A semantic differential like old fashioned store / outlet, management might embark on
renovation exercises to make it look modern. The approach could be mistake if the
outlet has a reputation of low priced or valued for nostalgia or because shoppers feel
comfortable in the store. Multi attribute uses various attributes, like price, assortment,
personnel, atmosphere, service, quality (James, Durand & Robert, 2013). Results of
the survey can enable management of the store to improve, and take care of important
attributes and the strengths or weaknesses of competitors; it has been successfully
adopted in measuring patronage behavior in restaurants. Multi-dimensional scaling
measures techniques is useful in studying store choice; it examines store relationships
as compared to a single outlet attribute. The basic hypothesis is that two similar to
each other, the greater the likelihood that the individual behavior towards each will be
similar. The approach is useful for competitive advantage (know which are direct
competitors) (Doyle & Fenwick, 1994).
6
1.1.3 Retail Sector in Kenya
The retail sector in Kenya is characterized into public and private retail Markets,
others operate as retail outlets, some as retail and wholesale. While others are as
informal basis and structures such as small and medium scale (SMEs) and some on
individual basis including (hawkers). Formal wholesalers and retailers comprise of
three (3) large key players (Tuskys, Carrefour, Choppies.). These firms occupy 30%
of the Market share and have streamlined supply chains. The micro small enterprises
are quite informal in nature and offer better quality and prices, most of these
businesses operate from markets or makeshift kiosks. Finally, the Hawkers who sell
goods in the street, their products are generally identical and charge low prices as they
are not taxed (National SME Survey, 2013). Public retail markets are operated and
managed by county governments, in designated and non-designated areas such as
tenant purchase stalls, rental public stalls, open air markets, and self-constructed
markets.
Private retail Markets operate as supermarkets, hypermarkets and specialty stores,
vending machines, light industries. These establishments deal in non-agricultural
products and nonfood items. They include Tuskys, Naivas, Chandarana, Eastmatt,
Mathais. Rapid growth of these sectors is attributed to the changing lifestyles of the
customers, the globalization wave of change, and liberalization policies. Challenges
and constraints within the local retail sector includes policy and legislative
framework, infrastructure, management systems and processes, financial management
and access to business finance, resource management in terms of poor records
management and absence of effective information systems (Government of Kenya
Vision 2030, 2013).

7
1.1.4 Supermarkets in Nairobi
There are approximately 125 independent supermarkets operating in Nairobi (Nairobi
County Government, 2017). The supermarkets are classified according to a tier
category, depending on its branch networks and operations. Tier one was composed of
Uchumi and Nakumatt supermarket, both currently under financial problems affecting
their operational efficiencies. Tier two comprises of Naivas, Tuskys, Choppies,
targeting low- and middle-income segments. Third tier super markets include
Mathais, Eastmatt, Tumaini, Clean Shelf, these supermarkets target low level income
Market segments. The tier classification keeps changing due to growth factor and high
rate of customer patronage.
1.2 Research Problem
Majority of firms excel in customer interactions but fails to pay sufficient attention to
customers’ comprehensive experience on the buying procedures and post purchase
evaluations. Firms that have perfected customer journeys benefit enormously in terms
of rewards, improved customer satisfaction, condensed churn, amplified revenues,
reduced costs and an improved collaboration across the company. Creating strong
customer experience is a critical management objective. Kumar and Reinarts (2016)
held that focus on customer management need to be grounded on creation of customer
value for business which include concentration on customer lifetime value but no
creating value for consumers. Increasing attention on customer experience and
preference has arisen because consumers now are interacting with companies through
many media and multiple channels, creating a more multifaceted customer journey(s)
(Hu & Rahman 2013, Verhoef, Kannan & Inman, 2015).
The local retail sector has tremendously undergone major transformation and change
since the mid-eighties to date. The local retail sector undertakes various functions

8
including breaking the bulk, assortment of goods and services, maintaining the
inventory(s) and provision of services. Local retail stores offer wide selection of
goods and merchandize giving consumers great shopping experience, through a wide
selection of brands, colors, sizes, and prices in one location. Local retailing practices
encompasses of hypermarkets, supermarkets, superstores, main merchandizers,
departmental stores, convenient stores. The growth of the local retail sector can be
attributed to the following factors, the rise in purchasing power of buyers, more
choice to consumers, economy of scale enabling selling at competitive price (s) and
advent of technology offering supply and distribution management solution(s). All the
above factors combined has enabled better services and comfortable ambience aimed
at making each shopping a memorable experience for the consumer. Competition
being on the verge of rise will compel smaller retailers cease to exists as the populace/
consumer are opting for supermarkets form of outlets as they provide daily family
need requirements of milk vegetables, fruits to expensive electronics and clothing as
well as textiles (Vision, 2030 & GOK, 2013).
International studies undertaken in the field of customer experience and preferences in
the retail sector is quite diverse. Melis et al. (2015) examined the impact of
multichannel retail mix in consumer behavior in online store. The findings outlined
the various influences of online purchases including the psychographics and social
influences, costs, perceived benefits, marketing mix tools and post buying behavior.
Husson Thomas et al. (2015) researched on mobile trends for marketers, the findings
indicated that competitors influenced customer experience, the customers dynamic
external environment have major impacts on customer experience, the economic and
circumstances including secession expansion, influence customer experience across
companies and the influencers of customer experience are contingent to the economic

9
situations, thrilling crises have a sturdy negative and lasting effect on the consumer
experience.
Klesse et al. (2015) investigated the impacts of preference manifestation modality on
self-control; the outcome of their research indicated how customers express their
favorites affects their self-control. However, the researchers recommended the
following: that mobile devise channels interact and can interfere with prevailing
channels, mobile devise channels provide new location used time sensitive
opportunities to develop company-initiated touch points, mobile devises direct touch
interface meaningfully influence the customer journey. (Klaus, 2015) undertook a
study on measuring customer experience” the findings indicated that customer
experience is an outcome of various inputs and variables which shape the destiny of
each different customer(s). Dettaan et al. (2015) analyzed the place of mobile devises
in the online purchasing.
The various knowledge gaps identified in the various international studies and local
studies have contributed to further research and refinement of customer experience
and preference. The studies undertaken have demonstrated that each service exchange
result in customer experience irrespective of form and nature of interaction. The
current expansive approach and perspective considers the holistic nature of customer
experience encompassing the customers, emotional, cognitive, social, sensory, and
spiritual responses to all dealings of with the company (Bolton et al., 2014). The
current study tries to consider customer experience to include all aspects of firm’s
offering, customer care quality, service and product features, advertising packaging,
reliability and ease of use, all these include subjective and internal responses
customers develop to any indirect or direct contact with the firm.

10
Locally, Toili (2017) studied customer satisfaction and perceived quality of services
offered in Supermarkets located in Nairobi County. The findings of this study
indicated that consumers of Nairobi supermarket were highly satisfied by service
offered by these outlets, the study also revealed high quality aspects of the practices.
The results fully indicated that consumer satisfaction of Supermarkets in Nairobi
County was highly influenced by tangible, reliability, responsiveness and empathy.
Kamau (2014), researched on effectiveness of supermarkets as retail outlets of fast-
moving consumer goods in Nairobi County, the results indicated that supermarkets
were kept fault or outlets in the sale of fast-moving consumer products, locally the
study also revealed that variety of goods gave supermarkets competitive edge among
other retail partners. An analysis of those previous undertaken research indicates that
none of the studies has focused on the influence of customer experience on
consumer’s preference of larger supermarkets in Nairobi County. The research
question is what is the effects of the customer experience on consumer preference for
larger supermarkets in Nairobi?
1.3 Research Objective
The objective of the research was to determine the influence of customer experience
on consumer preference for large supermarkets in Nairobi.
1.4 Value of the Study
The research was to evaluate the market participants, both retail leaders, challengers
and nichers to find out various ways and means to improve their service offerings
with the aim of improving customer loyalty, retention hence increasing their customer
base and market segment. The study will facilitate positive reinforcement; positive
reinforcement increases the likelihood of repeat behavior as it elicits a reward in terms
of customer experience. The findings from the study will enable the acquisition of

11
customer loyalty since it’s based on emotional attitudes which other firms will find
difficult to replicate.
To the government, the study will assist in formulating policies touching on
consumers with focus on enhancing customer experience. To the supermarkets the
study will increase their skills awareness as well as knowledge to understand the
issues of customer capability relative to the service environment. Customer
compatibility management by these supermarkets involves, the influencing of
customer interacts largely to elicit and faster desirable behaviors towards purchase
and positive post purchase evaluations.
To the academia the research will be of great value towards publishing relevant study
materials for different categories of educational institutions to increase knowledge to
both primary, tertiary and post tertiary institutions. The academic may also litigate
knowledge and related approaches for training of managers of retail outlets on ways
and means of enhancing customer experience.

12
CHAPTER TWO
LITERATURE REVIEW
2.1 Introduction
This part of the research paper introduces the relevant theories supporting the study
including the Nicosia theory, the theory of buyer behavior and the Fishbein Model. It
also comprises of customer experience management and consumer preference.
2.2 Theoretical Foundations of the Study
The study is based on these theories. The Nicosia model; the theory of buyer
behaviour; and the Fishbein Model.
2.2.1 The Nicosia Model
This model was developed by Nicosia (1966). The model has a three-stage structure
which starts with the consumer having information on the existence of particular
product or outlet. The model also examines the decision process from purchase to post
purchase evaluations and feedback. This process of decision making encompasses the
consumer experience and preference. The awareness is created by marketing
communication processes (s). The perceptive element is influenced by attributes of
both the company and consumer. The consumer finally searches for alternatives
which are evaluated by past experiences, beliefs and attitudes. The search process
leads to the purchase or not purchase of the product. This ultimately contributes to
the consumer experience and finally provides feedback which will influence repeat
purchase or dismiss the predictor services.
The Nicosia theory had strong impact when it was published. The theory has never
had necessary elaborations and empirical support; it has not been revised to reflect
changes in the consumer behavior discipline as the Howard Seth Model and Eugel
13
Kollat. Model. Jagdish Seth collaborated with Howard john to strengthen the theory
of buyer behavior through the publication of the theory of buyer behavior in 1969.
Models can be evaluated in two different but related aspects, metatheoretically (in
terms of internal structure of the theory itself) and empirically (in terms of its utility in
describing and predicting the real-World behavior).
Metatheoretical evaluation is the investigation, analyses and description of the
technology of building theory, the theory itself, and utilization of theory hence the
metatheory focuses on the conceptual procedures of science by raising fundamental
philosophic questions (Zaltman et al., 1973).
There are fifteen (15) separate formal criteria to evaluate the Nicosia Model, the
Howard Seth Model (1969) and Eugel Kollat Model (1973). The criterion used was as
follows, well-formed (the theoretical structure conforms to the rules of elementary
logic), evaluation was very good; internal consistency (the theory doesn’t have logical
contradictions); strength, (the theory encompasses other relevant theories); conceptual
unity (components referring to same set of behavior phenomenon); linguistic
exactness (Minimum Vagueness, in terms); Empirical interpretability (ease of
operationalization in empirical terms); Representativeness (relationships explained at
very fundamentals level); feasibility (the theory as comfortable with facts and reality);
methodological simplicity (the theory is easy to test and build); confirmation (the
theory is consistent with facts). Originality (the theory upsurges reality by deriving
novel propositions); external consistency (the theory as reliable with existing
knowledge); unifying power (the theory joins previously unconnected substances);
Heuristic power (the theory suggests new directions for research); stability (the theory
is able to integrate new evidence through variations and modifications (Zaltman et al.,
1973).

14
2.2.3 The Theory of Buyer Behaviour
The theory of buyer behaviour was pioneered by Howard and Sheith (1983). The
buyer model has four main ingredients; the inputs which stimulate the buying process
these include product related factors like price, quality and distinctness, symbolic
features like image, arising from mass media and sales people, social factors like
family, reference social class and group influence. The others ingredient includes the
perceptual constructs which explains the consumer cognitive activity in terms of
information processing. The learning constructs reflects the information processing
and output including the purchase perception and learning. The theory of consumer
behaviour accounts for serves of factors including significant stimulus, social stimuli
and symbolic stimuli, all are relevant in customer experience.
The Howard Seth Model has undergone various tests, using various methodologies
like multiple regression, cross lagged correlation, simulation and longitudinal
analysis. Halbook (1997) came up with the following conclusions, that most studies
undertaken considered only smell part of the total equations adopted earlier, the
Howard Model is based on bivariate relationship (two variables) even though the
hypothesis warranted multiple variables; due to above limitations and conclusions,
Farley et al (1977) came up with various variables unlike the 1969 version of the
model. Zaltman et al. (1973) pointed out that the theory is consistent with present
knowledge.
2.2.4 Fishbein Model
The Fishbein Model developed by Fishbeins (1980) hypothesizes that attitude towards
the object, brand, store outlet is a function of a person’s beliefs about the object in
terms of its characteristics and attributes, and the customers’ evaluative aspects of
those beliefs and characteristics enables one to arrive at a reasonable conclusion about

15
the product/ service. The same understanding for marketers will enable them to gauge
relevant strategies to adopt. Perceived attributes can be attractiveness, brand
reputation, affordability, special features according to Fishbein Model, these attributes
are then weighted for each brand to arrive at their respective importance. This
Fishbein Model enables marketers to determine the brands strengths and deficiencies
in the Market relative to the competition.
The theory has been criticized by leading researchers in customer behavior, these
including Terence Shimp and Alican Kawas (1984); Michael J. Ryan and Bonifield
(1980); They argued that Fishbein model tends to assume that when consumers hold
positive feelings towards most of these product attributes will translate to purchase.
Adzen and Fishbein (1980) later changed the approach of the model from study
attributes towards objects and focused on attitudes towards actions, these new
approaches focused both on product/ object attributes and consequences of the
purchase. When considering purchase of personal computer, a consumer will ponder
on factors like increased productivity, time, saved, time required to learn, and many
other factors relevant to the individual. It makes sense to understand the buyers’
attitude towards the consequences of purchase and owning the product rather than
mere attitude towards its features. Due to these concerns Ajzen and Fishbein
developed the theory of reasoned Action to address these limitations (Adzen and
Fishbein, 1980).
2.3 Measures of Customer Experience
Customer experience is conceptualized as customers’ journey, which encompasses of
the buying cycle involving numerous touch points and as a dynamic practice. The
customer experience process starts from the pre-purchase (search) to purchase to after
purchase, the process Is alterative and evolving as it involves past experiences as well
16
as external factors. Pre-purchase includes of the customer relations with the product
and the environment where the transaction is undertaken, this stage signifies the
customers experience from need, impulse recognition, need and theory. Purchase
moments cover customer interaction with the brand and its immediate environment
characterized by selection, making an order, and paying (Kotler & Keller, 2015). Post
purchase as the third stage which includes customer relations with the brand / product
/ services in a particular environment, notable behaviours in this stage encompasses of
consumption, and usage, after purchase engagement and service requests. In such
case, the commodity itself becomes the touch point (Kotler & Keller, 2015).
Current customer experience touch points include partner owned, brand owned, social
external touch points. Partner owned touch points include consumer interactions with
the experience that is jointly managed, designed, or controlled by the company or its
agents, this include marketing departments, multi-channel distribution partners,
communication partners and vendor loyalty program partners. Customer owned touch
points are actions that constitute the complete customer experience, includes owed
desires or needs, in the pre-purchase stage (Mogenson, 2015). Social external touch
points reflect the immediate environment where the customer operates. These include
the presence of other customers, peer influence, independent information sources, and
general environment which influences the processes. Third party information sources
as social media and review sites also contribute to the influence of customers
(Baxendale, 2015).
Understanding customer experience is of great concern to markets and business
practitioners. Brand equity can influence brand development, brand preference,
purchase, (intention and the willingness of the customers to adopt high prices). Brand
preference leads to the acquisition and purchase intention. Brand association, brand

17
loyalty and distribution intensity significantly influence brand preference. Consumer
based brand equity and creating brand preference for selection are recognized when
consumer have a high level of brand awareness and acquaintance as well as desirable,
unique and strong associations in their lands (Shamim & Bett, 2013). Customer self-
concept and experience has a positive impact on product preference if brands,
products and services enable the customer define, promote and maintain self-concept,
it will eventually affect the consumers while choosing products. A strong congruency
between self-concept, brands and experience promotes preference for as well as
satisfaction with a particular product (Tsai, Chang & HO, 2015).
Customer to customer relations through social media is providing important
opportunities and major challenges to companies. According to Leeflang et al. (2013)
peer customers influence buying behavior. Nevertheless, companies have limited
control, overall of customer experience and the customer journey, resulting in
behaviors as show rooming (Hu and Rahman, 2013; Rapp et al., 2015). Firms are
facing complex challenges in trying to create, control and manage customer
experience (Edelman & Singer 2015, Rawson, Duncan & Jones, 2013). Management
of consumer experience is a complex process that include strategic management of
consumer experience with company or brand which involves five stages, including
building an experimental customers world, building the experimental platform,
conniving the brand experience, constructing the customer experience and
engagement in unceasing innovation, its critical to manage customer experience
across customer touch points (Eldelman and Singer, 2015).

18
2.4 Measures of Consumer Preferences
Quantitative research on consumer behavior utilizes various concepts and numerical
scales including attitude research, image and self-concept measurements, multi
attribute attitude models, and perceptual and preference mapping. The attitude
research undertakes evaluations on objects such as brands or persons. Using a
semantic differential scale to rate the objects in terms of pairs of traits, office
equipment’s may be evaluated on elements of poor, effective, economical, god, low
quality in terms of excellent, among other positively related variables. The customer
opinion can be liked to favourable or unfavourable, negative vs positive, dislike vs
liking for the brand. Kumar (2016) indicates that customers put high value on various
products provided, quality specifications and availability of these quality brands.
The image self-concept measurement can measure customer own self-image of
specific products and brands. Using various semantic differential scales, with such
elements as modern, economic, pleasant, feminine, masculine, traditional,
Uneconomic to measure psychographics that’s the values, self-concepts, and
lifestyles, researchers present a series of statements about possible activities and
interests and opinions, respondents indicate their agreement and disagreement with
these statements. The multi attribute attitude model examines the consumers
preferences or attitude towards a product or service, which is weighted, against a sum
of own beliefs and degree to which the item or service processes a set of attributes or
characteristics (Mittal & Seth, 2004).
Perceptual and preference mapping measures is used to measure the attributes and
criterion consumers use to judge and evaluate alternatives, brands, products, services,
retailers, or vendors. The analytical techniques provide visual map in
multidimensional nature which shows how similar or different brands are considered

19
to be by the consumer perceptual and preference maps are critical in identifying new
product concept in perceptually repositioning a brand, and identifying Market
segments best suited to own’s brand (Maghnati et al., 2013).
2.5 Relationship between Customer Experience and Consumer Preference
The Customer experience has considerable association with customer preferences.
Multiple factors including location, goods assortment, quality of service influence
patronage of clients to particular outlets hence regulating their behaviour. Consumers
great emphasis on variety and wide goods assortments, availability of quality brands
quality Merchandise and clean service scape all the factors increases customer loyalty,
high level of trust, In the service personal include positively reflects on great
Patronage behaviour (Kumar, 2016).
Customer experience of perceived value associated with malls and supermarkets
affects patrons to a large extent as well as influencing their level of satisfaction and
patronage. The element of value is closely related to the services cape and perceptual
interpretations (Sadachar, 2014). Customer experience has positive impacts on
customer preferences and affection. Cognitive experience is said to include
knowledge and beliefs which create memory, perception, information and learning,
through the touch point of customer.
Customer affection has positive influences on customer satisfaction and preference.
There is close relationship among the customer experience, and reference in terms of
products/ service and outlets (Blocker, 2013). Social experience and emotional
experience have noteworthy positive effects on buying intention and preference.
Customer experience creates instant and askew effect on buying intention. Purchase

20
and preference intentions are influenced by levels of customer experience; experience
does affect the customers’ preferences which successively affect their purchase
decisions (Yang and He, 2013).
Consumer preference for no choice option involves purchase of alternatives and
postponement of the purchase intentions. Consumer preferences is dependent on
multiple attributes including product attributes, store convenience, patronage and
emotional motives, brand preferences. Firms utilize use of brands as experiential and
symbolic resources from which customers connect their identity (CI) and consumer
ethnocentrism (CE) have different focus and different sentiments towards preference
for particular brands. (Wang & He, 2017) consumer identification with particular
culture influences for particular brands or products symbolically related with their
culture. Behavior intention is a critical variable between consumer preference,
attitude, and final purchase behavior (Chandon, Morwitz & Reinartz, 2015). Symbol
benefits like prestige, modernity and association with particular lifestyles create one
of the principal motivating forces of buyers’ preference (Wang, Barns and Ann,
2013).
2.6 Empirical Review
Consumer experience is being utilized to forecast the purchaser purchase intention,
and utilize the knowledge in experimental marketing. The critical components of
consumer experience encompass of the sensory experience, social experience and
emotional experience. The results from various studies have established that
emotional, social experience have substantial positive effects on purchase intentions
(Maghnatti et al., 2013). Analytical observations indicate that consumers had a
propensity to give advanced importance to store layout, store location, shopping
hours, atmospherics, and pleasing units to chatting stores especially when purchasing

21
cloths and apparels (Vera 2017). Retail environments play a critical role in the time
undertaken to shop in particular outlet(s) and influences consumer perceptions on
consumption. Yang and He (2013) asserts that experience does affect customers’
preference(s), which ultimately affect the purchase intention. Sensory, emotional and
social element dominate the customer experience.
A study by Naumi Ngumo (2014) found out that brands, price, store location,
apparent quality and products’ prices influence customer loyalty towards particular
outlets. Sachar (2014) established a positive relationship between education level,
entertainment, and prior experiences on store loyalty, also noted was store attributes
and norm store features plays a significant role in patronage and repurchase. Kumar
(2016) finally notes that there is a positive relationship patronage between store
decision, other factors which contributed to patronage including the diversity of
services and products.
The influence of promotion on consumer preference involving traditional and modern
marketing tools currently practiced have been characterized as cost effective and have
speed and ability to each wide market audience hence enabling product to be fairly
priced. The trend of communications has accelerated the concept of awareness in
terms of influencing consumer decision making. According to the studies undertaken
it revealed that awareness impacts heuristically on perceived quality of the brand
preference(s) (Foxal, 2013). Customer experience management in retailing sector has
received great response. Kamaldevi (2012) indicates that in terms of finance and
marketing perception, company-controlled factors such as merchandise, price,
promotion and location had an impact on customer experience and behavior.

22
Peter and Olson (2012) notes that consumer experience development and behavioral
customer analysis can be studied by affective experience and cognitive experience,
consumer behavior and consumer environment. To achieve sales volume and profit.
The impact and importance of brand experience on customer brand-based equity have
elaborately effect towards individual customer experience and purchase intention
(Bhatt and Shamin, 2013).

23
CHAPTER THREE
RESEARCH METHODOLOGY
3.1 Introduction
This section highlights the research methodologies the research adopted. It involves
study design, study population, and method of collecting and analyzing data.
3.2 Research Design
Kothari (2004) describes a research design as an arrangement of requirements for
collections and analysis of the data in a way that it combines relevance to the research
objective and significance of the study. Research design comprise of decisions
concerning what, where, how and when regarding a research or inquiry design
(Sekaran, 2011). This particular study adopted a cross sectional survey design. Cross
sectional survey was undertaken to describe the current situation, what respondents
believe, what is currently undertaken (Baumgartner, Strong & Hensley, 2002). The
adoption of the design was due to its complete inclusiveness of the entire population.
3.3 Population of Study
Burns and Groove (2003) indicated that population include all the elements that
achieve the criteria to be included in the study. Basically, population include
individual objects and events that have common observable characteristics. For the
purpose of this study the population constituted of shoppers of five large supermarkets
operating in Nairobi County (Nairobi County Licensing Department, 2018).

24
3.4 Sample Size
The respondents of the study consisted of 2,000 customers who daily patronage these
big supermarkets. Most of these supermarkets operate on a 24-hour basis. A sample
for this study must be specific enough to provide researchers with a clear
understanding of the applicability to particular situation. Mwangi (2015) adopted
Krejcie and Morgan sampling technique for small sample population while
identifying the sample size of average T.V viewers in Nairobi county- Ngumba estate.
For the purpose of this study, the Krejcie and Morgan (1970) formulae was adopted to
ascertain the number of Shoppers sample size as indicated below.
S= X2NP(1-P) ÷ d2 (N-1)+x2 P(1-P)
S= required sample size.
X2= the table value of Chi-square for 1 degree of freedom at the desired confidence
level (1.96 x 1.96= 3.4816)
(3.841)
N= the population size.
P= the population proportion (assumed to be .50 for maximum sample size)
d= the degree of accuracy expressed as a proportion (.50)
The sample size for this study index will be 322.
3.5 Data Collection
The study utilized primary statistics which was collected by use of questionnaire. A
questionnaire included a formulated question through which participants gave their
responses. A Five-point Likert scale questionnaire was utilized. Likert scales
constitute of interval scales that specially utilizes five anchors of strongly agree,
agree, neutral, disagree, and strongly disagree. Likert scale is better in measuring;
Perception, attitude, values, behavior; The questionnaire was subdivided into five

25
sections, section A constituted of customer demographics, section B consisted of
customer experience, Section C constituted of customer preference. Respondents were
the customers patronizing particular supermarkets.
3.6 Data Analysis
Hyndman (2008) indicates that data processing includes changing the responses in
questionnaires in a form that may be worked on to give statistics; this includes
editing, coding, monitoring and data entry that constitute data processing process.
Descriptive statistics of mean, frequency and Percentages was utilized to analyze
demographic characteristics of participants; Correlation analysis and regression
analysis was applied to measure and predict the influence of customer experience on
consumer preference.

26
CHAPTER FOUR
DATA ANALYSIS RESULTS, INTERPRETATION AND DISCUSSION
4.1 Introduction
This chapter presents the findings and interpretations of results obtained from the
study. The purpose of the study was to investigate the influence of customer
experience on customer preference for large supermarkets in Nairobi County. The
section covers the background demographic information, customer experience,
customer preference. Descriptive statistics was utilized to analyze the data.
4.2 Response rate
Response rate is the number of successfully administered questionnaires. The study
targeted an estimated sample size of 322 participants of which 236 were successfully
administered which comprises of a response.
Table 4. 1:Response Rate
Supermarkets Sample Size Respondents Response rate
Carrefour 65 50 77%
Naivas 65 45 69%
Tuskys 64 40 63%
Food Plus 64 55 86%
Choppies 64 46 72%
Total 322 236
Source: Research Data, 2018
The response rate of 73.3% is considered satisfactory and is quite a true representation
of the population. Mugenda and Mugenda (2003) articulates that a response rate of
50% is adequate, 60% is good, and 70% is very good. The same view is shared by

27
Barley (2000) who indicates that a response rate of 50% is adequate, while any higher
percentage signifies a very impressive response.
The high response rate can be attributed to the cooperativeness of participants and the
long hours of operation which most of these stores operate. A non-response rate of
27% is quite low and will not affect the result(s) outcome. In a study by lamb et al
(2012) indicates that most customers find quality products and services, prices being
competitive and brand availability being the key contributor for high turnout of
shoppers in these supermarkets.
4.3 Demographic Information of Respondents
The study sought to describe the demographic of customers who patronage those
supermarkets in terms of their gender, Age, Marital Status, Level of education,
duration of patronage to their particular outlet(s) and the employment status. The
findings are presented in the following sub section.
4.3.1 Gender Distribution
The study sought to analyze the gender categories of the sampled segment of
respondents, with a view to understand which gender represents a high percentage of
customers. This analysis of gender can be utilized while developing marketing
strategies targeting particular market segments customers.
Table 4.2: Gender Distribution
Gender Frequency Percentage
Male 108 46%
Female 128 54%
Total 236 100
Source: Research Data, 2018

28
The results in 4.3.1 revealed that 54% of the respondents were female whereas 46%
comprised of Male respondents. These percentages revealed an even dispersion of
gender. The current lifestyle has precipitated an even balance of shoppers across the
customer market segments. Thus, results indicate soft active gender participation in
household and consumer decision making processe(s). The study concurs with Vera
(2017) on the findings of consumer patronage towards shopping malls in Nairobi,
indicated high patronage of Lady shoppers.
4.3.2 Age Distribution
The study sought to establish the age groups of these respective customers who
frequent particular supermarkets as in indicated in Table 4.3.2.
Table 4.3 : Age Distribution
Age Frequency Percentage
18-25 40 17%
26-35 54 23%
36-45 58 24%
46-55 45 19%
Above 55 39 17%
Total 236 100%
Source: Research Data, 2018
The result in Table 4.3.2 indicates that a majority of respondents fall under the age
group of 36-45 years, 24%, 26yrs -35yrs, 23% 46ys -55yrs, 19% above 55 years and
18-25 years 17% respectively. The results clearly indicate that category of 36-45 and
26-35 constitute of the largest shoppers in these big five supermarkets in Nairobi. The
large number of these respondents are working category or young professionals who

29
run their own businesses or engaged in particular trade or business ventures. A low
percentage of 17% for age group above 55yrs indicates that that age bracket is not
quite active in daily purchases as the young generation. Family unit shoppers will
constitute of the adult children and mothers/ ladies who also constituted a his/her turn
out on their brackets.
4.3.3 Marital Status
The study sought to investigate the marital status of their respondents’ findings
indicated at table 4.3.3.
Table 4.4 : Marital Status
Marital Status Frequency Percentage
Single 73 31%
Married 106 45%
Others (Specify) 57 24%
Total 236 100%
Source Research Data, 2018
The study findings indicate that the married persons constitute the large numbers of
buyers/ customers 45%, followed by single status persons at 31% and others at 24%.
The pattern can be attributed to the traditional roles and duties of married person’s
responsibilities to family requirement
4.3.4 Level of Education
The study sought to describe the respondents’ level of Education findings indicated on
Table 4.3.4.

30
Table 4.5 : Education
Education Frequency Percentage
Secondary 26 11%
Diploma 51 22%
Degree 94 40%
Masters 55 23%
PhD 10 4%
Total 236 100%
Source: Research Data, 2018
Findings of table 4.5 indicates that majority of respondents were degree holder
constituting of 40% followed by master level of education 23%, Diploma level 22%
Secondary level 11% and Ph.D level 4. The results indicate that a modern shopper an
educated and well-informed customer. The lowest number of Ph.D respondents
clearly indicate, that these level of academic attainment are not frequent shoppers as
most of them shopping is done by those employed by them or family members who
compose of the other bracket(s). The studies also indicate that these categories of
shoppers have their own preferences in terms of choice and related decisions. It also
means that their responses and feedback were quite informed.
4.3.5 Employment Status
The study sought to investigate the relationship of employment status and the
purchase habits of various respondents as indicated in Table 4.3.5.

31
Table 4.6 : Employment Status
Employment Status Frequency Percentage
Business 65 28%
Employment 67 28%
Unemployment 24 10%
Retired 13 6%
Home maker 52 22%
Student 15 6%
Total 236 100%
Source: Research Data, 2018
From the results analyzed, the respondents who are in business profession and
employment accounted for 28% respectively. This is because these are financially
capable customers with strong finance base and have a high tendency towards
shopping activities; the home maker category which constituted of home maker
accounted for 22% of the total respondents. Thus, is also due to the fact that this
category of respondents is active in house hold purchases. They also have a higher
bond in home items decision making practices.
The unemployed respondents accounted for also 10% while retired and students
accounted for 6% respectively. The low rate percentage can be attributed in the return
of their status, for the retired group, they are not frequent shoppers as most of the
shopping is done by those in active daily business endeavors. Students also consisted
of low percentage shoppers due to their nature of status. They have no income and, in
most instances, they are in schools or colleges.

32
4.3.6 Income Level
The study sought to analyze the income level of respondents as shown in Table 4.3.6.
Table 4.7 : Income Level
Income Level (Kshs) Frequency Percentage
0-10,000/= 18 8%
10,001-18,000/= 32 14%
18,001-25,000/= 53 22%
25,001-45,000/= 66 28%
45,001 and above 67 28%
Total 236 100%
Source: Research Data, 2018
Findings from the table indicate that those respondents with an average income of
upto and above 45,000/= constitute 28%. This is a clear indication of their strong
purchasing power. Those with income of Ksh. 18,000/= and above to Ksh. 25,000
were 22%, those respondents with up to Ksh. 18,000 constituted 14% of the total
respondents while the least income bracket of Ksh. 10,000 comprised of 8% only. The
pattern of income and corresponding percentage indicates that those with average and
good disposable income are the large number of respondents who shop from various
supermarkets. The studies are similar with those of Acholla (2017) on consumer
patronage towards shopping malls in East of Nairobi.
4.3.7 Frequency of Supermarket Visits
The study sought to determine the nature and frequency of visits to the supermarkets
with a view to analyze their patronage rate as indicated in Table 4.3.7.

33
Table 4.8 : Frequency of Supermarkets Visits
Frequency of
Supermarket Visits
Frequency Percentage
Once a week or more 37 16%
Once every two weeks 25 11%
Three times a year 15 6%
Every Month 150 64%
Rarely/ first time 9 3%
Total 236 100%
Source Research Data, 2018
From the results its noted that the monthly shoppers account for 64% of the total
respondents, this is due to the fact that most people undertake their shopping activities
at the end of every month. Which is a true characteristic of employed persons. Those
respondents who shop every week account for 16%, those who undertake shopping
after two weeks 11% least percentage were noted on those who shop three times a
year accounted for 6% while those who rarely visited these outlets and those visiting
for the first time accounted for 3%. The study findings are I line with Mistri & Bhatt
(2014) who found that physical store aspects of the Retail services quality scale
(RSQS)) model have positive impacts on customer perception of retail outlets in
India. Nhat and Hau (2007) using RSQS concluded that service personnel have the
highest impact of customer perception in retail service quality in Vietnam.
4.3.8 Supermarket Preference
The researcher sought to understand supermarket preference of various respondents.
The results are indicated at Table 4.3.8.

34
Table 4.9 : Supermarket Preference
Supermarket Frequency Percentage
Carrefour 49 21%
Naivas 55 23%
Food Plus 50 21%
Tuskys 51 22%
Choppies 31 13%
Total 236 100%
Source: Research Data, 2018
The results of the investigation Carrefour is located in Westlands and city centre
hence commanding their percentage indicated. Food plus is quite popular because is
located in densely populated Highridge, Parklands Westlands and Lavington areas of
Nairobi.
This study reveals a uniform pattern of preference as far as individual respondent
choice of supermarket is concerned. The pattern of preference reflects the location of
the particular supermarket. Naivas, Tuskys and Food Plus have location in city urban
residential areas hence commanding a high and uniform rate of shoppers. Leading
choice is Naivas with 23% of respondents, Tuskys with 22% Food Plus with 21%,
Carrefour 21% and Choppies Supermarket 13%. Choppies supermarket does not have
branches or outlets in respective urban residential areas of Nairobi. The findings
concur with Reardon, Chege and Waug 2006 who indicated that the two great
motivations for shopping at supermarket is the variety of goods and fair prices.
35
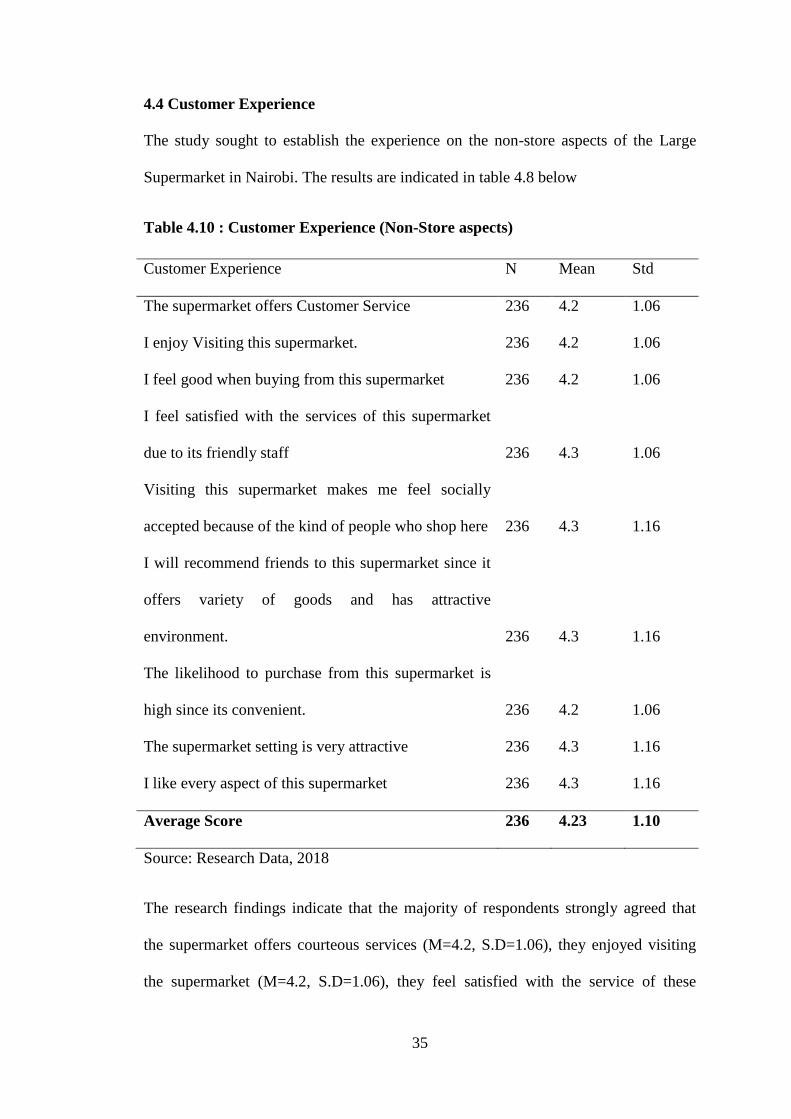
4.4 Customer Experience
The study sought to establish the experience on the non-store aspects of the Large
Supermarket in Nairobi. The results are indicated in table 4.8 below
Table 4.10 : Customer Experience (Non-Store aspects)
Customer Experience N Mean Std
The supermarket offers Customer Service 236 4.2 1.06
I enjoy Visiting this supermarket. 236 4.2 1.06
I feel good when buying from this supermarket 236 4.2 1.06
I feel satisfied with the services of this supermarket
due to its friendly staff 236 4.3 1.06
Visiting this supermarket makes me feel socially
accepted because of the kind of people who shop here 236 4.3 1.16
I will recommend friends to this supermarket since it
offers variety of goods and has attractive
environment. 236 4.3 1.16
The likelihood to purchase from this supermarket is
high since its convenient. 236 4.2 1.06
The supermarket setting is very attractive 236 4.3 1.16
I like every aspect of this supermarket 236 4.3 1.16
Average Score 236 4.23 1.10
Source: Research Data, 2018
The research findings indicate that the majority of respondents strongly agreed that
the supermarket offers courteous services (M=4.2, S.D=1.06), they enjoyed visiting
the supermarket (M=4.2, S.D=1.06), they feel satisfied with the service of these

36
supermarkets (M=4.2, S.D = 1.05), they will recommend others (M=4.3, S.D=1.16),
they are likely to purchase from the same supermarket (M=4.2, SD= 1.057), they
liked every aspect of the supermarket (M=4.2, SD=1.16). The respondents agreed that
they felt good when shopping from their respective supermarket (M=4.2, SD=1.16),
that the supermarket is very attractive (M=4.2, S.D=1.16).
4.5 Customer Preference
The following customer preference were considered in the survey.
4.5.1 Store Aspects
The study sought to establish the level at which participants agreed with the statement
about preference for particular supermarkets. The participants were asked to rate the
statement in table 4.10 on the five scale where
Five = Extremely favourable, Four=Favourable, Three= Neutral, Two= Unfavourable,
One= Extremely unfavourable.

37
Table 4.11 : Customer Preference
Store Aspect N Mean Std
Attractive 236 4.12 1.02
Convenient 236 4.15 1.06
Likable 236 4.13 1.11
Competent 236 4.15 1.06
Courteous 236 4.23 1.07
Reliable 236 4.09 1.36
Fair Prices 236 4.11 1.02
Modern 236 3.72 0.81
Easy to find items 236 4.09 0.91
Fast check out 236 4.22 1.10
Convenient 236 4.05 1.13
Wide selection 236 4.23 1.10
High quality products 236 4.22 1.10
Has known brands 236 3.9 0.93
Dependable 236 4.33 1.14
High prices 236 3.82 0.81
Advertises 236 3.81 0.96
Known to friends 236 3.8 0.91
Average Score 236
Source: Research Data, 2018
Table shows that respondents agreed that the supermarkets were dependable (M=4.33,
SD=1.12); they also agreed that the supermarkets , had made selection of merchandise
and had courteous employees (M=4.23, SD=1.10), they also agreed that the
supermarket had competent employees (M=4.23, SD=1.07),they also agreed that the
supermarket was conveniently located (M=4.15, SD=1.06) they also agreed that this
supermarket was attractive (M=4.12, S.D=1.06)

38
Large number of respondents agreed that the supermarkets were likable (M=4.13, S.D
1.11) while some respondents agreed that supermarket(s) was reliable and easy to
build items (M=4.09, S.D=1.36) other respondents agreed that the supermarkets were
conveniently located) M=4.05,SD=1.13). Finally, some respondents were neutral on
issues relating to the supermarket having known brands and charged high prices for
products (M=3.09, SD=0.93, M3.82, SD=0.81). Other respondents were not sure
whether the supermarket advertises their products, and some didn’t understand
whether the supermarket was modern in terms of what they benchmarked against
(M=3.72, SD=0.81). Finally, some respondents were not sure whether the
supermarket was known to friends (M=3.8, SD=0.91). The findings concur with Reza
and Barua (2013) who concluded that assurance. Physical attributes influence
customer satisfaction and reliability among local supermarkets.
4.5.2 Preference Multi Attribute Factors
The study sought to investigate the extent to which the underlisted Multi attribute
factors contributed to the supermarket preference in a scale of one to five. The
respondents indicated the extent to which various multi attributes factors contributed
to their current choice of supermarket. Table 4.5.2 indicates preference measures.

39
Table 4.12 : Preference Multi Attribute Factors
Preference Measures Mean SD
Products
The Store has adequate variety of goods 4.3 1.06
The quality of products is high 4.4 1.18
The store has numerous brand 4.12 1.11
The store is fully stocked 4.0 1.04
Preference Measures
The supermarket currently located 4.13 0.920
Supermarket has good ambience and
environment.
4.09 0.94
Price
The prices are low compared and other
stores
4.42 1.20
Price are competitive 4.22 1.23
Products have value for the money
spent
4.09 0.94
Promotion
The store has informative
advertisement
4.27 1.09
The store advertisement is appealing 4.21 1.05
The store adverts are easy visible 4.3 1.16
Source: Research Data, 2018

40
The researcher findings indicate the following patterns in terms of respondent
preferences. The respondents agreed that the supermarket had high quality goods
(M=4.4 SD= 1.18), they also agreed that the prices were low compared with other
supermarkets (M=4.42, SD=1.20).
They agreed that some supermarkets had adequate variety of goods (M=4.3, SD=1.06)
while others noted and agreed that the supermarkets were fully stoked (M=4.2,
SD=1.04). Further to that they also agreed that the supermarket had numerous brands.
The respondents agreed that supermarkets advertised their services and business
(M=4.3, SD=1.05).
Further analysis indicated that some respondents agreed that ambience and value of
goods was quite good (M=4.09, SD=0.94). The respondents also agreed that the
supermarkets were conveniently located and the increased their preference ego. Some
respondents identified the supermarkets through their being visible in the Market
place and competition (M= 4.3, SD= 1.16). Finally, the respondents agreed that these
supermarkets had competitively priced products which also increased their preference
option. Bojanic and Rosen (1994) posit that supermarket offers quality services and
products of value to customers.
4.6 Correlation Analysis
A Pearson Product-Moment Correlation Coefficient was computed to assess the
relationship between the customer experience and the consumer preference of large
supermarkets in Nairobi county County, Kenya. Table 4.6.1 presents the findings.

41
Table 4.13 : Correlations
Consu
mer
pre
fere
nce
Cust
om
er
exper
ien
ce
Consumer preference
Correlation Coefficient 1.000 .585
Sig. (1-tailed) . .000
N 236 236
Customer experience
Correlation Coefficient .585 1.000
Sig. (1-tailed) .000 .
N 236 236
Source: Research Data, 2018
It indicates that there was a strong positive correlation between the customer
experience and consumer preference of large supermarkets in Nairobi county County,
Kenya. where r = 0.585, p = 0.000, n = 236. The results also revealed that the p-value
was 0.000, which is less than 0.05. This implies that statistically there is a significant
relationship between the two variables. A positive correlation means that an increase
in one variable leads to an increase in the other variable. In this case, an increase in
customer experience would lead to an increase in the consumer preference of large
supermarkets in Nairobi county County, Kenya. The findings concur with Shamim
and Bett (2013), that customer self-concept and experience has a positive impact on
product preference if brands, products and services enable the customer define,
promote and maintain self-concept, it will eventually affect the consumers while
choosing products. A strong congruency between self-concept, brands and experience
promotes preference for as well as satisfaction with a particular product.

42
4.7 Regression Analysis
The research conducted regression analysis to determine whether there is a
relationship between customer experience and consumer preference of large
supermarkets in Nairobi County, Kenya.
4.7.1 Model Summary
The model summary in table below was utilized to determine whether there is
considerable variation between dependent variables and independent variables.
Furthermore, it was utilized to determine the proportion variation of dependent
variables on independent variable.
Table 4.14 : Regression Model Summary
Model R R Square Adjusted R
Square
Std. Error of
the Estimate
1 0.843821 0.712034 0.654441 3.341166
a. Predictors: customer experience
b. Dependent variable: consumer preference
Source: Research Data, 2018
The adjusted R squared was established to be of 0.654 this means that the independent
variable (customer experience) studied in this study contributes 65.4% of
supermarkets consumer preference. Other factors and random disparities not studied
in this study led to a measly 24.6 percent of the of supermarkets consumer preference
in Nairobi County.

43
4.7.2 Anova
Table 4.15 : Anovaa
Model Sum of Squares Df Mean Square F Sig.
1 Regression
Residual
Total
11.173
634.60
645.773
1
234
235
11.173
2.712
4.121 .000a
a. Predictors: customer experience
b. Dependent variable: consumer preference
Source: Research Data, 2018
The ANOVA results in table 4.7.2 show F-value of 4.12, which is significant at
0.000<0.05. This signifies a model fit and implies a match between the regression
model and the data, which means that the use of regression analysis in this study was
justified.
4.7.3 Coefficient Analysis
From the findings on table below, β0= 3.546 signified the constant that predicted
value of supermarkets consumer preference in nairobi county Kenya while customer
experience is held constant at zero (0).
Table 4.16 : Regression Coefficients
Model Unstandardized
Coefficients
Standardized
Coefficients
t Sig.
B Std. Error Beta
(Constant) 3.546 0.461 7.691974 .000
Customer experience 0.345 0.091 0.301 3.791209 .001
a. Predictors: customer experience
b. Dependent variable: consumer preference
Source: Research Data, 2018

44
The optimal regression model is therefore:
Y = 3.546 + 0.345X1 + ε
Regression outcomes showed that customer experience have significance and positive
influence on consumer preference of large supermarkets in nairobi county as indicated
by β1=0.345, p=.001. This means that an increase in customer experience would lead
to an increase in the consumer preference by β1= 0.345. The findings are in line with
Kumar (2016), indicates that customers put high value on various products provided,
quality specifications and availability of these quality brands. The findings indicated
that the quality of the service given had positive impact on consumers trust level in
the sales personnel, which in turn impacted positively the perception towards a
particular outlet. The findings are in line with Blocker (2013), that customer affection
has positive influences on customer satisfaction and preference. There close
relationship among the customer experience, and reference in terms of products/
service and outlets
4.8 Discussion of the Findings
The customer experience references to the interactions between customers and a
product a form of part of the organization, which cause to a reaction by customers.
The experience affects customers engagements in different purchase transactions. Batt
and Shamin (2013) notes that the importance of brand experience on customer-based
equity is critical in understanding a particular customer journey and experience. Boyle
and Martinez (2013) believe that brand equity can influence brand development,
brand preference and choice of outlet. It also increases the element of patronage and
buyer behaviours.

45
The study reveals that large supermarkets in Nairobi exhibit similar demographic
characteristics reflected in previous studies. In the current study there is an even
distribution of participants across the two genders group. Thus, findings are in line
with Rosseal and Venter (2014) and Nahari and Kuvad (2017), similarly the present
study indicates a balanced number of patronage among the employed group of
respondents and the business oriented individuals, there was less number of elderly
customers and school going respondents. Sohail (2013) found similar results with
malls patrons in Saudi Arabia. A unique pattern emerged that most patrons/customers
of large supermarkets were similar in education level, marital status, and employment
status. Similar studies have been undertaken locally by Acholla (2017) who
investigated customer patronage and perceptions towards shopping Malls in Nairobi.
The research utilized descriptive statistics by calculating mean, median and standard
deviation. Age factor of 25-35 years were noted as majority of patrons in malls. Other
outcomes were that there was strong and significant relationship between customers’
experience with store choice or preference with minimal variance of non-store and
store aspects.
Nyongesa and Kuloba (2015) in their findings of factors influencing consumer
preference for retail outlets in Kisii town identified similar variables which contribute
to store choice, these included prices of merchandise, location, promotion, prices and
in store management and audience. Thus, concurs with the current study which found
same characteristics and factors contributing to preference for particular outlet
(supermarket). Wornchanok and Suksa-ngom (2013) identified various factors which
influenced store patronage in Bangkok Thailand. The findings concur with the current
findings which highlighted the nature of products, being of quality, reliable brands,

46
the place factor in terms of location, ambience and environment, and price being
competitive low products having value for their money spent.
Thank and Tan (2013) in their research on linking consumer perception to preference
of retail stores using a multi attributes of store image concurs with the findings of the
current study, whereby the multi attributes factors are similar encompassing of
products, places, price and promotion. Factors relating to preference like
attractiveness, convenient, reliability, competent, dependability wide choice of
merchandise. Klause and Maklan (2012) notes that customer experience is a key
determinant of customer behavior and a critical objective for service firms. Customers
perceptions of their experience are generally associated with the nature on how
service is delivered rather than exploring what is delivered and how customer
experience relates to important marketing out comes. The research findings concur
with Dang (2014) who asserts that it’s understandable that consumers usually refer
fast delivery, large assortment and varieties add on services etc. There is need to
balance service outputs and consumer’s needs. There is a strong indication that gender
factor is important in choice of retail outlet. The female participants estimated of 54%
which was quite good compared with Men respondents of 46%. Women undertake
traditional roles of being in charge of household shopping and food purchases hence
the great turnout in various supermarkets. This concurs with Ravilochanan and Devi
(2012) women shoppers take time to compare quality choose among alternatives
hence spend more time in the supermarket. This trait also implies that they patronize
those outlets with variety and choice.
Supermarket need to take account of the women buyer behavior and improve the store
layout to attract them, and promote the store through positioning strategies using
various variables such as price, fashion, decency rare reliable dependability and self-

47
image for those wish to acclaim their society status. Thus, sentiments are supported
by Choi et al. (2004) then indicate that the retail product and service quality at the
point of purchase influencing consumer perceptions of value and willingness to buy.
Support services attract customers to certain retail outlets which allow them
convenient and pleasure of shopping at preferred outlet(s). Support services
encompasses of identifications of customers’ needs in the outlets, delivery of the
products to customers premises, warranties and guarantees, financial arrangement and
payment flexibility, product usage, training convenient shopping hours, loyalty
programmes and adequate parking. Management of service quality and the service
personnel are the corner store of any business the personnel are the first contract point
with customers in their encounter moments during their visits to particular
supermarkets. Service personnel are always in best position to evaluate customer
experience (Hesket et al., 2007).
Store promotion and communication enhances choice and preference studies indicate
a strong relationship between patronage number of customers and the level of
communication in the store adopts. Grunig and Hunt (2013) indicates that
communication environment via internet occurs in various ways. The emergence of
social media is a two-way symmetric environment has provided a balanced interactive
communication between target groups and retail outlets without time and location
constraints.

48
CHAPTER FIVE
SUMMARY OF FINDINGS, CONCLUSION AND RECOMMENDATIONS.
5.1 Introduction
This chapter describes the summary of Key results of analysis of the influence of
customer experience on customer preference of large supermarkets in Nairobi. It
consists of summary of findings, conclusion, recommendations, study Limitations and
recommendation for further research.
5.2 Summary of the Findings
The objective of the study was to establish the influence of customer preference for
large supermarkets in Nairobi County. The respondents were customers who
patronize those outlets. Questionnaires were distributed to them for their participation.
The response Rate was quite good. (A total of 322 respondents were targeted and only
236 successfully participated in the exercise).
The response rate from the large five supermarket was encouraging, these
supermarkets comprised of Food plus, Carrefour, Choppies, Naivas, Tuskys. The
findings indicated that gender classification was quite even but the female
respondents were high of all respondents while the male counterparts was relative.
The findings further indicated that most customers comprised of ages of twenty-six to
thirty-five (26-35 yrs) respectively, this is because most of these respondents are in
employment or in business. The age bracket had a low turnout, this is a mature
customer segment who are not very active purchase but have diverse responsibilities
at family level, while those above fifty-five years, and eighteen years to twenty-four
years were fewer. The findings further indicated that married persons had a higher
percentage while singles were relatively less. In the area of educational level, a higher

49
percentage of respondents had degree level of education, this is possible due to large
number of colleges and universities in Kenya today. Those with master level of
education, and diploma holders were of goo numbers and finally secondary school
level of education were fewer. The study findings indicated that those respondents in
employment and business was higher, home maker, unemployed and students were
relatively less.
On the level of income of respondents, the highest percentage of shoppers were those
who have a monthly income of Ksh. 25,000-45,000 and, followed by those with a
monthly income of Kshs. 25,000, and least percentage was that category of Ksh.
10,000. The study revealed that most of the respondents shop once a month due to
their occupation level, employment or business, those who shopped once a week
relatively fewer. The study findings indicated that most customers preferred
supermarket, which are close to their respective residence or work place, that’s why
the percentages are almost similar with slight differences, Naivas, Tuskys, Food plus,
Carrefour had a high turnout. Choppies is relatively low due to its presence in the city
centre and has no branches in the residential areas or on the outskirts of the central
business District.
The findings of the study noted the following as regards the customer experience, that
customer felt socially satisfied while shopping from particular outlets (mean= 1.9 SD
=O. 95) others indicated that supermarket are very attractive others suggested to
recommend friends to the supermarket, majority indicated enjoying the shopping
experience (M=1.9 sd-0.90) while a good number indicated that the service of these
outlets was customers. A good number of respondents indicated a likely good of
shopping again due to the good experience noted. The study findings registered the
following as far as store or supermarket preference was concerned. A number of

50
respondents indicated that they preferred the supermarket because it was dependable
(M=4.23, SD=1.14), others indicated the courteous staff and service (M=4.23,
SD=1.07) they checked out fast, (M=4.22, SD=1.10) the store had wide selection of
merchandise (M=4.23 SD= 1.10) supermarket had high quality products, convenient
easy to find items, attractive.
Some respondents indicated that the supermarket was well known to friends (M=3.82,
SD= 0.84) and had known brands of products (M=39, SD=0.93) while a some noted
the element of modernity M= 3.72 SD= 0.81) as factors encouraging preference. The
study noted that various multi attribute factors core utilized to measure the element of
preference these included the price, the promotion, the place and the products.
5.3 Conclusion
The study analysis and findings identified simultaneous customer demographic
factors across five large supermarkets. It revealed that the gender factor played a
significant role in purchase activities, was indicated that income played a significant
factor in choice of supermarkets, those respondents who frequent those outlets have
similar characteristics as far as their incomes is concerned. The age factor was quite
significant factor identified across the large five supermarkets. The study concludes
that gender, income, age, should be given more consideration while investigating the
influence of customer experience for preference of choice of supermarkets.
The store/ supermarket elements seemed to have a significant impact on customer
preference the location, ambience, layout and general assortment of high-quality
merchandise and good and courteous staff. The study concluded that supermarkets
should invest more in store aspects to increase the level of patronage as well
improving their overall shopping experience.

51
5.4 Recommendations from the Study
The study recommends that supermarkets invest in store related features and facilities
to increase the conclusiveness of the service scope where shopping operation are
undertaken. The study also recommends that supermarket chain of stores to adopt
online shopping trend as the current lifestyle and shopper expectations are changing
from the previous Brick and Motor establishments. The study also recommends that
supermarkets invest in more on social media communication as an effective two-way
communication channel of the current century and lifestyles.
5.5 Limitations of the Study
Challenges of time and resources were greatly experienced. Data collection and
movement was quite challenging. Element of confidentiality made to affect the
outcome as most respondents were not willing to indicate their deep details like
incomes, age, marital status. However, those who participated were a group
representation.
5.6 Recommendations for Further Research
The research notes that there is need to undertake further Research on other types of
Supermarkets the Medium sized, small sized to analyze whether the experience and
preference issues are similar to the large supermarkets. The study should also
undertake a case study of at least one supermarket to deeper insight of experience and
preference which signifies that a case study approach could yield more insight
information.

52
The study recommends that the same studies be undertaken to other retail sector
establishments not necessarily supermarket types. This could give a better
understanding of various customer experience and shopper preference information.
Finally, the study could also be undertaken on service related organizations to assert
the experience and preference factors.

53
REFERENCES
Ajzen & Fishbein (1980). Understanding attitude and predicting social behavior.
Journal of Marketing, 44 pp 82-95.
Bolton, Ruth N (2014). Service excellence: creating customer experience that build
Relationships. New York Business Expert press.
Barnes, Brooks (2013) The Digital Kingdon. At Disney Parks a bracelet meant to
build loyalty. New York.
Baxendale, Shane, Emma K, Macdonald Hugh N. (2015). The impact of different
touch points on Brand Consideration. Journal Retailing, 91 (2) 235-53).
Blockers C.P. (2013) The dynamics of satisfaction Loyalty after (relational
transgressions). Journal of Services of Marketing, Vol. 26 PP 94-101
Cao, Lanlan & Li Li. (2015). The Impact of Cross Channel Integration on Retailers
sales growth. Journal of Retailing, 91 (2) (198-216).
Experience, self-concept congruence, customer Satisfaction and brand preference.
Contemporarily Mugure of Research, PP 97-116 Vol. 11 No. 2 2015.
De Keyser, Arne Katherine N, Lemon, Timothy Keiningham & Phillip (2015). “A
framework for Understanding and Managing the customer experience: MSI
working paper No. 15-121. Caubridge M.A. Marketing Science Institute
Journal of Marketing and Logistics 25 (1)-102-117
Doyle P. & Fenwick J. (1974). How store Image affects shopping Habits in grocery
chains. Journal of Retailing, Vol. 50 (pp 39-52)
Herhausen Dennis, Jochem Binder, Marcus Schoegel, & Andreas Herman (2015)
Integrating Bricks with clicks. Retailer-level and Channel level outcomes of
online-offline Channel Integration “Journal of Retailing 91 (2) 309-25.
Homburg & ChristienKuehl (2015). Customer experience management “Toward
Implementing an evolving marketing concept” Journal of the Academy of
Marketing Science 11747-015-0460-7.
Hui, Sam K, Jeffrey J. Inman, Younliu Huang, & Jacob Suher (2013). “The effect of
lustore travel Distance on Unplanned Spending. Application to mobile
Promotion strategies” Journal of Marketing 77 (March) 1-16.
Husson, Thoma, Julie A Ask Carrie Johnson, Melissa Parish & Emily Kwan (2014).
Predictions 2014: Mobile trends for Marketers” research report Foraster
research. Kamaldevi B. (2012) customer experience management in Retailing.
Business Intelligence Journal Vol3 No.1 PP 37-54.
Klaus, Ph&Maklan S. (2013). ExQa Multiple Scale for assessing services experience
Journal of Service Management.

54
Klaus P. (2015). Measuring customer experience. How to develop and execute the
Most profitable Customer experience strategies. New York Palgrave
Macmillan.
Klesse, Anne K, Jouathan L, & Caroline Goukens (2015). The effect of Preference
expression Modality on Self-control “journal of Consumer Research, 42 (4)
535-50.
Keiningham, Timothy L, Bruce Cooil. Tor William Andreassen & Lerzan Aksoy
(2013). Longitudinal examination of Net promoter and Firm Revenue growth
“Journal of Marketing 71 (July) 39-51.
Leeflaug, Peter S. H. Penny N. Spring. Jenny VamRoorn, & Tom J. Wansbeek
(2013). “Identifying the direct mail phone Consumer “Journal of global
scholars of Marketing Science. 23 (2) 175-95.
Vera L.A (2017). Consumer patronage and perception towards shopping malls in East
of Nairobi, Unpublished Project UoN.
Mogesnnson, D. (2015). I want to do moments from home to Beauty. Think with
Google (https/ww/intml).
Melis, Kristine Katia Campo E/s BreagelImans, & Lamey Lelvu (2015). “The impact
of Multichannel Mix on Online store choice. Does Online experience matter”?
Journal of Consumer research.
Olson C. & Peter C. J (2012) Consumer Behaviour and Marketing strategy 9th Ed.
McGrawHill.
Rawson A. Duncan E & Jones (2013). The truth about customer experience. Harvard
Business Review, 91 (Sept) 90-98.
Sadachar A (2014). Indian Consumers Patronage Intention towards Shopping malls.
Application of an experience economy perspectives.
Verhoef P. &Lemonk, (2015). Customer experience creation determinants, dynamics
and Management Strategies. Journal of Retailing 85! PP 31-41
Wang, CL Barns B, & Ann J (2013). Country image product image and consumer
purchase intentions, Evidence from an emerging economy. International
Business Review 21(6) 1041-1051.
Wang L.C. & He. J. (2014) Culture Identity and Consumer ethnocentrism impacts on
preference and purchase of domestic versus import brands. An empirical study
in China. Journal of business Research, 68 (2015) 1225-1233.
Wedel & Kauuan P.K. (2010). Analytics for data rich environment of Marketing 80-
97-121.
Zaltman G; Christian R. A, Pinson & Angelmar R. (1973). Metatheory and Consumer
Behaviour Holt, Ronehart & Winston.

55
APPENDICES
Appendix I : Questionnaire
TOPIC: THE INFLUENCE OF CUSTOMER EXPERIENCE ON CONSUMER
PREFERENCE OF LARGE SUPERMARKETS IN NAIROBI.
The questionnaire is designed to collect data on the influence of customer
experience on consumer preference for large Supermarkets in Nairobi County.
Your participation will be highly appreciated and results will be used purely for
academic purposes and treated confidentially.
PART A PERSONAL BACKGROUND AND DEMOGRAPHIC VARIABLES
[ tick where appropriate]
1. (a) Name of Supermarket
Choppies [ ] Food plus(formerly Chandarana) [ ]
Tuskys[ ] Carrefour [ ] Naivas [ ]
(b) What is your gender? Male [ ] Female[ ]
2. What is your age?
18-25 [ ] 26-35 [ ] 36-45 [ ] 46-55 [ ] Above 55 [ ]
3. What is your marital status? Single [ ] Married [ ]
Other specify……………………………………………………………..
4. What is your level of Education?
Secondary [ ] Diploma [ ] Degree [ ] Masters [ ] PhD [ ]
5. For how long have you been shopping from this particular super market?
i) Less than one month [ ]
ii) 2-6 months [ ]

56
iii) 1-2 years [ ]
iv) More than 2 years [ ]
6. Kindly tick your status
(i) Business [ ]
(ii) employment [ ]
(iii) Un employment [ ]
(iv) Retired [ ]
(v) Home maker [ ]
(vi) Student [ ]
7. How often do you Purchase Merchandize from this particular Supermarket?
i. Once a week or more [ ]
ii. Once every two weeks [ ]
iii. Three times a year [ ]
iv. Every month [ ]
v. Rarely or first time [ ]
8. Which supermarket do you prefer shopping from? (specify)
9. Tick your monthly income (in Kshs)
0-10,000 [ ]
10,001-18,000 [ ]
18,001- 25,000 [ ]
25,001-45,000 [ ]
45,001 & Above [ ]

57
PART B: CUSTOMER EXPERIENCE
Please indicate the extent to which the following contribute towards your experience
with this supermarket.
5- Strongly Agree, 4- Agree, 3- Neutral, 2 – Disagree, 1- Strongly Disagree
Customer experience 1 2 3 4 5
The supermarket offers courteous services
I Enjoy visiting this supermarket due to its
Convenience
I Feel good when buying from this supermarket
because of its ambience
Shopping in this supermarket enhances my self-
image due to its reputation
I Feel satisfied with the services of this supermarket
due to its friendly staff
Visiting this supermarket makes me feel socially
accepted because of the kind of people who shop
here.
I will recommend friends to this supermarket since it
offers variety of goods and has attractive
environment
The likely hood to purchase from this supermarket is
high since its convenient
The supermarket setting is very attractive
I like every aspect of this super market

58
PART C: CUSTOMER PREFERENCES
a) Please indicate with a tick (√) the perception rating that best describes
preference for your particular supermarket
Extremely favourable
(Positive
5 4 3 2 1 Extremely
unfavourable
(Negative)
Attractive un-attractive
Convenient inconvenient
Likable un likable
Competent incompetent
Courteous uncourteous
Reliable un reliable
Fair prices un fair prices
Modern out dated
Easy to find items not easy find items
Fast check out slow check out
Convenient un convenient
Wide selection limited selection
High quality products low quality products
Has known brands has un known brands
Dependable un dependable
High prices low prices
Advertises does not advertise
Known to friends un known to friends

59
(b) Preference multi attribute factors
To what extent do you agree with the following factors in relation to your preferred
super market? Use a scale of 1-5
Where 1- Strongly disagree, 2- Disagree, 3- Neutral, 4- Agree, 5- Strongly Agree.
Preference Measures 1 2 3 4 5
Products
The store has adequate variety of goods
The quality of products is high.
The store has numerous brand
The store is fully stocked.
Place
The supermarket is hereby
The supermarket currently located.
Supermarket has good ambience &
environment
Price
The prices are low compared and other
stores.
Prices are competitive.
Products have value for the money spent.
Promotion
The store has informative advertisement.
The store advertisement is appealing.
The store adverts are easy visible.

60
Appendix II: List of large supermarkets in Nairobi, Kenya.
1. Carrefour Supermarket.
2. Food Plus (formerly Chandarana) Supermarket.
3. Tuskys Supermarket.
4. Choppies Supermarket.
5. Naivas Supermarket.
Source: Nairobi County Government Licensing Department (2018).