Embed Size (px)
Citation preview

Influence of Crosslinking and Plasticizing on the Viscoelasticity ofHighly Filled Elastomers
Aurelie Azoug,1 Robert Neviere,2 Rachel-Marie Pradeilles-Duval,1 Andrei Constantinescu1
1Laboratoire de M�ecanique des Solides, Centre National de la Recherche Scientifique Unit�e Mixte de Recherche (France) 7649,Ecole Polytechnique, 91128 Palaiseau Cedex, France2SNPE Mat�eriaux Energ�etiques, Centre de Recherches du Bouchet, 9 Rue Lavoisier, 91710 Vert-le-Petit, FranceCorrespondence to: A. Azoug (E - mail: [email protected])
ABSTRACT: Solid propellants, like all highly filled elastomers, exhibit a complex nonlinear viscoelastic behavior. The aim of this study
was to establish the relationships between the structure and properties, which is needed to construct a robust constitutive law for
these materials. An extensive design of experiments approach allowed us to quantify the influence of the curing agents and plasticizer
molecules on the microstructure of the propellant and its viscoelastic properties. Swelling and gel permeation chromatography meas-
urements described the microstructure of the propellant and prestrained dynamic mechanical analysis (PDMA) characterized the
viscoelastic behavior. The curing agents reacted with polymer chain ends participating in the network, in the sol fraction, or in filler–
binder links. Consequently, the polymer network was incomplete even in stoichiometric conditions, and a minimum of 10% of the
polymer was free in the microstructure. In addition, preswelling the polymer with plasticizer molecules before curing modified the
obtained network by decreasing the crosslink density in the binder and increasing it in the vicinity of the filler surface. This study
provided new insight into the local deformation mechanisms controlling nonlinearity as measured by PDMA. The nonlinear behavior
appeared between 0 and 1.7% prestrain in both the elastic and viscous parts of the behavior. The network reached its maximum
extensibility in the elastic part and constrained the sol fraction in this extended mesh for the viscous part. VC 2014 Wiley Periodicals, Inc.
J. Appl. Polym. Sci. 2014, 131, 40392.
KEYWORDS: crosslinking; elastomers; plasticizer; swelling; viscosity and viscoelasticity
Received 4 October 2013; accepted 31 December 2013DOI: 10.1002/app.40392
INTRODUCTION
Solid propellants are highly filled elastomers used for the pro-
pulsion of rockets and launchers. Their filler volume fraction
reaches 80%. The remaining constituent of the material is a
binder, which holds the particles together and ensures the visco-
elastic properties of the composite up to large strains. Because
of the high filler-to-binder ratio, the material exhibits a complex
nonlinear mechanical behavior, and predictive material models
are needed to design the structure of the launchers.
The modeling of the nonlinear viscoelastic mechanical behavior
exhibited by propellants is a current research challenge. Phenom-
enological models1–5 currently lead to inaccurate predictions of
the material behavior under complex loadings or extreme envi-
ronmental conditions, whereas homogenization theories6–9 are
usually predictive only up to filler fractions of 30–50%.
The difficulty of determining models based on the physics of
the material arises from the complexity of the microscopic
structure and the induced local deformation mechanisms in the
binder. An additional obstacle arises from the involved binder–
filler and filler–filler interactions. The aim of this study was to
understand the links between the solid propellant microstruc-
ture and its macroscopic mechanical properties.
A design of experiments (DoE) method was implemented to
consider the influence of four factors, namely, the filler fraction,
the bonding agents, the NCO/OH ratio, and the plasticizer con-
tent. The influences of the filler fraction and the filler–binder
bonding agents (FBBAs) were discussed in Azoug et al.10 (AZ1).
In this article, the results quantifying the influence of the NCO/
OH ratio, and the plasticizer content were discussed.
Crosslinking in hydroxyl-terminated polybutadiene (HTPB)
based propellants is controlled through the ratio of the number
of isocyanate functional ends of the curing agents (NCO) and
the number of hydroxyl groups of the polymer chains (OH).
Solid propellants are voluntarily undercrosslinked; that is, the
NCO/OH ratio is lower than 1. Consequently, a part of the
polymer chains remains unlinked to the network and
VC 2014 Wiley Periodicals, Inc.
WWW.MATERIALSVIEWS.COM J. APPL. POLYM. SCI. 2014, DOI: 10.1002/APP.4039240392 (1 of 9)

constitutes a free assembly of polymer chains denoted as the
sol polymer.
The sol fraction is defined as the microstructural phase that can
be extracted by swelling in a good solvent, i.e. the fraction of
the binder unlinked to the global polymer network and not
contributing to the elastic response. The sol fraction in propel-
lants is mainly composed of the sol polymer and plasticizer
molecules.
The plasticizer is an additive that masks polar groups of poly-
mer chains and, as a consequence, enables the polymer chains
to move freely past each other. Therefore, its microscopic role
has an impact on the macroscopic viscoelastic behavior. The
incorporation of plasticizers before curing, denoted as preswel-
ling, must be distinguished from the swelling of the cured poly-
mer with plasticizers or diluents, denoted as postswelling.11 The
effect of postswelling on solid propellants was considered in a
previous study.12 The results show that the macroscopic visco-
elastic behavior was modified according to the swelling or con-
traction of the network independently of the viscosity of the
introduced liquid. This study focused on the effect of preswel-
ling with plasticizer molecules.
The added plasticizers facilitated the manufacturing process and
targeted specific mechanical properties in the final material. The
propellants could be considered to be preswelled materials
because a high quantity of plasticizers was introduced into the
premix before we cured the polymer. The incorporation of
diluents or plasticizers before the creation of a three-
dimensional polymer network generated networks with a differ-
ent topology. These topological changes persisted after the
removal of the diluents and led to notable changes in the
mechanical properties.11 For example, the addition of plasticiz-
ers before curing in the filled elastomers decreased the visco-
elastic storage and loss moduli.13,14
EXPERIMENTAL
As described in AZ1,10 a D-optimal DoE was built. The details
of the formulation of the materials were given in AZ1. The
main elements are described as follows. The DoE factors were
the formulation ingredients that influenced the mechanical
behavior the most. Four factors were chosen:
� Filler fractions between 86 and 90 wt %.
� NCO/OH ratios between 0.8 and 1.1.
� Plasticizer contents between 10 and 30% of the binder.
� The presence or absence of FBBAs (categorical).
The fillers were ammonium perchlorate and aluminum
particles.
The exact synthesis of the FBBA molecules cannot be described
because of confidentiality restrictions. Their mechanism was
described in AZ1.10
The binder was based on an HTPB prepolymer cured with a
methylene diicyclohexyl isocyanate. The prepolymer had a
molar mass of 2900 g/mol and a mean functionality of around
2.3. The ratio of the quantity of the curing agent methylene dii-
cyclohexyl isocyanate with respect to the quantity of hydroxyl
functions in the introduced prepolymer was the NCO/OH ratio.
The NCO/OH ratio evolved between 0.8 and 1.1. At values
lower than 1, a part of the prepolymer was not linked to the
global network and was, therefore, extractable. As a result, it
constituted a part of the sol fraction and was named the sol
polymer.
The introduced plasticizer was dioctyl azelate. A plasticizer con-
tent of at least 10 wt % of the binder was necessary to manu-
facture the material. The percentage range of plasticizer
explored in the DoE was 10–30 wt % of the binder. The mole-
cules of plasticizer did not bind with the network or the fillers
and were located only in the sol fraction.15
The materials were thermally cured for 2 weeks at 50�C. The
levels of the factors for each of the 22 manufactured materials
are given in Table I.
Macroscopic and microscopic experiments were performed on
the materials. The microscopic structure was characterized by
swelling experiments, which determined the sol polymer frac-
tion (Fsolpol) and the crosslink densities of the propellant and
the binder (Dp and Db, respectively). The experimental proce-
dure was described in AZ1.10
In addition to the experiments described in AZ1, the relative
molecular weights [number-average molecular weight (Mn) and
Table I. Materials Manufactured According to the DoE Method
MaterialFiller(wt %) FBBA
NCO/OHratio
Plasticizer(wt % binder) GPC
0 86 2 1.1 10 X
1 90 2 0.8 30 X
2 86 3 1.1 20
3 90 3 0.8 20
4 86 2 1.1 30 X
5 90 3 1.1 30
6 90 2 0.8 10
7 86 3 0.8 10
8 86 2 0.8 20 X
9 86 3 0.8 30
10 90 2 0.95 20
11 88 2 1.1 20 X
12 90 3 1.1 10
13 88 3 0.95 30
14 88 3 0.95 15
15 88 2 0.88 25 X
16 88 2 0.95 10 X
17 90 3 0.8 10
18 86 2 0.8 10 X
19 86 3 1.1 10
20 89 2 1.1 20
21 89 2 0.8 10
The absence and presence of FBBA are indicated with 2 and 3, respec-tively. X indicates the materials of the DoE on which a GPC test wasperformed.
ARTICLE WILEYONLINELIBRARY.COM/APP
WWW.MATERIALSVIEWS.COM J. APPL. POLYM. SCI. 2014, DOI: 10.1002/APP.4039240392 (2 of 9)

weight-average molecular weight (Mw)] and the polydispersity
index (Mw/Mn) of the sol fraction were measured by gel permea-
tion chromatography (GPC) for eight materials of the DoE (see
Table I). The sol fraction was extracted by swelling in toluene. For
each material, 40 mg of the sol fraction was diluted in 20 mL of tet-
rahydrofuran. The mix was agitated for 2 h and then injected at
35�C. The device was equipped with three PLgel mixed columns,
and polypropylene glycol was used for calibration. The molecular
weights of the pure plasticizer and HTPB prepolymer molecules
were also determined with the same procedure.
The macroscopic mechanical viscoelastic response was deter-
mined by prestrained dynamic mechanical analysis (PDMA), as
detailed in AZ1.10 We recall that the evolution of the storage and
loss moduli according to prestrain is characterized by three varia-
bles: the plateau value (P) in the linear region, the threshold of
the onset of nonlinearity (T), and the slope of the curve in the
nonlinear region (S). For each variable, the symbols (•)0 and
(•)00 indicate correspondence with the storage modulus and the
loss modulus, respectively.
The DoE analysis procedure determined models quantifying the
influence of each factor on the chosen response, as described in
AZ1.10
RESULTS AND DISCUSSION
Fit of the Models
The fit of the models was quantified by the optimal adjusted
correlation coefficients (Radj2).16 This value should be equal to 1
when the response of the material is perfectly represented by
the mathematical model, depending on the composition of the
material, that is, the four factors. The optimal Radj2 values were
0.99 for Fsolpol, 0.96 for Dp, and 0.97 for Db.
As expected, the correlation coefficients for the microscopic
quantities were extremely high. The values measured for Fsolpol
and the crosslink densities were directly dependent on the com-
position of the material.
Table II shows the Radj2 values characterizing the fit of the mod-
els obtained for the PDMA responses.
The PDMA coefficients indicated that the models fit the Ps of
both the storage and loss moduli very precisely (Figure 1).
Hence, the evolution of these responses was the direct result of
the influence of the chosen factors. The coefficients obtained for
the S values were slightly lower but were still satisfying, espe-
cially when the experimental error was taken into account. The
measurements at high prestrain tended to be more scattered
than the one obtained in the linear domain.
The correlation coefficients of the models for the Ts were the
smallest (Figure 2). When the strain amplitude (ea) was 0.5%,
the coefficients were too weak to allow us to study the influence
of the factors. As a result, the values of T at ea 5 0.5% were
excluded from the analysis. Figure 2 shows the values predicted
by the DoE model as a function of the measured values for the
parameters T0 and T00.
The weak correlation for T0 and T00 originated from both the
scattering of the experimental data and modeling errors. The
measured T values were determined by optimization of the phe-
nomenological model on the experimental data and depended
on initial values and user-chosen constraints. Therefore, the
solution was not unique, and T was a weak point in the phe-
nomenological model proposed here.12 In addition, the DoE
model may not have been able to distinguish each of the com-
plex influence of the factors and their interactions on this aspect
of the behavior.
Characterization of the Microstructure
Dp and Db increased with the NCO/OH ratio (Figure 3). As this
factor controlled the amount of available curing agents, it
directly influenced Dp and Db by themselves.
Because the binder was assumed to be composed mainly of
plasticizer and polymer molecules, the percentage of polymer
(sol or participating in the network) in the binder depended
primarily on the introduced plasticizer content. Fsolpol was
defined as the volume percentage of the total quantity of the
polymer in the binder to remove the influence of the plasticizer
content. Fsolpol measures the ratio between the volume of the
sol polymer and the total volume of polymer chains in the
binder.
Increasing the NCO/OH ratio not only increased the crosslink
density but equally changed the quantity of the sol and network
polymer chains (Figure 4). Fsolpol decreased with the NCO/OH
ratio. As expected, increasing the relative amount of curing
agents in the material permitted a larger amount of polymer
chains to be linked to the network.
For large NCO/OH ratios (>1), where a complete network
could be built, Fsolpol formed at least 10% of the polymer.
Moreover, Fsolpol seemed to reach a minimum, whose value
depended on the plasticizer content (Figure 4). The presence of
Fsolpol at a high NCO/OH ratio proved that the curing agents
not only built the three-dimensional network by linking the
polymer chains to each other but also reacted to other mole-
cules. This corroborated the results in AZ1,10 where it was pro-
ven that the reaction of molecule X on the filler surface
consumed the curing agents.
For small NCO/OH ratios (<1), Fsolpol reached extremely high
values, between 50 and 70% of the polymer (Figure 4). This
was an astonishing observation as it seemed unlikely that a
Table II. Radj2 Values for the Models of the PDMA Responses
ea (%) P0 P00 T0 T00 S0 S00
0.01 0.99 0.98 0.71 0.54 0.75 0.80
0.1 0.99 0.97 0.83 0.58 0.94 0.77
0.5 0.98 0.99 0.22 0.33 0.87 0.79
ARTICLE WILEYONLINELIBRARY.COM/APP
WWW.MATERIALSVIEWS.COM J. APPL. POLYM. SCI. 2014, DOI: 10.1002/APP.4039240392 (3 of 9)

polymer composite could remain solid while presenting 70% of
its polymer chains as soluble, even when the large filler fraction
and the weak binder–filler links created by molecule X were
taken into account. Further insight into this question was given
by the measurements of the molecular weights in the sol
fraction.
The molecular weights of the molecules in the sol fraction are
represented on Figure 5 with respect to Fsolpol. The mean value
Mn is represented in plain lines, whereas the dashed lines indi-
cate the minimum and maximum molecular weights of the dis-
tribution according to Mw/Mn. Several low-molecular-weight
peaks were observed for all of the compositions and represent
the additives included in all industrial materials, such as antiox-
idants. As these molecules had little influence on the mechanical
behavior, they are not represented in Figure 5 and are neglected
in the following discussion.
By definition, plasticizer molecules are low-molecular-weight
components compared to polymer chains. Thus, the molecular
weight of the plasticizer molecules in the sol fraction was easily
distinguished from the HTPB molecular weights.
In materials containing little Fsolpol, the HTPB molecular
weights were distributed around one mean value, which was
equal to about twice the molecular weight of the HTPB prepol-
ymer. However, the width of the molecular weights distribution
was large. Hence, this phase of the microstructure already
Figure 2. Correlation between the T values predicted by the DoE model and the measured T values: (a) T0 and (b) T00.
Figure 1. Correlation between the Ps predicted by the DoE model and the measured Ps: (a) P0 and (b) P00.
ARTICLE WILEYONLINELIBRARY.COM/APP
WWW.MATERIALSVIEWS.COM J. APPL. POLYM. SCI. 2014, DOI: 10.1002/APP.4039240392 (4 of 9)

consumed some curing agents to link a few chains to each other
without building a network.
As Fsolpol increased, Mw/Mn increased up to 2.03 for a Fsolpol of
30 wt % of the polymer. This showed the transition between a
Fsolpol centered around one value and the microstructure of
undercrosslinked materials described in the next paragraph.
At high Fsolpol’s, a new phase appeared, which contained molec-
ular weights larger than 30,000 g/mol. This phase represented
parts of the network that lacked curing agents to be linked to
the global network. These parts empowered the solid to display
the high Fsolpol measured by swelling.
To complete the study of the microstructure, the influence of
the plasticizer content on the crosslink density and Fsolpol were
examined.
Db decreased when the plasticizer content increased (Figure 3).
This decrease proved that the addition of plasticizers before cur-
ing (preswelling) modified the resulting network. More pre-
cisely, the preswelling increased the weight between crosslinks.
The influence of the plasticizer content on Dp (Figure 3) and
Fsolpol (Figure 4) strongly depended on the NCO/OH ratio. The
behavior could be divided into two domains with NCO/OH
thresholds at 0.91 and 0.96 for Dp and Fsolpol, respectively.
When the NCO/OH ratio was lower than this threshold, Dp
decreased, and Fsolpol increased with increasing plasticizer con-
tent. When the NCO/OH ratio was higher than this threshold,
Dp increased, and Fsolpol decreased when the plasticizer content
increased.
As this effect was not measured on Db, we concluded that the
change in Dp and in Fsolpol due to plasticizers was eliminated by
the dissolution of the fillers. Thus, the influence of the plasti-
cizer content was associated with the increase in crosslinks in
the neighborhood of fillers attributed to the reaction of the
FBBA molecule X. As presented in AZ1,10 the molecule X
reacted with the filler surface and with the polymer chains and
consumed curing agents. It appeared that the plasticizers facili-
tated this reaction. One possible explanation was that the plasti-
cizers facilitated the movements of the curing agents toward the
surface of the fillers where they reacted with molecule X and a
polymer chain, either part of the network or of the sol fraction.
In the presence of an adequate quantity of curing agents, Dp
increased and Fsolpol decreased with increasing plasticizer con-
tent. The fact that the influence of the filler fraction on both Dp
and Fsolpol was strongly connected to the plasticizer content
(Figure 6) was further support for the preceding argument.
More precisely, the reaction of molecule X was facilitated by the
plasticizer molecules; therefore, the influence of the filler frac-
tion was larger for larger contents of plasticizer.
The reaction of molecule X was, however, annihilated by the
dissolution of the fillers in the second part of the swelling
experiment (see AZ1), and hence, it did not participate in the
measurement of Db.
An additional effect arose from the preswelling of the network
by plasticizers; that is, the amount of chains participating in the
network increased for the same quantity of curing agents intro-
duced. At NCO/OH ratios larger than 1, the outcome was an
Figure 3. Db and Dp versus the NCO/OH ratio and the plasticizer content
(filler fraction 5 88 wt %, no FBBAs).
Figure 4. Fsolpol according to the NCO/OH ratio and the plasticizer con-
tent (filler fraction 5 88 wt %, no FBBAs).
Figure 5. Mn and Mw/Mn values for the sol fraction measured by GPC for
the eight materials of the DoE. [Color figure can be viewed in the online
issue, which is available at wileyonlinelibrary.com.]
ARTICLE WILEYONLINELIBRARY.COM/APP
WWW.MATERIALSVIEWS.COM J. APPL. POLYM. SCI. 2014, DOI: 10.1002/APP.4039240392 (5 of 9)

almost complete network and a sol fraction that decreased with
increasing plasticizer content.
When the quantity of curing agents was not large enough to
generate a complete network, the plasticizers facilitated the
movements of small molecules into the microstructure. In this
configuration, the presence of molecule X further deprived the
network of essential curing agents. Consequently, Fsolpol
increased and Dp decreased with increasing plasticizer content.
To summarize, the microstructure was schematically composed
of fillers and binder. The influence of the fillers and binder–fil-
ler links was studied previously by AZ1.10 This study focused
on the influence of the NCO/OH ratio and the plasticizer con-
tent on the binder. The binder itself was seen as a polymer
chain network and a sol fraction.
The NCO/OH ratio quantified the quantity of curing agents
available to chemically link the HTPB chains and create a net-
work. Consequently, this factor strongly controlled the crosslink
density of the material. In addition, when NCO/OH was less
than 1, that is, when the amount of curing agents was not suffi-
cient to form a complete network, a new phase appeared in the
sol fraction and was composed of portions of the network not
linked to the global network. Finally, some of these curing
agents were actually used by the FBBA molecule X to react with
the filler surface and form binder–filler weak links.
The plasticizers played a double role in the formation of the
microstructure. First, they preswelled the network, and this led
to a decrease in the crosslink density in the presence of high
quantities of plasticizers. Second, the plasticizers molecules
seemed to facilitate the movements of small molecules, such as
curing agents or molecule X, into the microstructure and
toward the filler surface. This part of the study showed that the
plasticizers increased the crosslink density in the vicinity of fill-
ers when the NCO/OH ratio was higher than 1.
Deformation Mechanisms
In this section, we discuss the results of the characterization of
the macroscopic viscoelastic behavior. First, the influences of
the NCO/OH ratio and the plasticizer content on the linear
behavior at low prestrain are discussed. Second, the deformation
mechanisms leading to the nonlinear behavior are identified.
The measurements show that P0 increased with the NCO/OH
ratio (Figure 7). This could be explained by the fact that an
increase in the NCO/OH ratio had a double effect. On one
hand, it increased Db. On the other hand, it decreased Fsolpol
and, hence, increased the quantity of elastically effective chains.
Both effects led to an increase in the storage modulus, as
observed in other elastomers and elastomer composites.17–19
P00 increased with the NCO/OH ratio (Figure 8). A limit value
in P00 was obtained for NCO/OH ffi 1. When we scrutinized the
outcome of the increase in the NCO/OH ratio at the polymer
chain level, we noticed a decrease in Fsolpol; this was assumed to
be mainly responsible for the dissipations by intermolecular
frictions. A decrease in P00 would then be expected. However,
the study of the microstructure also showed that at low NCO/
OH ratios, a portion of Fsolpol was actually composed of parts
of network that had a low mobility in the global network and
that did not produce increased dissipations. Moreover, an
increase in the NCO/OH ratio also increased the crosslink den-
sity, and this led to a decrease in the mesh size. The sol polymer
Figure 6. Interaction of the filler fraction and the plasticizer content influencing the microstructure (NCO/OH 5 0.95, no FBBAs).
Figure 7. P0 according to the NCO/OH ratio and the plasticizer content
(filler fraction 5 88 wt %, no FBBAs).
ARTICLE WILEYONLINELIBRARY.COM/APP
WWW.MATERIALSVIEWS.COM J. APPL. POLYM. SCI. 2014, DOI: 10.1002/APP.4039240392 (6 of 9)
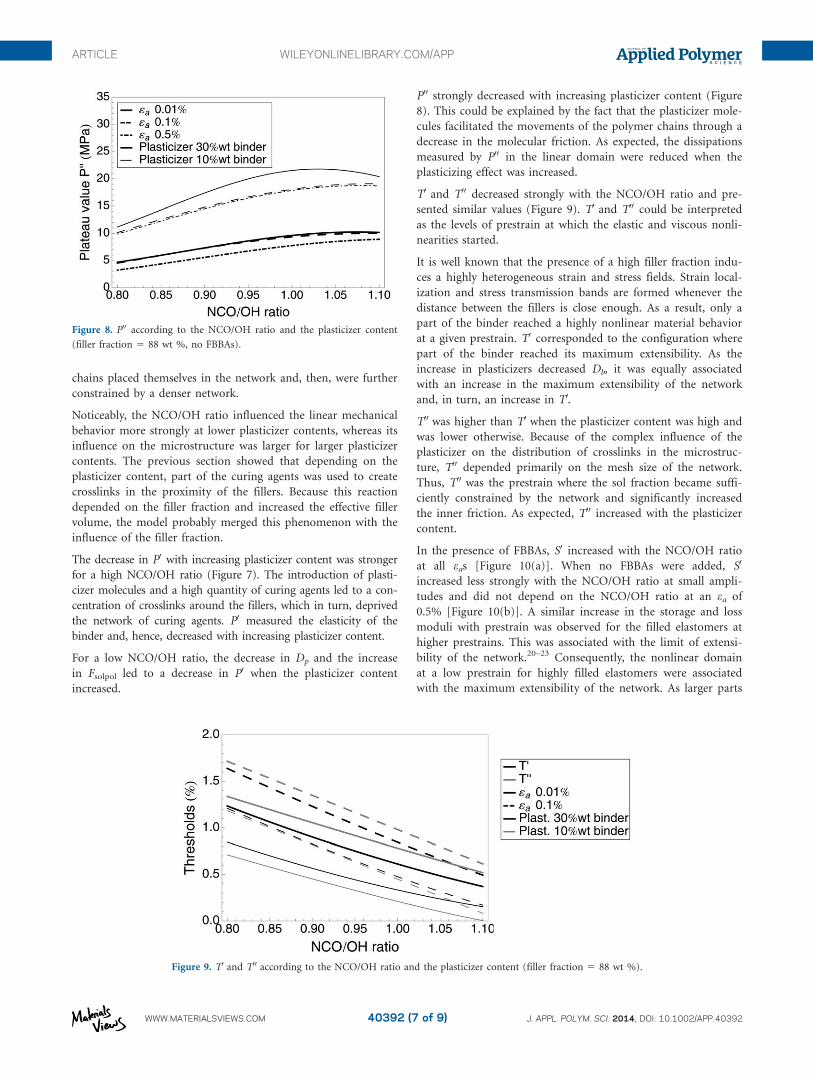
chains placed themselves in the network and, then, were further
constrained by a denser network.
Noticeably, the NCO/OH ratio influenced the linear mechanical
behavior more strongly at lower plasticizer contents, whereas its
influence on the microstructure was larger for larger plasticizer
contents. The previous section showed that depending on the
plasticizer content, part of the curing agents was used to create
crosslinks in the proximity of the fillers. Because this reaction
depended on the filler fraction and increased the effective filler
volume, the model probably merged this phenomenon with the
influence of the filler fraction.
The decrease in P0 with increasing plasticizer content was stronger
for a high NCO/OH ratio (Figure 7). The introduction of plasti-
cizer molecules and a high quantity of curing agents led to a con-
centration of crosslinks around the fillers, which in turn, deprived
the network of curing agents. P0 measured the elasticity of the
binder and, hence, decreased with increasing plasticizer content.
For a low NCO/OH ratio, the decrease in Dp and the increase
in Fsolpol led to a decrease in P0 when the plasticizer content
increased.
P00 strongly decreased with increasing plasticizer content (Figure
8). This could be explained by the fact that the plasticizer mole-
cules facilitated the movements of the polymer chains through a
decrease in the molecular friction. As expected, the dissipations
measured by P00 in the linear domain were reduced when the
plasticizing effect was increased.
T0 and T00 decreased strongly with the NCO/OH ratio and pre-
sented similar values (Figure 9). T0 and T00 could be interpreted
as the levels of prestrain at which the elastic and viscous nonli-
nearities started.
It is well known that the presence of a high filler fraction indu-
ces a highly heterogeneous strain and stress fields. Strain local-
ization and stress transmission bands are formed whenever the
distance between the fillers is close enough. As a result, only a
part of the binder reached a highly nonlinear material behavior
at a given prestrain. T0 corresponded to the configuration where
part of the binder reached its maximum extensibility. As the
increase in plasticizers decreased Db, it was equally associated
with an increase in the maximum extensibility of the network
and, in turn, an increase in T0.
T00 was higher than T0 when the plasticizer content was high and
was lower otherwise. Because of the complex influence of the
plasticizer on the distribution of crosslinks in the microstruc-
ture, T00 depended primarily on the mesh size of the network.
Thus, T00 was the prestrain where the sol fraction became suffi-
ciently constrained by the network and significantly increased
the inner friction. As expected, T00 increased with the plasticizer
content.
In the presence of FBBAs, S0 increased with the NCO/OH ratio
at all eas [Figure 10(a)]. When no FBBAs were added, S0
increased less strongly with the NCO/OH ratio at small ampli-
tudes and did not depend on the NCO/OH ratio at an ea of
0.5% [Figure 10(b)]. A similar increase in the storage and loss
moduli with prestrain was observed for the filled elastomers at
higher prestrains. This was associated with the limit of extensi-
bility of the network.20–23 Consequently, the nonlinear domain
at a low prestrain for highly filled elastomers were associated
with the maximum extensibility of the network. As larger parts
Figure 8. P00 according to the NCO/OH ratio and the plasticizer content
(filler fraction 5 88 wt %, no FBBAs).
Figure 9. T0 and T00 according to the NCO/OH ratio and the plasticizer content (filler fraction 5 88 wt %).
ARTICLE WILEYONLINELIBRARY.COM/APP
WWW.MATERIALSVIEWS.COM J. APPL. POLYM. SCI. 2014, DOI: 10.1002/APP.4039240392 (7 of 9)

of the network reached the limit of extensibility, we observed a
larger storage modulus.
The influence of the NCO/OH ratio on the nonlinear behavior
highly depended on whether the network was linked to the filler
surface or not. Indeed, when the network was not linked to the
filler surface, chain sliding on the filler surface according to
deformation was possible. This mechanism allowed the polymer
network to rearrange and balance the imposed prestrain. As a
result, the increase in the slope with the NCO/OH ratio was
smaller. When the amplitude was high enough, the rearrange-
ment of the network according to deformation was great
enough to prevent the crosslink density from having an influ-
ence on the increase in the modulus with prestrain.
When FBBAs were present, S00 increased with the NCO/OH
ratio at high eas and was constant at a low ea [Figure 11(a)].
When no FBBAs were introduced, the contrary result was
obtained; that is, S00 decreased with increasing NCO/OH ratio
[Figure 11(b)]. (An exception was ea 5 0.1%).
The influence of the NCO/OH ratio on S00 was a combination
of two effects. First, the crosslink density increased, which in
turn, reduced the mesh size of the network and increased the
dissipation. Second, Fsolpol decreased, and the outcome was a
substantial decrease in the dissipation by intermolecular friction.
The chemical connection between the fillers and the binder
determined the prevailing effect. The connection itself depended
on the presence of FBBAs.
When FBBAs were present, the network was linked to the filler
surface and was highly deformed. The sol polymer chains inside
the network represented a smaller fraction of the total polymer
but were more constrained and, hence, produced larger dissipa-
tions. Consequently, S00 increased with the NCO/OH ratio. In
the absence of FBBAs, the network adapted with a strain mech-
anism, and this diminished the constraints on the sol polymer
chains. Because the quantity of Fsolpol decreased with increasing
NCO/OH ratio, the macroscopic outcome was a decrease in S00.This decrease also indicated that chain sliding on the filler sur-
face was not the main dissipation mechanism.
In the presence of FBBAs, S0 decreased with the plasticizer con-
tent at amplitudes higher than 0.01% [Figure 10(a)]. Preswel-
ling the network with plasticizers decreased Db and facilitated
the rearrangement of the polymer chains according to strain. As
a result, the introduction of plasticizers decreased the amount
of highly constrained networks between the fillers at a given
prestrain level and, as a consequence, decreased S0.
Figure 10. S0 versus the NCO/OH ratio and the plasticizer content (filler fraction 5 88 wt %): (a) with FBBAs and (b) without FBBAs.
Figure 11. S00 according to the NCO/OH ratio and the plasticizer content (filler fraction 5 88 wt %): (a) with FBBAs and (b) without FBBAs.
ARTICLE WILEYONLINELIBRARY.COM/APP
WWW.MATERIALSVIEWS.COM J. APPL. POLYM. SCI. 2014, DOI: 10.1002/APP.4039240392 (8 of 9)

In the absence of FBBA, S0 exhibited a small increase with
increasing plasticizer content [Figure 10(b)]. Independently of
the presence or absence of FBBAs, S00 depended only on the
plasticizer content when ea was 0.5% (Figure 11). The complex
influence of the plasticizer molecules on the microstructure jus-
tified these observations. By definition, the main role of plasti-
cizers was to prevent friction between the polymer chains.
However, they also facilitated the concentration of crosslinks on
the filler surface, which in turn, increased the effective filler vol-
ume. Both mechanisms strongly influenced S but could not be
distinguished from each other.
CONCLUSIONS
In this series of experiments, we systematically studied the influ-
ence of the composition on the microstructure and mechanical
behavior of a solid propellant similar to the industrial composi-
tion and containing active fillers. This allowed us to take into
account the actual filler–binder interactions and the influence of
additives such as FBBAs without any assumptions. We imple-
mented a DoE that took into account four factors: the filler
fraction, the presence of FBBAs, the NCO/OH ratio, and the
plasticizer content. A previous article presented the influence of
the filler particles and their interactions with the binder, that is,
the influence of the filler fraction and FBBA factors. The results
concerning the influence of the NCO/OH ratio and plasticizer
content are discussed in this article.
The characterization of the microstructure through the swelling
experiments and GPC showed the complex action of both the
curing agents, quantified by the NCO/OH ratio, and the plasti-
cizer content on the binder. The nonlinear viscoelastic behavior
was determined by PDMA tests. With a phenomenological
model, the nonlinearity of each material was quantified and
processed in the classical frame of the DoEs. The correlation
between the DoE predicted values and the experimental data
was satisfying for all responses, except for T.
The curing agents had three roles: (1) the curing agents reacted
with the active sites of the polymer chains to form a three-
dimensional network, (2) the curing agents also linked the poly-
mer chains in the sol fraction, and (3) the curing agents partici-
pated in the reaction of molecule X with the filler surface.
As expected, the plasticizers molecules preswelled the network
and reduced the molecular friction between the polymer chains.
In addition, plasticizers facilitated the movements of small mol-
ecules into the microstructure. These movements resulted in an
increase in crosslinks at the proximity of fillers when the
amount of curing agents was sufficient.
The results of PDMA were discussed. We took into account the
influence of each factor on the microstructure, and the main
deformation mechanisms were determined. The first article
(AZ1) showed that the high filler packing induced a highly
heterogeneous strain field between fillers. This study provided
further insight into the deformation of the binder. The nonli-
nearity of the behavior originated when the maximum extensi-
bility of the network for the elastic part was reached and
constrained the sol fraction in this extended network for the
viscous part.
ACKNOWLEDGMENTS
The work of one of the authors (A. Azoug) was financially sup-
ported by D�el�egation G�en�erale pour l’Armement (France). The
authors thank Mrs. Amiet (D�el�egation G�en�erale pour l’Armement)
for supporting this project.
REFERENCES
1. Schapery, R. A. Eng. Fract. Mech. 1986,25, 845.
2. Ozupek, S.; Becker, E. B. J. Eng. Mater. Technol. 1992, 114,
111.
3. Ozupek, S.; Becker, E. B. J. Eng. Mater. Technol. 1997, 119,
125.
4. Ravichandran, G.; Liu, C. T. Int. J. Solids Struct. 1995, 32, 979.
5. Jung, G. D.; Youn, S. K.; Kim, B. K. Int. J. Solids Struct.
2000, 37, 4715.
6. Nadot-Martin, C.; Trumel, H.; Dragon, A. Eur. J. Mech. A
2003, 22, 89.
7. Dartois, S.; Halm, D.; Nadot, C.; Dragon, A.; Fanget, A.
Eng. Fract. Mech. 2008, 75, 3428.
8. Xu, F.; Aravas, N.; Sofronis, P. J. Mech. Phys. Solids 2008, 56,
2050.
9. Matou�s, K.; Inglis, H.; Gu, X.; Rypl, D.; Jackson, T.;
Geubelle, P. Compos. Sci. Technol. 2007, 67, 1694.
10. Azoug, A.; Neviere, R.; Pradeilles-Duval, R. M.;
Constantinescu, A. J. Appl. Polym. Sci., to appear.
11. Oberth, A. E.; Bruenner, R. S. J. Polym. Sci. Polym. Phys. Ed.
1970, 8, 605.
12. Azoug, A.; Constantinescu, A.; Pradeilles-Duval, R. M.;
Vallat, M. F.; Neviere, R.; Haidar, B. J. Appl. Polym. Sci.
2013, 127, 1772.
13. Dutta, D. K.; Khastgir, D.; Tripathy, D. K. Plast. Rubber Pro-
cess. Appl. 1989, 12, 1.
14. Varughese, S.; Tripathy, D. K. J. Elastomers Plast. 1993, 25, 343.
15. Desgardin, N.; Chevalier, S.; Grevin, M.Duree de
vie,Technical Report CRB N_ 12/06/CRB/DPS/CRA/DR,
Centre de Recherches du Bouchet, Vert-le-Petit, France,
2006.
16. Ezekiel, M. J. Am. Stat. Assoc. 1929, 24, 99.
17. Medalia, A. I. Rubber Chem. Technol. 1978, 51, 437.
18. Hagen, R.; Salm�en, L.; Stenberg, B. J. Polym. Sci. Part B:
Polym. Phys. 1996, 34, 1997.
19. Sekkar, V.; Narayanaswamy, K.; Scariah, K. J.; Nair, P. R.;
Sastri, K. S.; Ang, H. G. J. Appl. Polym. Sci. 2006, 103, 3129.
20. Busfield, J. J. C.; Deeprasertkul, C.; Thomas, A. G. Polymer
2000, 41, 9219.
21. Dutta, N. K.; Tripathy, D. K. Polym. Test. 1990, 9, 3.
22. Meinecke, E. A.; Maksin, S. Rubber Chem. Technol. 1981, 54, 857.
23. Voet, A.; Morawski, J. C. Rubber Chem. Technol. 1974, 47, 765.
ARTICLE WILEYONLINELIBRARY.COM/APP
WWW.MATERIALSVIEWS.COM J. APPL. POLYM. SCI. 2014, DOI: 10.1002/APP.4039240392 (9 of 9)