Embed Size (px)
Citation preview

Faculty of Landscape Architecture, Horticulture and Crop Production Science
Influence of claw health on fertility and
milk production in dairy cows – An epidemiologic study from farms situated on the Aland
Islands
Carin Ekström
Master´s thesis • 30 hp • Advanced level A2E
Agronom - husdjur
Alnarp 2015

Influence of claw health on fertility and milk production in dairy
cows – An epidemiologic study from farms situated on the Aland
Islands Klövhälsans inverkan på fertilitet och mjölkproduktion hos mjölkkor – En epidemiologisk
studie från gårdar belägna på Åland
Carin Ekström
Supervisor: Christer Bergsten, SLU, Department of Biosystems and
Technology
Examiner: Anders Herlin, SLU, Department of Biosystems and Technology
Credits: 30 hp
Level: Advanced level, A2E
Course title: Självständigt arbete i husdjursvetenskap - masterarbete
Course code: EX0742
Programme/education: Agronom - husdjur
Place of publication: Alnarp
Year of publication: 2015
Cover picture: Carin Ekström
Online publication: http://stud.epsilon.slu.se
Keywords: claw health, lameness, claw lesions, dairy cow, milk production, milk yield,
reproduction, fertility
Faculty of Landscape Architecture, Horticulture and Crop Production Science Department of Biosystems and Technology


Table of Contents
Abstract .................................................................................................................................................................. 2
Sammanfattning .................................................................................................................................................... 3
1. Introduction ................................................................................................................................................... 4
1.1 Aim ......................................................................................................................................................... 4
1.2 Question formulation .............................................................................................................................. 4
1.3 Hypothesis ............................................................................................................................................. 4
2. Literature review ........................................................................................................................................... 5
2.1 Lameness and claw anatomy ................................................................................................................. 5
2.2 Animal welfare........................................................................................................................................ 7
2.3 Fertility ................................................................................................................................................... 8
2.4 Milk production ..................................................................................................................................... 10
2.5 Economy .............................................................................................................................................. 12
3. Material and Method ................................................................................................................................... 14
3.1 Claw health protocols ........................................................................................................................... 14
3.2 Animals and participating farms ........................................................................................................... 15
3.3 Statistical analysis ................................................................................................................................ 16
4. Results ......................................................................................................................................................... 17
4.1 Claw health .......................................................................................................................................... 17
4.2 Reproduction ........................................................................................................................................ 18
4.3 Milk production ..................................................................................................................................... 21
5. Discussion ................................................................................................................................................... 24
5.1 Milk production ..................................................................................................................................... 25
5.2 Reproduction ........................................................................................................................................ 26
5.3 Study design ........................................................................................................................................ 26
6. Conclusion .................................................................................................................................................. 28
7. References .................................................................................................................................................. 29
Acknowledgements ............................................................................................................................................. 33
2
Abstract
Lameness and claw lesions are frequent health problems observed among dairy cows and are a
common reason for culling, reduced milk production and reproductive inefficiency. The present study
investigated the association between claw health, reproduction and milk production of dairy cows at
the Aland Islands in order to gain an understanding of the current situation. The study included data
from 17 farms during the years 2013 and 2014 regarding claw health, reproduction, milk production
and housing system. Five of the herds kept the cows in free stalls and 12 herds kept the cows in tie-
stalls.
The recorded claw lesions were divided into infectious diseases and laminitis related diseases.
Dermatitis, digital dermatitis, heel horn erosion, interdigital hyperplasia, wart growth, and interdigital
phlegmone were considered as infectious diseases. Sole hemorrhage, sole ulcer, double sole, white
line fissure, toe abscess, white line abscess and chronic laminitis, on the other hand, were considered
as laminitis related diseases. Each disease was given a severity score depending on its clinical severity.
The higher the total score a cow got the worse were the claw health. In the statistical analyses all
trimming sessions for each cow were compared so that only the most severe score was used. This
resulted in each cow having a maximum score for infectious diseases (maximum infectious point,
MIP), a maximum score for laminitis related diseases (maximum laminitis point, MLP) and a
maximum score for these two added together (maximum total point, MTP). Five parameters were
studied in order to evaluate the effect of claw health on reproduction and milk production; number of
services (inseminations), interval from first service to last service (IFLS), interval from calving to last
service (ICLS), calving interval (CI) and mean ECM production.
Fifty per cent of the total number of trimmed cows during 2013 had no recorded claw lesions; the
same number in 2014 was 52 %. No significant correlations between year of production and MIP,
MLP and MTP could be observed. Laminitis related diseases were more common on all farms
compared to infectious diseases and a difference in the prevalence of both laminitis related diseases
and infectious diseases could be observed between farms. There were significantly more infectious
diseases on farms with free stall systems compared to farms with tie-stalls during both years (P=0.000
and P=0.016). A significant difference in the occurrence of laminitis related diseases between the claw
trimmers was found. There were no significant differences between tie-stalls and free stalls herds
concerning number of services, IFLS, ICLS, CI and mean ECM production. Average ECM production
was not affected by an increase in MTP, MIP or MLP and there were no tendencies for more services,
longer ICLS or longer CI with increased MTP. There was however a tendency towards a positive
correlation between IFLS and MTP.
The anecdotal evidence that dairy cows on the Aland Islands have better claw health than their
counterparts in Sweden can neither be proved nor rejected based on the results from this study. The
present study was an epidemiologic study, to draw conclusions about cause - effect relationships are
therefore impossible. However, the results from this study can hopefully be a base in the future works
towards a better claw health status at the Aland Island.
3
Sammanfattning
Hältor och skador i klövarna är hälsoproblem som ofta uppmärksammas hos dagens mjölkkor. Studier
i ämnet rapporterar om försämrad mjölkproduktion, försämrad reproduktiv förmåga samt ett ökat antal
utslaktningar i samband med klövproblem. För att få en uppfattning om den nuvarande situationen på
Åland undersökte den här studien sambandet mellan klövhälsa, mjölkproduktion och reproduktion hos
17 gårdar. Data hämtades från åren 2013 och 2014. Fem av gårdarna hade lösdrift med liggbås och 12
av gårdarna hade uppbundna kor.
För att underlätta de statistiska analyserna delades de registrerade klövsjukdomarna upp i två grupper;
smittsamma klövsjukdomar och fångrelaterade klövsjukdomar. Dermatit (lindrig), digital dermatit,
klövröta, limax, vårta och klövspaltsinflammation ansågs vara smittsamma sjukdomar medan
sulblödning, klövsulesår, dubbelsula, hålvägg/separation vita linjen, tåböld, sår/böld i vita linjen och
fångbrytning ansågs vara fångrelaterade sjukdomar. Varje klövsjukdom tilldelades en poäng beroende
på hur kliniskt allvarlig den var. Ju högre poäng en ko fick, desto sämre var klövhälsan. Poängen för
varje klövverkningstillfälle jämfördes så att endast den högsta poängen för varje ko användes i de
statistiska analyserna. Detta resulterade i att alla kor fick en maxpoäng för smittsamma sjukdomar
(MIP) och en maxpoäng för fångrelaterade sjukdomar (MLP). Dessa två adderades så att alla kor
också fick en total maxpoäng (MTP). För att undersöka om klövhälsan hade någon effekt på
reproduktion och mjölkproduktion undersöktes fem parametrar; antal insemineringar, intervallet från
första inseminering till den sista (IFLS), intervallet från kalvning till den sista insemineringen (ICLS),
kalvningsintervall (CI) och den medelsnittliga ECM produktionen.
I studien var 50 % av alla kor friska och utan några rapporterade klövskador år 2013 och 2014 var
siffran 52 %. Studien kunde inte finna någon signifikant korrelation mellan produktionsår och MIP,
MLP och MTP. Fångrelaterade klövsjukdomar var generellt mer vanligt förekommande på gårdarna
än smittsamma sjukdomar och det fanns en stor skillnad i förekomst av både smittsamma och
fångrelaterade klövsjukdomar mellan gårdarna. Korna på gårdarna med lösdrift hade signifikant mer
smittsamma klövsjukdomar båda åren (P=0.000 och P=0.016) jämfört med de gårdarna där korna stod
uppbundna. Det fanns en signifikant skillnad i förekomst av fångrelaterade sjukdomar mellan de tre
klövvårdarna som deltog i studien. Det fanns ingen skillnad i antal insemineringar, IFLS, ICLS, CI
och medelsnittlig ECM produktion mellan gårdar med lösdrift och uppbundet. Den medelsnittliga
ECM produktionen påverkades inte av ökade MIP, MLP eller MTP. Inte heller fanns det någon
tendens för ett ökat antal insemineringar, längre ICLS eller längre CI då MTP ökade. Dock fanns det
en tendens till en liten positiv korrelation mellan IFLS och MTP.
Uppgifter om att mjölkkor på Åland har bättre klövhälsa än deras motsvarigheter i Sverige kan varken
bevisas eller förkastas på baserat på resultaten från denna studie. Detta var en epidemiologisk studie så
det är inte möjligt att dra slutsatser om orsak och verkan. Dock kan studien förhoppningsvis fungera
som stöd i det fortsatta arbetet för en förbättrad klövhälsa på Åland.

4
1. Introduction The modernization and intensification of the agricultural industry has led to increased herd sizes and
higher milk production (Capion et al., 2008; Tike, 2013; SCB, 2014) thereby putting high demands on
the animals producing within the systems. One of the most pronounced differences nowadays
compared to some decades ago is the new demands arising when transferring dairy cows from tie-stall
barns to free stall systems. A major difference between the two housing systems is that cows in the
free stall system have to move around in order to find feed and water and to be milked. This is, on the
other hand, not necessary or possible in a tie-stall barn. The increased demand for mobility in
combination with concrete floors and manure, affects the claw and leg health (Bergsten & Pettersson,
1992; Bergsten, 2001). Today, lameness and claw lesions have emerged as a frequent health problem
among dairy cows (Warnick et al., 2001; Manske et al., 2002a; Capion et al., 2008) and are common
reasons for culling (Sprecher et al., 1997; Rajala-Schultz & Gröhn, 1999).
Lameness is, according to Hedges et al. (2001), a disease that is associated with several risk factors
such as nutrition, environment and management. Research suggests that a lame cow will produce less
milk (Warnick et al., 2001; Green et al., 2002; Onyiro et al., 2008). In addition, oestrus detection is
expected to become more difficult and lame cows are likely to experience reproductive inefficiency by
having a longer interval between calving and conception and thus longer calving intervals (Lucey et
al., 1986a; Collick et al., 1989; Sprecher et al., 1997). Even though claw problems are considered a
major health concern research indicates that the occurrence of claw lesions can differ widely between
herds (Barkema et al., 1994; Enting et al., 1997; Hedges et al., 2001; Manske et al., 2002a). This
difference has also been noted by professional claw trimmers going to the Aland Islands and anecdotal
evidence suggests that dairy cows on the Aland Islands have a superior claw health compared to their
counterparts in Sweden.
1.1 Aim
The aim of this study is to analyze the claw health in association with reproduction and milk
production of dairy cows at the Aland Islands in order to gain an understanding of the current
situation.
1.2 Question formulation
What interactions exist between reproduction, milk production and claw health on dairy farms at the
Aland Islands? Do dairy cows on the Aland Islands have better claw health than dairy cows in
Sweden?
1.3 Hypothesis
The cows have in general good claw health, but cows with impaired claw health will have lower milk
production and inferior reproduction results compared to cows with better claw health.

5
2. Literature review
2.1 Lameness and claw anatomy
It is important to have a general understanding of claw anatomy in order to realize why lameness and
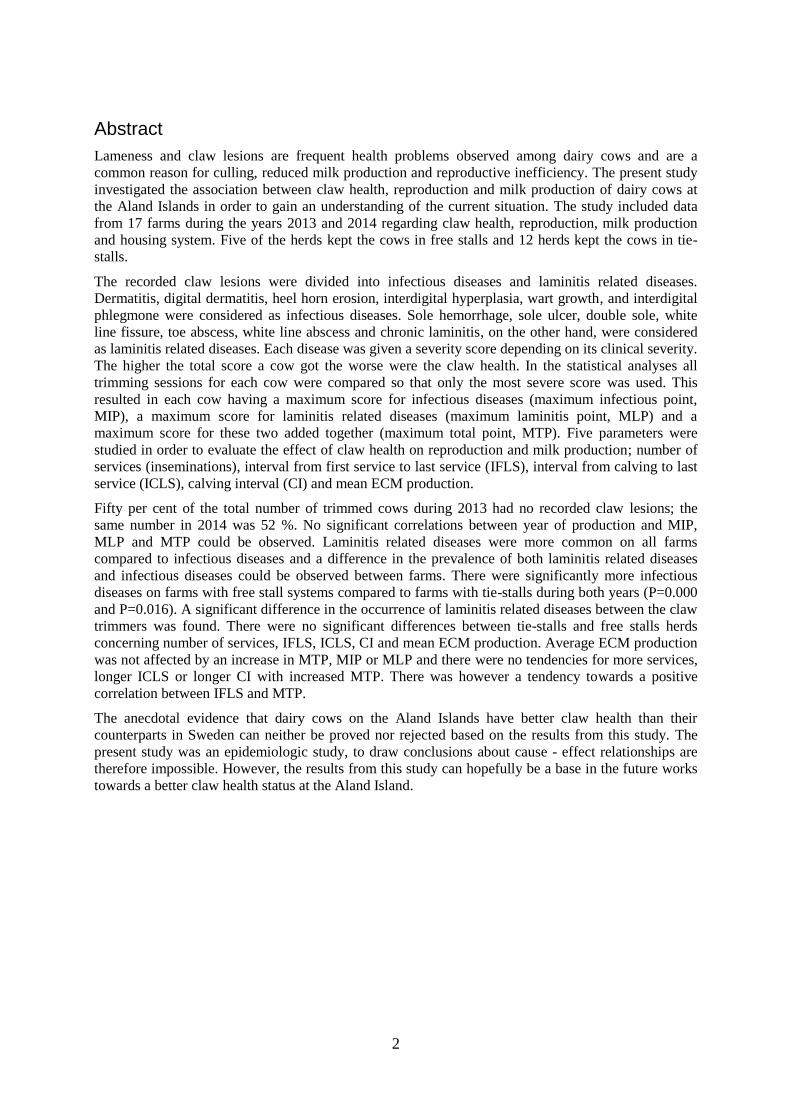
claw problems occur. Figure 1 shows the claw from below. The claw is surrounded by the wall, sole
and bulb (heel) and their main function is to protect the foot from external stress when moving in
different environments. When the cow is standing the weight of the body is mainly carried by the claw
wall and not by the sole. The white line is located between the sole and the wall (see Figure 1). The
white line consists of younger material than the wall and is therefore more vulnerable to external
forces. Damage to the white line is especially common at the very back of the claw i.e., at the posterior
wall. This is because the bulb is moving considerably when the cow is walking and this puts high
pressure on the white line at the transition to the older wall material (Manske et al., 2002b).
The growth of the claw is a result of proliferation and keratinization of cells (MacCallum et al., 2002).
The growth of the wall starts at the coronary band and is illustrated in Figure 2. The claw wall will
grow about 4-6 mm/month (Offer et al., 2000; Manske et al., 2002b). The lamellar horn originates
from the lamellar corium and can be recognized as the lamellar ring or white line. The sole and bulb
also grows from their respective corium. The toe angle between the floor and the claw wall should be
Figure 1: Anatomy of the claw. Photo: Carin Ekström.

6
45°-50° (see Figure 2) and the wear of the claw should ideally be equal to the growth of the claw
(Manske et al., 2002b; Huxley et al., 2012). However, especially in free stall systems, the different
characteristics of concrete floors influence the wear and this can result in an improper toe angle. The
sole is often exposed to a moist environment making it softer and more sensitive to different kinds of
trauma compared to the claw wall. Since the wall horn in the toe is harder than the bulb horn and the
stress and the wear is greater at the bulb, the toe will be extended and the toe angle becomes shallower.
The result is an overgrown claw, which is more sensitive to sole ulcers that can arise when the pedal
bone pushes towards the sole (see Figure 2). Excessive wear of the wall can, on the other hand, result
in the sole also becoming weight bearing and thereby creating pressure points that will increase the
risk of injuries (Manske et al., 2002b; Telezhenko et al., 2009).
When the cow is walking she will carefully examine the ground in front of her in order to avoid
placing the front feet on any obstacles. A cow with a normal gait will move with long strides and place
the hind foot at the same spot as the front foot. The cow cannot see where she places the hind feet so
this is a precautionary measure to avoid injuries. The cow will walk with a straight back and will have
an even weight bearing between the left and right feet (O´Callaghan, 2002; Huxley et al., 2012). If a
cow becomes lame the stride length will be shortened and the hind feet will no longer be placed in the
same track as the forefeet (tracking up). The head will bob up and down and the back will be arched
(Sprecher et al., 1997; Flower & Weary, 2009).
Bergsten (2001) defined lameness as an anomaly in the locomotor system while O´Callaghan (2002)
in a similar way defined lameness as a condition which the animal exhibits by not being able to walk
normally. The underlying cause may be a claw disorder or some kind of painful process in the limb
(Murray et al., 1996; Bergsten et al., 2001). Studies have shown that the occurrence of lameness can
differ greatly between farms. Warnick et al. (2001) reported that 40 and 52 % of the cows were treated
for lameness at least once on the two farms included in the study. Barkema et al. (1994) demonstrated
a significant difference in incidence of lameness between the participating farms ranging from 9.3 to
49.2 % while Enting et al. (1997) reported an average lameness incidence of 21 %. Green et al. (2002)
reported that more than 70 % of the cows were diagnosed lame at least once during the study. Also,
the lameness prevalence was 5.1 % in a study by Manske et al. (2002a). However, 72 % of the cows
experienced a minimum of one claw lesion meaning that the majority of the claw lesions did not cause
lameness.
Lameness is considered a multifactorial disease because there are many underlying factors that are
contributing when a cow becomes lame (Vermunt, 2005). Manske et al. (2002a) and Capion et al.
(2008) therefore suggest that it may be advantageous to divide the underlying factors into cow-level
and herd-level factors. One example of a cow-level factor is the individual milk production of each
cow. There are evidence proving the existence of an unfavorable genetic correlation between health
traits and production traits (Pryce et al., 1998) and this is also true for milk production since it is
positively correlated to a high incidence of lameness (Hansen et al., 1979). This means that breeding
Figure 2: Illustration of the cross section of a claw. Modified from Hulsen (2011).
Claw angle
Claw growth

7
for higher milk production has brought about a higher incidence of lameness (Onyiro et al., 2008).
However, the exterior of the cow is also of importance since studies have shown that for example
sickled legs are related to poorer locomotion (Onyiro and Brotherstone, 2008).
Age and stage of lactation are other cow-level factors. Several studies have demonstrated that the
highest lameness incidences were revealed during the first months of lactation (Collick et al., 1989;
Barkema et al., 1994; Offer et al., 2000; Warnick et al., 2001; Green et al., 2002) and that older cows
had a higher incidence and prevalence of lameness (Barkema et al., 1994; Warnick et al., 2001;
Bicalho et al., 2007; Onyiro et al., 2008). Body weight is also considered to be a cow-level factor.
Onyiro et al. (2008) demonstrated that cows with lower body weight had more locomotion problems.
Also the body condition score (BCS) was correlated to locomotion problems and cows with a high
BCS had higher locomotion scores (Onyiro et al., 2008).
Herd-level factors include factors such as season of the year, feeding and housing system. Onyiro et al.
(2008) demonstrated that cows receiving a high concentrate/low forage ration and were housed
throughout the year had higher lameness scores compared to cows receiving a low concentrate/high
forage ration and that had access to pasture during the summer. Somers et al. (2003) and Onyiro and
Brotherstone (2008) demonstrated in agreement with Onyiro et al. (2008) that cows having access to
pasture and cows housed in straw yards suffered less from claw problems compared to cows housed
on concrete floors. Pasture has also been shown to improve the gait of lame cows while the gait of
cows housed on concrete floors tended to be stable or impaired (Hernandez-Mendo et al., 2007).
However, a large proportion of today’s dairy cows are housed on concrete floors. According to
Bergsten (2001), the floors must not be too slippery, hard or dirty in order not to compromise the
health of the claws and legs. Rubber floors can provide a better comfort and is preferred by the cows
(Telezhenko et al., 2007).
Approximately 90 % of the lameness cases in cattle originate from claw lesions (Murray et al., 1996;
O´Callaghan, 2002) and occur more often in the hind feet (Murray et al., 1996; O´Callaghan, 2002;
Barkema et al., 2004). However, as mentioned earlier, claw lesions do not always result in lameness
(Logue et al., 1994; Manske et al., 2002a). Globally, the most common causes for lameness are sole
ulcer, white line disease, digital dermatitis, and foul-in-the-foot. However, the impact of these
disorders varies between countries and management systems (Barkema et al., 2004; Huxley et al.,
2012). Cows housed in a free stall system have to move around to find feed and water but this is not
necessary in a tie-stall barn. This means that all claws of cows in a free stall system are exposed to the
same environment. The claws of cows in a tie-stall system, on the other hand, are exposed to quite
different environments (Sogstad et al., 2005). There is evidence that cows housed in free stalls suffer
from a higher incidence of lameness and claw lesions compared to cows in a tie-stall housing system
(Hultgren, 2002; Cramer et al., 2008).
2.2 Animal welfare
Changes in behavior are used in both research and in animal production practice as common signs of
pain and discomfort in animals (O´Callaghan, 2002). Both Singh et al. (1993) and Hassall et al. (1993)
could see that cows suffering from lameness changed their behavior. Therefore, and because of the
high incidence and the pain associated with the disorder, lameness is considered to be an animal
welfare issue (Hernandez et al., 2002). Singh et al. (1993) conducted a study in which the behaviors of
lame and healthy cows were compared. The study included 10 lame and 10 healthy cows; 15 cows
were housed in cubicles and five of the healthy cows were housed in a straw yard. The researchers
observed the cows every 15 min for 24 hours and this procedure was repeated three times. The
observed behaviors were total time spent for rumination, standing and lying. Eating time as well as the
number of times the animal lied down and the maximum lying period, both for 24h, were included.
Healthy cows housed in free stalls lay down significantly shorter than their herd mates in the straw
yard system. Also, the healthy cows in cubicles lay down shorter than the lame cows. The lame cows
were standing with arched backs and repetitively changed which leg they put weight on resulting in
abnormal standing behaviors. The researchers concluded that the cows seemed to minimize pain by
8
changing posture. This suggests that lameness is a matter of serious concern from an animal welfare
perspective (Singh et al., 1993). Juarez et al. (2003) reported that the percentage of cows lying down
increased, that the cow stayed in a shorter distance of the pen exit and that the time taken to move
from the milking parlor increased with increasing locomotion scores in their experiments. The results
of the study by Hassall et al. (1993) showed that lame cows entered the milking parlor later, lay down
for longer periods of time and grazed for shorter periods of time compared to healthy herd mates. The
cows changed their behavior to such a great extent that Hassall et al. (1993), in agreement with Singh
et al. (1993), wanted to emphasize that lameness truly is an animal welfare problem.
Cows are believed to hide the signs of pain and discomfort because this is a part of their natural
behavior. However, this might result in the farmer having difficulties detecting lame cows
(O´Callaghan, 2002). Wells et al. (1993) performed an epidemiologic study in which farmers were
asked to estimate the prevalence of lameness on their farms. The researchers then scored the cows and
this number was compared to the prevalence estimated by the farmers. The prevalence estimated by
the farmers proved to be 2.5 times lower than the prevalence obtained by the investigators. Also Whay
et al. (2002) performed a study in which the perception of lameness was evaluated in a similar manner.
Whay et al. (2002) also concluded that the farmers underestimated the prevalence of clinical lameness
on their farms; the farmers reported a prevalence of about 5 % while the observer found an average
prevalence of about 22 %. The fact that farmers do not recognize most lameness cases poses a great
risk that numerous cases of mild or moderate lameness remains undetected (Wells et al., 1993) and
that lame cows therefore are less likely to get the treatments they need (Whay et al., 2002). However,
research has found that cows change their feeding behavior two weeks before becoming lame and this
may be used as a tool for monitoring lameness in the future (Norring et al., 2014).
Culling is the fate of many lame cows. According to Rajala-Schultz and Gröhn (1999) culling caused
by diseases can be categorized as involuntary culling while voluntary culling is the act of removing a
cow from the herd because of for example a low milk yield or bad temper. Lame cows are more likely
to be culled than non-lame cows (Rajala-Schultz and Gröhn, 1999) and this has been demonstrated by
several studies. Rajala-Schultz and Gröhn (1999) reported that cows treated for foot and leg problems
in the beginning of lactation had a six times greater risk of being culled than healthy cows. A cow had
a 12 times higher risk of being culled if she was treated for foot and leg problems during the second
month of lactation compared to a healthy cow. A study by Melendez et al. (2003) included one group
of lame cows and one control group. The researchers reported that 30.8 % of the cows in the lame
group left the herd whilst 5.4 % of the cows from the control group were culled before any
reproductive event was recorded. Collick et al. (1989) found that almost 16 % of the lame cows were
culled compared to about 5 % of the control cows while Sprecher et al. (1997) concluded that there is
an 8.4 times higher risk of the cow being culled if she receives a lameness score >2 compared to a cow
receiving a lameness score of ≤ 2.
2.3 Fertility
The effects of lameness on fertility have been studied for several decades. Weaver (1985) mentions
infertility as a result of lameness as a plausible cause of economic loss for the British dairy farmers.
According to Weaver (1985) a cow suffering from lameness will spend longer time lying and be less
eager to mount other cows making estrus detection more difficult resulting in a longer interval
between calving and conception.
Back in the 80´s both Lucey et al. (1986a) and Collick et al. (1989) conducted studies in which the aim
was to investigate the effect of lameness on fertility. The study by Lucey et al. (1986a) included 770
cows and 1491 lactations from calvings occurring between July 1977 and June 1982. Collick et al.
(1989) on the other hand included 17 herds in the Somerset area during the housing period from
October to April. Both studies included Friesian, Holstein and Ayrshire cows and cross breeds thereof.
Lucey et al. (1986a) divided the lesions into four groups depending on where the affected areas were
located: heel, wall/coronary band, interdigital cleft and sole/white line. Also Collick et al. (1989)

9
divided the cause of lameness into groups. These groups were interdigital diseases, digital diseases and
sole ulcers.
Both studies could demonstrate that the intervals between calving to first service and between calving
and conception were affected by lameness. The calving to first service interval increased by seven
(Lucey et al., 1986a) and four days (Collick et al., 1989). The interval between calving and conception
increased by 11 (Lucey et al., 1986a) and 14 days (Collick et al., 1989) in cows diagnosed with
lameness. The timing of when lameness struck and the type of lesion proved to be of importance.
Lesions in the interdigital cleft arising 36 to 70 days postpartum resulted in a significantly longer
calving to first service interval. Cows diagnosed with sole or white line lesions had a 17 days longer
calving to first service interval and 30 days longer calving to conception interval when the lesion
occurred in the same time period (36 to 70 d postpartum; Lucey et al., 1986a). Cows suffering from
lameness needed more services per conception (2.14 vs. 1.72) and had a lower pregnancy rate at first
service (45.9 vs. 56.3 %) compared to the control cows (Collick et al., 1989).
In a study by Sprecher et al. (1997) a five point lameness scoring system was introduced. In this
system the best score (score one, normal) was given to a cow that walked with a normal gait and had a
leveled back when standing still. The most severe score (score five, severely lame) was given to a cow
that was reluctant to put weight on one or several feet. The study aimed at predicting the reproductive
performance of the cows using this lameness scoring system. The study was conducted on one farm
and included in total 66 cows. The researchers concluded that lameness increased the difficulty of
estrus detection. Sprecher et al. (1997) demonstrated, in accordance with Lucey et al. (1986a) and
Collick et al. (1989), that a cow with lameness score >2 were likely to have a prolonged interval
between calving and first service and between calving and conception. As a result, the cow needed
more services to enter gestation (Sprecher et al., 1997).
Also Barkema et al. (1994) investigated the effect of lameness on fertility and found similar results as
reported by Lucey et al. (1986a), Collick et al. (1989) and Sprecher et al. (1997). The study included
13 commercial dairy farms with an average herd size of 64 cows. Information about milk production,
reproduction, culling and lameness were collected by veterinarians and the farmers. The study
included a control group of 1798 lactations from cows that were not lame and 637 lactations from
cows reported lame. Compared to the control group, the interval from calving to first service was 2.9
and 4.6 days longer when the cow was lame in a hind- or fore leg respectively. However, despite the
results, the researchers concluded unlike Lucey et al. (1986a), Collick et al. (1989) and Sprecher et al.
(1997), that lameness only had a limited effect on reproduction (Barkema et al., 1994). Bicalho et al.
(2007) also conducted a study investigating the calving to conception interval. Bicalho et al. (2007)
concluded that the interval was significantly prolonged in cows suffering from lameness during the 70
first days of lactation.
The intervals between calving and first service and calving and conception is, however, not the only
things to consider. Melendez et al. (2003) conducted an epidemiologic study in order to investigate the
relationship between postpartum lameness and the occurrence of ovarian cysts. The researchers
assumed that cows suffering from lameness postpartum would also suffer from an increased incidence
of ovarian cysts compared to healthy cows. The study included in total 195 cows; 65 cows had been
diagnosed with lameness within 30 days postpartum and 130 cows served as controls and had never
been lame. The cows were housed on a commercial farm holding 3000 dairy cows with an average
production of 10,500 kg per cow and year. Except for ovarian cysts, the study also examined the
calving to first service interval, the pregnancy rate and conception rate at first service. The study found
that the control cows were 4.22 times more likely to become pregnant after the first service compared
to the lame cows. Also, the risk of a cow developing ovarian cysts before the first service was 2.63
times greater if she was lame 30 days postpartum. The authors concluded that lameness within 30 days
after calving resulted in inferior fertility, that the cow was less likely to conceive and that the
incidence of ovarian cysts increased compared to healthy cows (Melendez et al., 2003).
Garbarino et al. (2004) investigated the association between lameness and delayed ovarian cyclicity
during 60 days postpartum and the number of days to first luteal phase. The study included 238
Holstein cows from a commercial dairy farm using estrus synchronization. The cows were reported as
10
lame, moderately lame or not lame according to the system introduced by Sprecher et al. (1997) with a
few modifications. Garbarino et al. (2004) reported that delayed cyclicity was more common among
cows that were lame (17 %) or moderately lame (14 %) compared to non-lame cows (6 %). The
interval between calving and first luteal phase was longer among moderately lame and lame cows
compared to cows that were not lame. The authors concluded that lameness do have a negative effect
on the ovarian cyclicity, at least in Holstein cows during the first 60 days postpartum. If lameness had
been prevented could the delay in ovarian cyclicity have been reduced by 71 % (Garbarino et al.,
2004).
2.4 Milk production
The effect of lameness on milk production is of great interest and has consequently been studied by
several researchers. The results of the studies are not, however, all in agreement with each other. As
mentioned earlier, Barkema et al. (1994) also collected information about milk production. Barkema et
al. (1994) concluded, in accordance with Hultgren et al. (2004), that milk production was not
decreased by lameness. On the other hand, cows suffering from sole ulcers actually had a higher 100-
day in milk (DIM) production (77 kg) and 270-DIM production (171 kg) compared to the control
cows. No other lameness diagnoses resulted in any difference in milk production. However, Barkema
et al. (1994) concluded that the study would benefit from daily measurement of milk production and
calculations of the deviation from the lactation curve.
Also Dohoo and Martin (1984a) could find an effect of foot problems on milk production. The aim of
the study was to estimate the effect of several diseases on milk production and reproduction by using a
path model developed in Dohoo and Martin (1984b). The study included records from 2875 lactations
from 2008 Holstein-Friesian cows. The researchers concluded that foot problems resulted in an
increased milk production of 1.6 % per day of life. However, they could not explain what was causing
this large positive effect on milk production due to the epidemiologic study design (Dohoo & Martin,
1984a).
There are however a greater number of studies demonstrating a negative effect of lameness on milk
production. Lucey et al. (1986b) were able to demonstrate a significant decrease in milk yield (1.1
kg/day) one week before and after lameness was clinically diagnosed. Also, Green et al. (2002) could
see a reduction in yield long before lameness was diagnosed. Green et al. (2002) conducted a study in
which the objective was to investigate the relationship between lameness and milk production. The
study included data from 900 Friesian/Holstein cows that were housed on five farms in the UK during
1997 to 1999. Test day-milk yields were recorded for each cow once every month and were included
in the study. The farmers detected clinical lameness that was treated and diagnosed by veterinarians.
The researchers reported that more than 70 % of the cows were lame at some point during the study
period. A reduction in milk yield in cows identified as lame could be seen as early as four months
before the lameness was even diagnosed. The study demonstrated that this reduction in milk yield
could continue until five months after the cow had been treated.
Green et al. (2002) estimated that the total reduction in milk yield was 357 kg (range 160 to 550 kg)
during a 305-day lactation if the cow became lame in the fifth month of lactation. However, in
accordance with Barkema et al. (1994) and Hultgren et al. (2004) this study also identified cows with a
higher yield than average to be more prone to develop lameness compared to cows with a lower milk
yield. Green et al. (2002) believed that this was due to the fact that high yielding cows experienced a
negative energy balance and must stand for long times in order to consume enough feed. The benefit
of a high producing cow will be lost if she becomes lame because of the reduction in milk production.
The farmer must therefore either take extra good care of high yielding cows or, if this is not possible,
aim for a lower average production. The researchers concluded that the reduction in milk yield varied
between farms, but that a clinically lame cow is likely to produce less milk than her potential (Green et
al., 2002).
By using records from two commercial New York dairy farms Warnick et al. (2001) also investigated
the effect of lameness on milk production. The participating farms housed mostly Holstein cows and

11
both farms used recombinant bST (growth hormone). On one farm lameness was identified as severe,
moderate or mild and both diagnosed and treated by the farm staff. On the other farm claw lesions
were diagnosed either by the farm staff or by a professional claw trimmer. The study included in total
2520 cows of which more than two-thirds were entering their first or second lactation. Milk production
was recorded weekly as a total daily milk production. Of the cows included in the study, 52 % in the
first herd and 40 % in the second herd received lameness treatment at least once during the study. The
study revealed that lameness was significantly more prevalent in older cows and that lameness had a
negative impact on milk production. Lameness resulted in a significant decrease in milk yield on both
participating farms. The daily milk yield decreased by 1.5 kg/d during the second week and thereafter
as from the lameness diagnosis on the first farm. On the second farm the reduction in milk yield of
lame cows was slightly smaller, 0.8 kg/d during the first two weeks after diagnosis and 0.5 kg/d during
the third week and thereafter. Different diagnoses affected the milk yield to various degrees. On the
first farm sole ulcers and abscesses had a greater negative impact on the drop in milk production and
its duration compared to cows diagnosed with foot warts (digital dermatitis), foot rot or healthy cows.
A similar pattern was revealed on the second farm, however, sole ulcers and abscesses tended not to
have as long and large effect on the milk yield as foot rot.
Rajala-Schultz et al. (1999) conducted a study in which the aim was to explore the effects of lameness
as well as ketosis and milk fever on milk production. The study included 23,416 Finnish Ayrshire
cows and test day milk production data was collected once every month. The researchers reported a
decrease in milk yield among cows suffering from lameness. However, the magnitude of the effect of
lameness on milk yield varied depending on lactation number. Cows in their first lactation experienced
a significant decrease in milk production starting already two weeks before the cow actually was
diagnosed as lame. The decrease in production continued throughout the entire lactation resulting in a
loss of 1.0-1.6 kg/d during different stages of lactation. The study did identify a decrease in production
during the second lactation; however, this decrease was not significant. During the third lactation the
decrease was greatest 15-28 days after diagnosis, resulting in a significant decrease of 2.2 kg/d. Cows
entering their forth or later lactation also experienced a significant decrease two weeks before the cow
was diagnosed with lameness. The significant reduction in milk yield continued for another six weeks
and ranged between 1.7-2.8 kg/d. In conclusion, lameness had a detrimental effect on milk production
in this study and cows in their first lactation were affected the most.
By using locomotion scores, based on the system introduced by Sprecher et al. (1997), Juarez et al.
(2003) investigated how lameness influenced the behavior and milk production of multiparous
Holstein cows. The study consisted of two experiments; experiment 1 and experiment 2 that were
performed on two different farms. During experiment 1 milk production data was collected. The cows
were housed in four pens, two close to the milking parlor (38 m) and two further away from the parlor
(121 m). Behavioral data were collected and consisted of the return time from the parlor after milking,
if the cow was standing, walking or lying in the pen and the cow location inside the pen (close to the
exit or not). The second experiment was conducted in a similar way as the first experiment but was
repeated two times. The cows were housed in three pens located 34, 64 and 94 m from the milking
parlor. The researchers did not find a difference in milk production or protein and fat yields between
locomotion scores and distance from the parlor in experiment 2. In experiment 1, on the other hand,
there was a decrease in milk and protein production with increasing locomotion score. Juarez et al.
(2003) recognized season and different feeding schedules as factors that could affect the results
obtained in the study.
In a more recent study Onyiro et al. (2008) aimed at explaining the association between locomotion
scores and milk production and how lameness influenced the shape of the lactation curve. The study
included 248 cows that were divided into two management groups. One group was fed a low-forage,
high-concentrate ration. The cows in the other group had the opportunity to graze for 7 months and
their ration included at least 75 % DM forage. The system for locomotion scoring the cows was based
on five scores. A cow given score one were considered normal and a cow given score five found it
difficult to turn around. First lactation cows were considered to be one group and older cows (lactation
2, 3, 4 and 5) were one group when the analysis was performed. The researchers found that cows that
become lame during the 60 first days of lactation had a higher milk production than healthy cows
12
during this period. However, the cows were not able to continue producing more milk during the rest
of the lactation and the total milk yield did therefore not differ between healthy cows and cows being
lame during the first two months of lactation. The healthy cows therefore had a more persistent
lactation. Onyiro et al. (2008) explained that the increased milk yield among lame cows was due to the
fact that high milk production was associated with higher locomotion scores and we should therefore
not misinterpret these results and breed for inferior claw health to achieve higher milk production.
There are also studies that could not find any effect of lameness on milk yield. Cobo-Abreu et al.
(1979) used a university herd to investigate the effect of several diseases on milk production as well as
calving interval and culling. The study did find a small reduction in milk production among cows
suffering from foot problems resulting in a lower than average life time milk yield. However, this
reduction was not significant (Cobo-Abreu et al., 1979). Martin et al. (1982) included 18 farms
holding purebred Holstein cows in a study in order to recognize diseases that increased the risk of
culling. Even though the effect of the investigated diseases on milk production was not described in
detail the researchers did not find a significant effect of foot problems on milk yield.
2.5 Economy
Diseases are considered to have a negative impact on farm economy. According to Kossaibati and
Esslemont (1997) the costs for diseases could be divided into two different parts; direct and indirect
costs. Costs involved with low milk yield, more working hours and medication are examples of direct
costs. Longer calving intervals, extra services, greater risk for culling and other health problems are
examples of indirect costs. It is important, according to Kossaibati and Esslemont (1997), to recognize
the indirect costs and to realize that the total cost for a disease in reality can be higher than only the
direct costs.
There are several studies investigating the impact of lameness on farm economy. Back in 1983
Whitaker et al. conducted a survey about incidence of lameness in dairy cattle. The study included 185
dairy farms and 21,000 cows from England and Wales. The researchers estimated that the cost for
lameness was £1175 per year in a herd holding 100 cows. This indicated that the British dairy farmers
lost £35 million in total due to lameness. Whitaker et al. (1983) realized that this was a rough estimate
but concluded that lameness played a significant economic role. Kossaibati and Esslemont (1997)
conducted a study in which the economic impact of some selected production diseases was estimated.
The study was performed on 90 commercial dairy farms in England and was based on current prices
for that time period. The researchers concluded that lameness contributed to the second largest health
costs next to mastitis. The costs related to lameness were derived primarily from inferior fertility, that
less milk was sold to the dairy plant and that more cows were culled. The study found the total cost for
one case of lameness to be approximately £245. However, the total cost per affected cow was
approximately £270 because a lame cow suffered an average of 1.4 cases.
Enting et al. (1997) used an epidemiologic study to investigate economic losses originating from
clinical digital diseases. Data was collected by veterinarians from 21 Dutch farms and included in total
2183 cows. The collected data included information about milk production (yield, fat and protein),
culling rate, calving interval and incidence of diseases. Enting et al. (1997) found in accordance with
Kossaibati and Esslemont (1997) that lameness was one of the most costly diseases affecting the
Dutch dairy cows. Only mastitis and fertility problems were considered more economically
challenging. Enting et al. (1997) reported that each lame cow cost about NLG 230. In this study the
researchers found similar underlying causes resulting in economic losses as reported by Kossaibati and
Esslemont (1997). However, except reasons related to culling, milk production and fertility Enting et
al. (1997) also found veterinary costs and extra labor associated with treating sick animals to be
factors contributing to the total loss.
In a more recent study by Cha et al. (2010) a somewhat different approach was used. The objective
was to help the farmer to manage lameness by calculating the cost for sole ulcer, digital dermatitis and
foot rot on an individual cow level. The researchers created a model in order to evaluate if it was more
profitable to replace a cow, keep a cow without inseminating her or inseminate her and thereby keep
13
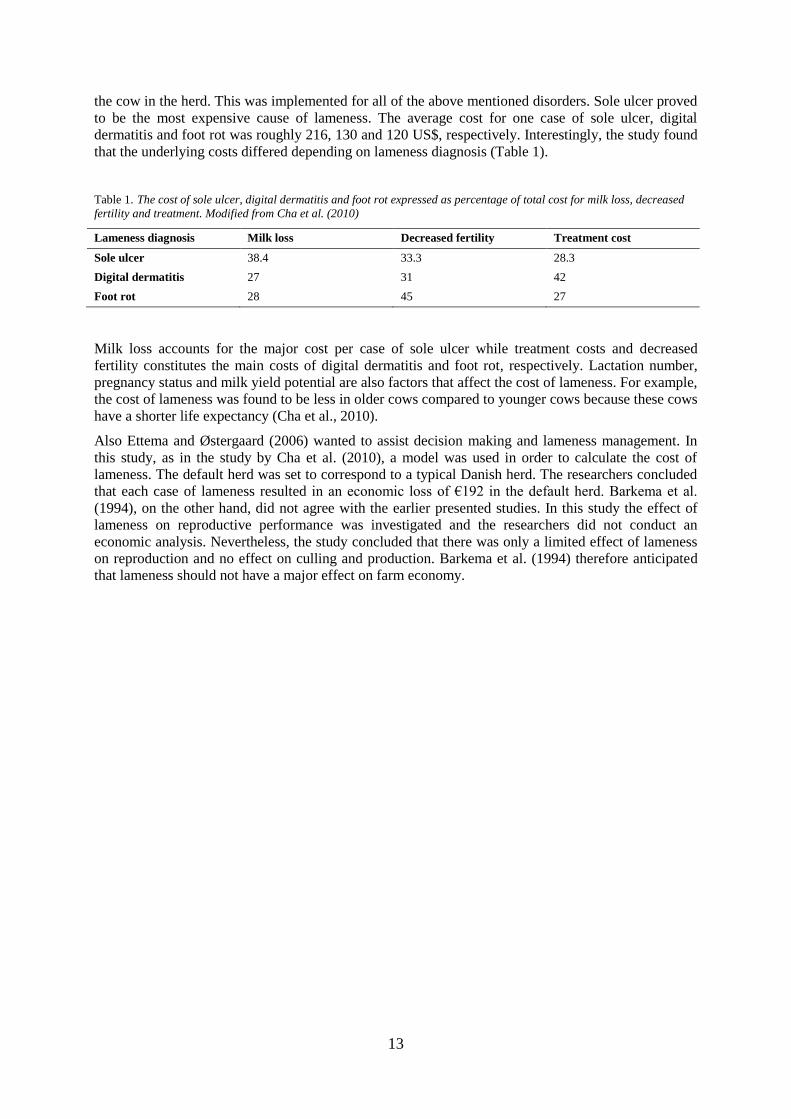
the cow in the herd. This was implemented for all of the above mentioned disorders. Sole ulcer proved
to be the most expensive cause of lameness. The average cost for one case of sole ulcer, digital
dermatitis and foot rot was roughly 216, 130 and 120 US$, respectively. Interestingly, the study found
that the underlying costs differed depending on lameness diagnosis (Table 1).
Table 1. The cost of sole ulcer, digital dermatitis and foot rot expressed as percentage of total cost for milk loss, decreased
fertility and treatment. Modified from Cha et al. (2010)
Lameness diagnosis Milk loss Decreased fertility Treatment cost
Sole ulcer 38.4 33.3 28.3
Digital dermatitis 27 31 42
Foot rot 28 45 27
Milk loss accounts for the major cost per case of sole ulcer while treatment costs and decreased
fertility constitutes the main costs of digital dermatitis and foot rot, respectively. Lactation number,
pregnancy status and milk yield potential are also factors that affect the cost of lameness. For example,
the cost of lameness was found to be less in older cows compared to younger cows because these cows
have a shorter life expectancy (Cha et al., 2010).
Also Ettema and Østergaard (2006) wanted to assist decision making and lameness management. In
this study, as in the study by Cha et al. (2010), a model was used in order to calculate the cost of
lameness. The default herd was set to correspond to a typical Danish herd. The researchers concluded
that each case of lameness resulted in an economic loss of €192 in the default herd. Barkema et al.
(1994), on the other hand, did not agree with the earlier presented studies. In this study the effect of
lameness on reproductive performance was investigated and the researchers did not conduct an
economic analysis. Nevertheless, the study concluded that there was only a limited effect of lameness
on reproduction and no effect on culling and production. Barkema et al. (1994) therefore anticipated
that lameness should not have a major effect on farm economy.

14
3. Material and Method The study was performed by collecting claw health protocols as well as data from the Finnish national
cattle database from 17 dairy farms situated on the Aland Islands. Of the 1975 trimmed cows, 45 %
(12 farms) were housed in tie-stalls and 55 % (5 farms) were housed in free stalls. At the time of the
study three professional claw trimmers, all based in Sweden, were contracted to trim cows at farms on
the Aland Islands. Claw health protocols were filled in by the claw trimmer when visiting the
participating farms for scheduled trimming sessions during the years 2013 and 2014.
In Table 2 the mean milk production (kg) and the mean ECM production (kg) on the Aland Islands
and in Finland during the years 2013 and 2014 are illustrated. The data is collected from farms that are
part in the Finnish national cattle database. It is not mandatory to submit farm data to the national
database meaning that the database does not comprise all farms in Finland. The Aland Islands have,
compared to Finland, a higher average milk production. The difference between the Aland Islands and
Finland was 539 kg milk and 930 kg ECM in 2013 and even greater in 2014 (883 kg milk and 1187 kg
ECM) (Ålands Hushållningssällskap, 2013; Ålands Hushållningssällskap, 2014).
Table 2. Mean milk and ECM production on the Aland Islands compared to Finland in 2013 and 2014 (Ålands
Hushållningssällskap, 2013; Ålands Hushållningssällskap, 2014)
Region Milk 2013 (kg) ECM 2013 (kg) Milk 2014 (kg) ECM 2014 (kg)
Aland 9497 10007 9995 10423
Finland 8958 9077 9112 9236
Threshold values for reproductive parameters are set in the Finnish national cattle database. The aim is
to achieve a calving interval of 365-375 d., an interval from first service to last service of 0-20 d. and
1.0-1.6 services per calving. These parameters should not exceed 400 d., 30 d. and 2, respectively.
3.1 Claw health protocols
The claw health protocol was divided into two sections. The herd number and claw trimmer identity as
well as the date of the visit were specified in the first section. In the second section the trimmer
recorded the identity number of the cow being trimmed and any claw problems detected during
trimming. The severity of the problem (mild or severe) and if the trimmer decided to treat the claw in
some way were also noted in the protocol. The protocol was filled in by hand during the trimming
session by the claw trimmer since the claw trimmers that are currently working on the Aland Islands
did not have the opportunity to use the Finnish computer software.
15
3.2 Animals and participating farms
Data concerning milk production and reproduction was collected from the Finnish national cattle
database. The data included information about cow identity, date of birth, calving date, year of
production, milk production (kg), energy corrected milk production (kg ECM), number of feed days,
number of services, interval from calving to first service (ICFS; days), interval from first service to the
last service (IFLS; days), calving interval (CI; days), recorded treatments as well as culling date and
reason for culling. All the information was based on calendar year and not on lactation. From this data
information about mean milk production (kg/d.) and mean ECM production (kg/d.) could be
calculated by dividing milk production and ECM production with the number of feed days for each
cow. Also, the interval from calving to last service (ICLS; days) could be calculated by adding the
retrieved information about ICFS with the IFLS. All the participating farms were visited during
August and September of 2014. During the visits information about housing system was collected
(free stalls or tie-stalls).
At the time of the study there were 38 dairy farms at the Aland Islands. However, some farms were
excluded from the study due to the lack of claw health data and data from the Finnish national cattle
database. Therefore, the material included data from 17 farms, meaning that approximately 45 % of
the total number of farms was included in the study. One farm was excluded in the 2014 dataset
because no data from the Finnish national cattle database was available from that farm. Information
concerning ICLS is missing from another farm in the 2014 dataset because information about ICFS
and IFLS was missing in the national cattle database. In total 1298 individual cows were included in
the study. However, each farm applied different claw trimming routines, meaning that the number of
claw trimming sessions per year varied between the participating farms (range 1-3 times/year). The
implication of this is that the number of cows trimmed was in total 1975 after adding all trimming
sessions for each cow together for the years 2013 and 2014.
The recorded diseases were divided into two groups for analysis purposes; infectious diseases and
laminitis related diseases. Dermatitis, digital dermatitis, heel horn erosion, interdigital hyperplasia,
wart growth, and interdigital phlegmone were considered as infectious diseases while sole
hemorrhage, sole ulcer, double sole, white line fissure, toe abscess, white line abscess and chronic
laminitis were considered as laminitis related diseases. Only the most severely affected foot was used
in the statistical analysis if a cow had several ulcers on different feet. A severity scoring system similar
to the system adopted by Greenough & Vermunt (1991) and Bergsten & Herlin (1996) was used in the
analysis. Each disease was then given a severity score depending on its clinical severity (Table 3 and
4). The scores of infectious diseases and laminitis related diseases were added together into a total
score for each cow for each trimming session.
In the statistical analyses the scores given to a cow for infectious diseases, laminitis related diseases
and the total score during each trimming session were compared so that only the most severe score
from each of these parameters were used. This resulted in each cow having a maximum score for
infectious diseases (maximum infectious point, MIP), a maximum score for laminitis related diseases
(maximum laminitis point, MLP) and a maximum score for the total score (maximum total point,
MTP). The conformation of the claw was not considered in the statistical analysis because this
information was not always available. Other information that was not included in the study was
information about treatments and additional comments made by the claw trimmers.

16
Table 3. Severity scoring of infectious diseases Table 4. Severity scoring of laminitis related diseases
3.3 Statistical analysis
The data from the study were analyzed using Minitab Statistical Software (Minitab 16, Minitab Inc.,
State College, PA, USA). The statistical analyses were performed on herd level and on cow level. The
herd level analyses were performed separately on mean values from year 2013 and 2014 but also on
mean values from both years. The analyses on cow level included results from all trimmings for all
cows and both years. On herd level descriptive statistics were calculated using the procedure
descriptive statistics. The procedure two sample t-tests were used to determine if the means of the
following parameters were different from each other: housing system and mean ECM production,
housing system and number of services, housing system and IFLS, housing system and ICLS as well
as housing system and CI. Variance analysis was performed in order to evaluate the effect of claw
trimmer and housing system on MIP, MLP and MTP. The procedure used was General Linear Model
and least square means. Pearson correlation coefficients was calculated using the procedure correlation
between mean ECM production, number of services, IFLS, ICLS, CI, MIP, MLP and MTP. On the
individual cow level boxplot diagrams were used to display the retrieved data. The means were
considered to be statistically different in all analyses if P<0.05. However, trends where P>0.05 was
also noted.
Infectious diseases Points
Dermatitis, mild case 1
Dermatitis, severe case 5
Heel horn erosion, mild case 1
Heel horn erosion, severe case 5
Interdigital hyperplasia 5
Wart growth 5
Digital dermatitis 5
Interdigital phlegmone 5
Laminitis related diseases Points
Sole hemorrhage, mild case 1
Sole hemorrhage, severe case 3
Sole ulcer, mild case 5
Sole ulcer, severe case 7
Double sole 3
White line fissure 3
Toe abscess 7
White line abscess 5
Laminitis 4

17
4. Results Fifty per cent of the total number of trimmed cows during 2013 and 52 % in 2014 had no recorded
claw lesions and consequently a maximal severity score of zero. Table 5 shows the mean values of the
parameters included in the statistical analyses.
Table 5. Mean values of the mean ECM production, number of services, interval from first service to last service (IFLS),
interval from calving to last service (ICLS) and calving interval (CI) during the years 2013 and 2014
Year Mean ECM prod. (kg/d.) No of services IFLS (d.) ICLS (d.) CI (d.)
2013 30.1 1.7 39 122 397
2014 29.5 2.1 41 124 402
4.1 Claw health
Figure 3 illustrates the prevalence of infectious and laminitis related diseases in the 17 participating
farms.
Figure 3. Prevalence of infectious and laminitis related diseases on the 17 participating farms.
0,0
10,0
20,0
30,0
40,0
50,0
60,0
70,0
80,0
1 2 3 4 5 6 7 8 9 10 11 12 13 14 15 16 17
Pre
vale
nce
of
affe
ctre
d c
ow
s
Farm number
Infectious diseases
Laminitis related diseases
Infectious diseases (mean)
Laminitis related diseases (mean)

18
Laminitis related diseases were more common on all farms compared to infectious diseases. There was
a great difference in the prevalence of both laminitis related diseases (range 16.7 to 67.2 %) and
infectious diseases (range 0.0 to 52.7 %) between farms (Figure 3).
There was no difference in the prevalence of infectious diseases between any of the years. There were,
on the other hand, significantly more infectious diseases on farms with free stall systems compared to
farms with tie-stalls during both years (P=0.000 and P=0.016). There were no significant differences
in the prevalence of laminitis related diseases or MTP between tie-stalls and free stalls. There was a
significant difference in the occurrence of laminitis related diseases (P-value: 0.024) and in MTP (P-
value: 0.026) recorded by the three claw trimmers during the year 2013 but not during 2014 (P-value:
0.445).
Table 6 demonstrates the Pearson correlation coefficients between year of production, MIP, MLP and
MTP in the combined 2013 and 2014 dataset. There were no significant correlations between year of
production and MIP, MLP and MTP. It existed, on the other hand, significant positive correlations
between MIP and MTP and between MLP and MTP. The correlation coefficient was however slightly
lower in the first comparison (0.734 vs. 0.919).
Table 6. Pearson correlation coefficients between year of production, maximum infectious points (MIP), maximum laminitis
points (MLP) and maximum total points (MTP) in the 2013 and 2014 combined dataset. P-value within brackets
2013 & 2014 Year of production MIP MLP
MIP -0.068
NS
MLP 0.202
NS
0.410
NS
MTP 0.123
NS
0.734
(0.001)
0.919
(0.000)
4.2 Reproduction
There were no significant differences between tie-stalls and free stalls herds concerning any of the
reproduction parameters. However, there was a tendency for a higher number of services in tie-stalls in
the 2013 dataset (P-value: 0.060) and in the joined 2013 and 2014 datasets (P-value: 0.058).
Table 7 demonstrates the Pearson correlation coefficient between the above mentioned parameters and
MIP, MLP and MTP in the 2013 dataset. There were no significant correlations between any of the
reproductive parameters and MIP, MLP and MTP. However, there were significant positive
correlations between IFLS and ICLS (0.799), IFLS and CI (0.045) and ICLS and CI (0.559).
Table 7. Pearson correlation coefficient between number of services, interval from first service to last service (IFLS),
interval from calving to last service (ICLS), calving interval (CI) and maximum infectious points (MIP), maximum laminitis
points (MLP) and maximum total points (MTP) during year 2013. P-value within brackets
2013 IFLS ICLS CI MIP MLP MTP
No. services 0.127
NS
-0.180
NS
0.165
NS
-0.252
NS
-0.272
NS
-0.415
NS
IFLS 0.799
(0.000)
0.492
(0.045)
0.340
NS
0.375
NS
0.427
NS
ICLS 0.559
(0.020)
0.305
NS
0.183
NS
0.254
NS
CI -0.065
NS
-0.452
NS
-0.415
NS
19
Table 8. Pearson correlation coefficient between number of services, interval from first service to last service (IFLS),
interval from calving to last service (ICLS), calving interval (CI) and maximum infectious points (MIP), maximum laminitis
points (MLP) and maximum total points (MTP) during year 2014. P-value within brackets
2014 IFLS ICLS CI MIP MLP MTP
No. services 0.601
(0.018)
0.342
NS
0.449
NS
0.229
NS
0.275
NS
0.272
NS
IFLS 0.835
(0.000)
0.748
(0.001)
0.383
NS
0.509
(0.053)
0.487
NS
ICLS 0.834
(0.000)
0.234
NS
0.460
NS
0.383
NS
CI 0.098
NS
0.201
NS
0.161
NS
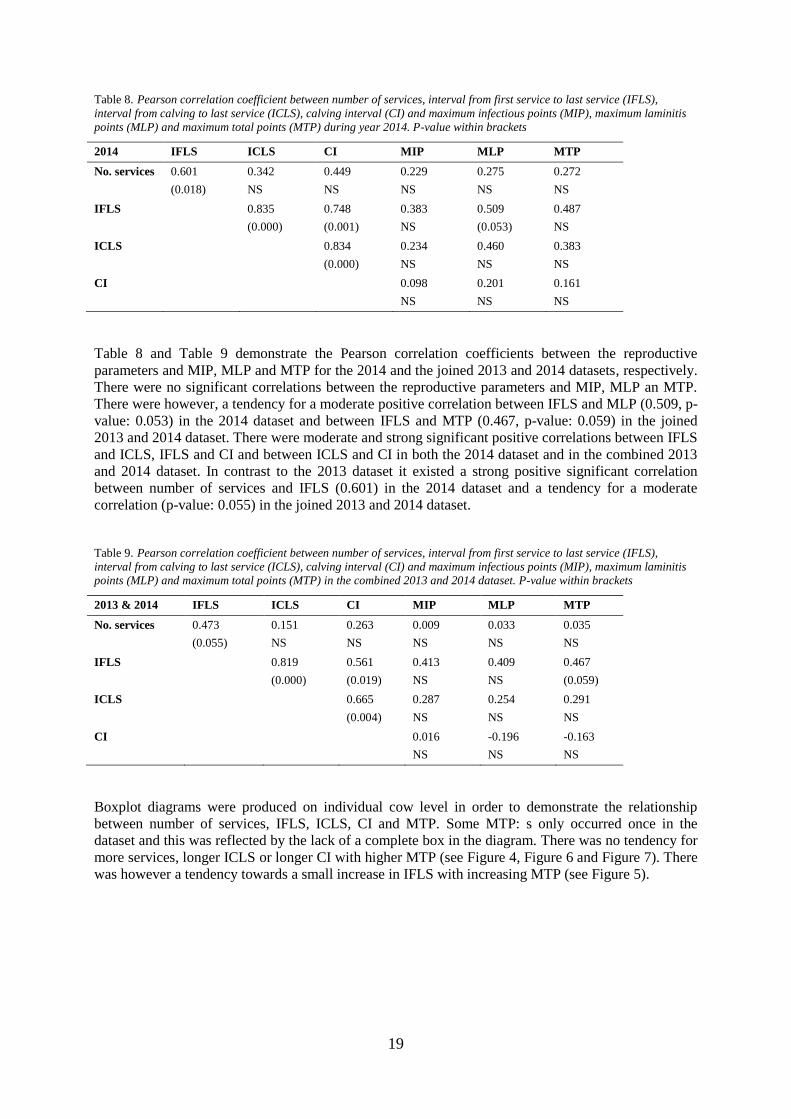
Table 8 and Table 9 demonstrate the Pearson correlation coefficients between the reproductive
parameters and MIP, MLP and MTP for the 2014 and the joined 2013 and 2014 datasets, respectively.
There were no significant correlations between the reproductive parameters and MIP, MLP an MTP.
There were however, a tendency for a moderate positive correlation between IFLS and MLP (0.509, p-
value: 0.053) in the 2014 dataset and between IFLS and MTP (0.467, p-value: 0.059) in the joined
2013 and 2014 dataset. There were moderate and strong significant positive correlations between IFLS
and ICLS, IFLS and CI and between ICLS and CI in both the 2014 dataset and in the combined 2013
and 2014 dataset. In contrast to the 2013 dataset it existed a strong positive significant correlation
between number of services and IFLS (0.601) in the 2014 dataset and a tendency for a moderate
correlation (p-value: 0.055) in the joined 2013 and 2014 dataset.
Table 9. Pearson correlation coefficient between number of services, interval from first service to last service (IFLS),
interval from calving to last service (ICLS), calving interval (CI) and maximum infectious points (MIP), maximum laminitis
points (MLP) and maximum total points (MTP) in the combined 2013 and 2014 dataset. P-value within brackets
2013 & 2014 IFLS ICLS CI MIP MLP MTP
No. services 0.473
(0.055)
0.151
NS
0.263
NS
0.009
NS
0.033
NS
0.035
NS
IFLS 0.819
(0.000)
0.561
(0.019)
0.413
NS
0.409
NS
0.467
(0.059)
ICLS 0.665
(0.004)
0.287
NS
0.254
NS
0.291
NS
CI 0.016
NS
-0.196
NS
-0.163
NS
Boxplot diagrams were produced on individual cow level in order to demonstrate the relationship
between number of services, IFLS, ICLS, CI and MTP. Some MTP: s only occurred once in the
dataset and this was reflected by the lack of a complete box in the diagram. There was no tendency for
more services, longer ICLS or longer CI with higher MTP (see Figure 4, Figure 6 and Figure 7). There
was however a tendency towards a small increase in IFLS with increasing MTP (see Figure 5).

20
Figure 4: Boxplot of number of services compared to maximum total point (MTP) for all individual cows.
Figure 5: Boxplot of interval from first service to the last service (IFLS, d.) compared to maximum total points (MTP) for all
individual cows.

21
Figure 6: Boxplot of interval from calving to last service (ICLS, d.) compared to maximum total points (MTP) for all
individual cows.
Figure 7: Boxplot of calving interval (CI, d.) compared to maximum total points (MTP) for all individual cows.
4.3 Milk production
There were no significant differences in mean ECM production between the different farm types (tie-
stalls and free stalls). Figure 8 illustrates the average ECM production of all trimmed cows in relation
to the MTP assigned to each cow during the trimming sessions performed during 2013 and 2014.
Higher scores implied impaired claw health. The scores 15, 17 and 19 occurred only once in the
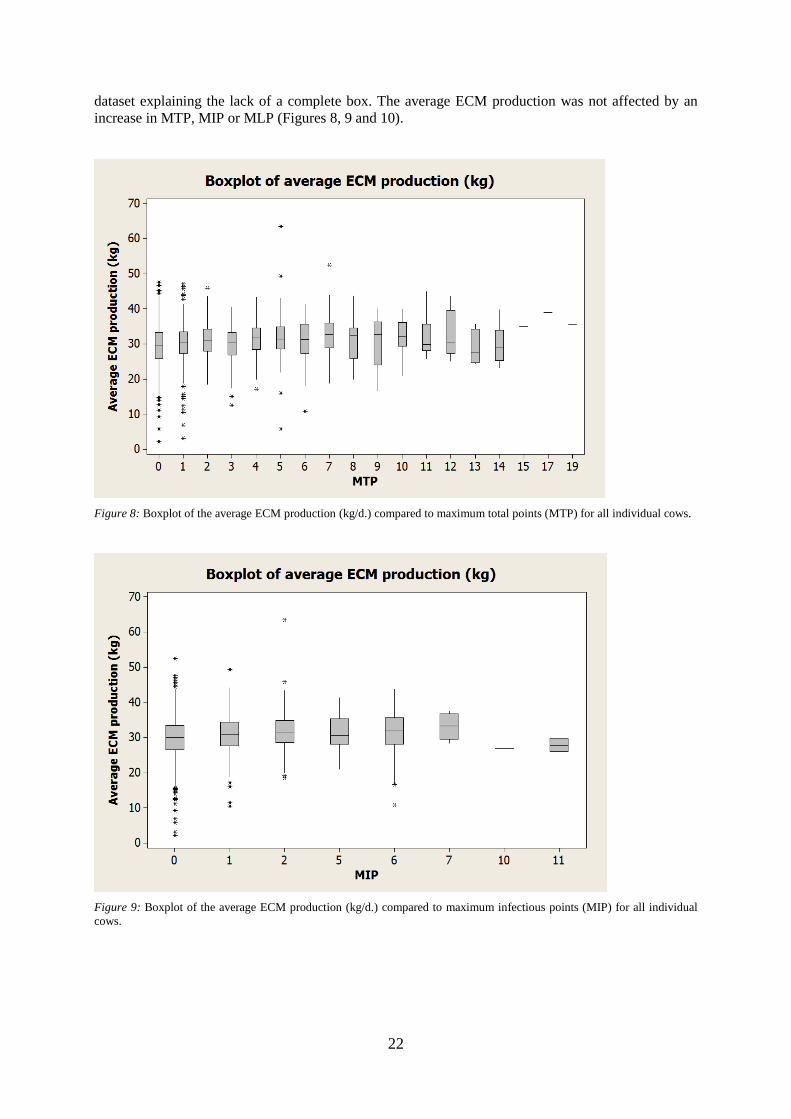
22
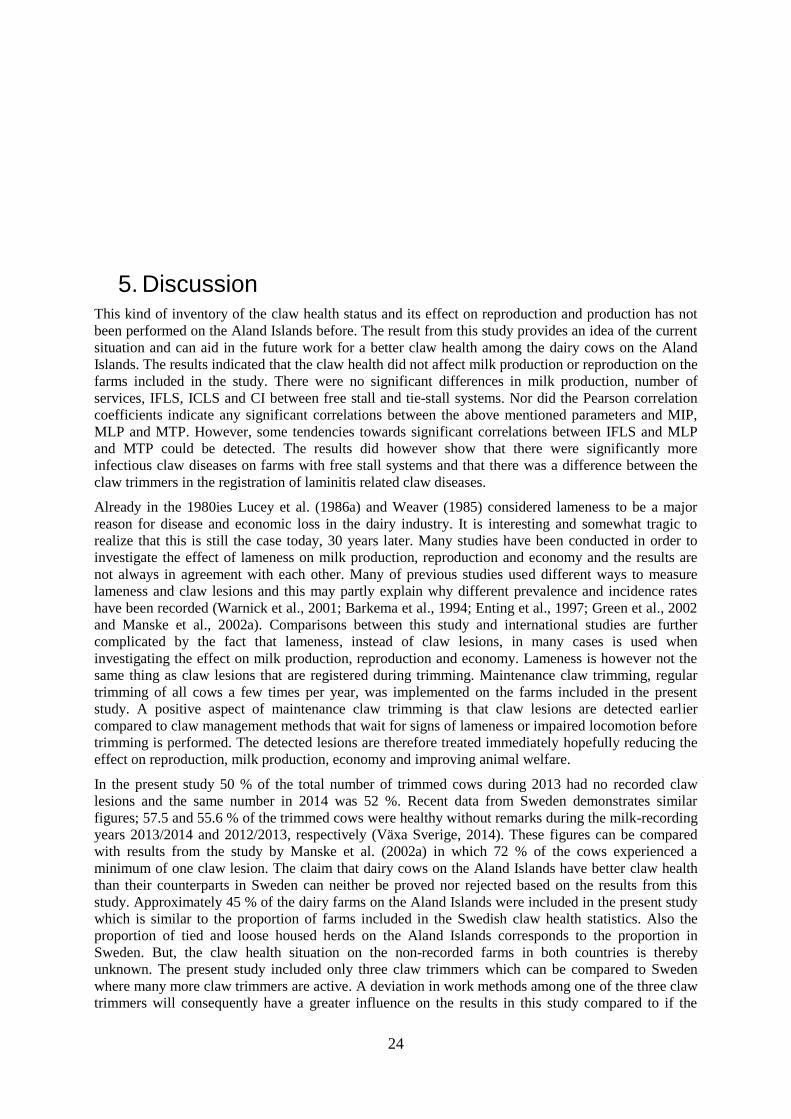
dataset explaining the lack of a complete box. The average ECM production was not affected by an
increase in MTP, MIP or MLP (Figures 8, 9 and 10).
Figure 8: Boxplot of the average ECM production (kg/d.) compared to maximum total points (MTP) for all individual cows.
Figure 9: Boxplot of the average ECM production (kg/d.) compared to maximum infectious points (MIP) for all individual
cows.

23
Figure 10: Boxplot of the average ECM production (kg/d.) compared to maximum laminitis points (MLP) for all individual
cows.
24
5. Discussion This kind of inventory of the claw health status and its effect on reproduction and production has not
been performed on the Aland Islands before. The result from this study provides an idea of the current
situation and can aid in the future work for a better claw health among the dairy cows on the Aland
Islands. The results indicated that the claw health did not affect milk production or reproduction on the
farms included in the study. There were no significant differences in milk production, number of
services, IFLS, ICLS and CI between free stall and tie-stall systems. Nor did the Pearson correlation
coefficients indicate any significant correlations between the above mentioned parameters and MIP,
MLP and MTP. However, some tendencies towards significant correlations between IFLS and MLP
and MTP could be detected. The results did however show that there were significantly more
infectious claw diseases on farms with free stall systems and that there was a difference between the
claw trimmers in the registration of laminitis related claw diseases.
Already in the 1980ies Lucey et al. (1986a) and Weaver (1985) considered lameness to be a major
reason for disease and economic loss in the dairy industry. It is interesting and somewhat tragic to
realize that this is still the case today, 30 years later. Many studies have been conducted in order to
investigate the effect of lameness on milk production, reproduction and economy and the results are
not always in agreement with each other. Many of previous studies used different ways to measure
lameness and claw lesions and this may partly explain why different prevalence and incidence rates
have been recorded (Warnick et al., 2001; Barkema et al., 1994; Enting et al., 1997; Green et al., 2002
and Manske et al., 2002a). Comparisons between this study and international studies are further
complicated by the fact that lameness, instead of claw lesions, in many cases is used when
investigating the effect on milk production, reproduction and economy. Lameness is however not the
same thing as claw lesions that are registered during trimming. Maintenance claw trimming, regular
trimming of all cows a few times per year, was implemented on the farms included in the present
study. A positive aspect of maintenance claw trimming is that claw lesions are detected earlier
compared to claw management methods that wait for signs of lameness or impaired locomotion before
trimming is performed. The detected lesions are therefore treated immediately hopefully reducing the
effect on reproduction, milk production, economy and improving animal welfare.
In the present study 50 % of the total number of trimmed cows during 2013 had no recorded claw
lesions and the same number in 2014 was 52 %. Recent data from Sweden demonstrates similar
figures; 57.5 and 55.6 % of the trimmed cows were healthy without remarks during the milk-recording
years 2013/2014 and 2012/2013, respectively (Växa Sverige, 2014). These figures can be compared
with results from the study by Manske et al. (2002a) in which 72 % of the cows experienced a
minimum of one claw lesion. The claim that dairy cows on the Aland Islands have better claw health
than their counterparts in Sweden can neither be proved nor rejected based on the results from this
study. Approximately 45 % of the dairy farms on the Aland Islands were included in the present study
which is similar to the proportion of farms included in the Swedish claw health statistics. Also the
proportion of tied and loose housed herds on the Aland Islands corresponds to the proportion in
Sweden. But, the claw health situation on the non-recorded farms in both countries is thereby
unknown. The present study included only three claw trimmers which can be compared to Sweden
where many more claw trimmers are active. A deviation in work methods among one of the three claw
trimmers will consequently have a greater influence on the results in this study compared to if the

25
number were to be greater. Nevertheless, it is evident that the occurrence of claw lesions can vary
greatly between farms, which have also been demonstrated in previous studies (Warnick et al., 2001;
Barkema et al., 1994).
According to Rajala-Schultz et al. (1999) first lactation cows are most affected by lameness but
Barkema et al. (1994), Warnick et al. (2001), Bicalho et al. (2007) and Onyiro et al. (2008) reported
that lameness was most prevalent in older cows. However, no significant correlations between year of
production and claw health could be found in the present study. There were, on the other hand,
significantly more infectious diseases on farms with free stalls compared to farms with tie-stalls during
both 2013 and 2014. This might be due to the fact that cows in free stall systems have to move around
to find feed and water. This in combination with manure and concrete floors will facilitate the spread
of infectious diseases and impair claw health (Bergsten & Pettersson, 1992; Bergsten, 2001).
Furthermore, it is likely that cows in tie-stalls are not exposed to the same infectious pressure from
other cows as they have their appointed space in the barn.
The present study also found that the there was a significant difference in occurrence of laminitis
related diseases and MTP between the claw trimmers in the year 2013. The same relationship did not
exist in the year 2014. The reason for this is unknown. One explanation could be that the claw
trimmers evaluated the laminitis related diseases differently in comparison to each other. Another
explanation could be that the trimmers by coincidence worked on farms with different occurrence of
laminitis related diseases. A significant difference between the trimmers might be facilitated if a claw
trimmer that worked on farms with more laminitis related diseases is compared to a claw trimmer that
worked on farms with very little laminitis related claw diseases. The significant difference in MTP
between the claw trimmers in 2013 was probably an effect of the difference in laminitis related
diseases and the fact that there were significant positive correlations between MIP and MTP and MLP
and MTP where the correlation between MLP and MTP was the strongest.
5.1 Milk production
The hypothesis that the milk production decreased when the claw health deteriorated was not
supported by this study. Similar results were reported by Cobo-Abreu et al. (1979) and Martin et al.
(1982) who did not find significant effects of claw problems on milk yield. However, Lucey et al.
(1986b), Rajala-Schultz et al. (1999), Warnick et al. (2001) and Green et al. (2002) all found that
lameness had a detrimental effect on the milk production. There are also studies reporting a beneficial
effect of lameness on milk yield. Dohoo & Martin (1984a), Barkema et al. (1994), Green et al. (2002)
and Onyiro et al. (2008) all reported an increased milk yield from cows suffering from claw problems.
However, not all claw lesions result in lameness (Manske et al., 2002a) which complicates the
comparisons between these studies.
One explanation to the results in the present study is that the recorded hoof disorder simply did not
affect the milk production since claw lesions can be subclinical. However, another explanation may
perhaps be present. The dairy cows at the Aland Islands are the highest producing in Finland (Ålands
Hushållningssällskap, 2013; Ålands Hushållningssällskap, 2014) and according to Barkema et al.
(1994), Green et al. (2002), Hultgren et al. (2004) and Onyiro et al. (2008) are high yielding cows
more prone to develop lameness. High producing cows are more likely to experience a large negative
energy balance and have to remain standing by the feed bunk for longer periods in order to consume
enough feed (Green et al., 2002). On the other hand, the negative energy balance could also be
facilitated by a decreased feed intake resulting from the cow not standing at the feed bunk because of
the pain associated with lameness and claw lesions. The difference in milk yield between lame and
healthy cows is thereby reduced since the yield from high producing cows is decreased to the same
level as the average but perhaps not below it. Lame cows may consequently not produce less milk than
their healthy counterparts but will produce less milk than their potential and have a less persistent
lactation (Green et al., 2002; Onyiro et al., 2008). In the future it would perhaps be better to measure
the deviation from the milk curve as proposed by Barkema et al. (1994) and implemented by Bergsten
et al. (2003) in order to quantify the difference between healthy and lame cows. There is also a risk,

26
according to Warnick et al. (2001), that cows with lameness and lower milk production are culled
more often than lame cows with higher milk production. Cows with a higher milk production will
remain in the herd and the risk of them suffering from lameness increases.
5.2 Reproduction
The effect of claw problems on fertility has been carefully studied. In previous studies have lameness
and claw lesions resulted in an increased interval between calving and first service and calving and
conception. Moreover, lameness is reported to increase the number of services, decrease the mounting
activity making estrus detection more difficult and lead to an increased risk for developing ovarian
cysts (Weaver, 1985; Lucey et al., 1986a; Collick et al., 1989; Sprecher et al., 1997; Melendez et al.,
2003 and Bicalho et al., 2007). However, in contrast to earlier studies there were no significant
correlations between claw health and the above mentioned fertility measurements in the present study.
No significant differences between free stall and tie-stall herds were found in CI, ICLS, IFLS and
number of services. The study did find moderate and strong significant positive correlations between
IFLS, ICLS and CI. This is not surprising since both IFLS and ICLS will affect the CI. There were
also a significant positive correlation between IFLS and number of inseminations in the 2014 dataset
and a tendency for the same in the joined 2013 and 2014 dataset. This is reasonable because the IFLS
should increase when the number of services increases. The boxplots did not supply any clear
indications that the claw health deteriorated the fertility measures (see Figure 4, Figure 5, Figure 6 and
Figure 7).
5.3 Study design
The facts that lameness is considered to be a multifactorial disease (Vermunt 2005) and that the
present study is an epidemiologic study makes it impossible to draw conclusions about cause - effect
relationships. The drawback of epidemiologic studies is that factors affecting the results cannot be
controlled in the same manner as in intervention studies. Epidemiologic studies are also dependent on
the quality of the input data since these cannot be controlled. This was evident in the present study
since data from the Finnish national cattle database was missing from one farm and data about ICLS
was missing from another farm in 2014. The lack of significant results can be explained by the small
number of farms included in the study together with the large variation among them. A larger sample
size is beneficial because it represents the average population better. This was however not possible
because of lack of data from the Finnish national cattle database and claw trimming sessions.
All data from the national cattle database was based on calendar years instead of on lactation. A cow
calving in January consequently had a much higher milk yield than a cow calving in December. The
implication of this was that the mean ECM production had to be calculated by dividing the ECM
production with the number of feed days. However, the number of feed days included the dry period
and the maximum number of feed days was as a result 365 d. Since the lactation normally extends
over 305 days, the calculated average daily ECM production will be lower than the true production
when divided by 365 days. This procedure is not believed to have a significant effect on the results on
the present study but should be remembered if the milk yields ever are to be compared to other studies.
Another important factor that may affect the results is the time of the claw trimming sessions. The
cows have to be outside on pasture during the summer and according to Hernandez-Mendo et al.
(2007) and Onyiro et al. (2008) grazing will decrease the locomotion scores. It is possible that cows
that were claw trimmed in autumn had better claw health than cows that were claw trimmed in late
winter. This was however not investigated further in the present study and should be considered in
future studies. The interval between calving and first service, known as the voluntary waiting period,
was not included in the study because it depends largely on the farmers’ attitude; the aim on some
farms is to serve the cow the first time 60 d. after calving while others serve the cow as early as
possible after calving.
27
The results from this study give rise to new questions. It would be interesting to investigate if different
claw lesions affect the production and reproduction to different degrees as pointed out by Warnick et
al. (2001). The effect of breed on the occurrence of different claw lesions could also be a future field
of study. Another interesting aspect would be to check whether the difference between the claw
trimmers was arbitrary or if they assessed claw lesions differently. There are records from every
Swedish claw trimmer that would be possible to use for comparisons. A unified basis for assessment is
important if claw health data are to be used in breeding in the future.
In the present study approximately 50 % of the cows experienced some kind of claw problem. Should
this be considered as an acceptable figure since neither the production nor the fertility was affected?
Murray et al. (1996) reported that sole ulcer, white line lesions, digital dermatitis, interdigital
phlegmone, interdigital hyperplasia and interdigital dermatitis are claw lesions commonly associated
with lameness. Lameness is considered to be an animal welfare problem associated with pain and
changed behavior (Hassall et al., 1993; Singh et al., 1993; Hernandez et al., 2002 and O´Callaghan,
2002) as well as impaired economic results on farms (Whitaker et al., 1983; Kossaibati and Esslemont,
1997 and Enting et al., 1997). However, lameness was not recorded in the present study and many
claw diseases are subclinical. Whether the cows in the present study experienced pain associated with
lameness is therefore unknown. Finally, even if it would be considered acceptable that 50 % of the
cows had some kind of claw lesion it would in any case be wise to minimize the prevalence of claw
lesions on the farms. The present study indicates that free stall systems could benefit from controlling
the claw health routines in order to decrease the occurrence of infectious diseases. It would however
be important for all farms to decrease the amount of laminitis related diseases since these were the
most common in the study. During these economically challenging times farmers might benefit from
improving the claw health both from economic and animal welfare terms.

28
6. Conclusion The aim of this study was to analyze the claw health, reproduction and milk production of dairy cows
at the Aland Islands in order to gain an understanding of the current situation. The study found no
significant differences in milk yield and fertility between the farms included in the study or with claw
health records from Sweden. No detrimental correlations between milk production and claw health and
between fertility and claw health could be reported. Laminitis related diseases were the most common
claw problems on the farms but there were significantly more infectious diseases on farms with free
stalls compared to tie-stalls. A significant difference in the occurrence of laminitis related diseases
between the claw trimmers was found. The reason for this difference is unknown. The results of this
study can aid in the future work towards better a claw health status among the dairy cows at the Aland
Island.
29
7. References
Barkema, H.W., Westrik, J.D., van Keulen, K.A.S., Schukken, Y.H. & Brand, A. (1994). The effects of lameness on
reproductive performance, milk production and culling in Dutch dairy farms. Preventive Veterinary Medicine, vol. 20 (4), pp.
249–259.
Bergsten, C., Greenough, P.R., Gay, J.M., Seymour, W.M. & Gay, C.C. (2003). Effects of biotin supplementation on
performance and claw lesions on a commercial dairy farm. Journal of Dairy Science, vol. 86 (12), pp. 3953-3962.
Bergsten, C. (2001). Effects of conformation and management system on hoof and leg diseases and lameness in dairy cows.
The Veterinary Clinics of North America. Food Animal Practice, vol. 17 (1), pp. 1-23.
Bergsten, C & Herlin, A.H. (1996). Sole haemorrhages and heel horn erosion in dairy cows: The influence of housing system
on their prevalence and severity. Acta Veterinaria Scandinavica, vol. 37 (4), pp. 395-408.
Bergsten, C. & Pettersson, B. (1992). The cleanliness of cows tied in stalls and the health of their hooves as influenced by the
use of electric trainers. Preventive Veterinary Medicine, vol. 13, pp. 229-238.
Bicalho, R.C., Vokey, F., Erb, H.N. & Guard, C.L. (2007). Visual locomotion scoring in the first seventy days in milk:
impact on pregnancy and survival. Journal of Dairy Science, vol. 90 (10), pp. 4586–4591.
Capion, N., Enevoldsen, C. & Thamsborg, S.M. (2008). Prevalence of foot lesions in Danish
Holstein cows. Veterinary Record,vol. 163, pp. 80-86.
Cha, E., Hertl, J.A., Bar, D. & Gröhn, Y.T. (2010). The cost of different types of lameness in dairy cows calculated by
dynamic programming. Preventive Veterinary Medicine, vol. 97 (1), pp. 1-8.
Cobo-Abreu, R., Martin, S.W., Willoughby, R.A. & Stone, J.B. (1979). The association between disease, production and
culling in a university dairy herd. The Canadian Veterinary Journal, vol. 20 (7), pp. 191-195.
Collick, D.W., Ward, W.R. & Dobson, H. (1989). Associations between types of lameness and fertility. Veterinary Record,
vol. 125, pp. 103-106.
Cramer, G., Lissemore, K.D., Guard, C.L., Leslie, K.E. & Kelton, D.F. (2008). Herd- and cow-level prevalence of foot
lesions in Ontario dairy cattle. Journal of Dairy Science, vol. 91 (10), pp. 3888-3895.
Dohoo, I. R. & Martin, S. W. (1984a). Disease, production and culling in Holstein- Friesian cows. IV. Effects of disease on
production. Preventive Veterinary Medicine, vol. 2, pp. 755-770.
Dohoo, I. R. & Martin, S. W. (1984b). Disease, production and culling in Holstein- Friesian cows. III. Disease and
production as determinants of disease. Preventive Veterinary Medicine, vol. 2, pp. 671-689.
Enting, H., Kooij, D. Dijkhuizen, A.A., Huirne, R.B.M. & Noordhuizen-Stassen, E.N. (1997) Economic losses due to clinical
lameness in dairy cattle. Livestock Production Science, vol. 49, pp. 259-267.
Ettema, J.F & Østergaard, S. (2006). Economic decision making on prevention and control of clinical lameness in Danish
dairy herds. Livestock Science, vol. 102 (1-2), pp. 92-106.
Flower, F.C & Weary, D.M. (2009). Gait assessment in dairy cattle. Animal, vol. 3 (1), pp. 87-95.
Garbarino, E.J., Hernandez, J.A., Shearer, J.K., Risco, C.A. & Thatcher, W.W. (2004). Effect of Lameness on Ovarian
Activity in Postpartum Holstein Cows. Journal of Dairy Science, vol. 87 (12), pp. 4123–4131.

30
Green, L.E., Hedges, V.J., Schukken, Y.H., Blowey, R.W. & Packington, A.J. (2002). The Impact of Clinical Lameness on
the Milk Yield of Dairy Cows. Journal of Dairy Science, vol. 85 (9), pp. 2250–2256.
Greenough, P.R. & Vermunt, J.J. (1991). Evaluation of subclinical laminitis in a dairy herd and observations on associated
nutritional and management factors. Veterinary Record, vol. 128, pp. 11-17.
Hansen, L.B., Young, C.W., Miller, K.P. & Touchberry, R.W. (1979). Health Care Requirements of Dairy Cattle. I. Response
to Milk Yield Selection. Journal of Dairy Science, vol. 62 (12), pp. 1922–1931.
Hassall, S.A., Ward, W.R. & Murray, R.D. (1993). Effects of lameness on the behavior of cows during the summer.
Veterinary Record, vol. 132, pp. 578-580.
Hedges, J., Blowey, R.W., Packington, A.J., O´Callaghan, C.J. & Green, L.E. (2001). A Longitudinal Field Trial of the Effect
of Biotin on Lameness in Dairy Cows. Journal of Dairy Science, vol. 84 (9), pp. 1969–1975.
Hernandez, J., Shearer, J.K. & Webb, D.W. (2002). Effect of lameness on milk yield in dairy cows. Journal of the American
Veterinary Medical Association, vol. 220 (5), pp. 640-644.
Hernandez-Mendo, O., von Keyserlingk, M.A.G., Veira, D.M. & Weary, D.M. (2007). Effects of Pasture on Lameness in
Dairy Cows. Journal of Dairy Science, vol. 90 (3), pp. 1209–1214.
Hultgren, J., Manske, T. & Bergsten, C. (2004). Associations of sole ulcer at claw trimming with reproductive performance,
udder health, milk yield, and culling in Swedish dairy cattle. Preventive Veterinary Medicine, vol. 62 (4), pp. 233-251.
Hultgren, J. (2002). Foot/leg and udder health in relation to housing changes in Swedish dairy herds. Preventive Veterinary
Medicine, vol. 53, pp. 167-189.
Huxley, J., Archer, S., Bell, N., Burnell, M., Green, L., Potterton, S. & Reader, J. (2012). Control of lameness. I: Green, M.
(ed.), Dairy herd health. Oxfordshire: CABI, pp. 169-204.
Kossaibati, M.A & Esslemont, R.J. (1997). The Costs of Production Diseases in Dairy Herds in
England. The Veterinary Journal, vol. 154, pp. 41-51.
Logue, D.N., Offer, J.E. & Hyslop, J.J. (1994). Relationship of diet, hoof type and locomotion score with lesions of the sole
and white line in dairy cattle. Animal Production, vol. 59, pp. 173-181.
Juarez, S.T., Robinson, P.H., DePeters, E.J. & Price, E.O. (2003). Impact of lameness on behavior and productivity of
lactating Holstein cows. Applied Animal Behaviour Science, vol. 83 (1), pp. 1–14.
Lucey, S., Rowlands, G.J. & Russell, A.M. (1986a). The association between lameness and fertility in dairy cows. Veterinary
Record, vol. 118, pp. 628-631.
Lucey, S., Rowlands, G.J. & Russell, A.M. (1986b). Short-term associations between disease and milk yield of dairy cows.
Journal of Dairy Research, vol. 53, pp. 7-15.
MacCallum, A.J., Knight, C.H., Hendry, K.A.K, Wilde, C.J., Logue, D.N. & Offer, J.E. (2002). Effects of time of year and
reproductive state on the proliferation and keratinisation of bovine hoof cells. Veterinary Record, vol. 151, pp. 285-289.
Manske, T., Hultgren, J. & Bergsten, C. (2002a). Prevalence and interrelationships of hoof lesions and lameness in Swedish
dairy cows. Preventive Veterinary Medicine, vol. 54 (3), pp. 247–263.
Manske, T., Bergsten, C. & Hultgren, J. (2002b). Klövvård och klövhälsa hos mjölkkor. Skara: Institutionen för husdjurens
miljö och hälsa. Jordbruksinformation 4.
Martin, S.W., Aziz, S.A., Sandals, W.C.D. & Curtis, R.A. (1982). The association between clinical disease, production and
culling of Holstein-Friesian cows. Canadian Journal of Animal Science, vol. 62, pp. 633–640.
Melendez, P., Bartolome, J., Archbald, L.F. & Donovan, A. (2003). The association between lameness, ovarian cysts and
fertility in lactating dairy cows. Theriogenology, vol. 59 (3-4), pp. 927–937.
Murray, R.D., Downham, D.Y., Clarkson, M.J., Faull, W.B., Hughes, J.W., Manson, F.J., Merritt, J.B., Russell, W.B.,
Sutherst, J.E. & Ward, W.R. (1996). Epidemiology of lameness in dairy cattle: Description and analysis of digit lesions.
Veterinary Record, vol. 138, pp. 586–591.
Norring, M., Häggman, J., Simojoki, H., Tamminen, P., Winckler, C. & Pastell, M. (2014). Short communication: Lameness
impairs feeding behavior of dairy cows. Journal of Dairy Science, vol. 97 (7), pp. 4317–4321.

31
O´Callaghan, K. (2002). Lameness and associated pain in cattle – challenging traditional perceptions. In Practice, vol. 24, pp.
212-219.
Offer, J.E., McNulty, D. & Logue, D.N. (2000). Observations of lameness, hoof conformation and development of lesions in
dairy cattle over four lactations. Veterinary Record, vol. 147, pp. 105-109.
Onyiro, O.M. & Brotherstone, S. (2008). Genetic analysis of locomotion and associated conformation traits of Holstein-
Friesian dairy cows managed in different housing systems. Journal of Dairy Science, vol. 91 (1), pp. 322–328.
Onyiro, O.M., Offer, J. & Brotherstone, S. (2008). Risk factors and milk yield losses associated with lameness in Holstein-
Friesian dairy cattle. Animal, vol. 2 (8), pp. 1230–1237.
Pryce, J. E., Esslemont, R. J., Thompson, R., Veerkamp, R. F., Kossaibati, M. A. & Simm, G. (1998). Estimation of genetic
parameters using health, fertility and production data from a management recording system for dairy cattle. Animal Science,
vol. 66 (3), pp. 577-584.
Rajala-Schultz, P.J. & Gröhn, Y.T. (1999). Culling of dairy cows. Part I. Effects of diseases on culling in Finnish Ayrshire
cows. Preventive Veterinary Medicine, vol. 41 (2–3), pp. 195–208.
Rajala-Schultz, P.J., Gröhn, Y.T. & McCulloch, C.E. (1999). Effects of milk fever, ketosis, and lameness on milk yield in
dairy cows. Journal of Dairy Science, vol. 82 (2), pp. 288–294.
Rajala-Schultz, P.J. & Gröhn, Y.T. (1999c). Culling of dairy cows. Part III. Effects of diseases, pregnancy status and milk
yield on culling in Finnish Ayrshire cows. Preventive Veterinary Medicine, vol. 41 (4), pp. 295-309.
SCB (2014). Jordbruksstatistisk årsbok 2014. Örebro: Statistiska centralbyrån
Singh, S.S., Ward, W.R., Lautenbach, K. & Murry, R.D. (1993). Behaviour of lame and
normal dairy cows in cubicles and in a straw yard. Veterinary Record, vol. 133, pp. 204–208.
Somers, J.G.C.J., Frankena, K. Noordhuizen-Stassen, E.N. & Metz J.H.M. (2003). Prevalence of claw disorders in Dutch
dairy cows exposed to several floor systems. Journal of Dairy Science, vol. 86, pp. 2082–2093.
Sogstad, Å.M., Fjeldaas, T., Østerås, O. & Plym Forshell, K. (2005). Prevalence of claw lesions in Norwegian dairy cattle
housed in tie stalls and free stalls. Preventive Veterinary Medicine, vol. 70 (3–4), pp. 191-209.
Sprecher, D.J., Hostetler, D.E. & Kaneene, J.B. (1997). A lameness scoring system that uses posture and gait to predict dairy
cattle reproductive performance. Theriogenology, vol. 47, pp. 1179-1167.
Telezhenko, E., Bergsten, C., Magnusson, M. & Nilsson, C. (2009). Effect of different flooring systems on claw
conformation of dairy cows. Journal of Dairy Science, vol. 92 (6), pp. 2625-2633.
Telezhenko, E., Lidfors, L. & Bergsten, C. (2007). Dairy cow preferences for soft or hard flooring when standing or walking.
Journal of Dairy Science, vol. 90 (8), pp. 3716-3724.
Tike (2013). Lantbruksstatistisk årsbok 2013. Helsingfors: Jord- och skogsbruksministeriets informationstjänstcental
Vermunt, J.J. (2005). The multifactorial nature of cattle lameness: A few more pieces of the jigsaw. The Veterinary Journal,
vol. 169 (3), pp. 317-318.
Växa Sverige. (2014). Redogörelse för husdjursorganisationens Djurhälsovård. Available at:
http://www.vxa.se/Global/Bildbank/Redog%C3%B6relse%20f%C3%B6r%20husdjursorganisationens%20djurh%C3%A4lso
v%C3%A5rd%202013_14.pdf
Warnick, L.D., Janssen, D., Guard, C.L. & Gröhn, Y.T. (2001). The Effect of Lameness on Milk Production in Dairy Cows.
Journal of Dairy Science, vol. 84, pp. 1988–1997.
Weaver, A.D. (1985). Lameness in cattle – Investigational and diagnostic check lists. British Veterinary Journal, vol. 141 (1),
pp. 27-33.
Wells, S.J., Trent, A.M., Marsh, W.E. & Robinson, R.A. (1993). Prevalence and severity of lameness in lactating dairy cows
in a sample of Minnesota and Wisconsin herds. Journal of the American Veterinary Medical Association, vol. 202 (1), pp.
78-82.
Whay, H.R., Main, D.C.J., Green, L.E. & Webster, A.J.F. (2002). Farmer perception of lameness prevalence. I: Shearer, J.K.
(ed.), 12th International Symposium on Lameness in Ruminants (pp. 355-358). Florida, USA January 9-13.

32
Whitaker, D.A., Kelley, J.M. & Smith, E.J. (1983). Incidence of lameness in dairy cows. Veterinary Record, vol. 113, pp. 60-
62.
Ålands Hushållningssällskap. (2013). Verksamhetsberättelse 2013. Jomala.
Ålands Hushållningssällskap. (2014). Verksamhetsberättelse 2014. Jomala.
33
Acknowledgements First I want to thank my supervisor Professor Christer Bergsten for the guidance and advice that you
have given me during this master thesis. Thanks also to Jan-Eric Englund for all the patience shown
while helping me with the statistical analyses. I would like to say a big thank you to Kerstin Lundberg
at Ålands Hushållningssällskap for all the time you have spent retrieving information that have made
this master thesis possible. Thanks also to my family for all the support and for always believing in
me, even when I did not believe in myself. Finally, I want to thank all the farmers that participated in
the study. Without you and your participation this study would not have been possible.