Embed Size (px)
Citation preview
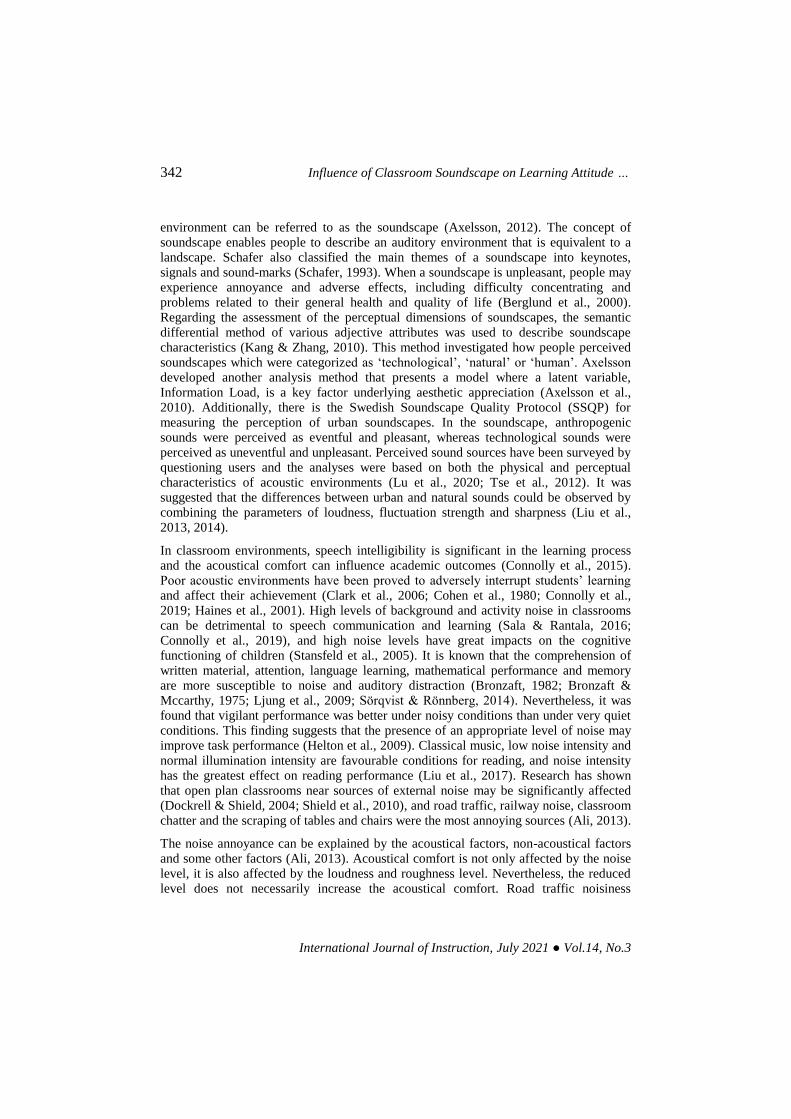
International Journal of Instruction July 2021 ● Vol.14, No.3
e-ISSN: 1308-1470 ● www.e-iji.net p-ISSN: 1694-609X pp. 341-358
Citation: Chan, Y. N., Choy, Y. S., To, W. M., & Lai, T. M. (2021). Influence of Classroom
Soundscape on Learning Attitude. International Journal of Instruction, 14(3), 341-358.
https://doi.org/10.29333/iji.2021.14320a
Article submission code: 20200503170234
Received: 03/05/2020 Revision: 18/12/2020
Accepted: 12/01/2021 OnlineFirst: 17/05/2021
Influence of Classroom Soundscape on Learning Attitude
Ying-Ngai Chan Student, Hong Kong Polytechnic University, Department of Mechanical Engineering, China, [email protected]
Yat-Sze Choy Assoc. Prof., Hong Kong Polytechnic University, Department of Mechanical Engineering, China, [email protected]
Wai-Ming To Prof., Macao Polytechnic Institute, School of Business, China, [email protected]
Tsz-Ming Lai Assoc. Prof., Macao Polytechnic Institute, School of Business, China, [email protected]
This study aims to investigate the interaction between acoustical and psychological features in the perception of soundscape to improve the learning attitude. Sound measurements were performed in nine classrooms in three Hong Kong’s higher education institutions and questionnaires were used to collect responses from 209 students who attended lectures. The measured sound levels ranged from LAeq 55.20 to 73.55 dB. The corresponding values of loudness ranged from 2.78 to 12.5 sones and fluctuation strengths ranged from 1.17 to 2.33 vacils. Students indicated that anthropogenic sounds such as people shouting, playing, and talking were quite frequent and unpleasant. The results of structural equation modelling showed that classroom acoustical environments with lower sound levels, loudness, and fluctuation strengths would positively influence acoustical perceptions, encompassing acoustical comfort, acoustical calmness, acoustical satisfaction, and hearing of natural sounds while students’ favourable acoustical perceptions promoted their learning attitude. The findings of the study confirmed that anthropogenic sounds negatively affected students’ learning attitude in the higher education context.
Keywords: classroom, soundscapes, learning attitude, learning motivation, structural equation model, natural sounds, anthropogenic sounds
INTRODUCTION
Urban environments are characterized by a variety of sound sources. The interaction between sound sources, the individual interpretations of sound and the acoustical
342 Influence of Classroom Soundscape on Learning Attitude …
International Journal of Instruction, July 2021 ● Vol.14, No.3
environment can be referred to as the soundscape (Axelsson, 2012). The concept of soundscape enables people to describe an auditory environment that is equivalent to a landscape. Schafer also classified the main themes of a soundscape into keynotes, signals and sound-marks (Schafer, 1993). When a soundscape is unpleasant, people may experience annoyance and adverse effects, including difficulty concentrating and problems related to their general health and quality of life (Berglund et al., 2000). Regarding the assessment of the perceptual dimensions of soundscapes, the semantic differential method of various adjective attributes was used to describe soundscape characteristics (Kang & Zhang, 2010). This method investigated how people perceived soundscapes which were categorized as ‘technological’, ‘natural’ or ‘human’. Axelsson developed another analysis method that presents a model where a latent variable, Information Load, is a key factor underlying aesthetic appreciation (Axelsson et al., 2010). Additionally, there is the Swedish Soundscape Quality Protocol (SSQP) for measuring the perception of urban soundscapes. In the soundscape, anthropogenic sounds were perceived as eventful and pleasant, whereas technological sounds were perceived as uneventful and unpleasant. Perceived sound sources have been surveyed by questioning users and the analyses were based on both the physical and perceptual characteristics of acoustic environments (Lu et al., 2020; Tse et al., 2012). It was suggested that the differences between urban and natural sounds could be observed by combining the parameters of loudness, fluctuation strength and sharpness (Liu et al., 2013, 2014).
In classroom environments, speech intelligibility is significant in the learning process and the acoustical comfort can influence academic outcomes (Connolly et al., 2015). Poor acoustic environments have been proved to adversely interrupt students’ learning and affect their achievement (Clark et al., 2006; Cohen et al., 1980; Connolly et al., 2019; Haines et al., 2001). High levels of background and activity noise in classrooms can be detrimental to speech communication and learning (Sala & Rantala, 2016; Connolly et al., 2019), and high noise levels have great impacts on the cognitive functioning of children (Stansfeld et al., 2005). It is known that the comprehension of written material, attention, language learning, mathematical performance and memory are more susceptible to noise and auditory distraction (Bronzaft, 1982; Bronzaft & Mccarthy, 1975; Ljung et al., 2009; Sörqvist & Rönnberg, 2014). Nevertheless, it was found that vigilant performance was better under noisy conditions than under very quiet conditions. This finding suggests that the presence of an appropriate level of noise may improve task performance (Helton et al., 2009). Classical music, low noise intensity and normal illumination intensity are favourable conditions for reading, and noise intensity has the greatest effect on reading performance (Liu et al., 2017). Research has shown that open plan classrooms near sources of external noise may be significantly affected (Dockrell & Shield, 2004; Shield et al., 2010), and road traffic, railway noise, classroom chatter and the scraping of tables and chairs were the most annoying sources (Ali, 2013).
The noise annoyance can be explained by the acoustical factors, non-acoustical factors and some other factors (Ali, 2013). Acoustical comfort is not only affected by the noise level, it is also affected by the loudness and roughness level. Nevertheless, the reduced level does not necessarily increase the acoustical comfort. Road traffic noisiness
Chan, Choy, To & Lai 343
International Journal of Instruction, July 2021 ● Vol.14, No.3
disturbance was found significantly correlated with the noise level, loudness, fluctuation strength and roughness; however, it did not significantly correlate with sharpness (Sheikh et al., 2014). Moreover, continuous exposure to chronic noise may result in poor academic performance, motivation and concentration (Trimmel et al., 2012). Acoustical environments under different soundscapes can be either acoustically comfortable or uncomfortable in terms of students’ emotions and their learning process. Additionally, previous researches mainly focused on classroom soundscape in the Western countries (Bronzaft, 1981; Clark et al., 2006; Connolly et al., 2015, 2019; Dockrell & Shield, 2004; Haines et al., 2001; Ljung et al., 2009; Sala & Rantala, 2016). There are scarce studies on classroom soundscape in Asian countries (Chan et al., 2015; Sajin et al., 2019). Chan et al. measured background noise levels in 146 occupied classrooms in Hong Kong’s kindergartens, primary schools and secondary schools (Chan et al., 2015). They reported that the mean background noise levels in the four classroom types i.e. kindergarten, primary, junior secondary and senior secondary ranged from 67 to 70 dBA which was far from satisfactory for unamplified speeches given by teachers. For that reason, it is worthwhile to conduct research on the classification of classroom soundscape and acoustical indicators that differentiate these perceptual categories. Specifically, this study aims to address the following two research questions: (1) What are the sound levels, loudness, and fluctuation strengths of sounds experienced by Hong Kong’s higher education students in classrooms? (2) What are the factors influencing students’ learning attitude? Specifically, sound measurements were performed in classrooms in Hong Kong’s higher education institutions. Additionally, a self-administrated questionnaire survey was conducted to identify sound sources in classrooms, students’ acoustical perceptions, and their learning attitude. The interaction between acoustical and psychological features in the perception of soundscape was investigated so that the strategy or direction of enhancing teaching and learning effectiveness can be recognized.
METHOD
The study involved two types of data: the first type was the sound data recorded in classrooms during lessons; the second type was students’ perceptions of classroom soundscape during lessons. The collection of these data was presented separately in the following subsections.
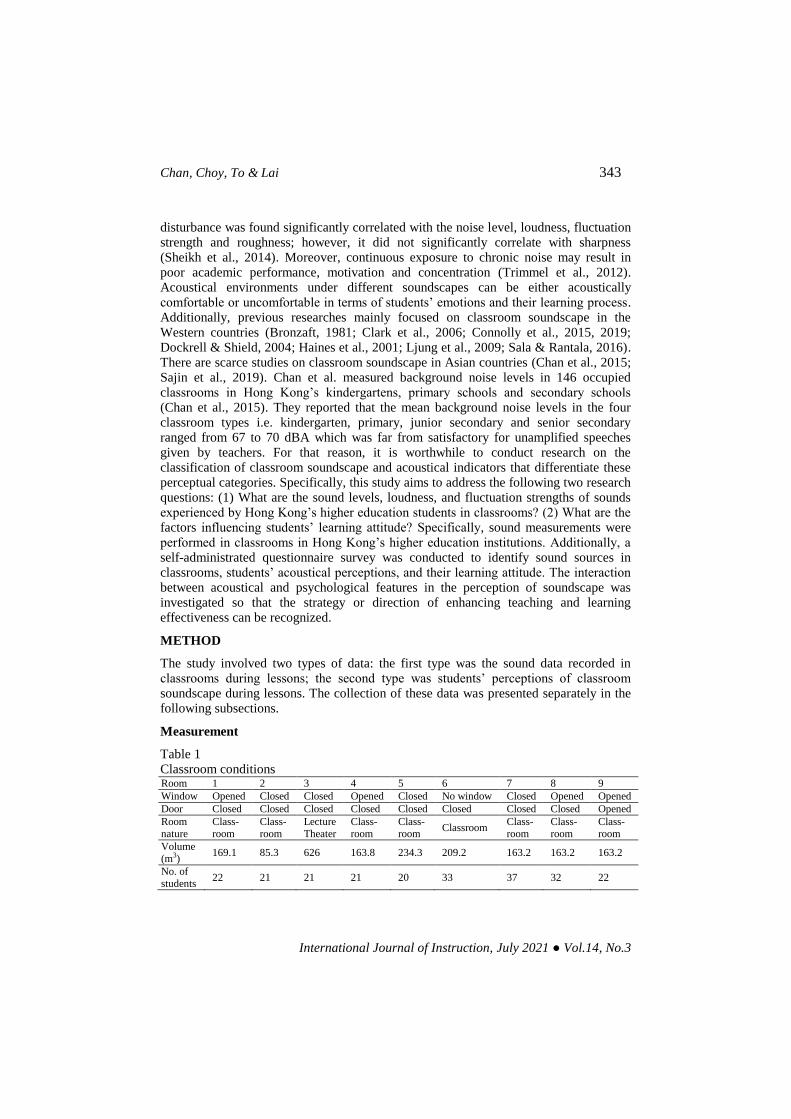
Measurement
Table 1 Classroom conditions Room 1 2 3 4 5 6 7 8 9
Window Opened Closed Closed Opened Closed No window Closed Opened Opened
Door Closed Closed Closed Closed Closed Closed Closed Closed Opened
Room nature
Class-room
Class-room
Lecture Theater
Class-room
Class-room
Classroom Class-room
Class-room
Class-room
Volume (m3)
169.1 85.3 626 163.8 234.3 209.2 163.2 163.2 163.2
No. of students
22 21 21 21 20 33 37 32 22
344 Influence of Classroom Soundscape on Learning Attitude …
International Journal of Instruction, July 2021 ● Vol.14, No.3
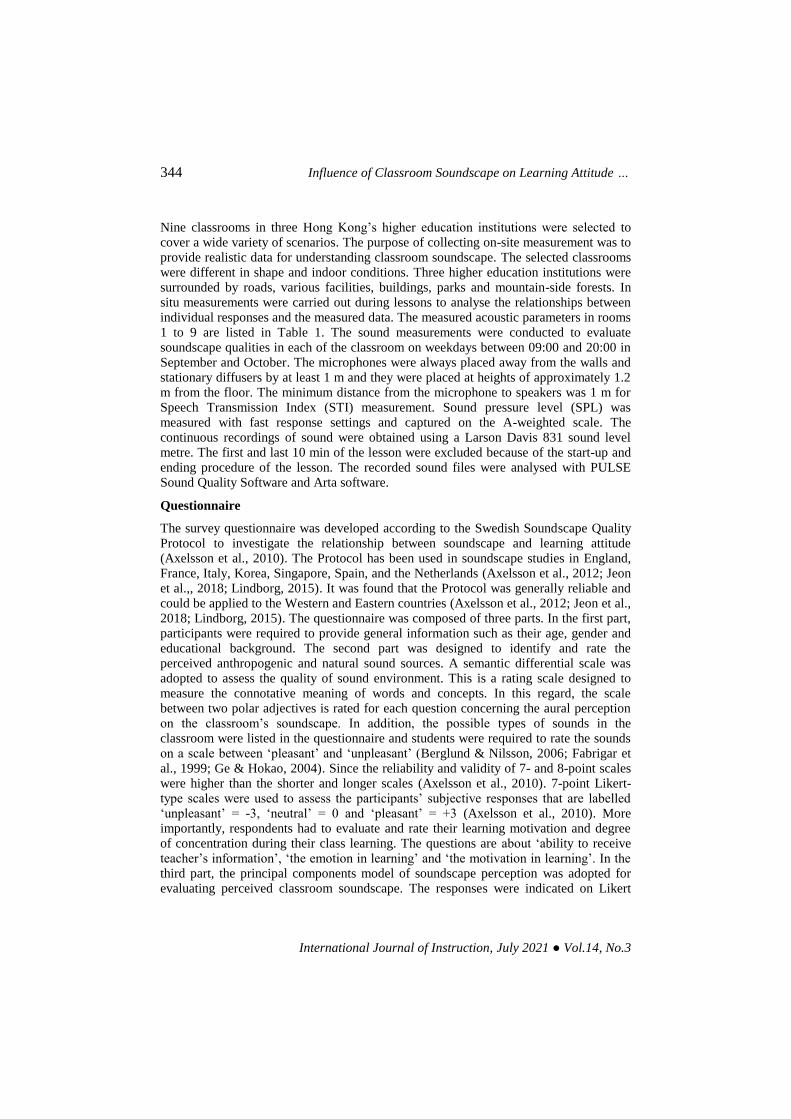
Nine classrooms in three Hong Kong’s higher education institutions were selected to cover a wide variety of scenarios. The purpose of collecting on-site measurement was to provide realistic data for understanding classroom soundscape. The selected classrooms were different in shape and indoor conditions. Three higher education institutions were surrounded by roads, various facilities, buildings, parks and mountain-side forests. In situ measurements were carried out during lessons to analyse the relationships between individual responses and the measured data. The measured acoustic parameters in rooms 1 to 9 are listed in Table 1. The sound measurements were conducted to evaluate soundscape qualities in each of the classroom on weekdays between 09:00 and 20:00 in September and October. The microphones were always placed away from the walls and stationary diffusers by at least 1 m and they were placed at heights of approximately 1.2 m from the floor. The minimum distance from the microphone to speakers was 1 m for Speech Transmission Index (STI) measurement. Sound pressure level (SPL) was measured with fast response settings and captured on the A-weighted scale. The continuous recordings of sound were obtained using a Larson Davis 831 sound level metre. The first and last 10 min of the lesson were excluded because of the start-up and ending procedure of the lesson. The recorded sound files were analysed with PULSE Sound Quality Software and Arta software.
Questionnaire
The survey questionnaire was developed according to the Swedish Soundscape Quality Protocol to investigate the relationship between soundscape and learning attitude (Axelsson et al., 2010). The Protocol has been used in soundscape studies in England, France, Italy, Korea, Singapore, Spain, and the Netherlands (Axelsson et al., 2012; Jeon et al.,, 2018; Lindborg, 2015). It was found that the Protocol was generally reliable and could be applied to the Western and Eastern countries (Axelsson et al., 2012; Jeon et al., 2018; Lindborg, 2015). The questionnaire was composed of three parts. In the first part, participants were required to provide general information such as their age, gender and educational background. The second part was designed to identify and rate the perceived anthropogenic and natural sound sources. A semantic differential scale was adopted to assess the quality of sound environment. This is a rating scale designed to measure the connotative meaning of words and concepts. In this regard, the scale between two polar adjectives is rated for each question concerning the aural perception on the classroom’s soundscape. In addition, the possible types of sounds in the classroom were listed in the questionnaire and students were required to rate the sounds on a scale between ‘pleasant’ and ‘unpleasant’ (Berglund & Nilsson, 2006; Fabrigar et al., 1999; Ge & Hokao, 2004). Since the reliability and validity of 7- and 8-point scales were higher than the shorter and longer scales (Axelsson et al., 2010). 7-point Likert-type scales were used to assess the participants’ subjective responses that are labelled ‘unpleasant’ = -3, ‘neutral’ = 0 and ‘pleasant’ = +3 (Axelsson et al., 2010). More importantly, respondents had to evaluate and rate their learning motivation and degree of concentration during their class learning. The questions are about ‘ability to receive teacher’s information’, ‘the emotion in learning’ and ‘the motivation in learning’. In the third part, the principal components model of soundscape perception was adopted for evaluating perceived classroom soundscape. The responses were indicated on Likert
Chan, Choy, To & Lai 345
International Journal of Instruction, July 2021 ● Vol.14, No.3
scales which rated acoustical comfort, feeling acoustical eventfulness, feeling of the presence of natural or artificial sound, level of excitement, acoustical calmness and satisfaction with the aural environment. At the end of the questionnaire, participants were asked to suggest improvements about classroom soundscape.
Survey data collection and analysis
The research team distributed copies of the questionnaire to students and introduced the purpose of the survey before the classes began. Students were requested to fill in the questionnaire right after the lessons. It was suggested that a sample size of 200 or more can offer sufficient statistical power for data analysis (Steiger, 1990). Originally, there were 229 students in nine classes. 209 questionnaires were completed and returned by students (39 females, 158 males, 12 unspecified) who participated in the lessons. The participants were ranged between 17 and 30 years of age. Therefore, 91.3% of 229 questionnaires (i.e., 209 cases) were valid. The margin of error of the collected data was calculated to be 7% with a 95% confidence level assumption (Weerahandi, 1993). The survey data were entered into an IBM SPSS 25.0 file. Descriptive statistics were used to identify the demographic profile of respondents and the frequency of occurrence of sounds in classrooms and students’ subjective evaluation. The data were combined with the key acoustical indicators identified by sound measurements and analysed with IBM SPSS Amos 25.0. Structural equation modelling was used to determine whether and how physical (i.e. acoustical) indicators influences students’ acoustical perceptions that in turn affects their learning attitude.
FINDINGS
Influence of different type of sound sources
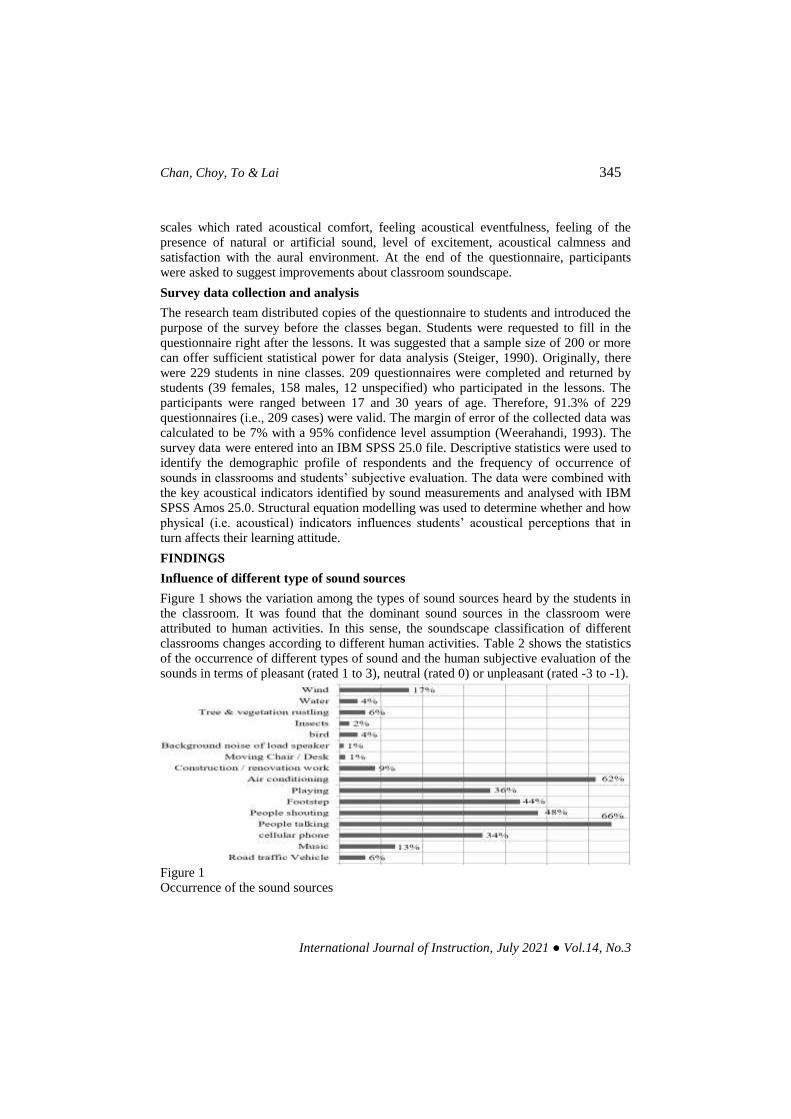
Figure 1 shows the variation among the types of sound sources heard by the students in the classroom. It was found that the dominant sound sources in the classroom were attributed to human activities. In this sense, the soundscape classification of different classrooms changes according to different human activities. Table 2 shows the statistics of the occurrence of different types of sound and the human subjective evaluation of the sounds in terms of pleasant (rated 1 to 3), neutral (rated 0) or unpleasant (rated -3 to -1).
Figure 1 Occurrence of the sound sources
346 Influence of Classroom Soundscape on Learning Attitude …
International Journal of Instruction, July 2021 ● Vol.14, No.3
Table 2 The statistics of occurrence of sounds and the listeners' subjective evaluation
Traffic sounds Anthropogenic sounds Natural Sounds
Percentage of Occurrence 1.8% 88.6% 9.6%
-3 to -1 (Unpleasant) 23.1% 42.7% 14.1%
0 (Neutral) 30.8% 22.3% 22.5%
1 to 3 (Pleasant) 46.2% 35.1% 63.4%
Figure 1 shows that the main noise sources noted in the classrooms originated inside the institutions, similar to the findings of Silva et al. (2016) and Zannin & Marcon (2007). The noises were mainly generated in the classroom but not from outside when the institutions were in operation which led to the difficulties in hearing teachers’ voices. Noises produced by students in the classroom were more disrupting than noises from outside. The findings were similar to what reported by Enmarker & Boman (2004) who identified the most disturbing and annoying noises to be sounds from the school yard, sounds from the corridor, chatter in the classroom, sounds from apparatus and scraping sounds from chairs and tables, ventilation noise, and traffic noise. Table 2 shows that there was a high percentage of anthropogenic sounds (88.6%) heard in classrooms and most students showed that they felt an unpleasant sensation with this kind of sound (42.7%). Most of the time, the students heard anthropogenic sounds rather than natural sounds, and many students (63.4%) showed that they felt a pleasant sensation with natural sound. The result indicated that 23.1% of the students claimed that the traffic sound was unpleasant, whereas 46.2% of them thought that it was pleasant. Approximately 22%-31% of the respondents showed a zero or neutral score, no matter if it was traffic sound, anthropogenic sound or natural sound. The result implied that the characteristic of classrooms soundscape is dominated by the sound sources in an indoor environment.
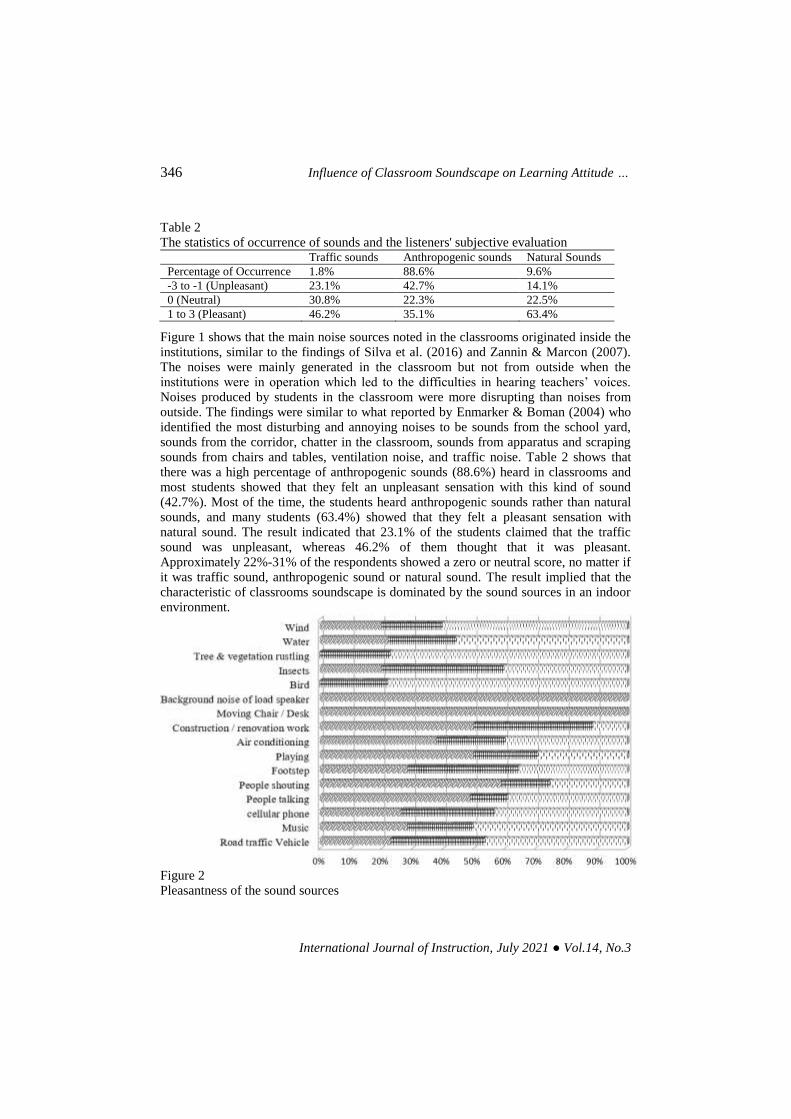
Figure 2 Pleasantness of the sound sources
Chan, Choy, To & Lai 347
International Journal of Instruction, July 2021 ● Vol.14, No.3
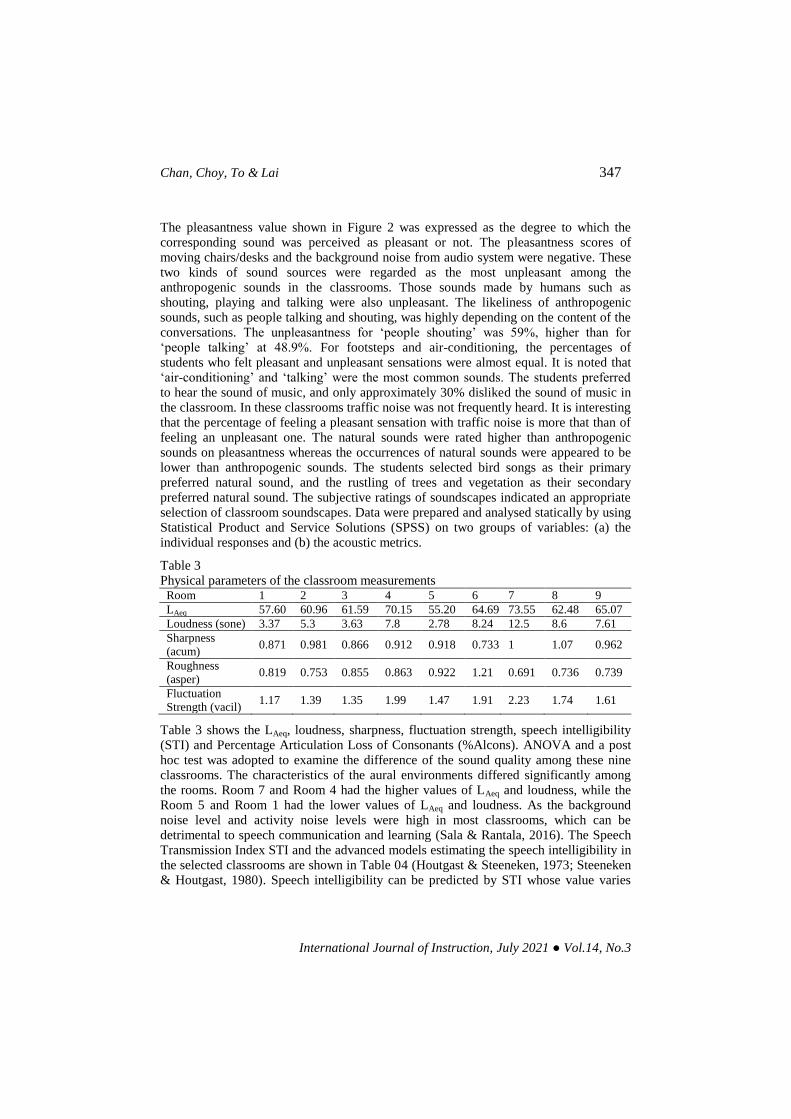
The pleasantness value shown in Figure 2 was expressed as the degree to which the corresponding sound was perceived as pleasant or not. The pleasantness scores of moving chairs/desks and the background noise from audio system were negative. These two kinds of sound sources were regarded as the most unpleasant among the anthropogenic sounds in the classrooms. Those sounds made by humans such as shouting, playing and talking were also unpleasant. The likeliness of anthropogenic sounds, such as people talking and shouting, was highly depending on the content of the conversations. The unpleasantness for ‘people shouting’ was 59%, higher than for ‘people talking’ at 48.9%. For footsteps and air-conditioning, the percentages of students who felt pleasant and unpleasant sensations were almost equal. It is noted that ‘air-conditioning’ and ‘talking’ were the most common sounds. The students preferred to hear the sound of music, and only approximately 30% disliked the sound of music in the classroom. In these classrooms traffic noise was not frequently heard. It is interesting that the percentage of feeling a pleasant sensation with traffic noise is more that than of feeling an unpleasant one. The natural sounds were rated higher than anthropogenic sounds on pleasantness whereas the occurrences of natural sounds were appeared to be lower than anthropogenic sounds. The students selected bird songs as their primary preferred natural sound, and the rustling of trees and vegetation as their secondary preferred natural sound. The subjective ratings of soundscapes indicated an appropriate selection of classroom soundscapes. Data were prepared and analysed statically by using Statistical Product and Service Solutions (SPSS) on two groups of variables: (a) the individual responses and (b) the acoustic metrics.
Table 3 Physical parameters of the classroom measurements
Room 1 2 3 4 5 6 7 8 9
LAeq 57.60 60.96 61.59 70.15 55.20 64.69 73.55 62.48 65.07
Loudness (sone) 3.37 5.3 3.63 7.8 2.78 8.24 12.5 8.6 7.61
Sharpness (acum)
0.871 0.981 0.866 0.912 0.918 0.733 1 1.07 0.962
Roughness (asper)
0.819 0.753 0.855 0.863 0.922 1.21 0.691 0.736 0.739
Fluctuation Strength (vacil)
1.17 1.39 1.35 1.99 1.47 1.91 2.23 1.74 1.61
Table 3 shows the LAeq, loudness, sharpness, fluctuation strength, speech intelligibility (STI) and Percentage Articulation Loss of Consonants (%Alcons). ANOVA and a post hoc test was adopted to examine the difference of the sound quality among these nine classrooms. The characteristics of the aural environments differed significantly among the rooms. Room 7 and Room 4 had the higher values of LAeq and loudness, while the Room 5 and Room 1 had the lower values of LAeq and loudness. As the background noise level and activity noise levels were high in most classrooms, which can be detrimental to speech communication and learning (Sala & Rantala, 2016). The Speech Transmission Index STI and the advanced models estimating the speech intelligibility in the selected classrooms are shown in Table 04 (Houtgast & Steeneken, 1973; Steeneken & Houtgast, 1980). Speech intelligibility can be predicted by STI whose value varies
348 Influence of Classroom Soundscape on Learning Attitude …
International Journal of Instruction, July 2021 ● Vol.14, No.3
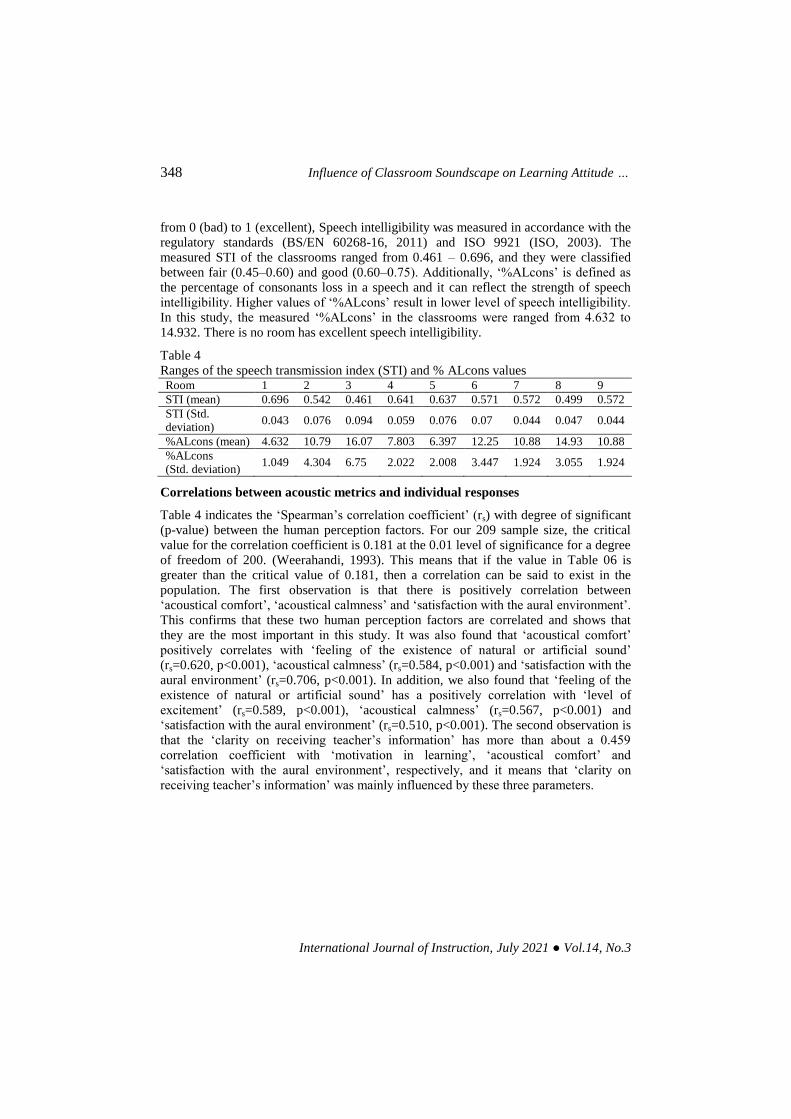
from 0 (bad) to 1 (excellent), Speech intelligibility was measured in accordance with the regulatory standards (BS/EN 60268-16, 2011) and ISO 9921 (ISO, 2003). The measured STI of the classrooms ranged from 0.461 – 0.696, and they were classified between fair (0.45–0.60) and good (0.60–0.75). Additionally, ‘%ALcons’ is defined as the percentage of consonants loss in a speech and it can reflect the strength of speech intelligibility. Higher values of ‘%ALcons’ result in lower level of speech intelligibility. In this study, the measured ‘%ALcons’ in the classrooms were ranged from 4.632 to 14.932. There is no room has excellent speech intelligibility.
Table 4 Ranges of the speech transmission index (STI) and % ALcons values Room 1 2 3 4 5 6 7 8 9
STI (mean) 0.696 0.542 0.461 0.641 0.637 0.571 0.572 0.499 0.572
STI (Std. deviation)
0.043 0.076 0.094 0.059 0.076 0.07 0.044 0.047 0.044
%ALcons (mean) 4.632 10.79 16.07 7.803 6.397 12.25 10.88 14.93 10.88
%ALcons (Std. deviation)
1.049 4.304 6.75 2.022 2.008 3.447 1.924 3.055 1.924
Correlations between acoustic metrics and individual responses
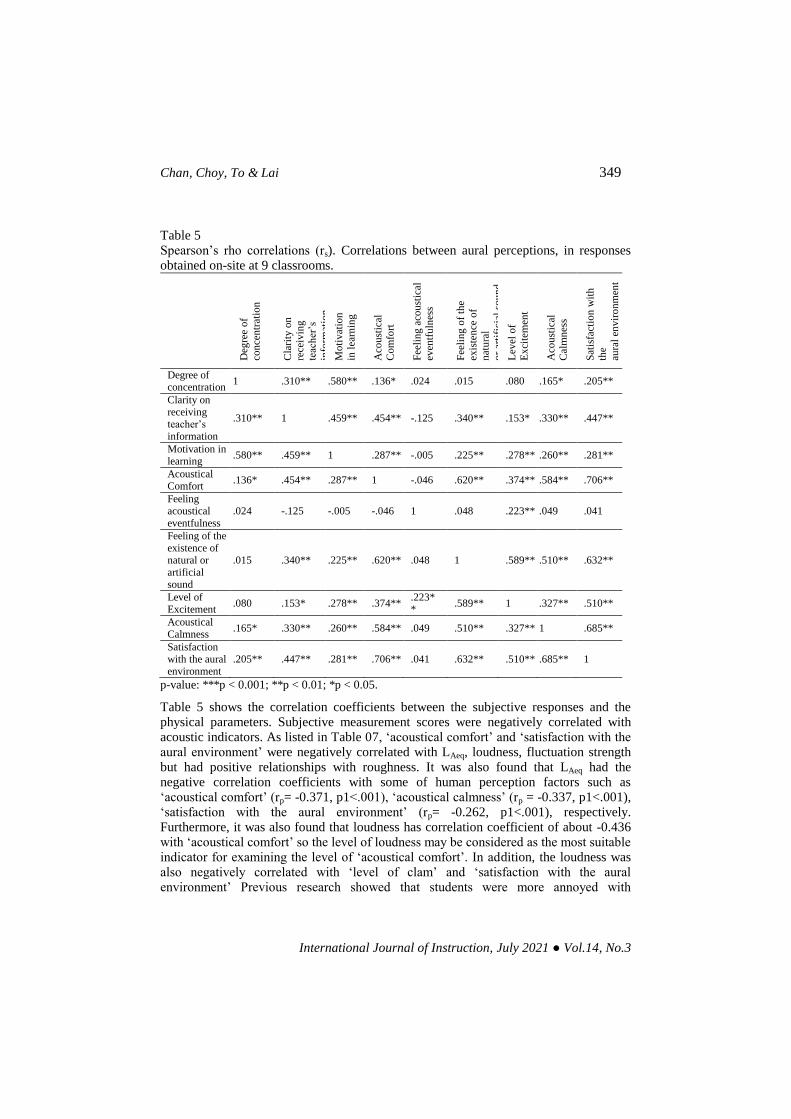
Table 4 indicates the ‘Spearman’s correlation coefficient’ (rs) with degree of significant (p-value) between the human perception factors. For our 209 sample size, the critical value for the correlation coefficient is 0.181 at the 0.01 level of significance for a degree of freedom of 200. (Weerahandi, 1993). This means that if the value in Table 06 is greater than the critical value of 0.181, then a correlation can be said to exist in the population. The first observation is that there is positively correlation between ‘acoustical comfort’, ‘acoustical calmness’ and ‘satisfaction with the aural environment’. This confirms that these two human perception factors are correlated and shows that they are the most important in this study. It was also found that ‘acoustical comfort’ positively correlates with ‘feeling of the existence of natural or artificial sound’ (rs=0.620, p<0.001), ‘acoustical calmness’ (rs=0.584, p<0.001) and ‘satisfaction with the aural environment’ (rs=0.706, p<0.001). In addition, we also found that ‘feeling of the existence of natural or artificial sound’ has a positively correlation with ‘level of excitement’ (rs=0.589, p<0.001), ‘acoustical calmness’ (rs=0.567, p<0.001) and ‘satisfaction with the aural environment’ (rs=0.510, p<0.001). The second observation is that the ‘clarity on receiving teacher’s information’ has more than about a 0.459 correlation coefficient with ‘motivation in learning’, ‘acoustical comfort’ and ‘satisfaction with the aural environment’, respectively, and it means that ‘clarity on receiving teacher’s information’ was mainly influenced by these three parameters.
Chan, Choy, To & Lai 349
International Journal of Instruction, July 2021 ● Vol.14, No.3
Table 5 Spearson’s rho correlations (rs). Correlations between aural perceptions, in responses obtained on-site at 9 classrooms.
Deg
ree
of
con
cen
trat
ion
Cla
rity
on
rece
ivin
g
teac
her
’s
info
rmat
ion
Mo
tiv
atio
n
in l
earn
ing
Aco
ust
ical
Co
mfo
rt
Fee
lin
g a
cou
stic
al
even
tfu
lnes
s
Fee
lin
g o
f th
e
exis
ten
ce o
f
nat
ura
l
or
arti
fici
al s
ou
nd
Lev
el o
f
Ex
cite
men
t
Aco
ust
ical
Cal
mn
ess
Sat
isfa
ctio
n w
ith
the
aura
l en
vir
on
men
t
Degree of concentration
1 .310** .580** .136* .024 .015 .080 .165* .205**
Clarity on receiving teacher’s information
.310** 1 .459** .454** -.125 .340** .153* .330** .447**
Motivation in learning
.580** .459** 1 .287** -.005 .225** .278** .260** .281**
Acoustical Comfort
.136* .454** .287** 1 -.046 .620** .374** .584** .706**
Feeling acoustical eventfulness
.024 -.125 -.005 -.046 1 .048 .223** .049 .041
Feeling of the
existence of natural or artificial sound
.015 .340** .225** .620** .048 1 .589** .510** .632**
Level of Excitement
.080 .153* .278** .374** .223**
.589** 1 .327** .510**
Acoustical Calmness
.165* .330** .260** .584** .049 .510** .327** 1 .685**
Satisfaction with the aural environment
.205** .447** .281** .706** .041 .632** .510** .685** 1
p-value: ***p < 0.001; **p < 0.01; *p < 0.05.
Table 5 shows the correlation coefficients between the subjective responses and the physical parameters. Subjective measurement scores were negatively correlated with acoustic indicators. As listed in Table 07, ‘acoustical comfort’ and ‘satisfaction with the aural environment’ were negatively correlated with LAeq, loudness, fluctuation strength but had positive relationships with roughness. It was also found that LAeq had the negative correlation coefficients with some of human perception factors such as ‘acoustical comfort’ (rp= -0.371, p1<.001), ‘acoustical calmness’ (rp = -0.337, p1<.001), ‘satisfaction with the aural environment’ (rp= -0.262, p1<.001), respectively. Furthermore, it was also found that loudness has correlation coefficient of about -0.436 with ‘acoustical comfort’ so the level of loudness may be considered as the most suitable indicator for examining the level of ‘acoustical comfort’. In addition, the loudness was also negatively correlated with ‘level of clam’ and ‘satisfaction with the aural environment’ Previous research showed that students were more annoyed with
350 Influence of Classroom Soundscape on Learning Attitude …
International Journal of Instruction, July 2021 ● Vol.14, No.3
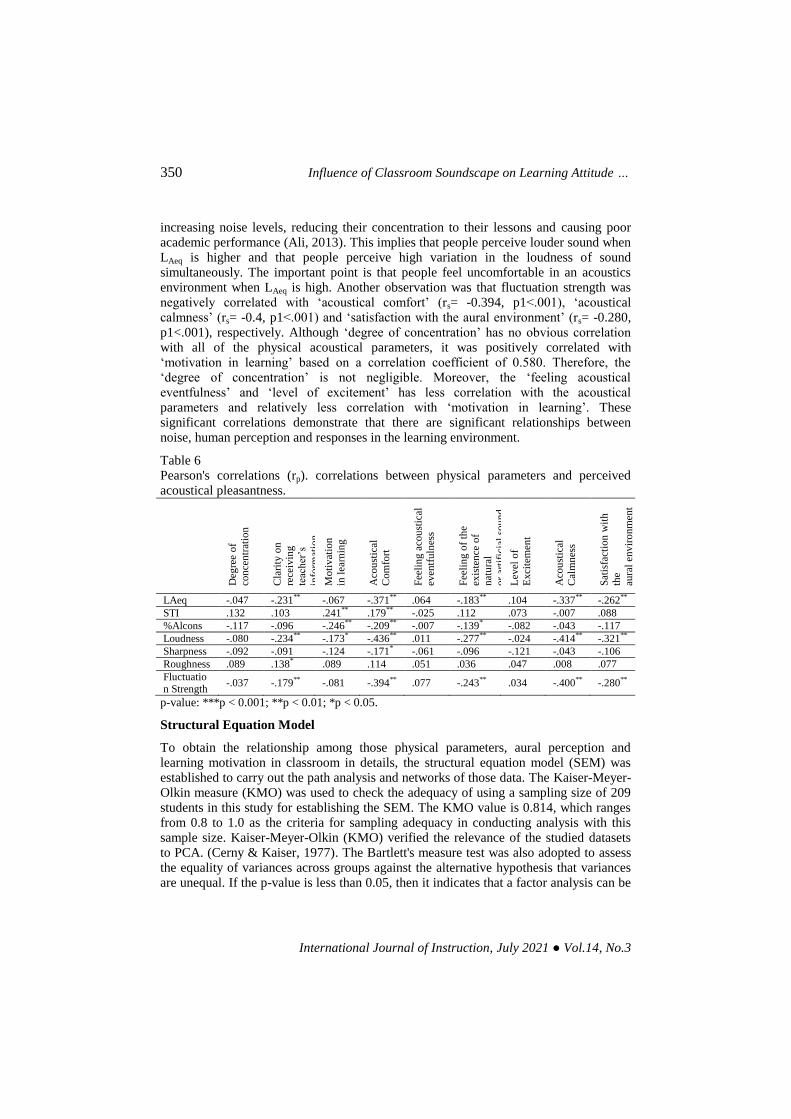
increasing noise levels, reducing their concentration to their lessons and causing poor academic performance (Ali, 2013). This implies that people perceive louder sound when LAeq is higher and that people perceive high variation in the loudness of sound simultaneously. The important point is that people feel uncomfortable in an acoustics environment when LAeq is high. Another observation was that fluctuation strength was negatively correlated with ‘acoustical comfort’ (rs= -0.394, p1<.001), ‘acoustical calmness’ (rs= -0.4, p1<.001) and ‘satisfaction with the aural environment’ (rs= -0.280, p1<.001), respectively. Although ‘degree of concentration’ has no obvious correlation with all of the physical acoustical parameters, it was positively correlated with ‘motivation in learning’ based on a correlation coefficient of 0.580. Therefore, the ‘degree of concentration’ is not negligible. Moreover, the ‘feeling acoustical eventfulness’ and ‘level of excitement’ has less correlation with the acoustical parameters and relatively less correlation with ‘motivation in learning’. These significant correlations demonstrate that there are significant relationships between noise, human perception and responses in the learning environment.
Table 6 Pearson's correlations (rp). correlations between physical parameters and perceived acoustical pleasantness.
Deg
ree
of
con
cen
trat
ion
Cla
rity
on
rece
ivin
g
teac
her
’s
info
rmat
ion
Mo
tiv
atio
n
in l
earn
ing
Aco
ust
ical
Co
mfo
rt
Fee
lin
g a
cou
stic
al
even
tfu
lnes
s
Fee
lin
g o
f th
e
exis
ten
ce o
f
nat
ura
l
or
arti
fici
al s
ou
nd
Lev
el o
f
Ex
cite
men
t
Aco
ust
ical
Cal
mn
ess
Sat
isfa
ctio
n w
ith
the
aura
l en
vir
on
men
t
LAeq -.047 -.231** -.067 -.371** .064 -.183** .104 -.337** -.262**
STI .132 .103 .241** .179** -.025 .112 .073 -.007 .088
%Alcons -.117 -.096 -.246** -.209** -.007 -.139* -.082 -.043 -.117
Loudness -.080 -.234** -.173* -.436** .011 -.277** -.024 -.414** -.321**
Sharpness -.092 -.091 -.124 -.171* -.061 -.096 -.121 -.043 -.106
Roughness .089 .138* .089 .114 .051 .036 .047 .008 .077
Fluctuation Strength
-.037 -.179** -.081 -.394** .077 -.243** .034 -.400** -.280**
p-value: ***p < 0.001; **p < 0.01; *p < 0.05.
Structural Equation Model
To obtain the relationship among those physical parameters, aural perception and learning motivation in classroom in details, the structural equation model (SEM) was established to carry out the path analysis and networks of those data. The Kaiser-Meyer-Olkin measure (KMO) was used to check the adequacy of using a sampling size of 209 students in this study for establishing the SEM. The KMO value is 0.814, which ranges from 0.8 to 1.0 as the criteria for sampling adequacy in conducting analysis with this sample size. Kaiser-Meyer-Olkin (KMO) verified the relevance of the studied datasets to PCA. (Cerny & Kaiser, 1977). The Bartlett's measure test was also adopted to assess the equality of variances across groups against the alternative hypothesis that variances are unequal. If the p-value is less than 0.05, then it indicates that a factor analysis can be
Chan, Choy, To & Lai 351
International Journal of Instruction, July 2021 ● Vol.14, No.3
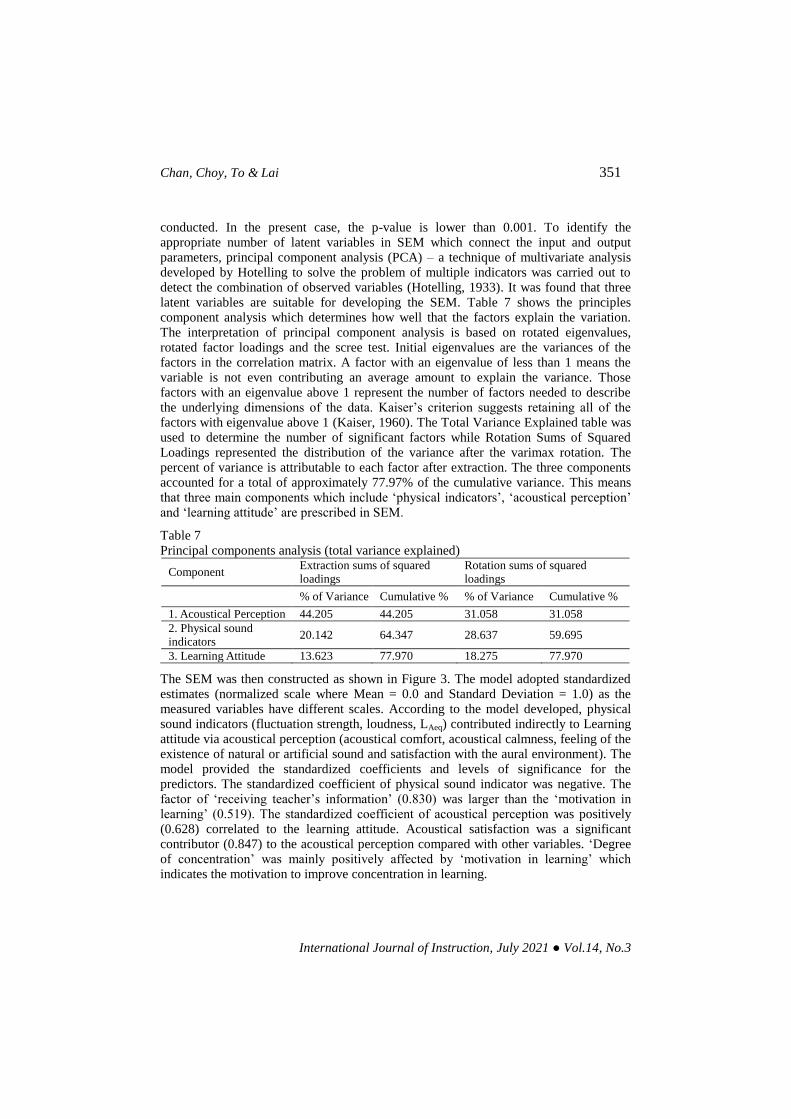
conducted. In the present case, the p-value is lower than 0.001. To identify the appropriate number of latent variables in SEM which connect the input and output parameters, principal component analysis (PCA) – a technique of multivariate analysis developed by Hotelling to solve the problem of multiple indicators was carried out to detect the combination of observed variables (Hotelling, 1933). It was found that three latent variables are suitable for developing the SEM. Table 7 shows the principles component analysis which determines how well that the factors explain the variation. The interpretation of principal component analysis is based on rotated eigenvalues, rotated factor loadings and the scree test. Initial eigenvalues are the variances of the factors in the correlation matrix. A factor with an eigenvalue of less than 1 means the variable is not even contributing an average amount to explain the variance. Those factors with an eigenvalue above 1 represent the number of factors needed to describe the underlying dimensions of the data. Kaiser’s criterion suggests retaining all of the factors with eigenvalue above 1 (Kaiser, 1960). The Total Variance Explained table was used to determine the number of significant factors while Rotation Sums of Squared Loadings represented the distribution of the variance after the varimax rotation. The percent of variance is attributable to each factor after extraction. The three components accounted for a total of approximately 77.97% of the cumulative variance. This means that three main components which include ‘physical indicators’, ‘acoustical perception’ and ‘learning attitude’ are prescribed in SEM.
Table 7 Principal components analysis (total variance explained)
Component Extraction sums of squared loadings
Rotation sums of squared loadings
% of Variance Cumulative % % of Variance Cumulative %
1. Acoustical Perception 44.205 44.205 31.058 31.058
2. Physical sound indicators
20.142 64.347 28.637 59.695
3. Learning Attitude 13.623 77.970 18.275 77.970
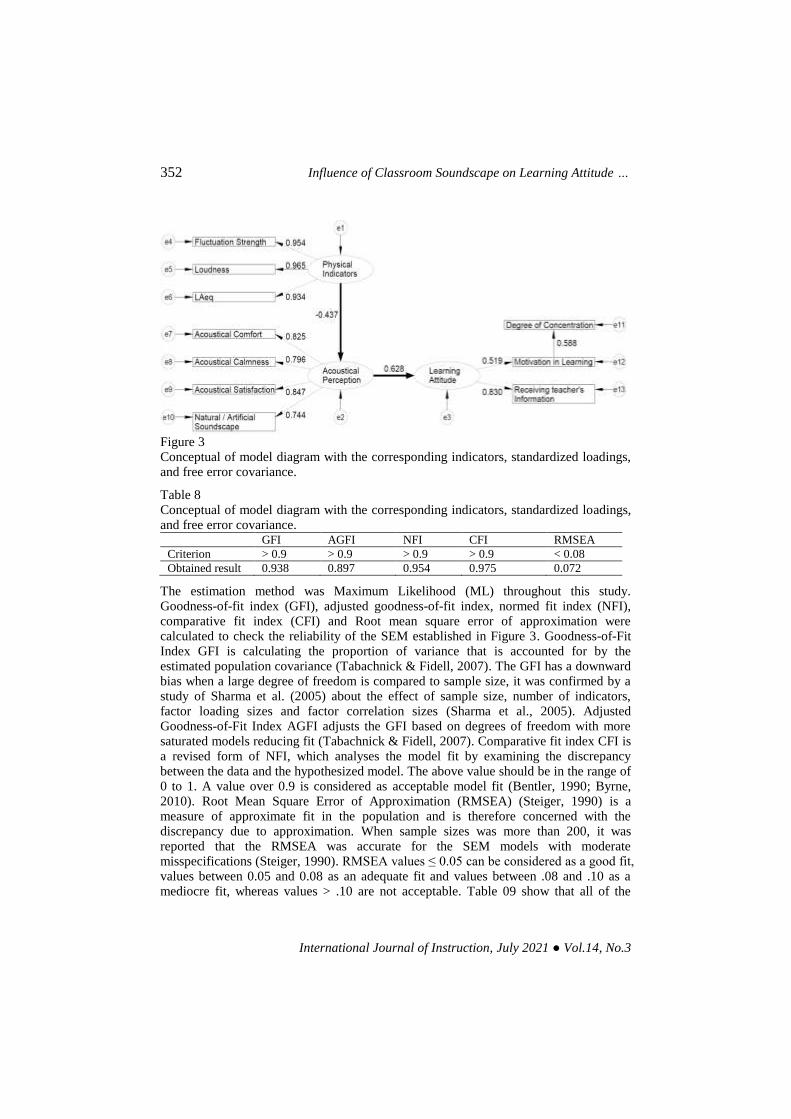
The SEM was then constructed as shown in Figure 3. The model adopted standardized estimates (normalized scale where Mean = 0.0 and Standard Deviation = 1.0) as the measured variables have different scales. According to the model developed, physical sound indicators (fluctuation strength, loudness, LAeq) contributed indirectly to Learning attitude via acoustical perception (acoustical comfort, acoustical calmness, feeling of the existence of natural or artificial sound and satisfaction with the aural environment). The model provided the standardized coefficients and levels of significance for the predictors. The standardized coefficient of physical sound indicator was negative. The factor of ‘receiving teacher’s information’ (0.830) was larger than the ‘motivation in learning’ (0.519). The standardized coefficient of acoustical perception was positively (0.628) correlated to the learning attitude. Acoustical satisfaction was a significant contributor (0.847) to the acoustical perception compared with other variables. ‘Degree of concentration’ was mainly positively affected by ‘motivation in learning’ which indicates the motivation to improve concentration in learning.
352 Influence of Classroom Soundscape on Learning Attitude …
International Journal of Instruction, July 2021 ● Vol.14, No.3
Figure 3 Conceptual of model diagram with the corresponding indicators, standardized loadings, and free error covariance.
Table 8 Conceptual of model diagram with the corresponding indicators, standardized loadings, and free error covariance.
GFI AGFI NFI CFI RMSEA
Criterion > 0.9 > 0.9 > 0.9 > 0.9 < 0.08
Obtained result 0.938 0.897 0.954 0.975 0.072
The estimation method was Maximum Likelihood (ML) throughout this study. Goodness-of-fit index (GFI), adjusted goodness-of-fit index, normed fit index (NFI), comparative fit index (CFI) and Root mean square error of approximation were calculated to check the reliability of the SEM established in Figure 3. Goodness-of-Fit Index GFI is calculating the proportion of variance that is accounted for by the estimated population covariance (Tabachnick & Fidell, 2007). The GFI has a downward bias when a large degree of freedom is compared to sample size, it was confirmed by a study of Sharma et al. (2005) about the effect of sample size, number of indicators, factor loading sizes and factor correlation sizes (Sharma et al., 2005). Adjusted Goodness-of-Fit Index AGFI adjusts the GFI based on degrees of freedom with more saturated models reducing fit (Tabachnick & Fidell, 2007). Comparative fit index CFI is a revised form of NFI, which analyses the model fit by examining the discrepancy between the data and the hypothesized model. The above value should be in the range of 0 to 1. A value over 0.9 is considered as acceptable model fit (Bentler, 1990; Byrne, 2010). Root Mean Square Error of Approximation (RMSEA) (Steiger, 1990) is a measure of approximate fit in the population and is therefore concerned with the discrepancy due to approximation. When sample sizes was more than 200, it was reported that the RMSEA was accurate for the SEM models with moderate misspecifications (Steiger, 1990). RMSEA values ≤ 0.05 can be considered as a good fit, values between 0.05 and 0.08 as an adequate fit and values between .08 and .10 as a mediocre fit, whereas values > .10 are not acceptable. Table 09 show that all of the
Chan, Choy, To & Lai 353
International Journal of Instruction, July 2021 ● Vol.14, No.3
indices reach the criteria listed in the first row according to Hu and Bentler, and MacCallum (Hu & Bentler, 1999; MacCallum, 1996), and this means that the developed model is considered as good fit model.
DISCUSSION
Learning emotion strongly depends on the type of sound sources and therefore the assessment of pleasantness depends on the individual appraisal of the acoustical environment, according to the models for soundscape characterisation have been proposed by Axelsson et al. (Axelsson, 2012). There were several and diverse natural and anthropogenic sounds from all source types and so the opinions of the listeners regarding the classroom soundscape were varied. Natural sounds were perceived as pleasant while artificial sounds were perceived as unpleasant and annoying during the lessons in the classroom. In Shu & Ma's (2019) study, this was also proved the water sounds were more appropriate in classroom, followed by music and birdsong (Shu & Ma, 2019). Anthropogenic sounds were heard predominantly and perceived as rather unfavourable in the classroom. Additionally, ‘people talking’, ‘playing’, ‘shouting’, ‘construction/renovation work’ (from nearby rooms or sites), were considered as unpleasant sounds in the classrooms. The most annoying sound sources were the noises of moving chairs/tables and the background noise of the speaker. These indicated that the students were more affected by the sudden change of the sounds, especially the sounds were irrelevant to the learning content. However, loudness, which is another acoustical parameter, can also influence student perceptions of soundscapes. Another sound source which causes annoyance to students in classroom is the noise coming from the human activity. Students may not experience acoustical discomfort when they hear traffic noises because of lesser sudden fluctuation than anthropogenic sounds. To provide an aurally comfortable environment, the classroom should be designed by reducing the dominance of anthropogenic sound sources and adding more nature sounds. The nature sounds are not to be used for masking the anthropogenic sounds but used for enhancing the classroom soundscape. The nature sounds should be selected carefully because the students have the preference in the natural sound sources. This may be done by the precise planning and acoustic treatment of the classroom. The reduction of the sound power level of the sound source or quantity of unwanted sound source may be the feasible mitigation measures.
Regarding the relationship between the human perception of the classroom soundscape and physical acoustics parameters, the results showed that there is learning attitude was significantly influenced by the acoustical environment. Loudness and LAeq had the highest correlation coefficients with the many perceptual variables respectively. According to Jia et al., (2020) the comfortable value is correlated with sound source category and fluctuation strength (Jia et al., 2020). Shu & Ma (2018) showed the natural sounds as potential restorative sounds in school environments while other urban sounds should be reduced. Additionally, the restorative potential of environmental sounds was correlated with the psychoacoustic parameters including fluctuation strength, sharpness, loudness, and roughness (Shu & Ma, 2018). In this study, it was also observed that highest correlation coefficient values among the physical indicators were loudness and
354 Influence of Classroom Soundscape on Learning Attitude …
International Journal of Instruction, July 2021 ● Vol.14, No.3
fluctuation strength for ‘acoustical comfort’, with values (rp=-0.436, p<.001) and (rp=-0.394, p<.001). However, negative correlations were observed with subjective measures and with the physical acoustic indicators except for roughness. This suggests that the lower ambient sound level and fluctuation strength are beneficial for improving the student’s learning attitude. The structural equation model with physical acoustics indicators as a starting point and learning attitude as the end product demonstrated that the ‘feeling of the existence of natural or artificial sound’, ‘acoustical calmness’, ‘acoustical comfort’ and ‘satisfaction with aural environment’ were important factors in the soundscape. Those parameters may be useful indicators to classify classroom soundscapes and must be considered during modelling and evaluation of future soundscapes. Among the physical acoustics indicators, fluctuation strength, loudness and LAeq had a strong impact on the soundscape and learning attitudes of students in classrooms. Since the motivation in learning has direct effect on the degree of concentration, adding the natures sound would help improve the acoustical perception, which finally increase the concentration in learning. The sound level of the added nature sounds should be moderate and constant in order to diminish the fluctuation strength of the sounds in the classroom. From the results of the analysis, when either the loudness is high, or the fluctuation strength is high, the student perceives acoustic discomfort and this has negative effect on learning. The added nature sounds with high sound level may also decrease the clarity of receiving teaching’s information.
CONCLUSION
The study investigated acoustic metrics along with individual responses to the perceived sound sources in the aural environment during lessons. This research indicated that classrooms can be re-designed by placing more favourable types of sound sources to improve acoustics comfort and learning attitude. More specifically, the results of this study reveal that people feel pleasant in several specific sound categories of both natural and anthropogenic sounds. It is shown that the students considered artificial sounds as having a negative effect on the environmental calmness. The human voice was perceived as an unfavourable sound, whereas road traffic noise and music were not considered as unfavourable in the classroom environment. To overcome the negative effect on human perception of the acoustic environment, the twittering of birds and music can be added.
Acoustic indicators for the soundscape classifications in classrooms were investigated. Loudness and LAeq had the highest correlation coefficients with perceptual variables such as acoustical comfort, acoustical calmness, feeling of the existence of natural or artificial sound and satisfaction with the aural environment respectively. This finding suggests that the improvement or sound treatment in the classroom may be beneficial for enhancing the student learning. A Structural Equation Model of aural perception in classrooms was developed. Through a series of analyses, the physical acoustics parameters such as fluctuation strength, loudness and LAeq was found to influence human perception in terms of acoustical comfort, acoustical calmness, feeling of the existence of natural or artificial sound and satisfaction with the aural environment. These factors influence students’ learning attitude.
Chan, Choy, To & Lai 355
International Journal of Instruction, July 2021 ● Vol.14, No.3
One limitation was that the subjective responses in this study were influenced by sequential biases because the sound source evaluations were conducted in the same order as the sound measurements. In addition, the findings were restricted to local conditions because the soundscape evaluations were only conducted in Hong Kong’s higher education institutions. The perception of classroom soundscape varies depending on learning activities such as lectures, workshops, group discussions, etc. It also varies in different cities and countries. Thus, further studies and researches are needed to investigate the impact of learning activities on soundscape perceptions. Additionally, classroom soundscape can be investigated in cross-cultural perspective.
REFERENCES
Ali, S. A. A. (2013). Study effects of school noise on learning achievement and annoyance in Assiut city, Egypt. Applied Acoustics, 74(4), 602–606. https://doi.org/10.1016/j.apacoust.2012.10.011
Axelsson, Ö., &54, I. 43/Sc 1/Wg. (2012). The ISO 12913 series on soundscape: An update, May 2012. The Journal of the Acoustical Society of America, 131(4), 3381–3381. https://doi.org/10.1121/1.4708750
Axelsson, Ö., Nilsson, M. E., &Berglund, B. (2010). A principal components model of soundscape perception. The Journal of the Acoustical Society of America, 128(5), 2836–2846. https://doi.org/10.1121/1.3493436
Bentler, P. M. (1990). Comparative fit indexes in structural models. Psychological Bulletin, 107(2), 238–246. https://doi.org/10.1037/0033-2909.107.2.238
Berglund, B., Lindvall, T., &Schwela, D. (2000). New WHO guidelines for community noise. Noise & Vibration Worldwide, 31(4), 24–29. https://doi.org/10.1260/0957456001497535
Berglund, B., &Nilsson, M. E. (2006). On a tool for measuring soundscape quality in urban residential areas. Acta Acustica United with Acustica, 92(6), 938–944.
Bronzaft, A. L. (1981). The effect of a noise abatement program on reading ability. Journal of Environmental Psychology, 1(3), 215–222. https://doi.org/10.1016/S0272-4944(81)80040-0
Bronzaft, A. L., &Mccarthy, D. P. (1975). The effect of elevated train noise on reading ability. Environment and Behavior, 7(4), 517–528. https://doi.org/10.1177/001391657500700406
Bs/En60268-16. (2011). Sound System equipment, Part 16: Objective rating of speech intellegibility by speech transmission index. In BSI STandard (2011). http://resource.isvr.soton.ac.uk/staff/pubs/PubPDFs/BS EN 60268-16.pdf
Byrne, B. M. (2010). Structural Equation Modeling with AMOS: Basic Concepts, Applications, and Programming. In Structural Equation Modeling. https://doi.org/10.4324/9781410600219
356 Influence of Classroom Soundscape on Learning Attitude …
International Journal of Instruction, July 2021 ● Vol.14, No.3
Cerny, B., & Kaiser, H. (1977). A study of a measure of sampling adequacy for factor-analytic correlation matrices. Multivariate Behavioral Research, July 2012, 37–41. https://doi.org/10.1207/s15327906mbr1201
Cohen, S., Evans, G. W., Krantz, D. S., &Stokols, D. (1980). Physiological, motivational, and cognitive effects of aircraft noise on children: Moving from the laboratory to the field. American Psychologist, 35(3), 231–243. https://doi.org/10.1037/0003-066X.35.3.231
Connolly, D. M., Dockrell, J. E., Shield, B. M., Conetta, R., &Cox, T. J. (2015). Students’ perceptions of school acoustics and the impact of noise on teaching and learning in secondary schools: Findings of a questionnaire survey. Energy Procedia, 78, 3114–3119. https://doi.org/10.1016/j.egypro.2015.11.766
Dockrell, J. E., &Shield, B. (2004). Children’s perceptions of their acoustic environment at school and at home. The Journal of the Acoustical Society of America, 115(6), 2964–2973. https://doi.org/10.1121/1.1652610
Enmarker, I., &Boman, E. (2004). Noise annoyance responses of middle school pupils and teachers. Journal of Environmental Psychology. https://doi.org/10.1016/j.jenvp.2004.09.005
Fabrigar, L. R., Wegener, D. T., MacCallum, R. C., &Strahan, E. J. (1999). Evaluating the use of exploratory factor analysis in psychological research. Psychological Methods, 4(3), 272–299. https://doi.org/http://shelob.ocis.temple.edu:3395/10.1037/1082-989X.4.3.272
Haines, M., Stansfeld, S., Brentnall, S., Head, J., Berry, B., Jiggins, M., &Hygge, S. (2001). The west London schools study: The effects of chronic aircraft noise exposure on child health. Psychological Medicine, 31, 1385–1396. https://doi.org/10.1017/S003329170100469X
Helton, W. S., Matthews, G., &Warm, J. S. (2009). Stress state mediation between environmental variables and performance: The case of noise and vigilance. Acta Psychologica, 130(3), 204–213. https://doi.org/10.1016/j.actpsy.2008.12.006
Hotelling, H. (1933). Analysis of a complex of statistical variables into principal components. Journal of Educational Psychology, 24(6), 417–441. https://doi.org/10.1037/h0071325
Houtgast, T., &Steeneken, H. J. M. (1973). The Modulation Transfer Function in Room Acoustics as a Predictor of Speech Intelligibility. The Journal of the Acoustical Society of America, 54(2), 557–557. https://doi.org/10.1121/1.1913632
Hu, L. T., &Bentler, P. M. (1999). Cutoff criteria for fit indexes in covariance structure analysis: Conventional criteria versus new alternatives. Structural Equation Modeling, 6(1), 1–55. https://doi.org/10.1080/10705519909540118
ISO. (2003). ISO 9921:2003 Ergonomics - Assessment of speech communication. Iso, 3.
Chan, Choy, To & Lai 357
International Journal of Instruction, July 2021 ● Vol.14, No.3
Jia, Y., Ma, H., Kang, J., &Wang, C. (2020). The preservation value of urban soundscape and its determinant factors. Applied Acoustics. https://doi.org/10.1016/j.apacoust.2020.107430
Kaiser, H. F. (1960). The Application of Electronic Computers to Factor Analysis. Educational and Psychological Measurement, 20(1), 141–151. https://doi.org/10.1177/001316446002000116
Kang, J., &Zhang, M. (2010). Semantic differential analysis of the soundscape in urban open public spaces. Building and Environment, 45(1), 150–157. https://doi.org/10.1016/j.buildenv.2009.05.014
Liu, J., Kang, J., Luo, T., &Behm, H. (2013). Landscape effects on soundscape experience in city parks. Science of the Total Environment, 454–455, 474–481. https://doi.org/10.1016/j.scitotenv.2013.03.038
Liu, T., Lin, C. C., Huang, K. C., &Chen, Y. C. (2017). Effects of noise type, noise intensity, and illumination intensity on reading performance. Applied Acoustics, 120, 70–74. https://doi.org/10.1016/j.apacoust.2017.01.019
Ljung, R., Sorqvist, P., &Hygge, S. (2009). Effects of road traffic noise and irrelevant speech on children′s reading and mathematical performance. Noise and Health, 11(45), 194. https://doi.org/10.4103/1463-1741.56212
Sala, E., &Rantala, L. (2016). Acoustics and activity noise in school classrooms in Finland. Applied Acoustics, 114, 252–259. https://doi.org/10.1016/j.apacoust.2016.08.009
Schafer, R. M. (1993). Introduction. The Soundscape: Our Sonic Environment and the Tuning of the World, 3–12.
Sharma, S., Mukherjee, S., Kumar, A., &Dillon, W. R. (2005). A simulation study to investigate the use of cutoff values for assessing model fit in covariance structure models. Journal of Business Research, 58(7), 935–943. https://doi.org/10.1016/j.jbusres.2003.10.007
Shield, B., Greenland, E., &Dockrell, J. (2010). Noise in open plan classrooms in primary schools: A review. Noise and Health, 12(49), 225. https://doi.org/10.4103/1463-1741.70501
Shu, S., &Ma, H. (2018). The restorative environmental sounds perceived by children. Journal of Environmental Psychology. https://doi.org/10.1016/j.jenvp.2018.10.011
Shu, S., &Ma, H. (2019). Restorative effects of classroom soundscapes on children’s cognitive performance. International Journal of Environmental Research and Public Health. https://doi.org/10.3390/ijerph16020293
Silva, L. T., Oliveira, I. S., &Silva, J. F. (2016). The impact of urban noise on primary schools. Perceptive evaluation and objective assessment. Applied Acoustics. https://doi.org/10.1016/j.apacoust.2015.12.013
358 Influence of Classroom Soundscape on Learning Attitude …
International Journal of Instruction, July 2021 ● Vol.14, No.3
Sörqvist, P., &Rönnberg, J. (2014). Individual differences in distractibility: An update and a model. PsyCh Journal, 3(1), 42–57. https://doi.org/10.1002/pchj.47
Stansfeld, S. A., Berglund, B., Clark, C., Lopez-Barrio, I., Fischer, P., Öhrström, E., Haines, M. M., Head, J., Hygge, S., VanKamp, I., &Berry, B. F. (2005). Aircraft and road traffic noise and children’s cognition and health: A cross-national study. Lancet, 365(9475), 1942–1949. https://doi.org/10.1016/S0140-6736(05)66660-3
Steeneken, H. J. M., &Houtgast, T. (1980). A physical method for measuring speech‐transmission quality. The Journal of the Acoustical Society of America, 67(1), 318–326. https://doi.org/10.1121/1.384464
Steiger, J. H. (1990). Structural Model Evaluation and Modification: An Interval Estimation Approach. Multivariate Behavioral Research, 25(2), 173–180. https://doi.org/10.1207/s15327906mbr2502_4
Tabachnick, B. G., &Fidell, L. S. (2007). Multivariate analysis of variance and covariance. Using Multivariate Statistics, 3, 402–407.
Trimmel, M., Atzlsdorfer, J., Tupy, N., &Trimmel, K. (2012). Effects of low intensity noise from aircraft or from neighbourhood on cognitive learning and electrophysiological stress responses. International Journal of Hygiene and Environmental Health, 215(6), 547–554. https://doi.org/10.1016/j.ijheh.2011.12.007
Tse, M. S., Chau, C. K., Choy, Y. S., Tsui, W. K., Chan, C. N., &Tang, S. K. (2012). Perception of urban park soundscape. The Journal of the Acoustical Society of America, 131(4), 2762–2771. https://doi.org/10.1121/1.3693644
Weerahandi, S. (1993). Generalized confidence intervals. Journal of the American Statistical Association, 88(423), 899–905. https://doi.org/10.1080/01621459.1993.10476355
Zannin, P. H. T., &Marcon, C. R. (2007). Objective and subjective evaluation of the acoustic comfort in classrooms. Applied Ergonomics. https://doi.org/10.1016/j.apergo.2006.10.001