Embed Size (px)
Citation preview
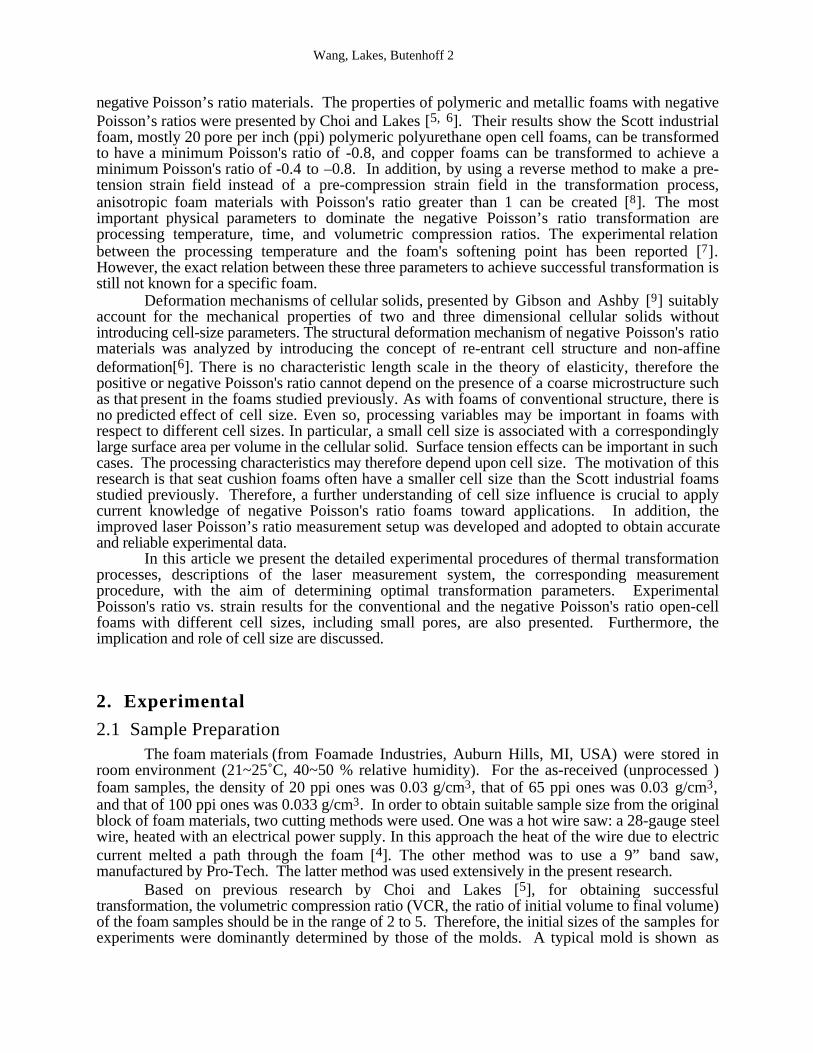
Wang, Lakes, Butenhoff 1
Influence of Cell Size on Re-Entrant Transformationof Negative Poisson's Ratio Reticulated Polyurethane Foams
Yun-Che Wang †, Roderic Lakes †¶, and Amanda Butenhoff ‡
Department of Engineering Physics †, Engineering Mechanics and Astronautics Program †,Department of Biomedical Engineering ¶,
University of Wisconsin-Madison,147 Engineering Research Building,
1500 Engineering Drive, Madison, WI 53706-1687
Department of Chemistry ‡,Drake University,
2507 University Avenue, Des Moines, IA 50311
Wang, Y. C., Lakes, R. S., and Butenhoff, A.,"Influence of cell size on re-entrant transformation of negative poisson's ratio reticulated
polyurethane foams",adapted from
Cellular Polymers, 20, 373-385, (2001).
Abstract
Several foams of different cell-size, including Scott Industrial polyurethane foam with largecells (20 pores per inch, ppi, or 1.2 mm per pore, black), medium cells (65 ppi, or 0.4 mm perpore, green), and near-microcellular (100 ppi, 0.25 mm per pore, white), were processed overvarious time and temperature regimes to ascertain the role of cell size in transformation to negativePoisson's ratio materials. These foams were transformed successfully, and exhibited negativePoisson's ratio behavior. Poisson's ratio was measured using a new laser based setup. For all as-received (unprocessed) foams with different cell sizes, Poisson's ratio decreased with compressiveaxial strain and increased with tensile strain up to a maximum. The maximum Poisson's ratio intension decreased as cell size increases. The strain at which maximum Poisson's ratio occurs,increased with cell size. In negative Poisson's ratio foams, minimum Poisson’s ratios of –0.8,-0.5, and -0.4 for 20 ppi, 65 ppi, and 100 ppi foams, respectively were observed. Furthermore,the cell size effects on transformation parameters were also found.
1. Introduction
Negative Poisson’s ratio, the transverse expansion of a material under tension, iscounterintuitive but nevertheless possible. Theoretically, the allowable range of Poisson’s ratio forisotropic materials is between –1 and +0.5 based on energy considerations of materials' intrinsicstructural stability [1]. Historically, negative Poisson's ratio materials were reported by A. E. H.Love [2] in certain anisotropic single crystal iron pyrites. The first man-made isotropic materialswith negative Poisson’s ratios were presented by Lakes [3]. Many follow-on researches have beenmade by the inventor and other researchers [4,5,6,7] to explore the intrinsic properties of the
Wang, Lakes, Butenhoff 2
negative Poisson’s ratio materials. The properties of polymeric and metallic foams with negativePoisson’s ratios were presented by Choi and Lakes [5, 6]. Their results show the Scott industrialfoam, mostly 20 pore per inch (ppi) polymeric polyurethane open cell foams, can be transformedto have a minimum Poisson's ratio of -0.8, and copper foams can be transformed to achieve aminimum Poisson's ratio of -0.4 to –0.8. In addition, by using a reverse method to make a pre-tension strain field instead of a pre-compression strain field in the transformation process,anisotropic foam materials with Poisson's ratio greater than 1 can be created [8]. The mostimportant physical parameters to dominate the negative Poisson’s ratio transformation areprocessing temperature, time, and volumetric compression ratios. The experimental relationbetween the processing temperature and the foam's softening point has been reported [7].However, the exact relation between these three parameters to achieve successful transformation isstill not known for a specific foam.
Deformation mechanisms of cellular solids, presented by Gibson and Ashby [9] suitablyaccount for the mechanical properties of two and three dimensional cellular solids withoutintroducing cell-size parameters. The structural deformation mechanism of negative Poisson's ratiomaterials was analyzed by introducing the concept of re-entrant cell structure and non-affinedeformation[6]. There is no characteristic length scale in the theory of elasticity, therefore thepositive or negative Poisson's ratio cannot depend on the presence of a coarse microstructure suchas that present in the foams studied previously. As with foams of conventional structure, there isno predicted effect of cell size. Even so, processing variables may be important in foams withrespect to different cell sizes. In particular, a small cell size is associated with a correspondinglylarge surface area per volume in the cellular solid. Surface tension effects can be important in suchcases. The processing characteristics may therefore depend upon cell size. The motivation of thisresearch is that seat cushion foams often have a smaller cell size than the Scott industrial foamsstudied previously. Therefore, a further understanding of cell size influence is crucial to applycurrent knowledge of negative Poisson's ratio foams toward applications. In addition, theimproved laser Poisson’s ratio measurement setup was developed and adopted to obtain accurateand reliable experimental data.
In this article we present the detailed experimental procedures of thermal transformationprocesses, descriptions of the laser measurement system, the corresponding measurementprocedure, with the aim of determining optimal transformation parameters. ExperimentalPoisson's ratio vs. strain results for the conventional and the negative Poisson's ratio open-cellfoams with different cell sizes, including small pores, are also presented. Furthermore, theimplication and role of cell size are discussed.
2. Experimental
2.1 Sample PreparationThe foam materials (from Foamade Industries, Auburn Hills, MI, USA) were stored in
room environment (21~25˚C, 40~50 % relative humidity). For the as-received (unprocessed )foam samples, the density of 20 ppi ones was 0.03 g/cm3, that of 65 ppi ones was 0.03 g/cm3,and that of 100 ppi ones was 0.033 g/cm3. In order to obtain suitable sample size from the originalblock of foam materials, two cutting methods were used. One was a hot wire saw: a 28-gauge steelwire, heated with an electrical power supply. In this approach the heat of the wire due to electriccurrent melted a path through the foam [4]. The other method was to use a 9” band saw,manufactured by Pro-Tech. The latter method was used extensively in the present research.
Based on previous research by Choi and Lakes [5], for obtaining successfultransformation, the volumetric compression ratio (VCR, the ratio of initial volume to final volume)of the foam samples should be in the range of 2 to 5. Therefore, the initial sizes of the samples forexperiments were dominantly determined by those of the molds. A typical mold is shown as
Wang, Lakes, Butenhoff 3
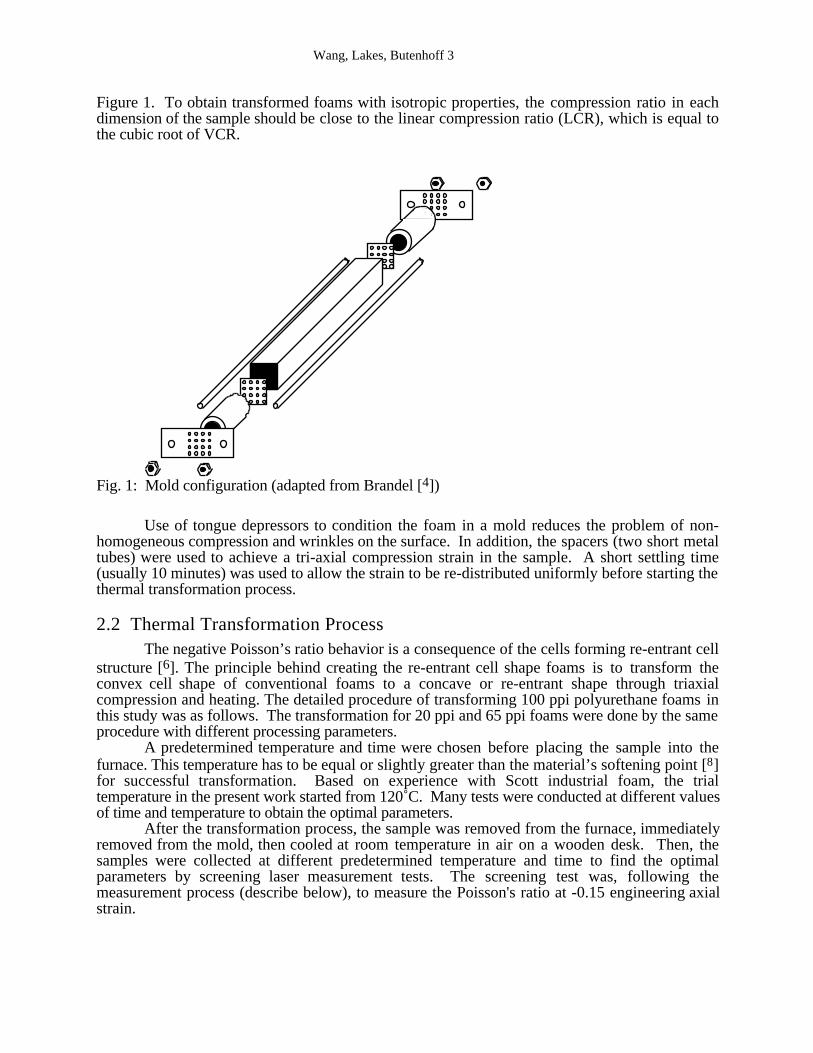
Figure 1. To obtain transformed foams with isotropic properties, the compression ratio in eachdimension of the sample should be close to the linear compression ratio (LCR), which is equal tothe cubic root of VCR.
Fig. 1: Mold configuration (adapted from Brandel [4])
Use of tongue depressors to condition the foam in a mold reduces the problem of non-homogeneous compression and wrinkles on the surface. In addition, the spacers (two short metaltubes) were used to achieve a tri-axial compression strain in the sample. A short settling time(usually 10 minutes) was used to allow the strain to be re-distributed uniformly before starting thethermal transformation process.
2.2 Thermal Transformation ProcessThe negative Poisson’s ratio behavior is a consequence of the cells forming re-entrant cell
structure [6]. The principle behind creating the re-entrant cell shape foams is to transform theconvex cell shape of conventional foams to a concave or re-entrant shape through triaxialcompression and heating. The detailed procedure of transforming 100 ppi polyurethane foams inthis study was as follows. The transformation for 20 ppi and 65 ppi foams were done by the sameprocedure with different processing parameters.
A predetermined temperature and time were chosen before placing the sample into thefurnace. This temperature has to be equal or slightly greater than the material’s softening point [8]for successful transformation. Based on experience with Scott industrial foam, the trialtemperature in the present work started from 120˚C. Many tests were conducted at different valuesof time and temperature to obtain the optimal parameters.
After the transformation process, the sample was removed from the furnace, immediatelyremoved from the mold, then cooled at room temperature in air on a wooden desk. Then, thesamples were collected at different predetermined temperature and time to find the optimalparameters by screening laser measurement tests. The screening test was, following themeasurement process (describe below), to measure the Poisson's ratio at -0.15 engineering axialstrain.
Wang, Lakes, Butenhoff 4
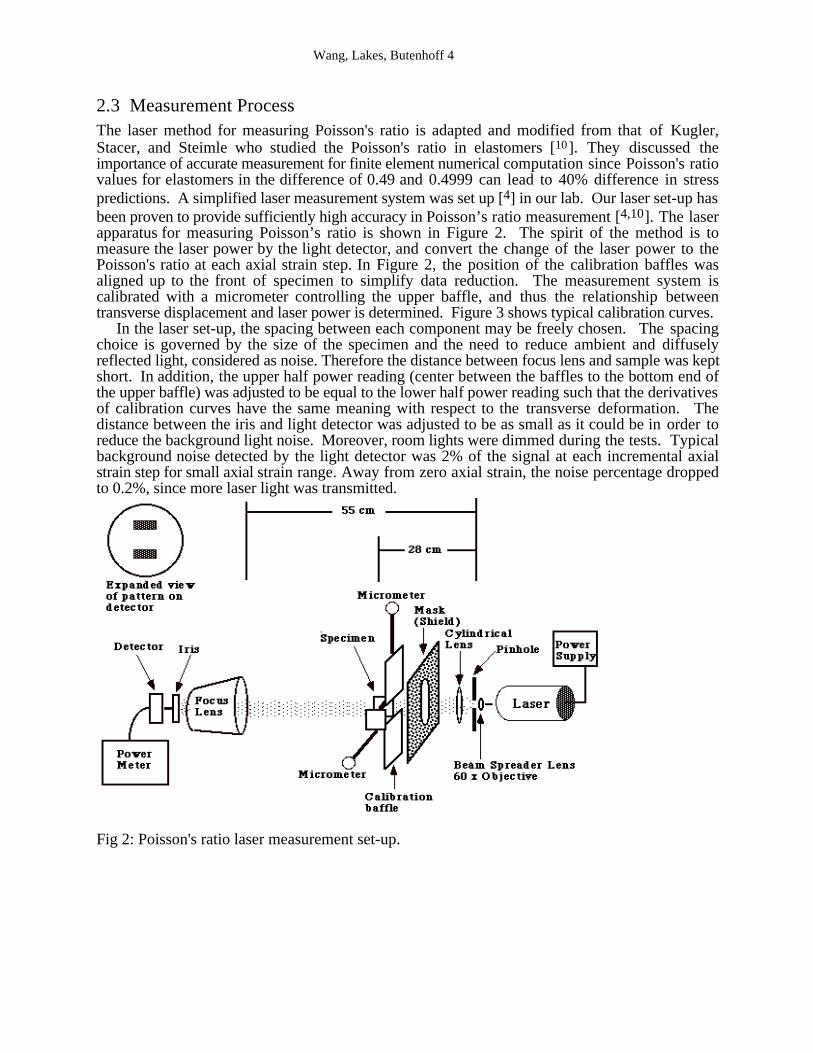
2.3 Measurement ProcessThe laser method for measuring Poisson's ratio is adapted and modified from that of Kugler,Stacer, and Steimle who studied the Poisson's ratio in elastomers [10]. They discussed theimportance of accurate measurement for finite element numerical computation since Poisson's ratiovalues for elastomers in the difference of 0.49 and 0.4999 can lead to 40% difference in stresspredictions. A simplified laser measurement system was set up [4] in our lab. Our laser set-up hasbeen proven to provide sufficiently high accuracy in Poisson’s ratio measurement [4,10]. The laserapparatus for measuring Poisson’s ratio is shown in Figure 2. The spirit of the method is tomeasure the laser power by the light detector, and convert the change of the laser power to thePoisson's ratio at each axial strain step. In Figure 2, the position of the calibration baffles wasaligned up to the front of specimen to simplify data reduction. The measurement system iscalibrated with a micrometer controlling the upper baffle, and thus the relationship betweentransverse displacement and laser power is determined. Figure 3 shows typical calibration curves. In the laser set-up, the spacing between each component may be freely chosen. The spacingchoice is governed by the size of the specimen and the need to reduce ambient and diffuselyreflected light, considered as noise. Therefore the distance between focus lens and sample was keptshort. In addition, the upper half power reading (center between the baffles to the bottom end ofthe upper baffle) was adjusted to be equal to the lower half power reading such that the derivativesof calibration curves have the same meaning with respect to the transverse deformation. Thedistance between the iris and light detector was adjusted to be as small as it could be in order toreduce the background light noise. Moreover, room lights were dimmed during the tests. Typicalbackground noise detected by the light detector was 2% of the signal at each incremental axialstrain step for small axial strain range. Away from zero axial strain, the noise percentage droppedto 0.2%, since more laser light was transmitted.
Fig 2: Poisson's ratio laser measurement set-up.
Wang, Lakes, Butenhoff 5
0
0.05
0.1
0.15
0.2
0.25
0.3
0.35
0 0.5 1 1.5 2 2.5
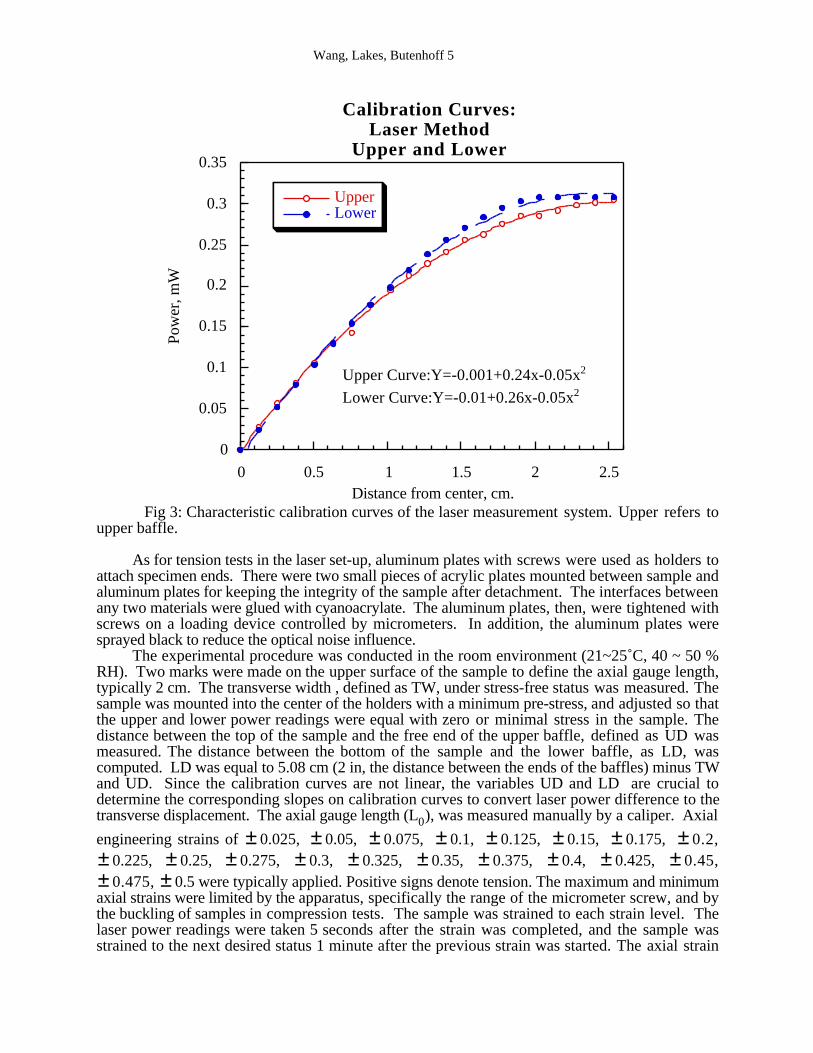
Calibration Curves:Laser Method
Upper and Lower
UpperLower
Pow
er, m
W
Distance from center, cm.
Upper Curve:Y=-0.001+0.24x-0.05x2
Lower Curve:Y=-0.01+0.26x-0.05x2
Fig 3: Characteristic calibration curves of the laser measurement system. Upper refers toupper baffle.
As for tension tests in the laser set-up, aluminum plates with screws were used as holders toattach specimen ends. There were two small pieces of acrylic plates mounted between sample andaluminum plates for keeping the integrity of the sample after detachment. The interfaces betweenany two materials were glued with cyanoacrylate. The aluminum plates, then, were tightened withscrews on a loading device controlled by micrometers. In addition, the aluminum plates weresprayed black to reduce the optical noise influence.
The experimental procedure was conducted in the room environment (21~25˚C, 40 ~ 50 %RH). Two marks were made on the upper surface of the sample to define the axial gauge length,typically 2 cm. The transverse width , defined as TW, under stress-free status was measured. Thesample was mounted into the center of the holders with a minimum pre-stress, and adjusted so thatthe upper and lower power readings were equal with zero or minimal stress in the sample. Thedistance between the top of the sample and the free end of the upper baffle, defined as UD wasmeasured. The distance between the bottom of the sample and the lower baffle, as LD, wascomputed. LD was equal to 5.08 cm (2 in, the distance between the ends of the baffles) minus TWand UD. Since the calibration curves are not linear, the variables UD and LD are crucial todetermine the corresponding slopes on calibration curves to convert laser power difference to thetransverse displacement. The axial gauge length (L0), was measured manually by a caliper. Axial
engineering strains of ± 0.025, ± 0.05, ± 0.075, ± 0.1, ± 0.125, ± 0.15, ± 0.175, ± 0.2,± 0.225, ± 0.25, ± 0.275, ± 0.3, ± 0.325, ± 0.35, ± 0.375, ± 0.4, ± 0.425, ± 0.45,± 0.475, ± 0.5 were typically applied. Positive signs denote tension. The maximum and minimumaxial strains were limited by the apparatus, specifically the range of the micrometer screw, and bythe buckling of samples in compression tests. The sample was strained to each strain level. Thelaser power readings were taken 5 seconds after the strain was completed, and the sample wasstrained to the next desired status 1 minute after the previous strain was started. The axial strain
Wang, Lakes, Butenhoff 6
rate at each strain level was approximately 0.025 in 10 seconds. The compression and tension testswere done separately. The waiting time between any two tests on the same sample was set at least30 minutes to allow for viscoelastic recovery.
The mathematical relationship between Poisson’s ratio and the upper, lower, and total powerreadings is shown below. The power (mW) of the upper light beam per transverse displacement(cm) is denoted as S
U;, which is the slope of the upper calibration curve corresponding to the point
UD away from the origin on the horizontal axis, and for the lower beam, denoted as SL, obtained
through the variable LD using the same procedure as the upper beam. The SU and S
L are computed
from the derivatives of the calibration curves, and the ST is the average of S
U and S
L. P
U, P
L and P
T
are defined as upper, lower, and total power reading. Theoretically, PT is equal to the sum of P
U
and PL. Then, the total transverse displacement was calculated as follows.
∆ transverse = PL
SL
+ PU
SU
, or (1)
∆ transverse = PT
ST
(2)
The differences of transverse displacement from the above two equations are small. Thisdifference is an indication of the error in the laser system from the laser itself. The possible errorsources come from the fluctuation of the readings and the misalignment between upper and lowerlight beams before straining the sample. Finally, the Poisson’s ratio, ν, can be computed asfollowing.
ν = −εtransverse
εaxial= −
∆transverse
L0 × TW(3)
3. Results and discussionTo explore the properties of small cell negative Poisson’s ratio foams with respect to
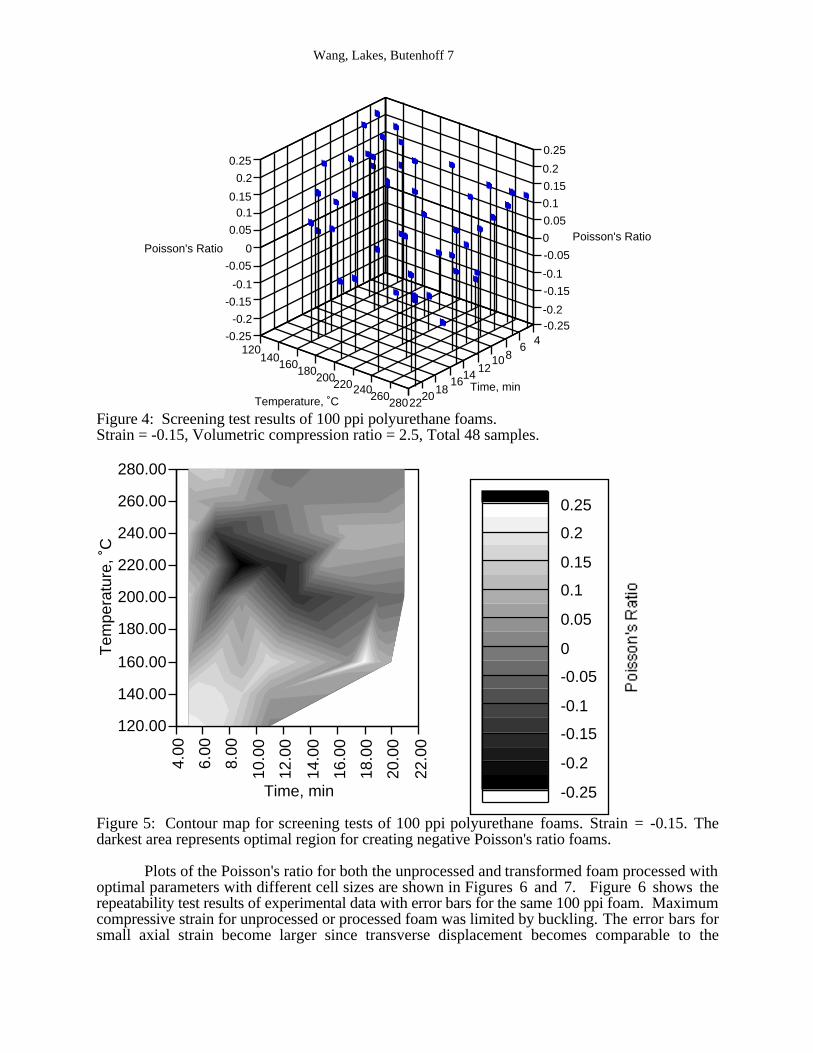
different processing time and temperature, the Scott reticulated 100 ppi white foam was used in thescreening tests to find the optimal processing parameters. Similar Scott polyurethane foams areavailable in pore sizes from 10 ppi to 100 ppi. Screening tests were performed controlling thevolume compression ratio to be about 2.5, and the Poisson’s ratio was recorded at an engineeringaxial strain, -0.15. The rationale for choosing -0.15 axial strain is that experimentally significantnegative Poisson’s effects can be detected with minimal error due to noise. In the screening tests,the processing temperature was from 120˚C to 280˚C, and the processing time was from 5 to 21minutes. The results are shown as Figure 4. As seen in the diagram, the optimal time was 8 to 12minutes, and the optimal temperature was 210 to 230˚C. Figure 5, which is the contour map of thedata shown in Figure 4, further elucidates the optimal transformation range. Comparing to theoptimal transformation parameters for 20 ppi (170˚C, 17 minutes)[3] and 65 ppi green (190˚C, 13minutes) foams, it shows smaller cell size foams prefer higher temperature and shorter processingtime. This could be due to the role of surface tension in foams of smaller cells. It is also possiblethat there is some difference in the chemistry.
Wang, Lakes, Butenhoff 7
280260240220200180160140120
2220181614 12
1086 4
0.25
0.2
0.150.1
0.05
0
-0.05
-0.1
-0.15
-0.2
-0.25
0.25
0.2
0.15
0.1
0.05
0
-0.05
-0.1
-0.15
-0.2-0.25
Poisson's RatioPoisson's Ratio
Time, minTemperature, ˚C
Figure 4: Screening test results of 100 ppi polyurethane foams.Strain = -0.15, Volumetric compression ratio = 2.5, Total 48 samples.
120.00
140.00
160.00
180.00
200.00
220.00
240.00
260.00
280.00
4.00
6.00
8.00
10.0
0
12.0
0
14.0
0
16.0
0
18.0
0
20.0
0
22.0
0
Tem
pera
ture
, ˚C
Time, min -0.25
-0.2
-0.15
-0.1
-0.05
0
0.05
0.1
0.15
0.2
0.25
Figure 5: Contour map for screening tests of 100 ppi polyurethane foams. Strain = -0.15. Thedarkest area represents optimal region for creating negative Poisson's ratio foams.
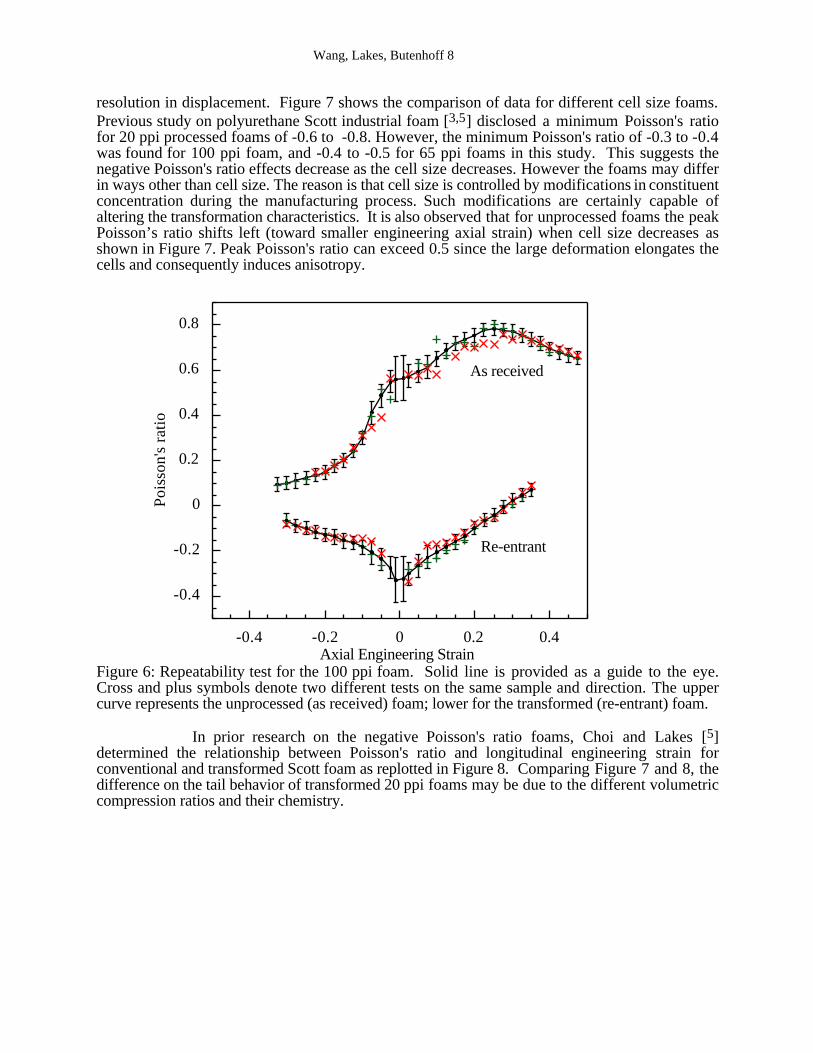
Plots of the Poisson's ratio for both the unprocessed and transformed foam processed withoptimal parameters with different cell sizes are shown in Figures 6 and 7. Figure 6 shows therepeatability test results of experimental data with error bars for the same 100 ppi foam. Maximumcompressive strain for unprocessed or processed foam was limited by buckling. The error bars forsmall axial strain become larger since transverse displacement becomes comparable to the
Wang, Lakes, Butenhoff 8
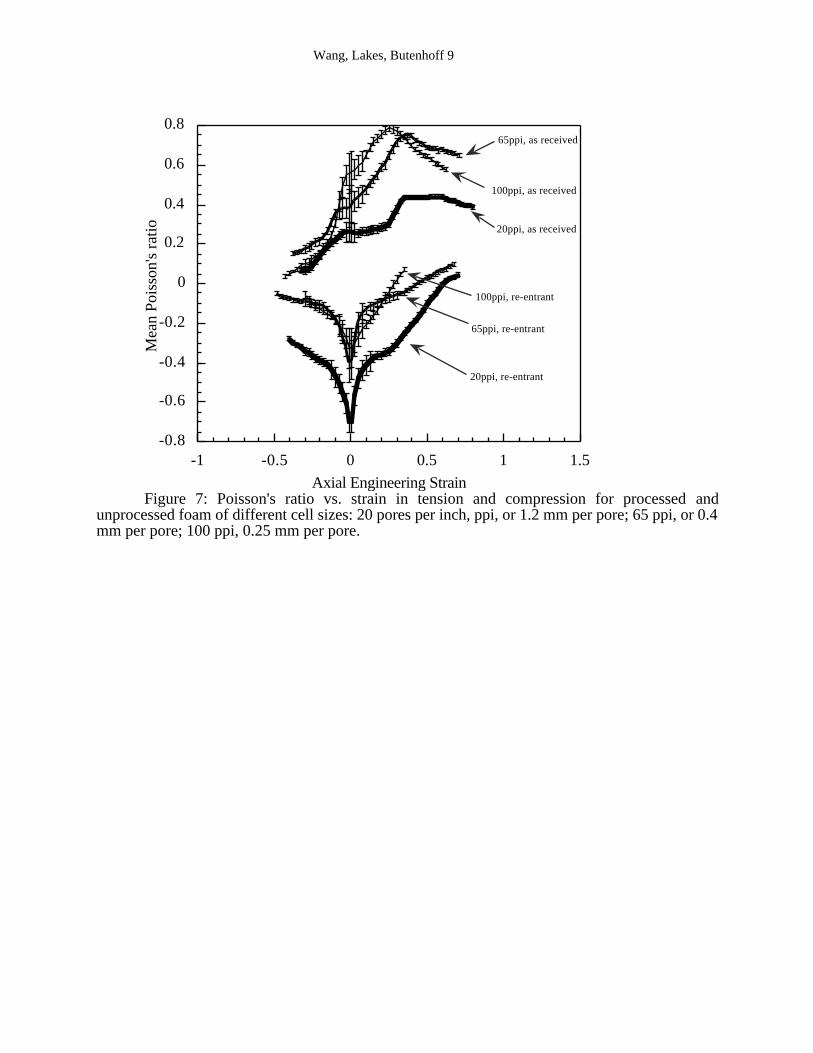
resolution in displacement. Figure 7 shows the comparison of data for different cell size foams.Previous study on polyurethane Scott industrial foam [3,5] disclosed a minimum Poisson's ratiofor 20 ppi processed foams of -0.6 to -0.8. However, the minimum Poisson's ratio of -0.3 to -0.4was found for 100 ppi foam, and -0.4 to -0.5 for 65 ppi foams in this study. This suggests thenegative Poisson's ratio effects decrease as the cell size decreases. However the foams may differin ways other than cell size. The reason is that cell size is controlled by modifications in constituentconcentration during the manufacturing process. Such modifications are certainly capable ofaltering the transformation characteristics. It is also observed that for unprocessed foams the peakPoisson’s ratio shifts left (toward smaller engineering axial strain) when cell size decreases asshown in Figure 7. Peak Poisson's ratio can exceed 0.5 since the large deformation elongates thecells and consequently induces anisotropy.
-0.4
-0.2
0
0.2
0.4
0.6
0.8
-0.4 -0.2 0 0.2 0.4
Poi
sson
's r
atio
Axial Engineering Strain
As received
Re-entrant
Figure 6: Repeatability test for the 100 ppi foam. Solid line is provided as a guide to the eye.Cross and plus symbols denote two different tests on the same sample and direction. The uppercurve represents the unprocessed (as received) foam; lower for the transformed (re-entrant) foam.
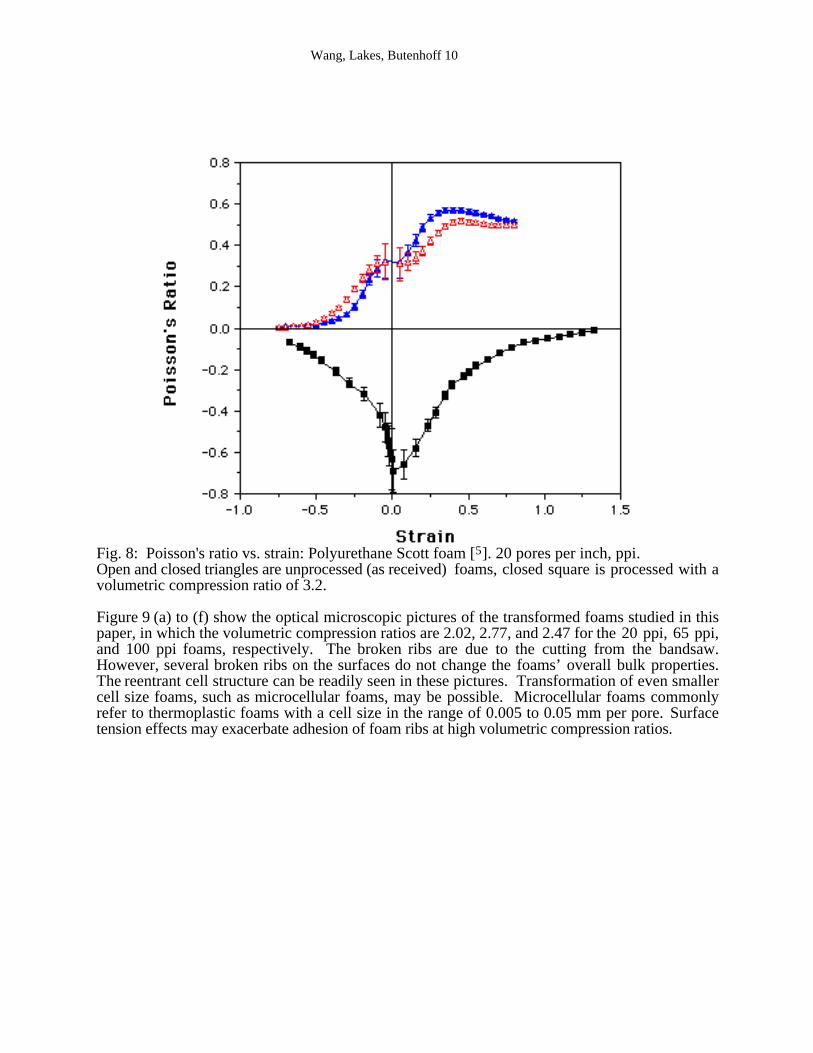
In prior research on the negative Poisson's ratio foams, Choi and Lakes [5]determined the relationship between Poisson's ratio and longitudinal engineering strain forconventional and transformed Scott foam as replotted in Figure 8. Comparing Figure 7 and 8, thedifference on the tail behavior of transformed 20 ppi foams may be due to the different volumetriccompression ratios and their chemistry.
Wang, Lakes, Butenhoff 9
-0.8
-0.6
-0.4
-0.2
0
0.2
0.4
0.6
0.8
-1 -0.5 0 0.5 1 1.5
Mea
n Po
isso
n's
ratio
Axial Engineering Strain
20ppi, as received
100ppi, as received
65ppi, as received
20ppi, re-entrant
65ppi, re-entrant
100ppi, re-entrant
Figure 7: Poisson's ratio vs. strain in tension and compression for processed andunprocessed foam of different cell sizes: 20 pores per inch, ppi, or 1.2 mm per pore; 65 ppi, or 0.4mm per pore; 100 ppi, 0.25 mm per pore.
Wang, Lakes, Butenhoff 10
Fig. 8: Poisson's ratio vs. strain: Polyurethane Scott foam [5]. 20 pores per inch, ppi.Open and closed triangles are unprocessed (as received) foams, closed square is processed with avolumetric compression ratio of 3.2.
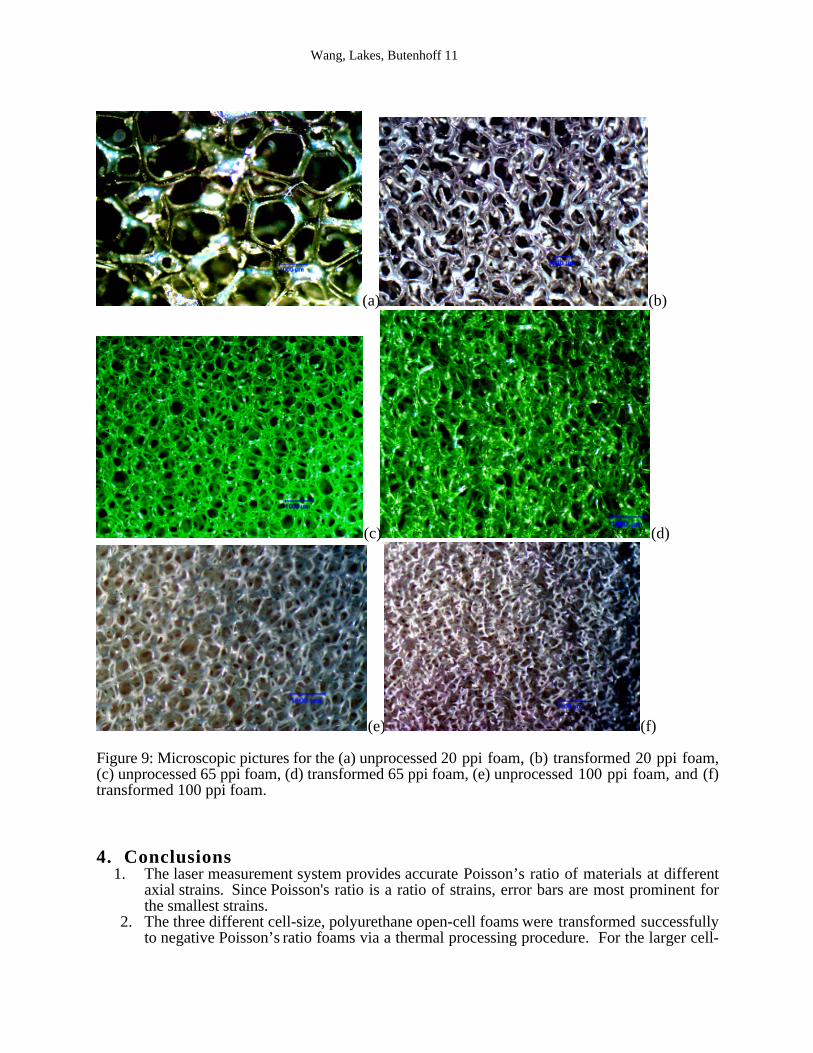
Figure 9 (a) to (f) show the optical microscopic pictures of the transformed foams studied in thispaper, in which the volumetric compression ratios are 2.02, 2.77, and 2.47 for the 20 ppi, 65 ppi,and 100 ppi foams, respectively. The broken ribs are due to the cutting from the bandsaw.However, several broken ribs on the surfaces do not change the foams’ overall bulk properties.The reentrant cell structure can be readily seen in these pictures. Transformation of even smallercell size foams, such as microcellular foams, may be possible. Microcellular foams commonlyrefer to thermoplastic foams with a cell size in the range of 0.005 to 0.05 mm per pore. Surfacetension effects may exacerbate adhesion of foam ribs at high volumetric compression ratios.
Wang, Lakes, Butenhoff 11
(a) (b)
(c) (d)
(e) (f)
Figure 9: Microscopic pictures for the (a) unprocessed 20 ppi foam, (b) transformed 20 ppi foam,(c) unprocessed 65 ppi foam, (d) transformed 65 ppi foam, (e) unprocessed 100 ppi foam, and (f)transformed 100 ppi foam.
4. Conclusions1. The laser measurement system provides accurate Poisson’s ratio of materials at different
axial strains. Since Poisson's ratio is a ratio of strains, error bars are most prominent forthe smallest strains.
2. The three different cell-size, polyurethane open-cell foams were transformed successfullyto negative Poisson’s ratio foams via a thermal processing procedure. For the larger cell-
Wang, Lakes, Butenhoff 12
size 20 ppi foam, the optimal parameters were 170˚C and 17 minutes. This gave aminimum Poisson’s ratio of -0.8. For the medium cell-size 65 ppi foam, they were 190˚Cand 13 minutes with a minimum Poisson’s ratio of -0.5. For the small cell-size 100 ppifoam, they were 220˚C and 10 minutes with a minimum Poisson’s ratio of –0.4.
Figure captionsFig. 1: Mold configuration (adapted from Brandel [4])Fig 2: Poisson's ratio laser measurement set-up.Fig 3: Characteristic calibration curves of the laser measurement systemFigure 4: Screening test results of 100 ppi polyurethane foams.Strain = -0.15, Volumetric compression ratio = 2.5, Total 48 samples.Figure 5: Contour map for screening tests of 100 ppi polyurethane foams. Strain = -0.15. Thedarkest area represents optimal region for creating negative Poisson's ratio foams.Figure 6: Repeatability test for the 100 ppi foam. Solid line is provided as a guide to the eye.Cross and plus symbols denote two different tests on the same sample and direction. The uppercurve represents the unprocessed (as received) foam, and lower for the transformed (re-entrant)foam.Figure 7: Poisson's ratio vs. strain in tension and compression for processed and unprocessedfoam of different cell sizes: 20 pores per inch, ppi, or 1.2 mm per pore; 65 ppi, or 0.4 mm perpore; 100 ppi, 0.25 mm per pore.Fig. 8: Poisson's ratio vs. strain: Polyurethane Scott foam [5]. 20 pores per inch, ppi.Open and closed triangles are unprocessed (as received) foams. Closed squares represent foamsprocessed with a volumetric compression ratio of 3.2.Figure 9: Microscopic pictures for the (a) unprocessed 20 ppi foam, (b) transformed 20 ppi foam,(c) unprocessed 65 ppi foam, (d) transformed 65 ppi foam, (e) unprocessed 100 ppi foam, and (f)transformed 100 ppi foam.Acknowledgment
Support by Proctor and Gamble is gratefully acknowledged.
References
1 Fung, Y. C., “Foundations of Solid Mechanics”, Prentice-Hall, Englewood, NJ (1968).2 Love, A. E. H., A treatise on the mathematical theory of elasticity, 4th ed., Dover, NY (1944).3 Lakes, R. S., “Foam structures with a negative Poisson’s ratio”, Science, 235, 1038-1040 (1987).4 Brandel, B. P., M.S. Thesis, University of Wisconsin-Madison (1999).5 Choi, J. B. and Lakes, R. S., “Nonlinear properties of metallic cellular materials with a negative Poisson’sratio”, J. Materials Science, 27, 5373-5381 (1992).6 Lakes, R. S., “Deformation mechanisms of negative Poisson’s ratio materials: structural aspects”, J.Materials Science, 26, 2287-2292 (1991).7 Choi, J. B. and Lakes R. S., “Nonlinear properties of polymer cellular materials with a negative Poisson’sratio”, J. Materials Science, 27, 4678-46848 Lee, T. and Lakes, R. S., “Anisotropic polyurethane foam with Poisson’s ratio greater than 1”, J. MaterialsScience, 32, 2397-2401 (1997).
9 Gibson, L. J. and Ashby, M. F., Cellular Solids: Structure and Properties, Cambridge: CambridgeUniversity Press (1997).
10 Kugler, H., Stacer, R., and Steimle, C., “Direct measurement of Poisson’s ratio in elastomers”, RubberChemistry and Technology, 63, 473-487 (1990).