Embed Size (px)
Citation preview
ORIGINAL PAPER
Influence of atmospheric oxygen on hydrogen detection on Pdusing Kelvin probe technique
Gabriela Schimo1,2 & Wolfgang Burgstaller1,3 & Achim Walter Hassel1,2,3
Received: 28 March 2017 /Revised: 25 July 2017 /Accepted: 27 July 2017 /Published online: 30 September 2017# The Author(s) 2017. This article is an open access publication
Abstract Influence of oxygen concentration in the measure-ment atmosphere on detection of hydrogen using Kelvinprobe was studied. The studied material was a 100-μm-thickpalladium foil, which was mounted in a 3D printed electro-chemical flow cell. The used setup enables hydrogen loadingwith in-situ contact potential measurement of the hydrogenexit side of the Pd electrode. The hydrogen loading andunloading procedure, including insertion of different amountsof hydrogen into the Pd membrane and recording resultingvalues of contact potential difference, was performed at dis-tinct oxygen concentrations ranging between 1 and 80 vol%.An increasing amount of oxygen in the atmosphere surround-ing the hydrogen-loaded Pd electrode resulted in an accelerat-ed removal of hydrogen from the Pd. The kinetics of thisreaction was studied based on Kelvin probe measurements,and a reaction mechanism is discussed.
Keywords Kelvin probe . Hydrogen detection . Palladium .
Diffusion . Permeation . Atmospheric oxygen
Introduction
Palladium is playing an essential role in hydrogen economy[1], which is due to the unprecedented properties of Pd.Compared to other metals, it can easily absorb a large amountof hydrogen at standard conditions [2]. Hydrogen uptake intoPd is proceeding in a two-step mechanism with dissociationand adsorption of the hydrogen molecule on the metal surfaceas first step [3–5]. Hydrogen insertion can be also achievedelectrochemically from aqueous electrolyte by application of asuitably cathodic potential as shown for Pd theoretically [6, 7]and practically in alkaline [8–13] and acidic electrolyte [14,15]. The simplicity of hydrogen uptake makes Pd a promisingcandidate for hydrogen storage [16–19], for example as cata-lyst for hydrogen uptake and removal in other hydrideforming metals [20]. Its properties enable also application asmembrane for hydrogen purification [21–23]. Regarding thehydride formation of Pd, it is important to consider the Pd–H-phase diagram [24], which indicates the occurrence of twophases [25–27]: α-PdHx,α (xα,max = 0.015) and β-PdHx,β
(xβ,min = 0.607) are separated by a miscibility gap, character-ized by the coexistence of both phases. Formation of the β-phase leads to change in several material properties such asdecrease in electrical conductivity [28] and volume expansionof the Pd metal lattice [29]. On the one hand, this change inproperties is the basis for hydrogen sensing [30–32], but onthe other hand, it leads to drawbacks like hydrogen embrittle-ment [16, 33–35]. Based on the work of the Rohwerder group[36–39], Pd was introduced for sensing hydrogen in metalswith Kelvin probe (KP) technique. Detection of hydrogen forexample in steel has great importance for corrosion studiesfocusing hydrogen embrittlement-related damages [40–43].The Kelvin probe method is capable of performing non-destructive surface characterization by means of contact po-tential difference (CPD) or Volta potential measurement.
* Achim Walter [email protected]
1 Institute for Chemical Technology of Inorganic Materials, JohannesKepler University Linz, Altenberger Str. 69, 4040 Linz, Austria
2 CEST Competence Centre for Electrochemical Surface Technology,Viktor Kaplan Str. 2, 2700 Wiener Neustadt, Austria
3 Christian Doppler Laboratory for Combinatorial Oxide Chemistry, atthe Institute for Chemical Technology of Inorganic Materials,Johannes Kepler University Linz, Altenberger Str. 69,4040 Linz, Austria
J Solid State Electrochem (2018) 22:495–504DOI 10.1007/s10008-017-3715-z
Therefore, KP studies are covering many research fields fromthe investigation of corrosion processes [44–49], visualizationof hydrogen distribution in steel [37–39, 50–54] to reactionkinetics studies [55, 56].
The aim of this work is the investigation of Kelvinprobe-based semi-quantitative detection of hydrogen inPd and the influence of measurement conditions on theexperiment. Part 1 of the present work [57] focuses onthe influence of relative humidity on the hydrogen de-tection with KP and explains the fundamental aspects ofhydrogen dependence of CPD. Building on these results,the influence of oxygen concentration in the measure-ment atmosphere is studied. By stepwise alternation ofthe oxygen concentration, the reaction kinetics of hydro-gen removal from Pd involving oxygen as direct reac-tion partner in a water-forming reaction can be studied,which is of great importance for the evaluation of cat-alytic effects on reactions occurring on the Pd surface[58–63]. Additionally, application for hydrogen detec-tion in other metal systems using Pd thin films isdiscussed.
Experimental
A 80 × 10 mm sized, 0.1-mm-thick palladium foil(Goodfellow, as rolled, 99.5%) was cleaned ultrasonical-ly with acetone, ethanol and deionized water, beforemounting into the experimental setup, described else-where [57]. Description of the 3D-printed cell used forin situ hydrogen loading of the Pd foil during Kelvinprobe measurements can be found elsewhere [13].Deaerated 0.1 M NaOH electrolyte solution waspumped with a constant flow rate of 75 ml min−1
through the flow cell.All KP measurements were performed with an in-house
modified system with essential parts from Wicinski &Wicinski GbR, utilizing a 300-μm-thick Cr–Ni tip, probingthe surface in a distance of 110 μm. The KP sample chamberatmosphere was varied in terms of oxygen content, whereasrelative humidity was kept constant at a low level (4% rH) at atemperature of 22.3 °C. In order to enable comparison to elec-trochemical potentials, the system was calibrated before mea-surement by probing an electrochemical system with knownpotential, which was in this case the liquid surface of a satu-rated CuSO4 solution provided in a Cu crucible [44].
Electrochemical hydrogen loading was performedwith a three-electrode arrangement including a Hg/HgO/0.1 M NaOH micro-reference electrode and a goldcounter electrode. For studying dependency of the KPsignal on hydrogen concentration, increasing amounts ofhydrogen were loaded into the Pd by applyingpotentiostatic pulses at − 0.7 V versus standard
hydrogen electrode (SHE) with durations of 5, 15, 30,50, 75, 105, 140 and 180 s. For all electrochemicaltests, a potentiostat (CompactStat, Ivium Technologies,The Netherlands) was used, operating in floating groundmode.
For the investigation of the KP signal variation on steel aswell as on Pd-coated steel, 75 × 10 × 1.06mm3-sized pieces ofFe-0.04C-0.18Mn-0.01P-0.011S steel (wt%) were used. Pdcoatings were fabricated either by physical vapour depositionor by electrochemical deposition. Electrochemical depositionwas carried out galvanostatically as proposed by Flis et al.[64] from a 0.8 g l−1 PdCl2 (pro synthesis, Merck) and60 g l−1 NaOH (TitriPur, Merck) electrolyte solution at roomtemperature. The thermal deposition was performed in acustom-developed thermal evaporator from high purity Pd(99.95%, Heimerle + Meule GmbH Pforzheim, Germany).Process details are reported elsewhere [31]. The thickness ofthe fabricated Pd layers was 90 nm in case of electrodepositionand 110 nm for thermal evaporation. Steel specimens wereground with SiC-paper up to grit 4000 before KP-measurement and Pd deposition.
Results and discussion
Hydrogen measurement and oxygen influence
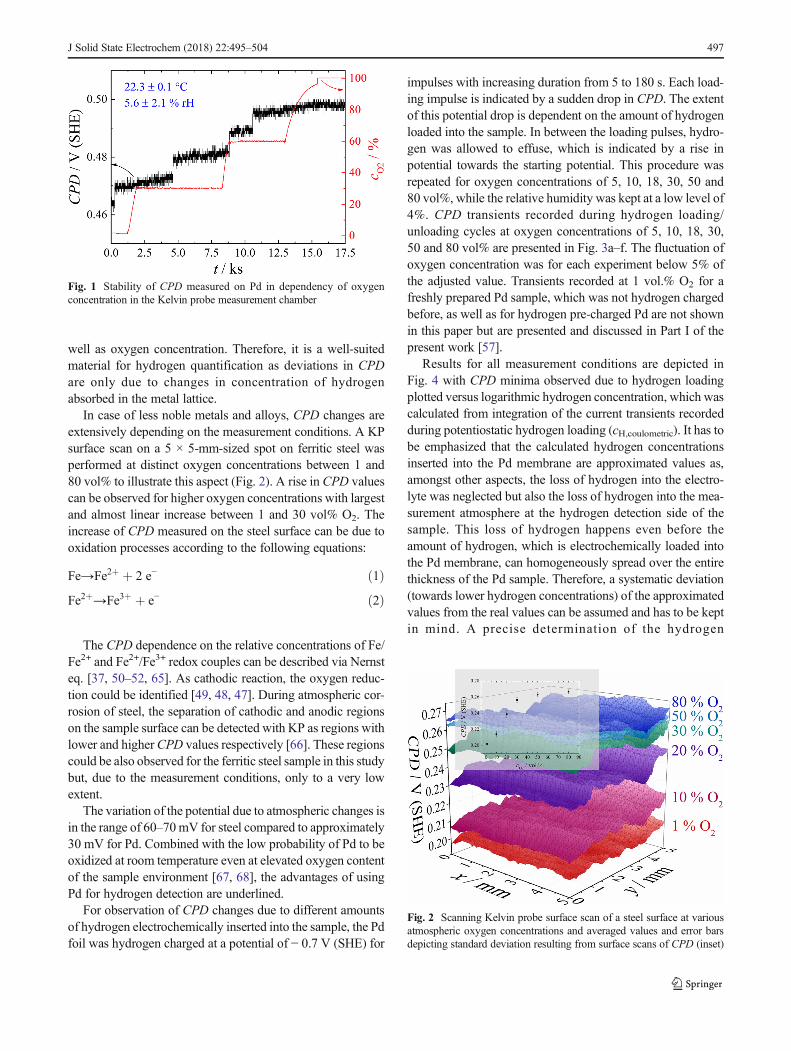
In similar manner as potential stability was shown for Pdduring variation of relative humidity [57], stability has to beproven for increase of oxygen concentration in the measuringatmosphere. Independence of CPD from measurement condi-tions ensures reliable hydrogen quantification, as deviations inCPD are, as a consequence, exclusively based on changes inthe hydrogen concentration within the investigated material.Due to the noble character of Pd, the influence of Pd oxidationprocesses occurring on the surface, especially at higher oxy-gen concentrations, can be neglected. The variation of theoxygen concentration from almost 0 to 100 vol% O2 leadsto a slight increase of CPD from 0.470 to 0.497 V (SHE) asshown in Fig. 1. The observed stepwise CPD increase cannotbe correlated to steps in oxygen concentration transient.However, oxygen adsorption might take place during this ex-periment leading to a rise in CPD. In case that this adsorptionprocess is slow, a similar increasing trend in CPD, as the oneobserved, is conceivable, as oxygen adsorption proceeds tooslowly as to react to an increase in oxygen concentration im-mediately. Therefore, an oxygen adsorption process shouldnot be completely neglected.
At the highest adjusted oxygen concentration (96%), thedetection limit of the utilized oxygen sensor is reached leadingto a displayed value of 100%. In comparison to other metals oralloys like steel, Pd shows a very stable potential at variousatmospheric conditions, concerning relative humidity [57] as
496 J Solid State Electrochem (2018) 22:495–504
well as oxygen concentration. Therefore, it is a well-suitedmaterial for hydrogen quantification as deviations in CPDare only due to changes in concentration of hydrogenabsorbed in the metal lattice.
In case of less noble metals and alloys, CPD changes areextensively depending on the measurement conditions. A KPsurface scan on a 5 × 5-mm-sized spot on ferritic steel wasperformed at distinct oxygen concentrations between 1 and80 vol% to illustrate this aspect (Fig. 2). A rise in CPD valuescan be observed for higher oxygen concentrations with largestand almost linear increase between 1 and 30 vol% O2. Theincrease of CPD measured on the steel surface can be due tooxidation processes according to the following equations:
Fe→Fe2þ þ 2 e− ð1ÞFe2þ→Fe3þ þ e− ð2Þ
The CPD dependence on the relative concentrations of Fe/Fe2+ and Fe2+/Fe3+ redox couples can be described via Nernsteq. [37, 50–52, 65]. As cathodic reaction, the oxygen reduc-tion could be identified [49, 48, 47]. During atmospheric cor-rosion of steel, the separation of cathodic and anodic regionson the sample surface can be detected with KP as regions withlower and higherCPD values respectively [66]. These regionscould be also observed for the ferritic steel sample in this studybut, due to the measurement conditions, only to a very lowextent.
The variation of the potential due to atmospheric changes isin the range of 60–70mV for steel compared to approximately30 mV for Pd. Combined with the low probability of Pd to beoxidized at room temperature even at elevated oxygen contentof the sample environment [67, 68], the advantages of usingPd for hydrogen detection are underlined.
For observation of CPD changes due to different amountsof hydrogen electrochemically inserted into the sample, the Pdfoil was hydrogen charged at a potential of − 0.7 V (SHE) for
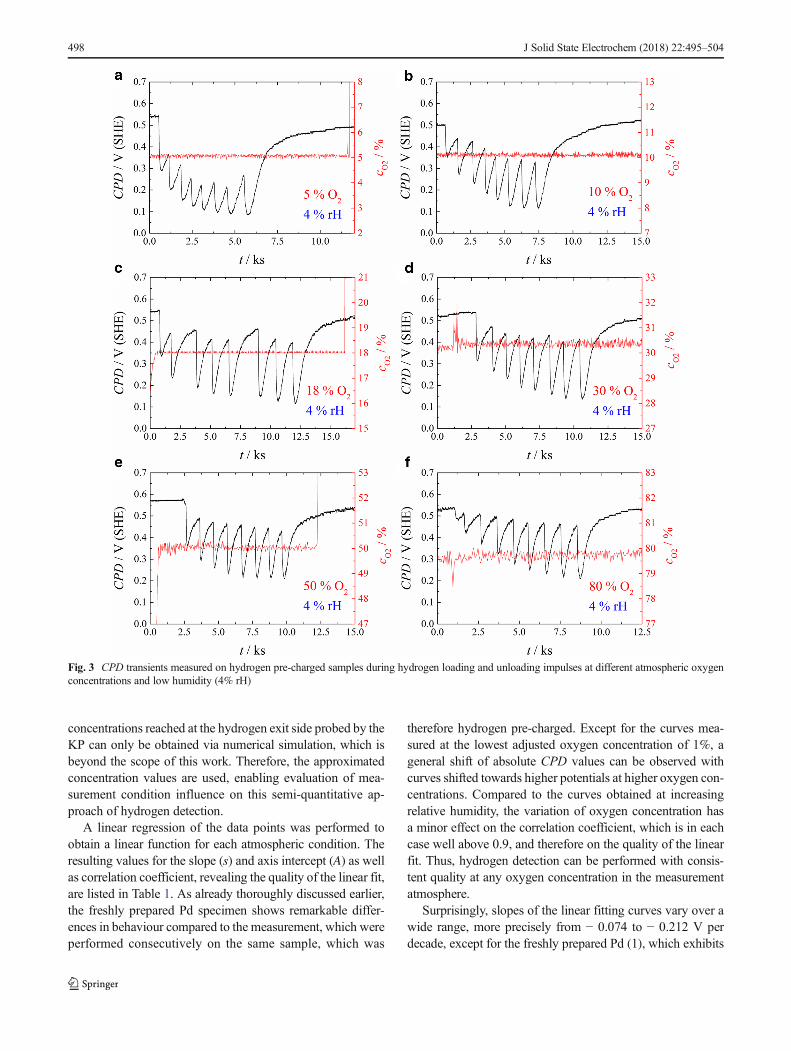
impulses with increasing duration from 5 to 180 s. Each load-ing impulse is indicated by a sudden drop in CPD. The extentof this potential drop is dependent on the amount of hydrogenloaded into the sample. In between the loading pulses, hydro-gen was allowed to effuse, which is indicated by a rise inpotential towards the starting potential. This procedure wasrepeated for oxygen concentrations of 5, 10, 18, 30, 50 and80 vol%, while the relative humidity was kept at a low level of4%. CPD transients recorded during hydrogen loading/unloading cycles at oxygen concentrations of 5, 10, 18, 30,50 and 80 vol% are presented in Fig. 3a–f. The fluctuation ofoxygen concentration was for each experiment below 5% ofthe adjusted value. Transients recorded at 1 vol.% O2 for afreshly prepared Pd sample, which was not hydrogen chargedbefore, as well as for hydrogen pre-charged Pd are not shownin this paper but are presented and discussed in Part I of thepresent work [57].
Results for all measurement conditions are depicted inFig. 4 with CPD minima observed due to hydrogen loadingplotted versus logarithmic hydrogen concentration, which wascalculated from integration of the current transients recordedduring potentiostatic hydrogen loading (cH,coulometric). It has tobe emphasized that the calculated hydrogen concentrationsinserted into the Pd membrane are approximated values as,amongst other aspects, the loss of hydrogen into the electro-lyte was neglected but also the loss of hydrogen into the mea-surement atmosphere at the hydrogen detection side of thesample. This loss of hydrogen happens even before theamount of hydrogen, which is electrochemically loaded intothe Pd membrane, can homogeneously spread over the entirethickness of the Pd sample. Therefore, a systematic deviation(towards lower hydrogen concentrations) of the approximatedvalues from the real values can be assumed and has to be keptin mind. A precise determination of the hydrogen
Fig. 2 Scanning Kelvin probe surface scan of a steel surface at variousatmospheric oxygen concentrations and averaged values and error barsdepicting standard deviation resulting from surface scans of CPD (inset)
Fig. 1 Stability of CPD measured on Pd in dependency of oxygenconcentration in the Kelvin probe measurement chamber
J Solid State Electrochem (2018) 22:495–504 497
concentrations reached at the hydrogen exit side probed by theKP can only be obtained via numerical simulation, which isbeyond the scope of this work. Therefore, the approximatedconcentration values are used, enabling evaluation of mea-surement condition influence on this semi-quantitative ap-proach of hydrogen detection.
A linear regression of the data points was performed toobtain a linear function for each atmospheric condition. Theresulting values for the slope (s) and axis intercept (A) as wellas correlation coefficient, revealing the quality of the linear fit,are listed in Table 1. As already thoroughly discussed earlier,the freshly prepared Pd specimen shows remarkable differ-ences in behaviour compared to the measurement, which wereperformed consecutively on the same sample, which was
therefore hydrogen pre-charged. Except for the curves mea-sured at the lowest adjusted oxygen concentration of 1%, ageneral shift of absolute CPD values can be observed withcurves shifted towards higher potentials at higher oxygen con-centrations. Compared to the curves obtained at increasingrelative humidity, the variation of oxygen concentration hasa minor effect on the correlation coefficient, which is in eachcase well above 0.9, and therefore on the quality of the linearfit. Thus, hydrogen detection can be performed with consis-tent quality at any oxygen concentration in the measurementatmosphere.
Surprisingly, slopes of the linear fitting curves vary over awide range, more precisely from − 0.074 to − 0.212 V perdecade, except for the freshly prepared Pd (1), which exhibits
Fig. 3 CPD transients measured on hydrogen pre-charged samples during hydrogen loading and unloading impulses at different atmospheric oxygenconcentrations and low humidity (4% rH)
498 J Solid State Electrochem (2018) 22:495–504
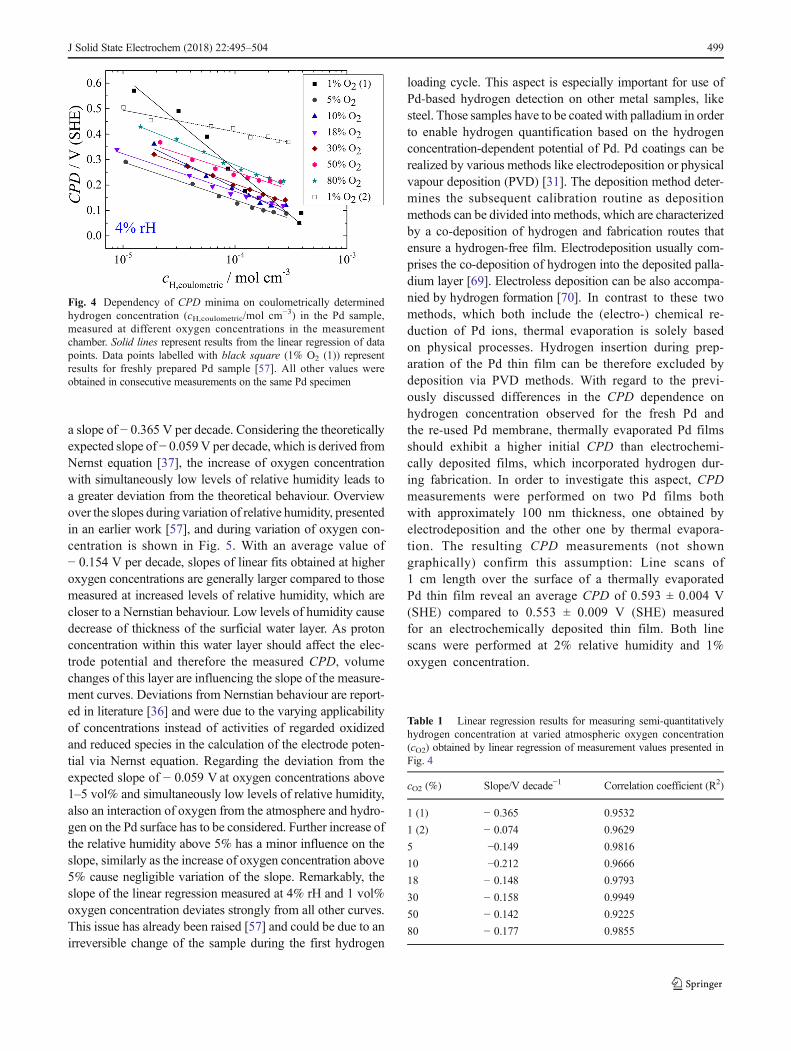
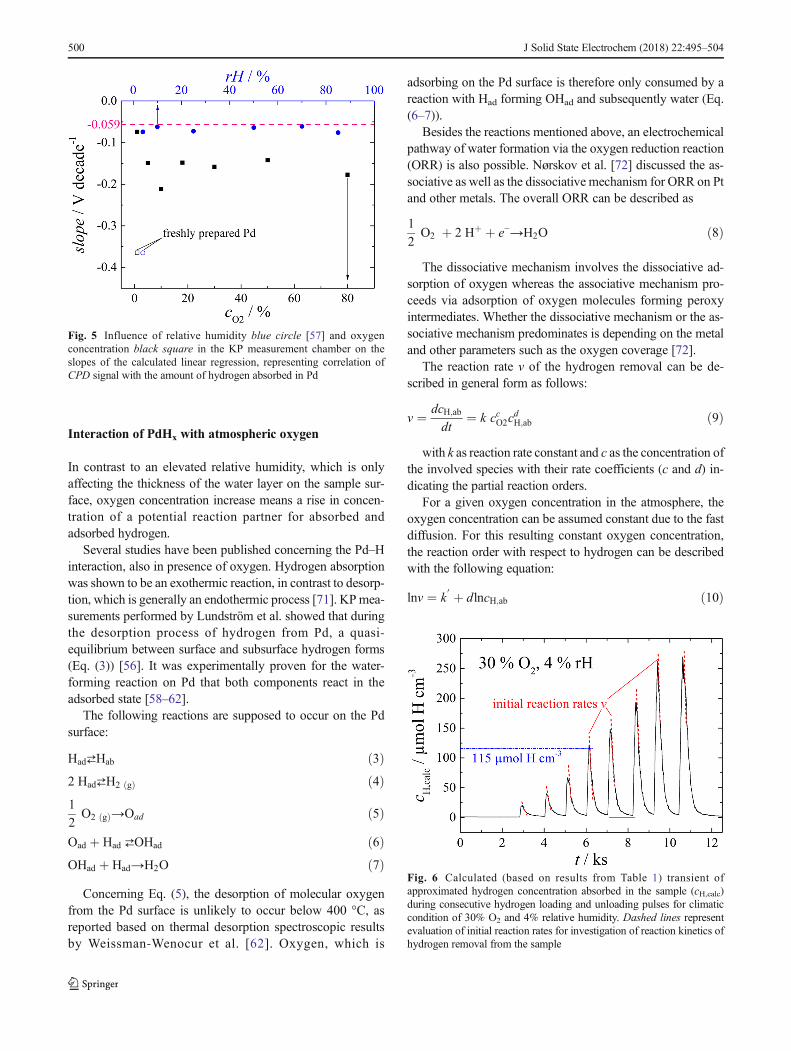
a slope of − 0.365 V per decade. Considering the theoreticallyexpected slope of − 0.059 V per decade, which is derived fromNernst equation [37], the increase of oxygen concentrationwith simultaneously low levels of relative humidity leads toa greater deviation from the theoretical behaviour. Overviewover the slopes during variation of relative humidity, presentedin an earlier work [57], and during variation of oxygen con-centration is shown in Fig. 5. With an average value of− 0.154 V per decade, slopes of linear fits obtained at higheroxygen concentrations are generally larger compared to thosemeasured at increased levels of relative humidity, which arecloser to a Nernstian behaviour. Low levels of humidity causedecrease of thickness of the surficial water layer. As protonconcentration within this water layer should affect the elec-trode potential and therefore the measured CPD, volumechanges of this layer are influencing the slope of the measure-ment curves. Deviations from Nernstian behaviour are report-ed in literature [36] and were due to the varying applicabilityof concentrations instead of activities of regarded oxidizedand reduced species in the calculation of the electrode poten-tial via Nernst equation. Regarding the deviation from theexpected slope of − 0.059 V at oxygen concentrations above1–5 vol% and simultaneously low levels of relative humidity,also an interaction of oxygen from the atmosphere and hydro-gen on the Pd surface has to be considered. Further increase ofthe relative humidity above 5% has a minor influence on theslope, similarly as the increase of oxygen concentration above5% cause negligible variation of the slope. Remarkably, theslope of the linear regression measured at 4% rH and 1 vol%oxygen concentration deviates strongly from all other curves.This issue has already been raised [57] and could be due to anirreversible change of the sample during the first hydrogen
loading cycle. This aspect is especially important for use ofPd-based hydrogen detection on other metal samples, likesteel. Those samples have to be coated with palladium in orderto enable hydrogen quantification based on the hydrogenconcentration-dependent potential of Pd. Pd coatings can berealized by various methods like electrodeposition or physicalvapour deposition (PVD) [31]. The deposition method deter-mines the subsequent calibration routine as depositionmethods can be divided into methods, which are characterizedby a co-deposition of hydrogen and fabrication routes thatensure a hydrogen-free film. Electrodeposition usually com-prises the co-deposition of hydrogen into the deposited palla-dium layer [69]. Electroless deposition can be also accompa-nied by hydrogen formation [70]. In contrast to these twomethods, which both include the (electro-) chemical re-duction of Pd ions, thermal evaporation is solely basedon physical processes. Hydrogen insertion during prep-aration of the Pd thin film can be therefore excluded bydeposition via PVD methods. With regard to the previ-ously discussed differences in the CPD dependence onhydrogen concentration observed for the fresh Pd andthe re-used Pd membrane, thermally evaporated Pd filmsshould exhibit a higher initial CPD than electrochemi-cally deposited films, which incorporated hydrogen dur-ing fabrication. In order to investigate this aspect, CPDmeasurements were performed on two Pd films bothwith approximately 100 nm thickness, one obtained byelectrodeposition and the other one by thermal evapora-tion. The resulting CPD measurements (not showngraphically) confirm this assumption: Line scans of1 cm length over the surface of a thermally evaporatedPd thin film reveal an average CPD of 0.593 ± 0.004 V(SHE) compared to 0.553 ± 0.009 V (SHE) measuredfor an electrochemically deposited thin film. Both linescans were performed at 2% relative humidity and 1%oxygen concentration.
Fig. 4 Dependency of CPD minima on coulometrically determinedhydrogen concentration (cH,coulometric/mol cm−3) in the Pd sample,measured at different oxygen concentrations in the measurementchamber. Solid lines represent results from the linear regression of datapoints. Data points labelled with black square (1% O2 (1)) representresults for freshly prepared Pd sample [57]. All other values wereobtained in consecutive measurements on the same Pd specimen
Table 1 Linear regression results for measuring semi-quantitativelyhydrogen concentration at varied atmospheric oxygen concentration(cO2) obtained by linear regression of measurement values presented inFig. 4
cO2 (%) Slope/V decade−1 Correlation coefficient (R2)
1 (1) − 0.365 0.9532
1 (2) − 0.074 0.9629
5 −0.149 0.9816
10 −0.212 0.9666
18 − 0.148 0.9793
30 − 0.158 0.9949
50 − 0.142 0.9225
80 − 0.177 0.9855
J Solid State Electrochem (2018) 22:495–504 499
Interaction of PdHx with atmospheric oxygen
In contrast to an elevated relative humidity, which is onlyaffecting the thickness of the water layer on the sample sur-face, oxygen concentration increase means a rise in concen-tration of a potential reaction partner for absorbed andadsorbed hydrogen.
Several studies have been published concerning the Pd–Hinteraction, also in presence of oxygen. Hydrogen absorptionwas shown to be an exothermic reaction, in contrast to desorp-tion, which is generally an endothermic process [71]. KPmea-surements performed by Lundström et al. showed that duringthe desorption process of hydrogen from Pd, a quasi-equilibrium between surface and subsurface hydrogen forms(Eq. (3)) [56]. It was experimentally proven for the water-forming reaction on Pd that both components react in theadsorbed state [58–62].
The following reactions are supposed to occur on the Pdsurface:
Had⇄Hab ð3Þ2 Had⇄H2 gð Þ ð4Þ1
2O2 gð Þ→Oad ð5Þ
Oad þ Had ⇄OHad ð6ÞOHad þ Had→H2O ð7Þ
Concerning Eq. (5), the desorption of molecular oxygenfrom the Pd surface is unlikely to occur below 400 °C, asreported based on thermal desorption spectroscopic resultsby Weissman-Wenocur et al. [62]. Oxygen, which is
adsorbing on the Pd surface is therefore only consumed by areaction with Had forming OHad and subsequently water (Eq.(6–7)).
Besides the reactions mentioned above, an electrochemicalpathway of water formation via the oxygen reduction reaction(ORR) is also possible. Nørskov et al. [72] discussed the as-sociative as well as the dissociative mechanism for ORR on Ptand other metals. The overall ORR can be described as
1
2O2 þ 2 Hþ þ e−→H2O ð8Þ
The dissociative mechanism involves the dissociative ad-sorption of oxygen whereas the associative mechanism pro-ceeds via adsorption of oxygen molecules forming peroxyintermediates. Whether the dissociative mechanism or the as-sociative mechanism predominates is depending on the metaland other parameters such as the oxygen coverage [72].
The reaction rate v of the hydrogen removal can be de-scribed in general form as follows:
v ¼ dcH;abdt
¼ k ccO2cdH;ab ð9Þ
with k as reaction rate constant and c as the concentration ofthe involved species with their rate coefficients (c and d) in-dicating the partial reaction orders.
For a given oxygen concentration in the atmosphere, theoxygen concentration can be assumed constant due to the fastdiffusion. For this resulting constant oxygen concentration,the reaction order with respect to hydrogen can be describedwith the following equation:
lnv ¼ k0 þ dlncH;ab ð10Þ
Fig. 5 Influence of relative humidity blue circle [57] and oxygenconcentration black square in the KP measurement chamber on theslopes of the calculated linear regression, representing correlation ofCPD signal with the amount of hydrogen absorbed in Pd
Fig. 6 Calculated (based on results from Table 1) transient ofapproximated hydrogen concentration absorbed in the sample (cH,calc)during consecutive hydrogen loading and unloading pulses for climaticcondition of 30% O2 and 4% relative humidity. Dashed lines representevaluation of initial reaction rates for investigation of reaction kinetics ofhydrogen removal from the sample
500 J Solid State Electrochem (2018) 22:495–504
For the evaluation of the interaction of oxygen andabsorbed/adsorbed H on the hydrogen-loaded Pd surface, hy-drogen concentration transients were calculated based on thepreviously described linear regression results. One represen-tative transient obtained by this method is presented in Fig. 6,depicting the transient at 30 vol% O2 during the consecutivehydrogen loading and unloading steps. Hydrogen concentra-tion within the sample is increased during hydrogen-loadingpulses and subsequently decreased due to hydrogen removalfrom the sample. The steepness of the concentration transientduring this unloading step gives information about the effu-sion rate of hydrogen.
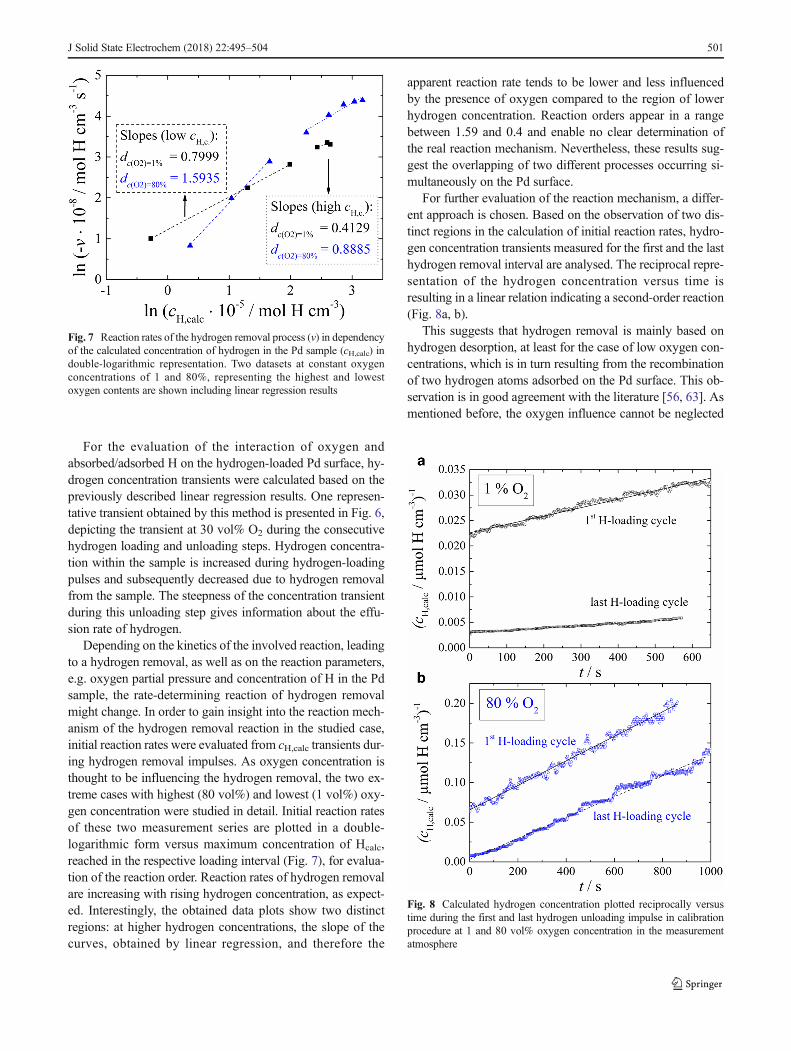
Depending on the kinetics of the involved reaction, leadingto a hydrogen removal, as well as on the reaction parameters,e.g. oxygen partial pressure and concentration of H in the Pdsample, the rate-determining reaction of hydrogen removalmight change. In order to gain insight into the reaction mech-anism of the hydrogen removal reaction in the studied case,initial reaction rates were evaluated from cH,calc transients dur-ing hydrogen removal impulses. As oxygen concentration isthought to be influencing the hydrogen removal, the two ex-treme cases with highest (80 vol%) and lowest (1 vol%) oxy-gen concentration were studied in detail. Initial reaction ratesof these two measurement series are plotted in a double-logarithmic form versus maximum concentration of Hcalc,reached in the respective loading interval (Fig. 7), for evalua-tion of the reaction order. Reaction rates of hydrogen removalare increasing with rising hydrogen concentration, as expect-ed. Interestingly, the obtained data plots show two distinctregions: at higher hydrogen concentrations, the slope of thecurves, obtained by linear regression, and therefore the
apparent reaction rate tends to be lower and less influencedby the presence of oxygen compared to the region of lowerhydrogen concentration. Reaction orders appear in a rangebetween 1.59 and 0.4 and enable no clear determination ofthe real reaction mechanism. Nevertheless, these results sug-gest the overlapping of two different processes occurring si-multaneously on the Pd surface.
For further evaluation of the reaction mechanism, a differ-ent approach is chosen. Based on the observation of two dis-tinct regions in the calculation of initial reaction rates, hydro-gen concentration transients measured for the first and the lasthydrogen removal interval are analysed. The reciprocal repre-sentation of the hydrogen concentration versus time isresulting in a linear relation indicating a second-order reaction(Fig. 8a, b).
This suggests that hydrogen removal is mainly based onhydrogen desorption, at least for the case of low oxygen con-centrations, which is in turn resulting from the recombinationof two hydrogen atoms adsorbed on the Pd surface. This ob-servation is in good agreement with the literature [56, 63]. Asmentioned before, the oxygen influence cannot be neglected
Fig. 7 Reaction rates of the hydrogen removal process (v) in dependencyof the calculated concentration of hydrogen in the Pd sample (cH,calc) indouble-logarithmic representation. Two datasets at constant oxygenconcentrations of 1 and 80%, representing the highest and lowestoxygen contents are shown including linear regression results
Fig. 8 Calculated hydrogen concentration plotted reciprocally versustime during the first and last hydrogen unloading impulse in calibrationprocedure at 1 and 80 vol% oxygen concentration in the measurementatmosphere
J Solid State Electrochem (2018) 22:495–504 501
as the oxygen concentration is obviously influencing the hy-drogen removal rate. Higher reaction rates obtained for mea-surements at 80 vol% oxygen concentration clearly indicatean accelerated hydrogen removal and therefore a water-forming reaction mechanism. It was repeatedly reported thatthe formation of OHad represents the rate-determining step inthe water formation reaction [58–62].
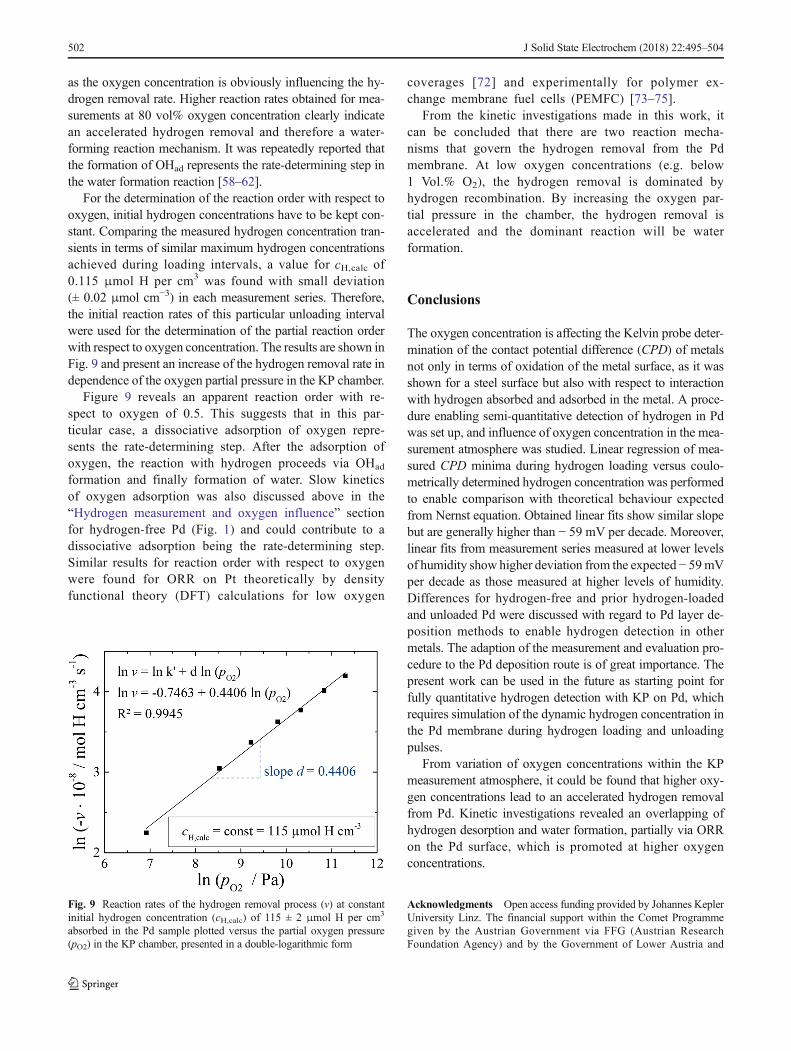
For the determination of the reaction order with respect tooxygen, initial hydrogen concentrations have to be kept con-stant. Comparing the measured hydrogen concentration tran-sients in terms of similar maximum hydrogen concentrationsachieved during loading intervals, a value for cH,calc of0.115 μmol H per cm3 was found with small deviation(± 0.02 μmol cm−3) in each measurement series. Therefore,the initial reaction rates of this particular unloading intervalwere used for the determination of the partial reaction orderwith respect to oxygen concentration. The results are shown inFig. 9 and present an increase of the hydrogen removal rate independence of the oxygen partial pressure in the KP chamber.
Figure 9 reveals an apparent reaction order with re-spect to oxygen of 0.5. This suggests that in this par-ticular case, a dissociative adsorption of oxygen repre-sents the rate-determining step. After the adsorption ofoxygen, the reaction with hydrogen proceeds via OHad
formation and finally formation of water. Slow kineticsof oxygen adsorption was also discussed above in the“Hydrogen measurement and oxygen influence” sectionfor hydrogen-free Pd (Fig. 1) and could contribute to adissociative adsorption being the rate-determining step.Similar results for reaction order with respect to oxygenwere found for ORR on Pt theoretically by densityfunctional theory (DFT) calculations for low oxygen
coverages [72] and experimentally for polymer ex-change membrane fuel cells (PEMFC) [73–75].
From the kinetic investigations made in this work, itcan be concluded that there are two reaction mecha-nisms that govern the hydrogen removal from the Pdmembrane. At low oxygen concentrations (e.g. below1 Vol.% O2), the hydrogen removal is dominated byhydrogen recombination. By increasing the oxygen par-tial pressure in the chamber, the hydrogen removal isaccelerated and the dominant reaction will be waterformation.
Conclusions
The oxygen concentration is affecting the Kelvin probe deter-mination of the contact potential difference (CPD) of metalsnot only in terms of oxidation of the metal surface, as it wasshown for a steel surface but also with respect to interactionwith hydrogen absorbed and adsorbed in the metal. A proce-dure enabling semi-quantitative detection of hydrogen in Pdwas set up, and influence of oxygen concentration in the mea-surement atmosphere was studied. Linear regression of mea-sured CPD minima during hydrogen loading versus coulo-metrically determined hydrogen concentration was performedto enable comparison with theoretical behaviour expectedfrom Nernst equation. Obtained linear fits show similar slopebut are generally higher than − 59 mV per decade. Moreover,linear fits from measurement series measured at lower levelsof humidity show higher deviation from the expected − 59mVper decade as those measured at higher levels of humidity.Differences for hydrogen-free and prior hydrogen-loadedand unloaded Pd were discussed with regard to Pd layer de-position methods to enable hydrogen detection in othermetals. The adaption of the measurement and evaluation pro-cedure to the Pd deposition route is of great importance. Thepresent work can be used in the future as starting point forfully quantitative hydrogen detection with KP on Pd, whichrequires simulation of the dynamic hydrogen concentration inthe Pd membrane during hydrogen loading and unloadingpulses.
From variation of oxygen concentrations within the KPmeasurement atmosphere, it could be found that higher oxy-gen concentrations lead to an accelerated hydrogen removalfrom Pd. Kinetic investigations revealed an overlapping ofhydrogen desorption and water formation, partially via ORRon the Pd surface, which is promoted at higher oxygenconcentrations.
Acknowledgments Open access funding provided by Johannes KeplerUniversity Linz. The financial support within the Comet Programmegiven by the Austrian Government via FFG (Austrian ResearchFoundation Agency) and by the Government of Lower Austria and
Fig. 9 Reaction rates of the hydrogen removal process (v) at constantinitial hydrogen concentration (cH,calc) of 115 ± 2 μmol H per cm3
absorbed in the Pd sample plotted versus the partial oxygen pressure(pO2) in the KP chamber, presented in a double-logarithmic form
502 J Solid State Electrochem (2018) 22:495–504
J Solid State Electrochem (2018) 22:495–504 503
Upper Austria is gratefully acknowledged. The financial support by theAustrian Federal Ministry of Science, Research and Economy and theNational Foundation for Research, Technology and Developmentthrough the Christian Doppler Laboratory for Combinatorial OxideChemistry (COMBOX) is gratefully acknowledged. The authors thankthe voestalpine for the support as well as Prof. Andrei I. Mardare andChristian M. Siket for the many helpful discussions.
Open Access This article is distributed under the terms of the CreativeCommons At t r ibut ion 4 .0 In te rna t ional License (h t tp : / /creativecommons.org/licenses/by/4.0/), which permits unrestricted use,distribution, and reproduction in any medium, provided you give appro-priate credit to the original author(s) and the source, provide a link to theCreative Commons license, and indicate if changes were made.
References
1. Adams BD, Chen A (2011) The role of palladium in a hydrogeneconomy. Mater Today 14:282–289
2. Jewell L, Davis B (2006) Review of absorption and adsorption inthe hydrogen–palladium system. Appl Catal A 310:1–15
3. Lee J, Pyun S (2005) Anomalous behaviour of hydrogen extractionfrom hydride-formingmetals and alloys under impermeable bound-ary conditions. Electrochim Acta 50:1777–1805
4. Mitsui T, Rose MK, Fomin E, Ogletree DF, Salmeron M (2003)Dissociative hydrogen adsorption on palladium requires aggregatesof three or more vacancies. Nature 422:705–707
5. Nakatsuji H, Hada M (1985) Interaction of a hydrogen moleculewith palladium. J Am Chem Soc 107:8264–8266
6. Gabrielli C, Grand PP, Lasia A, Perrot H (2004) Investigation ofhydrogen adsorption-absorption into thin palladium films: I.Theory J Electrochem Soc 151:A1925
7. Zoltowski P (1999) Effects of self-induced mechanical stress inhydrogen sorption by metals, by EIS. Electrochim Acta 44:4415–4429
8. Devanathan MAV, Stachurski Z (1962) The adsorption and diffu-sion of electrolytic hydrogen in palladium. Proc Royal Soc A 270:90–102
9. Yang T, Pyun S (1996) Hydrogen absorption and diffusion into andin palladium. Electrochim Acta 41:843–848
10. Yang T, Pyun S, Yoon Y (1997) Hydrogen transport through Pdelectrode. Electrochim Acta 42:1701–1708
11. Lim C, Pyun S (1994) Impedance analysis of hydrogen absorptionreaction on Pd membrane electrode in 0.1 M LiOH solution underpermeable boundary conditions. Electrochim Acta 39:363–373
12. MartinMH, Lasia A (2008) Study of the hydrogen absorption in Pdin alkaline solution. Electrochim Acta 53:6317–6322
13. Schimo G, Burgstaller W, Hassel AW (2015) Potentiodynamic hy-drogen permeation on palladium-Kelvin probe compared to 3Dprinted microelectrochemical cell. Electrochem Commun 60:208–211
14. Zoltowski P, Makowska E (2001) Diffusion coefficient of hydrogenin α-phase palladium and palladium–platinum alloy. Phys ChemChem Phys 3:2935–2942
15. Gabrielli C, Grand PP, Lasia A, Perrot H (2004) Investigation ofhydrogen adsorption and absorption in palladium thin films: II.Cyclic Voltammetry J Electrochem Soc 151:A1937
16. Narehood D, Kishore S, Goto H, Adair J, Nelson J, Gutierrez H,Eklund P (2009) X-ray diffraction and H-storage in ultra-smallpalladium particles. Int J Hydrog Energy 34:952–960
17. Züttel A, Sudan P, Mauron P, Kiyobayashi T, Emmenegger C,Schlapbach L (2002) Hydrogen storage in carbon nanostructures.Int J Hydrog Energy 27:203–212
18. Sakintuna B, Lamari-Darkrim F, Hirscher M (2007) Metal hydridematerials for solid hydrogen storage. Int J Hydrog Energy 32:1121–1140
19. Schlapbach L, Züttel A (2001) Hydrogen-storage materials for mo-bile applications. Nature 414:353–358
20. Zaluski L, Zaluska A, Tessier P, Ström-Olsen JO, Schulz R (1995)Catalytic effect of Pd on hydrogen absorption in mechanicallyalloyed Mg2Ni, LaNi5 and FeTi. J Alloys Compd 217:295–300
21. Hatlevik Ø, Gade SK, KeelingMK, Thoen PM, Davidson AP, WayJD (2010) Palladium and palladium alloy membranes for hydrogenseparation and production. Sep Purif Technol 73:59–64
22. Park ED, Lee D, Lee HC (2009) Recent progress in selective COremoval in a H2-rich stream. Catal Today 139:280–290
23. Li H, Xu H, Li W (2008) Study of n value and α/β palladiumhydride phase transition within the ultra-thin palladium compositemembrane. J Membr Sci 324:44–49
24. Manchester FD, San-Martin A, Pitre JM (1994) The H-Pd(hydrogen-palladium) system. J Phase Equilibria 15:62–83
25. Vogel W, He W, Huang Q, Zou Z, Zhang X, Yang H (2010)Palladium nanoparticles “breathe” hydrogen; a surgical view withX-ray diffraction. Int J Hydrog Energy 35:8609–8620
26. Flanagan TB, Oates WA (1991) The palladium-hydrogen system.Annu Rev Mater Sci 21:269–304
27. Lewis F (1995) The palladium-hydrogen system. Int J HydrogEnergy 20:587–592
28. Baba K, Miyagawa U, Watanabe K, Sakamoto Y, Flanagan TB(1990) Electrical resistivity changes due to interstitial hydrogen inpalladium-rich substitutional alloys. J Mater Sci 25:3910–3916
29. Feenstra R, Griessen R, de Groot DG Hydrogen induced latticeexpansion and effective H-H interaction in single phase PdHc. JPhys F: Met Phys 16:1933
30. Ghasemi S, Hosseini SR, Nabipour S, Asen P (2015) Palladiumnanoparticles supported on graphene as an efficient electrocatalystfor hydrogen evolution reaction. Int J Hydrog Energy 40:16184–16191
31. Walkner S, Schimo G, Mardare AI, Hassel AW (2015) Palladiumthin films for hydrogen sensing in aqueous electrolytes. Phys StatusSolidi A 212:1273–1280
32. Şennik E, Kılınç N, Öztürk ZZ (2010) Temperature-dependent H2gas-sensing properties of fabricated Pd nanowires using highly ori-ented pyrolytic graphite. J Appl Phys 108:54317
33. Merzlikin SV, Wildau M, Steinhoff K, Hassel AW (2014) Prove ofhydrogen formation through direct potential measurements in therolling slit during cold rolling. Metall Res Technol 111:25–35
34. Cottis RA (2010) In: Richardson TA, Cottis RA, Shreir LL (eds)Hydrogen Embrittlement, 4th edn. Elsevier, Amsterdam
35. Feitosa J, da Cruz A, Souza AC, Duda FP (2015) Stress effects onhydrogen permeation through tubular multilayer membranes. Int JHydrog Energy 40:17031–17037
36. Evers S, Rohwerder M (2012) The hydrogen electrode in the “dry”.Electrochem Commun 24:85–88
37. Evers S, Senöz C, Rohwerder M (2013) Hydrogen detection inmetals: a review and introduction of a Kelvin probe approach. SciTechnol Adv Mater 14:14201
38. Evers S, Senöz C, Rohwerder M (2013) Spatially resolved highsensitive measurement of hydrogen permeation by scanningKelvin probe microscopy. Electrochim Acta 110:534–538
39. Senöz C, Evers S, Stratmann M, Rohwerder M (2011) ScanningKelvin probe as a highly sensitive tool for detecting hydrogen per-meation with high local resolution. Electrochem Commun 13:1542–1545
40. Akiyama E, Li S, Shinohara T, Zhang Z, Tsuzaki K (2011)Hydrogen entry into Fe and high strength steels under simulatedatmospheric corrosion. Electrochim Acta 56:1799–1805
41. Pressouyre GM (1980) Trap theory of hydrogen embrittlement.Acta Metall 28:895–911
504 J Solid State Electrochem (2018) 22:495–504
42. Herlach D, Kottler C, Wider T, Maier K (2000) Hydrogen embrit-tlement of metals. Phys B 289-290:443–446
43. Djukic MB, Sijacki Zeravcic V, Bakic GM, Sedmak A, Rajicic B(2015) Hydrogen damage of steels. Eng Fail Anal 58:485–498
44. Rohwerder M, Turcu F (2007) High-resolution Kelvin probe mi-croscopy in corrosion science. Electrochim Acta 53:290–299
45. Frankel GS, Stratmann M, Rohwerder M, Michalik A, Maier B,Dora J, Wicinski M (2007) Potential control under thin aqueouslayers using a Kelvin probe. Corros Sci 49:2021–2036
46. Prosek T, Nazarov A, Bexell U, Thierry D, Serak J (2008)Corrosion mechanism of model zinc–magnesium alloys in atmo-spheric conditions. Corros Sci 50:2216–2231
47. Stratmann M, Streckel H (1990) On the atmospheric corrosion ofmetals which are covered with thin electrolyte layers—I.Verification of the experimental technique. Corros Sci 30:681–696
48. Stratmann M, Streckel H (1990) On the atmospheric corrosion ofmetals which are covered with thin electrolyte layers—II.Experimental results. Corros Sci 30:697–714
49. StratmannM, Streckel H, Kim KT, Crockett S (1990) On the atmo-spheric corrosion of metals which are covered with thin electrolytelayers—III. The measurement of polarisation curves on metal sur-faces which are covered by thin electrolyte layers. Corros Sci 30:715–734
50. Krasemann M, Streckel H, Hoffmann K, Grabke H, Stratmann M(1998) Passivity Breakdown and related processes. In: NatishanPM (ed) Detection of hydrogen ingress into iron oxide and ironoxy-hydroxide layers by the Kelvin probe. Proceedings of the sym-posium on Passivity and its breakdown. Electrochemical Society,Pennington, NJ
51. Williams G, McMurray HN, Newman RC (2013) Surface oxidereduction by hydrogen permeation through iron foil detected usinga scanning Kelvin probe. Electrochem Commun 27:144–147
52. Schaller RF, Scully JR (2014) Measurement of effective hydrogendiffusivity using the scanning Kelvin probe. Electrochem Commun40:42–44
53. Wang G, Yan Y, Yang X, Li J, Qiao L (2013) Investigation ofhydrogen evolution and enrichment by scanningKelvin probe forcemicroscopy. Electrochem Commun 35:100–103
54. Schimo G, Burgstaller W, Hassel AW (2016) Rolling direction de-pendent diffusion coefficient of hydrogen in ferritic steel by SDCMcharging and SKP probing. ISIJ Int 56:487–491
55. Söderberg D, Lundström I (1983) Competition between hydrogenand oxygen dissociation on palladium surfaces at atmospheric pres-sures. Solid State Commun 45:431–434
56. Lundström I, Söderberg D (1982) Isothermal hydrogen desorptionfrom palladium films. Appl Surf Sci 10:506–522
57. Burgstaller W, Schimo G, Hassel AW (2017) Challenges in hydro-gen quantification using Kelvin probe technique at different levelsof relative humidity. J Solid State Electrochem 21:1785–1796
58. Demchenko DO, Sacha GM, Salmeron M, Wang L (2008)Interactions of oxygen and hydrogen on Pd(111) surface. Surf Sci602:2552–2557
59. Mitsui T, Rose M, Fomin E, Ogletree D, Salmeron M (2002)Coadsorption and interactions of O and H on Pd(). Surf Sci 511:259–266
60. Pauer G, Kratzer M, Winkler A (2005) Reaction and desorptionkinetics of H2 and H2O on activated and non-activated palladiumsurfaces. Vacuum 80:81–86
61. Engel T, Kuipers H (1979) A molecular-beam investigation of thereaction H2 + O2 → H2O on Pd(111). Surf Sci 90:181–196
62. Weissman-Wenocur DL, Spicer WE (1983) Comparison betweenthe catalytic activities of Pd(111) and Pd-Au(111) for water synthe-sis. Surf Sci 133:499–515
63. Winkler A (2009) Adsorption, reaction and desorption of hydrogenon modified Pd(111) surfaces. Appl Surf Sci 256:1114–1119
64. Flis J (1999) Changes in hydrogen entry rate and in surface of ironduring cathodic polarisation in alkaline solutions. Electrochim Acta44:3989–3997
65. Nazarov AP, Marshakov AI, Rybkina AA (2015) Iron hydrogena-tion under atmospheric corrosion. Studies using a scanning vibrat-ing microscope. Prot Met Phys Chem Surf 51:347–359
66. Nazarov A, Thierry D (2007) Application of Volta potential map-ping to determine metal surface defects. Electrochim Acta 52:7689–7696
67. ZhengG, Altman EI (2000) The oxidation of Pd(111). Surf Sci 462:151–168
68. Voogt EH, Mens A, Gijzeman O, Geus JW (1997) Adsorption ofoxygen and surface oxide formation on Pd(111) and Pd foil studiedwith ellipsometry, LEED, AES and XPS. Surf Sci 373:210–220
69. Abys JA (2010) Palladium Electroplating. In: Schlesinger MPaunovic M (ed) Modern Electroplating, 5th ed. Wiley, Hoboken,N.J
70. Mallory GO, Hajdu JB (1990) Electroless plating. AmericanElectroplaters and Surface Finishers Society, Orlando
71. Flanagan TB, LuoW, Clewley JD (1991) Calorimetric enthalpies ofabsorption and desorption of protium and deuterium by palladium.J Less Common Metal 172-174:42–55
72. Norskov JK, Rossmeisl J, Logadottir A, Lindqvist L, Kitchin JR,Bligaard T, JónssonH (2004)Origin of the overpotential for oxygenreduction at a fuel-cell cathode. J Phys Chem B 108:17886–17892
73. Xu H, Song Y, Russell Kunz H, Fenton JM (2005) Effect of elevat-ed temperature and reduced relative humidity on ORR kinetics forPEM fuel cells. J Electrochem Soc 152:A1828–A1836
74. Neyerlin KC, Gu W, Jorne J, Gasteiger HA (2006) Determinationof catalyst unique parameters for oxygen reduction reaction in aPEMFC. J Electrochem Soc 153:A1955–A1963
75. Takahashi I, Kocha SS (2010) Examination of the activity and du-rability of PEMFC catalysts in liquid electrolytes. J Power Sources195:6312–6322