Embed Size (px)
Citation preview

Influence of Added Salt on Dynamic Viscoelasticity of Carboxymethylcellulose Aqueous Systems
TAKAYOSHI MATSUMOTO and KIM10 MASHIKO*
Department of Polymer Chemistry Kyoto University Kyoto 606, J a p a n
Using three series of sodium carboxymethylcellulose (NaCMC) in the range of the degree of substitution (the auexage number of carboxymethyl groups/glucose unit) from 0.5 to 1.3, weight-average molecular weight M, was determined by light scattering in solution of triethylene- diamine cadmium hydroxide (cadoxene). It was found that the relation between M, and the limiting viscosity number [q] in 0.1 N sodium chloride (NaC1) aqueous solution can be represented by Staudinger's equation. Dynamic viscoelas- ticity of aqueous disperse systems of NaCMC with various added salts was measured by means of a cone-and-plate rheometer. If the concentration of added salt is less than the concentration at which polymer begins to salt out, frequency dependence curves of the dynamic modulus, which is measured at various salt concentrations, can be superposed into a master curve by horizontal shift only. The shift factor depends on the salt concentration and the kind of salt.
INTRODUCTION odium carboxymethylcellulose (NaCMC) is S an anionic polysaccharide with wide use in
various industrial fields as a dispersing and flocculating agent, an adhesive, a humectant, and a thickner, etc. It is important to under- stand fully the rheological properties of NaCMC aqueous disperse systems for higher level ap- plications. However, there are only a few inveg- tigations on the rheology of these systems (1 - 3). Amari and Nakamura (4) measured dynamic viscoelasticity of semidilute aqueous disperse systems of NaCMC in a wide frequency range of 1 Od2 to 1 O3 s-'. Elliot and Ganz (5) reported that NaCMC aqueous disperse systems show thixo- tropy and Bingham yield stress.
NaCMC with wide varieties of degree of etherification (DS, the degree of substitution, the average number of carboxymethyl groups/ glucose unit) and degree of polymerization are available (6). The chemical formula of the re- peating unit of NaCMC having DS of 1.0 is shown as follows:
Address: Japan Tabacco Incorporated. Hlratsuka Research Institute of Engl- neering. 1-31 Kurobeoka, Hiratsuka. Kanagawa 254. Japan.
We have investigated the influence of the degree of substitution, the degree of polymeri- zation, and concentration on rheological prop- erties of the NaCMC aqueous disperse system (7). I t was shown that the rheological behavior as the polyelectrolyte and the dispersing state in water depend strongly on DS.
In the present report, the relation between limiting viscosity number and molecular weight and the influence of added salts on the rheolog- ical properties of NaCMC aqueous systems are discussed.
EXPERIMENTAL
Samples
NaCMC employed, kindly tendered by DAI- ICHI KOGYO SEIYAKU Co. Ltd., are shown in Table 1. These polymers were washed twice with ethanol/water (8/2) mixed solvent and dried in vacuum.
Weight-average molecular weight M, of the NaCMC was measured by means of a low-angle light-scattering photometer (Chromatix, KMX- 6) with cadoxene (trimethylenediamine cad- mium hydroxide) solution at a scattering angle of 6 to 7 degrees. Clear solutions can be ob- tained from all the polymer samples irrespective of DS values (8). Specific refractive index incre- ment d n / d c was measured with a differential refractometer (UNION GIKEN Co. Ltd.). Weight-
POLYMER ENQfNEERlNG AND SCIENCE, March, 1988, Vol. 28, No. 6 393

Takayoshi Matsurnoto a n d Kirnio Mashiko
Table 1. Code of NaCMC, Degree of Substitution, Molecular Weight, Degree of Polymerizations, and Specific Refractive
Index Increment.
Sample DS M,.x P, Pn dnldc (mL1g)
CM13 0.51 1.87 922 437 0.150 CM25 0.57 2.51 1209 750+50 0.146‘ CM4 0.91 1.45 618 178 0.1 26’ CM16 0.88 2.06 886 301 0.128 CM15 0.80 2.15 951 349 0.133’ CM34 0.92 7.90 3357 956 0.126’ CM18 1.13 2.22 880 314 0.110 CM36 1.31 5.85 2193 1569 0.1 10
*Interpolated from the plot of dn/dc and DS.
average degree of polymerization P, was calcu- lated from
(1) P, = M,/(162.1 + 80.0 DS).
Limiting viscosity number [q] was measured for 0.1 N NaCl aqueous solution of NaCMC by means of a Ubbelohde-type capillary viscome- ter. Number-average degree of polymerization Pn was calculated by the following equation (9, 10):
[V]O.lNNaCl = 16.6 K m P n (2) where K , is a constant depending on DS (9).
Measurement of Viscoelasticity Sample polymers were dispersed in water or
in aqueous solutions of various salts such as LiC1, NaCI, KCl, MgC12, CaC12, and BaCI2. Dy- namic viscoelastic properties were measured by means of a cone-and-plate type rheometer (Rheometrics Mechanical Spectrometer) with cone angle 1.7 degree and plate diameter 5.0 cm. Measuring frequency ranged from lo-’ to 102s-’, and strain amplitude was 0.1 at which all the samples showed linear viscoelasticity. Measuring temperature ranged from 27°C to 60”C, and time-temperature superposition was applied for viscoelastic functions.
RESULTS AND DISCUSSION Relation Between [ 7 ~ ] and Molecular Weight
In Fig. 1, reduced viscosity qsp/c or inherent viscosity (In v)/c are plotted against the concen- tration of NaCMC, c, for the 0.1 N NaCl aqueous solution at 25°C. The limiting viscosity number (111 can be obtained by extrapolation to c = 0. In Figs. 2a and 2b, (771 is logarithmically plotted against the weight-average molecular weight M, and the weight-average degree of polymeri- zation P,, respectively. NaCMC having low DS of the order of 0.5 was excepted from the deter- mination of these relationships, since clear so- lutions were not able to be obtained from these polymers in mixing with 0.1 N NaCl aqueous solution. The plots of log [v] vs. log M, and log [v ] vs. log P,, which are slightly dependent on DS, are approximated to straight lines having slope 1. That is, Staudinger’s relation can be applied as follows:
2 5OC
. V \ L
F C d
CM3L CM3€
I8 e 13 15
Q
\--
0416 ‘044
I I I 1 I I
0 002 QO4 0.06 0.08 0.10 012 014 C g/100ml
Fig. 1 . Extrapolations of qsp/c and In nJc to zero concen- tration for NaCMC in 0.1 N NaCl aqueous solution.
[v ] = K Pw (3) where
K = 5.01 x dL/g for DS = 0.8-1.0 (4) K = 6.68 X loe3 dL/g for DS > 1.0
Dynamic Viscoelasticity In Fig. 3, logarithms of storage G’ and loss
G” moduli are plotted against logarithm of fre- quency log m a T for 15 wt% aqueous disperse systems of four NaCMCs: CM13, CM15, CM16, and CM 18. These curves are master curves by the time-temperature superposition in the range from 27°C to 60°C and aT is the shift factor for the reference temperature 40°C. These polymers have almost the same P, of approximately 900 but different DS values. G ’ and G ” increase with decreasing DS. Especially in the low frequency region, the dynamic mod- ulus of the low DS polymer shows a so-called second plateau which is a characteristic behav- ior in inhomogeneous systems such as suspen- sion (1 1, 12). In the high frequency region, all the systems show the rubbery plateau and the height of the plateau is almost the same except for the system of CM13.
Photomicrographs under crossed polarizer for these four NaCMC aqueous disperse systems are shown in Fig. 4. Nonsubstituted cellulose is detected as anisotropic rodlike dispersing par- ticles. Content of the anisotropic particles de- creases with increasing DS of the NaCMC. Al- though there are slight anisotropic residues, the system CM18 can be regarded as the isotropic solution, as can be expected from the viscoelas- tic behavior. In the system CM13, the content of the anisotropic particles is extremely large,
394 POLYMER ENGlNEERlNG AND SCIENCE, March, 1988, V d . 28, No. 6

Influence of Added Salt on Dynamic Viscoelasticity of Carboxymethylcellulose Aqueous Systems
d 1 2 -
. 1.0 U Q8-
- 0.6
13
n
n, 0
04-
1.4 f 1
-
- 0 > 1.0
0.8-1.0 I I I I I I I
5.0 52 54 56 5s 60 62 log Mw (a 1
1.4 I 1
0.8- 1.0 1 I I I I
26 28 30 32 34 36 l og Pw (b)
Fig. 2. Logarithmic plots of the limiting ulscoslty number 1111 against the weight-average molecular weight M , (a) and the weight-auerage degree of polymerizatlon P , (b).
so that G’ and G” of CM13 in the rubbery plateau region seem to be higher than those of other systems as shown in the previous figure.
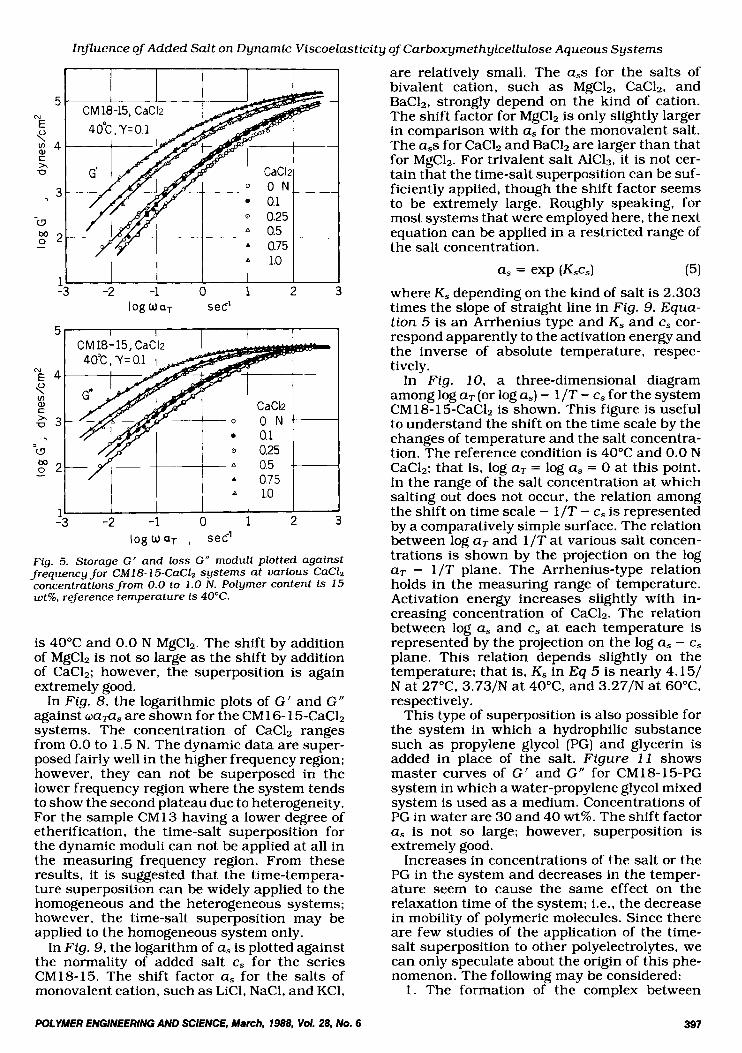
The influence of added salt on the dynamic viscoelasticity was investigated for CM 13, CM16, and especially CM18. In Fig. 5, fre- quency dependencies of G and G ” are shown for the 15 wt% aqueous systems of CM18 (CM 18- 15) at various CaC12 concentrations from 0 to 1.0 N. NaCMC was dispersed in the pre- pared aqueous solution of CaC12, and the con- centration in normality of CaC1, is for water as the medium. The curves in Fig. 5 are master curves obtained by time-temperature superpo- sition. The reference temperature is 40°C. G’ and G” increase or shift to the low frequency region with increasing concentration of CaC12. In the concentrations of CaC12 more than 1 .O N,
POLYMER ENGINEERING AND SCIENCE, March, 1988, Vol. 28, No. 6
G and G ” decrease again because of salting out of polymer.
The curves of G and G” shown in Fig. 5 can be superposed on each other by horizontal shift only into smooth curves, respectively. To do this superposition, the curve for higher concentra- tions of salt must be shifted to a higher fre- quency region. Master curves for G’ and G“ that were superposed by this method (called time-salt superposition) are shown in Fig. 6. The reference condition is 40°C and 0.0 N CaC12. The horizontal axis is plotted as log @a+,, where a, is the shift factor in each salt concen- tration to zero normality. The superposition of data in different concentrations of the salt is extremely fine. It should be noted, however. that the superposition can not be applied for the data of the higher salt concentration at which the effect of salting out is predominant (e.g., more than 1 .O N CaC12). The range of the salt concen- tration in which the time-salt superposition can be applied with high accuracy is relatively wide (e.g., from 0 to 1.0 N for CaCl,], though it de- pends on the kind of salt as described later. The shift factor as reaches nearly 42 for the system of 1.0 N CaC12, which is larger than the shift factor aT (nearly 13) of 27°C to 60°C for the same system.
The time-salt superposition can be also al- lowed by other salts. Master curves of G’ and G” for CM18-15 with added MgC12 of 0.0 to 3.0 N are shown in Fig. 7. The reference condition
I I I I
I I I I I -3 -2 -1 log W a T 0 , see’ 1 2
I I I I I
I I I I
-2 -1 0 1 2 3
Fig. 3. Storage G ‘ and loss of G“ moduli plotted against frequency for four NaCMC aqueous disperse systems.
2’ -3
Log w.aT , see’
395

CM16
Takayoshi Matsumoto and Kimio Mashiko
CM18 - 200 p
Fig. 4. Photomicrographs under crossed polarizer for four NaCMC aqueous disperse systems. Polymer content is 15 wt%.
396 POLYMER ENGINEERING AND SCIENCE, March, 1988, Vol. 28, No. 6
Influence of Added Salt on Dynamic Viscoelasticity of Carboxymethylcellulose Aqueous Systems
5 - cu E \" 2 4 -
, 3 -
c x U
a
- E 2 -
I -3 -2 -1 0 1 2 3 I1
logwaT sec'
Fig. 5. Storage G' and loss G" moduli plotted against frequency for CMl8-1 5-CaC12 systems at various CaCl, concentrations from 0.0 to 1.0 N. Polymer content is 15 wt%, reference temperature is 40°C.
is 40°C and 0.0 N MgCl,. The shift by addition of MgC12 is not so large as the shift by addition of CaC12; however, the superposition is again extremely good.
In Fig. 8, the logarithmic plots of G ' and G" against wa+, are shown for the CM 16- 15-CaCl, systems. The concentration of CaC1, ranges from 0.0 to 1.5 N. The dynamic data are super- posed fairly well in the higher frequency region; however, they can not be superposed in the lower frequency region where the system tends to show the second plateau due to heterogeneity. For the sample CM 13 having a lower degree of etherification, the time-salt superposition for the dynamic moduli can not be applied at all in the measuring frequency region. From these results, it is suggested that the time-tempera- ture superposition can be widely applied to the homogeneous and the heterogeneous systems; however, the time-salt superposition may be applied to the homogeneous system only.
In Fig. 9, the logarithm of a, is plotted against the normality of added salt c, for the series CM18-15. The shift factor a, for the salts of monovalent cation, such as LiC1, NaCl, and KCl,
are relatively small. The ass for the salts of bivalent cation, such as MgCl,, CaC12, and BaC12, strongly depend on the kind of cation. The shift factor for MgC12 is only slightly larger in comparison with a, for the monovalent salt. The ass for CaCl, and BaC12 are larger than that for MgC12. For trivalent salt A1C13, it is not cer- tain that the time-salt superposition can be suf- ficiently applied, though the shift factor seems to be extremely large. Roughly speaking, for most systems that were employed here, the next equation can be applied in a restricted range of the salt concentration.
as = exp ( K 4 (51 where K , depending on the kind of salt is 2.303 times the slope of straight line in Fig. 9. Equa- t ion 5 is an Arrhenius type and K, and c, cor- respond apparently to the activation energy and the inverse of absolute temperature, respec- tively.
In Fig. 10. a three-dimensional diagram among log aT (or log a,) - l /T - cs for the system CM18-15-CaC12 is shown. This figure is useful to understand the shift on the time scale by the changes of temperature and the salt concentra- tion. The reference condition is 40°C and 0.0 N CaC12; that is. log aT = log a, = 0 at this point. In the range of the salt concentration at which salting out does not occur, the relation among the shift on time scale - 1/T - c, is represented by a comparatively simple surface. The relation between log aT and 1/T at various salt concen- trations is shown by the projection on the log aT - 1/T plane. The Arrhenius-type relation holds in the measuring range of temperature. Activation energy increases slightly with in- creasing concentration of CaC1,. The relation between log a, and c, at each temperature is represented by the projection on the log a, - c, plane. This relation depends slightly on the temperature; that is, K, in Eq 5 is nearly 4.151 N at 27"C, 3.73/N at 40"C, and 3.27," at 60°C respectively.
This type of superposition is also possible for the system in which a hydrophilic substance such as propylene glycol (PG) and glycerin is added in place of the salt. Figure 11 shows master curves of G' and G" for CM18-15-PG system in which a water-propylene glycol mixed system is used as a medium. Concentrations of PG in water are 30 and 40 wt%. The shift factor a, is not so large; however, superposition is extremely good.
Increases in concentrations of the salt or the PG in the system and decreases in the temper- ature seem to cause the same effect on the relaxation time of the system: i.e., the decrease in mobility of polymeric molecules. Since there are few studies of the application of the time- salt superposition to other polyelectrolytes, we can only speculate about the origin of this phe- nomenon. The following may be considered:
1. The formation of the complex between
POLYMER ENGINEERING A N D SCIENCE, March, 1988, Vol. 28, N o . 6 397

Takayoshi Matsurnoto and Kirnio Mashiko
6
5
4
3
2
1 -
CM 18-15, CaC12
4OoC, Y =0.1
I I CaCk
0 O N 0 0.1 0 0.25 A 0.5 A 0.75
1.0 A
-2 -1 0 1 2 IogwaTas , sec-’
3 4
Fig. 6. Master curves of G‘ and G” for CMI8-1 5-CaC12 system. Polymer content is 15 wt%. reference condition is 40°C. 0.0 N CaC12.
398 POLYMER ENGlNEECllNG AND SCIENCE, March, 1988, V d . 28, No. 6

Influence of Added Salt on Dynamic Viscoelasticity of Carboxymethylcellulose Aqueous Systems
5
4
3
2
CM 18 -15, MgC12
-1tr t 'I I
I MgCI; O N 0.2 0.4 1.0 2 .o 3.0
1 -3 -2 -1 0 1 2 3
I o g w a T a S J see1 Fig. 7 . Master curves of G' and G" for CM18-15-MgC12 system. Reference condition is 40°C. 0.0 N MgC12.
4
POLYMER ENGINEERING AND SCIENCE, March, 1988, Vol. 28, No. 6 399

Takayoshi Matsurnoto and Kimio Mashiko
1 1 -1 0 1
CaCk 0 O N . 0.2 0 0.5 A 0.75 A 1.0
15) 2 3
l o g w a s se? Fig. 8. applicatlon of the time-salt superposition f o r CMl6-1 5-CaC12 system.
6
0 c Q
4 ’
MI 0 -
3
2 4
POLYMER €NGlN€€RM AND SCIENCE, March, 1988, V d . 28, No. 6

Influence of Added Salt on Dynamic Viscoelasticity of Carboxymethylcellulose Aqueous Systems
added ions and functional groups on polymer chains. The complex works as intra- and in- termolecular cross-linked points. 2. The restriction on molecular mobility by the hydration of counter ions accompanying the polymer chains. 3. The decrease in molecular mobility caused by the dehydration of the polymer molecule
CM 18-15 40°C ,Y =0.1
"0 1.0 2.0 3.0 cs 2 N
Fig. 9. Logarithm of the shift factor In the time-salt su- perposition plotted against the salt concentration c, for various salt systems 6f CMl8-15.
itself by addition of salts or hydrophilic sub- stances. If the effect due to the formation of the com-
plex is a dominant factor, the number of the intermolecular ionic cross-linked points in the system will increase. Since this may lead to the rise in the modulus in the rubbery plateau, the
Fig. 10. Three-dimensional diagram among log aT (or log aJ - 1 /T - cs for the system C M l 8 - I 5-CaC12.
Fig. 1 1 . Master curves of G' and G" for CMl8-15-PG system. Reference condition is 4 0 T , 0% PG.
POLYMER ENGINE€RlNG AND SCIENCE, March, 1988, V d . 28, No. 6 401

Takayoshi Matsurnoto and Kimio Mashiko
time-salt superposition by the horizontal shift only cannot be applied. If intramolecular cross- linking by intramolecular complex formation is dominant, on the other hand, the mobility of polymer molecules may be somewhat restricted. In such a case, however, it is doubtful if the shapes of the frequency dependence curves of viscoelastic functions are independent of the complex formation. To discuss the appropriate- ness of 2. and 3., it will be necessary to have more information on the hydration of salts and polymer molecules.
REFERENCES 1. K. Watanabe and M. Nakamura, Kogyo Kagaku Zas-
s h f , 69. 85 (1966).
2.
3.
4.
5. 6.
7.
8.
9. 10.
11.
12.
E. Rinde and J. M. Pereiia, Makrornol. Chern.. 175, 2923 (1 974). S. Kuroiwa and M. Nakamura, Kobunshi Kagaku, 22. 9, 394 (1965). T. Amarl and M. Nakamura. Kogyo Kagaku Zasshf , 73,781 (1970). J. H. Elliot and A. J. Ganz, Rheol. Acta. 13,670 (1974). D. A. Rees, Adv. Carbohyd. Chern. Bfochern., 24, 267 (1 969). K. Mashiko and T. Matsumoto. NIHON REOROJI GAK- KAISHI, 14, 93 (1986). W. Brown, D. Henley. and J. Ohman. Makrornol. Chern., 62, 164 (1963). H. Fujitaand T. Homma. J. Polyrn. Scf . . 15.277 (1955). I. Kagawa and M. Fukuda, Kogyo Kagaku Zasshi, 54, 97 (1951). S. Onogi, T. Masuda. and T. Matsumoto. Trans. SOC. Rheol. 14,275 (1970). T. Matsumoto, S. . Yao, and S . Onogi, J. Rheol., 29, 177 (1 985).
402 POLYMER ENGlNEERlNG AND SCIENCE, March, 1988, Val. 28, No. 6