Embed Size (px)
Citation preview
1
Influence of acidification on dough viscoelasticity of gluten-free rice starch-based 1
dough matrices enriched with exogenous proteins 2
3
Felicidad Ronda1*
, Marina Villanueva1, Concha Collar
2
4
5
(1) Department of Agriculture and Forestry Engineering, Food Technology, College of 6
Agricultural and Forestry Engineering, University of Valladolid, Av. Madrid, 44, 34004 7
Palencia, Spain. 8
(2) Cereal Group, Food Science Department, Instituto de Agroquímica y Tecnología de 9
Alimentos, IATA-CSIC, Avda. Catedrático Agustín Escardino 7, 46980 Paterna, Spain. 10
11
*Corresponding author: Felicidad Ronda. College of Agricultural and Forestry 12
Engineering, University of Valladolid, Av. Madrid, 44, 34004 Palencia, Spain. Tel: 13
+34979108339; Fax: +34 979108200. E-mail: [email protected] 14
15
*ManuscriptClick here to view linked References
2
Abstract 16
The impact of acid incorporation (acetic+lactic, 0.5%) into rice starch-based doughs 17
enriched with different proteins (egg albumin, calcium caseinate, pea protein and soy 18
protein isolates) at different doses (0, 5 and 10%) has been investigated on dough 19
viscoelastic and pasting profiles. Oscillatory (stress and frequency sweeps) and creep-20
recovery tests were used to characterise the fundamental viscoelastic behaviour of the 21
doughs, and thermomechanical assays were performed to assess dough viscometric 22
performance. Supplementation of gluten-free doughs with proteins from vegetal sources 23
led to more structured dough matrices (higher viscoelastic moduli and steady 24
viscosities, and lower tan , instantaneous and retarded elastic compliances) effect being 25
magnified with protein dose. Acid addition decreased these effects. Incorporation of 26
proteins from animal source resulted in different viscoelastic behaviours according to 27
the protein type, dosage and acidification, especially for casein. Acidification conferred 28
lower dough deformation and notably higher steady viscosity and viscoelastic moduli 29
for 5 %-casein-added dough. Protein-acid interaction favoured higher viscosity profiles, 30
particularly for doughs with proteins of vegetable origin and lower dosage. Dough 31
acidification decreased the pasting temperatures and the amylose retrogradation. 32
Acidification of protein-enriched rice-starch doughs allowed manipulation of its 33
viscometric and rheological properties which is of relevant importance in gluten-free 34
bread development. 35
36
37
38
Keywords: Acetic acid; Gluten-Free Doughs; Lactic acid; Proteins; Rheology 39
40

3
Abbreviations: 41
a: Exponent from fitting power law to G’ data 42
b: Exponent from fitting power law to G’’ data 43
BD: Breakdown viscosity 44
c: Exponent from fitting power law to tan data 45
FV: Final Viscosity 46
'
1G : Elastic modulus at a frequency of 1 Hz obtained from fitting power law to G’ data 47
''
1G :Viscous modulus at a frequency of 1 Hz obtained from fitting power law to G’’ data 48
J0c: Instantaneous compliance obtained from creep test 49
J0r: Instantaneous compliance obtained from recovery phase 50
J1c: Retarded compliance obtained from creep test 51
J1r: Retarded compliance obtained from the recovery phase. 52
LVR: Linear Viscoelastic Region 53
1c: Retardation time in the creep phase 54
1r: Retardation time in the recovery phase 55
0: Steady state viscosity 56
PV: Peak Viscosity 57
PT: Pasting Temperature 58
SB: Setback 59
(tan )1: Loss tangent at a frequency of 1 Hz obtained from fitting power low to tan 60
data 61
TV: Through Viscosity 62
: Oscillation Frequency 63
64
65

4
1. Introduction 66
Gluten-free (GF) products are a growing sector in the food industry, and the related 67
research constitutes a prioritised and challenging topic in cereal-based goods area. The 68
unequivocal need for The development of new GF products is emerging not only 69
because daily dietary requirements for essential nutrients of celiac disease patients are 70
not fully covered at present by existing products (Mandala and & Kapsokefalou, 2011). 71
The target group of GF products is currently expanding to adhere join, in addition to 72
celiac patients (1-3% of the population), people looking for nonallergenic ingredients, 73
leading to a new market that needs a variety of products. Also, GF products can 74
function as prototypes/templates for the development of other products addressed to 75
specific vulnerable groups of population with special nutritional needs (e.g., diabetics). 76
GF product approaches include: (1) reformulations (e.g., high-fiber gluten-free versions 77
of traditional antecedents), (2) new forms of existing products (e.g., frozen and part-78
baked), (3) repackaging of existing products, and (4) innovative products (e.g., use of 79
novel cereals) (Kelly, Moore, Elke, & Arendt et al., 2008). Concerning the first 80
approach, complex formulations that appear promising in terms of technological 81
improvement and nutritional quality have been developed so far, with variable 82
success/failure regarding sensory appreciation and technological constraints. The 83
formulations mainly involve the incorporation of starches of different origin, other non-84
gluten proteins such as dairy proteins, gums, and their combinations (Mariotti, 85
Lucisano, Pagani, & Ng et al., 2009). These ingredients can mimic the viscoelastic 86
properties of gluten and may result in improved structure, mouthfeel, acceptability, and 87
shelf life of these products (Gallagher, Gonnley, & Arendt et al.,, 2004). 88
Rice flour is considered one of the most suitable cereal flour for preparing gluten-free 89
products associated to its several significant properties such as natural, hypoallergenic, 90
colorless, and bland taste. It has also very low level of protein, sodium, fat, fiber and 91
high amount of easily digested carbohydrates. Since most of the rice contain relatively 92
small amount of prolamin (2.5–3.5%) (Gujral and & Rosell, 2004), it is necessary to use 93
some sort of gum, emulsifier, enzymes or dairy products together with rice flour for 94
achieving desired viscoelastic mixture (Demirkesen, Mert, Sumnu, & Sahin et al.,, 95
2010). Gum type additives, such as hydroxyl propyl methyl cellulose (HPMC) 96
(Sivaramakrishnan, Senge, & Chattopadhyay et al.,, 2004) and the enzyme glucose 97
oxidase (Gujral and & Rosell, 2004) resulted in successful formation of rice bread 98
Formatted: Strikethrough

5
showing the optimum volume expansion and a general improvement of bread quality, 99
respectively (Nikolić, Dodić, Mitrović, & Lazić, et al., 2011). Proteins from different 100
sources can be added to increase both nutritional and functional values of GF products. 101
Protein incorporation leads to the formation of a continuous protein phase (Moore, 102
Tilman, Dockery, & Arendt et al., 2004), and are added to GF applications (Crockett, Ie, 103
& Vodovotz et al., 2011) to increase elastic modulus by cross linking, to improve 104
perceived quality by enhancing Maillard browning and flavour, to improve structure 105
with gelation and to aid in foaming (Moore, Dal Bello, & Arendt et al., 2008). These 106
result in bread with increased loaf volume, improved crumb regularity and improved 107
sensory characteristics (Moore et al., 2008). The use of dairy powder in gluten-free 108
baked product formulations has resulted in improved volume as well as better 109
appearance and sensory aspects of the loaves (Gallagher et al., 2004). Soy protein 110
isolate and dried egg white solids were investigated due to their foam-stabilizing 111
activity and use in GF applications (Marco and & Rosell, 2008; Moore et al., 2004). 112
According to Stathopoulos (2008), the most used ingredients in gluten-free baked 113
product formulations are caseinates, skim milk powder, dry milk, whey protein 114
concentrate and milk protein isolate. It follows that the selection of the proteins used in 115
a gluten-free formulation is a critical issue (Mandala and & Kapsokefalou, 2011). 116
Soybean protein isolates increases the nutritional value of rice cassava bread and 117
increases elastic modulus, resulting in enhanced gas retention and loaf volume, and 118
improves water binding in the bread loaves. Other authors stated that the addition of 119
soybean protein isolate to an HPMC-treated rice cassava bread reduced dough stability 120
by suppressing HPMC functionality, altering water distribution within the dough, 121
weakening HPMC interactions with the starch matrix and reducing foam stability 122
(Crockett et al., 2011). Green pea protein has been used in less extent than the soybean 123
protein in GF breads evidencing also an increase in the elastic modulus (Marco and & 124
Rosell, 2008). Acetic and lactic acids confer suitable properties to final breads in terms 125
of odour and taste either when produced by the exogenous microflora or added to 126
breadmaking matrices, increasing in addition protease and amylase activities that lead to 127
a retarded staling during storage (Moore et al., 2008). 128
The combined effect of acid addition and protein supplementation in GF matrices has 129
not been described so far despite inter ande intra-molecular interactions established 130
between exogenous proteins and starch molecules that are the main responsible for 131
dough structurization, certainly depend on dough pH. In addition, despite several 132

6
rheological techniques, including oscillation, stress relaxation, creep and creep-recovery 133
measurements have been used extensively for assessing fundamental mechanical 134
properties of gluten, the use of dynamic rheometry in studies of GF-dough rheological 135
behavior has only been applied over the last decade (Lazaridou, Duta, Papageorgiou, 136
Belc, & Biliaderis et al., 2007; Ronda, Pérez-Quirce, Angioloni, & Collar et al., 2013). 137
Fundamental and empirical rheological properties of doughs inform about interactions 138
among ingredients and the creation of structure at macromolecular and macroscopic 139
levels, respectively. In addition, quality attributes of breads such as volume and texture 140
can be correlated with dough rheological properties (Sahin, 2008; Pérez-Quirce, Collar, 141
& Ronda, 2014). 142
This paper is intended to know the impact of acid incorporation (acetic:lactic, 0.1:0.4 %, 143
w:wg/100 g starch+protein basis) into GF rice starch-based dough matrices enriched 144
with different proteins (egg albumin, calcium caseinate, pea protein and soy protein 145
isolates) at different doses on dough viscoelastic, and pasting profiles, prior to assess 146
comparatively the structure promoting ability in GF matrices of exogenous proteins in 147
absence/presence of acid. 148
149
2. Material and methods 150
2.1. Materials 151
Rice starch (9.9 % moisture, 0.2 % ash and 0.5 % protein) from Ferrer Alimentación 152
S.A. (Barcelona, Spain), and salt, sugar (Azucarera Ebro, Spain) and sunflower oil 153
(branded Coosur Premium) purchased from the local market, were used to make gluten-154
free doughs. Hydroxypropylmethylcellulose (HPMC, Methocel K4M Food Grade) was 155
provided by Dow Chemical (Midland, EEUU). Proteins used in gluten-free 156
formulations were: soybean isolate Supro 500-E IP from Proveedora hispano-holandesa 157
S.A. (Barcelona, Spain), calcium caseinate from Armor proteines (Saint-Brice-en-158
Coglès, France), egg albumin in dry powder from Eurovo (Valladolid, Spain) and pea 159
protein isolate branded Pisane C9, from Cosucra (Warcoing, Belgium). Acetic acid and 160
lactic acid (analytical grade; Panreac, Barcelona) were used as a source of hydrogen 161
ions. 162
163
2.2. Methods 164

7
2.2.1. Dough preparation 165
A straight dough process was performed using the following formula on a 100 g rice 166
starch (or rice starch+protein) basis: 6 g/100 g% oil, 5 % g sucrose, 1.5 % g salt, 2 % g 167
HPMC and 80 % g water. All proteins were added at 0 %, , 5 % and 10 % g/100 gw/w 168
(starch+protein basis) levels. Doughs were supplemented with (0.1 % g/100 g + 0.4) % 169
g/100 g (w/w starch+protein basis) of acetic and lactic acid, respectively, when acid-170
treatment was applied. The experimental design is shown in Table 1. GF dough-making 171
was achieved by blending first solid ingredients and oil in a kitchen-aid professional 172
mixer (KPM5). Then water was added and hand mixed. Finally the dough was mixed 173
with dough hook at a speed 4 for 8 min. Acid blend, when added, was diluted in a small 174
part of water (7 % of total) and adjusted to the dough before the mixer was powered on. 175
176
2.3 Dough measurements 177
Oscillatory and creep recovery tests 178
Oscillatory and creep-recovery tests were carried out with a RheoStress 1 rheometer 179
(Thermo Haake, Karlsruhe, Germany) with parallel plate geometry (60 mm diameter) of 180
serrated surface and with 3 mm gap. The excess of batter was removed and vaseline oil 181
was applied to cover the exposed sample surfaces. Before the measurement, the batter 182
was rested for 10 min to allow relaxation. Frequency sweeps were carried out from 20 183
to 0.1 Hz in the linear viscoelastic region (LVR) previously established for each batter 184
by means of stress sweeps from 0.1 to 1000 Pa at 1 Hz. The frequency sweeps of all 185
batters were carried out at stress values between 2 Pa and 10 Pa. Temperature was 25 186
ºC. Frequency sweep data were fitted to the power law model as in previous works 187
(Ronda et al., 2013): 188
aGG '
1
' )( ; bGG ''
1
'' )( ; cab
G
G
G
G
1
)(
1
)(tan'
''
)('
)('')(tan 189

8
The coefficients '
1G , ''
1G , and (tan )1, represent the elastic and viscous moduli and the 190
loss tangent at a frequency of 1 Hz. The a, b and c exponents quantify the dependence 191
degree of dynamic moduli and the loss tangent with the oscillation frequency, . Creep 192
tests were performed by imposing a sudden step shear stress in the LVR for 150 s. In 193
the recovery phase the stress was suddenly removed and the sample was allowed for 194
300 s to recover the elastic (instantaneous and retarded) part of the deformation. Each 195
test was performed in triplicate. The data from creep tests were modelled to the 4-196
parameter Burgers model (Lazaridou et al., 2007) given by: 197
01
10 exp1)(
ttJJtJ
c
ccc
198
In the equation, Jc (t) is the creep compliance (strain divided by stress), J0c is the 199
instantaneous compliance, J1c is the retarded elastic compliance or viscoelastic 200
compliances, 1c is the retardation time and 0 gives information about the steady state 201
viscosity. Similar equations were used for the recovery compliance Jr(t). As there is no 202
viscous flow in the recovery phase, equations consist only of parameters describing the 203
elastic response after removal of the shear stress. The data from creep tests were 204
modelled to the 3-parameter Burgers model given by: 205
r
rrr
tJJJtJ
1
10max exp1)(
206
Jmax is the maximum creep compliance obtained at the end of the creep step. 207
Thermoviscous test: Viscometric profile 208
Viscometric profiles (gelatinization, pasting, and setback properties) of formulated 209
starch rice doughs were obtained with a Rapid Visco Analyser (RVA-4, Newport 210
Scientific, Warriewood, Australia) using ICC Standard 162. Freeze-dried hydrated 211
samples (3.5 g, 14 % moisture basis) were transferred into canisters and ≈25 ± 0.1 mL 212

9
of distilled water were added and processed following standard method. The pasting 213
temperature (PT), peak time (when peak viscosity occurred) (VT), peak viscosity (PV), 214
holding strength or trough viscosity (TV), breakdown (BD), final viscosity (FV) and 215
setback (final viscosity minus peak viscosity) (SB) were calculated from the pasting 216
curve (Collar, 2003) using Thermocline v. 2.2 software. For each viscometric 217
measurement, 3 samples were used. 218
219
2.4. Statistical analysis 220
Statgraphics Centurion v.6 (Bitstream, Cambridge, MN, USA) was used for 221
multivariate non-linear regression and Pearson correlation matrix. STATISTICA 222
package (Tulsa, OK, EEUU) v.6, allowed performance of MANOVA analysis, and LSD 223
(Least Significant Difference) test was used to evaluate significant differences (p<0.05) 224
between samples. 225
226
3. Results and discussion 227
Table 2 and 3 show the single and 2nd order interactive effects of protein and acid 228
addition on pH and rheological and pasting properties of GF doughs. Protein presence 229
increased the dough pH between 7 % and 12 % with respect to the control dough, 230
depending on the dose. The lower increase was obtained with albumin. The acidification 231
of protein-enriched doughs resulted in pH values 15 % – 34 % higher than the acid-232
added control dough. 233
3.1. Fundamental rheology 234
3.1.1. Dynamic oscillatory rheology 235
10
Protein–enriched rice starch-based doughs were submitted to both stress and frequency 236
sweeps in the linear visco-elastic region (LVR), which oscillatory rheological behaviour 237
for selected samples is illustrated in Figures 1.a. and 1.b., respectively. Stress sweep 238
tests allowed to know the maximum stress (τmax) that GF matrices can tolerate in the 239
LVR -from 6 to 108 Pa- providing structure preservation. Lower τmax values 240
corresponded to control samples without protein addition and to albumin-enriched 241
samples regardless either acid or protein level addition, whereas higher τmax were 242
obtained for no acid/10 g/100 g% pea protein or 10 g/100 g% soya protein enrichment 243
and for acid/10 g/100 g% casein incorporation. Except for the egg albumin, the presence 244
of protein encompassed a significant (p<0.01) increase in τmax values as a result of 245
dough structurization. Increased dosage from 5 to 10 g/100 g% promoted τmax for 246
doughs enriched with vegetal proteins (+63 % soya, +89 % pea), whereas only acidified 247
matrices containing casein underwent a relevant structure promotion with protein dose 248
(+160 %). For vegetal proteins, dough acidification led to a weakening effect regardless 249
the dose, and consequently to a decrease in τmax, more prominent in pea enriched 250
samples (-54 %) than in soya samples (-37 %). Samples supplemented with casein 251
proteins observed a strengthening effect in acid medium when added at 10 g/100 g% 252
(+37 %), but underwent weakening impact with acid addition when added at 5 g/100 253
g% to the doughs (-47 %). 254
Frequency sweep tests of unacidified and acidified 5 g/100 g% casein added dough 255
matrices are illustrated in Figure 1.b. Visco-elastic behaviour of dough samples 256
corresponded with no exception to solid-like samples with storage modulus values (G’1) 257
higher (from 2568 to 70665 Pa) than loss modulus values (G’’1) (from 477 to 10465 258
Pa), slight frequency dependence, and values for tan δ (G’’/G’) under 1, in good 259
accordance with earlier results found for rice doughs enriched with protein isolates 260

11
(Gujral and & Rosell, 2004). In this work, protein addition affected dough 261
viscoelasticity, the extent of the changes being dependent on the type and the dose of 262
protein and on the absence/presence of acid (Table 2), and on the interactive effects of 263
protein x acid (Table 3). Interactions between starch and proteins depend upon the 264
molecular structure of protein, the starch: state of the granules and the 265
amylose/amylopectin ratio, the composition of protein and starch, as well as the phase 266
transition temperatures of starch gelatinization and protein denaturation. There is also an 267
electrostatic association between the two polymers. Anionic polysaccharide and protein 268
are incompatible at pH values above the protein's isoelectric point (point of minimum 269
solubility, pH ~ 5.1) and completely compatible below it due to the net opposite charges 270
they carry (Rao, 2007). Factors affecting protein-polysaccharide compatibility and the 271
characteristics of their complexes include the molecular characteristics of the two 272
molecules (e.g., molecular weight, net charge, and chain flexibility), the pH, ionic 273
strength, temperature, the protein/polysaccharide ratio, rate of acidification, and rate of 274
shear during acidification (Rao, 2007). Vegetal proteins significantly increased (p<0.01) 275
both the elastic and viscous components in doughs (Table 2), increments being larger in 276
soya protein samples (+143 % G’, +94 % G’’) than in pea protein matrices (+109 % G’, 277
+78 % G’’) by increasing the dose from 5 to 10 g/100 g%, starch-protein basis. Acid 278
addition modulated dough viscoelasticity in soya protein matrices at higher dose, so that 279
a weakening effect denoted by a significant drop in G’ (-61 %) and G’’ (-40 %) with a 280
concomitant increase in tan (+52 %) was observed (Table 3). Animal proteins 281
significantly modified mechanical spectra of protein-enriched matrices depending on 282
the type of protein, when compared to both unacidified and acidified control doughs. 283
Casein addition observed a dependence on the frequency for both dynamic moduli 284
(Figure 1.b), a higher consistency than the control and albumin enriched samples, but a 285

12
lower predominance of G’1 over G’’1, (higher tan values) compatible with a more 286
viscous nature (Table 2). The acidification of casein supplemented samples increased G’ 287
(+52 %) when added at 5 g/100 g% and decreased G’’ depending on the dose of 288
addition (-34 % at 5 g/100 g%, -25 % at 10 g/100 g%) (Table 3). Doughs enriched with 289
albumin exhibited a different behaviour with lower mechanical spectra profiles than 290
unsupplemented protein-samples, regardless the dose of addition and the 291
absence/presence of acid (Table 2 and Table 3). Slight dependence of the moduli on 292
angular frequency (a and b values ranged 0.11-0.28) and values of phase shift tangent 293
(tan ) varying in the range 0.1 < tan < 0.4 are both characteristic features for the 294
systems which so called weak gels (elastic behaviour). This is in agreement with earlier 295
observations regarding viscoelastic properties of GF dough (Witczak, Korus, Ziobro, & 296
Juszczak et al., 2010). Significant variation in dough viscoelastic moduli was also 297
observed by Nunes, Ryan, and Arendt et al. (2009) who supplemented GF bakery 298
products with milk and whey proteins. In the case of albumin a significant decrease of 299
G’ and G’’ was accompanied with a slight, but statistically significant increase of phase 300
shift tangent when added at 5 g/100 g%. All other protein preparations caused 301
significant increase of moduli G’ and G’’ (Table 2). Although the addition of pea 302
protein resulted in a significant growth of G’ and G’’, it caused only a slight shift of 303
phase shift tangent in the range of low frequencies, in accordance with previous reports 304
(Ziobro, Witczak, Juszczak, & Korusa et al., 2013). In oscillatory studies, Crockett et al. 305
(2011) observed an increase of storage modulus accompanied by the drop in phase shift 306
tangent of the dough supplemented with soy protein isolate, which was potentially due 307
to protein aggregation within the medium. The application of casein significantly 308
modified rheological image of dough structure, shifting its properties toward values 309
typical for strong gels, probably caused by its special arrangement, in which regularly 310

13
occurring amino acid sequence favoured the formation of tight polypeptide-strands 311
stabilized by covalent and hydrogen bonds, as described for collagen (Gómez-Guillén, 312
Giménez, López-Caballero, & Montero et al., 2011). Current results in agreement with 313
previous studies (Crockett et al., 2011; Ziobro et al., 2013) are compatible with the 314
creation of a robust crosslinked structure by added proteins, especially supported in the 315
case of soya protein by glicinin and a high water retention ability (Crockett et al., 2011). 316
In studies using acid in rice flour based doughs, chemical acidification encompassed a 317
dough softening effect highly dependent on both the final dough pH and the type of acid 318
(Blanco, Ronda, Pérez, & Pando et al., 2011). Some authors have reported an increase 319
in wheat flour dough stiffness (viscosity or complex shear modulus) with decreasing pH 320
in the range 6-5.6 to 4 (Jekle and & Becker, 2012) probably as result of the change in 321
the conformation of the proteins. The decreased pH would lead to the change in the 322
overall net charge from neutral (near the isoelectronic point) to positive. A neutral 323
charge causes less repulsion forces and less space for water molecules between the 324
proteins. This repulsion forces increase with increasing charge and more water 325
molecules can be attached to the protein strands whereby less mobile water is available 326
in the dough system (Jekle and & Becker, 2012). 327
3.1.2. Creep-recovery tests 328
Creep-recovery tests were also conducted on formulated GF doughs. Stress applied in 329
the LVR ranged from 2 Pa to 10 Pa, and were maintained for 150 s, sufficient for the 330
sample to reach the steady-state flow. Creep-recovery curves of GF doughs exhibited a 331
typical viscoelastic behaviour combining both viscous fluid and elastic components 332
(Figure 1.c), similar to the corresponding curves obtained previously for rice flour 333

14
(Sivaramakrishnan et al., 2004) and other gluten-free doughs (Lazaridou et al., 2007; 334
Ronda et al., 2013). 335
Creep parameters for all GF dough formulations are summarized in Table 2. Major 336
impact on creep-recovery parameters was associated to vegetal proteins and albumin 337
incorporation. Increased vegetal protein incorporation led to significantly lower 338
instantaneous (J0) and retarded (J1) elastic compliance in both creep and recovery phases 339
associated to a lower dough deformation submitted to a constant stress, and a higher 340
recovery when stress is removed, respectively. Maximum depletion in compliance 341
values was observed for soya protein enriched matrices at 10 g/100 g% of addition: -70 342
% (J0c), -54 % (J1c), -70 % (J0r), -72 % (J1r). For animal protein supplemented doughs, 343
albumin incorporation notably promoted J values compared to control doughs, increases 344
being magnified with protein dosage; whereas casein inclusion in dough formulation 345
only affected J0c when added at 10 g/100 g%, encompassing a 40 % decrease in values 346
(Table 2). 347
Addition of protein from both animal and vegetal source encompassed higher 348
retardation times in the creep phase (1c) and lower retardation times in the recovery 349
phase (1r), indicating a slower and quicker retarded elastic response, respectively 350
(Table 2). pH decrease as a result of acidification significantly affected major creep-351
recovery parameters (Table 3). In unacidified doughs, J1c values were higher in presence 352
of animal proteins but similar or even 50-60 % lower in presence of vegetal proteins, in 353
accordance with a higher deformation at a constant stress with time for animal proteins 354
encompassing a lower dough consistency. Dough acidification led to a decrease in J1c 355
when albumin or casein was incorporated while for vegetal protein addition, the 356
opposite effect was observed. Protein addition to unacidified matrices significantly 357
increased values of λ1c except for doughs supplemented with 5 g/100 g% pea protein. 358
15
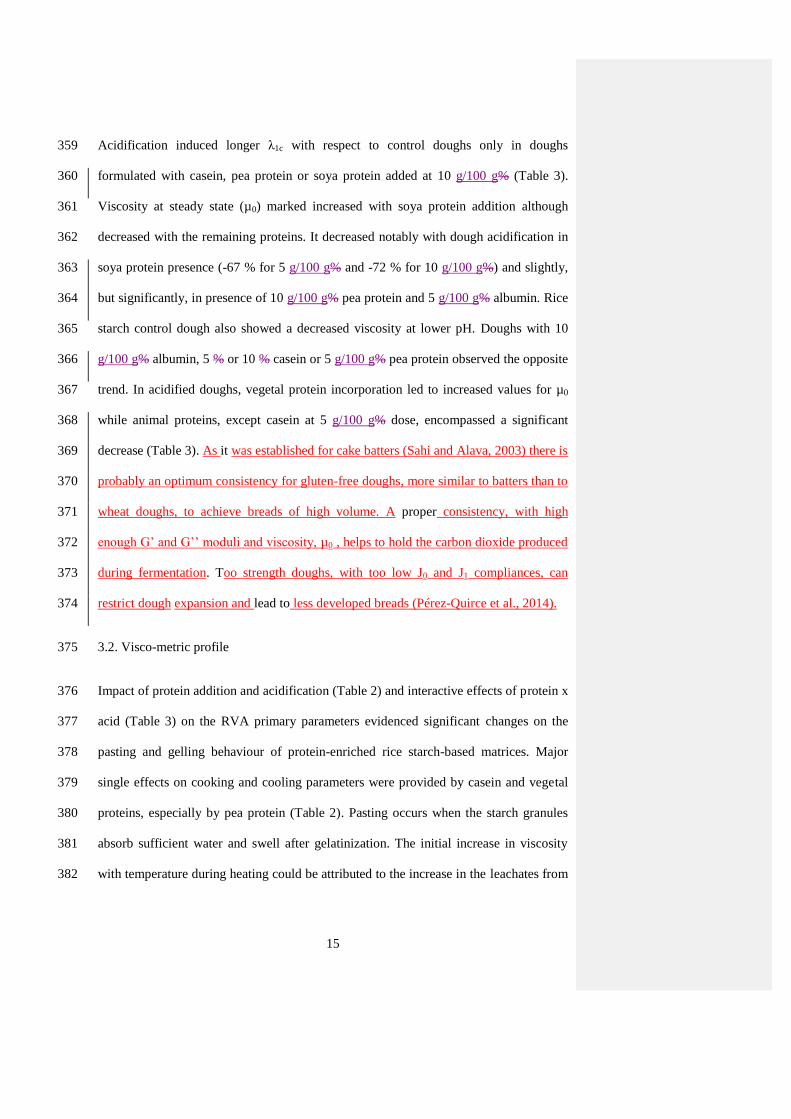
Acidification induced longer λ1c with respect to control doughs only in doughs 359
formulated with casein, pea protein or soya protein added at 10 g/100 g% (Table 3). 360
Viscosity at steady state (µ0) marked increased with soya protein addition although 361
decreased with the remaining proteins. It decreased notably with dough acidification in 362
soya protein presence (-67 % for 5 g/100 g% and -72 % for 10 g/100 g%) and slightly, 363
but significantly, in presence of 10 g/100 g% pea protein and 5 g/100 g% albumin. Rice 364
starch control dough also showed a decreased viscosity at lower pH. Doughs with 10 365
g/100 g% albumin, 5 % or 10 % casein or 5 g/100 g% pea protein observed the opposite 366
trend. In acidified doughs, vegetal protein incorporation led to increased values for µ0 367
while animal proteins, except casein at 5 g/100 g% dose, encompassed a significant 368
decrease (Table 3). As it was established for cake batters (Sahi and Alava, 2003) there is 369
probably an optimum consistency for gluten-free doughs, more similar to batters than to 370
wheat doughs, to achieve breads of high volume. A proper consistency, with high 371
enough G’ and G’’ moduli and viscosity, µ0 , helps to hold the carbon dioxide produced 372
during fermentation. Too strength doughs, with too low J0 and J1 compliances, can 373
restrict dough expansion and lead to less developed breads (Pérez-Quirce et al., 2014). 374
3.2. Visco-metric profile 375
Impact of protein addition and acidification (Table 2) and interactive effects of protein x 376
acid (Table 3) on the RVA primary parameters evidenced significant changes on the 377
pasting and gelling behaviour of protein-enriched rice starch-based matrices. Major 378
single effects on cooking and cooling parameters were provided by casein and vegetal 379
proteins, especially by pea protein (Table 2). Pasting occurs when the starch granules 380
absorb sufficient water and swell after gelatinization. The initial increase in viscosity 381
with temperature during heating could be attributed to the increase in the leachates from 382

16
the starch granules and the formation of a homogeneous mass resulting from the 383
remaining fragile starch granules (Atwell, Hood, Lineback, Marston, & Zobel et al., 384
1988). A sharp decrease in peak viscosity was observed with the addition of casein and 385
vegetal proteins with a concomitant general increase in pasting temperature, with 386
changes being magnified with increased dose of protein (Table 2). The importance of 387
protein in the initialization of pasting (Meadows, 2002) as well as in peak and final 388
viscosity (Fitzgerald, Martin, Ward, Park, & Shead et al., 2003) has been strongly 389
evidenced in rice. In addition, protein-starch linkages established in presence of proteins 390
stabilise starch structure, and hence delayed the gelatinization process (Crockett et al., 391
2011). Lower values for pasting viscosities are an indication of a reduction in starch 392
available for gelatinization. This reduction is likely due to a general reduction in the 393
starch content of the pastes because of replacement with proteins that can additionally 394
retain water from the starch granules. The reduction of available water in the system 395
would reduce initial starch granule swelling and, hence, add to the explanation of lower 396
peak viscosities of the pastes. In addition to the retention of the integrity of the starch 397
granules, it is suggested that a reduction in pasting characteristics may be associated 398
with a reduced enthalpy of starch gelatinization as observed in dietary enriched biscuits 399
(Brennan and & Samyue, 2004). Acidification decreased pasting temperature in protein-400
free and protein-enriched doughs with the exception of both soya and pea proteins 401
added at 10 g/100 g%. Effects of acid incorporation on peak viscosity revealed a 402
decrease in protein-free doughs and an increase in protein enriched doughs with the 403
exception of soya protein, where no significant effects were observed. The viscosity of 404
the paste that had been gelatinized in acetic/lactic acid solution was decreased by 405
shearing thinning effect caused by stirring in the RVA test. Takahashi (1974) mentioned 406
that the part where the molecular associative strength was weak in starch granule 407

17
collapsed and dispersed when gelatinized starch paste was sheared by mechanical 408
power. In the presence of acetic/lactic acid, the structure of the starch became more 409
fragile by stirring, resulting in the decrease of viscosity and the increase of breakdown. 410
It was considered that the residual proteins prevented the increase in viscosity and the 411
collapse of starch granules during heating. Proteins mainly exist among the starch 412
granules as protein bodies. Proteins around starch granules might indirectly disturb the 413
gelatinization of starch (Ohishi, Kasai, Shimada, & Hatae et al., 2007). 414
Upon subsequent cooling, a gel is formed that consists of an amylose matrix in which 415
amylopectin enriched granules are embedded (Miles, Morris, Orford, & Ring et al., 416
1985). Effects of protein supplementation and acidification on the parameters 417
characterizing the gelling process were particularly significant for the final viscosity on 418
cooling (Table 2, Table 3). This parameter sharply decreased in presence of increasing 419
amounts of either vegetal or animal protein except for albumin. Dough acidification 420
promoted the decrease in final viscosity values for unsupplemented and supplemented 421
protein matrices particularly for soya protein, except for casein-enriched samples that 422
underwent an increase (Table 3). In earlier reports, final viscosity of the rice paste with 423
acetic acid was lower than that with distilled water. It was suggested that cooked rice 424
with acetic acid might exhibit less tendency to retrogradation when rice was soaked in 425
acetic acid solution; proteins were eluted from rice grains and degraded by aspartic 426
proteinase and carboxypeptidase (Ohishi et al., 2007). The different nature of added 427
proteins may be responsible for the different behaviour. General results are in 428
accordance with those reported by others for protein isolates (Ribotta and & Rosell, 429
2010) and acetic acid incorporation (Ohishi et al., 2007). 430
3.3. Correlations between fundamental and empirical rheological parameters 431

18
Multivariate data handling of rheological variables supplied useful information on the 432
significantly correlated viscoelastic and viscometric characteristics of GF dough 433
samples. Using Pearson correlation analysis, a range of correlation coefficients (r) (from 434
0.46 to 0.95) was obtained for the relationships between fundamental and empirical 435
properties of protein-free and protein-supplemented rice starch-based matrices 436
with/without acid addition (Table 4). A significant interdependence (0.51<r<0.98) 437
within both rheometer and mimetic measurements was found. This is especially true for 438
parameters retrieved from the same fundamental (oscillatory measurements and creep-439
recovery features) and mimetic (pasting and gelling) tests. Storage and loss moduli, 440
indicators of dough strengthened structure and solid-like behavior, strongly correlated 441
(p<0.001, r=0.81). The loss tangent tan indicating solid-like or liquid like nature, is 442
highly connected to the “a” exponent (p<0.001, r=0.98), indicating a correspondence 443
between less structured doughs with high viscous nature expliciting elastic component 444
G’ more dependent on the frequency. As expected, a strong correlation was found 445
between creep compliance parameters and the recovery phase counterparts (p<0.001), 446
since the creep-recovery tests were carried out in the LVR (data not shown). In addition 447
it was observed that factors increasing viscosity at the steady state (µ0) decreased 448
compliance values J0 (r=-0.56) and J1 (r=-0.66), in good accordance with previous 449
observations (Lazaridou et al., 2007; Ronda et al., 2013), and increased G’1. The larger 450
the maximum stress max providing structure integrity, the greater are the dynamic 451
moduli, the poorer are the instantaneous and retarded compliance, and the lower is the 452
visco-metric profile of the corresponding doughs. 453
4. Conclusions 454

19
A gluten-free formulation based on rice starch can be obtained with a suitable 455
combination of different proteins (egg albumin, calcium caseinate, pea protein and soy 456
protein isolates) and acid. Supplementation of GF doughs with proteins from vegetal 457
sources led to more structured dough matrices (higher viscoelastic moduli and steady 458
viscosities, and lower tan , instantaneous and retarded elastic compliances) effect being 459
magnified with protein dose. Acid addition produced weakening of the structure dough 460
matrices. Acidification of soya-added doughs decreased G’ and G’’ (20–60 % 461
depending on the dose) and the steady viscosity (60-70 %) and increased the loss 462
tangent (up to 50 %) and the elastic compliances, J0c (30 – 120 %) and J1c (30 % - 230 463
%). The effect of acidification on pea protein-enriched doughs was similar although the 464
changes in viscoelastic moduli and loss tangent did not result significant. Incorporation 465
of proteins from animal source resulted in different viscoelastic behaviours according to 466
the protein type, dosage and acidification, especially for casein. Acidification conferred 467
lower dough deformation and notably higher steady viscosity, G’ and G’’ for dough 468
with 5 g/100 g% casein. Protein-acid interaction favoured higher viscosity profiles, 469
particularly for doughs with proteins of vegetable origin and lower dosage. Dough 470
acidification decreased the pasting temperatures and the amylose retrogradation. It can 471
be concluded that acidification of protein-enriched rice-starch doughs allows 472
manipulation of dough rheological properties which is of relevant importance in GF 473
bread development. 474
Acknowledgement 475
Authors gratefully acknowledge the financial support of the Spanish Institutions 476
Ministerio de Economía y Competitividad (Projects AGL2012-35088 and AGL2011-477
22669) and Comunidad de Castilla y León (Project VA252A12-2). 478
479

20
References 480
Atwell, W. A., Hood, L. F., Lineback, D. R., Marston, E. V., & Zobel, H. F. (1988). The 481
terminology and methodology associated with basic starch phenomena. Cereal Foods 482
World, 33, 306-311. 483
Blanco, C. A., Ronda, F., Pérez, B., & Pando, V. (2011). Improving gluten-free bread 484
quality by enrichment with acidic food additives. Food Chemistry, 127, 1204-1209. 485
Brennan, C. S., & Samyue, E. (2004). Evaluation of starch degradation and textural 486
characteristics of dietary fibre enriched biscuits. International Journal of Food 487
Properties, 7, 647-657. 488
Collar, C. (2003). Significance of viscosity profile of pasted and gelled formulated 489
wheat doughs on bread staling. European Food Research and Technology, 216(6), 505-490
513. 491
Crockett, R., Ie, P., & Vodovotz, Y. (2011). Effects of soy protein and egg white solids 492
on the physicochemical properties of gluten-free bread. Food Chemistry, 129, 84-91. 493
Demirkesen, I., Mert, B., Sumnu, G., & Sahin, S. (2010). Rheological properties of 494
gluten-free bread formulations. Journal of Food Engineering, 96, 295-303. 495
Fitzgerald, M. A., Martin, M., Ward, R. M., Park, W. D., & Shead, H. J. (2003). 496
Viscosity of rice flour: A rheological and biological study. Journal of Agricultural and 497
Food Chemistry, 51(8), 2295-2299. 498
Gallagher, E., Gonnley, T. R., & Arendt, E. K. (2004). Recent advances in the 499
formulation of gluten-free cereal-based products. Trends in Food Science & 500
Technology, 15, 143-152. 501
Gómez-Guillén, M., Giménez, B., López-Caballero, M., & Montero, M. (2011). 502
Functional and bioactive properties of collagen and gelatin from alternative sources: a 503
review. Food Hydrocolloids, 25(8), 1813-1827. 504
Gujral, H. S., & Rosell, C. M. (2004). Improvement of the breadmaking quality of rice 505
flour by glucose oxidase. Food Research International, 37, 75-81. 506
Jekle, M., & Becker, T. (2012). Effects of Acidification, Sodium Chloride, and 507
Moisture Levels on Wheat Dough: I. Modeling of Rheological and Microstructural 508
Properties. Food Biophysics, 7, 190-199. 509
Kelly, A. L., Moore, M. M., Elke, K., & Arendt, E. K. (2008). New product 510
development: the case of gluten-free food products. In E. K. Arendt, & F. Dal Bello 511
(Eds.), Gluten-free: cereal products and beverages (pp. 413-431). New York: 512
Academic Press. 513
Lazaridou, A., Duta, D., Papageorgiou, M., Belc, N., & Biliaderis, C. G. (2007). Effects 514
of hydrocolloids on dough rheology and bread quality parameters in gluten-free 515
formulations. Journal of Food Engineering, 79, 1033-1047. 516

21
Mandala, I., & Kapsokefalou, M. (2011). Gluten-Free Bread: Sensory, 517
Physicochemical, and Nutritional Aspects. In V. R. Preedy, R. R. Watson, & V. B. Patel 518
(Eds.), Flour and breads and their fortification in health and disease prevention (pp. 519
161-169). 520
Marco, C., & Rosell, C. M. (2008). Functional and rheological properties of protein 521
enriched gluten free composite flours. Journal of Food Engineering, 88, 94-103. 522
Mariotti, M., Lucisano, M., Pagani, M. A., & Ng, P. K. W. (2009). The role of corn 523
starch, amaranth flour, pea isolate, and Psyllium flour on the rheological properties and 524
the ultraestructure of gluten-free doughs. Food Research International, 42, 963-975. 525
Miles, M. J., Morris, V. J., Orford, P. D., & Ring, S. G. (1985). The roles of amylose 526
and amylopectin in the gelation and retrogradation of starch. Carbohydrate Research, 527
135(2), 271-281. 528
Moore, M., Tilman, T. S., Dockery, P., & Arendt, E. K. (2004). Textural comparisons 529
of gluten-free and wheat-based doughs, batters, and breads. Cereal Chemistry, 81(5), 530
567-575. 531
Moore, M., Dal Bello, F., & Arendt, E. K. (2008). Sourdough fermented by 532
Lactobacillus plantarum FST 1.7 improves the quality and shelf life of gluten-free 533
bread. European Food Research and Technology, 226, 1309-1316. 534
Nikolić, N., Dodić, J., Mitrović, M., & Lazić, M. (2011). Rheological properties and the 535
energetic value of wheat flour substituted by different shares of white and brown rice 536
flour. Chemical Industry and Chemical Engineering Quarterly, 17(3), 349-357. 537
Nunes, M. H. B., Ryan, M. A. L., & Arendt, E. K. (2009). Effect of low lactose dairy 538
powder addition on the properties of gluten-free batters and bread quality. European 539
Food Research and Technology, 229, 31–41. 540
Ohishi, K., Kasai, M., Shimada, A., & Hatae, K. (2007). Effects of acetic acid on the 541
rice gelatinization and pasting properties of rice starch during cooking. Food Research 542
International, 40, 224-231. 543
Pérez-Quirce, S., Collar, C., & Ronda, F., (2014). Significance of healthy viscous 544
dietary fibres on the performance of gluten-free rice-based formulated breads 545
International Journal of Food Science and Technology, 49, 1375–1382. 546
Rao, M. A. (2007). Rheology of Food Gum and Starch Dispersions. In M. A. Rao (Ed.), 547
Rheology of Fluid and Semisolid Foods Principles and Applications (pp. 153-214). New 548
York: Springer Science+Business Media. 549
Ribotta, P. D., & Rosell, C. M. (2010). Effects of enzymatic modification of soybean 550
protein on the pasting and rheological profile of starch–protein systems. Starch, 62, 551
373-383. 552
Formatted: Font: Italic

22
Ronda, F., Pérez-Quirce, S., Angioloni, A., & Collar, C. (2013). Impact of viscous 553
dietary fibres on the viscoelastic behaviour of gluten-free formulated rice doughs: A 554
fundamental and empirical rheological approach. Food Hydrocolloids, 32, 252-262. 555
Sahi, S.S., Alava, J.M., (2003). Functionality of emulsifiers in sponge cake production. 556
Journal of the Science and Agriculture, 83, 1419–1429. 557
Sahin, S. (2007). Cake batter rheology. In: Summu, S.G., Sahin, S. (Eds.), Food 558
Engineering Aspects of Baking Sweet Goods (pp. 99–118). London. CRC Press. 559
Sivaramakrishnan, H., Senge, B., & Chattopadhyay, P. K. (2004). Rheological 560
properties of rice dough for making rice bread. Journal of Food Engineering, 62, 37-45. 561
Stathopoulos, C. E. (2008). Dairy-based ingredients. In E. K. Arendt, & F. Dal Bello 562
(Eds.), Gluten-free cereal products and beverages (pp. 464). Elsevier, Academic Press. 563
Takahashi, R. (1974). Physical properties of starch granules and their uses. Journal of 564
the Japanese Society of Starch Science, 21, 51-60. 565
Ziobro, R., Witczak, T., Juszczak, L., & Korusa, J. (2013). Supplementation of gluten-566
free bread with non-gluten proteins. Effect on dough rheological properties and bread 567
characteristic. Food Hydrocolloids, 32, 213-220. 568
Witczak, M., Korus, J., Ziobro, R., & Juszczak, L. (2010). The effects of maltodextrins 569
on gluten-free dough and quality of bread. Journal of Food Engineering, 96, 258-265. 570

Table 1.- Experimental design
Fórmula Protein Acetic/Lactic
acid CA EA SPI PPI
1 0 10 0 0 0.1/0.4
2 0 5 0 0 0
3 0 0 10 0 0
4 0 0 5 0 0
5 0 10 0 0 0
6 0 5 0 0 0.1/0.4
7 0 0 0 0 0
8 0 0 5 0 0.1/0.4
9 0 0 0 5 0
10 0 0 0 10 0.1/0.4
11 0 0 0 0 0.1/0.4
12 10 0 0 0 0.1/0.4
13 5 0 0 0 0
14 5 0 0 0 0.1/0.4
15 0 0 0 5 0.1/0.4
16 0 0 10 0 0.1/0.4
17 0 0 0 10 0
18 10 0 0 0 0
CA: Calcium Caseinate; EA: Egg Albumin;
SPI: Soya Protein Isolate; PPI: Pea Protein Isolate
Amounts are in % w/w, starch +protein basis
Table

Table 2. Single effects of design factors at different levels on the dynamic oscillatory, creep-recovery, visco-
metric parameters and pH of protein-enriched rice starch-based gluten-free doughs.
Parameter Unit Overall
Mean
Level
Egg
albumin
Calcium
caseinate
Isolated pea
protein
Isolated soya
protein Acid
Dynamic Oscillatory Rheometry
G’1 Pa 21858 0 14382 b 14382 a 14382 a 14382 a ns
ns
ns
1 3945 a 19330 a 17987 a 23138 a
2 3042 a 28690 b 37600 b 56313 b
G’’1
Pa
4152
0
2738
b
2738
a
2738
a
2738
a
1 888 a 5443 b 3519 b 4104 a
2 603 a 9146 c 6254 c 7952 b
tan
0.2070
0
0.19
a
0.19
a
0.19
b
0.19
b
1 0.23 b 0.31 b 0.20 b 0.18 ab
2 0.20 a 0.32 b 0.17 a 0.15 a
Creep recovery test
Joc Pa-1 1.19 x10⁻⁴ 0 0.99 x 10⁻⁴ a 0.99 x 10⁻⁴ b 0.99 x 10⁻⁴ c 0.99 x 10⁻⁴ c ns
ns
1 2.70 x 10⁻⁴ b 0.81 x 10⁻⁴ b 0.64 x 10⁻⁴ b 0.55 x 10⁻⁴ b
2 3.84 x 10⁻⁴ c 0.53 x 10⁻⁴ a 0.34 x 10⁻⁴ a 0.30 x 10⁻⁴ a
J1c
Pa-1
1.14 x 10⁻⁴
0
0.54 x 10⁻⁴
a
ns
0.54 x 10⁻⁴
c
0.54 x 10⁻⁴
b
1 2.64 x 10⁻⁴ b 0.41 x 10⁻⁴ b 0.33 x 10⁻⁴ a
2 3.44 x 10⁻⁴ c 0.24 x 10⁻⁴ a 0.25 x 10⁻⁴ a
1c
s
20
0
17
a
17
a
17
a
17
a
22.37
b
1 21 b 18 a 18 b 29 b 18.57 a
2 17 a 21 b 20 c 24 ab
0
Pa·s
3.69 x 10⁶
0
4.33 x 10⁶
b
4.33 x 10⁶
b
4.33 x 10⁶
a
ns
ns
ns
ns
ns
1 0.63 x 10⁶ a 3.02 x 10⁶ ab 3.34 x 10⁶ a
2 0.40 x 10⁶ a 0.86 x 10⁶ a 5.50 x 10⁶ b
Jor
Pa-1
1.45 x 10⁻⁴
0
1.14 x 10⁻⁴
a
ns
1.14 x 10⁻⁴
c
1.14 x 10⁻⁴
c
1 3.23 x 10⁻⁴ b 0.71 x 10⁻⁴ b 0.59 x 10⁻⁴ b
2 4.67 x 10⁻⁴ c 0.39 x 10⁻⁴ a 0.36 x 10⁻⁴ a
J1r
Pa-1
1.16 x 10⁻⁴
0
0.90 x 10⁻⁴
a
ns
0.90 x 10⁻⁴
c
0.90 x 10⁻⁴
b
1 2.26 x 10⁻⁴ b 0.42 x 10⁻⁴ b 0.35 x 10⁻⁴ a
2 3.17 x 10⁻⁴ c 0.27 x 10⁻⁴ a 0.25 x 10⁻⁴ a
1r
s
77
0
121
b
121
b
121
b
121
b
1 65 a 97 ab 60 a 65 a
2 63 a 69 a 72 a 83 a
Viscometric profile
PV mPa.s 2340 0 ns 2860 c 2860 c 2860 b ns
ns
ns
1 2222 b 2426 b 2518 a
2 1665 a 2035 a 2294 a
TV
mPa.s
1804
0
2429
b
2429
c
2429
c
2429
c
1 2225 ab 1821 b 1679 b 1955 b
2 1986 a 1377 a 1216 a 1545 a
FV
mPa.s
2683
0
ns
ns
3228
c
3228
c
3228
b
1 2655 b 2557 b 2822 ab
2 2164 a 2090 a 2349 a
PT
ºC
81.54
0
79.31
a
79.31
a
79.31
a
82.87
b
1 83.94 b 77.78 a 82.03 b 80.21 a
2 87.30 c 79.63 a 83.69 b
pH of the medium
pH 5.20 0 4.54 a 4.54 a 4.54 a 4.54 a 5.73 b
1 5.08 b 5.22 b 5.23 b 5.16 b 4.73 a
2 5.27 c 5.47 c 5.53 c 5.43 ab
Levels: 0, absence; 1, 5% protein addition (starch + protein basis) or acetic/lactic acid addition (0.1/0.4, w/w, starch + protein
basis); 2, 10% protein addition (starch + protein basis). ns: non significant effects p>0.05. Within each parameter, different
letters in the corresponding column mean statistically differences between means at p<0.05.
Abbreviations used for the measured parameters are presented in the materials and methods section.
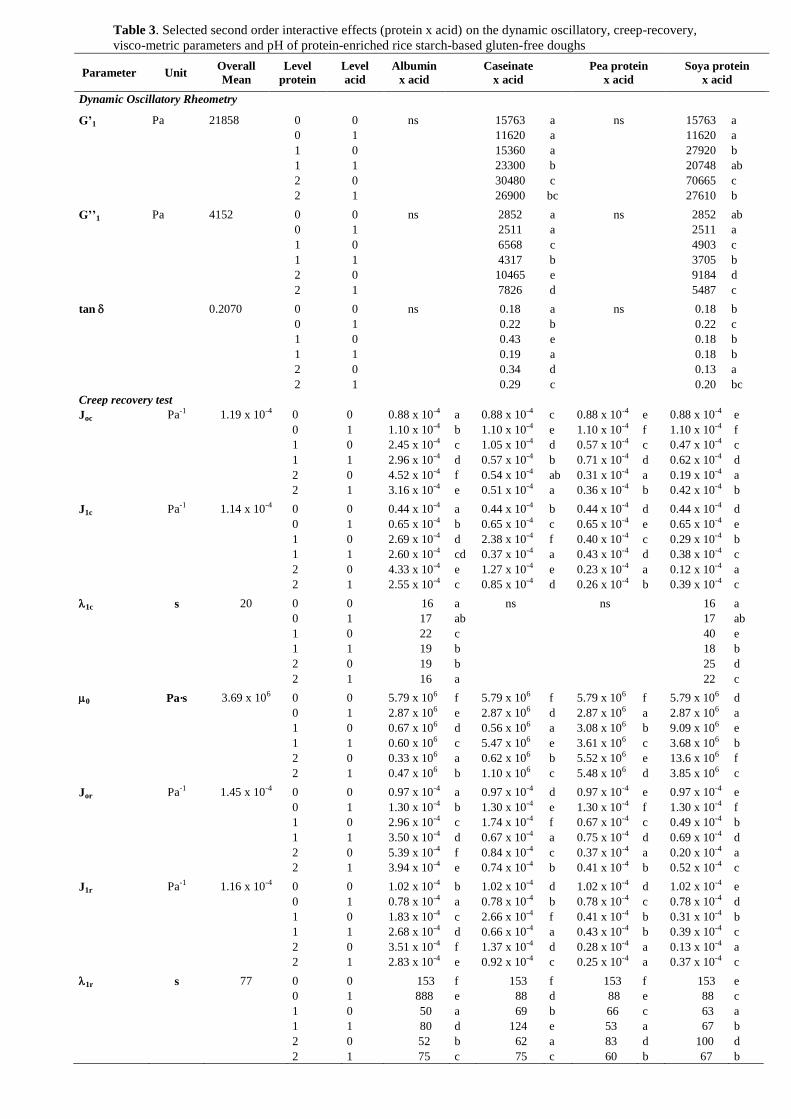
Table 3. Selected second order interactive effects (protein x acid) on the dynamic oscillatory, creep-recovery,
visco-metric parameters and pH of protein-enriched rice starch-based gluten-free doughs
Parameter Unit Overall
Mean
Level
protein
Level
acid
Albumin
x acid
Caseinate
x acid
Pea protein
x acid
Soya protein
x acid
Dynamic Oscillatory Rheometry
G’1 Pa 21858 0 0 ns 15763 a ns 15763 a
0 1 11620 a 11620 a
1 0 15360 a 27920 b
1 1 23300 b 20748 ab
2 0 30480 c 70665 c
2 1 26900 bc 27610 b
G’’1 Pa 4152 0 0 ns 2852 a ns 2852 ab
0 1 2511 a 2511 a
1 0 6568 c 4903 c
1 1 4317 b 3705 b
2 0 10465 e 9184 d
2 1 7826 d 5487 c
tan 0.2070 0 0 ns 0.18 a ns 0.18 b
0 1 0.22 b 0.22 c
1 0 0.43 e 0.18 b
1 1 0.19 a 0.18 b
2 0 0.34 d 0.13 a
2 1 0.29 c 0.20 bc
Creep recovery test
Joc Pa-1 1.19 x 10⁻⁴ 0 0 0.88 x 10⁻⁴ a 0.88 x 10⁻⁴ c 0.88 x 10⁻⁴ e 0.88 x 10⁻⁴ e
0 1 1.10 x 10⁻⁴ b 1.10 x 10⁻⁴ e 1.10 x 10⁻⁴ f 1.10 x 10⁻⁴ f
1 0 2.45 x 10⁻⁴ c 1.05 x 10⁻⁴ d 0.57 x 10⁻⁴ c 0.47 x 10⁻⁴ c
1 1 2.96 x 10⁻⁴ d 0.57 x 10⁻⁴ b 0.71 x 10⁻⁴ d 0.62 x 10⁻⁴ d
2 0 4.52 x 10⁻⁴ f 0.54 x 10⁻⁴ ab 0.31 x 10⁻⁴ a 0.19 x 10⁻⁴ a
2 1 3.16 x 10⁻⁴ e 0.51 x 10⁻⁴ a 0.36 x 10⁻⁴ b 0.42 x 10⁻⁴ b
J1c Pa-1 1.14 x 10⁻⁴ 0 0 0.44 x 10⁻⁴ a 0.44 x 10⁻⁴ b 0.44 x 10⁻⁴ d 0.44 x 10⁻⁴ d
0 1 0.65 x 10⁻⁴ b 0.65 x 10⁻⁴ c 0.65 x 10⁻⁴ e 0.65 x 10⁻⁴ e
1 0 2.69 x 10⁻⁴ d 2.38 x 10⁻⁴ f 0.40 x 10⁻⁴ c 0.29 x 10⁻⁴ b
1 1 2.60 x 10⁻⁴ cd 0.37 x 10⁻⁴ a 0.43 x 10⁻⁴ d 0.38 x 10⁻⁴ c
2 0 4.33 x 10⁻⁴ e 1.27 x 10⁻⁴ e 0.23 x 10⁻⁴ a 0.12 x 10⁻⁴ a
2 1 2.55 x 10⁻⁴ c 0.85 x 10⁻⁴ d 0.26 x 10⁻⁴ b 0.39 x 10⁻⁴ c
1c s 20 0 0 16 a ns ns 16 a
0 1 17 ab 17 ab
1 0 22 c 40 e
1 1 19 b 18 b
2 0 19 b 25 d
2 1 16 a 22 c
0 Pa·s 3.69 x 10⁶ 0 0 5.79 x 10⁶ f 5.79 x 10⁶ f 5.79 x 10⁶ f 5.79 x 10⁶ d
0 1 2.87 x 10⁶ e 2.87 x 10⁶ d 2.87 x 10⁶ a 2.87 x 10⁶ a
1 0 0.67 x 10⁶ d 0.56 x 10⁶ a 3.08 x 10⁶ b 9.09 x 10⁶ e
1 1 0.60 x 10⁶ c 5.47 x 10⁶ e 3.61 x 10⁶ c 3.68 x 10⁶ b
2 0 0.33 x 10⁶ a 0.62 x 10⁶ b 5.52 x 10⁶ e 13.6 x 10⁶ f
2 1 0.47 x 10⁶ b 1.10 x 10⁶ c 5.48 x 10⁶ d 3.85 x 10⁶ c
Jor Pa-1 1.45 x 10⁻⁴ 0 0 0.97 x 10⁻⁴ a 0.97 x 10⁻⁴ d 0.97 x 10⁻⁴ e 0.97 x 10⁻⁴ e
0 1 1.30 x 10⁻⁴ b 1.30 x 10⁻⁴ e 1.30 x 10⁻⁴ f 1.30 x 10⁻⁴ f
1 0 2.96 x 10⁻⁴ c 1.74 x 10⁻⁴ f 0.67 x 10⁻⁴ c 0.49 x 10⁻⁴ b
1 1 3.50 x 10⁻⁴ d 0.67 x 10⁻⁴ a 0.75 x 10⁻⁴ d 0.69 x 10⁻⁴ d
2 0 5.39 x 10⁻⁴ f 0.84 x 10⁻⁴ c 0.37 x 10⁻⁴ a 0.20 x 10⁻⁴ a
2 1 3.94 x 10⁻⁴ e 0.74 x 10⁻⁴ b 0.41 x 10⁻⁴ b 0.52 x 10⁻⁴ c
J1r Pa-1 1.16 x 10⁻⁴ 0 0 1.02 x 10⁻⁴ b 1.02 x 10⁻⁴ d 1.02 x 10⁻⁴ d 1.02 x 10⁻⁴ e
0 1 0.78 x 10⁻⁴ a 0.78 x 10⁻⁴ b 0.78 x 10⁻⁴ c 0.78 x 10⁻⁴ d
1 0 1.83 x 10⁻⁴ c 2.66 x 10⁻⁴ f 0.41 x 10⁻⁴ b 0.31 x 10⁻⁴ b
1 1 2.68 x 10⁻⁴ d 0.66 x 10⁻⁴ a 0.43 x 10⁻⁴ b 0.39 x 10⁻⁴ c
2 0 3.51 x 10⁻⁴ f 1.37 x 10⁻⁴ d 0.28 x 10⁻⁴ a 0.13 x 10⁻⁴ a
2 1 2.83 x 10⁻⁴ e 0.92 x 10⁻⁴ c 0.25 x 10⁻⁴ a 0.37 x 10⁻⁴ c
1r s 77 0 0 153 f 153 f 153 f 153 e
0 1 888 e 88 d 88 e 88 c
1 0 50 a 69 b 66 c 63 a
1 1 80 d 124 e 53 a 67 b
2 0 52 b 62 a 83 d 100 d
2 1 75 c 75 c 60 b 67 b

Table 3. (Continuation)
Parameter Unit Overall
Mean
Level
protein
Level
acid
Albumin
x acid
Caseinate
x acid
Pea protein
x acid
Soya protein
x acid
Viscometric profile
PV mPa.s 2340 0 0 3091 e 3091 f 3091 d ns
0 1 2628 c 2629 e 2629 c
1 0 2384 b 1990 c 2239 b
1 1 2852 d 2454 d 2612 c
2 0 2086 a 1536 a 1869 a
2 1 2770 cd 1794 b 2200 b
TV mPa.s 1804 0 0 2771 d 2771 e 2771 f 2771 d
0 1 2087 b 2087 d 2087 e 2087 c
1 0 2158 bc 1615 c 1455 c 2008 bc
1 1 2291 c 2028 d 1903 d 1902 b
2 0 1876 a 1275 a 1151 a 1581 a
2 1 2095 b 1479 b 1281 b 1509 a
FV mPa.s 2682 0 0 3783 d 3783 e 3783 e 3783 d
0 1 2672 a 2672 d 2672 d 2672 b
1 0 3401 c 2558 c 2521 c 2986 c
1 1 3128 b 2752 d 2593 cd 2658 b
2 0 3077 b 2068 a 2227 b 2518 b
2 1 2955 b 2259 b 1952 a 2181 a
PT ºC 81.54 0 0 80.23 b 80.23 b 80.23 c 80.23 ab
0 1 78.38 a 78.38 a 78.38 b 78.38 a
1 0 81.05 b 86.03 d 81.30 c 83.52 c
1 1 78.10 a 81.85 c 74.27 a 80.53 b
2 0 83.57 c 88.10 e 79.00 b 83.05 c
2 1 77.63 a 86.50 d 80.27 c 84.33 c
pH of the medium
pH 5.20 0 0 5.21 d 5.21 d 5.21 c 5.21 d
0 1 3.88 a 3.88 a 3.88 a 3.88 a
1 0 5.56 e 5.71 e 5.73 d 5.68 e
1 1 4.46 b 4.73 b 4.72 b 4.64 b
2 0 5.73 f 5.84 ef 5.85 de 5.82 ef
2 1 4.80 c 5.10 cd 5.20 c 5.03 c
Levels: 0, absence; 1, 5% protein addition (starch + protein basis) or acetic/lactic acid addition (0.1/0.4, w/w, starch + protein
basis); 2, 10% protein addition (starch + protein basis). ns: non significant effects p>0.05. Within each parameter, different
letters in the corresponding column mean statistically differences between means at p<0.05.
Abbreviations used for the measured parameters are presented in the materials and methods section.

Table 4: Correlations between dough functional properties
a G’’1 b tan c max J0c J1c o PV TV BD FV SB TP
G’1 - 0.81*** - - - 0.75*** -0.70** -0.66** 0.80*** - -0.56* 0.52* -0.55* - -
a - - 0.98*** -0,84*** - - - - - - - - - -
G’’1 - - - 0.90*** -0.73*** -0.55* - -0.65** -0.71*** - -0.71*** - 0.59*
b - 0,68** - 0.66** 0.66** - - - - - 0.65** -
tan -0,81*** - - - - - - - - - -
c
- - - - - - - - 0.47*
-
max
-0.67** -0.51* - -0.67** -0.74*** - -0.68** - 0.57*
J0c
0.95*** -0.56* - - - 0.54* - -
J1c
-0.66** - - -0.52* - - -
o
- - 0.56* - - -
PV
0.85*** - 0.73*** - -0.66**
TV
- 0.92*** - -
BD
- - -0.46*
FV
0.50* -
SB
-
Protein: is referred to the dose of protein (0. 5. 10 %) independently of the type of protein; Acid: varied between 0
(without acid addition) and 1 (with addition); *p<0.05; ** p<0.01; *** p<0.001; ns: not significant
Abbreviations used for the correlated parameters are presented in the materials and methods section.

FIGURE CAPTIONS
Figure 1: (a) Stress sweeps of doughs with 10 g/100 g albumin (triangle) and pea
protein (circle), (b) Frequency sweeps of doughs with 5 g/100 g casein without acid
(triangle) and with acid (circle). Elastic modulus, G’, is represented by solid points and
the viscous modulus, G’’, by void points. The loss tangent is represented by
discontinuous lines in the secondary (right) scale.
(c) Creep-recovery tests of control doughs (circle) and doughs with 10 g/100 g casein
(triangle), both with (solid points) or without (void points) acid.
Figure

0
0,4
0,8
1,2
1,6
10
100
1000
10000
100000
0,1 1 10 100 1000
tan
d
G', G
'' (P
a)
Stress (Pa)
Albumin 10% Pea 10%
a)
0,1
0,2
0,3
0,4
0,5
1000
10000
100000
0,1 1 10ta
n d
G', G
'' (P
a)
Frequency (Hz)
Casein 5% Casein 5% with acid
b)
0
5
10
15
20
25
30
35
40
45
50
0 100 200 300 400 500
Co
mp
lia
nc
e (
10
-5P
a-1
)
Time (s)
Control Control with acid Casein 10% Casein 10% with acid
c)
Figure

0
0,2
0,4
0,6
0,8
1
1,2
1,4
10
100
1000
10000
100000
0,1 1 10 100 1000
tan
d
G', G
'' (P
a)
Stress (Pa)
Albumin 10% Pea 10%
a)
0,1
0,2
0,3
0,4
0,5
1000
10000
100000
0,1 1 10
tan
d
G', G
'' (P
a)
Frequency (Hz)
Casein 5% Casein 5% with acid
b)
0
5
10
15
20
25
30
35
40
45
50
0 100 200 300 400 500
Co
mp
lia
nc
e (
10
-5P
a-1
)
Time (s)
Control Control with acid Casein 10% Casein 10% with acid
c)
Figure