Embed Size (px)
Citation preview

Catarina Chemetova Cravo Branco de Oliveira
Licenciatura em Engenharia do Ambiente
Influence of Abiotic Stress Factors on
VOCs Emission from Portuguese Rice
Paddy Fields
Relation with increased Climate Change
Dissertação para obtenção do Grau de Mestre em
Engenharia do Ambiente
Perfil de Gestão de Sistemas Ambientais
Orientador: Professora Doutora Alexandra de Jesus
Branco Ribeiro, CENSE, DCEA, FCT-UNL Co-orientador: Doutora Maria da Nazaré Parada
Figueiredo de Sousa Couto, CENSE, FCT-UNL
Júri
Presidente: Doutora Maria Júlia Fonseca de Seixas
Arguente: Doutor Eduardo Manuel Hipólito Pires Mateus
Vogais: Doutora Corina Luísa Videira de Abreu Fernandes Carranca
Doutora Alexandra de Jesus Branco Ribeiro
Doutora Maria da Nazaré Parada Figueiredo de Sousa Couto
Outubro de 2013


Influence of Abiotic Stress Factors on VOCs Emission from Portuguese Rice Paddy Fields Relation with increased Climate Change 2013
i
nfluence of Abiotic Stress Factors on VOCs
Emission from Portuguese Rice Paddy Fields
Relation with increased Climate Change
Copyright © 2013 Todos os direitos reservados a Catarina Chemetova Cravo Branco de Oliveira, FCT/UNL.
A Faculdade de Ciências e Tecnologia e a Universidade Nova de Lisboa têm o direito, perpétuo e sem limites geográficos, de arquivar e publicar esta dissertação através de exemplares impressos reproduzidos em papel ou de forma digital, ou por qualquer outro meio conhecido ou que venha a ser inventado, e de a divulgar através de repositórios científicos e de admitir a sua cópia e distribuição com objectivos educacionais ou de investigação, não comerciais, desde que seja dado crédito ao autor e editor.
I

Influence of Abiotic Stress Factors on VOCs Emission from Portuguese Rice Paddy Fields Relation with increased Climate Change 2013
ii

Influence of Abiotic Stress Factors on VOCs Emission from Portuguese Rice Paddy Fields Relation with increased Climate Change 2013
iii
Acknowledgements
Big opportunities always happen when we less expect – I called Serendipity – and we should
never waste them! At least, it was what I have done and never regretted. The challenge of
coming up with new tasks and reproduce them on an ended dissertation should be considered
important help and motivation from who made it possible and I have a pleasure to thank all of
them now.
To start, I want to underline here all my highest honor and admiration and thank my
supervisor Professor Dr. Alexandra Ribeiro by orientation, support, friendship and important
opportunity of leave me work and explore my field and laboratory skills with maximum vote of
confidence.
I also want to recognize the enormous support offered by my Co-supervisor Post-Doc
researcher Dr. Maria Nazaré Couto, which was truly tireless in all support, friendship,
availability and dedication among the whole dissertation.
I had the experience of working as a researcher with a team from FCT-UNL and partners from
INIAV and UTAD, on a project named PTDC/AGR-AAM/102529/2008 “Trace gas emission from
Portuguese irrigated rice fields in contrasting soils, by the influence of crop management,
climate and increased concentration of CO2 and temperature in the atmosphere”. I get totally
involved with the aim of doing my best day by day. It was big step further on my professional
enrolment and gained skills. My thesis appears as one of the result marks of the project. And it
was only possible thanks to the four months of financial support allowed by FFCT (Portuguese
Foundation for Science and Technology) for reach the objectives and make possible the
accomplishment of field and laboratory investigation.
I would also like to thank CENSE-DCEA (Center for Environmental and Sustainability Research-
Department of Environmental Engineering Sciences) - FCT-UNL for the facilities. As well as the
rest of team project from FCT-UNL, the important help from all other researchers and
laboratory colleges in technical support and features, and specially Dr. Eduardo Mateus for
offered complete availability and support during the analysis, identification and discussion
process of results and sharing knowledge about laboratory work technical performance. From
INIAV team, I want to thanks to project coordinator Dr. Corina Carranca for conferences
invitation and sharing information about data from rice paddy fields, and Ms. Nuno Figueiredo
for support in field and informative/technical material. Other partners of the project from
CotArroz, Paula Marques, I also want to mention the great reception and permission for
collecting plant material for analysis.
By last but not the least, I attribute highest gratifications for having with me my family, my
partner and all my friends that always make me believe that everything, with effort and
dedication, is possible. A sincerely thank for still walking with me in this important journey of
my life.
Thank you all.

Influence of Abiotic Stress Factors on VOCs Emission from Portuguese Rice Paddy Fields Relation with increased Climate Change 2013
iv

Influence of Abiotic Stress Factors on VOCs Emission from Portuguese Rice Paddy Fields Relation with increased Climate Change 2013
v
Resumo
A resposta ao stress pelas plantas leva à emissão de sinais químicos para a atmosfera -
compostos orgânicos voláteis (COVs). Os COVs participam na química da atmosfera: sofrem
fotólise ou reagem com oxidantes atmosféricos originando ozono troposférico. Neste trabalho
foi estudada a emissão de COVs no ciclo da planta do arroz (O. sativa L. cv. Aríete), em campos
alagados, em dois ensaios, em blocos aleatórios com três repetições, instalados em dois solos
de texturas diferentes (argilo-limoso e areno-franco), avaliando o efeito das emissões ao ar
livre e em câmaras abertas sob efeito de tratamentos com indução de stress abiótico
(aumento da temperatura e aumento simultâneo da temperatura e da concentração de CO2).
Os COVs foram extraídos da planta utilizando micro extração em fase sólida e destilação por
arrastamento de vapor com extracção sumultânea, seguido de deteção por cromatografia
gasosa acoplada a espectrometria de massa, utilizando duas colunas capilares, uma apolar
(DB-5) e outra polar (DB-WAX). Foram identificados 33 COVs com a coluna apolar e 22 com a
polar e identificadas três principais classes: voláteis verdes das folhas, monoterpenos e
sesquiterpenos. Tendo em conta o ciclo de vida da planta, observou-se uma mais elevada
emissão na fase vegetativa, seguida da reprodutiva e a menor na maturação. No solo argilo-
limoso ocorreu uma maior emissão em comparação a de textura areno-franco. Entre as
câmaras abertas, verificou-se uma maior emissão quando do aumento apenas da temperatura,
em relação ao aumento simultâneo com CO2. Pelos cenários do Painel Intergovernamental das
Alterações Climáticas com aumento de temperatura e concentração de CO2, há dois efeitos
inerentes na emissão de COVs pelo arroz, um negativo com maior emissão devido à
temperatura e outro positivo referente à diminuição de COVs na presença de CO2. A inclusão
de dados de campo nos modelos de qualidade do ar ajudará a previsão e entendimento do
impacte das alterações climáticas na qualidade do ar à escala global.
Palavras-chave: cultura do arroz; factores de stress abiótico; emissão de COVs; alterações
climáticas.

Influence of Abiotic Stress Factors on VOCs Emission from Portuguese Rice Paddy Fields Relation with increased Climate Change 2013
vi

Influence of Abiotic Stress Factors on VOCs Emission from Portuguese Rice Paddy Fields Relation with increased Climate Change 2013
vii
Abstract
Plants are emitting chemical-signals to the atmosphere in response to stress factors - Volatile
Organic Compounds (VOCs). VOCs have higher influence on atmosphere chemistry: they are
acting as photochemical precursors in tropospheric ozone formation. Present work studies
VOCs emission released by rice (Oryza sativa L cv. Aríete) cycle in paddy fields, in aleatory
schemes with three replicates, in two separate soil plots with different textures (silty clay and
loamy sand), studying open field conditions and open top chambers (OTCs) under influence of
treatments with induced abiotic stress (increase temperature and simultaneously temperature
and CO2 atmospheric concentration enhancement). VOCs were extracted from plant by solid
phase micro extraction (SPME) and stem distillation extraction (SDE), and analyzed by gas
chromatography coupled to mass spectrometry (GC/MS) using two GC capillary columns with
different polarities, one non-polar (DB-5) and other polar (DB-WAX). A total of 33 VOCs using a
non-polar column and 22 VOCs using a polar column, in both set of results were identified the
three main classes of compounds: green leaf volatiles (GLV), monoterpenes and
sesquiterpenes. Between rice cycle VOCs vary their trend and on vegetative stage were
observed more VOCs, followed by ripening and lesser on reproductive. Silty clay soil
demonstrated higher amount of VOCs released if compared with loamy sand texture. Between
OTCs, more compounds were released by increasing temperature than simultaneously
temperature and CO2. In Intergovernmental Panel for Climate Change (IPCC) scenarios with
emergent trend of increasing temperature and CO2 atmospheric concentration, two effects are
inherent to rice VOCs emission, one negative with higher emission related with temperature
and other positive with less emission associated CO2. Field data measurements addictions in
air quality models will help achievements of realistic previsions and better understand the
effect of climate change in air quality on a global scale.
Key-works: rice culture; abiotic stress factors; VOCs emission; climate change.

Influence of Abiotic Stress Factors on VOCs Emission from Portuguese Rice Paddy Fields Relation with increased Climate Change 2013
viii

Influence of Abiotic Stress Factors on VOCs Emission from Portuguese Rice Paddy Fields Relation with increased Climate Change 2013
ix
Table of Contents
ACKNOWLEDGEMENTS ......................................................................................................................... III
RESUMO ............................................................................................................................................... V
ABSTRACT ........................................................................................................................................... VII
TABLE OF CONTENTS .............................................................................................................................IX
LIST OF FIGURES ..................................................................................................................................XIII
LIST OF TABLES................................................................................................................................... XVI
ACRONYMS AND ABBREVIATIONS ..................................................................................................... XIX
1. INTRODUCTION ............................................................................................................................. 1
1.1 RESEARCH SCOPE AND OBJECTIVES .................................................................................................. 2
1.2 DISSERTATION STRUCTURE ............................................................................................................ 2
2. LITERATURE REVIEW...................................................................................................................... 3
2.1 IMPORTANCE OF RICE CULTURE ...................................................................................................... 3
2.1.1 Global status ..................................................................................................................... 3
2.1.2 Economics ......................................................................................................................... 6
2.1.3 Ecological advantage ......................................................................................................... 7
2.1.4 Rice culture in Portugal ...................................................................................................... 7
2.2 RICE PLANT ............................................................................................................................... 8
2.2.1 Cultivation systems .......................................................................................................... 10
2.2.2 Influent stress factors ...................................................................................................... 11
2.2.2.1 Soil characteristics ............................................................................................................... 11
2.2.2.2 Temperature and atmospheric carbon dioxide concentration ................................................ 12
2.2.2.3 Wind ................................................................................................................................... 13
2.2.2.4 Sun Radiation ....................................................................................................................... 13
2.2.2.5 Water .................................................................................................................................. 13

Influence of Abiotic Stress Factors on VOCs Emission from Portuguese Rice Paddy Fields Relation with increased Climate Change 2013
x
2.2.3 Chemical responses to stress factors ................................................................................ 14
2.3 VOLATILE ORGANIC COMPOUNDS ................................................................................................. 14
2.3.1 VOCs main classes ........................................................................................................... 15
2.3.1.1 Terpenes ............................................................................................................................. 15
2.3.1.2 Green Leaf Volatiles ............................................................................................................. 16
2.4 VOCS STUDY ........................................................................................................................... 17
2.4.1 Extraction techniques ...................................................................................................... 17
2.4.2 Analytical techniques ....................................................................................................... 18
2.4.3 Rice volatile profile studies ............................................................................................... 20
2.4.4 VOCs specific meanings and aroma correspondence ......................................................... 21
2.5 VOCS, RICE AND CLIMATE CHANGE SCENARIOS ................................................................................. 23
3. MATERIALS AND METHODS ......................................................................................................... 33
3.1 SITE DESCRIPTION ..................................................................................................................... 33
3.1.1 CULTURE PRACTICES .................................................................................................................. 34
3.2 EXPERIMENTAL DESIGN .............................................................................................................. 35
3.2.1 Sampling ......................................................................................................................... 35
3.2.2 VOCs extraction methods ................................................................................................. 38
3.2.2.1 Solid phase microextraction ................................................................................................. 39
3.2.2.2 Steam distillation extraction ................................................................................................ 40
3.2.3 VOCs analysis .................................................................................................................. 41
3.2.3.1 Gas chromatography/mass spectrometry .............................................................................. 41
3.2.4 VOCs Identification .......................................................................................................... 43
3.2.4.1 Statistical results treatment ................................................................................................. 44
4. RESULTS ...................................................................................................................................... 45
4.1 VOCS PROFILE BY GC/MS USING DB-5 NON-POLAR COLUMN ............................................................. 45

Influence of Abiotic Stress Factors on VOCs Emission from Portuguese Rice Paddy Fields Relation with increased Climate Change 2013
xi
4.2 VOCS PROFILE BY GC/MS USING DB-WAX POLAR COLUMN .............................................................. 49
4.3 DATA TREATMENT .................................................................................................................... 52
4.3.1 Students t-test ................................................................................................................. 52
4.3.1.1 One sample t-test mean (confidence intervals) ..................................................................... 52
4.3.1.2 Independent two sample t-test (mean differences) .............................................................. 53
5. DISCUSSION ................................................................................................................................. 55
6. CONCLUSIONS ............................................................................................................................. 59
7. REFERENCES ................................................................................................................................ 60
ANNEXES

Influence of Abiotic Stress Factors on VOCs Emission from Portuguese Rice Paddy Fields Relation with increased Climate Change 2013
xii

Influence of Abiotic Stress Factors on VOCs Emission from Portuguese Rice Paddy Fields Relation with increased Climate Change 2013
xiii
List of Figures
FIG. 2.1 – WORLD POPULATION IN 2004 BASED ON STAPLE FOOD CROPS CALCULATED FROM DATA AVAILABLE IN FAOSTAT
(SOURCE: FAO, 2004) ........................................................................................................................ 4
FIG. 2.2 – WORLD MAP OVERVIEW OF COUNTRIES WITH HIGHER (BLUE COLOUR) AND LOWER (ORANGE COLOUR) RICE AREA
HARVESTED/TOTAL CROP AREA HARVESTED (SOURCE: MOHANTY, 2010) ......................................................... 4
FIG. 2.3 - TREND OF THE THREE MAIN CEREAL PRICES (USD PER CEREAL TONNE) SINCE 2011 TO FIRST TWO MONTHS OF
2013. PRICES REFERRED MONTHLY AVERAGE (SOURCE: FAO, 2013) .............................................................. 6
FIG. 2.4 – RICE ECOSYSTEM LANDSCAPE A) FLOCK OF STROKS (SOURCE: APARROZ, 2009) AND B) CRAYFISH IN RICE SOIL
SUBSTRATE IN COTARROZ PADDY FIELDS, SALVATERRA DE MAGOS ................................................................. 7
FIG. 2.5 - RICE PLANT CONSTITUENTS (SOURCE: IRRI, 2013A)............................................................................... 8
FIG. 2.6 – EXAMPLE OF GROWTH PHASES OF RICE PLANT (SOURCE: IRRI, 2013B)....................................................... 9
FIG. 2.7 - IRRIGATE VS. RAINFED RICE IN ASIAN CONTINENT (SOURCE: HUKE (1997) IN WASSMANN ET AL., 2009) .......... 10
FIG. 2.8 – METEOROLOGICAL CHARACTERISTICS IN SALVATERRA DE MAGOS DURING THE RICE CULTURAL CYCLE OF 2012 (P =
ACCUMULATE MONTHLY PRECIPITATION, MM; T MED/GREEN CIRCLES = MONTHLY AVERAGE AIR TEMPERATURE, ⁰C;
RED TRIANGLES = MAXIMUM TEMPERATURE, ⁰C, AND BLUE SQUARES = MINIMUM TEMPERATURE, ⁰C) (ADAPTED
FROM: INIAV, 2013A) ...................................................................................................................... 11
FIG. 2.9 – CHARACTERISTICS OF SAND AND CLAY SOILS TOWARDS TENSION AND WATER CONTENT VARIATION (SOURCE: IRRI,
2013B).......................................................................................................................................... 12
FIG. 2.10 – EXAMPLES OF MONO – AND SESQUITERPES POLYCYCLIC STRUCTURES (SOURCE: NIST 08, 2013) .................. 16
FIG. 2.11 – CONSTITUENT PARTS OF A STANDARD SPME HOLDER (SOURCE: CHROMEDIA, 2013) ................................ 17
FIG. 2.12 – GC/MS EQUIPMENT LAYOUT (SOURCE: GINSBACH ET AL., 2010) ......................................................... 19
FIG. 2.13 – VOC PROFILES COLLECTED FROM UN- AND INFESTED RICE PLANTS SAMPLES (SOURCE: ZHOU AND WANG, 2011)
.................................................................................................................................................... 20
FIG. 2.14 - RELATION BETWEEN VOC SOURCES EMISSION, MOLECULAR SIZE AND CLIMATE REACTION (SOURCE: RIIPNEN ET
AL., 2012)...................................................................................................................................... 23
FIG. 2.15 – LOW MOLECULAR COMPOUNDS AND THEIR REACTIONS (ADDAPTED FROM: SHENG ET AL., 2013).................. 24
FIG. 2.16 – MONTHLY ESTIMATION OF ISOPRENE, MONOTERPENES, SESQUITERPENES, AND OVOCS EMISSIONS FROM
EUROPEAN VEGETATION. OTHER LAND AREA USES INCLUDE ALL CATEGORIES EXCEPTED FOREST (SOURCE: STEINBERG ET
AL., 2009)...................................................................................................................................... 25
FIG. 2.17 – VOCS EMISSION REDUCTION IN EUROPE BETWEEN 1990 AND 2010 (SOURCE: EEA, 2004) ....................... 27

Influence of Abiotic Stress Factors on VOCs Emission from Portuguese Rice Paddy Fields Relation with increased Climate Change 2013
xiv
FIG. 2.18 – COMPLEMENTATION METHODS FOR INCLUDING MEASUREMENT STUDIES AND MODEL STUDY TO UNDERSTAND
REAL PHENOMENA AND PREDICT FUTURE SITUATION (CHO AND OKI, 2012) .................................................... 28
FIG. 3.1 – LOCATION OF FIELD SITE; (RIGHT SIDE) COTARROZ PLOTS (SOURCE: FIGUEIREDO, 2011) ............................. 33
FIG. 3.2 – COTARROZ PARTIAL LANDSCAPE ..................................................................................................... 33
FIG. 3.3 – CULTURE PRATICES DATES AND FLOODING PERIOD (SOURCE: INIAV, 2013C) ............................................. 34
FIG. 3.4 – COTARROZ FIELD ASPECT AFTER SEEDING (A); WEEDING (B); BEFORE HARVESTED (C) ................................... 34
FIG. 3.5 – EXPERIMENTAL DESIGN LAYOUT ...................................................................................................... 35
FIG. 3.6 – DATA COLLECTION LAYOUT IN COTARROZ, SALVATERRA DE MAGOS, 2012, IN OF SOIL PLOT A (A); SOIL PLOT B
OTC (B); PLOTS UNDER CONTROLED CONDITIONS (C) ................................................................................. 36
FIG. 3.7 – SAMPLING SCHEME AT SILTY CLAY SOIL .............................................................................................. 36
FIG. 3.8 – DAILY TEMPERATURE AVERAGE DURING THE WHOLE RICE CYCLE .............................................................. 37
FIG. 3.9 – DAILY CO2 CONCENTRATION AVERAGE AMONG WHOLE RICE CYCLE .......................................................... 38
FIG. 3.10 - MATERIAL FOR SPME EXTRACTION SPME HOLDER AND FIBRE DVB/CAR/PDMS AND (A), ABOUT 0.3 G OF RICE
SAMPLES INTO 15 ML VIALS (B) ............................................................................................................ 39
FIG. 3.11 – SDE EXTRACTION; SDE MATERIAL (A) AND FRESH RICE SAMPLES (B)....................................................... 40
FIG. 3.12 – EXAMPLE OF TIC RESULTING FROM SPME EXTRACTION AND ANALYSED BY GC/MS USING DB-5 CAPILARY
COLUMN ......................................................................................................................................... 41
FIG. 4.1 – RETENTION TIME IN RELATION WITH AMOUNT OF CARBON UNITS OF VOC CONSTITUENTS FROM THE THREE MAIN
CLASSES (TIC BY GC/MS USING DB-5 COLUMN) ...................................................................................... 47
FIG. 4.2 – PREDOMINANCE OF MONO- AND SESQUITERPENES ON VEGETATIVE STAGE ................................................. 47
FIG 4.3 – VOICES EMISSION DIFFERENCES BETWEEN SOIL TEXTURES ....................................................................... 48
FIG. 4.4 – HIGHER NUMBER OF VOCS ON TEMPERATURE INDUCED OTC (TEC) ........................................................ 48
FIG 4.5 – GLV BETWEEN THREE PHASES (TE SAMPLE COMPARATION) WITH GC DB-WAX POLAR COLUMN .................... 50

Influence of Abiotic Stress Factors on VOCs Emission from Portuguese Rice Paddy Fields Relation with increased Climate Change 2013
xv

Influence of Abiotic Stress Factors on VOCs Emission from Portuguese Rice Paddy Fields Relation with increased Climate Change 2013
xvi
List of Tables
TABLE 2.1 – COUNTRY RANGE OF RICE PRODUCTION (TONES AND PERCENTAGE), OCCUPIED AREA (HECTARES AND
PERCENTAGE) AND PRODUCTIVITY IN THE YEAR 2009 ................................................................................... 5
TABLE 2.2 - RANGE OF FIFTH MAIN EU RICE PRODUCERS IN THE YEAR 2011 .............................................................. 8
TABLE 2.3 – CLASSIFICATION OF COMMERCIAL RICE BY GRAIN SIZE ........................................................................... 9
TABLE 2.4 - OPTIMAL, MINIMAL AND MAXIMAL TEMPERATURES (°C) DURING RICE GROWING PHASES ............................ 12
TABLE 2.5 – ISOPRENE UNITS, CARBON AND HYDROGEN ATOMS AND CHEMICAL FORMULA OF DIFFERENT TERPENES ........... 15
TABLE 2.6 – STRUCTURE OF MAIN GREEN LEAF VOLATILES .................................................................................. 16
TABLE 2.7 – ASSUMED MEANING AND AROMA DESCRIPTOR OF MAIN VOCS ............................................................ 22
TABLE 2.8 – MAIN VOC EMITTER COUNTRIES IN EU ACCORDING WITH THE UNECE PROTOCOL ................................... 27
FIG. 2.18 – COMPLEMENTATION METHODS FOR INCLUDING MEASUREMENT STUDIES AND MODEL STUDY TO UNDERSTAND
REAL PHENOMENA AND PREDICT FUTURE SITUATION (CHO AND OKI, 2012) .................................................... 28
TABLE 2.9 – MAIN CONCLUSIONS OF THE IPCC SCENARIOS PREDICTION.................................................................. 29
TABLE 2.10 – SCENARIO RESULTS FOR RICE PRODUCTION OVER THE THREE ECONOMICAL CATEGORIES GROUP COUNTRIES .... 30
TABLE 3.1 – FIELD SAMPLING DATA RESUME .................................................................................................... 37
TABLE 3.2 – SAMPLING DATES AND CORRESPONDING PHASE ................................................................................ 38
TABLE 3.3 – SPME EXTRACTION .................................................................................................................. 39
TABLE 3.4 – MASS OF RICE SAMPLES FOR SPME EXTRACTION .............................................................................. 39
TABLE 3.5 – SDE EXTRACTION ..................................................................................................................... 40
TABLE 3.6 – MASS OF COMPOSITE RICE SAMPLES FOR SDE EXTRACTION ................................................................. 41
TABLE 3.7 – GC PROGRAMMED METHOD ....................................................................................................... 42
TABLE 3.8 – THE VAN DEN DOOL/KRATZ RI FORMULA CALCULATION ..................................................................... 43
TABLE 3.9 – MOLECULAR IONS FROM HYDROCARBONS C8 TO C15 ......................................................................... 43
TABLE 3.10 – EMISSIONS MEAN X AND STANDARD DEVIATION SX OF POPULATION FROM EACH TREATMENT AND RESPECTIVE
RICE CYCLE PHASE.............................................................................................................................. 44
TABLE 4.1 – RICE CYCLE VOCS EMISSION PERFORMED BY SPME ANALYZED BY GC/MS (DB-5 COLUMN) ....................... 46

Influence of Abiotic Stress Factors on VOCs Emission from Portuguese Rice Paddy Fields Relation with increased Climate Change 2013
xvii
TABLE 4.2 - VOCS EMISSION ANALYZED GC/MS (DB-WAX POLAR COLUMN) ......................................................... 49
FIG 4.5 - GLV BETWEEN THREE PHASES (TE SAMPLE COMPARATION) WITH GC DB-WAX POLAR COLUMN...................... 50
TABLE 4.3 – GC COLUMNS RESULTS COMPARISON ............................................................................................ 51
TABLE 4.4 – T-STUDENT TEST CI95% RESULTS FOR ONE SAMPLE TEST (MEAN µ) WITH 95% OF CONFIDENCE DEGREE ........... 52
TABLE 4.5 - T-STUDENT TEST CI99% RESULTS FOR ONE SAMPLE TEST (MEAN µX) WITH 99% OF CONFIDENCE DEGREE ........... 53
TABLE 4.6 – INDEPENDENT SAMPLES T-TEST BETWEEN SAMPLE TREATMENTS ........................................................... 53

Influence of Abiotic Stress Factors on VOCs Emission from Portuguese Rice Paddy Fields Relation with increased Climate Change 2013
xviii

Influence of Abiotic Stress Factors on VOCs Emission from Portuguese Rice Paddy Fields Relation with increased Climate Change 2013
xix
Acronyms and abbreviations
°C degree Celsius 3-PGA 3-phospoglycerate AVOC Anthropogenic Volatile Organic Compound BVOC Biogenic Volatile Organic Compound C5 isoprene COTArroz Centro Operativo e Tecnológico do Arroz DB-5 non polar capillary column with 5% phenyl-95% methylpolysiloxane DB-WAX polar capillary column with polyethylene glycol DMAPP dimethylsiphospate E-nose Electronic nose EU European Union eV electric volt FAO Food and Agricultural Organization FCT – UNL Faculdade de Ciência e Tecnologia da Universidade Nova de Lisboa Fe iron FFCT Fundação para a Ciência e Tecnologia g/mol gram per mole GC gas chromatography GC/MS GC coupled with Mass Spectrometry GC-FID GC with Flame Ionization Detector GDP Gross Domestic Product GLV green leaf volatiles ID Inner diameter INIAV Instituto Nacional de Investigação Agrária e Veterinária IPCC Intergovernmental Panel on Climate Change IPP isopentenyldiposphate IRGSP Rice Genome Sequencing Project Kcal/cap/day kilocalories per capita per day Kt kilo tons LMC low molecular compounds LOX lipoxygenase m/z mass to charge MEP methyllerythritol phosphate MVA mevalonic acid MW molecular weight NERICA New Rice for Africa NO3 Nitrate O3 ozone OF open field OH hydroxyl radical OTC open tot chamber P phosphorus Pa Pascal PA polyacrilate PAN peroxyacetylnitrate PDMS polydimethylsyloxane

Influence of Abiotic Stress Factors on VOCs Emission from Portuguese Rice Paddy Fields Relation with increased Climate Change 2013
xx
pF water tension PI panicle initiation Ppb part per billion Ppbv part per billion of volume Ppm part per million PTR-MS proton transfer reaction mass spectrometry RI retention indices RuBPCO Ribulose bisphosphate carboxylase oxygenase SDE steam distillation extraction SOA Secondary Organic Aerosol SPME solid phase micro extraction SRES Special Report Emission Scenarios T/ha ton per hectare TE OF silty clay soil texture TEc OTC with induced temperature TECC OTC with simultaneous temperature and CO2 enhanced TIC total ion current TN OF loamy sand soil texture TWB the World Bank UNECE United Nations Economic Commission for Europe UTAD Universidade de Trás-os-Montes e Alto Douro VOC Volatile Organic Compound WDI World Development Indicators WDI World Development Indicators WHO World Health Organization μm micro meter
Influence of Abiotic Stress Factors on VOCs Emission from Portuguese Rice Paddy Fields Relation with increased Climate Change 2013
xxi

Influence of Abiotic Stress Factors on VOCs Emission from Portuguese Rice Paddy Fields Relation with increased Climate Change 2013
Introduction 1
1. Introduction
The combination of the importance of rice culture as a main staple food crop in the world, with
the raise of global population and increasing climate change effects due to higher temperature
and atmospheric CO2 concentration, will set a new valid topic of study – the interaction
between rice cycle gas emission and atmospheric chemistry. Rice plant response to abiotic
stress factors is expressed by releasing volatile organic compounds (VOCs) to atmosphere;
these compounds promote the secondary aerosol oxidation as well as are considered a
precursor of tropospheric ozone formation. The major goal of this thesis is to understand the
effect of VOCs emitted from rice paddy fields in Portugal, in open field under different
treatments as different soil characteristics, and open top chambers (OTCs) where abiotic
factors are induced as temperature enhancement and temperature together with atmospheric
CO2 concentration.
The motivation and data collected for the present thesis are part of the research project
PTDC/AGR-AAM/102529/2008 entitled “Trace gas emission from Portuguese irrigated rice
fields in contrasting soils, by the influence of crop management, climate and increased
concentration of CO2 and temperature in the atmosphere” – carry out by teams from three
Portuguese research institutions named: Instituto Nacional de Investigação Agrária e
Veterinária (INIAV); Universidade de Trás-os-Montes e Alto Douro (UTAD) and Faculdade de
Ciência e Tecnologia – Universidade Nova de Lisboa (FCT-UNL), in cooperation with Centro
Operativo e Tecnológico do Arroz (COTArroz).
The data collection covered the whole rice cycle, between May and October 2012, in COTArroz
paddy fields, Salvaterra de Magos, Portugal. In this scope a field scale data measurement has
never been done before. This work represents the first step in this domain. Laboratory
measurements from different rice plant parts, as roots, leaves and grain, studying abiotic and
biotic stresses were already performed. The identification process was difficult due to vestigial
emissions released by rice plant, when compared with other plants, as Pinnus spp. or
Eucalyptus spp. For that reason it was only possible to accomplish qualitative analysis from rice
VOCs profile.

Influence of Abiotic Stress Factors on VOCs Emission from Portuguese Rice Paddy Fields Relation with increased Climate Change 2013
Introduction 2
1.1 Research scope and objectives
This thesis aims to take further steps towards analyzing the impacts of gas emissions from
Portuguese irrigated rice fields with relation with climate change predictions, and it involves:
Understand the importance of main staple food crop – rice (Oryza sativa L.) – on global
economic, environment and cultural spheres;
Identify VOCs distribution among whole rice field cycle growing phases under different
treatments including different soil textures (silty clay and loamy sand) and different
abiotic conditions with increasing temperature and simultaneous temperature and CO2
atmospheric concentration enhanced. Analyse statistical data set significance;
Understand the effects of VOCs emission from rice field and their behaviour in climate
change forecast scenarios with increasing temperature and CO2 concentration.
1.2 Dissertation structure
The present dissertation is divided in the following chapters:
1. Introduction: details of research scope, main objectives and dissertation structure
2. Literature review: previous work developed in the scope
3. Materials and methods: description of materials used in sampling, extraction, analysis,
identification and data treatments methods
4. Results: presentation of results
5. Discussion: hypothesis formulation and their discussion
6. Conclusions: main outcomes and future research
7. References
Annexes

Influence of Abiotic Stress Factors on VOCs Emission from Portuguese Rice Paddy Fields Relation with increased Climate Change 2013
Literature Review 3
2. Literature review
2.1 Importance of rice culture
The nutritional properties assimilated by humans to their subsistence and welfare are crucial.
Good nutrition status is essential way to have an optimal physical and psychical life. The intake
of a right proportion of a big variety of food is necessary, varying from place to place and
depending on a geographical and cultural base. Rice is in charge of keeping nutritional safety
conditions to humans and is a main source of carbohydrates but has lower percentage of
proteins, fiber and lipids. However, it contains vitamin B1, B2 and B6 as well minerals and
natural antioxidants (AParroz, 2009).
Historically, China and India were the precursors of the rice production practices and varieties,
followed by the African continent. In Portuguese age of discovery (between 1415 – 1543) rice
expanded its production to Portuguese colonies, as Guiné – Bissau and Brazil, and also in
Spanish colonies of Central America (Kush (1997) in Figueiredo, 2011).
Nowadays, almost 120 000 different species of rice exists and the culture has extended to all
continents aside from cold polar zones. More common specie to grow is Oryza sativa L.,
divided on two subspecies: indica and japonica, depended on geographic position and
morphologic characteristics (AParroz, 2009). The indica type is usually associated with tropical
and subtropical zones (representing 80% of global production) (Mohanty, 2010) and japonica is
mainly found in temperate climate, Mediterranean, Norwest Asia, United States and some
European countries (Glaszmann (1987) in Figueiredo, 2011).
2.1.1 Global status
As a consequence of grow population in last years it is predictable that we will need twice
more food than expected, in the period between 2000 – 2025, when compared with 1960’s
(UNDP, 2010). Modification of land use to create more space and resources for agriculture
cannot expand more, and rice fields will increase not in occupied area or different
geographical location, but in consequence of intensive agricultural practices. Sustainable rice
agriculture management can be achieved by developing adequate water techniques to each
location with appropriate technology and applying efficient fertilization methods.
Rice, wheat and maize are the three biggest widely grown crops around the world. Fig. 2.1
shows that in the year 2004 rice was the staple food crop (crop that constitutes predominant
calories intake of a standard diet, 700 Kcal/cap/day or more) of about 3.23 billion people,
wheat of almost 1.55 billion and lastly maize was responsible for about 288 million (FAO,
2004). United States emphasized this fact by making 2004 as international year of rice.

Influence of Abiotic Stress Factors on VOCs Emission from Portuguese Rice Paddy Fields Relation with increased Climate Change 2013
Literature Review 4
Fig. 2.1 – World population in 2004 based on staple food crops calculated from data available in FAOSTAT (Source: FAO, 2004)
In the 21st century rice harvested area was approximately 152 million ha (Mohanty, 2010),
including multiple cropping and their frequency, i.e. how much times crop can be produced in
the same land. Literature analysis (AParroz, 2009; Figueiredo, 2011; FAO 2012) and world map
in Fig. 2.2 are matching with the blue and violet colour meaning half or more of country area
occupied by rice. Fig. 2.2 shows higher rates of yield improvements in Southeast Asian
countries and some Latin America ones.
Fig. 2.2 – World map overview of countries with higher (blue colour) and lower (orange colour) rice area harvested/total crop area harvested (Source: Mohanty, 2010)
Global rice production more than tripled between 1961 and 2008 at average annual growth
rate of 2.49% (Mohanty, 2010).

Influence of Abiotic Stress Factors on VOCs Emission from Portuguese Rice Paddy Fields Relation with increased Climate Change 2013
Literature Review 5
Table 2.1 presents the major production of rice, more than 90% (FAO (2010) in Figueiredo,
2011), is associated to the Asian continent, where China and India are the key producers and
the smallest production is in Oceania due to agricultural land available space. Second continent
is America, with Brazil as a main producer and in Africa the most important producer country is
Egypt.
Table 2.1 – Country range of rice production (tones and percentage), occupied area (hectares and percentage) and productivity in the year 2009
Continent
/Country
Production
(106 t)
Area
(106 ha)
Harvested
area (%)
Global
production (%)
Productivity
(t/ha)
Asia 611 143 88.8 90.1 4.36
America 38.2 7.30 4.50 5.60 5.25
Africa 24.4 10.0 6.20 3.60 2.44
Europe 4.10 0.70 0.40 0.60 6.14
Oceania 0.30 0.00 0.00 0.00 8.03
China 197 29.9 18.5 29.1 6.59
India 131 44.1 27.3 19.3 2.98
Indonesia 64.4 12.9 8.00 9.50 5.00
Bangladesh 45.1 11.5 7.10 6.60 3.92
Vietnam 38.9 7.40 4.60 5.70 5.23
Taiyuan 31.5 11.0 6.80 4.60 2.87
Brazil 12.6 2.90 1.80 1.90 4.37
Japan 10.6 1.60 1.00 1.60 6.52
USA 10.0 1.30 0.80 1.50 7.94
Egypt 7.50 0.80 0.50 1.10 10.0
Global 678 161 100 100 4.20
(Source: FAO (2010) in Figueiredo, 2011)
Rice is grown on both small and large farms. The extent are generally smallest in Asia and
Africa (both continents with higher production), less than 1 ha size. European continent vary
from 3.90 ha in Greece to 40 ha in Italy. In Latin America farms have a tendency to be larger

Influence of Abiotic Stress Factors on VOCs Emission from Portuguese Rice Paddy Fields Relation with increased Climate Change 2013
Literature Review 6
but less than 5 ha, except Uruguay (276 ha) and United States (160 ha) (IRRI, 2013b). The
heterogeneity within regions and between countries results from a range of production
factors, such as: technology used, water regime, amount of rainfall, soil characteristics,
climate, cultural practices and others. However, genetic manipulation creates good advantages
for plant agrosystem adaptation. Rice genome sequences were completed in 2005 by
International Rice Genome Sequencing Project (IRGSP, 2008).
2.1.2 Economics
No country has been able to sustain a rapid transition out of poverty without raising
productivity in its agricultural sector. This process involves a successful structural
transformation providing food, labour and savings (Mohanty, 2010). The World Development
Indicators (WDI) published, by the World Bank (TWB), that agriculture contributed more than
10% of global Gross Domestic Product (GDP) in 1961, but nowadays agriculture is responsible
of about 3% of economic output (FAO, 2012).
The rice consumption, in many cases/countries, is done on the original country that is
produced. It represents a low importance on trade international market, with only 7 - 8% of
total production is transactional (FAO, 2012). Fig. 2.3 shows that rice is the cereal with the
highest price per tonne (600 USD/t) in the beginning of 2013 (FAO, 2013), almost the double
than maize (300 USD/t) and wheat (350 USD/t) (FAO, 2013).
Fig. 2.3 - Trend of the three main cereal prices (USD per cereal tonne) since 2011 to first two months of 2013. Prices referred monthly average (Source: FAO, 2013)
Economics of rice global situation will be one of the big discussion topics on the First
International Conference of Food Security to be held this September and October of 2013, in
Noordwijkerhout, the Netherlands. It aims better understand the drivers of current and future
food security system and the trade-offs between competing environmental, economic and
social objectives and outcome (International Conference on Food Security, 2013).

Influence of Abiotic Stress Factors on VOCs Emission from Portuguese Rice Paddy Fields Relation with increased Climate Change 2013
Literature Review 7
2.1.3 Ecological advantage
Rice wetlands create habitats containing an appreciate number of fauna and flora species,
contributing for biodiversity of the region. About 86% of rice flooded lands for at least part of
the year has the big ecological function, such as surrogate seasonal migrating, wintering and
nesting spot for water birds species, including waterfowl, shorebirds, wading birds (Fig. 2.4 a),
and land birds (Taft and Elphick, 2007).
The vegetation roots growing in rice fields are important foraging resources, the presence of a
large number of aquatic in- and vertebrates organisms (fishes, reptiles and amphibians) (Fig.
2.4 b), plays an important role on regulation and biologic control of pest and infestations (Taft
and Elphick, 2007).
Around rice ecosystems areas, not only rice crop grows, but also maize, wheat, ryes are
cultivated as well as vegetables and fruits are produced (INIAV, 2013b).
2.1.4 Rice culture in Portugal
More than 60% of rice produced in EU is from japonica subspecies and indica subspecies just
takes place in Spain and at a smaller scale in Greece (INIAV, 2013b). In Portugal japonica
represents about 70% of total national production, which is explained by climate
characteristics of growing rice in paddy (INIAV, 2013b).
Portugal is the fourth biggest rice producer (18.2×10⁶ t) in the 27 European Union countries
(Table 2.2). Italy has the first place (150×106 t), followed by Spain (93×106 t) (FAO, 2011). Rice is
the sixth main crop produced in Iberia Peninsula (Portugal and Spain).
Fig. 2.4 – Rice ecosystem landscape a) Flock of stroks (Source: AParroz, 2009) and b) Crayfish in rice soil substrate in COTArroz paddy fields, Salvaterra de Magos

Influence of Abiotic Stress Factors on VOCs Emission from Portuguese Rice Paddy Fields Relation with increased Climate Change 2013
Literature Review 8
Portugal is the first per capita consumer with 18 kg/year in Europe (INIAV, 2013b), being
consumed 60% in the north and 40% in the South. Main rice farms are located in Sado, Tejo
and Mondego river valleys, covering Alentejo, Ribatejo and Beira Litoral regions, respectively.
Table 2.2 - Range of fifth main EU rice producers in the year 2011
Country Production (106 t) Area (106 ha)
Italy 150 24.6
Spain 92.9 12.1
Greece 24.4 3.23
Portugal 18.2 3.12
France 13.2 2.50
(Adapted from: FAO, 2012)
2.2 Rice plant
Rice is an angiosperm plant, belonging to Ponocea family (Wells, 2003). Morphologic
constituents are divided in roots, stem, leafs and panicle (Fig. 2.5). The panicles keep the
spikelet and this will form rice grain.
Fig. 2.5 - Rice plant constituents (Source: IRRI, 2013a)

Influence of Abiotic Stress Factors on VOCs Emission from Portuguese Rice Paddy Fields Relation with increased Climate Change 2013
Literature Review 9
Life cycle of rice cultivars under irrigated systems ranges from 110 to 165 days from
germination to maturity, depending on the variety and environment conditions (Wells, 2003).
On Mediterranean land this period occurs between May and mid of October.
Fig. 2.6 presents the three main agronomic rice development phases: vegetative (germination
to panicle initiation (PI)); reproductive (PI to heading), and ripening (heading to maturity).
Fig. 2.6 – Example of growth phases of rice plant (Source: IRRI, 2013b)
The duration of vegetative phase differs on rice variety, but reproductive and ripening phases
are common between variety types (IRRI, 2013b).
Rice is consumed mainly in the grain form. Table 2.3 presents the classification of rice by size
(length) and the relation between length and width of the grain. Short, medium and long
categories are following Portuguese legislation (INIAV, 2013b).
Table 2.3 – Classification of commercial rice by grain size
Commercial
Classification
Size (length
mm)
Relation
(length/width)
Type/
Varieties
Short (Round) ≤ 5.2 ≤ 2.0 Bomba; Paella rice.
Medium 5.2 – 6.0 ≤ 3.0 Sushi rice; Risotto rice.
Long > 6.0 > 3.0 Carolino; Agulha; Basmati.
(Adapted from: Figueiredo, 2011)

Influence of Abiotic Stress Factors on VOCs Emission from Portuguese Rice Paddy Fields Relation with increased Climate Change 2013
Literature Review 10
In Portugal, long rice is consumed in larger quantities in different varieties proportion, 72% is
Carolino, 27% Agulha and 1% belonging to other types like sushi rice (INIAV, 2013b).
Rice can be distinguished from other cereals that are just consumed after transformation
processes. The only physical process is whitening the rice grain and this can cause losses of
mineral salts, vitamins and fiber (Figueiredo, 2011). “Whiteness” can be divided in three types:
white (polished rice obtained after process of bleaching); brown (richer in vitamins and fiber)
and middle rice (partially removed the shell) (Mahanty, 2010).
The number of complete rice cycle days and respective rice form are depended on the location
and the rice cultivation systems (Wells, 2003).
2.2.1 Cultivation systems
Rice systems can be characterized by water source in irrigated and rainfed rice. Fig. 2.7 shows
the area occupied on Asian continent by both systems. Rainfeed rice system can be
distinguished between lowland, upland/dryland and deepwater rice (Mahanty, 2010).
Fig. 2.7 - Irrigate vs. rainfed rice in Asian continent (Source: Huke (1997) in Wassmann et al., 2009)
Irrigate rice grows using water supplies to reinforce rainfall and natural runoff via human-
made surface irrigation systems. There exists a greater control for reducing risks associate with
drought. More than 75% of the world’s rice (FAO, 2012) are produced under irrigated systems,
and about 48% of irrigate systems grow more than one crop (multiple cropping) combining rice
– wheat, rice – oilseed and rice – ryegrass (Mahanty, 2010).
Rice plant is submerged around 80% of the time (Mahanty, 2010) during vegetative phase.
Rainfed rice uses only rainfall and natural runoff. In general, farmers applied less fertilizer in
rainfed than in irrigated rice (Figueiredo, 2011).
Fig. 2.8 presents temperature and precipitation data in Portuguese rice paddy fields during the
standard rice cycle course. Monthly average temperature oscillated around 13 and 21 ⁰C. The
precipitation values are higher in autumn.

Influence of Abiotic Stress Factors on VOCs Emission from Portuguese Rice Paddy Fields Relation with increased Climate Change 2013
Literature Review 11
Fig. 2.8 – Meteorological characteristics in Salvaterra de Magos during the rice cultural
cycle of 2012 (P = Accumulate monthly precipitation, mm; T med/green circles = Monthly average air temperature, ⁰C; red triangles = Maximum temperature, ⁰C, and
blue squares = Minimum temperature, ⁰C) (Adapted from: INIAV, 2013a)
Between April and October, normally at temperate Mediterranean climate, any extreme event
is observed. Rice systems are chosen according with environmental climate characteristics of
each region (Mohanty, 2010).
2.2.2 Influent stress factors
Rice is produced on a big variety of climates, within higher precipitation zones, more than 5
100 mm, and in lower ones with less than 100 mm. Altitude is also a determinant factor but
rice can be found from 3 m to high altitudes over 3 000 m (Krishnan et al. (2011) in Figueiredo,
2011).
Rice culture depends on external abiotic and biotic factors. The biotic factors cover all intra-
and interspecific interactions exchanging actions of attraction, defence, attack and mutual
gain. The abiotic ones described below are: soil characteristics; wind intensity and direction;
sun radiation; water and temperature and CO2 concentration in atmosphere.
2.2.2.1 Soil characteristics
Soil profile influences water infiltration. Rice plant has good adaptation to different kinds of
soils. Fig 2.9 presents the relation of water content in clay and sandy soils, where water moves
from low tension (pF) for high tension. Clay soil particles are colloidal (smaller than 0.05 µm)
electrically charged. Those characteristics permit water and nutrient storage (line on right side
chart in Fig. 2.9), but above pF=2 water tension, it is difficult for roots to extract the needed
contents. A pure sandy soil, are less common for crop cultivation due to holding a little portion
of water (large dimension of particles, from 0.02 – 2 mm) (IRRI, 2013b).

Influence of Abiotic Stress Factors on VOCs Emission from Portuguese Rice Paddy Fields Relation with increased Climate Change 2013
Literature Review 12
In Europe, particularly in Portugal, the rice cropping practices are mainly by flooding/irrigation
systems (Maes and Derbergh, 2001). Sandy soils are well drained and aerated, making easier
for submersible control than clay ones. Sandy soils become productive for rice cultivation if
water and nutrients are correctly supplied. To gain perform rice yields, loamy soils are suitable
(see soil textures proportions in annexes T1) (IRRI, 2013b).
2.2.2.2 Temperature and atmospheric carbon dioxide concentration
Rice response to temperature is dependent on its stage (Cho and Oki, 2012). The vegetative
period is normally more sensitive to extreme temperatures variation when compared to other
growing phases (Table 2.4).
Table 2.4 - Optimal, minimal and maximal temperatures (°C) during rice growing phases
Growing phases Optimal temp. (°C) Minimal temp. (°C) Maximal temp. (°C)
Vegetative 25-28 15 35
Reproductive 27-33 20 38
Ripening 20-25 12 30
(Adapted from: Figueiredo, 2011)
Fig. 2.9 – Characteristics of sand and clay soils towards tension and water content variation (Source: IRRI, 2013b)

Influence of Abiotic Stress Factors on VOCs Emission from Portuguese Rice Paddy Fields Relation with increased Climate Change 2013
Literature Review 13
Rice is consider a C3 plant, that uses metabolic pathway for carbon fixation only in Kalvin
Cycle, this process transforms CO2 and enzyme ribulose bisphosphate carboxylase oxygenase
(RuBPCO) into two units of 3-phosphoglycerate (3-PGA), essential sugar during the
photosynthesis process. C3 plants, as rice, prefer moderate temperatures and optimum
photosynthesis rate is gain under CO2 concentration around 300 ppm or higher (Dudareva et
al., 2013). Rice has low photosynthetic efficiency at hot dry conditions, caused by
photorespiration – instead of fixing carbon the plant start to fix oxygen (Nomura et al., 2000).
Biochemically, higher CO2 concentration stimulates increase on RuBPCO and photorespiration
is reduced (Nomura et al., 2000).
Temperature and CO2 atmospheric concentration conditions, separately, have higher influence
on rice grain yield. Generally, with increasing temperature, yield declined 10% for every degree
⁰C above the optimal one. The japonica type during the vegetative stage (Nomura et al., 2000),
at mean temperatures around 36 ⁰C, will have zero grained yield, explained by pollen sterility
effect. According with Boote et al. (2005), doubling CO2 atmospheric concentration, rice grain
size and biomass increased by 25 to 32% due to a greater number of reproductive sites
(panicles).
2.2.2.3 Wind
Wind direction and velocity does not play a main role on rice growth, but can influence crop
production as physiological and mechanical impact, e.g. if the plant does not yet have a deep
root or if in earliest stages extreme wind storm events happen, it can damage and break the
steam or, in worst cases, cause the death of plant. Beneficial impact can also result like a good
balance of hormones. The moderate wind turbulence in surrounding environment creates a
good supply of CO2 levels to the plants resulting in larger photosynthesis rates (TNAU, 2013).
2.2.2.4 Sun Radiation
Light energy is an important factor in rice plant during all its stages (e.g. for seed germination,
leaf expansion, stem growth and also influences nutrient assimilation) (FAO, 2004). If rice
passes through extensive shade periods in maturation/ripening stage the grains will stop to be
filled. On irrigates fields sun reflection helps to develop an optimum plant population and
increase its yield production (IRRI, 2013c).
2.2.2.5 Water
Water creates the environment for rice cultivation, and it is responsible for many functions as
regulation of temperature in soil and water surface, pest defence repelling pathogenic attacks
and in flooded areas water increases heat capacity of soil (heat capacity of water is 23 times
higher than the air) (IRRI, 2013c). The tallest of rice plant has direct relation with the water
slide and it can make a big impact on plant hardness and mainly on panicle resistance.

Influence of Abiotic Stress Factors on VOCs Emission from Portuguese Rice Paddy Fields Relation with increased Climate Change 2013
Literature Review 14
Reduced availability of water during vegetative stage will delay the period of panicle initiation
by 10 to 20 days (Lansigan et al., 2000), consecutively increased the proportion of unfilled
grains along the maturation process and can reduce 1000 times seed weight (Lansigan et al.,
2000). Water stress change morphological and physiological measurements like tiller number,
photosynthetic rate, leaf area index, leaf nitrogen, roots and shoot biomass and density.
Positive multifunctionality from water management of flooding rice farming is possible. Next
to rivers deltas, water released from the flooded rice area can be used in the downstream
delta areas and it contributes largely for water quality and salinization control at the beginning
of dry season (TNAU, 2013).
2.2.3 Chemical responses to stress factors
Plants produce a large variety of chemicals (Mateus, 2008). They can be divided in two
metabolisms, primary – essential and direct involved on plant grow – and secondary ones –
not related with primary functions and restrict to certain plant taxa involved on competition
and reproduction functions (Dudareva et al., 2013).
Stress in plants can be defined as any change in growth condition that disrupts metabolic
homeostasis (equilibrium of plant functions) and requires process of acclimation (Spinelli et al.,
2011). Stresses are rarely happen singularly, they often occur in combination. Responses to
stress factors are made by secondary metabolism – emitting chemical odour signals to the
atmosphere – usually called Volatile Organic Compounds (VOCs).
2.3 Volatile Organic Compounds
The VOCs are organic compounds that are gaseous in atmospheric conditions. They have a
molecular weight, usually lower than 300 g/mol, and high vapour pressure at ambient
temperature (upper than 130 Pa at 20 °C). The physical parameters of these compounds allow
them to freely cross low atmosphere/troposphere (Dudareva et al., 2013).
VOCs can be divided in anthropogenic VOCs (AVOCs) and biogenic VOCs (BVOCs), depending
on the emission source. AVOCs can be released from two types of fonts, stationary and diffuse.
The stationary ones, as fuel industries, domestic uses, sludge treatments on wastewater
treatment plants and waste disposal sites, have almost the same environmental impact than
diffuse ones, based on fossil fuel burned out motors. From biologic sources, BVOCs are
released from diffuse sources as forests and agricultural fires (burning biomass), biochemical
soil reaction, but the main source is focusses on the emission from vegetation (Schirmer and
Quadros, 2010).
Dudareva et al. (2004) found that the formation of VOC can be regulated at the gene
expression – VOCs biosynthesis normally occurs in the epidermal cells of plant tissues, or in
glandular trichomes in secretory structures like found on plant genera Artemisia annua
(peppermint) and Ocimum basilicum (Dudareva et al., 2004). There are two types of VOCs in

Influence of Abiotic Stress Factors on VOCs Emission from Portuguese Rice Paddy Fields Relation with increased Climate Change 2013
Literature Review 15
plants: stored VOCs – volatized into the atmosphere by healthy unwounded plants; and
induced VOCs – emitted hours or days after a stimuli or stress from both, stressed and
undamaged plant leaves, having defenced and attraction functions (Spinelli et al., 2011).
The major difference on emission of VOCs between plants depends on the species, developing
plant stage, released plant organs (Rinne et al., 2009) and quantities of a particular VOC mainly
depends on the rate of its biosynthesis – availability of substrate, level of stress induced and
energy provided by primary metabolism (Dudareva et al., 2013).
2.3.1 VOCs main classes
VOCs are a very heterogeneous group of compounds including alkenes, alkanes, carboxilic
acids, nitrogen-containing compounds and alcohols, and there are three main dominating
group compounds named terpenes (including mono- and sesquiterpenes) and green leaf
volatiles (GLV) (Spinelli et al., 2011).
2.3.1.1 Terpenes
Terpenes are a class of unsaturated hydrocarbons from biological origin and can be named
essential oils of plants (Khor and Uzir, 2010).
Terpenes constitute the biggest and varied biochemical class of secondary metabolites derived
from two common C5 five-carbon constituents, singular C5 is named isoprene. Two separated
pathways, mevalonic acid (MVA) and methyllerythritol phosphate (MEP) are involved in their
synthesis (Dudareva et al., 2013). MEP pathway links two C5 units producing C10 –
monoterpenes. MVA pathway originates three units of C5 creating volatiles C15 –
sesquiterpenes and four C5 units forming C20 – diterpenes (Rinne et al., 2009). Table 2.5
presents the combination of carbon and hydrogen atoms of each terpene and their chemical
formula.
Table 2.5 – Isoprene units, carbon and hydrogen atoms and chemical formula of different terpenes
Terpenes Isoprene units Carbon atoms Hydrogen atoms Chemical formula
Monoterpene 2 10 16 C10H16
Sesquiterpene 3 15 24 C15H24
Diterpene 4 20 32 C20H32
Sesterpene 5 25 40 C25H40
Triterpene 6 30 48 C30H48
Carotenoid 8 40 64 C40H64
(Source: Coutinho et al., 2009)

Influence of Abiotic Stress Factors on VOCs Emission from Portuguese Rice Paddy Fields Relation with increased Climate Change 2013
Literature Review 16
Mono- and sesquiterpenes are more commonly present in the oils, these two groups can be
considered a separate classes, where sesquiterpenes are typically fragrances emitted from
flowers, and other ones as iso- and diterpenes are usually associated with balsams, resins,
waxes and rubbers (Khor and Uzir, 2010; Spinelli et al., 2011). Essential oils normally present
polycyclic structures (Fig. 2.10) with C=C double bounds. To date, 55 000 terpenes have been
isolated (Khor and Uzir, 2010) and the trend is doubling each decade.
Fig. 2.10 – Examples of mono – and sesquiterpes polycyclic structures (source: NIST 08, 2013)
2.3.1.2 Green Leaf Volatiles
Most of the plants have a similar response to artificial damage, such as wounding, drying or
freezing (Harren and Cristescu, 2013). Physiological relation was established with the rapid
formation of C6 (six carbon compounds), so-called green leaf volatiles (GLVs). These
compounds are produced via the lipoxygenase (LOX) pathway and are responsible for 50% of
the emissions, within a few seconds, from plant parts after damage (Harren and Cristescu,
2013). Chemically, GLVs are mostly saturated or monosaturated aldehydes, alcohols and esters
(Legendre et al., 1978). Table 2.6) shows the name and structure of main GLV.
(Source: Mateus, 2008)
α pinene caryophyllene limonene
Table 2.6 – Structure of main Green Leaf Volatiles

Influence of Abiotic Stress Factors on VOCs Emission from Portuguese Rice Paddy Fields Relation with increased Climate Change 2013
Literature Review 17
2.4 VOCs study
The characterization of volatile fraction emitted by plants is a “dynamic process” sequenced by
VOCs extraction, analysis and identification. Presents section explains the main techniques
used.
2.4.1 Extraction techniques
Solid phase microextraction (SPME) is an efficient extraction technique for plant VOCs
collection introduced by Janusz Pawliszyn, in the early 1990’s (Zini et al, 2002). Several studies
have been reported that applied the SPME method due to its high sensitivity, solvent free
sample preparation, non-invasive, rapid operation and small amount of sample needed (Maes
et al., 2001; Zini et al, 2002; Mateus, 2008; Santana, 2009; Zeng et al., 2011).
The heart of the SPME technique is a fibre coated by an adsorbent/absorbent polymer which
extracts the analytes, due physical interactions. The extraction of analytes can be performed
on liquid or gaseous phases. The fibre is attached to a stainless steel pluger and is assembled
on a syringe-like holder (Mateus, 2008). Fig. 2.11 illustrates constituent parts of a standard
SPME system.
Fig. 2.11 – Constituent parts and detail of a standard SPME system (Source: Chromedia, 2013)
For efficient extraction the analytes must have an affinity to SPME fibre. The principle of SPME
technique is based in the equilibrium establishment between the analytes and fibre (Zeng et
al., 2012). Optimization and reproducibility of the extraction can be achieved by controlling the
polarity and thickness of the coating of the fibre and parameters such as operational
temperatures, stirring, and extraction time (e.g. constant sampling time for all extractions)
(Chromedia, 2013).
Influence of Abiotic Stress Factors on VOCs Emission from Portuguese Rice Paddy Fields Relation with increased Climate Change 2013
Literature Review 18
The selection of a fibre coating depends on factors that promote the best efficiency of
adsorption/absorption process, such as molecular weight and analyte size, analyte’s and fibre
polarity (Chromedia, 2013). The most used fibres, considered as having a good efficiency for
headspace VOCs extraction, are polydimethylsyloxane (PDMS) and polyacrilate (PA) (Parreira
and Cardeal, 2005). In order to improve the efficiency of SPME, some mixed coatings, with
complementary characteristics from PDMS and PA, have been developed to produce more
selectivity of certain compounds and stronger retained analytes (Parreira and Cardeal, 2005)
(see recommended applications of usual polymer coating fibres in annexes T2).
Steam distillation extraction (SDE) technique is also a good method for achieving the extraction
of volatile compounds from solid matrices (Parreira and Cardeal, 2005). It involves the steam
distillation of plant materials, with sequential trapping of the volatiles in the solvent. The
solvent used must be immiscible with water in order to achieved two phases (Godefroot et al.,
1981).
2.4.2 Analytical techniques
Gas chromatography (GC) is an effective separation method for the qualitative and
quantitative VOCs analyses. The inherent principle behind GC techniques is based on the
partition of the analytes between an inert carrier gas, the mobile phase, and a solid or liquid
stationary phase, that is placed inside the column (Mateus, 2008).
GC mass spectrometry (GC/MS) technique is used for separation, analysis and identification of
volatile and semi volatile compounds. The sample molecules after eluting from analytical
columns enter into a vacuum chamber where they are ionized in the ion source. The resulting
ions are then separated depending of their m/z (mass to charge) ratio in the mass analyzer and
processed into detector. Detector produces a total ion chromatogram and mass spectrum for
each peak with intensity of ions vs. their m/z (Mateus, 2008).
There are four injection techniques in GC: split, splitless, direct and on-column injection. The
first two techniques (see results comparison in annexes F1 and F2) are the most used. Split
mode is used for high sample concentrations where a portion of sample is discarded during the
injection process through to split vent (RESTEK, 2013). The splitless mode, where all the
sample is introduced to the column, is used for trace level analysis (Mateus, 2008). Sample
polarity and temperature limits of compounds elution are important concerns to take into
account for correct choice of the injection mode (RESTEK, 2013).
In the GC technique, the column plays the most important role. The principle is that analytes
like to interact with stationary phase of a similar chemical nature (Agilent Technologies, 2013)
(main stationary phases are presented in annexes T3). The capillary GC columns, made by inert
fused silica material, provide very good separation efficiency (narrowed and separated peaks)
with lower sample amounts, short column length and brief runs (Mateus, 2008). Around 90%
of separation problems can be resolved by doing the separation using columns with different

Influence of Abiotic Stress Factors on VOCs Emission from Portuguese Rice Paddy Fields Relation with increased Climate Change 2013
Literature Review 19
phase polarities (e.g. polar and non-polar) (Mateus, 2008).
Film thickness also influences retention and maximum operation temperature of the column.
Thick films (1 to 5 μm), promoting higher residential time in the stationary phase, are used for
the separation of compounds with higher volatilities, due to better peak resolution (Agilent
Technologies, 2013). Fig. 2.12 illustrates whole GC/MS system process.
Different methods have been used for trace gas detection and analysis of rice plants. Instead
of GC/MS analyses, proton transfer reaction – mass spectrometry (PTR-MS) has enable
monitoring VOC emissions in a more comprehensive way, detecting stable isotopes from
various chemical groups, with online real-time capability to distinguish, in the order of
seconds, at (sub)part per billion levels, isoprene molecules (Rinne et al., 2009; Harren and
Cristesu, 2013).
Gas chromatography – olfactometry (GC-O) uses human nose as a detector and can be
employed to determine whether a particular volatile, eluting from GC, has aroma activity
(Mahattanatawee et al., 2005). Technique sensitivity depends on the experience from the
professional and on the different concentration levels of VOC (Mahattanatawee et al., 2005).
Fig. 2.12 – GC/MS equipment layout (Source: Ginsbach et al., 2010)

Influence of Abiotic Stress Factors on VOCs Emission from Portuguese Rice Paddy Fields Relation with increased Climate Change 2013
Literature Review 20
Recent studies also applied the electric-nose (E-nose) technique for detection of VOC profiles.
This technique is more used for studying different degrees of insect damage and storage time.
The E-nose system do not detect individual compound, although, it is used to identify a wide
range group of volatiles, with rapid, sensitive, non-destructive and easy management (Zhou
and Wang, 2011). The big advantage of this technique is the efficient discrimination and
prediction power without requiring any specific tuning or refinements for optimizing
performance (Zhou and Wang, 2011).
2.4.3 Rice volatile profile studies
Zhou and Wang (2011) used the Electronic-nose multisensory technology (E-nose) and GC/MS
to discriminate between volatile profiles, emitted from infested and uninfested rice plants by
Nilaparvata lugens, an herbivorous insect common named brown planthopper, and for VOCs
identification. In total they identified 23 VOCs emitted by infested plants, and that amount was
3.37, 3.36 and 6.57 times larger than in uninfected control rice. Fig. 2.13 shows the growing
trend of VOCs intensification with ascendant number of insects in rice samples, during first two
hours after infestation.
Yuang et al. (2008) studied the rice plant defence against Cotesia marginiventris, a rice
parasitoid, using SPME followed by GC/MS analysis technique, found a total of 28 volatile
compounds, where 11 were terpenes. The most abundant compound was linalool and a few
sesquiterpenes as zizimbrene and sesquipellandrene. After stress stimuli, plant released just
few unclear peaks and breakthrough the time a large number of mono- and sesquiterpenes are
came out.
VOCs emission from unprocessed rice grain was study to prove interaction/attraction between
Oryza sativa L. and rice field rats (Rattus rattus mindanesis) (Bullard and Holguim, 1977). A
total of 73 compounds were identify, mostly alcohols, aldehydes, ketones and terpenes.
Fig. 2.13 – VOC profiles collected from un- and infested rice plants samples; pest 0 (without infestation); pest 5 (five insects); pest 10 (ten insects) and
pest 40 (forty insects) (Source: Zhou and Wang, 2011)

Influence of Abiotic Stress Factors on VOCs Emission from Portuguese Rice Paddy Fields Relation with increased Climate Change 2013
Literature Review 21
Yatsumatsu et al. (1966) in Maga (1984) studied VOCs associated with cooked rice and found
out a range of monoterpenes, including limonene and cymene.
A large range of GLV was found by Legendre et al. (1978) in commercial rice grain.
Buttery et al. (1983) in Maga (1984) identified aldehydes and alcohols in scented rice without
any application of induced stress factors.
Zeng et al. (2011) investigated flavour components from rice bran (a by-product of rice milling)
and a total of 43 out of 76 compounds were identified belonging to esters, alkanes, alcohols,
ketones, aldehydes and fatty acids.
Studies were performed to measuring other forms of rice emissions, i.e. parcels of rice
constitution in other products. As an example, volatile flavour of commercial rice cakes and
also from backed in laboratory (differing in proportion of brown rice grain and wheat flour
pastas added) were studied by Butery et al. (1999). In total they found 60 compounds, the
major compositions were aldehydes and ketones.
VOCs emissions from soil textures were also studied. Wheatley et al. (1996) used GC/MS and
identified a total of 35 VOCs in the headspace of a silty clay soil (without testing any plant
growth). They concluded that VOCs are depending from nutrient addition into soil. Bastos and
Magan (2007) used E-nose system to identify VOCs composition under different temperatures
and water potential, between three soil textures loamy sand, calcareous clay and volcanic ash.
Most of VOCs were alcohols, ketones and aldehydes. Their conclusions point that identification
of volatile profiles responses can help to understand some cause – effect dealings between
agricultural crop areas (with different soils textures) and environmental stresses.
2.4.4 VOCs specific meanings and aroma correspondence
VOC profiles collected from agricultural field system possess all necessary condition to be
translated into cause-effect relations of plant defence against external abiotic or biotic stress
(Dudareva et al., 2013).
Table 2.7 describes the assumed meanings of main representative VOCs found in natural
systems (Michael et al. (1978) in Maga, 1984; Rinne et al., 2009; Harren and Cristescu, 2013;
and Dudareva et al., 2013). All aroma descriptions are based in assumptions from the study
performed by Mahattanatawee et al. (2005).

Influence of Abiotic Stress Factors on VOCs Emission from Portuguese Rice Paddy Fields Relation with increased Climate Change 2013
Literature Review 22
Table 2.7 – Assumed meaning and aroma descriptor of main VOCs
VOCs Assumed meaning Reference Aroma
descriptor
3-hexenol
After wounding or physical
damage has antibiotic
properties and inhibit the
invasion of bacteria and other
microorganisms into damage
tissues – Defence
Harren
and
Cristescu,
2013
Green
fruity
2–hexenal
Precursor in the degradation
process of plant – storage
condition
Michael
et al.,
1978 in
Maga,
1984
Fruity
β–
caryophylene
Improve plant defences below-
ground attracting
entomopatogenic nematodes
that kill root pests – Defence
Dudareva
et al.,
2013
Fruity
warm
floral
α-copaene
Attract male Mediterranean
fruit flies – Intra – specie
interaction
Maes and
Debergh,
2003
-
limonene
Produced by storage pools in
leafs is related with
photosynthetic efficiency/yield
– environmental condition
Rinne et
al., 2009
Fruity
floral
lemonate
linalool
Attract predatory mites that kill
other upper leafs herbivores –
Defence
Dudareva
et al.,
2013
Sweet
floral
n-octanal, n-
nonanal and
n-decanal
Contribute for pollinators
attraction – Intra – specie
interaction
Dudareva
et al.,
2013
Meaty
oily and
metallic
green
herbal

Influence of Abiotic Stress Factors on VOCs Emission from Portuguese Rice Paddy Fields Relation with increased Climate Change 2013
Literature Review 23
2.5 VOCs, rice and climate change scenarios
This section describes a correlation between VOCs influence on air chemistry and behaviour of
rice VOCs emission in climate change scenarios prediction.
2.5.1 VOCs influence on air chemistry
VOCs are considered one of the major precursors of photochemical oxidants in atmosphere,
e.g. ozone (O3) and peroxyacetyl nitrate, in presence of sunlight (equation 1.1).
Oxygen + VOCs + sunlight = tropospheric ozone (equation 1.1)
Warmer and sunny locations tend to net formation of tropospheric O3 (Hobbs et al., 2004). In
human population the main complains have been recognized as eye, nose, throat irritation and
potential mood or memory effects. Increasing ozone concentrations in troposphere, besides
being the big component of smog, can also cause stress to vegetation, in case of agriculture is
visible in crops yield welfare (Hobbs et al., 2004).
The average concentration of tropospheric O3 level had doubled in the past 100 years (NASA,
2013), and there is a tendency of increasing peak concentration events. The World Health
Organization (WHO) established the quality standard limit of O3 concentration in 100 µg/m3
(measured in 8 hours average). But this legislation limits were frequently exceed, at least in
2003 and again in 2006, for more than 50% of European urban population (Steinbrecher et al.,
2009).
Upper-left quadrant in Fig. 2.14 shows VOCs participation in aerosol growth and formation
process, named secondary organic aerosol (SOA) with Dp < 100 nm (Matsumoto, 2013).
.
Fig. 2.14 - Relation between VOC sources emission, molecular size
and climate reaction (source: Riipnen et al., 2012)

Influence of Abiotic Stress Factors on VOCs Emission from Portuguese Rice Paddy Fields Relation with increased Climate Change 2013
Literature Review 24
VOCs react with O3, hydroxyl (OHx) and nitrate (NOx) radicals, as the reaction products have
lower volatility and thus condense into aerosol particles. O3 can be abundant during both day
and night (Riipnen et al., 2012). VOCs also compete with methane (CH4) for OHx. Have
influence on CH4 lifetime and concentration due to the high reaction coefficients (Matsumoto,
2013).
The BVOCs are more reactive in atmosphere than AVOCs (Rinne et al., 2009). Little research
has been performed to define mass or type of chemical species originating from agriculture
and livestock emission. Heterogeneity of low molecular weight (LMW) propriety (Fig. 2.15) has
a direct impact on transportation and transformation of VOCs, e.g. they contribute to 40 to
60% of OHx loss associated with VOCs in the clear air and more 20% in polluted air (Chen et al.,
2012). The VOCs and their products can enter in human body by human breathing and skin
exposure. Depending on concentration level, human exposure can cause health problems, and
in the worst case, provoke cytotoxicity in lung cells, encouraging lung cancer (Sheng et al.,
2013).
Fig. 2.15 – Low molecular compounds and their reactions (Addapted from: Sheng et al., 2013)
2.5.2 VOCs behaviour in atmosphere
In high pressure weather systems, VOCs are more reactive in the atmosphere, with a
pronounced emission during the summer months, which have higher probability of low wind
speed, high insolation and higher NOx levels (Steinberg et al., 2009).
Air quality studies have been developed thought the years. Steinberg et al. (2009) used
modeling techniques to estimate VOCs emission from European vegetation (10 km by 10 km)
for an extended area of 22,56×10⁶ m2 for the years 1997, 2000, 2001 and 2003 (Fig. 2.15). They

Influence of Abiotic Stress Factors on VOCs Emission from Portuguese Rice Paddy Fields Relation with increased Climate Change 2013
Literature Review 25
divided VOCs by class and concluded that emission are dominated by forest areas, with
isoprene being the most abundant category, followed by almost similar distribution of
monoterpenes, oxygenate VOCs (OVOCs) where GLV category is included, and sesquiterpnes
only contributed with 1-2% of the total VOC emitted.
Fig. 2.16 shows a strong dependence on the annual cycle of temperature and light in North
hemisphere, with main emitting months coinciding with the period from May to September. In
addition, the most of vegetation also change the emission-active surface throughout the year,
with higher area surface during summer, and in consequence, most of the emissions are
observed in the leaf-on phase of the year (Steinberg et al, 2009).
Fig. 2.16 – Monthly estimation of isoprene, monoterpenes, sesquiterpenes, and OVOCs emissions from European vegetation. Other land area uses include all categories
excepted forest (Source: Steinberg et al., 2009)
Steinberg et al. (2009) emission modelling study also concluded distinct diurnal variations of
isoprene and monoterpenes emissions. Isoprene reveals higher peaks emission during mid-
day, as monoterpenes, but stops during the night and monoterpenes continue in a smaller
rate. Monoterpene emissions occur from stored pools that continue their activity in darkness
night environments (see F3 in annexes).

Influence of Abiotic Stress Factors on VOCs Emission from Portuguese Rice Paddy Fields Relation with increased Climate Change 2013
Literature Review 26
Only about one third of angiosperm species tested, including rice, emit isoprene at vestigial
rates (Spinelli et al., 2011). To date incomplete or very limited knowledge are well-known
about the release of VOCs from plant tissues, due to not only physical properties – their
volatility and polarity – but also to cytological organized process (Hobbs et al., 2004).
According to Spinelli et al. (2011), some general aspects about isoprene behaviour emission in
response to abiotic stress, should be retained:
Isoprene synthesis is dependent on photosynthesis, and on the other hand
photosynthesis has high dependence of CO2. It is proved that isoprene emission can be
50% less under elevated CO2 concentration. But if O2 is removed, the isoprene
emissions stops.
Isoprene emission is affected by N nutrition. It means that plants with low N nutrition
have lower rates of isoprene. However, plants with higher N availability emitted more
isoprene when grown under sun radiation than grown in the shade;
Isoprene emission is very sensitive to temperature. It plays an important role on
thermotolerance of plants (protection against short high temperature episodes);
Low influence on isoprene emission by water – stress, but if several drought affects
plant for substantial period of time, isoprene emission is increased;
Same as in drought effect, the rate of emission depends on the level of stress caused.
2.5.3 Air quality, climate change scenarios projections and rice VOC
emissions
Atmospheric chemists are interested in the origin of air pollution and its consequences (Maes
and Derbergh, 2003). There is big pressure on EU member states to reduce emissions to
atmosphere from agricultural sources (see T4 in annexes), as defined by UNECE Gothenburg
Protocol (UNECE, 2012), the EU National Emission Ceilings Directive (see annexes T5 about
Directive 2008/50/EC, 2008) and the Kyoto Protocol.
European Environmental Agency (2004) explored targets of Kyoto Protocol (Fig. 2.17) and
revealed positive evolution of VOCs emission (including BVOCs and AVOCs). The analysis was
concentrated in the uses of Kyoto mechanisms (air pollution policies control) under three
different scenarios using RAINS model – Regional Air pollution Information and Simulations,
which included emission reduction from Kyoto strategies, costs and environmental effects of
emission control policy actions, taking into account the role of atmospheric dispersion
proprieties. Fig. 2.17 shows a progressive change in emissions in 2010 when compared with
1990: the reduction of 44% in all Europe, including Western (-54%) blue colour, Central (-22%)
orange and East Europe (-26%) green line (EEA, 2004).

Influence of Abiotic Stress Factors on VOCs Emission from Portuguese Rice Paddy Fields Relation with increased Climate Change 2013
Literature Review 27
Fig. 2.17 – VOCs emission reduction in Europe between 1990 and 2010 (Source: EEA, 2004)
Table 2.8 indicates the ranking of four main EU VOCs (BVOCs and AVOCs) emitter countries (for
entire ranking see T5 in annexes).
Table 2.8 – Main VOC emitter countries in EU according with the UNECE Protocol
Ranking County VOCs emission in
2005 (103 tons/year)
1st Italy 1286
2nd France 1232
3rd Germany 1143
4rd United Kingdom 1088
(Adapted from: UNECE, 2012)
From the beginning of 21st century, new issues are pumping out from research scientific
community: “If we do not understand what is going on with biogenic (plant – produced) VOCs,
we are not going to be able to weigh different air-quality strategies properly” (Purves in
Schultz, 2004).
Steinberg et al. (2009) carried out air quality studies, at on the European scale, and concluded
that countries with highest emission of BVOCs per ground area (including not only isoprene
measurements, but also monoterpenes, sesquiterpenes and OVOCs) were Portugal, Spain and
Greece. They found a correlation with the Mediterranean highest vegetation emitter species,

Influence of Abiotic Stress Factors on VOCs Emission from Portuguese Rice Paddy Fields Relation with increased Climate Change 2013
Literature Review 28
such as oaks, eucalyptus, aromatic plants, like rosemary and thyme and interpreted that higher
amount of compounds in river valleys (F4 in annexes). Other investigations found also a high
BVOCs peak emission in European boreal zone/taiga, due to dominant vegetation of coniferous
forests consisting in pines, spruces and larches (Rinne et al., 2009). Rinne et al. (2009) conclude
that isoprene emission from open wetland ecosystems per land area can be of the same order
of magnitude than emission from coniferous forests. These authors assume that the modelling
results did not include feedback interactions from steadily increasing CO2 concentrations on
the atmosphere neither abiotic nor biotic stresses.
Fig. 2.18 shows the importance of the need of field species VOCs measurements in order to
better predict results from air quality modelling efforts about emission influence factors. These
approaches of analysis, expression, validation and prediction are a present trend for scientific
community research.
Fig. 2.18 – Complementation methods for including measurement studies and model study to understand real phenomena and predict future situation (Cho and Oki, 2012)
There is a higher temperature trend accepted for the future (see annexes F5 to understand
temperature trend until 2012). The projection based climate modelling scenarios from
Intergovernmental Panel on Climate Change (IPCC, 2013), set the warming average
temperature for the near future from 2014 to 2030, compared to 1980 – 1999 period, in the
worst scenario case, at + 0.85 °C. Between 2031 and 2070 projection shows + 3.10 °C and, by
the end of 21st century, among 2071 to 2099, temperature will be + 4.49 °C. Table 2.9 shows
the impact projections.

Influence of Abiotic Stress Factors on VOCs Emission from Portuguese Rice Paddy Fields Relation with increased Climate Change 2013
Literature Review 29
Table 2.9 – Main conclusions of the IPCC scenarios prediction
(Source: IPCC, 2013)
Climate change has many facets, including changes in long-term trends in temperature, rainfall
regimes and atmospheric gases concentration. Higher air temperature will increase sea level
due to the thermal expansion of sea water and rapid melting of glaciers and ice caps. Effects
on greater rice productive deltaic cultivation areas will be more unprotected to inundation and
salinity intrusion (IPCC, 2013).
Table 2.10 shows the projections for rice production outcomes during the next decades for
three category groups of TWB classification scheme (TWB – Country and Leading Groups,
2013), where authors (Nelson et al., 2010) calculated their percentage based on two scenarios:
perfect mitigation of climate change effects and under influence of climate change, between
2010 and 2050. The baseline scenario (red circles) assumed standard economic, social and
environmental conditions like we are globally having today. Nelson et al. (2010) assumed the
highest trend of increasing rice production under climate change mean scenario and
pessimistic case (low economic grow and high population growth tendency, with continue
GHGs increasing concentration due to tropospheric ozone formation). On the other hand,
under optimistic conditions (with good and equal economic evolution situation and low
population grow), the rice production slowed down and decreased over the years.

Influence of Abiotic Stress Factors on VOCs Emission from Portuguese Rice Paddy Fields Relation with increased Climate Change 2013
Literature Review 30
Table 2.10 – Scenario results for rice production over the three economical categories group countries
(Adapted from: Nelson et al., 2010)
Rice production is increasing only on single digits (red narrow pointing up), more emphasis are
going to low-income developing countries, with more than 6% of growth (Nelson et al., 2010),
where some countries with high rice production are included (as Bangladesh, Vietnam and
Southeast Asia countries. However, for rising these percentages there will be concern about
water scarcity related to irrigate systems for rice crop production (Nelson et al., 2010).
Having in mind abiotic stress conditions, progressive population growth and rice demand, it
should expect the negative impacts between these interactions, resulting on decreased of rice
yields and increased susceptibility of plant sterility. A good point among the negative
projections is the opportunity for rice genome improvement mechanism (Nelson et al., 2010).
It will help to reduce losses related with abiotic stresses temperature tolerance, as well as
drought, submergence and over salty environmental concentration (Mahonty, 2010).
In 2002, FAO, the West African Rice Development Association, National Agricultural Research
Systems in sub-Saharan Africa, and many other partners got involved on the creation of African
Rice Initiative promoting the use of New Rice for Africa (NERICA) in upland rice production
systems. NERICA varieties have greater tolerance to water scarcity (FAO, 2004).

Influence of Abiotic Stress Factors on VOCs Emission from Portuguese Rice Paddy Fields Relation with increased Climate Change 2013
Literature Review 31
The growth trend of rice culture will cause impact on the environment, like changing water
regime, soil characteristic, N cycle, and other effects. We would also like to identify variation
on rice VOCs composition, variation trends and the air quality effects. As referred in previous
section 2.1.1 Global status, more than 166 million ha of global earth terrestrial surface are
belonging to rice field cultivation, which should represent concern.
Influence of Abiotic Stress Factors on VOCs Emission from Portuguese Rice Paddy Fields Relation with increased Climate Change 2013
Literature Review 32

Influence of Abiotic Stress Factors on VOCs Emission from Portuguese Rice Paddy Fields Relation with increased Climate Change 2013
Materials and Methods 33
3. Materials and Methods
3.1 Site description
A study of VOCs emission from Portuguese rice paddy fields was carried out during the period
between May and October 2012, comprehending the whole life cycle of rice plant (Oryza
sativa L. cv. Aríete). Site study were located in COTArroz fields in Paul de Magos (Lat. 39º 02’
21, 40’’N, Long. 8º 44’ 25, 98’’ W) Salvaterra de Magos, Santarém district part of Tejo river
valley, denominated region Lisboa e Vale do Tejo (Fig. 3.1).
Fig. 3.1 – Location of field site; (right side) COTArroz plots (Source: Figueiredo, 2011)
The sectioned area is characterized in terms of soil characteristics as Fluvisols, from semi-
bodied tertiary soil deposits (FAO, 2007). Fig. 3.2 shows COTArroz partial landscape.
Fig. 3.2 – COTArroz partial landscape

Influence of Abiotic Stress Factors on VOCs Emission from Portuguese Rice Paddy Fields Relation with increased Climate Change 2013
Materials and Methods 34
3.1.1 Culture practices
Fig. 3.3 presents rice culture practices (since May to October 2012) conducted by COTArroz
and detailed growing phases. Seeding was made at 23rd May and harvested at 13rd October.
Fig. 3.4 shows rice field aspect at after seeding, weeding and before harvested moments.
Fig. 3.4 – COTArroz field aspect after seeding (a); weeding (b); before harvested (c)
Fig. 3.3 – Culture pratices dates and flooding period (Source: INIAV, 2013c)

Influence of Abiotic Stress Factors on VOCs Emission from Portuguese Rice Paddy Fields Relation with increased Climate Change 2013
Materials and Methods 35
3.2 Experimental design
Fig 3.5 presents the layout of whole experiment (from rice sample collection to VOCs
qualitative identification).
1open field; 2open top chamber; 3steam distillation extraction; 4solid phase micro extraction; 5gas chromatography
coupled to mass spectrometry; 6total ion chromatogram;
7retention index
3.2.1 Sampling
Samples were collected from two distinct soil plots A – Loamy sand and B – Silty clay (right side
Fig 3.1). In loamy sand soil, three OF arbitrary zones were installed with area of 3.0 m2 (1.5 m x
1.2 m) and 0,5 m between each sampling zone (Fig 3.6 a). In silty clay soil were installed also
three OF areas, and six OTCs (Fig 3.6 b) covered by polyethylene film material with
approximate area of 12 m2 (4 m wide x 3 m high) and 2 m open top hole diameter, three with
induced temperature and other three with simultaneous temperature and CO2 concentration
enhancement. In addition, a controlled plant experiment with both types of soil textures was
conduct in separated vases (Fig 3.6 c).
Fig. 3.5 – Experimental design layout

Influence of Abiotic Stress Factors on VOCs Emission from Portuguese Rice Paddy Fields Relation with increased Climate Change 2013
Materials and Methods 36
Fig. 3.7 – Sampling scheme at silty clay soil
Fig. 3.6 – Data collection layout in COTArroz, Salvaterra de Magos, 2012, in OF soil plot A (a); soil plot B OTC (b); plots under controled conditions (c)
Fig. 3.7 outlines the method scheme for sampling at silty clay. Three OTCs with induced
temperature symbolized with numbers 1, 3 and 6, three others OTCs with temperature and
CO2 enhancement are numbered 2, 5 and 7 and three OF areas with 4, 8 and 9.

Influence of Abiotic Stress Factors on VOCs Emission from Portuguese Rice Paddy Fields Relation with increased Climate Change 2013
Materials and Methods 37
The plant samples were preferably collected during the early p.m. daily period. The sampling
units from plots A and B were made selecting 4 to 5 whole plants. After plant material
collection the samples were transported to FCT laboratory in a short period of time.
Table 3.1 presents the field data sampling resume, considering TN – OF loamy sand; TE – OF
silty clay; TEc – OTC with increased temperature, and TEcc – OTC with temperature and CO2
enhancement. Rice plant completes its cycle within the mean duration days of irrigate rice
paddy fields, between 150 – 180 days (Aparroz, 2009). At the beginning of the field sample
collection (4th June, 2012), in TEc and TEcc, some unexpected occurrence did not allow healthy
plant development. Rice plants from TE were relocated into chambers at 9th July.
Table 3.1 – Field sampling data resume
Treatments
Rice
cycle
(days)
Sampling
(days)
Nº of
samples
each day
Average and
standard deviation
temperature* (ºC)
Average and
standard
deviation [CO2]*
(ppm)
TN and TE
158
6 6 20,1±2,1 375,4±38,5
TEC 5 3 22,8±2,3 398,1±33,4
TECC 5 3 22,0±2,2 547,3±65,7
*Data provide by COTArroz
The average temperature at TEc and TEcc did not vary much between each other (red and green
lines on Fig. 3.8), however comparing with the environmental average temperature (blue line),
the maximal differences stayed about + 3 ⁰C inside TEC (Table 3.1).The TECC registered almost
+175 ppm atmospheric CO2 concentration (Table 3.1) and had always the higher concentration
level among the cycle (green line on Fig. 3.9).
Fig. 3.8 – Daily temperature average during the whole rice cycle

Influence of Abiotic Stress Factors on VOCs Emission from Portuguese Rice Paddy Fields Relation with increased Climate Change 2013
Materials and Methods 38
Fig. 3.9 – Daily CO2 concentration average among whole rice cycle
In total, six field sampling days were made to cover the three main phases of the rice cycle
(Table 3.2).
Table 3.2 – Sampling dates and corresponding phase
Representative sampling date choice for analyses always symbolizes approximately the mid
date of each developing phase.
3.2.2 VOCs extraction methods
Field campaign since 4th of July until 19th of September (Table 3.1) was used for performing
SPME and SDE extraction methods.
Sampling date Rice cycle phase Samples chosen for analyses
4th July Vegetative -
24th July Vegetative
16th August Reproductive
4th September Ripening -
19th September Ripening
26th September Ripening -

Influence of Abiotic Stress Factors on VOCs Emission from Portuguese Rice Paddy Fields Relation with increased Climate Change 2013
Materials and Methods 39
Fig. 3.10 - Material for SPME extraction SPME holder and fibre DVB/CAR/PDMS and (a), about 0.3 g of rice samples into 15 mL vials (b)
3.2.2.1 Solid phase microextraction
Table 3.3 describes SPME extraction technique.
Table 3.3 – SPME extraction
Technique description
SPME
Manual SPME holder (Supelco, Belledort) (Fig. 3.10 a)
Fibre coating: DVB/CAR/PDMS (Polydimethylsyloxane –
Divinylbenzene) (1 cm length and 100 μm film thickness)
15 mL vial
Samples About 0,3 g (Table 3.4) of fresh cut rice leaves (Fig.3.10 b)
Extraction time 45 min at room temperature
Fibre desorption GC injection port at 250 ⁰ for 2 min
Table 3.4 presents the average mean and standard deviations mass of fresh rice samples (three
replicates per treatment) extracted by SPME from field campaign dates covering three rice
growing phases.
Table 3.4 – Mass of rice samples for SPME extraction
Growing phases TN (g) TE (g) TEC (g) TECC (g)
Vegetative (24th July) 0.28±0.01 0.24±0.06 0.27±0.04 0.27±0.04
Reproductive (16th August) 0.25±0.04 0.25±0.04 0.26±0.04 0.26±0.06
Ripening (19th September) 0.31±0.06 0.31±0.03 0.27±0.08 0.24±0.04

Influence of Abiotic Stress Factors on VOCs Emission from Portuguese Rice Paddy Fields Relation with increased Climate Change 2013
Materials and Methods 40
3.2.2.2 Steam distillation extraction
Table 3.5 describes SDE extraction technique.
Table 3.5 – SDE extraction
Technique description
SDE
Veith and Kiwus exhaustive steam - distillation connected
to solvent-extraction distillation apparatus (Fig. 3.11 a)
250 mL round bottomed flask
Solvent: diethyl ether (Riedel-de Haen; 32203) – pentane
(Sigma-Aidrich; 34956) 2:1 (v/v)
Samples About 7 g (Table 3.6) of fresh cut rice leaves from
composite samples (Fig. 3.11 b)
Extraction time 2 h at boiling point water temperature
Concentration volume 1 mL under a gentle steam nitrogen
Storage -20 ⁰C until analysis
Fig. 3.11 – SDE extraction; SDE material (a) and fresh rice samples (b)
Table 3.6 presents the mass of composite samples extracted by SDE from field campaign dates
covering the three rice growing phases.

Influence of Abiotic Stress Factors on VOCs Emission from Portuguese Rice Paddy Fields Relation with increased Climate Change 2013
Materials and Methods 41
Fig. 3.12 – Example of TIC resulting from SPME extraction and analysed by GC/MS using DB-5 capilary column
Table 3.6 – Mass of composite rice samples for SDE extraction
Growing phases TN (g) TE (g) TEC (g) TECC (g)
Vegetative (24th July) 7.01 7.08 7.15 6.98
Reproductive (16th August) 7.10 6.98 7.02 7.11
Ripening (19th September) 7.07 7.03 7.07 6.99
3.2.3 VOCs analysis
The qualitative analysis of VOCs compounds emitted from rice Oryza sativa L. cv. Ariete were
performed by two different equipment of gas chromatography coupled to mass spectrometry
(GC/MS) with different column polarities.
3.2.3.1 Gas chromatography/mass spectrometry
SPME samples were analysed by GC/MS system (HP Hewlett Packard, Series II, model 5890/
MSD 5972 mass selective detector). The VOCs separation was achieved on a capillary column
coated with a non – polar phase 5% phenyl 95% dimethylpolysiloxane (ZB-5MS equivalent to
DB-5) with 30 m length x 320 μm ID and 0.25 μm film thickness (Phenomenex Inc., USA). Data
were generated in full screen spectra between mass ranges of 40 – 300 m/z and results was
recorded in total ion chromatograms (e.g. Fig. 3.12).
SDE samples were analyzed by GC/MS system (SCINSQ – BUNKER model GC – 456) equipped
with MS quadrupole mass spectrometer. The VOCs separation was achieved on a capillary
column coated with a polar phase polyethylene glycol (BR-SWAX equivalent to DB-WAX) with
30 m length x 320 μm ID and 0.25 μm film thickness (Bruker Daltonics Inc., USA). Total volume
injection of 1 μL with a microliter syringe (Hamilton MicroliterTM Syringes, Reno, Nevada, USA).

Influence of Abiotic Stress Factors on VOCs Emission from Portuguese Rice Paddy Fields Relation with increased Climate Change 2013
Materials and Methods 42
Data were generated in full screen spectra between mass ranges of 40 – 400 m/z and results
were recorded in total ion chromatogram (e.g. Fig. 3.13).
Fig 3.13 – Example of TIC resulting from SDE extracts analysed by GC/MS using DB-WAX
capillary column
In both GC equipment was used the same method and Table 3.7 presents respective method
parameters.
Table 3.7 – GC programmed method
Method parameters
Injection type Manual
Injection mode Splitless for 2 min
Carrier gas (constant flow) Helium 1.2 mL/min
Temperature injection 250 ⁰C
Temperature ramp 4 ⁰C/min
Temperature initial 40 ⁰C for 2 min
Temperature final 200 ⁰C
Ionization mode EI (70 eV)

Influence of Abiotic Stress Factors on VOCs Emission from Portuguese Rice Paddy Fields Relation with increased Climate Change 2013
Materials and Methods 43
3.2.4 VOCs Identification
After extraction and analysis, the fingerprints/fragments/chromatograms of studied
compounds were qualitatively analysed. Quantitative analyses were no possible to perform
due of the small peak area on the chromatograms. Rice volatile emissions are not as high as
those reported for Pinnus spp. or Eucalyptus spp. leaves that allow high peak areas.
The resulting chromatographic peaks from GC/MS were analysed using the softwares AMDIS
from NIST and MS ChemStation from Agilent. Identification process started with peak
detection (each compound has the respective retention time), followed by their RI (retention
index) calculation (Table 3.8), and comparison with reported literature RI (e.g. Adams, 2001).
The maximal absolute index difference admitted comparing with available literature was
assumed to fall between a deviation of 25 (Zeng et al., 2012) to 30 (Cardeal et al, 2006) from
the literature reported values. The identification process is confirmed after mass spectra
comparison with NIST 08 database libraries (F6 in annexes shows mass spectra examples from
the three main VOCs classes).
Table 3.8 – The van den Dool/Kratz RI formula calculation
Common RI Temperature
conditions Formula Reference
van den
Doll/Kratz
Linear
temperature
program ramp
RIx = 100n + 100(tx-tn) / (tn+1 − tn) van den Dool and
Kratz, 1963
Legend
tn+1 and tn retention times of the reference n-alkane hydrocarbons
eluting immediately before and after compound “X”
tx retention time of compound “X”
Hydrocarbons RIs were obtained from injection of C8-C20 standard solution using the same
GC/MS programmed method parameters. The molecular mass of hydrocarbons was found
using the equation 12 + (2 2) (with representing the number of carbon atoms),
derived from general formula of n-alkanes CnH2n+2 (Chang and Goldsby, 2012). The equation
gives the highest molecular mass (m/z) of the peak, so-called molecular ion (MI), and it is
represented by the last ion in spectra. Table 3.9 shows molecular ions from C8-C15
hydrocarbons of interest.
Table 3.9 – Molecular ions from hydrocarbons C8 to C15
CnH2n+2 C8H18 C9H20 C10H22 C11H24 C12H26 C13H28 C14H30 C15H32
MI (m/z) = 12×n + (2n+2) 114 128 142 156 170 184 198 212

Influence of Abiotic Stress Factors on VOCs Emission from Portuguese Rice Paddy Fields Relation with increased Climate Change 2013
Materials and Methods 44
3.2.4.1 Statistical results treatment
Student’s-t test was used to find the statistical truth for treatment means in each rice growing
phase (one sample mean test), as well as to comparing the means between two treatments
(independent sample test). Only SPME results were statistically treated. A total of 36 samples
were analysed by GC/MS using DB-5 column, data were grouped in triplicates from each
sample treatment. Population size of for each t-student test was equal for all treatments
( =3). Table 3.10 shows the population VOCs emission mean x and respective standard
deviation Sx (numbers x from 1 to 12 present the sequential order of treatments).
Table 3.10 – Emissions mean x and standard deviation Sx of population from each treatment and respective rice cycle phase
Rice cycle
phases TN TE TEC TECC
Vegetative 1 = 11,3
S1 = 5,80
4 = 12,7
S4 = 3,85
7 = 5,67
S7 = 1,69
10 = 3,00
S10 = 0,82
Reproductive 2 = 2,67
S2 = 0,94
5 = 3,67
S5 = 1,24
8 = 5,00
S8 = 1,63
11 = 4,03
S11 = 0,94
Ripening 3 = 6,67
S3 = 0,47
6 = 5,00
S6 = 2,45
9 = 8,67
S9 = 2,62
12 = 6,00
S12 = 2,94
The assumptions to measure confidence interval (CI) (one sample mean test) were observed:
normal population distribution and standard deviation of treatments is unknown. We were in
the case to assume null hypothesis: real mean of treatments are belonging to calculated CI at
different confidence levels (99% and 95%), i.e. Can we use this values as representative of field
rice plant?; Assuming equal variance between treatments, we are in the case of proving the
differences between two treatments (independent unpaired test), where null hypothesis is:
there are no differences between treatments, i.e. Do abiotic stress factors influence VOCs
emission?
Influence of Abiotic Stress Factors on VOCs Emission from Portuguese Rice Paddy Fields Relation with increased Climate Change 2013
Results 45
4. Results
This chapter presents all qualitative analysis of VOC fraction emitted by the rice (Oryza sativa
L. cv. Aríete) samples among the whole growing cycle (referred in Table 3.1). Identification of
volatile components extracted from SPME was performed by GC/MS using a non-polar (DB-5)
column and from SDE extraction VOCs were analysed by GC/MS using a polar (DB-WAX)
column. Data treatment was based on t-Student analyses in order to interpret statistical mean
results.
4.1 VOCs profile by GC/MS using DB-5 non-polar column
Table 4.1 presents the results obtained from the 36 field rice samples (each sample collection
day counted with six OTC plus three open field soil plot B and open field soil plot A). Table
legend are divided in compound name and their chemical formulas, ascending order of RIcalc
calculated according with quasi-linear equation of Van den Dol/Kratz (referred on Table 3.9)
and RIlit from literature (Adams, 2001). Right columns represented by gray colour expressing all
treatments sampled: TN means plot A OF (loamy sand soil); TE represents plot B OF (silty clay
soil), TEC means plot B OTC with temperature enhanced and TECC plot B OTC with induced
simultaneously temperature and CO2.
A total of 33 VOCs were found and the composition results points out to a 15,15% of GLV (five
compounds counting some aldehydes and alcohols) including 4-pentanal 2-methyl, 3-hexenal,
3-hexenol and 2,4-hexadienal; within the class of terpenes the division is followed by
monoterpenes, with 33.3% (11 compounds) like α-pinene, myrcene, α-phellandrene, cymene,
limonene, 1,8-cineol, ocymene, α-terpinolene, linalool, n-decanal β-cyclocitral; and
sesquiterpenes with 33.3% (11 compounds) such as coparene, elemenne, β-caryophyllene, α-
farnesene, bergamotene, humulene, aromadendrene, α-curcumene, ziginberene, bisabolene
and β-sesquipheladrene. Other compounds outside of main classes represent 18.2%, such as 1-
hexenol 2-ethyl (alcohol), benzoic acid (acid), n-nonanal and 2,6-nonadienal (aldehydes),
methyl salicylate (ester) and β-ionene (ketone).
The GLV trend did not vary as much among the treatments as mono- and sesquiterpenes.
Mono- and sesquiterpenes fluctuation occurs essentially between OF (TN and TE) and OTC (TEC
and TECC) treatments. Sesquiterpenes compounds were less observed and the difference trend
among the treatments is mainly present in OTC with zero sesquiterpenes found at vegetative
and reproductive stage and only four compounds appeared at ripening stage.
According with Spinelli et al. (2011) the VOCs division in classes (GLV, mono- and
sesquiterpenes) is based on their C units. With DB-5 capillary column was possible to establish
a linear relation between retention time and volatility of the compounds.

Influence of Abiotic Stress Factors on VOCs Emission from Portuguese Rice Paddy Fields Relation with increased Climate Change 2013
Results 46
Table 4.1 – Rice cycle VOCs emission performed by SPME analyzed by GC/MS (DB-5 column)
Fig 4.1 shows the linearity between compounds class and retention time, where GLV (C6 units)
appear in earliest retention time, followed by monoterpenes (10 C units) and by more ‘heavy’
sesquiterpenes (15 C units).
Vegetative Reproductive Ripening
Peaks Chemical formula
RI Lit RI
Calc TN TE TECC TEC TN TE TECC TEC TN TE TECC TEC
4-pentanal 2-methyl
C6H10O 776 784 . X . . X X
3-hexenal C6H10O 796 807 . X X X . X X X .
2-hexenal C6H10O 850 854 . X X X X . X X X . X X X
3-hexenol C6H12O 853 868 . X X X X . X X X X . X X
2,4-hexadienal C6H8O 925 928 . X X X . X X X . X X
α-pinene C10H16 939 943 . X X X . . X X X
myrcene C10H16 989 1001 . . . X
phellandrene C10H16 1004 1014 . X . X .
cymene C10H16 1026 1032 . X X X X . . X X X
1-hexenol 2-ethyl C8H18O 1028 1035 . X X . X X . X X X
limonene C10H16 1035 1038 . X X X X . X X . X X X
1,8-cineol C10H18O 1039 1047 . X X X X . X X . X X X X
ocymene C10H16 1050 1056 . X . . X
α-terpinolene C10H16 1089 1100 . X X . . X
benzoic acid C8H8O2 1102 1110 . X X X . X . X
n-nonanal C9H14O 1104 1111 . . . X X
linalool C10H18O 1106 1117 . X X . .
2,6 nonadienal C9H14O 1180 1191 . . X . X
methyl salicylate C8H8O3 1201 1207 . X X . .
n-decanal C10H20O 1212 1221 . . X . X X X
β-cyclocitral C10H16O 1219 1229 . . . X
coparene C15H24 1386 1400 . X . .
elemene C15H24 1406 1418 . X X . . X X
β-caryophyllene C15H24 1425 1440 . X X . .
α-farnesene C15H24 1430 1442 . X X . X .
bergamotene C15H24 1435 1450 . X X . .
humulene C15H24 1455 1470 . X . .
aromadendrene C15H24 1462 1479 . X . X .
α-curcumene C15H24 1481 1501 . X . .
β-ionene C13H18O 1493 1504 . . . X X X X
ziginberene C15H24 1500 1514 . X X . .
bisabolene C15H24 1511 1527 . . . X
β-sesquipheladrene C15H24 1523 1537 X X . . X X
Total 20 22 7 10 . 6 6 5 8 . 11 12 9 13
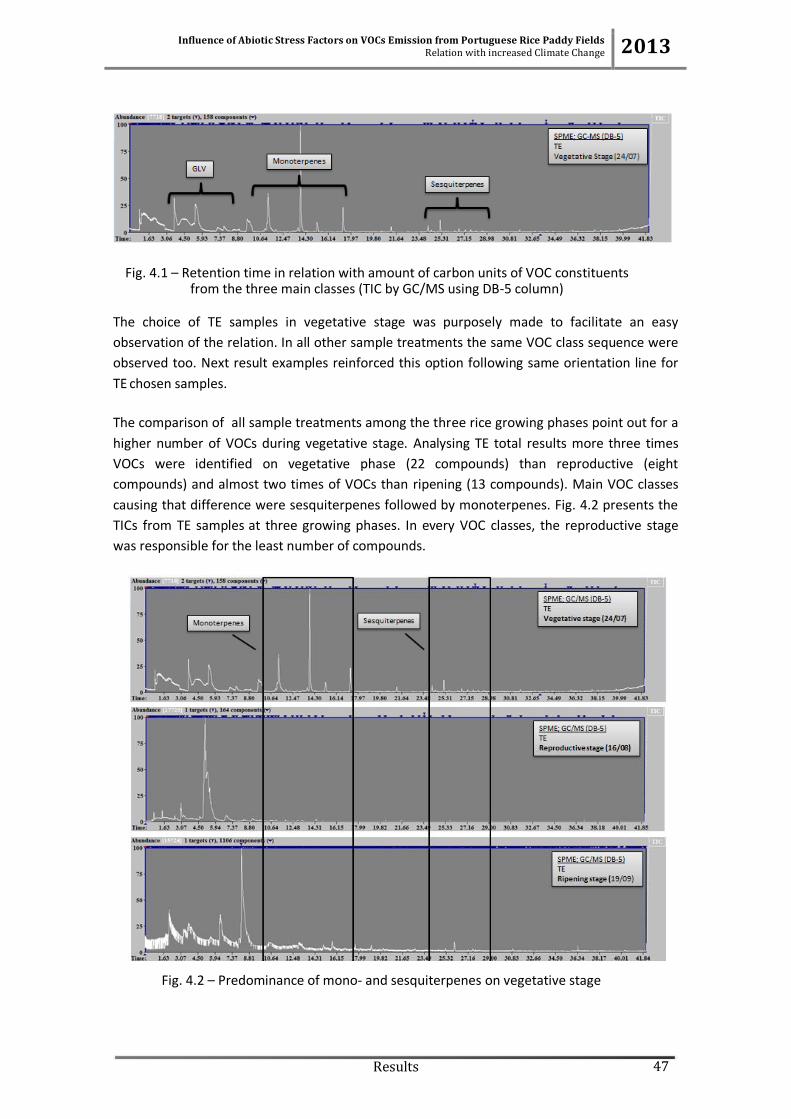
Influence of Abiotic Stress Factors on VOCs Emission from Portuguese Rice Paddy Fields Relation with increased Climate Change 2013
Results 47
Fig. 4.1 – Retention time in relation with amount of carbon units of VOC constituents from the three main classes (TIC by GC/MS using DB-5 column)
The choice of TE samples in vegetative stage was purposely made to facilitate an easy
observation of the relation. In all other sample treatments the same VOC class sequence were
observed too. Next result examples reinforced this option following same orientation line for
TE chosen samples.
The comparison of all sample treatments among the three rice growing phases point out for a
higher number of VOCs during vegetative stage. Analysing TE total results more three times
VOCs were identified on vegetative phase (22 compounds) than reproductive (eight
compounds) and almost two times of VOCs than ripening (13 compounds). Main VOC classes
causing that difference were sesquiterpenes followed by monoterpenes. Fig. 4.2 presents the
TICs from TE samples at three growing phases. In every VOC classes, the reproductive stage
was responsible for the least number of compounds.
Fig. 4.2 – Predominance of mono- and sesquiterpenes on vegetative stage

Influence of Abiotic Stress Factors on VOCs Emission from Portuguese Rice Paddy Fields Relation with increased Climate Change 2013
Results 48
Taking into account the two different soil textures used (see section 2.2.1.1 Soil
characteristics), silty clay (TE) and loamy sand (TN), there were differences in VOCs emission
trend. Fig. 4.3 presents these results and TE had always more VOCs than soil TN, at least one or
two compounds.
Fig 4.3 – Voices emission differences between soil textures
Silty clay soil increased volatile emission. Every replicate field sample indicates more VOC
compounds in OTC under the influence only of temperature (TEC), when compared with
simultaneously increase of temperature and CO2 (TEcc). Fig. 4.4 shows fewer compounds
emitted by rice under influence of simultaneous higher temperature and CO2 concentration. It
should be pointed out that for better peak comparison Fig. 4.4 presents differences on
chromatogram scales.
Fig. 4.4 – Higher number of VOCs on temperature induced OTC (TEC)
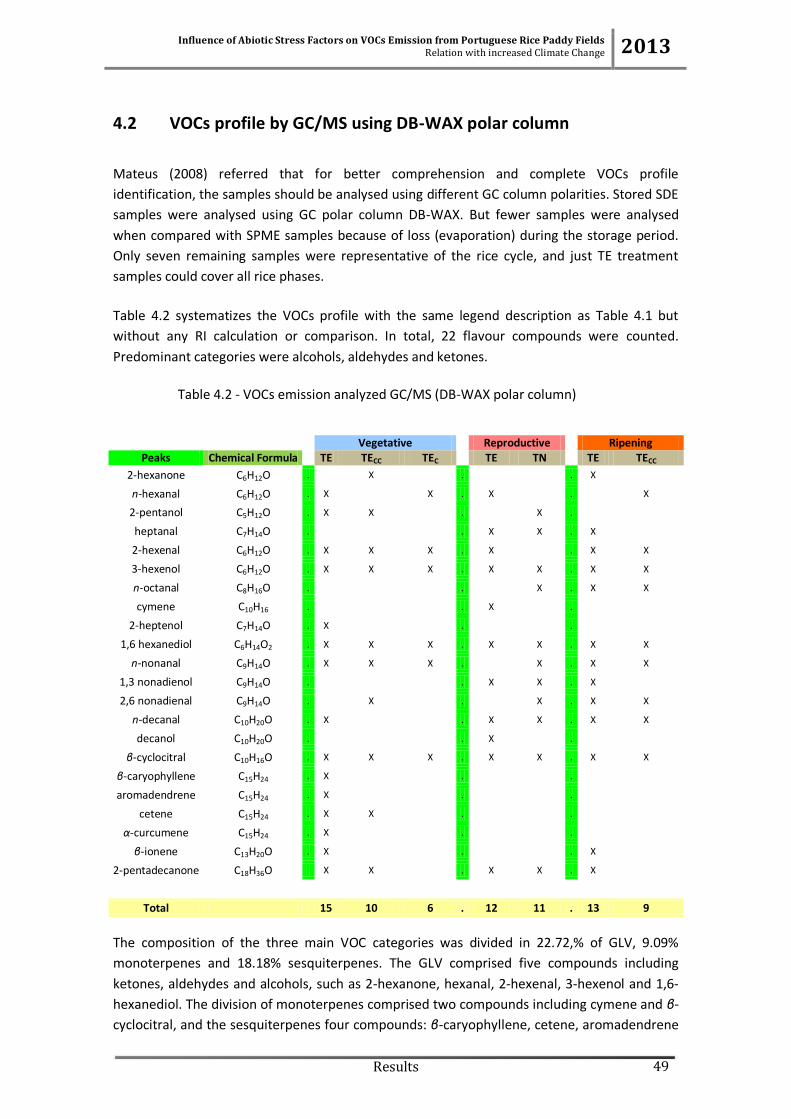
Influence of Abiotic Stress Factors on VOCs Emission from Portuguese Rice Paddy Fields Relation with increased Climate Change 2013
Results 49
4.2 VOCs profile by GC/MS using DB-WAX polar column
Mateus (2008) referred that for better comprehension and complete VOCs profile
identification, the samples should be analysed using different GC column polarities. Stored SDE
samples were analysed using GC polar column DB-WAX. But fewer samples were analysed
when compared with SPME samples because of loss (evaporation) during the storage period.
Only seven remaining samples were representative of the rice cycle, and just TE treatment
samples could cover all rice phases.
Table 4.2 systematizes the VOCs profile with the same legend description as Table 4.1 but
without any RI calculation or comparison. In total, 22 flavour compounds were counted.
Predominant categories were alcohols, aldehydes and ketones.
Table 4.2 - VOCs emission analyzed GC/MS (DB-WAX polar column)
The composition of the three main VOC categories was divided in 22.72,% of GLV, 9.09%
monoterpenes and 18.18% sesquiterpenes. The GLV comprised five compounds including
ketones, aldehydes and alcohols, such as 2-hexanone, hexanal, 2-hexenal, 3-hexenol and 1,6-
hexanediol. The division of monoterpenes comprised two compounds including cymene and β-
cyclocitral, and the sesquiterpenes four compounds: β-caryophyllene, cetene, aromadendrene
Vegetative Reproductive Ripening Peaks Chemical Formula TE TECC TEC TE TN TE TECC
2-hexanone C6H12O . X . . X
n-hexanal C6H12O . X X . X . X
2-pentanol C5H12O . X X . X .
heptanal C7H14O . . X X . X
2-hexenal C6H12O . X X X . X . X X
3-hexenol C6H12O . X X X . X X . X X
n-octanal C8H16O . . X . X X
cymene C10H16 . . X .
2-heptenol C7H14O . X . .
1,6 hexanediol C6H14O2 . X X X . X X . X X
n-nonanal C9H14O . X X X . X . X X
1,3 nonadienol C9H14O . . X X . X
2,6 nonadienal C9H14O . X . X . X X
n-decanal C10H20O . X . X X . X X
decanol C10H20O . . X .
β-cyclocitral C10H16O . X X X . X X . X X
β-caryophyllene C15H24 . X . .
aromadendrene C15H24 . X . .
cetene C15H24 . X X . .
α-curcumene C15H24 . X . .
β-ionene C13H20O . X . . X
2-pentadecanone C18H36O X X . X X . X
Total 15 10 6 . 12 11 . 13 9

Influence of Abiotic Stress Factors on VOCs Emission from Portuguese Rice Paddy Fields Relation with increased Climate Change 2013
Results 50
and α-curcumene. Other compounds also included on the Table 4.2 represent 50% of total
VOC composition: (four aldehydes) n-octanal, n-nonanal, 2,6 nonadienal and n-decanal; (three
alcohols) 2-heptenol, 1,3 nonadienol and decanol; (one ketone) 2-pentaecanone; and (one
ester) β-ionene.
Comparing the three columns of TE (left column from each phase) between all growing phases
in Table 4.2, the highest number of VOCs is present on vegetative (15 compounds) phase,
followed by ripening (13 compounds) and reproductive (12 compounds). Fig. 4.5 presents an
example of this analysis with a higher number of GLV on vegetative stage. The differences on
chromatogram scale are used for simplifying peaks observation.
Fig 4.5 - GLV between three phases (TE sample comparation) with GC DB-WAX polar column
Table 4.3 shows, simultaneously, the differences of VOCs distribution from DB-WAX and DB-5
columns between all treatments among the rice cycle. In total DB-WAX identified 22
compounds and DB-5 column 33. Similarities between columns results exist manly on the
sesquiterpenes class.

Influence of Abiotic Stress Factors on VOCs Emission from Portuguese Rice Paddy Fields Relation with increased Climate Change 2013
Results 51
Columns
Peaks Chemical formula DB-5 DB-WAX
2-pentanol C5H12O . X
4-pentanal 2-methyl C6H10O X .
2-hexanone C6H12O . X
n-hexanal C6H12O . X
3-hexenal C6H10O X .
2-hexenal C6H10O X . X
3-hexenol C6H12O X . X
2,4-hexadienal C6H8O X .
n-heptanal C7H14O . X
n-heptenol C7H14O . X
1,6 hexanediol C6H14O2 . X
n-octanal C8H16O . X
α-pinene C10H16 X .
myrcene C10H16 X .
phellandrene C10H16 X .
cymene C10H16 X . X
1-hexenol 2-ethyl C8H18O X .
limonene C10H16 X .
1,8-cineol C10H18O X .
ocymene C10H16 X .
α-terpinolene C10H16 X .
benzoic acid C8H8O2 X .
n-nonanal C9H14O X . X
linalool C10H18O X .
1,3 nonadienol C9H14O . X
2,6 nonadienal C9H14O X . X
methyl salicylate C8H8O3 X .
n-decanal C10H20O X . X
decanol C10H20O . X
β-cyclocitral C10H16O X . X
coparene C15H24 X .
elemene C15H24 X .
β-caryophyllene C15H24 X . X
α-farnesene C15H24 X .
bergamotene C15H24 X .
cetene C15H24 . X
humulene C15H24 X .
aromadendrene C15H24 X . X
α-curcumene C15H24 X . X
β-ionene C13H18O X . X
ziginberene C15H24 X .
bisabolene C15H24 X .
β-sesquipheladrene C15H24 X .
2-pentadecanone C18H36O . X
Total 33 . 22
Table 4.3 – GC columns results comparison

Influence of Abiotic Stress Factors on VOCs Emission from Portuguese Rice Paddy Fields Relation with increased Climate Change 2013
Results 52
4.3 Data treatment
In this section were carried out the statistical analyses of the Oryza sativa L. cv. Aríete chemical
volatile leaves composition, extracted by SPME and analysed by GC/MS (DB-5), proving the
significance of the influence of stress factors in VOCs emission among the whole rice cycle.
4.3.1 Students t-test
The rice data were in accordance with statistical t-student hypothesis test conditions: small
data sets of treatments samples, data follow approximately standard normal distribution
model, standard deviation is unknown and is replaced by an estimate scaling parameter using
t-distribution, and the real mean value and standard deviation population are independent.
4.3.1.1 One sample t-test mean (confidence intervals)
Two degrees of freedom were chosen and statistical significance were set at 0,05 and 0,01
levels (95% and 99% of confidence degree, respectively). Null hypothesis defend that real
mean values are within the respective CIx (confidence interval).
Table 4.4 presents the CI with 95% of confidence, where the real mean value (Table 4.1) are
within the limits for the respective treatment on correspondent rice cycle phase.
Table 4.4 – T-student test CI95% results for one sample test (mean µ) with 95% of confidence degree
Rice cycle
phases TN TE TEC TECC
Vegetative CIµ1 = 11,3±14,4 CIµ4 = 12,7±9,56 CIµ7 = 5,67±4,19 CIµ10 = 3,00±2,03
Reproductive CIµ2 = 2,67±3,67 CIµ5 = 3,67±3,08 CIµ8 = 5,00±2,33 CIµ11 = 4,03±2,36
Ripening CIµ3 = 6,67±1,17 CIµ6 = 5,00±6,08 CIµ9 = 8,67±6,51 CIµ12 = 6,00±7,30
The real mean values (µx) (see last row on Table 4.1), µ1=20, µ2=6, µ4=22, µ5=6, µ7=10, µ9=9,
µ11=5, µ12=9 are located between the associated confidence interval limits, and the null
hypothesis was not excluded. Other mean values µ3=11, µ6=12, µ8=8 and µ10=10 rejected the
null hypothesis, i.e. the real mean values are not within the correspondent CI95%.
Table 4.5 presents the CI where we are having 99% of confidence that the real mean value
(Table 4.1) are within the respective limits.

Influence of Abiotic Stress Factors on VOCs Emission from Portuguese Rice Paddy Fields Relation with increased Climate Change 2013
Results 53
Table 4.5 - T-student test CI99% results for one sample test (mean µx) with 99% of confidence degree
Having 99% of confidence all mean real values µx from Table 4.1 are within the IC99% limits. Null
hypothesis are not reject in any test, i.e. we can use this results as representative from field
rice culture. Highest CI values were observed in TN and TE samples at vegetative phase.
4.3.1.2 Independent two sample t-test (mean differences)
Student’s independent two sample t-test was used to study the difference between two
independent treatments. Both samples size are equal ( =3) and the two distributions having
the same variance (in concordance with independent two sample t-test assumptions).
Hypotheses were tested between two treatments each time. Triplicate combinations were
studied combining all treatments TE, TN, TECC and TEC. Four degrees of freedom were used
with 1%, 5% and 10% of significance (99%, 95% and 90 confidence degree, respectively), where
Ttab99%=4,60 Ttab95%=2,78 and Ttab90%=2,13. Values of Tcalcx present the t-test calculation. Null
hypothesis points out that real means are equal between treatments and hypothesis one is the
reverse (exists differences between means). If Tcalcx> Ttabx is proved that means are significantly
different at determinate level of probability. Table 4.6 present the Tcalcx values from each
treatment comparison.
Table 4.6 – Independent samples t-test between sample treatments
Rice cycle phases TN TE TEC TECC
Vegetative CIµ1 = 11,3±33,2 CIµ4 = 12,7±19,3 CIµ7 = 5,67±9,68 CIµ10 = 3,00±4,70
Reproductive CIµ2 = 2,67±5,38 CIµ5 = 3,67±10,1 CIµ8 = 5,00±9,36 CIµ11 = 4,03±5,38
Ripening CIµ3 = 6,67±2,69 CIµ6 = 5,00±14,0 CIµ9 = 8,67±15,0 CIµ12 = 6,00±16.8
Rice cycle
phases TN and TE
TEC and
TECC
TN and
TECC
TN and
TEC
TE and
TECC TE and TEC
Vegetative Tcalc1=0,28 Tcalc4=2,01 Tcalc7=2,00 Tcalc10=1,32 Tcalc13=2,51 Tcalc16=2,35
Reproductive Tcalc2=0,90 Tcalc5=0,52 Tcalc8=1,73 Tcalc11=1,20 Tcalc14=0,57 Tcalc17=1,75
Ripening Tcalc3=0,94 Tcalc6=2,00 Tcalc9=0,32 Tcalc12=1,07 Tcalc15=0,37 Tcalc18=1,07

Influence of Abiotic Stress Factors on VOCs Emission from Portuguese Rice Paddy Fields Relation with increased Climate Change 2013
Results 54
Having 99%, 95% of confidence all t-tests demonstrated Tcalcx< Ttabx, i.e. null hypothesis is not
rejected and is not statistically proved that exist differences between treatment means. But
with 90% (Ttab90%=2,13) of confidence Tcalc13 = 2,51 and Tcalc16 = 2,35 proved Tcalcx> Ttabx, i.e.
results rejected null hypothesis and exists differences between TE absolute mean at vegetative
phase (TEµ4=22) and TECC (TECCµ10=7) and TEC (TEcµ7=10) real mean values.
Between phases, higher Tcalcx values show the respective treatments with major absolute mean
differences. Vegetative phase had the major values which mean more differences in total
released compounds. At vegetative phase, comparing pairs or treatments, TE and TECC at
presents higher value.

Influence of Abiotic Stress Factors on VOCs Emission from Portuguese Rice Paddy Fields Relation with increased Climate Change 2013
Discussion 55
5. Discussion
Rice is the most important staple food crop for a large part of the world’s population. As the
population growth trend increasing, the demand for rice will grow. Portugal is the fourth
biggest rice producer in EU and the first per capita consumer. Agrosystems occupy a large land
areas and rice extends their territory every year. Air quality issues are now focused on the
emission rates from biogenic sources, one of the present pollutants is the volatile fraction
emitted by plants, so-called VOC. VOCs are released from plants by secondary metabolism in
response to biotic and abiotic stress factors, such as: herbivore damage, pathogenic attack or
infestation, intra- and interspecies odour signals, temperature, light – time-explosion, plant
species physiology and phenology, O3 and CO2 exposure, soil physical and chemical
characteristics (availability of N and water soil). VOCs are very heterogeneity group of
compounds with a higher influence on atmosphere chemistry, acting as photochemical
precursors in tropospheric ozone formation.
Portuguese rice paddy fields were a subject study of chemical volatile fraction emission from
fresh rice leaves, among 2012 rice (Oryza sativa L. cv. Ariete) cycle. Field measurements from
whole rice cycle allowed a greater interpretation of a complete growth process, being the first
study in the scope, followed the one previously carried out by FCT research team of the
project.
When we are comparing other studies, referred in this chapter, about VOCs emission from
other parts of the rice plant or even though different plant species, a range of different factors
should be taking into account: the metabolic type of the plant; morphology and phenology of
developing plant phases, environmental plant material conditions during the studies (in- or
outdoor), GC equipment features (spectrometers, programmed methods and GC columns) and
VOCs methodology identification. These differences are not always representing unfailing
results if compared with field sample collection and analysis, but on the other hand, it should
be considered as a good methodology to matching environmental responses.
The small peak size represented vestigial VOCs emission from rice leaves, allowing only
performing qualitative analysis. From SPME technique, 36 headspace samples were analysed
by quadrupole analyzer and DB-5 capillary column, where 33 VOCs have been identified. From
SDE extraction, 22 VOCs were identified from 7 liquid samples by quadrupole analyzer and DB-
WAX capillary column. In total were identified three main VOC classes GLV, mono- and
sesquiterpenes, with different composition between columns. The DB-5 capillary column
showed to be a main choice for separation of non-polar compounds and DB-WAX capillary
column looked to be greater for polar VOCs, such as aldehydes, ketones and alcohols (see
column coating on T3 in annex). Table 4.4 shows a large difference in monoterpenes emission
(DB-5 columns had 11 and DB-WAX only two).
The SPME, as equilibrium process is dependent of the volatile concentration in the headspace
and it not allows injection repetition, the SDE promote enrichment of the volatiles on the
solvent layer and the final solvent extract allows multiple injections (Mahattanatawee et al,

Influence of Abiotic Stress Factors on VOCs Emission from Portuguese Rice Paddy Fields Relation with increased Climate Change 2013
Discussion 56
2005). The amount of sample used influences the concentration of SDE final extract. Kpoviessi
et al, (2011) used 500 g of fresh leaves from Sclerocarya birriea (deciduous three) samples (in
this study we just could steam distilled 7 g of fresh cut rice leaves each time). Zeng et al. (2011)
observed from same rice bran samples, 65 compounds detected from SDE and 76 from SPME.
VOCs emitted by plants can be direct related as isoprene derivatives (mono- and
sesquiterpenes) and, as Spinelli et al. (2011) affirmed, the emission is closely related with
younger leafs in earlier stages of plant development. Rinne et al. (2009) biochemically
assumed that the higher amount of isoprene emission only starts few weeks after first leaves
come out of plant. Highest VOCs abundance on vegetative phase was observed in our study
and this result can be explained by the greater rice plant activity on early stage (Dudareva et
al., 2004) to grow a solid steam extension and to fully expend their young leafs.
In 2011 rice cycle, samples were submitted to SPME extraction and GC-FID
separation/detection using DB-5 capillary column and also vegetative phase presented
maximum VOCs emission from mono- and sesquiterpenes classes (Couto et al., 2012). Other
example from different plant cycle VOCs profile identification, Maes and Debergh (2009)
studied VOCs emission from tomato shoots and the higher amount of volatile compounds was
observed in the vegetative phase too. They identified compounds by GC/MS using non-polar
capillary column and found out a predominance of mono-and sesquiterpenes.
Common mechanism to reduce leaves temperature is transpiration and it is regulated by
stomata opening and air relative humidity. But, rice paddy ecosystem are characterized by
elevate humidity caused by flooding environment, where the transpiration is reduced and
other mechanism should act as thermoregulation function to protect leaves (Cho and Oki,
2012). Increasing temperature induces stress to rice plant growth. Our study may prove that
VOCs are higher under higher temperatures and it is can be related with thermotolerance
protection.
According to literature studies involving VOCs emission from other rice varieties, such as wild
(Zizania aquatic) (Frank et al. (1976) in Maga, 1984), unpolished California brown pearl rice
(Bullard and Holguium (1977) in Maga, 1984) and scented or so-called aromatic rice (Buttery et
al., 1983), all authors concluded the same phenomena of temperature influencing the
increased number of VOCs. From cooked rice (Aisaka, 1977) were identified 3 to 5 times more
VOCs then fresh raw rice. And also Tsugita et al. (1983) compared the flavour compounds from
rice stored at 4 ⁰C to that stored at 40 ⁰C for 60 days, where in rice stored at 4 ⁰C had less 50%
of total amount of VOCs than at 40 ⁰C.
Temperature tolerance has a relevant effect on phosyntethesis rate. This relation has been
connected to down-regulation at biochemical and enzymatic level of rice plant (Dudareva et
al., 2004). A change in emission rates is predictable, resulting on reduced VOCs emission. In
our treatments TEcc shows always lesser compounds emission. Also in 2011 rice cycle, plants
in OTC under influence of temperature plus CO2 enhancing showed less volatile compounds
than under only temperature treatment (Couto et al., 2012). There is a concern about
construction material of OTCs, polyethylene film, may or may not have influence on VOCs

Influence of Abiotic Stress Factors on VOCs Emission from Portuguese Rice Paddy Fields Relation with increased Climate Change 2013
Discussion 57
composition. Other authors (Rinne et al., 2009 and Wassman, et al., 2010) referred that
enhanced CO2 concentration on ambient reduce VOCs emission, due to closer relation
between photosynthesis and VOCs stomatal biosynthesis on C3 plants.
More VOCs emission was identified in silty clay soil texture when compared with loamy sand
soil. Fewer studies focused on VOCs released from plants under different soil textures (Bastos
and Magan, 2007). Wheatley et al. (1996) used GC/MS technique to study VOCs from
headspace of a silty clay soil (without testing any plant growth). They concluded that VOCs are
depending from nutrient addition into soil. Bastos and Magan (2007) used e-nose system to
identify VOCs differences between three soils: loamy sand, calcareous clay and volcanic ash
under different temperatures and water potentials. They conclude that loamy sand soil had
the lowest compound variability and even lower different VOC classes were observed under
drier soil conditions.
Other external factor referred by several authors (Coutinho et al., 2009; Rinne et al., 2009;
Kpoviessi et al., 2011; Dudareva et al., 2012) that influenced VOC emission peaks remains to
photoperiod. According to Rinne et al. (2009), monoterpene emissions from Mediterranean
specie Quercus ilex are almost double in high summer peak. Coutinho et al. (2009) and Hobbs
et al. (2004) also referred that soil moisture can cause emission variations. Spinelli et al. (2011)
points out the O3 exposure variation and N availability as other stress factors that can induce
fluctuation on VOCs profiles. Some singular compounds released during rice cycle present a
particular trend between stages and also between sample treatments. This can be related not
only with our studied factors, but also with presence of pest infestation (Aisaka (1977) in
Maga, 1984; Michael et al. (1978) in Maga, 1984; Zhou and Wang, 2011).
Data analyses allow us to estimate the statistical significance of the results. The results of one
sample t-test mean conclude that with 99% of confidence level, all mean values from
treatment samples were within the calculated correspondent interval. The results of
independent t-test studying the difference between pairs of treatments proved that just two
pairs of mean values were statistically different (TE from TEC and TECC in absolute mean values
at vegetative phase). These treatments had the highest difference (more than ten compounds)
between them (see last raw on Table 4.1). The explanation for other values do not statistically
concluding the truth are in the compound premises identification, i.e. compound only need to
be found in one triplicate to be considered for whole composite treatment.
At this point, hypothesis according to analysed data allowed us to say that increasing rice
production will probably influence VOCs emission in air chemistry under climate change
scenarios predictions (simultaneous higher temperature and higher CO2 concentration). Plants
produce more vegetative matter under elevated CO2 concentration, and rice as well (plus 30%
rice production) (INIAV, 2013b), encouraging a higher tillers number and grain yield depending
of photosyntetical process used (C3 plants use CO2 less efficiency than C4 plants) (Wassmann,
et al., 2010). Rice (C3 plant) revealed a big sensitivity to higher CO2 concentration (less
emission of VOCs). This fact has been seen as a positive response to compensate effects of
future climate change conditions. Based on previous studies, we may associate rice
performance under elevated CO2 on three main parameters: a decreased of stomatal aperture,

Influence of Abiotic Stress Factors on VOCs Emission from Portuguese Rice Paddy Fields Relation with increased Climate Change 2013
Discussion 58
increased photosynthetic activity and enhances total biomass (Cho and Oki, 2012). The impact
of higher air temperature on rice VOCs emission may cause more volatile compounds emission
among the rice growing season (Cho and Oki, 2012).
In general, other plants such as forests of oak and pine, citrus, cottonwood, vegetables, and
others agroforestry species also emit higher number of VOCs under warmer climate. It means
that when temperatures are higher, associated with a greater AVOCs demand of NOx and CO2
in the summer could affect agricultural areas through medium and long distance
transportation factors (NASA, 2013). This fact will accelerate photochemical reaction rates in
atmosphere, and just showering if in the presence of a cloud cover.
In the past, some of the government’s anti-smog efforts have been reducing AVOCs released
by motor vehicles, power plants and factories. Since the 90’s, this issue starts to change and
great attention was given to BVOCs from vegetation. In 1998, United States Environmental
Protection Agency reports (USEPA, 1998), concluded that 131 million people lived in countries
with higher and unhealthy level of smog. VOCs emission from agriculture is a complex sphere
between interaction from all BVOCs and AVOCs sources, climate conditions, location, air
chemistry and atmospheric sinks (Cho and Oki, 2012). There is also a linear relation between
VOCs concentration and distance of emitter sources. Air quality models are dealing with many
uncertainties. To obtain a desired result we need critically understand which factors are
making a definitive contribution to achieve the main physiological and phenological responses
of rice to abiotic stress. Rice cycle field measurements are crucial tools for the projection of
future rice VOCs behaviour under climate change effects, offering important information that
is of great use to society.

Influence of Abiotic Stress Factors on VOCs Emission from Portuguese Rice Paddy Fields Relation with increased Climate Change 2013
Conclusions 59
6. Conclusions
Rice volatile emissions extracted by SDE and SPME techniques and identified by GC/MS using
two capillary columns with different phases, present qualitative differences in their volatile
fraction composition. Some of the differences maybe explained by the use of different
columns phases, DB-5 resolves non-polar compounds and DB-WAX polar compounds. Other
factor with possible influence on the results is the extraction method (SPME vs. SDE) that, in
spite of allowing complementary characterization, produced different “extracts” from the
same matrix. Among rice cycle growing phases, vegetative may stimulated a higher VOCs
emission, possible to explain due to greater plant activity on early stage of development.
Temperature caused more VOCs emission from rice plant when compared with simultaneous
temperature and CO2 concentration, probably revealed by thermotolerance capacity of rice
plant under higher temperatures. VOCs emission was lower in presence of elevated CO2
concentration, possible to explain by photosynthesis plant rate. Other external stress factors
should be studied to have a complete interpretation of results, and point out the influence of
each factor separately, such as: photoperiod, soil water, O3 exposure and N availability. Study
biotic factors in the field also can help to identify cause-effect relations.
Looking into prediction for climate change scenarios, we may formulate that the hypothesis
higher temperature will be a fact, appearing simultaneously with other climacteric parameters.
Atmospheric CO2 concentration it is also expect to increase. Taking into account that VOCs are
released when plant experiment stress, as we observed on rice cycle under our experimental
conditions, temperature may affect VOCs emission expressed in higher number of compounds,
although CO2 may contribute for lowering this emission. Rice shows to have a vestigial
emission per plant, but considering the world rice farms extension, rice can play a role on
global air quality. Complete inventory of VOCs emission for main vegetation categories would
improve correct estimations and projection of future VOCs behaviour under climate change
effects, and help new correct implementation of air quality issues.
Further research:
Rice biotic (intra- and interspecific) odour-signals interaction under field conditions;
Influence of other abiotic factors on VOCs emission during the rice cycle (photoperiod,
soil water, O3 exposure and N availability);
VOCs profile among the other rice varieties cycle;
VOCs profile from other crop species (maize and wheat).

Influence of Abiotic Stress Factors on VOCs Emission from Portuguese Rice Paddy Fields Relation with increased Climate Change 2013
References 60
7. References
Adams, R. 2001. Identification of essential oil components by gas chromatography/quadrupole
mass spectroscopy. 3rd edition, Allured Publishing Corporation, Illinois, USA.
Agilent Technologies 2013. Choosing the right columns.
http://www.chem.agilent.com/cag/cabu/gccolchoose.htm. (accessed on 6th March, 2013)
Aparroz 2009. A cultura do Arroz. Agrupamento de produtores de arroz.
http://actd.iict.pt/list/?cat=quick_filter&search_keys[0]=arroz&order_by=Relevance&tpl=4.
(accessed on 3th March, 2013)
Bastos, A. and Magan, N. 2007. Soil volatile fingerprints: use for discrimination between soil
types under different environmental conditions. Sensors and Actuators B Chemical, 125: 556-
562.
Boote, K., Allen, L., Prasad, P., Baker, J., Gesch, R., Snyder, A., Pan, D., and Thomas, J. 2005.
Elevated Temperature and CO2 Impacts on Pollination, Reproductive Growth, and Yield of
Several Globally Important Crops. Journal Agriculture Meteorology, 60(5): 469-474.
Bullard, R. and Holguim, G. 1977. Volatile components of unprocessed rice (Oryza sativa L.).
Journal Agriculture Food Chemistry, 25(1): 99-103.
Buttery, R., Orts, W., Takeoka, G. and Nam, Y. 1999. Volatile flavour components of rice cakes.
Journal Agriculture Food Chemistry, 47: 4353-4356.
Chang, R. and Goldsby, K. 2012. In: Chemystry, 11th edition, McGraw-Hill, pp. 535.
Cheng, S., Zhang, X., Wang, D., Cheng, L., Xu, C. and Zhang, X. 2012. Effect of long – term paddy
– upland yearly rotation on rice (Oryza sativa) yield, soil properties and bacterial community
diversity. The Scientific World Journal, 2012: 1-11.
Cho, J. and Oki, T., 2012. Application of T⁰, water stress, CO2 in rice growth models. The Rice
Journal, 5: 1-10.
Chromedia 2013. Chromatography knowledge base. http://www.chromedia.org. (accessed on
5th September, 2013)
Counce, P., Keisling, T., Mitchell, A. 2013. Rice growth staging system. University of Arkansas.
http://cses.uark.edu/RGSSPOster.pdf (accessed on 6th June, 2013)
Coutinho, I., Cardoso, C., Ré-Poppi, N., Melo, A., Vieira, M., Honda, N. and Coelho, R. 2009. Gas
chromatography – mass spectrometry (GC-MS) and evaluation of antioxidant and antimicrobial
activities of essential oil of Campomanesia adamantium (Cambess) O. Berg (guavira), Brazilan

Influence of Abiotic Stress Factors on VOCs Emission from Portuguese Rice Paddy Fields Relation with increased Climate Change 2013
References 61
Journal of Pharmaceutical Sciences, 45(4): 767-776.
Couto, N., Mateus, E., Silva, M., Ribeiro A. and Carranca, C. 2012. Monitoring biogenic volatile
emissions of rice in a Portuguese paddy field, 7th National Meeting on Chromatography, Porto,
Portugal, 9-11 January 2012, pp. 187.
Dudareva, N., Klempien, A., Muhlemann, J. and Kaplan, I. 1013. Biosynthesis, Function and
metabolic engineering of plant volatile organic compounds. New Phytologist, 198: 16 – 32
Dudareva, N., Pichersky, E, and Gershenzon, J. 2004. Biochemistry of plant volatiles. Plant
Physiology 135: 1893 – 1902; 2004.
EEA 2004. Exploring the ancillary benefits of Kyoto protocol for air pollution in Europe,
Technical Report 93, pp. 50. European Environment Agency.
EEA 2013. Global temperatures. European Environment Agency.
http://www.eea.europa.eu/data-and-maps/indicators/global-and-european
temperature/global-and-european-temperature-assessment-6. (accessed on 6th July, 2013)
FAO 2004. Fact sheets 3: Rice and climate change, international year rice. Food and Agriculture
Organization. http://www.fao.org/rice2004/en/f-sheet/factsheet3.pdf. (accessed on 6th July,
2013)
FAO 2007. A framework for international classification, correlation and communication. World
soil resources Reports, No. 103. IUSS Working Group WRB 2007.
FAO 2012. World food and agriculture. Statistical Yearbook 2012. Food and Agriculture
Organization, pp. 369.
FAO 2013. Crop prospect and food situation, No. 1, March 2013. Food and Agriculture
Organization. http://www.fao.org/giews/english/cpfs/. (accessed on 9th June, 2013)
Figueiredo, N. 1011. Dinâmica do azoto em campos alagados para produção de arroz, em
salvaterra de magos. Dissertação de mestrado em Engenharia Agrómica. Instituto Superior
Agronomia da Universidade Técnica de Lisboa, pp. 60.
Ginsbach, J., Taylor, K., Olsen, R., Peterson, B., and Dunnivant, F. 2010. The fraction of organic
carbon predicts labile desorption rates of chlorinated organic pollutants in laboratory-spiked
geosorbents. Environmental Toxicology and Chemistry, 29(5): 1049-1055.
Godefroot, M., Sandra, P. and Verzel, M. 1981. New method for quantitative essential oil
analysis. Journal of Chromatography A, 203: 325-335.
Groeningen, K., Kessel, C. and Hungate, B. 2013. Increased greenhouse-gas intensity of rice

Influence of Abiotic Stress Factors on VOCs Emission from Portuguese Rice Paddy Fields Relation with increased Climate Change 2013
References 62
production under future atmospheric condition. Nature and Climate Change, 3: 288-291.
Harren, F. and Cristescu S. 2013. Online, real-time detection of volatile missions from plant
tissue, AoB Plants, 5: 1-16.
Hobbs, P., Webb, J., Mottram, T., Grant, B. and Misselbrook, T. 2004. Emission of volatile
organic compound origination from UK livesrock agriculture. Journal of the Science of Food and
Agriculture, 84: 1414-1420.
INIAV 2013a. 3º Relatório de Progresso do projecto PTDC/AGR-AAM/102529/2008 “Emissões
gasosas medidas em campos regados de arroz produzido em dois solos diferentes, em
Portugal, por efeito das práticas culturais, do clima e do aumento da concentração de CO2 na
atmosfera”, pp. 17.
INIAV 2013b. Boas práticas no Cultivo de Arroz por Alagamento, em Portugal. Seminar on 30th
May, 2013, Oeiras, Portugal.
INIAV 2013c. Relatório final do projecto PTDC/AGR-AAM/102529/2008 “Emissões gasosas
medidas em campos regados de arroz produzido em dois solos diferentes, em Portugal, por
efeito das práticas culturais, do clima e do aumento da concentração de CO2 na atmosfera”,
pp. 29.
IRRI 2013a. Soil and nutrient management. International Research Rice Institute.
http://irri.org/index.php?option=com_k2&view=item&id=9548:soil-and-nutrient-
management&lang=en. (accessed on 14th June, 2013)
IRGSP 2008. International Rice Genome sequencing Project. http://rgp.dna.affrc.go.jp/IRGSP/.
(accessed on 25th March, 2013)
IRRI 2013c. Rice knowledge bank – Farmer’s guide. International Research Rice Institute.
http://www.knowledgebank.irri.org. (accessed on 19 of July, 2013)
IRRI 2013b. The rice plant – soil – water system. Crop and environmental science division.
International Research Rice Institute.
http://www.knowledgebank.irri.org/ewatermgt/courses/course1/resources/presentations/Pla
ntSoilWater.pdf. (accessed on 14th June, 2013)
IPCC 2013. Climate change 2013 – The physical science basis. International Panel of Climate
Change. http://www.ipcc.ch/report/ar5/wg1/#.UlfeJ1D6Ugl. (accessed on 25th September,
2013)
International Conference of Food Security 2013.
http://www.globalfoodsecurityconference.com/. (Accessed on 20 of May, 2013)
Kpoviessi, D., Gbaguidi, F., Kossouih, C., Agbani, P., Yayi-Ladekan, E., Sinsin, B., Moudachirou,
M., Accrombessi, G. and Quentin-Leclercq, J. 2011. Chemical composition and seasonal

Influence of Abiotic Stress Factors on VOCs Emission from Portuguese Rice Paddy Fields Relation with increased Climate Change 2013
References 63
variation of essential oil from Sclerocarya birrea (A. Rich) Hochst subsp birrea leaves from
Benin. Journal of Medicinal Plants Research, 5(18): 4640-4646.
Lansigan, F., Santos, W., Coladilla, J. 2000. Agronomic impacts of climate variability on rice
production in the Philippines, Agriculture, Ecosystems and Environment, 82: 129-137.
Legendre, M., Dupuy, H., Ory, R. and Mcllrath, W. 1978. Instrumental Analysis of Volatiles from
Rice and Corn Products. Journal Agriculture Food Chemistry, 26(5): 1035-1038.
Maes, K. and Debergh, P. 2003. Volatiles emitted from in vitro grown tomato shoots during
abiotic and biotic stress. Plant Cell – Tissue and Organ Culture, 75: 73-78.
Maes, K.; Vercammen, J; Phan-Tuan, H.; Sandra, P,; Debergh, P. 2001. Critical Aspects for
Reliable Headspace – Analysis of Plants Cultivated in vitro. Phytochemical Analysis, 12: 153-
158.
Maga, J. 1984. Rice Product Volatiles: A Review. Journal Agriculture Food Chemistry, 32(5):
964-970.
Mahattanatawee, K., Goodner, K., and Baldwin, E. 2005. Volatile constituents and character
impact compounds of selected Florida’s tropical fruit. Florida State Horticulture Society, 188:
414-418.
Mateus, E. 2008. Characteristics of Pinus spp. needles by gas chromatography and mass
spectrometry: Application to plant-insect interactions. PhD thesis dissertation on
Environmental Sciences, Faculdade de Ciências e Tecnologia da Universidade Nova de Lisboa,
pp. 322.
Matsumoto, J. 2013. Measuring biogenic volatile organic compound (BVOC) from vegetation in
terms of ozone reaction. Aerosol and Air quality research. (Article in press available on:
http://aaqr.org/ArticlesInPress/AAQR-12-10-OA-0275_proof.pdf)
Mohanty, S. 2010. Global rice trade: What does it mean for future food security? Rice Today,
9(4): 47-48.
MonoTrap, 2013. Monolithic material sorptive Extraction. http://www.atasgl.com/monotrap/
(acessed on 9th September, 2013)
NASA 2003. Low – Level ozone. Earth Observatory.
http://earthobservatory.nasa.gov/IOTD/view.php?id=3732. (accessed on 9th September, 2013)
National Emission Ceilings Directive 2008/50/EC. Council on ambient air quality and cleaner air
for Europe. European Commission.
Nelson, G., Rosengrant, M., Palazzo, A., Gray, I., Ingersoll, C. Robertson, R., Tokgoz, S., Msangi,

Influence of Abiotic Stress Factors on VOCs Emission from Portuguese Rice Paddy Fields Relation with increased Climate Change 2013
References 64
S. and You, L. 2010. Food security farming and climate changes to 2050 scenarios – results,
policy and options. In: International Food Policy Research Institute, pp. 320.
NIST 08 2013. National Institute of Standards a Technology. http://webbook.nist.gov.
(accessed on 2th September, 2012)
Nomura, M., Katayama, K., Nishimura, A., Ishida, Y., Ohta, S., Komari, T., Tokutomi, M.,
Tajima, S., Matsuoka, M. 2000. The promoter of rbcS in a C3 plant (rice) directs organ-specific,
light dependent expression in a C4 plant (maize), but does not confer bundle sheath cell-
specific expression. Plant molecular Biology, 44: 99-106.
Parreira, F. and Cardeal, Z. 2005. Amostragem de compostos orgênicos voláteis no ar
utilizando a técnica de microextração em fase sólida. Qimíca Nova, 28(4): 646-654.
RESTEK 2013. Guide to GC column selection and optimizing separation.
http://www.restek.com. (accessed on 4th August, 2013)
Riipnen, I., Juuti, T., Pierce, T., Worsnop, D., Kumala, M. and Donahue, N. 2012. The
contribution of organics to atmospheric nanoparticle growth. Nature Geoscience, 5: 453-458.
Rinne, J., Back, J., and Hakola, H. 2009. Biogenic volatile organic compound emissions from the
Eurasian taiga: current knowledge and future directions. Boreal Environment Research, 14:
807-826.
Santana, J. 2009. Análise cromatográfica e identificação de marcadores de envelhecimento de
documentos gráficos. Dissertação de Mestrado em Bioorgânica. Faculdade de Ciências e
Tecnologia da Universidade Nova de Lisboa, Departamento de Química, pp. 50.
Schirmer, W. and Quadros, M. 2010. Compostos orgênicos voláteis biogênicos emitidos a partir
de vegetação e seu papel no ozônio troposférico urbano. Sociedade Brasileira de Arborização
Urbana, 5(1): 25-42.
Schultz, S. 2004. Changes in forestry and agriculture affecting ozone pollution. Princeton
Weekly Bulletin, 4(5): 1-5.
Sheng, Y., Zhao, Y., Cheng, Z., and Huang, D. 2013. The heterogeneous reaction of volatile
organic compounds in the atmosphere. Atmosphere Environment, 68: 297-314.
Spinelli, F., Cellini, A., Marchetti, L., Nagesh K. and Piovene, C. 2011. Emission and Funtion of
Volatile Organic Compounds in Response to Abiotic Stress. In: Abiotic Stress in Plants –
Mechanisms and adaptations. Department of Fruit Tree and Woody Plant Sciences, Bologna
University, pp. 428.
Steinbrecher, R., Smiatek, G., Koble, R., Seufert, G., Theloke, J., Hauff, K., Ciccioli, P., Valutard,

Influence of Abiotic Stress Factors on VOCs Emission from Portuguese Rice Paddy Fields Relation with increased Climate Change 2013
References 65
R. and Curci, G. 2009. Intra- and inter-annual variability of VOC emission from natural and semi
natural vegetation in Europe and neighbouring countries. Atmospheric Environment, 43: 1380-
1391.
Taft, O. and Elphick, C. 2007. Waterbirds on working lands: Literature review biography.
Audubon Monsanto Foundation 3: 9-52.
Tavares, J. 2012. Interação entre a vegetação e a atmosfera para formação de nuvens e chuva
na Amazônia – uma revisão. Estudos Avançados, 74(6): 320-339.
Tian, C., Luo, Y., Zhao, X. Chen, Q., Luo, M. and Luo, L. 2012. Components analysis of volatile
matter in simethicone by gas chromatography-mass spectrometry, African Journal of
Pharmacy and Pharmacology 6(37): 2657-2663.
TNAU 2013. Agrometeorology. Tamil Nadu Agricultural University.
http://agritech.tnau.ac.in/agriculture/agri_agrometeorology_wind.html. (cccessed on 20th
July, 2013)
TWB 2013. Country and leading groups. The Word Bank.
http://data.worldbank.org/about/country-classifications/country-and-lending-groups.
(accessed on 1st of August, 2013)
UN Agency 2013. Food prices rise for second month, strong cereal forecast for 2013. United
Nations News Centre.
http://www.un.org/apps/news/story.asp?NewsID=44864#.Uamt_UCgkbg. (accessed on 20th
May, 2013)
UNDP 2010. United Nation Development programme Trinidade and Tobago.
http://www.undp.org.tt/TT-Today/Trinidad-Tobago-Population-Projections-2000-2025.html.
(accessed on 5th March, 2013)
UNECE 2012. The 1999 Gothenburg Protocol to Abate Acidification, Eutrophication and
Ground-level Ozone (amended in 2012). United Nations Economic Commission for Europe.
USEPA 1998. National air quality and emissions trends report, pp. 238. United States
Environmental Protection Agency.
van den Dool, H. and Kratz, P. 1963. A generalization of retention index system including linear
temperature programmed gas-liquid partition chromatography. Journal of Chromatography,
11: 463-471.
Wassmann, R., Jagadish, S., Heuer, S., Ismail, A., Redona, E., Serraj, R., Singh, R., Howell, G.
Pathak, H., and Sumfleth, K. 2009. Climate change affection rice production: The physiological
and agronomic basis for possible adaptation stratigies. Advances in Agronomy, 101: 59-122.

Influence of Abiotic Stress Factors on VOCs Emission from Portuguese Rice Paddy Fields Relation with increased Climate Change 2013
References 66
Wells, B. 2003. In: Rice Research studies 2002, University of Arkansas, Division of Agriculture,
R. J. Norman and J. F. Maullenet editors.
Whetney. R., Millar, S. and Griffiths, D. 1996. The production of volatile organic compounds
duric the nitrogen transformation in soils. Plant Soil, 181: 163-1671.
Zeng, M., Zhang, L., He, Z., Qin, F., Tang, X., Huang, X., Qu, H., and Chen, J. 2012. Determination
of flavour components of rice bran by GC – MS and chemometrics. Analytical Methods 4: 520-
539.
Zini, C., Lord, H., Christensen, E., Assis, T., Camarão, E. and Pawliszyn, J. 2012. Automation of
solid-phase microextraction of Eucalyptus volatiles. Journal of Chromatographic Science,
50(25): 7199-7205.
Zhou, B. and Wang, J. 2011. Use of electronic nose technology for identifying rice infestation
by Nilaparvata lugens. Sensors and Actuators B: Chemical 10: 1-7.

Influence of Abiotic Stress Factors on VOCs Emission from Portuguese Rice Paddy Fields Relation with increased Climate Change 2013
Annexes
Annexes
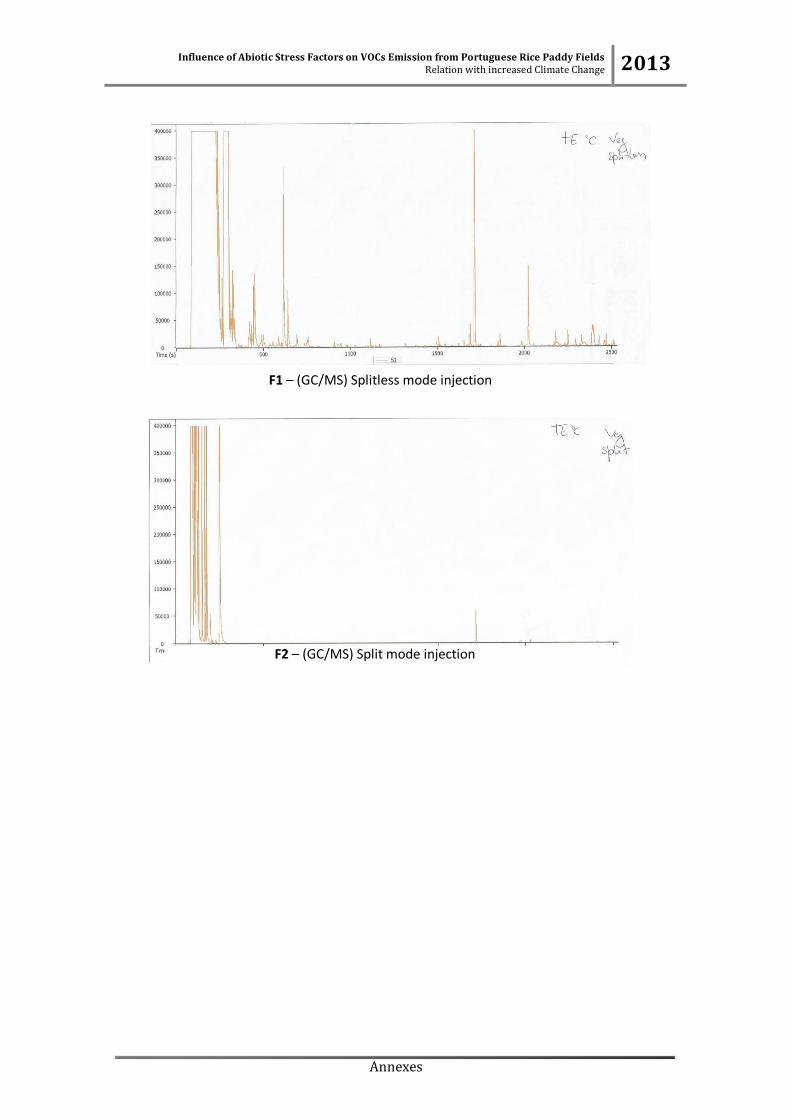
Influence of Abiotic Stress Factors on VOCs Emission from Portuguese Rice Paddy Fields Relation with increased Climate Change 2013
Annexes
F2 – (GC/MS) Split mode injection
F1 – (GC/MS) Splitless mode injection

Influence of Abiotic Stress Factors on VOCs Emission from Portuguese Rice Paddy Fields Relation with increased Climate Change 2013
Annexes
F 3 – Dayly variation of isoprene and monoterpene emissions in Europe from 1st to 10th July (Source: Steinberg et al., 2009)

Influence of Abiotic Stress Factors on VOCs Emission from Portuguese Rice Paddy Fields Relation with increased Climate Change 2013
Annexes
F 4 – Emissions of BVOCs from terrestrial vegetation in Europe in July 2000 (Source: Steinbrecher et al., 2009)

Influence of Abiotic Stress Factors on VOCs Emission from Portuguese Rice Paddy Fields Relation with increased Climate Change 2013
Annexes
F5 - Chart of global temperature change since 1850 to 2012, based on three different studies presented by black, red and blue lines (Source: EEA, 2013)

Influence of Abiotic Stress Factors on VOCs Emission from Portuguese Rice Paddy Fields Relation with increased Climate Change 2013
Annexes
F6 – Mass spectra examples of three mains VOCs categories (GLV, mono- and sesquiterpenes)

Influence of Abiotic Stress Factors on VOCs Emission from Portuguese Rice Paddy Fields Relation with increased Climate Change 2013
Annexes
T1 – Content of sand, silt and clay of main textural grade soils
Textural grade Sand (%) Silt (%) Clay (%)
Loam 65 15 20
Sandy Loam 80 15 15
Loamy Sand 85 10 5
Sandy 95 2 3
Clay Loam 55 15 30
Silty Clay Loam 30 35 35
Clay 40 10 50
Silty Loam 40 50 10
(Adapted from: IRRI, 2013a)
T2– Standard polymer coatings and their applications
Polymer coating Thickness
(µm)
Recommended
extraction
temperature
(T⁰)
Recommended
applications
MW
range
(g/mol)
PDMS
Polydimethylsyloxane 100 200-270 VOCs 80-300
PDMS/DVB
Polydimethylsyloxane –
Divinylbenzene
70 200-270
polar VOCs;
Amines;
Nitroaromatic
compounds
50-300
CAR/PDMS
Carboxen –
Polydimethylsyloxane
75 240-300
Gases and low
molecular weight
compounds
30-225
CW/DVB
Carbowax – Divinylbenzene 70 200-260 Polar compounds 40-275
CAR/PDMS/DVB
Carboxen –
Polydimethylsyloxane –
Divinylbenzene
75 220-280
Polar VOCs and
low MW
compounds
30-300
PA
Polyacrilate 85 220-310 Semi polar VOCs 80-300
(Adapted from: Parreira and Cardeal, 2005)

Influence of Abiotic Stress Factors on VOCs Emission from Portuguese Rice Paddy Fields Relation with increased Climate Change 2013
Annexes
T 3 - GC columns descriptions and their applications
Stationary
phase Applications Compositions Polarity
Temperature range (ºC)
(Isothermal/Programed)
*
HP-
1ms,DB-
1ms,HP-
1, DB-1
Amines,
hydrocarbons,pesticides,
PCBs, phenols, sulfur
compounds, flavours and
fragrances
100%
Dimethylpolysilox
ane
Non-
polar From -60 to 325/350
HP-
5ms,DB-
5, HP-5
Semivolatiles,
alkaloids,drugs, FAMEs,
halogenated compounds,
pesticides, herbicides
5% Phenyl 95%
dimethylpolysilox
ane
Non-
polar From -60 to 325/350
DB-5ms
Semivolatiles, alkaloids,
drugs, FAMEs,
halogenated compounds,
pesticides, herbicides
5% Phenyl 95%
dimethyl arylene
siloxane
From -60 to 325/350
DB-1301 Aroclors, alcohols,
pesticides, VOCs
6% Cyanopropyl-
phenyl 94%
dimethyl
polysiloxane
Mid-
polar From -20 to 280/300
DB-35, HP-
35
CLP-pesticides,
aroclors,pharmaceuticals,
drugs of abuse
35% Phenyl 65%
dimethyl
polysiloxane
Mid-
polar From 40 to 300/320
DB-35ms
CLP-pesticides, aroclors,
pharmaceuticals, drugs of
abuse
35% Phenyl
65% dimethyl
arylene siloxane
From 50 to 340/360
DB-
1701,DB-
1701P
Pesticides, herbicides,
TMS sugars, aroclors
14% Cyanopropyl-
phenyl 86%
dimethyl
polysiloxane
Mid-
polar From -20 to 280/300
HP-
50+, DB-17
Drugs, glycols, pesticides,
steroids
50% Phenyl
50%
dimethylpolysilox
ane
Mid-
polar From 40 to 280/300
DB-17ms
Drugs, glycols, pesticides,
steroids
50% Phenyl
50% dimethyl
arylene siloxane
From 40 to 320/340
DB-200
Residual solvents,
35%
Polar
From 30 to 300/320

Influence of Abiotic Stress Factors on VOCs Emission from Portuguese Rice Paddy Fields Relation with increased Climate Change 2013
Annexes
*Temperatures vary with column dimensions
(Source: Agilent Technologies, 2013)
pesticides, herbicides Trifluoropropyl
65% dimethyl
polysiloxane
DB-
225ms,DB-
225
FAMEs, alditol acetates,
neutral sterols
50% Cyanopropyl-
phenyl
50% dimethyl
polysiloxane
Polar From 40 to 220/240
HP-
INNOWax
Alcohols, free organic
acids, solvents, essential
oils, flavours and
fragrances
Polyethylene
glycol Polar From 40 to 260/270
DB-WAX Solvents, glycols, alcohols Polyethylene
glycol Polar From 20 to 250/260
CAM Amines, basic compounds
Polyethylene
glycol-base
modified
Polar From 60 to 220/240
HP-
FFAP,DB-
FFAP
Organic acids, alcohols,
aldehydes, ketones,
acrylates
Polyethylene
glycol-acid
modified
Polar From 40 to 250
DB-23 FAMEs (requiring
cis/trans resolution)
50% Cyanopropyl
50% dimethyl
polysiloxane
Polar From 40 to 250/260
CycloSil-B Chiral compounds
(general purpose)
30%-heptakis (2,3-
di-O-methyl-6-O-t-
butyl
dimethylsilyl)-B-
cyclodextrin in
DB-1701
Mid-
polar From 35 to 260/280
HP-Chiral b
Columns
Chiral compounds (using
a Nitrogen selective
detector, NPD)
beta-Cyclodextrin
in phenyl-based
stationary phase
Mid-
polar From 30 to 240/250

Influence of Abiotic Stress Factors on VOCs Emission from Portuguese Rice Paddy Fields Relation with increased Climate Change 2013
Annexes
T4 - Emission reductions commitments for VOC for 2020 and beyond
Party
Emission levels 2005
(thousands of tons of
VOC)
Reduction from 2005
level (%)
1 Belgium 143 21
2 Bulgaria 158 21
3 Croatia 101 34
4 Cyprus 14 45
5 Czech Republic 182 18
6 Denmark 110 35
7 Finland 131 35
8 France 1232 43
9 Germany 1143 13
10 Greece 222 54
11 Hungary 177 30
12 Italy 1286 35
13 Latvia 73 27
14 Lithuania 84 32
15 Luxembourg 9.8 29
16 Netherlands 182 8
17 Norway 218 40
18 Poland 595 25
19 Portugal 207 18
29 Romania 425 25
30 Slovakia 73 18
31 Slovenia 37 23
32 Spain 809 22
33 Sweden 197 25
34 Switzerland 103 30
35 United Kingdom of Great Britain
and Northern Ireland 1088 32
36 European Union 8842 28
(Adapted from: UNECE, 2012)
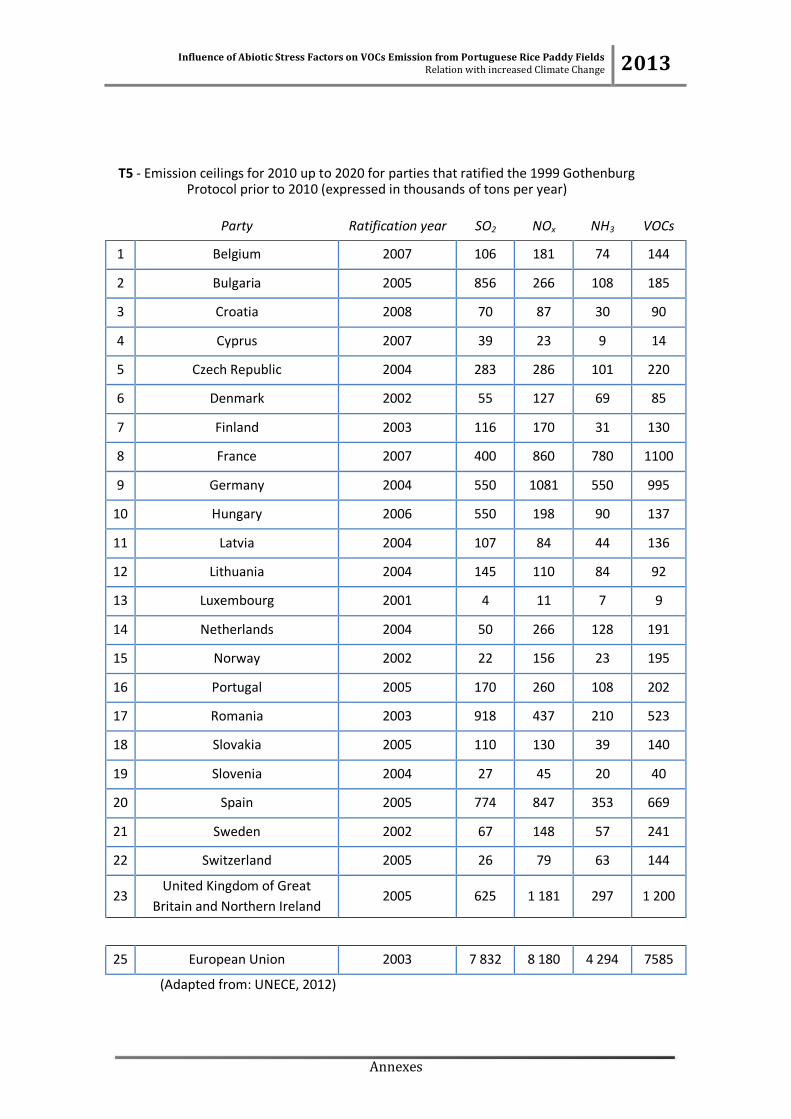
Influence of Abiotic Stress Factors on VOCs Emission from Portuguese Rice Paddy Fields Relation with increased Climate Change 2013
Annexes
T5 - Emission ceilings for 2010 up to 2020 for parties that ratified the 1999 Gothenburg Protocol prior to 2010 (expressed in thousands of tons per year)
Party Ratification year SO2 NOx NH3 VOCs
1 Belgium 2007 106 181 74 144
2 Bulgaria 2005 856 266 108 185
3 Croatia 2008 70 87 30 90
4 Cyprus 2007 39 23 9 14
5 Czech Republic 2004 283 286 101 220
6 Denmark 2002 55 127 69 85
7 Finland 2003 116 170 31 130
8 France 2007 400 860 780 1100
9 Germany 2004 550 1081 550 995
10 Hungary 2006 550 198 90 137
11 Latvia 2004 107 84 44 136
12 Lithuania 2004 145 110 84 92
13 Luxembourg 2001 4 11 7 9
14 Netherlands 2004 50 266 128 191
15 Norway 2002 22 156 23 195
16 Portugal 2005 170 260 108 202
17 Romania 2003 918 437 210 523
18 Slovakia 2005 110 130 39 140
19 Slovenia 2004 27 45 20 40
20 Spain 2005 774 847 353 669
21 Sweden 2002 67 148 57 241
22 Switzerland 2005 26 79 63 144
23 United Kingdom of Great
Britain and Northern Ireland 2005 625 1 181 297 1 200
25 European Union 2003 7 832 8 180 4 294 7585
(Adapted from: UNECE, 2012)

Influence of Abiotic Stress Factors on VOCs Emission from Portuguese Rice Paddy Fields Relation with increased Climate Change 2013
Annexes