Embed Size (px)
Citation preview

U T T E R W O R T H I N E M A N N
0140-7007(95)00025-9
Int. J. Re]H.q. Vol. 18, No. 5, pp 297-307, 1995 Copyright © 1995 Elsevier Science Ltd and IIR
Printed in Great Britain. All rights reserved 0140-7007/95/$10.00+ .00
Influence of product thickness, chamber pressure and heating conditions on production rate of freeze-dried yoghurt
N. K. Sharma Department of Mechanical Engineering, G. B. Pant University of Agriculture and
Technology, Pantnagar (Nainital), UP 263145, India C. P. Arora
Department of Mechanical Engineering, Indian Institute of Technology, New Delhi 110016, India
Received 10 M a y 1993; revised 25 March 1995
The effects of product thickness, chamber pressure and heating conditions on product temperature profiles and production rate of freeze-dried yoghurt were investigated experimentally. Three sample thicknesses - 3.8 mm, 6.2 mm and 9.4 mm - were tested at chamber pressures of 0.01 and 0.5 mmHg. The production rate increased by decreasing product thickness in contact heating through the bottom of the frozen layer, whereas no significant change was observed in radiant heating. A reduction in chamber pressure from 0.50 to 0.01 mmHg increased the drying time in radiant heating. Maximum production rate was obtained when the thickness of dried product was 6.2 mm, when heat was transferred simultaneously through the frozen and dried layers, and the chamber pressure was at 0.01 mmHg. Use of the product tray developed in this study prevents the growth of dry layers at the contact surfaces. (Keywords: freeze-drying; yoghurt; production rate)
Influence de l'epaisseur du produit, de la pression dans la cuve due lyophilisateur et des conditions de
chauffage sur la vitesse de production du yoghurt lyophilse
On a effectub des btudes expkrimentales portant sur les effets de l'bpaisseur du produit, de la pression dansia cure du lyophilsateur et des conditions de chauffage, sur les profils de tempbratures et la vitesse de production du yoghurt lyophilisb. On a essayb trois bpaisseurs: 3,8 mm, 6,2 mm et 9,4 mm gz des pressions 0,01 et de 0,5 mmHg. La rdduction de l'dpaisseur du produit a permis d'augmenter la vitesse de production lors de l'utilisation du chauffage par contact par le fond de la couche congelbe, alors que, pour le chauffage par radiation, aucun changOment n'a ~tO constat~. Le passage de la pression de la chambre de 0,50 ~ 0,01 mmHy s'est traduit par l'augmentation du temps de sechage dans le cas de chauffage par radiation. La vitesse maximale de production a btb obtenue avec une bpaisseur de produit sec de 6,2 rnm et une pression de cure de 0,01 mmH9 et lorsqu'on a transfdrb de la chaleur simultankment par les couches congelbes et dbj~ sech~es. Par ailleurs, on a mis au point, au cours de cette btude, un bac produits, dont l'utilisation permet d'bviter la croissance de couches seches aux surfaces de contact. Mots clfs: lyophilisation, yoghurt, chauffage, vide, production, vitesse
Nomenclature
L m
N
q s(t) t
V x
X
Thickness of the product being dried (mm) Sample mass (g) Water vapour flux (kg water/kg dry matter m - 2 S - 1 )
Heat flux (W m-2) Sublimation interface position at time t Time (s or h) Sample volume (cm 3) Coordinate Fraction of initial moisture remaining in the product on absolute basis (g water/g initial moisture content)
Greek symbols
tr Porosity p Density (g cm-a)
Subscripts
l Dry region 2 Frozen region end End of drying i Ice in Start of drying r Radiant wv Water vapour
297

298 N. K. Sharma and C. P. Arora
The nutritional and therapeutic effects of yoghurt are attributed to fermentative changes in the milk and/or metabolic effects of the yoghurt microflora on the digestive system, especially the enhancement of lactase activity 1'2. However, the shelf life of yoghurt in its natural form is short, but can be enhanced by spray- or freeze-drying. The latter method is more suitable for retaining the original biological characteristics of the material 3. Because of its therapeutic significance, more and more food products based on freeze-dried yoghurt are being developed 4'5. Previous studies on the freeze- drying of yoghurt pertain to aroma retention 6, the quality characteristics of the product and its shelf-life v, the selection of bacterial cultures that can withstand lyophilic treatment 3, the production of an instant form 8, the influence of freezing and freeze-drying on the survival of organisms used in manufacture 9, the effect of milk solids concentration on the freeze-drying rate and quality of the product 10, and prediction of the transient temperature distribution during freeze-drying 11. However, there are no systematic studies on the effects of drying conditions, such as the method of heat transfer, sample thickness and chamber pressure, on the productivity of the process.
The potential benefit of supplying heat by contact heating through a frozen layer to the sublimation interface was recognized by Harper and Tappe112. However, little progress in this mode of heating could be made, owing to the need to maintain the temperature of the contact heater platen below the melt-constraint of the product, to poor contact between the product and the heating platen, and to the development of dry layers at the contact surfaces 13.
Several types of finned tray have been developed for use in batch freeze-dryers to improve the drying rate 14. None of these tray designs has any mechanism to check the growth of dry layers at the contact surfaces. Owing to a large contact surface area, drying rates are fast initially, because there is little resistance either to heat transport from the platens or fins to the material, or to vapour transport from the material to the condenser. However, as drying progresses, heat transfer from the platen to the sublimation interface reduces, owing to the growth of dry layers at the contact surfaces. Hence, even with the use of fins, the limitation of heat transfer from the platen to the subliming interface is not overcome. If the growth of dry layers at the contact surfaces is checked, the heat transfer limitation is obviated. The use of microwave heating accelerates the drying process but the problems encountered, namely the tendency to glow discharge in the pressure range 0.1-5.0 torr, which can cause ionization of gases in the chamber and deleterious changes in the food as well as loss of useful power and control difficulties, substantially outweigh the advantages of microwave freeze-drying 15.
Using a numerical model and taking skimmed milk as a model material, Millman 16 studied the effect of various heating conditions, sample thicknesses and chamber pressures on drying time. He concluded that, for optimum productivity, large sample thicknesses should be used, chamber pressures should be kept at the lowest values, and the upper and lower heating platens should be independently controlled so that the product temperatures in the dried and frozen regions are brought to their maximum permissible values and maintained during drying. However, experimental validation of the model
was not reported by him. This model cannot be used for other products, as variations in the thermal and mass transport properties with temperature and pressure and bound water profile data of the product are needed for the numerical solution. Further, in a cabinet-type plate freeze-dryer, it is not feasible to control simultaneously the upper and lower heating platens at different temperatures.
It is difficult to provide a general theoretical treatment of the freeze-drying process, as the drying mechanisms and the optimum drying conditions depend not only on the physicochemical properties of the frozen materials, freezing rate and heating methods, but also on the method of vapour removal 17. Therefore, the only recourse is to carry out experimental studies on freeze-drying of a product to optimize the processing parameters.
Consequently, the effects of product thickness, heating methods and chamber pressure on the production rate of freeze-dried yoghurt were investigated experimentally to determine the optimum drying conditions. The study also envisaged the development of a product tray to prevent the growth of dry layers at the contact surfaces, for improving heat transfer to the sublimation interface.
Materials and methods
Materials
Fresh cow milk obtained from the Livestock Research Centre of the University of Pantnagar, India, was used in this study.
Cultures
Streptococcus thermophilus-YHS and Lactobaeillus delbrueckii subsp, bulgaricus-YHL, obtained from the National Dairy Research Institute, Karnal, India, were used to prepare the yoghurt. The cultures were maintained in sterilized skimmed milk by fortnightly transfers, and stored at 4 + 1 °C between transfers.
Yoghurt preparation
For yoghurt preparation, the milk was heated to 85 °C for 30 min. The total solids in the milk were increased by adding non-fat dry milk (NFDM) (moisture 5%, fat 2.7%, protein 35.0%), at 5% (w/v) level 1°. The milk was then cooled and inoculated with S. thermophilus and L. delbrueckii subsp, bulgaricus in the ratio of 1:1 @ 3% v/v. The inoculated milk was incubated at 42 °C for 3.5 h. The yoghurt thus prepared was kept at 4___ 1 °C until use. The total solids in the yoghurt are 18.8%.
Experimental apparatus and procedure
Apparatus. The experimental arrangement for this study is shown in Figure 1. The drying chamber had a cylindrical mild steel enclosure with an inside diameter of 550 mm and an inside depth of 500 mm. It was provided with a top cover plate of Plexiglas (15 mm thick) for viewing the sample during freeze drying. The vacuum was produced using a two-stage rotary vacuum pump with a displacement of 150 l; about 3 rain were required to obtain a pressure of 0.1 mmHg in the chamber. The vacuum was measured using a vacuscope. The refrigeration

Production rate of freeze-dried yoghurt 299
Data logger
- - ~ . . . . ~ i'l
Ice junction rO [
Figure 1 Experimental set-up Figure 1 Appareil expbrimental
Thermocouples
Solenoid
Surge
Vacuum pump
Connector
Radiator
Balance
Vacuscope Drying chamber
Product-tray - Insulation
==t - ~ - ] Temperature controller
Freeze
, Condenser I
I L .
I ~ " Insulation
j Cooling coil
_ Secondary trap
))Condenser ))
Drier
2~
u
system maintained a temperature of - 5 4 + 3 °C in the cylindrical condenser.
The product tray developed in this investigation is circular in shape (70 mm inside diameter and 10 mm in height) with nylon side walls and fiat aluminium bottom (Figure 2). Five copper-constantan thermocouple (32 SWG) probes were permanently fixed with the help of a thin plastic strip in the centre of the product tray, equally spaced at 3 mm from the bottom of the sample, and made it possible to take the temperature measurements at the same point in the samples from run to run. The thermocouples were calibrated with a standard mercury- in-glass thermometer. Thermocouple probes were run along the surface to the side of the sample holder to provide an isothermal path to minimize conduction errors along these probes (Figure 2). The leads were also shielded from the heating platen by passing them through the insulation in order to prevent direct radiation heat transfer to the wire.
Figure 3 shows the arrangement of the heating platens and product tray. The vacuum chamber was mounted on an angle iron frame to isolate it from the main apparatus to minimize the effect of vibrations on the sample. A top-loading digital pan balance with a sensitivity of _+0.01 g was installed in the vacuum chamber. Contact heating platen and the product tray were placed in the middle of the top pan. A separate rack with a heating platen was provided for radiant heating. On the top side of the top platen and the bottom side of the bottom platen were attached nichrome resistance heaters, which gave a temperature varying across the
- - Dried region - - Frozen region
Thermocouple wires ~ Interface
Connector /~ II io Steel pms
--_~x = S(t', x = L
' LAluminium bot m Figure 2 Schematic of product tray
Figure 2 Diagramme schc;matique de support ?1 produits
[ Radiant heating platen
I_ / 200 mm #p "1 I- [
Figure 3 Arrangement of the heating platens and the product tray Figure 3 Ammbnagement des cylindres de chauff?tge et du bac ft produits
300 N. K. Sharma and C. P. Arora
inner surface of the platen by less than +0.5°C after steady state was reached. The contact heating platen and radiator temperatures were controlled by a two-channel temperature controller (within +3.0°C and +2.0°C respectively), which received signals from copper- constantan thermocouples mounted on the inner sides of the platen.
Procedure. Three samples with weights 16.0, 24.0 and 40.0 g respectively were used. Weighed samples along with the heating platen were kept overnight in a deep freezer maintained at -24_+2°C. Before loading the sample, the freeze-dryer was run for about 2 h to obtain a steady minimum temperature of - 54_+ 3 °C in the freeze condenser. Before each run, the balance was calibrated against standard weights. Samples, along with the contact heating platen, were removed quickly from the freezer and placed on the balance in the vacuum chamber. Thermocouple and heater wire connections were made quickly with the help of quick connectors and the vacuum pump started. In about 1 min the vacuum pump brought down the chamber pressure to below the triple point of water. Various wire leads to the heating platen and the sample were hung loosely during a run, with the result that the weight registered by the balance was affected by only about _+0.1 g during a typical run. A constant minimum temperature of the sample was obtained in about 30 min at a chamber pressure of 0.01 mmHg and in about 45-50 min at a chamber pressure of 0.5 mmHg. The heating platen supply was then switched on.
Observations of the sample weight, vacuum chamber pressure and temperatures at various locations in the sample were recorded initially for half an hour at 5 min intervals and subsequently at 30 min intervals. The ice point was used as the cold junction throughout the work. The sample was considered to be fully dried when the weight change indicated by the balance was not more than _+0.05 g over a period of 30 min. After the drying process was complete, the samples were removed and the thickness measured with a digital micrometer at four to five locations. Thereafter, the samples were stored in glass-stoppered containers at 4_+ 1 °C.
It was found difficult to control the vacuum chamber pressure with an air admittance valve. The vacuum chamber pressure was controlled by changing the grade ofoil in the vacuum pump. With this method the chamber pressure could be controlled to within _+0.05 mmHg at a chamber pressure of 0.5 mmHg and to within _+0.01 mmHg at a chamber pressure of 0.01 mmHg.
Determination of density and porosity
Density. The density was determined by measuring the end weight of the dried sample and knowing its volume by micrometer-measured sample dimensions.
Porosity. The porosity was determined by measuring the initial and end weights of the sample during drying and the volume of the sample using the expression
mln -- men d tr= (1)
p~V
where min is the initial weight of the frozen sample, me. d is the weight of the sample at the end of the drying process, and Pi is the density of ice.
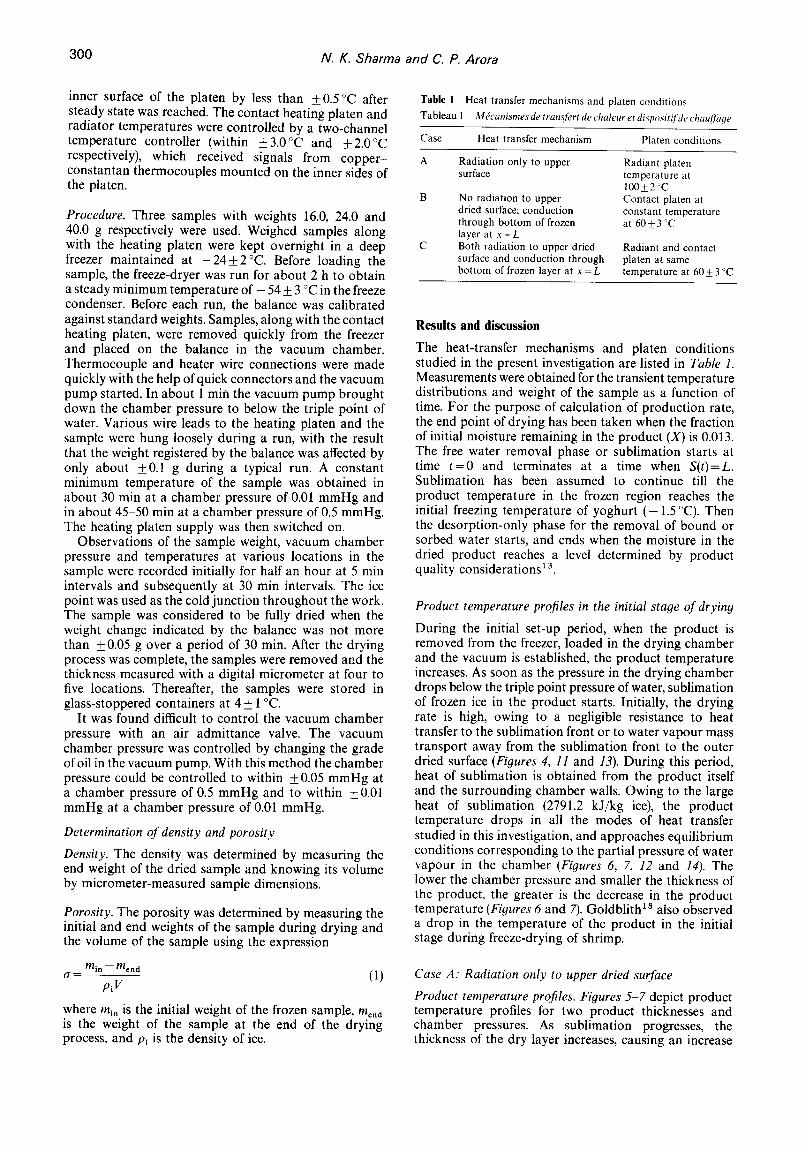
Table 1 Heat transfer mechanisms and platen conditions
Tableau 1 M &'anismes de transfert de chaleur et disposit!]'de chau[]aqe
Case Heat transfer mechanism Platen conditions
A Radiation only to upper Radiant platen surface temperature at
100_+2 ~'C B No radiation to upper Contact platen at
dried surface; conduction constant temperature through bottom of frozen at 60_+ 3 'C layer at x = L Both radiation to upper dried surface and conduction through bottom of frozen layer at x = L
Radiant and contact platen at same temperature at 60_+ 3 °C
Results and discussion
The heat-transfer mechanisms and platen conditions studied in the present investigation are listed in Table 1. Measurements were obtained for the transient temperature distributions and weight of the sample as a function of time. For the purpose of calculation of production rate, the end point of drying has been taken when the fraction of initial moisture remaining in the product (X) is 0.013. The free water removal phase or sublimation starts at time t = 0 and terminates at a time when S(t)=L. Sublimation has been assumed to continue till the product temperature in the frozen region reaches the initial freezing temperature of yoghurt ( - 1.5 °C). Then the desorption-only phase for the removal of bound or sorbed water starts, and ends when the moisture in the dried product reaches a level determined by product quality considerations13.
Product temperature profiles in the initial stage of drying
During the initial set-up period, when the product is removed from the freezer, loaded in the drying chamber and the vacuum is established, the product temperature increases. As soon as the pressure in the drying chamber drops below the triple point pressure of water, sublimation of frozen ice in the product starts. Initially, the drying rate is high, owing to a negligible resistance to heat transfer to the sublimation front or to water vapour mass transport away from the sublimation front to the outer dried surface (Figures 4, 11 and 13). During this period, heat of sublimation is obtained from the product itself and the surrounding chamber walls. Owing to the large heat of sublimation (2791.2 kJ/kg ice), the product temperature drops in all the modes of heat transfer studied in this investigation, and approaches equilibrium conditions corresponding to the partial pressure of water vapour in the chamber (Figures 6, 7, 12 and 14). The lower the chamber pressure and smaller the thickness of the product, the greater is the decrease in the product temperature (Figures 6 and 7). Goldblith is also observed a drop in the temperature of the product in the initial stage during freeze-drying of shrimp.
Case A: Radiation only to upper dried surface
Product temperature profiles. Figures 5-7 depict product temperature profiles for two product thicknesses and chamber pressures. As sublimation progresses, the thickness of the dry layer increases, causing an increase

Production rate of freeze-dried yoghurt 301
in the water vapour mass transfer resistance across the dry layer. The temperature of the sublimation interface increases despite maintaining a constant chamber pressure and radiator temperature (Figure 8). The sublimation interface temperature and its location were calculated from the measured product temperature profiles and the sample weight loss history during a drying run using the method proposed by Ma and Peltre 19. The product temperature profiles obtained in this study are similar to those obtained by Goldblith et al.18 during freeze-drying of 12.53 mm thick salmon steaks, but different from those obtained by Hatcher et al. 2° for a 50 mm thick sample of meat. Sandall 2~ also observed a variation in ice core temperature in several experimental runs despite maintaining a constant chamber pressure and constant sample surface temperature during freeze-drying of 6 mm thick samples of poultry meat. While freeze-drying aqueous coffee solutions, Sagara 22 observed that for a 25 mm thick sample, a variation in the product surface temperature of 19.1 °C to 70.7 °C had little effect on the sublimation interface temperature, thereby proving that the drying process was controlled by heat transfer. However, the present study shows that, for thin samples, the radiant freeze-drying process is not controlled by heat transfer. Sandall 2~ and Goldblith ~ have made similar observations.
In this study, it was seen that for a constant sample thickness, as the chamber pressure is reduced from 0.5 to 0.01 mmHg, the ice front temperature undergoes a wide variation (Figures 7, 8, 10 and 12). This may be explained on the basis of variation of the effective thermal conductivity of the dried layer of yoghurt with the sample thickness and chamber pressure. The effective thermal conductivity of freeze-dried yoghurt was calculated from the drying data using the URIF model proposed by King ~3. The effective thermal conductivity (Table 2) increases with the sample thickness as well as the chamber pressure. At higher chamber pressure and for large sample thickness, a large portion of the heat energy supplied to
14
'7 E 12
10
% X
4
.=.
¢~ 0
~--- t teater power on
0 I 2 4 5 6 7 8
Drying time (h)
F i g u r e 4 Effect of product thickness on drying rate in radiant heating: case A. Radiator temperature 100 + 2 °C. Chamber pressure 0.5 mmHg. Condenser temperature - 5 2 + 1 °C. Dried product thickness: O, 3.8 mm; Vq, 6.2 mm; A, 9.4 mm
Figure 4 Effet de l'~paisseur du produit sur le temps de sechage lors du chauffage pay rayonnement; cas A. Tempbrature du radiateur: 100 4- 2°C. Pression de cure." 0,5 mmHg. Tempbrature du condenseur: -52-+ I°C. Epaisseur due produit sechb: O, 3,8 ram; 6,2 ram; A , 9,4 mm
I 0 I 2 3 4 5 6
Drying time (h)
1.0
0.9
0.8
X --0.7
--0.6 '~
~0.5 E
0.4 "F.
- 0.3 .r~
-0 .2 U~
-O.I
F i g u r e 5 Product temperature profile and moisture loss during drying of 6.2 mm thick sample in radiant heating: case A, run 2. Chamber pressure 0.5 mmHg. Condenser temperature - 52 + 1 "C. Temperatures: I , radiator; D, just below surface; Zk, 3.2 mm from surface; O, bottom. x, fractional initial moisture
Figure 5 Profil de tempbrature du produit et perte d'humiditb lors du sechage d'une ~chantillon de 6,2 mm d'@aisseur par chauffaye d rayonnement: cas A, deuxi~me essai. Pression de chambre: 0,5 mmH9. Tempbrature du condenseur: - 5 2 + 1C. Temp&atures: I , radiateur; ~ , j u s t e en-dessous de la surJace," A , ~'~ 3,2 ram: @, au fimd, x ,Jiaction de rhumiditk initiale
I oo 1.0 0.9
0.8 90 8c 0.7 X 7c g
G 6C 0.6 ,~
9 412 0.5 E = 3C "~
".7-.. ~2c o.4 i~_ ,c
-20 0.2 -3C • -4C O. I -5C ~£ 0.0
0 I 2 3 4 5 6 7 8 9
Drying time (h)
F i g u r e 6 Product temperature profile and moisture loss during drying of 9.4 mm thick sample in radiant heating: case A, rtm 3. Chamber pressure 0.5 mmHg. Condenser temperature - 52 + 1 °C. Temperatures: I , radiator; E],just below surface; V, 3.4 mm from surface; A, 6.4 mm from surface; O, bottom, x, fraction initial moisture
Figure 6 Profil de tempbrature du produit et perte d'humiditb lors du sechage d'une ~chantillon de 9,4 mm d'i'paisseur dans le cas de chat4ffhge par rayonnement: cas A, troisbme essai. Pression de chambre: 0,5 mmH9. Tempbrature du condenseur." - 5 2 + I°C. Tempbratures." I , radiateur, [~, juste en-dessous de la surfiwe; V , h 3.4 mm de la surface: h & , h 6,4 mm de la surface." @ au,fond, x , fi'action d'humit~ initiale
the sample surface by the radiator is transported to the ice front for sublimation of ice, and sensible heating effects are negligible. Consequently, variations in the ice front temperature for a large portion of drying run are small (Figures 6 and 9). On the other hand, at low chamber pressure, owing to the low effective thermal conductivity

302 N. K. Sharma and C. P. Arora
of the dry layer, a greater portion of the heat energy supplied by the radiator is dissipated as sensible heat of the dry layer. Hence the temperature at the ice front increases as drying progresses (Figure 10). A numerical model based on the above reasoning predicted a transient temperature distribution in the dried region during-freeze drying of yoghurt for both constant as well as variable ice front temperature 11.
Dryin9 time and production rate. In radiant heating, a rapid drying rate can be achieved by decreasing the sample thickness (Figure 4). As anticipated, with an increase in sample thickness, the drying time increases. However, not much change in production rate (kg dry material m -2 h-l) was observed with the increase in sample thickness. The sample with a thickness of 3.8 mm showed a slightly higher production rate compared with 6.2 and 9.4 mm thick samples (Table 3). Similar results have been obtained by Millman 16 for freeze-drying of skimmed milk. With the increase in sample thickness from 3.8 mm to 9.4 mm, the desorption time decreased from 41.7% to 32.4% of the total drying time (Table 3).
110 100
90 G 80 o
70 .o 60
50 ~. 40 E 30 o [.., 20
I0 0
-I0 -20 -30 -40 - 5 0
0 1 2 3 4 5 6 Drying time (h)
- 1.0
- 0 .9
- 0 . 8 X
- 0 .7 "5
- 0 . 6 E
- o.5 i,~
- - 0 . 4 . o
-0.3 ~,
- 0.2
-0 .1
I 0.0 7
Figure 7 Product temperature profile and moisture loss during drying at chamber pressure of 0,1 mmHg in radiant heating: case A, run 5. Sample thickness 6.2 mm. Condenser temperature - 5 2 + 1 °C. Temperatures: II, radiator; U], just below surface; A, 3.2 mm from surface; ©, bottom. ×, fraction initial moisture
Figure 7 Profil de temperature du produit et perte d'humiditb lors du sechage fi une pression de cuve de 0,1 mmH 9 dans le cas due chauffage par rayonnement: cas A, cinquiOme essai. Epaisseur de I'~chantillon: 6.2 mrn. Tempbrature du condenseur," -52+_1°C. Tempbratures." , , radiateur; I--],juste en-dessous de la surface," A , it 3,2 mm de la surface; O, au fond, X, fraction d'humiditb initiale
During sublimation, water vapours evolved at the sublimation interface move outwards towards the surface and then diffuse in the chamber and ultimately freeze in the freeze-condenser. Some of the water vapour molecules get adsorbed in the dry layer; the remaining molecules escape to the drying chamber. The numbers of molecules adsorbed in the dry layer and those escaping depend upon the temperature of the dry layer and the partial pressure of water vapour at the exposed surface of the product. The larger the dry layer temperature and the lower the partial pressure of water vapour at the exposed surface of the sample, the less is the moisture adsorbed in the dry layer. With the increase in sample thickness, the sublimation time increases and the dry layer is exposed to higher temperatures for a longer time (Figure 6, Table 3). Consequently, the amount of adsorbed
~ " . . - Exposed surface
6 5 4 3 2 1 0 Distance from e x p o s e d s u r f a c e (mm)
Figure 8 Location of sublimation interface and its temperature during drying of 6.2 mm thick sample in radiant heating: case A, run 2. Chamber pressure 0.5 mmHg. ---, interface position (calculated)
Figure 8 Emplacement de l'interface de sublimation et la tOmp~rature de celle-ci Iors du sechage d'un ~chantillon d'une ~paisseur de 6,2 mm dans le cas de chauffage pay rayonnement; cas A, deuxi~me essai. Pression de cure: 0,5 mmHg. - - - , position de l'interface (calcul~e)
T a b l e 2 Density, porosity and effective thermal conductivity of freeze-dried yoghurt
Tableau 2 DensitY, porositk et conductivit~ thermique effective du yoghurt lyophillis~
Dried Density Run Chamber product of dried no. pressure thickness product
(mmHg) (mm) (g cm- 3) Porosity
Effective thermal conductivity
(W m -1 K -1)
1 0.5 3.8 0.224 0.81 0.274 2 0.5 6.2 0.217 0.80 0.412 3 0.5 9.4 0.235 0.81 0.444 4 0.01 3.8 0.225 0.81 0.229 5 0.01 6.2 0.212 0.80 0.332

Production rate of freeze- dried yoghurt 303
moisture at the end of the sublimation period in thick samples is lower than it is in thin samples. Millman 1° has made similar observations on freeze drying of skimmed milk.
Effect of chamber pressure on drying time. With a decrease 'in chamber pressure, the total drying time increases (Table 3). Further, the sublimation time as a percentage of the total drying time increases. A decrease in chamber pressure decreases heat transfer from the product surface to the sublimation interface, owing to the lower thermal conductivity of the dry layer, resulting in an increased sublimation time. However, a reduction in chamber
/ 7/h--'" I / / / ¢ / f f - ~ 3 . 5 h
--'b . . f 3.
E '(; n,~ / / / / / / / - j a - - - - - - 2 h -sH W/// / ,4--- , . , ,
i " x / 1 / / / / - - - - ' " - 1 2 • • • .Sh
-20 f -24
I I I I I I I I I 9 8 7 6 5 4 3 2 I 0
Distance from exposed surface (ram)
Figure 9 Location of sublimation interface and its temperature during drying of 9.4 mm thick sample in radiant heating: case A, run 3. Chamber pressure 0.5 mmHg. - - - , interface position (calculated)
Figure 9 Emplacement de l'interface de sublimation et la tkmp&ature de celle-ci lots du sechage d'un ~chantillon d'une @aisseur de 9,4 mm dans le cas de chauffage pay rayonnement; cas A, deuxibme essai. Pression de cure: 0,5 mmHg. - -, position de I'interface (calcul~e)
pressure increases the mass transfer rate. Consequently, the desorption time reduces (Table 3). An increase in the chamber pressure increases the heat transfer from the product surface to the sublimation interface owing to a higher thermal conductivity of the dry layer, which reduces the sublimation time. However, the desorption time increases. Still, the net effect of an increase in chamber pressure is a reduction in the total drying time. With the increase in chamber pressure, the sublimation temperature also increases. Hence the pressure to be maintained in the chamber will depend upon the melt
1 2 - 8% 0 / / ~ Exposed surface
i./ / I•
Frozen ~ 1.5 h /
-2G • ~ /
-24
, O
-2~ I I I I I I 5 4 3 2 1 0
Distance from exposed surface (ram)
Figure 10 Location of sublimation interface and its temperature during drying at chamber pressure of 0.01 mmHg in radiant heating: case A, run 5. Sample thickness 6.2 mm. , interface position (calculated)
Figure 10 Emplacement de I'interface de sublimation et la t~mpkrature de celle-ci lors du sechage ~ une pression de cure de 0,01 mmHg, dans le cas de chauffage par rayonnement; cas A, cinquibme essai. Epaisseur de l'kchantillion: 6,2 ram, - - , position de I'interface (calcul~e)
Table 3 Effect of heating conditions, sample thickness and chamber pressure on drying time and production rate
Tableau 3 Effet des conditions de chauffage, de lYpaisseur de l'~chantillion et de la pression de la cuve lyophilisateur sur le temps de sechaoe et la vitesse de production
Total Percentage Percentage Heating Sample Chamber drying Sublimation of total Desorption of total Production conditions thickness pressure time time time time time rate
(mm) (mmHg) (min) (min) (min) (kg m- 2 h - 11
A 3.8 0.5 180 105 58.3 75 41.7 0.2752 6.2 0.5 330 204 61.8 126 38.2 0.2532 9.4 0.5 510 345 67.6 165 32.4 0.2532 3.8 0.01 225 135 60.0 90 40.0 0.2546 6.2 0.01 345 224 64.9 121 35.0 0.2243
B 3.8 0.01 120 66 55.0 54 45.0 0.4266 6.2 0.01 210 100 47.6 110 52.4 0.3688 9.4 0.01 360 135 37.5 225 62.5 0.3578
C 3.8 0.01 105 70 66.6 35 33.4 0.4899 6.2 0.01 135 75 55.5 60 44.5 0.5945 9.4 0.01 300 210 70.0 90 30.0 0.4294

304 N. K. Sharma and C. P. Arora
constraint of the product being dried ~3. Another option to improve the drying rate is to maintain a higher chamber pressure during the sublimation phase and to reduce it during desorption. In contact heating through the frozen layer and for the case of simultaneous heating through the frozen and dried regions, the process is rate limited to the mass transfer resistance of the dry layer ~3. Hence, for these heating conditions, the chamber pressure should be kept to a minimum.
Case B." No radiation to upper dried surface; conduction through the bottom of the frozen layer
Product temperature profiles. In this mode of heating, there is a tendency for drying to take place from the edges of the frozen layer and at surfaces in contact with the heating platen. Often, with this type of heating, the frozen layer detaches itself from the tray, initially at the edges and then towards the centre where underside drying occurs 23. Consequently, a thermal and vapour barrier builds up, limiting further drying of the material. The development of a dry layer at the contact surfaces is clearly indicated in the studies of Carn and King 24. At the start of drying, the subliming vapour pressure is negligible, as the sublimation front has not developed. If the vapour pressure at the interface between the bottom of the product and the tray is more than the pressure due to product weight and the sublimation pressure, the product lifts off the tray, causing vapour to escape, and
16
b, '7 E 14
~IE ,2
7
8
6 e-
20--
4 -
2 -
0 I I 0 I
Heater power on
2 3 4 5 Drying time (h)
Figure I t Effect of product thickness on drying rate in contact heating through the bot tom of the frozen layer: case B. Contact heating platen temperature 6 0 + 3 ° C . Chamber pressure 0.01 mmHg. Condenser temperature -51_+1°C . Dried product thickness: O, 3.8 ram; 73, 6.2 mm; A , 9.4 m m
Figure 11 Effet de l'~paisseur du produit sur la vitesse de sechage lots du chauffage par contact d travers le fond de la couche cong~l~e: cas B. Temp&ature du dispositif de chauffage par contact: 60 _+ 3 °. Pression de cure: 0,01 mmH 9. Temperature du condenseur: - 5 1 + 1°C. Epaisseur du produit sech~: O, 3,8 ram; ~ , 6.2 ram; A, 9,4 mm
50
40
30
g 20
.~ 1o
~ - I O [..
-20 I
-30
-40
-50
60
s S
D
0 I 2 3
Drying time (h)
1.0
0.9
0.8 X
0.7
0.6 E
0.5 '~- r .
0.4 .~
0.3 2
0.2
0.1
0.0 4
Figure 12 Product temperature profile and moisture loss during drying in contact heating through the bot tom of the frozen layer: case B, run 7. Sample thickness 6.2 mm. Chamber pressure 0.2_+0.i mmHg. Condenser temperature - 5 1 + 1 °C. Heating platen temperature 6 0 + 3 °C. Product temperatures: D, just below surface; ~ , 3.2 mm from surface; O, bottom, x , fraction initial moisture
Figure 12 Profil de temp&ature du produit et perte d'humiditb lors du sechaqe, dans le cas du chauffage par contact h travers le .[bnd de la couche congelbe: cas B, septiOme essai. Epaisseur de l'bchantillon; 6,2 ram. Pression de cure." 0,2+0,1 mmHg. Tempbrature du condenseur."
51 +_ 1°C. Temp&ature du dispositif de chauffaye: 60_+ 3°C. Temp&a- tures du produit: D, juste en-dessous de la surface; A , ~ 3,2 mm de la surface; O, au fired, x , fraction de l'humidit~ initiale
underside drying occurs 25. For the three product thicknesses studied (3.8, 6.2 and 9.4 mm), it was observed that the product actually lifted off the tray in the initial stage of drying. To overcome this difficulty, three steel pins (0.7 mm diameter and 15 mm long) were inserted radially through the nylon side-wall of the product tray (Figure 3). This arrangement also checked the growth of dry layers at the contact surfaces for a large portion of the drying run. During trials, drying was interrupted, samples removed and cut to observe the growth of the dry layer at the contact surfaces. It was seen that the product bottom was always frozen.
Although the contact heater platen temperature was much higher than the melt constraint of the product (-1.5 °C) the temperature at the bottom of the product during sublimation did not rise above the melt constraint for the sample thicknesses studied in this investigation (Figure 12). In contact heating through a frozen layer, King t3 has suggested drying with the heating platen temperature maintained below the melt constraint of the product. However, the present study shows that heating platen temperatures can be maintained much above the melt constraint of the product to improve the drying rate, A high thermal contact resistance between the contact heater platen and the bottom of the tray under the vacuum conditions existing in freeze-dryers is beneficial. As drying progresses, the outflowing cold water vapour from the ice front to the exposed surface of the product keeps the temperature of the dry region low. Since heat is not being supplied by a radiator to the outer dried layer, the product temperatures during sublimation in

Production rate of freeze- dried yoghurt 305
the dried region remain lower, compared with the radiant heating condition (Figures 7 and 12).
Owing to the increase in the drying rate with decrease in product thickness, the product temperature during sublimation decreases (Figure 11). As the heater supply is switched on, sensible heating of the product takes place (Figure 12). No constant temperature period was seen in this case. During freeze-drying of concentrated liquid foods by back-face heating, Kumagai et al. 26 also observed sensible heating of the product.
Dryin9 time and production rate. In contact heating through the bottom of a frozen layer, the process is rate limited to the mass transfer resistance of the dry layer 13. With a decrease in the sample thickness this resistance decreases and the productivity improves. This is also borne out of the results of this study (Fioure 11). The data in Table 3 reveal that the production rate increases from 0.3578 to 0.4266 kg m -2 h -~ with a decrease in sample thickness from 9.4 to 3.8 mm. Further, with an increase in sample thickness, the desorption time as a percentage of the total drying time increases. This behaviour is exactly opposite to the results obtained in radiant heating conditions (case A). In contact heating,
b~
E
.i o
exl)
24
22
0
Heater power on
16
10
0 1 2 3 4 5 Drying time (h)
Effect of product thickness on drying rate in simultaneous Figure 13 heating through frozen and dried layers: case C. Radiator and contact platen temperature 60_+3°C. Condenser temperature - 5 1 + l ° C . Chamber measure 0.01 mm Hg. Product thickness: O, 3.8 mm; ~ , 6.2 mm; A, 9.4 mm
Figure 13 Eflet de l'dpaisseur du produit sur la vitesse de sechage lors du chauffaoe simultan~ par d travers des couches congel~es et sech~es (contact et rayonnement): cas C. Tempdrature du radiateur et du dispositif de chauffage par contact; 60_ 3°C. Pression du condenseur: 0,01 mmHg. Epaisseur du produit; O, 3,8 mm; I-], 6,2 ram; ~ , 9,4 mm
7°f F 6O
50
/ o ~ 3o
I ° - ~, s'/
--40-
-50 - -55 0 ! 2
- 1 . 0
- 0 . 9
- 0 . 8
5 - 0 . 7 E
-0.6 :=. ._~ - 0.5 .~
--0.4 ~
--0.3
-~0.2
0.1
I I 0.0 3 4
Drying time (h)
Figure 14 Product temperature profile and moisture loss during drying in simultaneous heating through frozen and dried layers: case C, run 10. Upper and lower heating platen temperature 60 + 3 °C. Sample thickness 5.2 mm. Chamber pressure 0.02_+0.01 mmHg. Condenser temperature -50_+1 °C. Product temperatures: IS], just below surface; A, 3.2 m m from bottom; O, bottom, x , fraction initial moisture
Figure 14 Profil de tempbrature du produit et perle d'humiditb lors du sechage dans le cas de chauffage simultanb par les couches cong~lbe et sech~es: cas C, dixi~me essai. Tempbrature des dispositifs de chauflage supbrieur et infkrieur: 60+-+3~C, Epaisseur de l'bchantillon: 5,2 mm. Pression de cure: 0,02_+0.01 mmHg. Tempbrature du condenseur," - 50 +_ 1 < C. Temp&atures du produit: [~, juste en-dessous de la sur/ace, ~ , h 3.2 mm du [ond: ©, au Jbnd, x , /?action de I'humidit~ initiah,
as the product temperatures in the dry layer are much lower during sublimation than in radiative heating, the amount of adsorbed water in the dry layer is substantial, and increases with an increase in the sample thickness 13. Consequently, the desorption time as a percentage of the total drying time increases with an increase in the sample thickness. However, the total drying times for all the samples studied in this investigation are much lower than for the radiative heating conditions (Table 3). In contact heating (case B), the melt constraint is encountered first, and scorch conditions are not seen during sublimation. To avoid the melt constraint, and to maintain high drying rates, the chamber pressure must be maintained at the lowest value. In terms of product quality, this mode of heating is superior to radiant heating (case A), as drying takes place at much lower temperatures and the drying time is shorter.
Case C: Both radiation to upper dried surface and conduction through the bottom of the frozen layer
Product temperature profiles. As in both radiant and contact heating, at the start of a run the temperature of the product starts decreasing, owing to a fast drying rate (Figures 13 and 14). As the heater supply is switched on, the temperature at various locations in the product starts rising. The exposed surface temperature of the product during sublimation is higher than for the contact heating condition (case B), but remains much lower than for the

306 N. K. Sharma and C. P. Arora
radiative heating condition (case A), owing to a larger flux of cold water vapour through the dry layer (Figure 13). During sublimation, the temperature drop across the frozen region of a thicker sample is larger than for a thin sample. Owing to simultaneous heat transfer through the exposed surface and the bot tom of the product, at the end of sublimation the product temperature at all locations increases sharply, compared with the contact heating condition (case B), resulting in a reduced desorption time (Figure 15, Table 3).
Drying t ime and product ion rate. In simultaneous heating through frozen and dried layers, the production rates are much higher than for the radiative and contact heating conditions (Table 3). With an increase in the sample thickness from 3.8 to 9.4 mm, the drying time increased from 105 to 300 min but the production rate increased at first from 0.4899 to 0.5945 kg m - 2 h - 1 with the increase in sample thickness from 3.8 to 6.2 mm and then decreased to 0.4294 kg m -2 h-1 with a further increase in thickness to 9.4 mm. This is contrary to the results obtained in contact heating (case B), where the production rate increases with decreasing product thickness. In case C, heat flux to the sublimation interface is higher than in case B, owing to heat being supplied through both the frozen and dried layers. More bound water is desorbed during the free water removal phase than in case B. This difference occurs because product temperatures in the dried region for case C are higher than for case B, where the heat is supplied through the frozen layer only (Figure 15). In general, a lower drying temperature and a shorter drying cycle result in improved product quality. Therefore the drying conditions of case C will yield
a product of superior quality along with improved productivity.
Conclusions
The results of this study show that the production rate is not affected significantly by product thickness in radiant heating (case A). Hence large product thicknesses can be used to reduce dead time between loading. In contrast, the production rate improves with decreasing product thickness in contact heating through the bot tom of a frozen layer (case B). In radiant heating, the production rate improves slightly with an increase in chamber pressure from 0.01 to 0.5 mmHg. However, the chamber pressure to be maintained would depend upon the melt constraint of the product being dried.
For simultaneous heat transfer through the frozen and dried layers (case C), the maximum production rate is obtained when the thickness of the dried product is 6.2 mm and the chamber pressure is maintained at 0.01 mmHg. In contact heating through a frozen region and for simultaneous heat transfer through the frozen and dried regions, low operating vacuum chamber pressures are essential to ensure that the temperature of the frozen core is as low as possible and hence allow the use of a higher platen temperature to shorten the drying time. For all modes of heat transfer and dried sample thicknesses studied (3.8, 6.2 and 9.4 ram), it is only the melt constraint that needs to be controlled during sublimation. Steel pins inserted radially through the nylon side-wall of the product tray into the product help to maintain good thermal contact between the product bot tom and the tray during drying.
60[ 50 - 1.0
4013~ I ~" - 0.9 )<
° t \ \ c/,l: s ? I: -o8
20 _0.7 N
- o , = "~-
\ \ t t ' - i ~ ~ - 0.30"4
:f \ \ 0o ?, 00
0 I 2 3 Drying time (h)
Figure 15 Comparative temperature profiles and moisture loss during drying for cases B and C. Sample thickness 6.2 mm. Chamber pressure 0.02 + 0.1 mmHg. Condenser temperature - 51 __+ 1 °C. Heating platen temperature 60+3 °C. Product temperatures: F-l, just below surface;
3.2 mm from surface; O, bottom. ×, fraction initial moisture Figure 15 Comparison des profils de tempbrature et des pertes d'humiditb lors du sechage darts les cas Bet C. Epaisseur de l'bchantillon: 6,2 mm. Pression de cure: 0,02 +_ O. 1 mmHg. Tempbrature du condenseur: -51+_1°C. Tempbrature du dispositif de chauffage; 60+_3°C. Tempbratures du produit: [:], juste en-dessous de ta surface; ~ , ~ 3,2 mm de la surface; O, au fond. x ,fraction de l'humidit$ initiale
Acknowledgements
The authors acknowledge the assistance of Professor B. P. N. Singh, Professor, Post Harvest and Food Process Engineering Department, and Dr B. K. Mittal, Professor and Head, Department of Food Science and Technology, in the preparat ion of this manuscript.
References
1 Deelh, H.C., Tamine, A.Y. Yoghurt: nutritive and therapeutic aspects J Food Protect (1981) 44 78-86
2 Savaiano, D.A., Levitt, M.D. Nutritional and therapeutic aspects of fermented dairy products ASDCJ Dentistry Child (1984) 5I(4) 305 308
3 Vitanov, T., Nikolov, N., Boydasheva, L. Lyophilisation of Bulgarian yoghurt Proc 13th lnt Cong Refrig (Ed W.T. Pentzer) Van Nostrand/AVl, New York (1973) 773-779
4 Costanzo, L., Calcaveeehia, B. Innovative freeze-drying products, NV Dairy Sci Abstr 53 No. 3546 (1991)
5 Osacheva, V.A., Kholodova, T.A. Freeze-dried dietetic products Molochnayai Myasnaya Promyslennost (1989) 6 22-24
6 Vietz, L. Freeze drying of yoghurt Nova Proizv (1966) 17 262 (Dairy Sci Abstr 30, No. 2617)
7 Vitanov, T.Kh., Nikolov, N.M. Effect of freezing on the quality of freeze-dried yoghurt Izvestiya, Nauchnoizsledovatelski lnstitut po Mlechna Promishlenost, Vidin (1971) 5 151-162
8 Blanchaud, M. Fermented milk based food and its preparation French Patent 2093 908 (1972)
9 Bozoglu, T.F., Ozilgen, M., Bakir, U. Survival kinetics of lactic acid starter cultures during and after freeze-drying Enzyme Microb Technol (1987) 9 531-537
10 Sharma, N.K., Arora, C.P., Mital, B.K. Influence of concentration of milk solids on freeze-drying rate of yoghurt and its quality J Food Proc Eng (1992) 15 187-198

Production rate of freeze- dried yoghurt 307
11 Sharma, N.K., Arora, C.P. Prediction of transient temperature distribution during freeze drying of yoghurt Drying Technol (1993) 7 1863-1883
12 Harper, J.C., Tappel, A.L. in Advances in Food Research Vol. 7 (Eds G.F. Stewart and E.M. Mark) Academic Press, New York (1957)
13 King, C.J. Freeze-Drying of Foods CRC Press, Cleveland, OH (1971)
14 Dalglish, J.MeN. Freeze-Drying for the Food Industries Elsevier, New York (1990)
15 Bouldoires, J.P., Le Viet, T. Microwave freeze-drying of granulated coffee Second lnt Syrup on Drying Montreal, Canada (1980)
16 Millman, M.J. The modelling and control of freeze dryers PhD thesis University of Missouri-Rolla, Rolla, MO (1984)
17 Toei, R. Developments in spray, freeze and agitated indirect heat drying Proc Fourth lnt Drying Syrup Kyoto, Japan (1984) 88(~887
18 Goldhlith, S.A., Karel, M., Lnsk, G. in Aspects ThOoriques et Industriels de la Lyophilisation (Ed L. Rey) Hermann, Paris (1964) 545-547
19 Ma, Y.H., Peltre, P. Freeze dehydration by microwave energy: Part II Experimental study AIChE J (1975) 21 344-350
20 Hatcher, J.D., Lyons, D.W., Sunderland, J.E. An experimental study of moisture and temperature distributions during freeze- drying J Food Sci (1971) 36 33-36
21 Sandali, O.C. Interactions between heat and mass transfer in freeze-drying PhD thesis University of California, Berkeley, CA (1966)
22 Sagara, Y. Transport property measurement of a food sample undergoing sublimation dehydration Proc Fourth lnt Drying Syrup Kyoto, Japan (1984) 443-450
23 Mellor, J.D. Fundamentals of Freeze-Drying Academic Press, New York (1978) 71
24 Carn, M.R., King, C.J. Modification of conventional freeze dryers to accomplish limited freeze-drying AIChE Syrup Ser (1977) 73 103 111
25 Hernandez, L.A. Jr in Freeze Drying of Foods and Biologicals (Ed R. Noyce) Noyce Development Corporation (1968) 142-148
26 Kumagai, H., Nakamura, K., Toshimasa, Y. Freeze drying of concentrated liquid foods by back-face heating Proc Fourth lnt Drying Symp Kyoto, Japan (1984) 458-463