Embed Size (px)
Citation preview
Journal of Economic Behavior & Organization 72 (2009) 305–321
Contents lists available at ScienceDirect
Journal of Economic Behavior & Organization
journa l homepage: www.e lsev ier .com/ locate / jebo
Influence and inefficiency in the internal capital market
Julie WulfHarvard Business School, Soldiers Field Road, Boston, MA 02163, USA
a r t i c l e i n f o
Article history:Received 27 September 2005Received in revised form 25 June 2009Accepted 3 July 2009Available online 10 July 2009
JEL classification:G31D82D21D23
Keywords:Firm investmentM-form organizationInternal capital marketsAsymmetric informationSignal-jammingInfluence activities
a b s t r a c t
I model inefficient resource allocations in M-form organizations due to influence activi-ties by division managers that skew capital budgets in their favor. Corporate headquartersreceives two types of signals about investment opportunities: private signals that can bedistorted by managers, and public signals that are undistorted but noisy. Headquartersfaces a tradeoff between the cost of attaining an accurate private signal and the value ofthe information the signal provides. In contrast to existing models of “socialism” in internalcapital markets, I show that investment sensitivity to Tobin’s Q is higher than first-best infirms where division managers hold equity (a result consistent with evidence presentedin Scharfstein, 1998). When managers face high private costs from distorting information(equity holdings), headquarters may commit to investment contracts that place “too lit-tle” weight on private signals and “too much” weight on public signals (i.e. Q). This resulthas implications for managers in the design of capital budgeting processes and incentivecompensation systems.
© 2009 Elsevier B.V. All rights reserved.
1. Introduction
Evidence suggests that diversified conglomerates have active internal capital markets, using cash flow generated byone division to invest in another. While extensive research in financial economics analyzes both the benefits and costs ofcapital allocation within the firm’s hierarchy, a reasonable goal for future research is to understand better what factorsexplain the variation in efficiency of internal capital markets across firms.1 In pursuit of this goal, I model a particu-lar type of costly behavior by division managers (influence activities that distort private information about investmentopportunities) that leads to novel predictions about inefficiencies in internal capital markets.2 I find that asymmetricinformation can lead to investment sensitivity to public signals (i.e. Tobin’s Q) that is higher than first-best. Instead of ameasure of efficient capital allocation, increasing sensitivity to Q may be the firm’s attempt to mitigate division managerincentives to distort informative private signals (i.e. managerial recommendations). This is in contrast to much of the inter-nal capital markets literature that implicitly assumes that efficiency increases with divisional investment sensitivity toindustry Q.
E-mail address: [email protected] See Stein (2003) for a summary of research that discusses both costs and benefits of internal capital markets.2 The concept of influence activities (Milgrom, 1988, 1990; Milgrom and Roberts, 1988, 1992; Meyer et al., 1992) in this paper take the form of signal-
jamming, in which players “jam” or distort signals that others receive (Fudenberg and Tirole, 1986; Holmström, 1999). See Inderst et al. (2005) for a modelon influence costs and hierarchy and Bagwell and Zechner (1993) for a model on influence costs and capital structure.
0167-2681/$ – see front matter © 2009 Elsevier B.V. All rights reserved.doi:10.1016/j.jebo.2009.07.001
306 J. Wulf / Journal of Economic Behavior & Organization 72 (2009) 305–321
Information and knowledge production within the firm’s hierarchy is a subject of recent research in organizational eco-nomics (e.g. Aghion and Tirole, 1997; Garicano, 2000; Dessein, 2002; Stein, 2002; Marino and Matsusaka, 2005). In thispaper, I consider how the M-form organization creates perverse incentives for division managers to distort private signalsthat are transmitted to headquarters about competing investment opportunities across divisions within the firm. I identifycircumstances under which the problem is most pronounced and subsequently show how investment contracts implicitin capital budgeting processes can mitigate this rent-seeking behavior. While this model makes several novel predictionsconcerning the cross-sectional variation in the efficiency of internal capital markets across firms, the most important resultis the following. When “core” division managers hold equity, firms increase the sensitivity of investment to public signals(i.e. Q) for small divisions above first-best. When managers hold equity and the private costs of investment distortion arelarge, headquarters attempts to mitigate influence activities by placing “too little” weight on valuable, but distortable, pri-vate signals and “too much” weight on noisy, public signals. Headquarters faces a tradeoff between the cost of an accurateprivate signal and the value of the information the signal provides. The key result of the paper is consistent with evidencepresented in Scharfstein (1998). More broadly, the model predicts that inefficiencies are more pronounced in firms withmore influential division managers, less firm-level incentive pay for division managers (i.e. smaller equity holdings), andlower quality in public signals about investment opportunities.
Bower’s classic clinical study (1986) documents how better-informed division managers misrepresent project opportu-nities to decision makers at headquarters. A more recent example of the potential effect of influence activities in the internalcapital market is IBM’s inability to capitalize on its early success in the development of its personal computer business. Millsand Friesen (1996; 128–129) argue that:
“it was mainframe-myopia that so severely damaged IBM in the 1990s” and that “division executives began to putthe welfare of their own organizations above that of the corporation as a whole. . .in the resistance of the mainframedivision to the introduction of new technology.”
Based on accounts of IBM’s history, it seems that skepticism by the mainframe division about investment opportunities forthe IBM PC division was partially to blame for the inconsistent success in personal computers.3
One of corporate headquarters’ primary responsibilities is efficient resource allocation. However, accurate informationabout relative investment opportunities is typically unavailable, especially in new products and developing businesses. As apart of the capital budgeting process, headquarters relies on several sources of information from division managers: privateinformation such as managerial assessments or recommendations (that may be distorted) and public information such asindustry Q (that cannot be distorted, but is noisy). Examples of the private signal include assessments about new productdevelopment, the adoption of a division’s product as a standard, or a pending sale to a large customer. To the extent thatdivision managers prefer larger capital budgets, they have the incentive to engage in costly influence activities in orderto increase the capital allocated to their division. Division managers of “core” businesses (large, established divisions) aremore powerful than managers of developing businesses (small, newer divisions) because they have greater control overvaluable firm resources (Rajan and Zingales, 2000). Core division managers can distort the transmission of private informationto headquarters about the investment prospects of developing businesses. Headquarters cannot observe the core divisionmanager’s action, but does observe the realizations of both signals about the developing division’s investment prospects—thepossibly distorted, private signal and the noisy, public signal.4
Certainly, one extreme way to address the incentive disparity between headquarters and division managers is to eliminatethe internal capital market by either spinning off divisions (Gertner et al., 2002; Inderst and Laux, 2005) or instituting policiesthat limit the role of headquarters in allocating capital (Ozbas, 2005). Another less extreme approach is to rotate divisionmanagers across different divisions (similar to General Electric) to lessen incentives to lobby for capital (Stein, 2003).5
Alternatively, firms can design management processes or incentives to mitigate information distortion. For example, firmsdesign capital budget processes as mechanisms to elicit revelation of private information (Harris and Raviv, 1996, 1998; Antleand Eppen, 1985) or raise hurdle rates in their evaluation of potential investment projects as a crude method of addressingagency problems (Poterba and Summers, 1995). Finally, firms link division manager compensation to firm performance in
3 Carroll (1993) documents the power struggles between IBM’s mainframe and personal computer divisions. The manager of the General Products Division“couldn’t finance a personal computer because he had too many projects going”; Frank Cary (chairman) resolved the conflict with the remark “I’ll financeit.” The author argues “as the mainframe profits disappeared, IBM squandered its opportunities to turn the PC, or anything else into a business that wouldwax as mainframes waned”.
4 A specific example that motivates this paper’s model is based on the author’s experience as Vice-President of Corporate Planning and Developmentfor a Fortune 100 firm in financial services. In this capacity, I was involved in investment committee meetings to evaluate new business opportunities. Thefirm operated in three primary product segments and, at the time, was considering diversification into several businesses related to the core business. Inseveral instances, the Executive Vice President of the core division and member of the firm’s investment committee supported investment in new businessesif the unit reported to him, but was less optimistic about the new business prospects if the unit reported directly to the President and Chief OperatingOfficer. Managers of new businesses had shorter tenure and filled positions at lower levels in the hierarchy than the core division manager. They werenever members of the investment committee. In this organization, support from the core business division manager was critical to the ongoing capitalcommitment and the ultimate success of developing businesses. While the decision not to invest may have been optimal in each of these instances (althoughsubsequent developments by competitors suggested missed opportunities), this anecdote characterizes the mechanism by which division managers caninfluence resource allocation.
5 Job rotation would mitigate, but not eliminate the inefficiency arising from influence activities.

J. Wulf / Journal of Economic Behavior & Organization 72 (2009) 305–321 307
bonus contracts and through equity-based incentives to address potential problems in internal capital markets (Palia, 1999;Wulf, 2002).
In this paper, I combine the latter two approaches (the design of capital budgeting processes and division managercompensation schemes) in a model in which firms address incentive concerns in capital allocation. As a solution to mitigateinfluence activities, headquarters designs ex ante investment contracts that specify the optimal weights placed on privateand public information in the capital allocation decision, with the weights determined by the factors that represent themanager’s ability to distort information, the private cost of signal-jamming, and the noise in the public signals. The optimalinvestment contract results in the standard tradeoff between the cost of controlling the division manager’s action and thevalue of that action. In this context, the specific tradeoff is between the cost of attaining an accurate private signal and thevalue of the information the signal provides. The value, in this case, is more efficient resource allocation.
While the model in the paper does not derive optimal compensation contracts, the core division manager’s incentivepay consists of an exogenously determined fraction of firm profits. Since compensation of division managers is linked tofirm performance, managers are penalized through lower incentive pay because investment distortion leads to lower firmperformance. Clearly, there are many reasons why firms offer incentive pay: for example, to induce managerial effort.6
However, such motivations are absent from the present model because I am mainly interested in modeling the effect ofinformation distortion on investment.
The paper’s main contribution is a model of information distortion about competing investment opportunities by divi-sion managers in M-form firms. This paper’s model differs from earlier models of internal capital markets in several ways.First, it focuses on the relative quality of different information sources in allocating capital across divisions. In a related paper,Stein (2002) shows that division manager incentives to generate “soft” information in M-form organizations are reduced.7
While he focuses on incentives to produce information, in contrast, I focus on incentives to prevent distortion of information.Second, the results identify circumstances when firms ignore valuable information and the investment sensitivity to publicinformation (Q) is “too high” relative to first-best.8 This is in contrast to the “socialism” models that predict a reduced sensi-tivity to Q relative to standalone firms. Third, since the model identifies the settings in which the influence problem is mostsevere, the results have implications for firms in the design of optimal capital budgeting processes, a critical administrativeprocess that governs the allocation of resources within M-form organizations (Simon, 1997). Finally, the paper develops aneconomic model of a management phenomenon that links together the literatures on influence activities, signal-jamming,and optimal investment contracts in an application to internal capital markets.
Existing papers in financial economics investigate the effect of divisional manager power struggles or rent-seeking oncapital allocation and generally predict “socialism” in internal capital markets whereby weaker divisions are subsidized bystronger ones (Rajan et al., 2000; Scharfstein and Stein, 2000). Rajan et al. develop a model in which the principal optimallytransfers capital towards the small division with weak opportunities in order to make this division behave more cooperativelyin joint production with other divisions. The authors find support for inefficient cross-subsidies and that the extent ofinefficiency is positively related to the diversity of resources and investment opportunities across divisions. Similarly, thispaper’s model also predicts inefficiencies, and a key assumption about differential power between the division managersof large, core businesses versus small, developing businesses is a more restricted version of their finding on diversity ofresources.9 However, I explicitly model how influence activities distort the information that is available to headquarters whichin turn affects investment efficiency. Moreover, Rajan et al. make no predictions about how division manager compensation(or equity ownership) or the uncertainty in divisional investment opportunities affect internal capital market efficiencyacross firms.
The model in this paper allows division managers to be compensated in terms of capital allocations (because they prefermanaging larger divisions) in addition to being penalized by the reduced value of equity holdings. In featuring two formsof compensation, this model is similar to Scharfstein and Stein’s (2000) two-tiered agency model that predicts that largesocialist-type inefficiencies are more likely when the CEO has low-powered incentives. Providing empirical support for theirmodel, Scharfstein (1998) finds that investment of small divisions of multi-business firms is less sensitive to investmentopportunities than stand-alone firms, but it is greater when top management owns more equity. While this finding is broadlyconsistent with my model’s main result, the explanation for the result is quite different: when division managers face highprivate costs from distorting information (i.e. high equity), headquarters commits to investment contracts that place “toolittle” weight on private signals and “too much” weight on public signals (i.e. Q). As such, higher investment sensitivity to
6 For example, Jensen and Meckling (1976) discuss the role of incentive contracts in eliciting managerial effort, and Baker et al. (1994) explore thecombined use of subjective and objective performance measures in incentive contracts to motivate managers.
7 For a model of moral hazard in investment decisions that distinguishes between both “hard” and “soft” performance measures and the relationship tocontractibility, see Mukherji and Nagarajan (1995).
8 Milgrom and Roberts (1988) find a similar result (i.e. that influence activities can be mitigated by ignoring signals that are subject to manipulation), butin a different context and under different assumptions. Their model is set in the internal labor market and influence costs arise from effort distortion. Inmy model, influence costs arise from information distortion. In this paper, I am applying and adapting the influence cost model to internal capital marketswhere information transmission is a central issue.
9 A related paper by Inderst and Laux (2005) explores the implications of an internal capital market for new investment opportunities (in contrast toexisting businesses) by self-interested division managers. Another paper dealing with the issue of managerial rent-seeking by Glaser and Sautner (2007),finds that divisions whose managers have more bargaining power are able to appropriate a greater share of “windfall” cash flows for their capital allocation.
308 J. Wulf / Journal of Economic Behavior & Organization 72 (2009) 305–321
public signals is a second-best solution to an asymmetric information problem in which firms face a tradeoff between thecost of an accurate private signal and the value of the information that the signal provides.
Adding to the evidence that division manager incentives are important, both Palia (1999) and Wulf (2002) find evidencethat there are greater inefficiencies in internal capital markets when division manager compensation is less closely linkedto overall firm performance. While this paper’s model makes some predictions similar to Scharfstein and Stein, their modelmakes no predictions about division manager equity. Moreover, the results in this paper also highlight the importance ofrelative bargaining power of division managers and noise in public signals about investment opportunities.
The remainder of the paper is organized into four parts. Section 2 presents the model of influence and signal distor-tion. Section 3 solves for the value-maximizing investment rules under influence and derives specific predictions regardinginvestment sensitivity to signals. Section 4 discusses existing evidence in the literature. Section 5 concludes.
2. A model of influence and signal distortion
2.1. Overview
Efficiency of resource allocation in multi-divisional firms, certainly varies across firms and the ability to influence allo-cation decisions varies across managers within firms. One setting in which we might expect allocation decisions to beparticularly vulnerable to influence by division managers is in decisions related to new products or developing businesses.10
First, firm-specific human capital of new business managers is more limited in comparison to core division managers and theytypically have shorter tenure making them less entrenched (Shleifer and Vishny, 1989). Furthermore, they control fewer firmresources in the potential power struggles within the firm when property rights are not clearly defined (Rajan and Zingales,1998). Second, investment prospects for developing businesses are more uncertain. Uncertainty is greater both in industriesin early stages of development and in industries in which the firm has limited prior experience. Therefore, I model the inter-action between the two division managers in a firm in which we would expect the ability to influence allocation decisionsto be the most extreme: the division manager of the core business (large, established division) versus the division managerof the developing business (small, newer division with less predictable returns).
Consider a firm with two divisions: a large, established division (L) (or core division) with known returns and a smaller,newer division (S) with unknown returns. Headquarters (H) faces a fixed capital budget for new investment and invests ineither S or L (or both). H wants to maximize investment returns, while the division managers of S and L prefer larger budgets.The manager of L (hereafter referred to as L) is influential and can engage in costly influence activities to distort privatesignals that H receives about investment returns in S and thereby skew capital in favor of L. For simplicity and consistentwith the characterization that the small division manager (S) has limited firm-specific human capital, it is assumed that S isnot influential (i.e. S is a passive agent). In order to control signal distortion, H offers ex ante investment contracts to divisionmanagers that make investment rules contingent on signals about investment opportunities in S and the environment inwhich the manager operates (characterized by the exogenous parameters). The optimal investment contract is characterizedby the ability of the manager to influence, the private cost of doing so (e.g. foregone compensation), and the quality of thesignals about investment opportunities.
2.2. Influence activities and signal distortion
Investment in S generates either low returns (bad type) or high returns (good type). S’s type is represented by t ∈ {tb,tg}.H does not know the type, but knows its distribution: Pr(tb) = � and Pr(tb) = 1 − � where � ∈ (0,1). H also observes two signalsabout S’s type: a public signal (that cannot be influenced by L, but is noisy) and a private signal (that can be influenced).The public signal is denoted by ˘ ∈ {˘b,˘g} and is a function of S’s type and some noise. The distribution of ˘ is definedby the following conditional probabilities: Pr(˘b|tb) = Pr(˘g |tg) = and Pr(˘b|tg) = Pr(˘g |tb) = 1 − , where ∈ (0,1) isa parameter representing the quality or “fraction right” of the public signal (and 1 − represents the noise in the publicsignal). Thus, given a bad type, the probability that the public signal also will be bad is equal to .11 Examples of the publicsignal are industry Q or division profitability. While S’s profitability is a noisy indicator of investment opportunities, it is notlikely to be distorted by L.
In addition to the public signal, H receives a private signal from S. Examples of the private signal include informationabout new product development, the adoption of a division’s product as a standard, or a pending sale to a large customer.While the signal that S observes is perfect, L can take a costly action (i.e. to engage in influence activities or not) that may
10 Influence in internal capital markets may help explain the finding by Acs and Audrestsch (1988) that small firms were 43% more innovative than largerfirms in manufacturing industries were and exhibited an innovation-per-employee ratio 2.38 times greater than large firms exhibit. Other examples that areconsistent with managers influencing capital allocation decisions regarding new products are discussed in Christensen (1997). He argues that establishedfirms with a strong customer focus miss important investment opportunities that ultimately are exploited by entrepreneurial firms. For example, SeagateTechnology was late in offering a 3.5-in. disk drive primarily because of opposition from the marketing organization and senior executives who argued thatcustomers expressed no need for the product (p. 20). Another explanation is that the managers of the existing 5.25 in. standard opposed the new productand persuaded senior management that the market for the new technology was insignificant.
11 Without loss of generality and to eliminate duplicate cases, I restrict to ∈ (1/2,1).
J. Wulf / Journal of Economic Behavior & Organization 72 (2009) 305–321 309
distort the transmission of this signal to H. This private signal can be thought of as the investment recommendation that Smakes to H as part of the capital budgeting process. Influence activities are efforts that cast doubt on the potential viabilityof S’s business. They can occur in a variety of settings ranging from formal meetings (i.e. investment committee meetings)to casual comments in the hallways.12
The private signal is denoted by � ∈ (�b,�g) and hereafter represents the (possibly distorted) signal that is received by H. IfL chooses not to influence, this signal reveals S’s type with certainty (i.e. � = t). However, if L chooses to influence, the privatesignal received by H will be distorted with some probability. Specifically, with probability �, H will receive a bad privatesignal when S’s type is good.13 The conditional probabilities given influence by L are PrI(�b|tg) =� and PrI(�g|tg) = 1 −�where�∈ (0,1) is a parameter representing the “distortion success” of L’s action on the private signal.14 Finally, if L chooses toinfluence, he incurs a private cost. This private cost has two components that I will define more precisely in Section 2.3:(i) foregone compensation when division manager pay is linked to firm performance (or is equity-based) and investment isdistorted, and (ii) loss in future income to L from being dismissed or not promoted if influence activities are discovered.
To mitigate influence activities, H designs ex ante investment contracts with commitment for each division manager (Sand L) that specify investment levels and that are functions of both private (�) and public (˘) signal realizations (and theexogenous parameters—�,�, ,x,c0), but not of S’s type (t) since it is unobservable to H. While a common assumption inthe literature is that headquarters cannot commit to ex ante state-contingent capital allocations, I argue that reputationalconcerns in a repeated game combined with fixed budgeting rules make this a plausible assumption (Harris and Raviv,1996).15 The optimal contracts offered to S and L are represented by IS*(�,˘) and IL*(�,˘), where I is the investment in eachdivision given both signal realizations.
2.3. Technology and preferences
Headquarters represents shareholders and maximizes shareholder wealth defined as the sum of expected returns net ofinvestment in each division. I assume linear returns from investment in both divisions and denote rSt and rL as the respectiverates of return net of the cost of investment in S and L. The net return from S is a function of S’s type and is equal to rSt · IS(�,˘),while the net return from L is known and is equal to rL·IL(�,˘). I assume that rSg > r
L > rSb
and that the expected return frominvestment in S equals the known return from investment in L (i.e. �rS
b+ (1 − �)rSg = rL). Total expected firm value (V) is then
V = E[rSt · IS(�,˘) + rL · IL(�,˘)]. (1)
L is assumed to receive a share x of firm profits as incentive pay, while H receives the remaining (1 − x) share. Thus, H’sexpected payoff is defined as (1 − x) of the sum of the expected returns net of investment from each division and is given by
(1 − x)E[rSt · IS(�,˘) + rL · IL(�,˘)] (2)
Note that since x is exogenously determined, H maximizes total firm value V.Consistent with annual capital budgeting processes within firms and for simplicity, it is assumed that a fixed amount
of capital is raised at the corporate level (represented by I) and then allocated across divisions. While this is an extremeassumption and in many firms capital is not fixed, most firms face an upward sloping capital supply function. Influenceactivities would be less of a problem in firms with flexibility in their capital budgets. However, as long as there is an increasingcost of capital and divisions “pay” for capital, L has the incentive to reduce the capital allocated to S. In addition to firmsfacing capital constraints, I assume that divisions can only receive capital from corporate headquarters and that all capital isinvested in the two divisions.16 These assumptions imply that the sum of the investments in both divisions equals the totalcapital available to invest, or
IS(�,˘) + IL(�,˘) = I where 0 ≤ IS(�,˘), IL(�,˘) ≤ I (3)
Finally, division managers derive utility from the size of investment in their division. For simplicity, L’s utility function is thesum of (i) linear utility from investment in L, (ii) incentive pay deriving from an x share of firm profits, and (if L chooses to
12 In equilibrium, H knows whether L engages in influence activities. However, influence activities by L introduce noise into the private signal that H cannotcompletely correct for because the private signal received by H is distorted with some probability. In this way, influence activities introduce inefficiency.
13 It is assumed that L has no private information about S’s type and either chooses to influence the transmission of S’s private information to H or not (i.e.a moral hazard problem). Alternatively, this could be modeled as an adverse selection problem in which L also has information about S’s type. However,due to the asymmetric effect of influence activities (i.e. only good private signals can be distorted), this change would not affect the qualitative results ofthe model.
14 The conditional probability notation implies that while both the public and private signals are dependent upon the type, the noise in the public signaland the probability of successful distortion associated with the private signal are independent.
15 The investment contract in this paper is an implicit contract that is self-enforcing in the sense that it can be enforced not by the courts but by the firm’sconcern for its reputation among managers and ultimately in the labor market (Holmström, 1981).
16 Several studies document capital rationing in practice (e.g. Taggart, 1987). Theoretically, the fixed capital budget may arise from asymmetric informationin the external capital market. Specifically, Bolton and Scharfstein (1990) argue that investors may terminate a firm’s funding if its performance is poor(capital rationing) to ensure that the firm does not divert resources to itself at the expense of investors. Alternatively, Holmström et al. (1986) argue thatwhen investment is informative about managerial talent, capital rationing may be used to offset manager’s incentives to overinvest.

310 J. Wulf / Journal of Economic Behavior & Organization 72 (2009) 305–321
influence) (iii) the loss in future income to L from being dismissed or not promoted if influence activities are discovered,which is exogenously given as c0:
UL = E[IL(�,�)] + xV − c0 if L engages in influence activities,UL = E[IL(�,�)] + xV otherwise.
I assume that x is positive.17 Let VD equal expected firm value if H deters influence activities, so that L does not engage ininfluence activities. Let VA equal expected firm value if H allows influence activities, so that L engages in influence activities.(The deter and allow regimes are further discussed in Section 2.4.) Then L’s payoff if he does not influence equals
UL = E[IL(�,�)] + xVD (4)
while L’s payoff if he engages in influence activities equals
UL = E[IL(�,�)] + xVA − c0 = E[IL(�,�)] + xVD − c (5)
where c = x(VD − VA) + c0 represents the private costs of influence to L. c is the sum of two components. The first term(x(VD − VA)) represents the effect of distortion on the equity holdings of L.18 More broadly, when division manager payis linked to firm performance, either through the use of stock-based pay or an explicit weight on firm performance inannual bonus plans, managers are penalized through lower incentive pay because investment distortion leads to lower firmperformance. The second term (c0) represents loss of potential future income for L, as discussed earlier.
Timing occurs as follows: (1) H offers an investment contract to each division manager [IS(�,˘) to S and IL(�,˘) to L]. (2)L chooses whether to engage in influence activities or not. (3) Both private (�) and public (˘) signals are transmitted to Hand observed by all players. (4) H implements the investment contracts and allocates capital (I) between S and L. Payoffs toH and L are then realized. If L chooses to influence, then he incurs a cost (c0) that is foregone future income.
This game is solved in two steps. First, I derive the value-maximizing investment rules under the two possible regimes:one in which H “deters influence activities” (D) and the other in which H “allows (or induces) influence activities” (A).Following this, I consider the optimal regime as a function of the five exogenous parameters: � (the distortion parameter orthe probability that L’s influence distorts the private signal), (the quality of the public signal), x (L’s share of firm profits),c0 (foregone future income due to influence activities), and � (the probability that S is a bad type). In this paper, I focus on theoptimal regime and the implications for investment behavior as a function of � (or L’s ability to distort the private) signal.
I will present many of the results in terms of the variable c = c0/(1 − x(rSg − rL)), which summarizes the private costs ofinfluence to L. As we may expect, c is increasing in c0 and increasing in x (a larger share of firm profits x means that L incursa larger loss when he engages in influence activities).
2.4. The firm’s objective
In firms with influence activities (i.e. a second-best world), H faces a tradeoff between the cost of attaining an accurateprivate signal and the value of the information the signal provides. In some firms, contracts are designed to deter influence,while in other firms contracts allow or induce influence (i.e. they are not designed to mitigate influence activities). The typeof contract offered by H depends on the values of the exogenous parameters that vary across firms.
In the deter regime (D), H’s objective is to solve for the investment rule that maximizes the expected sum of the returnsnet of investment of the two divisions while ensuring that L’s expected utility from influencing is less than or equal tothat from not influencing. If ED represents the expectations under deter (where L does not influence) and EA represents theexpectations under allow (where L chooses to influence), profits under the respective regimes are
VD = ED[rSt · IS(�,˘) + rL · IL(�,˘)] (6)
and
VA = EA[rSt · IS(�,˘) + rL · IL(�,˘)]. (7)
The firm’s problem in the deter regime is to
maxIS,IL
VD (8)
subject to
EA[IL(�,˘)] − c ≤ ED[IL(�,˘)] (9)
17 In theory, another possible form of incentive pay would be to condition pay on divisional investment. For example, headquarters could control influenceactivities by “punishing” managers when their division receives a high capital allocation. In this model, this is equivalent to paying the manager a positiveshare of firm profits: managers are punished for inefficiently high capital allocations, which reduce profits. Equity-based pay is commonly observed inpractice.
18 Since firm value is higher when L does not distort, this term is strictly positive in equilibrium.
J. Wulf / Journal of Economic Behavior & Organization 72 (2009) 305–321 311
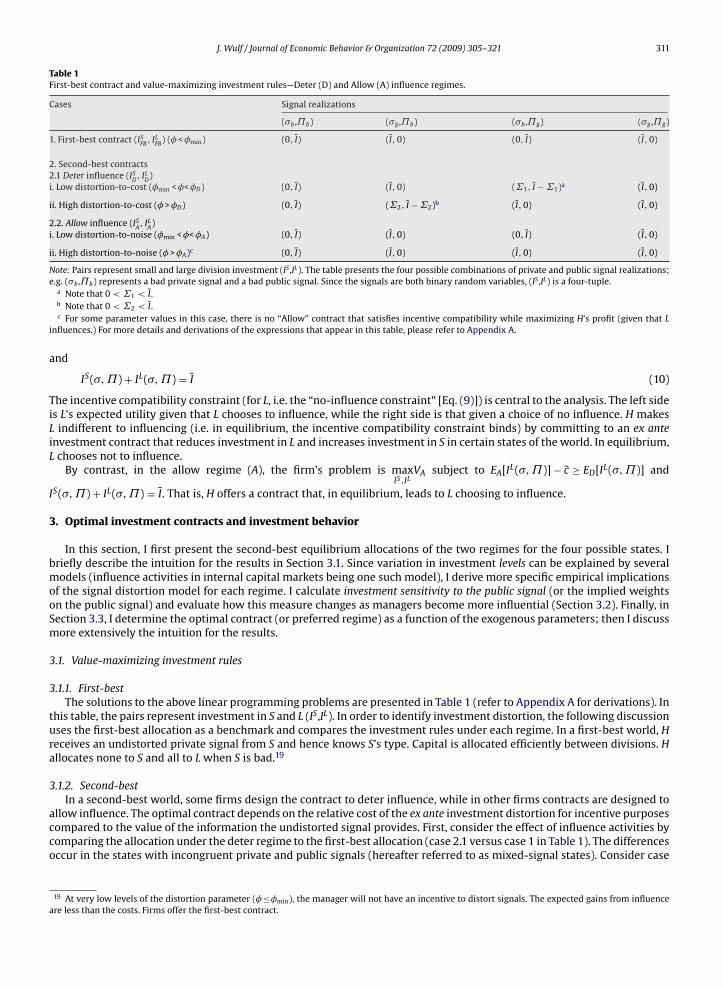
Table 1First-best contract and value-maximizing investment rules—Deter (D) and Allow (A) influence regimes.
Cases Signal realizations
(�b ,˘b) (�g ,˘b) (�b ,˘g) (�g ,˘g)
1. First-best contract (ISFB, ILFB
) (� <�min) (0, I) (I,0) (0, I) (I,0)
2. Second-best contracts2.1 Deter influence (IS
D, ILD
)i. Low distortion-to-cost (�min <�<�D) (0, I) (I,0) (˙1, I −˙1)a (I,0)
ii. High distortion-to-cost (� >�D) (0, I) (˙2, I −˙2)b (I,0) (I,0)
2.2. Allow influence (ISA, ILA)
i. Low distortion-to-noise (�min <�<�A) (0, I) (I,0) (0, I) (I,0)
ii. High distortion-to-noise (� >�A)c (0, I) (I,0) (I,0) (I,0)
Note: Pairs represent small and large division investment (IS ,IL). The table presents the four possible combinations of private and public signal realizations;e.g. (�b ,˘b) represents a bad private signal and a bad public signal. Since the signals are both binary random variables, (IS ,IL) is a four-tuple.
a Note that 0<˙1 < I.b Note that 0<˙2 < I.c For some parameter values in this case, there is no “Allow” contract that satisfies incentive compatibility while maximizing H’s profit (given that L
influences.) For more details and derivations of the expressions that appear in this table, please refer to Appendix A.
and
IS(�,˘) + IL(�,˘) = I (10)
The incentive compatibility constraint (for L, i.e. the “no-influence constraint” [Eq. (9)]) is central to the analysis. The left sideis L’s expected utility given that L chooses to influence, while the right side is that given a choice of no influence. H makesL indifferent to influencing (i.e. in equilibrium, the incentive compatibility constraint binds) by committing to an ex anteinvestment contract that reduces investment in L and increases investment in S in certain states of the world. In equilibrium,L chooses not to influence.
By contrast, in the allow regime (A), the firm’s problem is maxIS,IL
VA subject to EA[IL(�,˘)] − c ≥ ED[IL(�,˘)] and
IS(�,˘) + IL(�,˘) = I. That is, H offers a contract that, in equilibrium, leads to L choosing to influence.
3. Optimal investment contracts and investment behavior
In this section, I first present the second-best equilibrium allocations of the two regimes for the four possible states. Ibriefly describe the intuition for the results in Section 3.1. Since variation in investment levels can be explained by severalmodels (influence activities in internal capital markets being one such model), I derive more specific empirical implicationsof the signal distortion model for each regime. I calculate investment sensitivity to the public signal (or the implied weightson the public signal) and evaluate how this measure changes as managers become more influential (Section 3.2). Finally, inSection 3.3, I determine the optimal contract (or preferred regime) as a function of the exogenous parameters; then I discussmore extensively the intuition for the results.
3.1. Value-maximizing investment rules
3.1.1. First-bestThe solutions to the above linear programming problems are presented in Table 1 (refer to Appendix A for derivations). In
this table, the pairs represent investment in S and L (IS,IL). In order to identify investment distortion, the following discussionuses the first-best allocation as a benchmark and compares the investment rules under each regime. In a first-best world, Hreceives an undistorted private signal from S and hence knows S’s type. Capital is allocated efficiently between divisions. Hallocates none to S and all to L when S is bad.19
3.1.2. Second-bestIn a second-best world, some firms design the contract to deter influence, while in other firms contracts are designed to
allow influence. The optimal contract depends on the relative cost of the ex ante investment distortion for incentive purposescompared to the value of the information the undistorted signal provides. First, consider the effect of influence activities bycomparing the allocation under the deter regime to the first-best allocation (case 2.1 versus case 1 in Table 1). The differencesoccur in the states with incongruent private and public signals (hereafter referred to as mixed-signal states). Consider case
19 At very low levels of the distortion parameter (�≤�min), the manager will not have an incentive to distort signals. The expected gains from influenceare less than the costs. Firms offer the first-best contract.
312 J. Wulf / Journal of Economic Behavior & Organization 72 (2009) 305–321
2.1i. Note that in the deter regime the private signal is not distorted and H knows S is a bad type. Despite this, H commits toallocate capital to S even when it is bad: in the second mixed-signal state (�b,˘g), H allocates “too much” to S (�1 versus 0)and “too little” to L (I −˙1 versus I) relative to first-best. By penalizing L in the event of a bad private signal, H mitigates theincentive for L to distort the private signal. In equilibrium, L does not influence since the no-influence constraint is satisfied.The measure of investment distortion is represented by�1, where 0<˙1 < I.
Next, compare the two deter cases (case 2.1i versus case 2.1ii). The two cases depend on the distortion-to-cost ratio(�/c) or the probability that the signal is distorted relative to L’s private cost of influence. This ratio can be thought of as ameasure of L’s ability to influence. Firms with less influential managers (i.e. low distortion-to-cost, � <�D)20 offer contractsthat distort investment in only one mixed-signal state (case 2.1i). However, when managers are more influential (i.e. highdistortion-to-cost,� >�D), firms offer contracts that require investment distortion in both mixed-signal states. Specifically, Hallocates “too little” to a good S (�2 versus I) and “too much” to a bad S (I versus 0) relative to first-best. Note that 0<˙2 < I.
Since deterring influence activities is costly to the firm, it is not always optimal for firms to offer contracts with that asa goal. When the cost of deterrence exceeds the value of the information conveyed through accurate private signals, firmsdesign contracts that allow influence activities (i.e. case 2.2 in Table 1). The allocations in this regime fall into two cases thatdepend on the value of � /(1 − ). This term is increasing in distortion of the private signal (�) and decreasing in the noiseof the public signal (which decreases with ), so it can be thought of as a measure of the relative quality of the private andpublic signals. It is important to note that, in the allow regime, bad private signals received by headquarters may be distorted.Focusing on the second case first (i.e. high distortion-to-noise or case 2.2ii, � >�A)21, H follows the good public signal whenit receives a bad private signal because the private signal is not informative when distortion is high. The good public signal“outweighs” the bad private signal and all capital is allocated to S. In the other case (case 2.2i—low distortion-to-noise,� <�A),“too little” capital is allocated to a good S because, for some realizations, H receives a bad private signal when S is good. Inboth of the allow cases, H follows the private signal when it is good, because signal-jamming generates one-sided errors.
While the model predicts that influence activities lead to investment distortion, importantly, it identifies the circum-stances that determine the extent of inefficiency across firms. There are two types of investment distortion: underinvestmentin small divisions with good prospects and overinvestment in small divisions with poor prospects. The equilibrium resultsin Table 1 lead to the following empirical implications for investment allocations (or levels):
• Empirical implications—investment allocations: Investment distortion is greater in firms with (i) more influential managers(i.e. higher �), (ii) lower private costs to managers of influencing (i.e. lower c) and (iii) lower quality of the public signal (i.e.lower ).22 In addition, when private signal distortion is high (� >�D and� >�A), both types of distortion may occur, under-investment in small divisions with good prospects or overinvestment in small divisions with poor prospects—dependingon the state of the world.
3.2. Investment sensitivity to public signals by regime
Analyses of average investment levels as presented in Section 3.1 are subject to many interpretations. Certainly, morecompelling evidence would include cross-sectional correlations between measures of investment inefficiencies and therelevant variables as predicted by theory. To go one-step further in making specific predictions of the use of investmentcontracts to control influence activities, I analyze investment sensitivity to signals (or optimal weights placed on signals inthe investment decision). Ultimately, an empirical test would use a proxy for the public signal because the private signalwould never be observed. Thus, I consider investment sensitivity to the public signal for the small division [represented byS˘ =�E(IS|˘/�˘)] and evaluate it as a function of the manager’s ability to influence.23 Intuitively, S˘ represents the changein the capital allocated to S as the public signal changes from bad to good.
In a first-best world, influence activities are never undertaken and the private signal is undistorted. Hence, while invest-ment sensitivity to the public signal in the first-best contract (S˘FB) is a function of the signal-to-noise of the public signal andthe odds ratio of a bad type, it is not a function of the division manager’s ability to influence (Fig. 1). However, in a second-bestworld, investment sensitivity to the public signal is a function of�. In what follows, I derive investment sensitivity (or weighton the public signal) for both deter and allow regimes, then determine the optimal regime as a function of the parameters(Section 3.3).
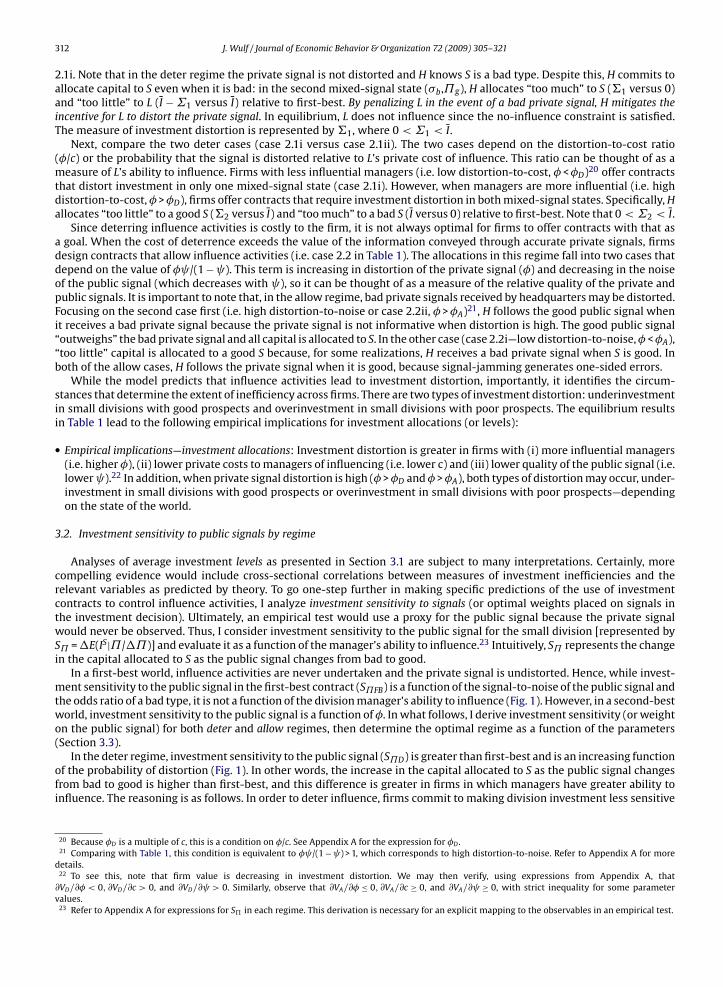
In the deter regime, investment sensitivity to the public signal (S˘D) is greater than first-best and is an increasing functionof the probability of distortion (Fig. 1). In other words, the increase in the capital allocated to S as the public signal changesfrom bad to good is higher than first-best, and this difference is greater in firms in which managers have greater ability toinfluence. The reasoning is as follows. In order to deter influence, firms commit to making division investment less sensitive
20 Because �D is a multiple of c, this is a condition on �/c. See Appendix A for the expression for �D .21 Comparing with Table 1, this condition is equivalent to � /(1 − ) > 1, which corresponds to high distortion-to-noise. Refer to Appendix A for more
details.22 To see this, note that firm value is decreasing in investment distortion. We may then verify, using expressions from Appendix A, that∂VD/∂� < 0, ∂VD/∂c > 0, and ∂VD/∂ > 0. Similarly, observe that ∂VA/∂� ≤ 0, ∂VA/∂c ≥ 0, and ∂VA/∂ ≥ 0, with strict inequality for some parametervalues.
23 Refer to Appendix A for expressions for S in each regime. This derivation is necessary for an explicit mapping to the observables in an empirical test.
J. Wulf / Journal of Economic Behavior & Organization 72 (2009) 305–321 313
Fig. 1. For � <�min, investment sensitivity to the public signal is at the first-best level (S˘FB). In the deter regime (�min <� < 1), investment sensitivity is S˘D .Investment sensitivity is continuous in � everywhere. Refer to Appendix A for expressions for �min, �D , S˘FB and S˘D .
to the private signal (the one that can be influenced) and more sensitive to the public signal (the noisy signal that cannot beinfluenced). Greater weight is given to the public signal in a way that is ex post inefficient (i.e. S˘D is “too high” relative toS˘FB). This difference in the weights (S˘D − S˘FB) is another measure of the investment distortion, and it is greater in firmswith more influential managers (i.e. firms with larger distortion parameters).
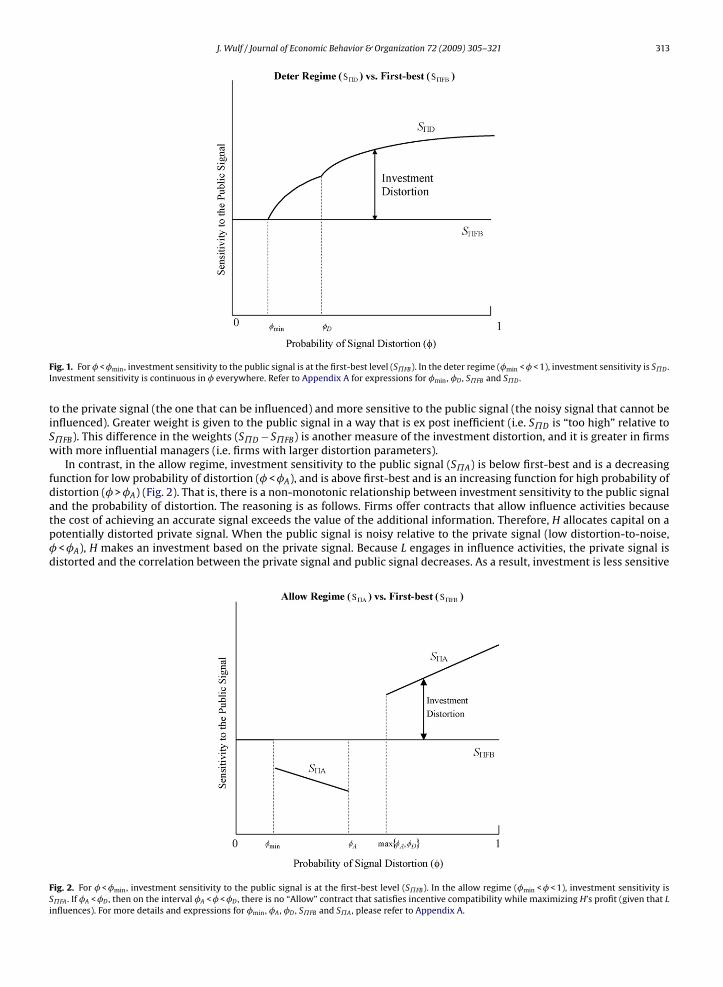
In contrast, in the allow regime, investment sensitivity to the public signal (S˘A) is below first-best and is a decreasingfunction for low probability of distortion (� <�A), and is above first-best and is an increasing function for high probability ofdistortion (� >�A) (Fig. 2). That is, there is a non-monotonic relationship between investment sensitivity to the public signaland the probability of distortion. The reasoning is as follows. Firms offer contracts that allow influence activities becausethe cost of achieving an accurate signal exceeds the value of the additional information. Therefore, H allocates capital on apotentially distorted private signal. When the public signal is noisy relative to the private signal (low distortion-to-noise,� <�A), H makes an investment based on the private signal. Because L engages in influence activities, the private signal isdistorted and the correlation between the private signal and public signal decreases. As a result, investment is less sensitive
Fig. 2. For � <�min, investment sensitivity to the public signal is at the first-best level (S˘FB). In the allow regime (�min <� < 1), investment sensitivity isS˘FA . If �A <�D , then on the interval �A <� <�D , there is no “Allow” contract that satisfies incentive compatibility while maximizing H’s profit (given that Linfluences). For more details and expressions for �min, �A , �D , S˘FB and S˘A , please refer to Appendix A.
314 J. Wulf / Journal of Economic Behavior & Organization 72 (2009) 305–321
to the public signal relative to first-best. Lower weight is given to the public signal in a way that is ex post inefficient (i.e.S˘A is “too low” relative to S˘FB), and H invests “too little”.
In the other case, when the public signal is more informative than the private signal (high distortion-to-noise, � >�A),greater weight is given to it relative to first-best (i.e. S˘A is “too high” relative to S˘FB) and H invests “too much” when thepublic signal is good. The difference in investment behavior below the critical value (�A) versus above is caused by the switchof investment levels in the mixed-signal state (�b,˘g) between the two cases in the allow regime. That is, when managersare more influential, firms offer contracts that differ from the first-best contract in the mixed-signal state (�b,˘g). With lessmanagerial influence, firms offer the first-best contract. However, in the allow regime, investment distortion always occurs inboth mixed-signal states. This distortion is a direct result of influence activities (rather than a distorted investment contractas in the deter case). Similar to the deter regime, the extent of the inefficiency is greater in firms with higher probabilities ofsignal distortion.24
3.3. Optimal investment contracts (or preferred regime)
The value-maximizing investment rules (Table 1) lead to implications for investment behavior for each regime(Figs. 1 and 2). However, these rules say nothing about which regime is optimal for H. By comparing the degree of invest-ment distortion under each regime, I determine the optimal contract (or preferred regime) as a function of the exogenousparameters, and then I discuss more extensively the intuition for the results.25
In a first-best world, investment sensitivity to the public signal is not a function of the distortion parameter. In contrast,in firms with influence problems, investment behavior is a function of managerial ability to distort private signals.26 Whilethe precise solutions vary depending on parameter values, there are two distinct cases.27
3.3.1. Case 1: investment pattern 1High private cost of influence to investment [c/I > ((1 − �)(1 − )/ )].For firms with influence problems (i.e. �≥�min), investment sensitivity to the public signal is greater than first-best and
is an increasing function of the distortion parameter (Fig. 3). When private costs of influence to the manager are high relativeto the size of the capital budget (c/I large), it is less costly for the firm to deter influence (i.e. easier to satisfy incentivecompatibility). In this case, the value of the information in the accurate private signal is greater than the cost of attaining it.Firms allocate capital by placing “too much” weight on the public signal and “too little” weight on the private signal relativeto first-best.
When are private costs to the division manager of influencing high? When incentive compensation is linked to firmperformance (i.e. equity-based pay), division managers are penalized because investment distortion leads to lower firmperformance.28 It follows that in M-form firms with heterogeneous divisions that are diverse in size and are operated bydivision managers with high equity holdings, we would expect to see higher investment sensitivity to industry Q relativeto first-best. Moreover, as the vulnerability to influence increases or the large division manager becomes more powerfulrelative to the small division manager, division investment sensitivity to industry Q should increase. This result suggests thathigher investment sensitivity to industry Q is not always an indicator of efficient internal capital markets. Instead, it may bea sign that firms are facing asymmetric information problems and attempting to mitigate incentives for managers to distortinformative private signals.
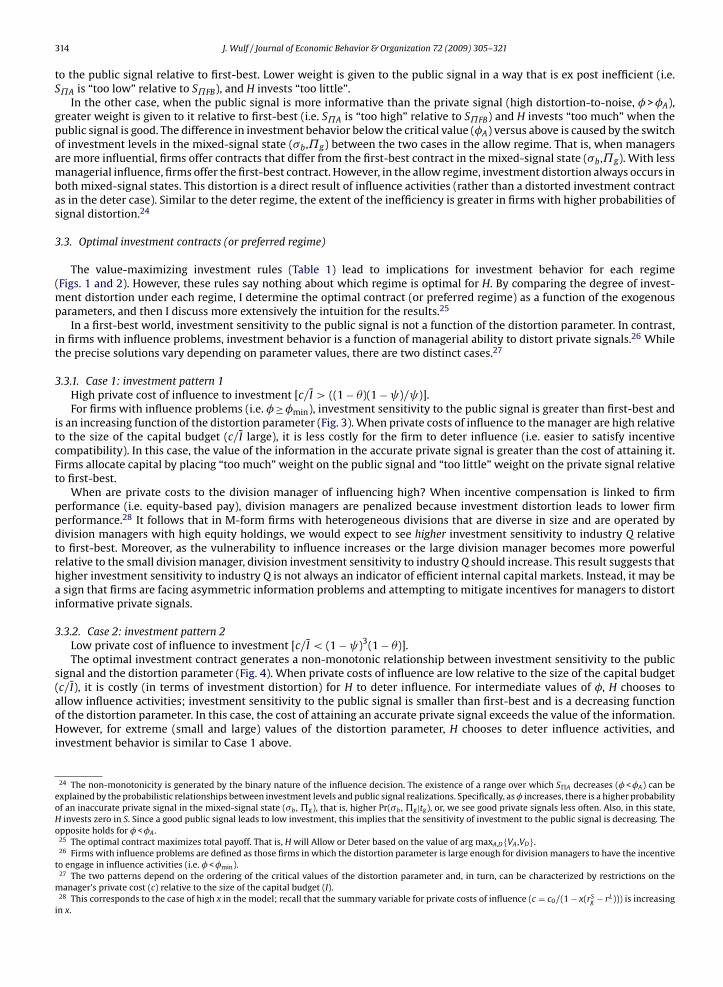
3.3.2. Case 2: investment pattern 2Low private cost of influence to investment [c/I < (1 − )3(1 − �)].The optimal investment contract generates a non-monotonic relationship between investment sensitivity to the public
signal and the distortion parameter (Fig. 4). When private costs of influence are low relative to the size of the capital budget(c/I), it is costly (in terms of investment distortion) for H to deter influence. For intermediate values of �, H chooses toallow influence activities; investment sensitivity to the public signal is smaller than first-best and is a decreasing functionof the distortion parameter. In this case, the cost of attaining an accurate private signal exceeds the value of the information.However, for extreme (small and large) values of the distortion parameter, H chooses to deter influence activities, andinvestment behavior is similar to Case 1 above.
24 The non-monotonicity is generated by the binary nature of the influence decision. The existence of a range over which SA decreases (� <�A) can beexplained by the probabilistic relationships between investment levels and public signal realizations. Specifically, as� increases, there is a higher probabilityof an inaccurate private signal in the mixed-signal state (�b , g), that is, higher Pr(�b , g|tg), or, we see good private signals less often. Also, in this state,H invests zero in S. Since a good public signal leads to low investment, this implies that the sensitivity of investment to the public signal is decreasing. Theopposite holds for � <�A .
25 The optimal contract maximizes total payoff. That is, H will Allow or Deter based on the value of arg maxA,D{VA ,VD}.26 Firms with influence problems are defined as those firms in which the distortion parameter is large enough for division managers to have the incentive
to engage in influence activities (i.e. � <�min).27 The two patterns depend on the ordering of the critical values of the distortion parameter and, in turn, can be characterized by restrictions on the
manager’s private cost (c) relative to the size of the capital budget (I).28 This corresponds to the case of high x in the model; recall that the summary variable for private costs of influence (c = c0/(1 − x(rSg − rL))) is increasing
in x.
J. Wulf / Journal of Economic Behavior & Organization 72 (2009) 305–321 315
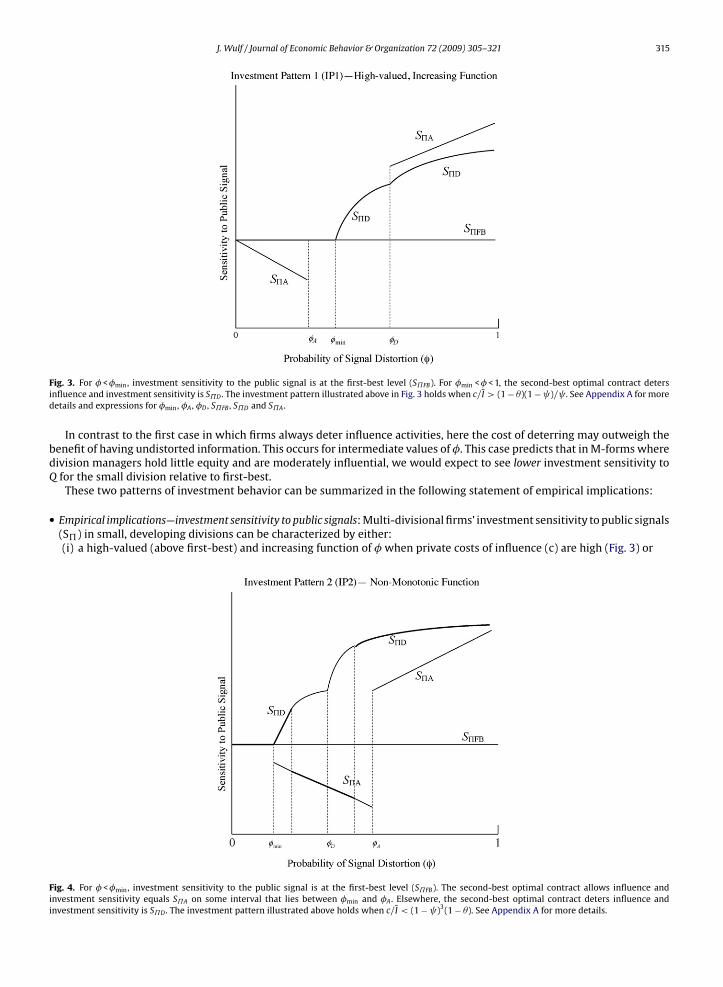
Fig. 3. For � <�min, investment sensitivity to the public signal is at the first-best level (S˘FB). For �min <� < 1, the second-best optimal contract detersinfluence and investment sensitivity is S˘D . The investment pattern illustrated above in Fig. 3 holds when c/I > (1 − �)(1 − )/ . See Appendix A for moredetails and expressions for �min, �A , �D , S˘FB , S˘D and S˘A .
In contrast to the first case in which firms always deter influence activities, here the cost of deterring may outweigh thebenefit of having undistorted information. This occurs for intermediate values of �. This case predicts that in M-forms wheredivision managers hold little equity and are moderately influential, we would expect to see lower investment sensitivity toQ for the small division relative to first-best.
These two patterns of investment behavior can be summarized in the following statement of empirical implications:
• Empirical implications—investment sensitivity to public signals: Multi-divisional firms’ investment sensitivity to public signals(S) in small, developing divisions can be characterized by either:(i) a high-valued (above first-best) and increasing function of � when private costs of influence (c) are high (Fig. 3) or
Fig. 4. For � <�min, investment sensitivity to the public signal is at the first-best level (S˘FB). The second-best optimal contract allows influence andinvestment sensitivity equals S˘A on some interval that lies between �min and �A . Elsewhere, the second-best optimal contract deters influence andinvestment sensitivity is S˘D . The investment pattern illustrated above holds when c/I < (1 − )3(1 − �). See Appendix A for more details.
316 J. Wulf / Journal of Economic Behavior & Organization 72 (2009) 305–321
(ii) a low-valued (below first-best) and decreasing function for intermediate values of � and a high-valued (above first-best) and increasing function for high or low values (i.e. a non-monotonic relationship between investment sensitivityto the public signal and the distortion parameter) when private costs are low (Fig. 4).
To sum up, when the private cost of influence (which is represented by c in the model) is high relative to size of the capitalbudget, firms will allocate capital to mitigate influence activities by placing less weight on private signals (i.e. managerialrecommendations) and more weight on public signals (i.e. Q) relative to first-best. More specifically, firms will increase thesensitivity of investment to public signals for small divisions above first-best when core division managers hold equity. Infirms where division manager compensation has no link to firm performance, sensitivity of investment to public signals willbe below first-best. More broadly, the model predicts that inefficiencies are more pronounced in firms with more influentialdivision managers, less firm-based incentive pay (i.e. smaller equity holdings) for division managers, and lower quality inpublic signals about investment opportunities.
4. Empirical implications
Several existing empirical findings are consistent with the central predictions of my model.29 First, using segment-leveldata from COMPUSTAT, Shin and Stulz (1998) find that while investment in small segments of diversified firms are positivelyrelated to cash flows of other divisions, investments appear to be independent of the division’s own investment prospects.This finding is consistent with my model’s prediction that small, developing divisions with weak prospects get too muchcapital and those with strong prospects get too little. Second, and more broadly, several papers provide evidence that, onaverage, internal capital markets engage in “socialist” cross-subsidization, allocating too much to divisions with low industryQ and too little to divisions with high industry Q (e.g. Rajan et al., 2000; Scharfstein, 1998).
Scharfstein (1998) finds that investment sensitivity to industry Q in diversified firms increases when management holdsequity. This is in agreement with my model, which predicts that high managerial equity stakes (i.e. high private cost ofinfluence (c)) are associated with investment sensitivities to industry Q that are higher than first-best, while investmentsensitivities below first-best may occur with low equity stakes. While this evidence is also broadly consistent with thepredictions of Scharfstein and Stein (2000), their model hinges on agency problems between the CEO and outside investorssince the CEO is an agent. In contrast, in my model, headquarters is a principal rather than an agent, and when divisionmanagers hold equity they face a private cost of distorting investment. The model of Scharfstein and Stein (2000) makes nopredictions about compensation contracts or equity holdings for division managers.
In addition to socialist cross-subsidies, Rajan et al. (2000) find that the extent of this inefficiency is positively related to thediversity of resources and investment opportunities across divisions. This finding is consistent with the (more restrictive)prediction in my model that the influence problem is most pronounced in a firm with divisions that are diverse in size(i.e. a large and a small division) as a proxy for a division manager’s ability to influence. However, while division size isrepresentative of the extremes in managerial ability to influence, a better measure might be the manager’s tenure or therelatedness of the businesses.30 More broadly, in my model the ability to influence is somewhat analogous to the power orstrength of division managers in Rajan et al. (2000) and Scharfstein and Stein (2000).
In a more recent empirical paper, Xuan (2009) finds that CEOs give more capital to unaffiliated divisions (i.e. divisionsthat CEOs have never managed), and this is more pronounced in multi-divisional firms that operate in related businesses. Ifone argues that CEOs are more likely to be affiliated with large divisions (and less likely with small) and that large divisionmanagers have less ability to influence information in firms with related businesses (because CEOs know more about thesmall division’s business because of relatedness), then the findings are consistent with the predictions of my model: (i) firmsmay distort investment towards small divisions (i.e. unaffiliated to the CEO), and (ii) this distortion towards small divisionsis particularly pronounced in firms that operate in related businesses (or when large division managers are less influential).
The private cost to managers of influence activities can be thought of as the lost future income from dismissal or missedpromotions as a result of influencing. Firms with job-rotation or high turnover may be less able to hold managers accountablefor their roles in investment decisions, thereby reducing the chances of detecting information distortion (Stein, 2003). How-ever, another, more quantifiable interpretation of this cost is the compensation that division managers lose when incentivepay is linked to firm performance. In this case, managers are penalized through lower incentive pay because investmentdistortion leads to lower firm performance. Consistent with this, Palia (1999) finds less cross-subsidization when divisionmanager compensation is more closely linked to firm performance (either through stock ownership or options). Moreover,Wulf (2002) finds reduced investment distortion when there is a greater weight placed on firm performance in divisionmanager bonuses. The findings in both of these papers are consistent with one of the main findings of this model: invest-ment distortion is less pronounced in firms in which division managers face higher private costs of influencing representedby firm-based compensation.
29 Importantly, this statement assumes that small, developing divisions are analogous to small divisions as defined in existing studies.30 While determining CEO tenure may be possible using proxy statements, determining division manager tenure is significantly more difficult. Usually a
division’s size is correlated with the amount of resources controlled by division managers (e.g. size of capital budgets and number of employees) and henceis a reasonable measure of division manager “power” within the firm.
J. Wulf / Journal of Economic Behavior & Organization 72 (2009) 305–321 317
Empirical research on internal capital markets has been criticized for measurement error in the use of industry Q asa proxy for segment investment opportunities (e.g. Maksimovic and Phillips, 2002; Villalonga, 2004; Campa and Kedia,2002; Chevalier, 2004; Whited, 2001). On a related point, this model’s prediction about noise in public signals suggeststhat empirical work using either industry Q or divisional profitability/cash flow should adjust for the accuracy of thesemeasures as proxies for investment opportunities. These measures are better signals of investment opportunities in stable,more predictable industries (e.g. textiles) in comparison to rapidly changing industries (e.g. pharmaceuticals). Hence, ceterisparibus, a diversified firm should place less weight on the public signal for a developing pharmaceuticals business and moreweight on managerial recommendations in allocating capital to that division in comparison to a textiles division. Buildingon the main finding of Rajan et al. (2000), it is not just diversity in resource-weighted opportunities across divisions thatdetermines the extent of inefficiencies, but also diversity in quality of public signals about investment opportunities.
5. Conclusion
The efficiency of resource allocation decisions within an organization ultimately depends on the quality of the informationavailable to the decision-maker. The intent of this paper is to develop an economic model that considers division managerincentives to influence capital allocation decisions based on different types of information in M-form organizations. Decision-makers place less weight on subjective, distortable information (e.g. managerial recommendations) and more weight onobjective, but noisy information (e.g. industry Q) to offset incentives for division managers to distort information aboutinvestment opportunities. Investment inefficiency depends on the ability of managers to distort information, the presenceof firm-level compensation incentives for division managers, and the quality of public signals of investment opportunities.By arguing that managerial ability to distort private signals is greater in certain types of firms, the model leads to testableimplications for division investment sensitivity to public signals across firm characteristics. I highlight several empiricalfindings of related work that are generally consistent with the model’s predictions.
One important point that this paper makes is that high investment sensitivity to public information may be a sign ofinefficiency in internal capital markets. Firms that face asymmetric information problems attempt to mitigate incentivesfor managers to distort more informative private signals by increasing investment sensitivity to public information abovethe first-best level. This is in contrast with much of the internal capital markets literature, which implicitly assumes thatdivisional investment sensitivity to industry Q increases with investment efficiency.
The importance of influence activities in the allocation of capital across divisions may help explain empirical findingsabout large firms. For example, large multi-business firms have difficulty in creating a desirable entrepreneurial climate andare generally less successful than small firms in developing new products and businesses. One caveat is that this paper has notexplained why multi-divisional firms should exist if investment inefficiencies are prevalent. It must be that other advantagesoutweigh the costs of an internal capital market or that firms learn of these inefficiencies over time and eventually correctthem. Clearly, there is more work to be done to understand the decisions firms make regarding organizational structure.
Acknowledgements
I wish to thank Kyle Bagwell, Severin Borenstein, Charlie Himmelberg, Teck Ho, Laurie Hodrick, Glenn Hubbard, HongyiLi, Maggie McMillan, Ron Miller, Andy Newman, Dan O’Flaherty, Kristen Willard, Dennis Yao and seminar participants atColumbia University, Cornell, The Wharton School, Harvard, Brown, Stanford, USC, Board of Governors, and the FederalReserve Bank of New York for their comments, suggestions, and encouragement.
Appendix A. Derivations
This section briefly derives the expressions for payoff functions and investment contracts that I discuss in the paper.
A.1. Preliminaries
The following observations are made without proof (which simply requires some algebra.) If L does not influence, totalpayoff is (from Eq. (6)):
VD = (1 − �)(rSg − rL){ [IS(�g,˘g) − IS(�b,˘b)] + (1 − )[IS(�g,˘b) − IS(�b,˘g)]} + IrLwhile if L engages in influence activities, total payoff is (from Eq. (7)):
VA = (1 − �)(rSg − rL){[�(1 − ) − ]IS(�b,˘b) + [� − (1 − )]IS(�b,˘g) + (1 − �)(1 − )IS(�g,˘b)
+ (1 − �) IS(�g,˘g)} + IrL.
In addition:
EA[IL(�,˘)] − ED[IL(�,˘)] = (1 − )[IS(�g,˘b) − IS(�b,˘b)] + [IS(�g,˘g) − IS(�b,˘g)].

318 J. Wulf / Journal of Economic Behavior & Organization 72 (2009) 305–321
A.2. First-best: �min
The first-best outcome is attainable if and only if L prefers not to influence (i.e. EA[IL(�,˘)] − c ≤ ED[IL(�,˘)] fromEqs. (4) and (5)) under the investment contract IS(�g) = I, IS(�b) = 0. A little algebra reveals that this holds wheneverc = c0/(1 − x(rSg − rL)) ≥ �(1 − �)I. This confirms that �min = c/((1 − �)I).
A.3. Deter (D) regime:�1,�2, �D
Recalling equations (8) and (9), H’s problem in the deter regime is maxIS,IL
VD subject to:
EA[IL(�,˘)] − c ≤ ED[IL(�,˘)].
Substituting, the constraint becomes:
(1 − )[IS(�g,˘b) − IS(�b,˘b)] + [IS(�g,˘g) − IS(�b,˘g)] ≤ c
�(1 − �).
Note that this IC constraint is binding in equilibrium. Inspecting the expression for VD and comparing to the constraint, it isclearly optimal to set IS(�b,˘b) = 0, IS(�g,˘g) = I. Also, it is optimal to maximize IS(�g,˘b). Thus whenever possible, weset IS(�g,˘b) = I; this and the equality of the constraint imply IS(�b,˘g) = (1/ )(I − (c/(�(1 − �)))) =˙1.
For this to be the optimal deter contract, we must have 0 ≤ IS(�b,˘g) ≤ I, or equivalently (after some manipulation)�min ≤ � ≤ c/(I(1 − )(1 − �)) = �D. Otherwise, we set IS(�b,˘g) = I, and the constraint then implies IS(�g,˘b) = (1/(1 − ))(c/(�(1 − �))) =˙2.
A.4. Allow (A) regime: �A, �A′
H’s problem in the allow regime is maxIS,IL
VA given EA[IL(�,˘)] − c ≥ ED[IL(�,˘)]. We first consider the case where L chooses
to influence given H’s optimal investment contract. As mentioned previously, it is optimal to set IS(�g,˘g) = IS(�g,˘b) = I.Next, to calculate optimal IS(�b,˘b) we simply check whether EA[rS |(�b,˘b)] ≥ rL , similarly for optimal IS(�b,˘g). With thisis mind, it is easy to check that EA[rS |(�b,˘b)] ≤ rL holds whenever ≥ 1/2, as we assume; so IS(�b,˘b) = 0. On the otherhand, EA[rS |(�b,˘g)] ≥ rL if and only if � ≥ (1 − / ) = �A, so IS(�b,˘g) = 0 when � <�A and IS(�b,˘g) = I when � >�A.
Note that we have assumed thus far that L always engages in influence activities given H’s investment choice. This maynot always be true when IS(�b,˘g) = I. In this case, the difference in payoff to L between influencing and not influencingis �(1 − �)(1 − )[x(rSg − rL) − 1]I − c0. If � >�A and �(1 − �)(1 − )[x(rSg − rL) − 1]I − c0 < 0 (or equivalently �A < � < �D =c/((1 − �)(1 − )I)) so there is no “Allow” contract that satisfies incentive compatibility while maximizing H’s profit (giventhat L influences)31 and the Allow regime has no solution on this interval.
A.5. Payoffs: VD,VA
Given H’s optimal investment contract, it is then straightforward to calculate total payoff in each regime using theexpressions for VD,VA from Eqs. (6) and (7). Denote total payoff in the first-best case as VFB. Omitting tedious algebra, we get:First-best: Total payoff� <�min VFB = (1 − �)(rSg − rL)I + IrL
Deter (D) regime:
�min <� <�D VD = (1 − �)(rSg − rL){
2 −1 I + 1−
c
�(1−�)
}+ IrL
� <�D VD = (1 − �)(rSg − rL){
(2 − 1)I + c�(1−�)
}+ IrL
Allow (A) regime:�min <� <�A VA = (1 − �)(rSg − rL)(1 − �)I + IrL
� < max{�A ,�D} VA = (1 − �)(rSg − rL)[ − �(1 − )]I + IrL
A.6. Investment sensitivities: S˘FB,S˘D,S˘A
Noting that S˘ = (�E(IS |˘)/�˘) = E(IS |˘g) − E(IS |˘b) where E(IS |˘) = Pr(�b/˘)IS(�b,˘) + Pr(�g/˘)IS(�g,˘), wecan calculate investment sensitivities in each regime. Again omitting tedious algebra, we get:
31 Since any mixed equilibrium where L randomizes between influencing and not influencing is dominated by a Deter strategy for H, I do not considermixed equilibria on this interval.
J. Wulf / Journal of Economic Behavior & Organization 72 (2009) 305–321 319
First-best: Investment sensitivity (S˘ )
� <�min S˘FB =[
(1−�) (1−�) +(1− )� − (1−�)(1− )
(1−�)(1− )+ �
]I
Deter (D) regime:
�min <� <�D S˘D = S˘FB + 1−
(I − c
�(1−�)
)�
(1−�) +(1− )�
� >�D S˘D = I − c/�
(1−�)(1− )+ �
Allow (A) regime:�min <� <�A S˘ = (1 −�)S˘FB
� < max{�A ,�D} S˘A =(
1 − (1−�)(1−�)(1− )(1−�)(1− )+ �
)�I
Note that S˘A → I as → 1 or �→ 1. An analogous measure for the investment sensitivity to the private signal is S� =�E(IS |�)/�� where S�FB = I (i.e. in first-best, investment in S changes from 0 to I when the private signal changes from badto good). Note that S˘FB → S�FB = I as → 1 or x → ∞ (i.e. in first-best, investment sensitivity to the public signal convergesto that of the perfect, private signal as noise in the public signal goes to zero).
A.7. Investment pattern 1 (from Fig. 3—high private cost/investment case (equity))
To show that the investment pattern described in Fig. 3 holds under the condition c/I > (1 − �)(1 − )/ , note first thatS˘D is increasing and continuous in � everywhere and is concave on �min <� <�D and on �D <� < 1. Also, S˘A is decreasingin � on �min <� <�A and is increasing thereafter, and has constant slope on �min <� <�A and on max{�A,�D}< � < 1. Wecan then check that: (i) �D >�min >�A, (ii) VD(�D)> VA(�A), and (iii) V ′
D(�)> V ′A(�) for �′ > �′
A, where VA(�) is total payoffunder the optimal allow contract and VD(�) is total payoff under the optimal deter contract for distortion parameter�, whichgenerates the observed investment pattern.
A.8. Investment pattern 2 (from Fig. 4—low private cost/investment case (no equity))
To show that the investment pattern described in Fig. 4 holds under the condition c/I < (1 − )3(1 − �), note the propertiesof S˘D and S˘A mentioned above; it is then straightforward to verify that: (i) �A >�D >�min, (ii) �D(�D)< �A(�D), (iii)VD(�A) > VA(�A) and (iv) �′
D(�)> �′A(�) for � <�A. This then implies that the observed investment pattern holds.
Appendix B. Proposed empirical test
In this appendix, I discuss an approach to test the empirical implications of the influence model; specifically, howinvestment sensitivity to signals varies with the environment that the manager operates in.
Compustat Industry Segment (CIS) data reports segment information for approximately 6500 firms per year. Informationincludes key financial statistics and SIC codes at the segment level. While the level of aggregation of these data is typicallyhigher than that of the division, capital allocation decisions also are made at the line of business (or segment) level.
The model distinguishes between two types of divisions within the firm: (i) large, established divisions with knownreturns (L) and (ii) smaller, newer divisions with unknown returns (S). However, in order to focus on the extremes, one couldestimate an investment equation for the small divisions using the segment with the smallest sales in each year to representthe division with the least influential (or passive) manager and the least predictable returns (smaller, newer division) andthe segment with the largest sales in each year to represent the division with the most influential manager and the mostpredictable returns (larger, established division).
The central idea behind an empirical strategy would be based on the premise that the manager’s ability to influence(i.e. the probability of signal distortion) varies across firms, and as a result, firms with certain characteristics suffer morefrom investment distortion due to influence activities. One measure commonly used in empirical research as a reasonableproxy for the public signal about investment opportunity is median Q for the division’s industry. Another possibility is laggedsegment profitability (represented by˘S
−1 and defined as operating income/assets for S).Proxies for the probability of signal distortion could be based on two firm characteristics: the relatedness of division
operations and the number of divisions within the firm. First, if the firm is more focused (or less diversified) and the businessesof the small and large divisions are closely related, one could argue that L should be less influential in denigrating S’sinvestment prospects. This is because the CEO is better informed and less easily influenced. It follows that the probability ofsignal distortion is lower in firms with more closely related businesses. Ultimately, whether managers are more influentialin distorting information in focused or diversified firms is an empirical issue.32 To measure the relatedness of divisionbusinesses, one could construct a diversification measure (e.g. HHI) based on segment industry classifications.
32 Empirical evidence suggests there are benefits to firms staying close to their core business (e.g. Comment and Jarrell, 1995, Berger and Ofek, 1995 andan extensive list of more current papers including Berger et al., 2005). The empirical results on whether relatedness is beneficial or costly to the efficiencyof internal capital markets are mixed. See Stein (2003) for a discussion of these results and a review of the literature on the diversification discount.

320 J. Wulf / Journal of Economic Behavior & Organization 72 (2009) 305–321
The second characteristic used as a proxy for the probability of signal distortion could be the number of divisions withinthe firm. If the firm has more divisions, the CEO is less knowledgeable about each division’s business and is more likely to beswayed by influential division managers, or said differently, there is more noise in the transmission of private informationin a firm with more divisions. For example, since General Electric’s CEO manages nine business segments (in 1998), hisknowledge of each division and his ability to evaluate investment opportunities personally is more limited relative to a firmwith two divisions. It follows that firms with more divisions should suffer from greater investment inefficiencies relative tofirms with fewer divisions.33
While the ex ante contract would not be observable to the econometrician, one can observe ex post investment andprofits for the small segment and the relevant firm characteristics. The econometric specification would be a regression ofinvestment in the small division (IS) on either industry Q or lagged profits of the small division (˘S
−1, as the proxy for thepublic signal), while specifying the regression coefficient (ˇ0) as a linear function of firm characteristics (˝, as proxies forthe distortion parameter). The coefficient on industry Q measures the sensitivity of investment to industry Q as a function offirm characteristics. Hence, ˆ 0(˝) would be an estimate of S˘ (�) =�E(IS |˘)/˘ as derived in the model (i.e. investmentsensitivity to the public signal as a function of the distortion parameter). This coefficient measures how much weight isplaced on industry Q in determining segment investment, and this weight varies by firm characteristics.34
Based on the above specification, there are two empirical tests of the influence model:
(1) do firm characteristics have any predictive power in determining segment investment sensitivity to Q (i.e. are thecomponents of˝ statistically significant)?
(2) Is the relationship between investment sensitivity to industry Q and firm characteristics similar to either the increasingor the non-monotonic relationship predicted by the model? Is ˆ 0(˝) either a high-valued, increasing function of thedistortion parameter, as the model predicts when the private cost of influence is high (i.e. high managerial equity holdings)(Fig. 3)? Or is it a low-valued, decreasing function for intermediate values of the distortion parameter and a high-valued,increasing function for extreme values, as is the case when the private cost of influence is low (Fig. 3)?
References
Acs, Z.J., Audrestsch, D.B., 1988. Innovation in large and small firms: an empirical analysis. American Economic Review 78, 678–690.Aghion, P., Tirole, J., 1997. Formal and real authority in organizations. Journal of Political Economy 105, 1–29.Antle, R., Eppen, G.D., 1985. Capital rationing and organizational slack in capital budgeting. Management Science 31, 163–174.Bagwell, L.S., Zechner, J., 1993. Influence costs and capital structure. The Journal of Finance 48, 975–1008.Baker, G.P., Gibbons, R., Murphy, K.J., 1994. Subjective performance measures in optimal incentive contracts. Quarterly Journal of Economics 109, 1125–1156.Berger, A.N., Miller, N.H., Petersen, M.S., Ranjan, R.G., Stein, J.C., 2005. Does function follow organizational form? Evidence from the lending practices of
large and small banks. Journal of Financial Economics 76, 237–269.Berger, P.G., Ofek, E., 1995. Diversification’s effect on firm value. Journal of Financial Economics 37, 39–65.Bolton, P., Scharfstein, D.S., 1990. A theory of predation based on agency problems in financial contracting. American Economic Review 80, 93–106.Bower, J.L., 1986. Managing the resource allocation process: a study of corporate planning and investment. Harvard Business School Press, Boston, MA.Campa, J.M., Kedia, S., 2002. Explaining the diversification discount. Journal of Finance 57, 1731–1762.Carroll, P., 1993. Big Blues: The Unmaking of IBM. Crown Publishers, New York.Chevalier, J., 2004. What do we know about cross-subsidization? Evidence from merging firms. Advances in Economic Analysis & Policy 4 (Article 3).Christensen, C.M., 1997. The Innovator’s Dilemma: When New Technologies Cause Great Firms to Fail, The Management of Innovation and Change Series.
Harvard Business School Press, Boston, MA.Comment, R., Jarrell, G., 1995. Corporate focus and stock returns. Journal of Financial Economics 37, 67–87.de Motta, A., 2003. Managerial incentives and internal capital markets. Journal of Finance 58, 1193–1220.Dessein, W., 2002. Authority and communication in organizations. Review of Economic Studies 69, 811–838.Fudenberg, D., Tirole, J., 1986. A ‘signal-jamming’ theory of predation. RAND Journal of Economics 17, 366–376.Garicano, L., 2000. Hierarchies and the organization of knowledge in production. Journal of Political Economy 108, 874–904.Gertner, R., Powers, E., Scharfstein, D.S., 2002. Learning about internal capital markets from corporate spin-offs. Journal of Finance 57, 2479–2506.Glaser, M., Sautner, Z., 2007. Looking inside a conglomerate: efficiency of internal capital allocation and managerial power within a firm. EFA 2007 Ljubljana
Meetings Working Paper, Available at SSRN: http://ssrn.com/abstract=966325.Harris, M., Raviv, A., 1998. Capital budgeting and delegation. Journal of Financial Economics 50, 259–289.Harris, M., Raviv, A., 1996. The capital budgeting process: incentives and information. Journal of Finance 51, 1139–1174.Holmström, B., 1999. Managerial incentive problems: a dynamic perspective. Review of Economic Studies 66, 169–182.Holmström, B., 1981. Contractual models of the labor market. American Economic Review 71, 308–313.Holmström, B., Ricard, I., Costa, J., 1986. Managerial incentives and capital management. Quarterly Journal of Economics 101, 835–860.Inderst, R., Laux, C., 2005. Incentives in internal capital markets: capital constraints, competition, and investment opportunities. RAND Journal of Economics
36, 215–228.Inderst, R., Müller, H.M., Wärneryd, K., 2005. Influence costs and hierarchy. Economics of Governance 6, 177–197.Jensen, M.C., Meckling, W.H., 1976. Theory of the firm: managerial behavior, agency costs and ownership structure. Journal of Financial Economics 3,
305–360.Maksimovic, V., Phillips, G., 2002. Do conglomerate firms allocate resources inefficiently across industries? Theory and evidence. Journal of Finance 57,
721–767.
33 This is the opposite prediction of the model developed in de Motta (2003).34 Note, one may argue that the estimate of this coefficient may be biased due to omission of the private signal in the investment equation. However, the
theoretical derivation of investment sensitivity to the public signal implies that the investment equation without the private signal is the correct econometricspecification. This is because the dependent variable is expected investment and is derived by taking expectations over the private signal. Hence, the effectof the private signal is already incorporated into the dependent variable of the regression equation, so including it as an independent variable would resultin misspecification.

J. Wulf / Journal of Economic Behavior & Organization 72 (2009) 305–321 321
Marino, A.M., Matsusaka, J.G., 2005. Decision processes, agency problems, and information: an economic analysis of capital budgeting procedures. Reviewof Financial Studies 18, 301–325.
Meyer, M., Milgrom, P., Roberts, J., 1992. Organizational prospects, influence costs, and ownership changes. Journal of Economics & Management Strategy1, 9–35.
Milgrom, P.R., 1990. Bargaining costs, influence costs, and the organization of economic activity. In: Alt, J.E., Shepsle, K.E. (Eds.), Perspectives on PositivePolitical Economy. Cambridge University Press, Cambridge, England; New York, pp. 57–89.
Milgrom, P.R., 1988. Employment contracts, influence activities and efficient organization design. Journal of Political Economy 96, 42–60.Milgrom, P.R., Roberts, J., 1992. Economics, Organization, and Management. Prentice-Hall, Englewood Cliffs, NJ.Milgrom, P., Roberts, J., 1988. An economic approach to influence activities in organizations. The American Journal of Sociology 94, S154–S179.Mills, D.Q., Friesen, G.B., 1996. Broken Promises: An Unconventional View of What Went Wrong at IBM. Harvard Business School Press, Boston, MA.Mukherji, A., Nagarajan, N.J., 1995. Moral hazard and contractibility in investment decisions. Journal of Economic Behavior & Organization 26, 413–430.Ozbas, O., 2005. Integration, organizational processes, and allocation of resources. Journal of Financial Economics 75, 201–242.Palia, D., 1999. Corporate governance and the diversification discount: evidence from panel data. Working paper, University of Chicago and Columbia
University.Poterba, J.M., Summers, L.H., 1995. A CEO survey of U.S. companies’ time horizons and hurdle rates. Sloan Management Review 37, 43–53.Rajan, R.G., Zingales, L., 2000. The governance of the new corporation. In: Vives, X. (Ed.), Corporate Governance: Theoretical and Empirical Perspectives.
Cambridge University Press, Cambridge, England; New York, pp. 201–232.Rajan, R.G., Zingales, L., 1998. Power in a theory of the firm. Quarterly Journal of Economics 113, 387–432.Rajan, R.G., Zingales, L., Servaes, H., 2000. The cost of diversity: the diversification discount and inefficient investment. Journal of Finance 55, 35–80.Scharfstein, D.S., 1998. The dark side of internal capital markets. II. Evidence from diversified conglomerates. National Bureau of Economic Research Working
Paper Series), Available at http://www.nber.org/papers/w6352.pdf.Scharfstein, D.S., Stein, J.C., 2000. The dark side of internal capital markets: divisional rent-seeking and inefficient investment. Journal of Finance 55,
2537–2564.Shin, H., Stulz, R.M., 1998. Are internal capital markets efficient? Quarterly Journal of Economics 113, 531–552.Shleifer, A., Vishny, R.W., 1989. Management entrenchment. Journal of Financial Economics 25, 123–139.Simon, H.A., 1997. Administrative Behavior: A Study of Decision-Making Processes in Administrative Organizations. Free Press, New York.Stein, J.C., 2003. Agency, information, and corporate investment. In: Constantinides, G.M., Harris, M., Stulz, R.M. (Eds.), Handbook of the Economics of
Finance. Elsevier/North-Holland, Amsterdam/Boston, pp. 111–163.Stein, J.C., 2002. Information production and capital allocation: decentralized versus hierarchical firms. Journal of Finance 57, 1891–1921.Taggart Jr., R.A., 1987. Allocating capital among a firm’s divisions: hurdle rates vs. budgets. Journal of Financial Research 10, 177–189.Villalonga, B., 2004. Does diversification cause the ‘diversification discount’? Financial Management 33, 5–27.Whited, T.S., 2001. Is it inefficient investment that causes the diversification discount? Journal of Finance 56, 1667–1691.Wulf, J., 2002. Internal capital markets and firm-level compensation incentives for division managers. Journal of Labor Economics 20, S219–S262.Xuan, Y., 2009. Empire-building or bridge-building? Evidence from new CEOs’ internal capital allocation decisions. Review of Financial Studies.