Embed Size (px)
Citation preview
STUDY OF PHYSICRL PROPERTIES OF CERTAIN BORATE GLASSES
Submitted to the Mahatma Gandhi University
in partial fulfilment of the requirements for the
award of the Degree of
DOCTOR OF PHILOSOPHY
in Physics under the Faculty of Science
BY K. SHREEKRISHNA K U M A R M. Sc., M. Phil.
SCHOOL OF PURE ~r APPLIED PHYSICS MAHATMA GANDHI UNIVERSITY
KOTTAYAM
.... fo my parents
D E C L A R A T I O N
I do hereby dec lare t h a t t he t h e s i s e n t i t l e d , "SlULlY OF PHYSICAL
PROPERTIES OF CERTAIN BORATE GLASSES" i s a bonaf ide record o f t he
research work carr ied ou t by me under t he guidance and d i r e c t
superv i s ion o f D r . U . ABJJULKHADAR, Reader, School o f Pure and
Applied Physics , Mahatma Gandhi U n i v e r s i t y , Kottayam. No part o f t h i s
t h e s i s has been presented f o r any o the r degree or diploma e a r l i e r .
Priyadarshini H i l l s 3D.12.1993.
K . SHREWCRISHNA KOlWl Research Scholar School o f Pure and Applied Physics Mahatma Gandhi U n i v e r s i t y Kottayam
C E R T I F I C A T E
This i s t o c e r t i f y that the t h e s i s e n t i t l e d , "STLIDY OF PHYSICAL
PROPERTIES OF CERTAIN BORATE GLASSES", i s an authentic record o f the
research work carried out by Mr. SHREMRISHNA KlJHAl? under my guidance
and supervision i n part ial f u l f i l m e n t o f the requirements for the
award o f the degree o f WClYlR OF PHILOSOPHY under the Faculty o f
Science o f the Mahatma Gandhi Univers i ty , Kottayam. The work
presented i n t h i s t h e s i s has not been submitted for any other degree
or diploma e a r l i e r .
Priyadarshini H i l l s 30.12.1993.
Dr . H. ABDULKHADAR Reader School o f Pure and Applied Physics Mahatma Gandhi Univers i ty
. . Kottayam. . ..
A C K N O W L E D G E M E N T S
I wish to place on record my profound sense of
gratitude to my esteemed guide Dr. M. Abdulkhadar, Reader,
School of Pure and Applied Physics, Mahatma Gandhi
University under whose guidance and direct supervision the
present work was carried out. I am indebted to him for
his inspiring guidance, keen interest and constant
encouragement throughout the course of this work. His
sincere dedication to research has always been a cause of
inspiration to me.
I am grateful to Dr. M.A. Ittyachen, Professor and
Director, School of Pure and Applied Physics, Mahatma
Gandhi University for providing me the basic facilities to
carry out this work and his constant advices and
suggestions throughout the course of my research work. I
also thank all the teaching staff for their help and
cooperation.
May I express my heart-felt sense of gratitude to
Prof. Prakash P. Karat, Mangalore University for taking me
to the field of research.
I owe sincere thanks to Dr. K.G.K. Warrier, Scientist,
RRL, Thiruvananthapuram and his research associates, and

Prof. Babu Joseph and Prof. Girija Vallabhan, Cochin
University for extending laboratory facilities in carrying
out the dielectric measurements.
I express my thanks to Regional Sophisticated
Instrumentation Centre, I.I.T. Madras for recording the
Laser Raman Spectra.
I am indebted to my colleagues Mr. Jugan J. and
Mr. Roshan Abraham for their valuable help and
encouragement at the various stages of my work.
My sincere thanks are due to Mr. Dileep Kumar,
Mr. Binny Thomas and Mr. Anilkumar, School of Pure and
Applied Physics, Mahatma Gandhi University for their
continued help at various stages of my work.
I express my sincere thanks to my friends
Mr. Ajithkumar, Research Scholar, School of Pure and
Applied Physics, Mr. George V. Thomas, Mr. G. Unnikrishnan,
I . Sajit T., Mr. G.D. Gem Mathew, Mr. Cyriac Joseph,
Mr. Vinu, Mr. Saji and Miss. Latha M.S., for their whole
hearted help and cooperation.
My thanks are also due to the non-teaching staff,
research scholars, postgraduate students of School of

Pure and Applied physics, Mahatma Gandhi University for
their cooperation.
I am thankful to Mahatma Gandhi University for
providing me the financial support during the course of
this work.
I am grateful to Dr. Mammootty, Director, LBS Centre
for Science and Technology and Prof. M.A. Muliyar,
Principal, College of Engineering, Kasargod for providing
me the essential leave and the encouragement to complete
the work.
My special thanks are due to M/s. LASER WRITE,
Ettumanoor, for the Word processing and Photocopying of
this work.
My special thanks are also due to my parents and my
sister for their constant encouragement throughout the
period of my work.
Finally, I thank all those who have helped me
directly or indirectly.
K. SHREEKRISHNA KUMAR

C O N T E N T S
Page
PREFACE '
cEAPTER1 GENEWL INTRODUCTION
1.1 Introduction 1.2 Definitions of Glass 1.3 Differences Between Crystalline and
Amorphous Solids 1.4 Formation of Glasses 1.4.1 Thermodynamics of glass formation 1.4.2 Glass or network formers and network
modifiers 1.5 Kinetics of Glass Formation 1.6 Preparation of Amorphous Materials
(Glasses) 1.7 Types of Glasses 1.8 Structure of Glasses 1.8.1 Structure of silicate glasses 1.8.2 Structure of borate glasses 1.9 Research Work Undertaken in the
Present Investigation References
CBAPPW2 EXPERIMENTAL TECHNIQUES
2.1 Introduction 2.2 preparation of Glass Sammples 2.3 Measurement of d.c Conductivity 2.4 Measurement of ~ielectric Constant
and a.c Conductivity 2.5 Ultrasonic Measurements 2.6 Laser Raman Spectroscopy References
cBApTw3 D.C.CONDUCTTVITY STUDIES ON CaO-B 0 -Al 0 -Na 0 AND Ca0-B203-A1203-Pe203 GLASS SY&~&~S
2 3 2
3.1 Introduction
PART I REVIEW OF D.C.COMIUCTIVITY STUDIES ON OXIDE GLASSES CONTAINING ALKALI/ TRANSITION-METAL OXIDES
3.2 Introduction 6 1 3.3 D.C Conductivity Studies on Oxide Glasses
Containing Alakali Oxides -- A Review 6 2 3.4 D.C Conductivity Studies on Oxide Glasses
Containing Transition-Metal Oxides- A Review 72
PART 11 STUDY OF D.C CONDUCTIVITY IN CaO-B o - A1203-Ne20 GLASS SYSTEM
2 3
3.5 Introduction 3.6 Experimental Details 3.6.1 Glass composition 3.6.2 Preparation of glass samples 3.6.3 Measurement of d.c. conductivity in
CaO-B 0 -A1 0 -Na 0 glass system 3.7 ~ e s u l ~ s ~ a n d ~ ~ ? s c u ~ s i o n 3.8 Conclusion
PART I11 STUDY OP D.C. CONDUCTIVITY IN CaO-B203- A1203-Pe 0 GLASS SYSTEM
2 3
3.9 Introduction 3.10 Experimental Details 3.11 Results and Discussion 3.12 Conclusion References
CEAPTW 4 DIELECTRIC CONSTANT AND A.C CONDUCTIVITY STUDIES ON CaO-B 0 -Al 0 -Na 0 AND CaO-B 0 -Al 0 -Fe 0 GLASS SY~& 2 2 3 2 3 2 3
4.1 Introduction
PART I REVIEW OF DIELECTRIC CONSTANT AND A.C. CONDUCTIVITY SlUDIES ON OXIDE GLASSES CONTAINING ALKALI/TRANSITION- METAL OXIDE
4.2 Review 120
PART 11 STUDY OF DIELECTRIC CONSTANT 'AND A.C. CUM)UCTIVITY IN C ~ O - B ~ O ~ - A ~ ~ O ~ - N ~ ~ O GLASS SYSTEM
4.3 Introduction 130 4.4 Experimental Details 130 4.4.1 Glass composition and measurement of
dielectric constant and a.c conductivity 130 4.5 Results and Discussion 132 4.6 Conclusion 154

PART I11 STUDY OF DIELECTRIC CONSTANT AND A.C CONDUCTIVITY I N CaO-B 0 - A l 0 -Pe 0 GLASS SYSTEM
2 3 2 3 2 3
4.7 Introduction 4.8 Experimental Details 4.9 Results and Discussion 4.10 Conclusion References
CHAPTER 5 L A S W RAMAN STUDIES ON QUARTERNARY GLASS SYSTEM CaO-B 0 -Al 0 -Na 0 AND CaO-B 0 -Al 0 -Pe 0
2 3 2 3 2 2 3 2 3 2 3
5 .1 Introduction 5.2 A short Review 5.3 Work Undertaken in the Present Study 5.4 Experimental Details 5.5 Results and Discussion 5.6 Conclusion References
- 6 ULTRASONIC STUDIES ON CaO-B 0 -Al 0 -Na 0 AND Ca0-B203-A1203-Pe2O3 ~Li.54 S Y ~ ~
6.1 Introduction 6.2 Ultrasonic Investigations in Oxide
Glasses -- A Brief Review 6.3 Theory 6.4 Work Undertaken in the Present Study 6.5 Experimental Details 6.6 Results and Discussion 6.7 Conclusion References

TREFACE
Glass is one of the oldest synthetic materials used
by man and knowledge of glass has been acquired over many
centuries. Scientific study of glasses began with Faraday
and others at the beginning of the nineteenth century and
today it is still a rapidly developing subject, both in
the development of new glassy materials with special
properties and in the application of new scientific
nethods to improve our understanding of the structure and
properties of ylasses. The ever increasing interest on
glasses is motivated by their widespread practical
agglications and by the fact that they exhibit a number of
physical properties, which suggest specific structural
sin9ularities that differentiate the glassy state of
matter from the crystalline as well as the ordinary
anorphous state. So far, however, a unified theory of
glassy state has failed to emerge, and so the specifies of
the structure of glasses continue to be less than fully
understood.
Glasses have some unique properties which are not
found in other engineering materials. The combination of
hardness and transparency at room temperature along with
sufficient strength and excellent corrosion resistance

make glasses indispensible for many practical
applications. Glassy materials are generally good
electrical insulators and glassy metals are more resistant
to chemical attack than polycrystalline metals. In recent
years the growth of the new field of solid state ionics
has caused renewed interest in the properties of glassy
ionic conductors. Glassy materials have acknowledged
advanta~es like physical isotropy, the absence of grain
boundaries, continuously variable composition and good
workability over their crystalline counter parts.
Due to potential practical applications in various
engineering and technological fields, the study of the
properties of glasses is of great significance. Recent
years have seen notable achievements in the development of
new glass systems with interesting properties. Continued
effort for the development of new glassy materials and
study of their properties is highly relevant in view of
the role these materials are expected to play in
technological fields.
CaO-B 0 -A1 0 glass system usually known as cabal 2 3 2 3
glass system has exceptionally high resistance. Sir
Herbert Jackson at the British Scientific Instruments
Research Association rras the person who first prepared
this glass and coined the name 'cabal' glass. The
electrical properties of this system of glass was first
studied by Owen. Owen reported that it has a very high
resistance and it acts almost as an insulator. The
present work deals with the study of the effect of
addition of an alkali oxide like Na 0 or a transition 2
metal oxide like Fe 0 on the physical properties of cabal 2 3
glasses. Cabal glasses containing different mole
percentages (mol%) of Na 0 or Fe 0 were prepared and 2 2 3
their d.c. conductivity, a.c. conductivity and dielectric
constant were studied in detail. The vibrational
properties of these glasses were studied using laser Raman
spectroscopy. The elastic properties of the glass samples
were investi~ated using ultrasonic techniques.
The thesis entitled, "Study of Physical Properties of
Certain Borate Glasses" is a detailed account of the
investigations carried out on the preparation, d.c.
conductivity, a.c. conductivity and dielectric constant,
vibrational properties using laser Raman spectroscopy and
elastic properties of cabal glasses containing Na20 or
Fe203.
The thesis is divided into six chapters. Chapter 1
provides a general introduction to amorphous materials
(especially slasses) and their importance in various
fields. A brief report on the various techniques of

preparation, different types of glasses, structure of
glasses and thermodynamic behaviour of glasses are also
included.
Chapter 2 gives a brief account of the various
instruments used for the preparation of glass systems and
their characterization. For the preparation of glasses an
horizontal muffle furnace and quenching system were used.
The d.c. conductivity was studied using a conductivity
cell and a prosrammable Keithley electrometer. a.c.
conductivity and dielectric constant measurements were
made with the help of a Hewlett-Packard impedance analyser
(4192A LF). The structure of the glass system was
investigated using laser Raman spectrometer. An
ultrasonic pulse-echo overlap system was used to
investigate the ultrasonic velocity and elastic constants
of the glass system.
Part I of Chapter 3 gives a brief review of the
earlier studies on d.c. electrical conductivity in alkali
and transition metal oxide containing oxide glass systems.
The pr*paration and d.c conductivity studies of Na O-CaO- 2
6 2 0 3 - ~ 1 2 ~ 3 and Fe 0 -CaO-B 0 -A1 0 2 3 2 3 2 3
glass systems
investigated in the present work are described in Part I1
and Part I11 respectively. The popular technique of
splat-quenching was used for the preparation of the glass

systems and amorphous nature of the glass samples was
confirmed with X-ray diffraction patterns. The effects of
~ a + , ca2+ and ~ 1 ~ + ions on conductivity were
systematically investigated by preparing three series of
glass samples containing varying concentrations of Na20,
CaO or A1203. Conductivity measurements were carried out
over a temperature range from 300 to 525 K. It was
observed that by the addition of the alkali oxide (Na20)
the insulator-like cabal glass system can be made
conducting to a reasonable extent. The author has also
made an attempt to make the glass system electronic
conducting by the addition of a transition metal oxide
Fe203. To make the study a systematic one, the effects of
Fe203, CaO and A1203 in this glass system were studied by
preparing three series of glass samples containing varying
concentrations of Fe 0 CaO or A1 0 2 3' 2 3' It was observed
that the d.c. conductivity of this glass system vary with
temperature and with the concentration of . t h e
constituents. The experimental results are discussed on
the basis of ionic and polaronic conducting models. It is
concluded that the insulator type cabal glass system can
be made conducting to a reasonable extent by the
incorporation of Na 0 or Fe 0 to the glass system. 2 2 3
A brief review of the recent studies on dielectric
constant and a.c. conductivity measurements in oxide

glasses is given in Part I of the Chapter 4. Part I1 and
Part I11 respectively deal with the measurement of real I
part of dielectric constant ( ) and a.c. conductivity
( 6ac) of Na 0-Ca0-B203-A1 0 and Fe 0 -CaO-B203-A1 0 2 2 3 2 3 2 3
glass systems. - The measurements were carried out with the
help of Hewlett-Packard impedance analyzer (4192A L F )
having a frequency range from 5Hz to 13MHz. Variation of
&I and b a c with frequency and temperature has been
studied for glasses containing different mol% of the
constituents. It is observed that the values of I' and
b a c depend on the temperature, frequency of the applied
field and the concentration of the constituents. The
experimental results are discussed on the basis of the
existing theories.
A brief review of laser Raman studies on borate
glasses is given in the beginning of Chapter 5. Chapter 5
describes the laser Raman studies of vibrational
properties of the glass systems Na20-CaO-B 0 -A1 0 and 2 3 2 3
Fe 0 -CaO-B 0 -A1203. 2 3 2 3 Since the glass system lacks long-
range periodicity the laser Raman spectra of glasses are
important for getting an insight into the structure of
glasses. The peaks in the spectra are discussed in the
light of reported spectra of other borate glasses. The
effects of variation of composition of the glasses on the
vibrational frequencies are studied.

vii
Chapter 6 provides an account of the ultrasonic
investigations carried out on the glass systems Na O-CaO- 2
B 0 -A1 0 and Fe203-CaO-B 0 -A1203. 2 3 2 3 2 3 A brief introduction
to elastic properties of solids and a short review of
recent ultrasonic studies on oxide glasses are given in
the beginning of Chapter 6. In this chapter, the author
presents the experimental results and discussions of
ultrasonic velocity and elastic constant measurements as a
function of composition of the Na20-CaO-B 0 -A1203 and 2 3
Fe 0 -CaO-B 0 -A1 0 glass systems. 2 3 2 3 2 3
Parts of the research work presented in this thesis
are published/communicated for publication or presented/
accepted for publication in National/International
Journals or Seminars.
1. Influence of Na20 on the d.c electrical conductivity (rnakeriak acd cyp1ications)
of cabal glasses, Solid State IonicsA, 499 (1992).
2. Dielectric constant and a.c conductivity of B2°3-
A1203-Na20-Ca0 glass system, J. Mat. Sci.
Lett. (communicated).
3. Dielectric properties of cabal glasses containing
Fe 0 2 3' Solid State Physics Symposium, BARC, Bombay,
(December 1993)(accepted for publication in the
proceedings).

4. d.c electrical conductivity of B203-Zn0-Ca0 glass
system, Proceedings of the Third Kerala Science
Congress, Kozhikode, 296 (Feb. 1991).
5. d.c conductivity of cabal glass system containing
Fe203, xxvth National Seminar on Crystallography-
Abstracts, Madras University, Madras (Dec. 1993).
6. Study of enhancement of d.c conductivity of cabal
glasses, Proceedings of the sixth Kerala Science
Congress, Thiruvananthapuram (Jan. 1994)(accepted for
publication).
7. Laser Raman study of Cao-B203-A1 0 -Na 0 and Cao- 2 3 2
B 0 -A1 0 -Fe203 glass systems(communicated). 2 3 2 3
8. Ultrasonic velocity and elastic constants
measurements of CaO-B 0 -A1 0 -Fe 0 2 3 2 3 2 3 glass
systems (communicated).
9. d.c conductivity measurements in Fe203 containing
cabal glasses (communicated).
+ 10. Effect of Na , Ca 2 + and ~ 1 ~ ' ions in the d.c
conductivity of CaO-B 0 -A1 0 -Na20 and CaO-B 0 - 2 3 2 3 2 3
Al2o3-~e2o3 glasses(conmunicated).
CHAPTER 1
GENERAL INTRODUCTION

CHAPTER 1
GENERAL INTRODUCTION
1.1. Introduction
The term 'glass' is commonly used to mean the fusion
products of inorganic materials which have been cooled to
a rigid condition without crystallization'.Glass is one
of the oldest synthetic materials used by man and the
present knowledge of glass has been acquired over many
centuries. Scientific study of glass began with Faraday
and others at the beginning of nineteenth century and
today it is still a rapidly developing subject, both in
the development of new glassy materials with special
properties for specific applications and in the
application of new scientific techniques to improve our
understanding of the structure and behaviour of glass.
Glasses have some unique properties which are not
found in other engineering materials. The combination of
hardness and transparency at room temperature along with
sufficient strength and excellent corrosion resistance
make glasses indispensible for many practical

applications. Glasses are generally good electrical
insulators. Also glassy metals are more resistant to
chemicals attack such as corrosion than polycrystalline
metals[l].
Recently, there has been renewed interest in the
properties of glassy ionic conductors[2-71. In part this
reflects a demand for new fast ion conductors and the
growth of the new field of solid state ionics. Glasses
have acknowledged advantages over crystalline electrolytes
including physical isotropy, the absence of grain
boundaries, continuously variable composition and good
workability.
1.2. Definitions of Glass
The increase in the scientific knowledge about
glasses caused a change in the definition of glasses.
In 1930, glass was defined as an amorphous solid, i.e., a
structureless solid[8]. In 1938, it was redefined as an
inorganic substance in a condition which is continuous
with and analogous to the liquid state of that substance,
but which, as a result of reversible change in viscosity
during cooling, has attained so high a degree of viscosity
that for all practical purposes it may be treated as
rigid[9]. In 1949, American Society for Testing

Materials (ASTM) defined glass as an inorganic product of
fusion which is cooled to a rigid condition without
crystallization[lO]. Later in 1960, glass was defined as
a non-crystalline solid[ll].
Again in 1968, glass was redefined as an amorphous
solid which exhibits a glass transition[l2]. Glass
transition exhibits more or less an abrupt change in the
thermodynamic properties, such as heat capacity, thermal
expansivity etc.
1.3. Differences Between Crystalline and Amorphous Solids
On the basis of atomic arrangement, solids may be
broadly classified into two categories. (i) crystalline
and (ii) amorphous.
In crystalline solids, both long-range and short-
range order exist in the arrangement of atoms while in
amorphous solids only short-range order exists. Figure 1.1
represents the schematic representation of the ordered
crystalline form and random network amorphous form of the
same composition. Due to the short-range periodicity in
the atomic arrangement, the degree of disorder will be
greater in an amorphous solid than its crystalline
counterpart and it will be having a higher entropy

F i q l . . Schematic representation of (a) ordered crystalline form and ( b ) random network amorphous form of the same composition.

compared to the crystalline phase. Therefore amorphous
state is a non-equilibrium state. So, on cooling from
liquid phase to the solid phase, a crystalline solid is
obtained as a transformation from one equilibrium state to
another while in amorphous solid, the transformation is
from an equilibrium state to a non-equilibrium state. Due
to the random arrangement of atoms, amorphous materials
exhibit isotropic properties while crystalline solids
exhibit anisotropic properties.
1.4. Formation of Glasses
There exist certain well-defined properties which are
common to all types of glasses (oxides, halides,
chalcogenides, etc) and are different from those of
liquids and crystalline solids. Diffraction studies using
X-rays and electrons have shown that glasses lack long
range periodicity. The atomic arrangement in glass is just
as in the liquid phase.
Unlike crystals, glasses do not have a sharp melting
point and do not cleave in preferred directions.. Like
crystalline solids they show elasticity - a glass fibre
can be bent almost double in the hand and, when released,
springs back to its original shape; like liquids, they
flow under a shear stress but only if it is very high.
Thus one can see that the glassy form of matter combines
the 'short-time' rigidity characteristic of the
crystalline state with a little of the long-time fluidity
of the liquid state. Glasses like liquids are isotropic,
a property which is of immense value in their use for a
variety of purposes.
1.4.1. Thermodynamics of glass formation
There are two main types of pathways that a liquid
may follow on cooling to the solid state: either it may
crystallize at or below the melting temperature, Tmr or it
may undercool sufficiently to form a glass without
crystallization. A glass is generally obtained by cooling
a liquid below its freezing point. The classical
explanation for the glass formation is that, when a liquid
is cooled, its fluidity which is the reciprocal of
viscosity decreases and, at a certain temperature, below
the freezing point, becomes nearly zero. That is, the
liquid becomes rigid. Figure 1.2 represents the volume-
temperature characteristics for crystal, liquid and glass.
When a liquid is cooled to form a solid, the resulting
cooling curve shows distinct differences from those of the
crystalline and amorphous solids. When a liquid
solidifies into a crystalline state there is a marked

To Tg3 Tg* Jg,Tm
Temperature .-+
Fig.l.2. Volume-temperature characteristics for crystal, liquid and glass.

discontinuity in the volume at a well-defined temperature
called the 'melting point', Tm'
of the material. However,
if no crystallization occurs, the volume of the liquid
decreases at about the same rate as above the melting
point until there is a decrease in the expansion
coefficient in a range of temperature called glass
transformation range. In other words, the liquid- glass
cooling curve does not show any discontinuity. The curve,
however, shows a change of slope at a temperature called
'glass transition (transformation) temperature', T . 9
Below this temperature range the glass structure does not
relax at the cooling rate used. The expansion coefficient
for the glassy state is usually about the same as that for
the crystalline solid.
Glass transition temperature mainly depends on the
rate of cooling of the melt. i-e., T is not a well- 9
defined one and is a function of cooling rate. Slower the
rate of cooling, lower is the value of T . However, T g 9
cannot be reduced indefinitely. Angell[l3] in 1970
pointed out that T cannot be lower than a particular g
minimum temperature called the ideal glass transition
temperature, To
. The explanation for this is found by
considering the relative heat capacities and entropies of
liquid and crystalline phases of the same composition.

The glass transition temperature can be determined by
differential thermal analysis (DTA) or differential
scanning calorimetry (DSC).
1.4.2. Glass or network formers and network modifiers
Glasses have been prepared using different types of
materials. The ability of a substance to form a glass
does not depend upon any particular physical or chemical
property. It is now generally agreed that almost any
substance, if cooled sufficiently fast could be obtained
in the glassy state although in practice crystallization
intervenes in many substances.
B2°3' Si02, Ge02 and P205, all of which come from a
certain area of the periodic table readily form glasses on
their own when their melts are cooled and are commonly
known as 'glass formers'. These are oxides of elements
with intermediate electronegativity: these elements are
sufficiently electropositive to form ionic structures,
such as MgO and NaCl, but also are not sufficiently
electronegative to form covalently bonded, small molecular
structures, such as C 0 2 . Instead, bonding is usually a
mixture of ionic and covalent and the structures are best
regarded as three-dimensional polymeric structures. As203

and Sb203 also produce glass on their own when cooled very
rapidly. Te02, SeO Moo3, W03, Bi 0 A1203, Ga203 and 2' 2 3'
V205 will not form glasses on their own, but each will do
so when melted with a suitable quantity of certain other
non-slass forming oxide. Hence they are known as
'conditional glass formers' according to Rawson[l4].
There are some oxides like Na 0, Li20, K20, PbO and 2
CaO which when added in small quantities (10 mol% to
15 mol%) to the glass network forming oxides produce
drastic changes (melting point, conductivity, etc.) in the
properties of the later. Such oxides also modify the
network structure of the glass and hence they are termed
as 'glass or network modifiers'. The changes that are
produced by these modifiers in the glass network is shown
in figure 1.3.
Various attempts were made to explain the glass
forming tendency of the oxides. Goldschmidt's
criterion[l5] gives a correlation between the ability to
form a glass and the relative sizes of the oxygen anion
and cation. According to him, glass forming oxides are
those for which the ratio of ionic radii of anion and
cation lie in the range 0.2 to 0.4 and have four anions
around each cation, the anions being situated at the

Fig.1.3. Two-dimensional network of sodium-silicate glass.

corners of a tetrahedron. In otherwords, a tetrahedral
configuration of the oxide is a pre-requisite for glass
formation.
Zachariasen[l6] in 1932, pointed out that the
Goldschmidt's criterion was not satisfactory even as an
emperical rule, since not all oxides having a radius ratio
in the specified range are glass formers, Be0 being one
such case (RBe/Ro = 0.221; RBe - Radius of Be and
Ro - Radius of oxygen). Zachariasen considered the
relative glass-forming ability of simple oxides and
concluded that the ideal condition for glass formation is
that the material should be capable of forming an extended
three-dimensional network structure without any long-range
order. Since, the mechanical properties and density of an
oxide glass are similar to those of the corresponding
crystal, the interatomic distances and interatomic forces
in crystals and glassy state must be similar.
Zachariasen[l6] pointed out that because of the random
network, internal energy of glass is slightly higher than
that of the corresponding crystal which suggests that the
polyhedra of the same type as in the crystal must be
joined together in a similar way in the glass. For
example, consider the glass which is made up of silicon
dioxide (SiO ) which not only illustrates many structural 2
features but also is a major constituent of most

commercial glasses. The crystalline form of silica
contains SiO tetrahedra joined at the corners. Glassy 4
(vitreous) silica must also contain SiO tetrahedra joined 4
at their corners. The only difference between crystalline
and vitreous silica is that the relative orientation of
adjacent tetrahedra is variable in the former where as in
the later it is constant throughout the structure.
The generally accepted view of the structure of Si02
glass is largely same as that proposed by Zachariasen and
supported by the X-ray diffraction results of Warren[l7].
Zachariasen has put forward a set of emperical rules known
as Zachariasen's rules which an oxide must satisfy if it
is to be a glass former:
(i) No oxygen atom may be linked to more than two atoms.
(ii) The coordination number of oxygen atoms is small
(probably 3 or 4).
(iii) The oxygen polyhedra share corners with each other,
not edges or faces.
(iv) The polyhedra link upto form a three-dimensional
network. i.e., at least three corners of each
polyhedron should be shared.

Zachariasen's hypothesis for glass formation has been
more or less universally accepted. The alkali and
alkaline-earth oxides like Na20, K 0, Li20, BaO, CaO, MgO 2
which do not satisfy Zachariasen's rules cannot form
glasses. Oxides like Si02, B203, Ge02, etc. satisfy these
emperical rules and are good glass forming oxides.
Zachariasen extended these rules to multicomponent
glasses also with a few additional modifications viz.,
(i) the sample contains high percentage of cations which
are surrounded by oxygen tetrahedra or triangles,
(ii) these tetrahedra or triangles share only corners with
each other, and (iii) some oxygen atoms are linked to
only two such cations and do not form further bonds with
any other cations. In terms of Zachariasen's model for
glass formation, a 'network forming oxide' is an oxide
which forms part of 'vitreous framework' and 'network
modifying oxide' is an oxide which does not form part of
the network.
Another important hypothesis regarding glass
formation was put forward by Snekal[l8], known as Smekal's
mixed bonding hypothesis. According to Smekal, pure
covalent bonds have sharply defined bond-lengths and bond-
angles and these are incompatible with the random
arrangement of the atoms in glass. On the otherhand,
purely ionic or metallic bonds completely lack any
directional characteristics. Thus the presence of
'mixed' chemical bonding in a material is necessary for
glass formation. Glass forming substances with mixed
bonding are divided into three categories by Smekal:
(i) inorganic compounds like B 0 Si02; in this case the 2 3'
bonds are partly covalent and partly ionic.
(ii) elements like S, Se having chain structures with
covalent bonds within the chains and van der Waals forces
between the chains and (iii) organic compounds
containing large molecules with covalent bonds within the
molecule and van der Waals forces between them.
Sun[l9] in 1947 proposed a criterion for the
correlation between the structural features and the glass
forming tendency of simple oxides. Since the process of
atomic rearrangement which takesplace during the
crystallization of a material may involve the breaking and
reforming of interatomic bonds, it may be reasonable to
expect a correlation between the strength of these bonds
and the ability of the material to form a glass[l91. The
stronger the bonds, the more sluggish will be the
rearrangement process and hence more readily will a glass
be formed. Sun[l9] showed that the glass forming oxides
- 1 have bond strength greater than 330 KJ mol , whereas
modifier ions, which are not part of the network
structures, have bond-strengths that are below this value.

Rawson[l4] modified Sun's criterion and related glass
forming tendency to the ratio of bond-strength to melting
temperature. This ratio accounts for both the bond-
strength and the thermal energy available to break the
bonds, which depends on temperature. It is vitrually
impossible to crystallize B203 glass and thus can be
understood from Rawson's criterion, since B203 has a
relatively low melting point, 4 0 0 ~ ~ . This criterion may
also explain why, in binary systems, the glass forming
compositions are often located around the low melting
eutectics.
1.5. Kinetics of glass formation
In order for a glass to form, the rate of
crystallization of the undercooled liquid must be
sufficiently slow that crystallization does not occur
during cooling. Crystallization of an undercooled liquid
is a two stage process that involves the formation of
crystal nuclei followed by their subsequent growth. A
kinetic condition for glass formation is that the rate of
nucleation and/or the rate of crystal growth should be
slow. In some undercooled liquids, nucleation is easy
because there are plenty of nucleation sites available;
foreign particles, container surfaces, etc. can act as
nucleation sites. The rate of crystallization is then

largely controlled by the rate of growth, which varies
with temperature in a manner shown in figure 1.4. The
rate is zero at the melting point, increases to a maximum
at a certain degree of undercooling and then falls to zero
again at still lower temperatures.
At lower temperatures, especially for glass forming
liquids, the viscosity of the undercooled liquid becomes
increasingly important. With increasing viscosity, the
diffusion of atoms or ions through the liquid to the
surface of the growing nuclei becomes increasingly
difficult and the rate of crystallization tends to
decrease accordingly.
With decreasing temperature, there are two competing
effects. The increased difference in free energy between
crystals and liquid favours crystallization whereas the
increased viscosity of the undercooled liquid reduces the
tendency for crystallization. The peak in the
crystallization (figure 1.4) corresponds to the situation
where these two competing effects have equal weight. On
the low temperature side of the peak, the viscosity effect
dominates whereas on the high temperature side it is the
difference in free energy between crystals and the liquid
that predominates.

RATE OF CRYSTALLIZATION -+
Tm
Dependence of rate of crystallization undercooled liquid on temperature.
>
-
+ W u 3 ----------- b 4. u W
4--- a
DANGER
z ZONE w FOR c GLASS
FORMATION
.f ---------------

In considering the crystallization of undercooled
liquids (figure 1.4) and the ability to form a glass,
there is a 'danger zone' for glass formation that
corresponds to the maximum in the crystallization rates.
If it is possible to undercool a liquid through this
danger zone, it should be relatively safe from subsequent
crystallization (or devitrification) and the liquid will
form a kinetically stable glass.
1.6. Preparation of amorphous materials (glasses)
There are atleast a dozen different techniques that
can be used to prepare materials in the amorphous state.
Of these, the following are commonly used in one form or
another to produce most non-crystalline (amorphous)
materials of commercial or academic interest. They are
(i ) thermal evaporation
(ii) melt quenching method
(iii) sputtering
(iv) glow discharge decomposition
(v) chemical vapour deposition
(vi) sol-gel method
(a) splat quenching
(b) melt spinning
(c) roller quenching

The commercially used methods for the preparation of
glasses are briefly discussed below.
(i) Thermal evaporation
This method is widely used to prepare amorphous thin
films of semiconductors and chalcogenide glasses. It is
one of the several ways of producing amorphous solids
from a vapour. In this method, the starting material is
vaporised and is collected on a substrate. The thermal
evaporation technique is performed in vacuum (about
Torr) to reduce contamination and to avoid the effect
due to scattering. The material is evaporated by heating
in a molybdenum or tungsten 'boat' or by bombarding with
high energy electrons from an electron gun and the
vapours are collected on a cold substrate. The essential
feature of thermal evaporation is that atomic surface
mobility is greatly diminished because of the cold
substrate, causing the atom to be frozen in the random
positions at which they arrive. The principal advantage
of thermal evaporation as a preparative technique lies in
the variability in purity and composition of the films.
The quality of the resulting film developed by this
method depends on (a) the substrate temperature (b)
distance between the source and substrate and their
orientation (c) pressure in the chamber and (d) the
filament (boat) temperature.
(ii) Melt-quenching technique
Many materials need sufficiently rapid quenching in
order that the melt solidifies into glass. Commonly used
melt quenching methods are (a) splat quenching (b)
melt-spinning and (c) roller quenching.
(a) Splat quenching: This is the oldest but most
established method for the preparation of amorphous
materials. In this method the melt is cooled
sufficiently quickly, which is referred to as 'quick
cooling'. The method is particularly useful in the
preparation of metallic glasses and the cooling rates may
8 lie in the range lo5 to 10 K/sec. This is the method
used for the preparation of glasses in the present study
and is discussed in detail in chapter 3.
(b) Melt spinning method: This is the most commonly used
rapid liquid quenching technique (figure 1.5) to obtain
glasses in the form of long ribbons of uniform cross
section and having reproducible properties. This method
is widely used for the commercial production of amorphous
alloys.

A melt-spinner consists of a disc, usually of copper,
which is to be rotated at high speed (figure 1.5). The
alloy is melted by r.f. induction heating under an inert
helium or argon atmosphere. The ejection of the alloy
melt is achieved by increasing the inert gas pressure
through a fine nozzle at the bottom of a refractory tube
of the spinning disc. The dynamic melt puddle impinging
on the moving substrate is solidified and is thrown out of
the wheel in the form of a ribbon by the centrifugal force
after travelling with it over a short distance. Some of
the main process variables affecting the properties of
the ribbons are the amount of superheating, i.e., the
temperature in excess of the liquidus temperature of the
alloy, the jet velocity, the angle of ejection, the
dimension and shape of the orifice, the speed of the
spinning disc, the temperature and nature of the surface
finish of the substrate, and the atmosphere.
(c) Roller quenching method: In this method, the melt is
propelled onto a cooled rotating drum as shown in
figure 1.6. The amorphous material (glass) thus obtained
is in the form of a thin ribbon. This method has the
advantage of producing glassy ribbons of uniform
thickness. Usually this method is used to prepare glassy
metals. In this method the cooling rates are of the order
8 of lo6 to 10 K/sec.

Fig.1.5. Schematic diagram of melt-spinning technique.
GAS I PRESSURE
EJECTED MELT I
GLASSY COOLED RIBBON ROTATING / COPPER DRUM
~i~.1.6. schematic diagram of roller-quenching technique-

(iii) Sputtering
Besides the rapid liquid quenching, the most commonly
used technique for the preparation of glassy
semiconductors and metals is sputtering. Sputtering is
the process by which atoms or molecular groups are
released from a target under the bombardment of positive
ions. The major advantage of this technique is that it is
not regulated by classical thermodynamics and Gibbs phase
rule. Hence, unlike methods involving rapid quenching of
liquids which require homogeneous melt, this technique can
be used to make new materials without regard to solid
solubility and immisibility. Further, the process of
sputtering does not degrade the properties of substrate.
The simplest way to induce sputtering is to apply a high
negative voltage to the target surface, thereby attracting
positive ions from the plasma. However, this d.c.
sputtering process is only feasible for targets composed
of metals, or atleast consisting of materials which are
sufficiently electrically conducting so that the target
can act as an electrode. In sputtering process, the
following factors are very significant. (i) sputtering
gas pressure (ii) r.f. power applied to target (iii)
bias voltage of target or substrate (iv) ratio of
partial pressures of reactive gas to inert gas.

(iv) Glow-discharge decomposition
This method is also used to prepare amorphous solids
of semiconductors in the form of thin films. This
technique, like sputtering relies on the production of a
plasma in a low pressure gas, but instead of ions from a
plasma ejecting materials from the target, chemical
decomposition of the gas itself takes place leading to
deposition of a solid film on a substrate placed in the
plasma.
(v) Chemical vapour deposition (CVD)
This method is used to prepare amorphous solids of
polycrystalline materials. Chemical vapour deposition is
similar to the glow discharge method in that both depend
on the decomposition of vapour species. In this CVD
method, chemical decomposition of a vapour takes place
leading to deposition of a solid film on a substrate
placed in plasma.
(vi) Sol-gel method
This is a new method for preparing glassy materials.
The advantage of this technique is that, it is a low
temperature glass preparation method. The method for

producing amorphous materials via sol-gel method has
considerable technological promises[20]. The sol-gel
method has its greatest usefulness for those system which
give rise to very viscous melts near the melting point, or
alternatively which have extremely high melting points and
hence pose considerable technical problems in actually
being able to make glass by melt quenching.
Recently, a technique called ion implantation has
been extensively used for modifying the properties of the
surface layers of thin films especially of semiconductors.
In this technique high speed ions are allowed to impinge
on the surface. These ions travel a short distance and
get embedded within the top few atomic layers of the
material. In this process the quenching rate is estimated
to be about 1014 K/sec. It is possible to produce
amorphous para-surface layers in crystalline solids by
implanting ions in high doss. In electropolished Fe, Co
+ + and Ni foils by implanting B and P at low energy of 40
KeV and high doss of lo1' ions/cm2 amorphous thin films at
the surface of the samples can be produced without much
difficulty.
In addition, there are methods like laser glazing
technique, electrolytic deposition, etc. to prepare
amorphous materials.

1.7. Types of glasses
Glasses are not restricted to inorganic silicates but
form in widely different types of materials. Glasses may
be broadly classified into different groups according to
their chemical composition and their type of bond
(Table 1.1) as follows.
(i) Oxide glasses (silicates, borates, phosphates, etc.)
(ii) Chalcogenide glasses
(iii) Metallic glasses.
Table 1.1. Classification of glass forming materials in terms of chemical bonding
Bond type Glass-forming materials
Covalent Oxide glasses (silicates, borates, phosphates etc), chalcogenides, organic high polymers.
Hydrated ionic Aqueous salt solutions
Ionic Halides, nitrides, sulphates
Molecular or vander Waals Splat-cooled alloys or metallic

(i) Oxide glasses
Silicate glasses : Among oxide glasses,
commercially important and extensively studied are the
silicate glasses (Si02 based glasses). In silicate
glasses SiOZ is the glass former and the study of its
structure and properties has been very important in
understanding the chemically more complex silicate
glasses. These glasses have immense applications in
various fields due to its chemical and weathering
stability.
Borate glasses: Boron trioxide is a significant
component of glasses, enamels and glazes. It is very
rarely added to the raw material mixtures in the form of
oxide, more frequent use being made of H BO or Na2B40,. 3 3
Boron oxide (B 0 ) usually occurs in the glassy form which 2 3
is virtually incapable of direct crystallization. The
crystalline forms of B 0 can only be prepared by special 2 3
procedure. Although borate glasses are of little
commercial importance because they are water soluble, B2°3
is an important constituent of borosilicate glasses such
as Pyrex. In contrast to Si02 and silicate glasses in
which the silicon is present as Si04 tetrahedra, B 0 2 3
glasses contain BO triangular units and 3
B04 tetrahedra
depending on the composition. Addition of alkali oxide to

glassy B203 gives rather different results from those
obtained in the corresponding alkali silicates. The
structure of borate glasses are explained in detail in
section 1.8.
(ii) Chalcogenide glasses
Chalcogenides (elements of group 6 A in the periodic
table) like sulphur and selenium give viscous liquids on
melting which rapidly form glasses on cooling. Glassy or
amorphous semiconductors can be made from the chalcogens
either alone or in combination with other elements. In
this type of glasses, the bonding is fairly covalent and
the melt contain rings and chains of sulphur and selenium
atoms. The chalcogenide based glasses are semiconductors
and usually have electronic conductivities in the range
to 10 -1 -1 -I3 ohm cm . These glasses are used as
optical elements in the instruments for the infrared
region, where they transmit radiation of considerably
longer wavelengths than oxide glasses; however they show
very strong absorption in the visible region.
(iii) Metallic glasses
Usually, liquid metals do not form glasses, but
recently certain compositions have been shown to do so.

Some particular metallic compositions may be quenched very
fast to yield glasses and usually, at least two elements
must be present in the melt composition. One of these is
a conventional metal, eg., a transition-metal element
such as iron or palladium and the other is an element on
the metal insulator border line. In order to prepare
glassy metals, special ultra rapid quenching techniques
like splat quenching or roller quenching are necessary.
The cooling rates are usually of the order of lo6 to
8 10 K/sec.
Glassy metals are much stronger than crystalline
metals. These are resistant to chemical attack. Some
glasses containing cobalt and iron have low coercivity and
may be easily magnetized and demagnetized.
1.8. Structure of glasses
Several techniques, both microscopic and macroscopic,
have been developed for the study of the structure and
properties of glasses. By measuring the viscosity,
density and electrical conductivity of glass system, one
can get an insight in to the structure of the glass121-261.
Structural studies have been carried out by several
investigators127-311, using electron spin resonance
(ESR), nuclear magnetic resonance (NMR), Raman, IR and
Mossbauer spectroscopy, and X-ray diffraction.

1.8.1. Structure of silicate glasses
Structure of glasses lacks long-range periodicity in
the atomic arrangement. The X-ray and spectroscopic
studies may be used for obtaining information about the
structure of glass systems. The generally accepted view of
the structure of glassy Si02 is largely the same as that
proposed by Zachariasen[l6] and supported by the
X-ray diffraction results of Warren[8]. The structure is
built up of corner-sharing Si04 tetrahedra which link up
to form a three-dimensional network that lacks long-range
periodicity. In order to maintain electroneutrality, each
corner oxygen is shared between only two tetrahedra and
consequently the structure is rather open.
Due to the absence of a unit cell in a glass
structure, the X-ray diffraction pattern of glasses is
very diffuse, consisting of broad humps rather than
sharp peaks. (The comparison of glassy and crystalline
X-ray diffraction patterns of Si02 is shown in figure 1.7).
The only information that can be obtained from the X-ray
studies is the radial distribution curve (figure 1.8).
This is a curve plotted between pair distribution function
and the interatomic distance. From this one can find out
the probability of finding a second atom as a function of

~ i g . 1 . 7 . X-ray powder d i f f r a c t i i o n p a t t e r n o f ( a ) c r y s t a l l i n e SiO and (bl g l a s s y SiO
2 2 '
INTERATOMIC DISTANCES (il
~ i g . l . 8 . X-ray d i f f r a c t i o n r e s u l t s f o r S i 0 2 g l a s s .

distance from a chosen atom. From the figure 1.8, it is
obvious that the probability of finding a second atom is
represented on the ordinate by a pair distribution
function and the straight line gives the results expected
for the hypothetical material that consists of a random
array of non-interacting point atoms.
The structure and properties of silica based glasses
(binary, ternary, etc.) is not only dependent on Si02
structure, but also on the nature and concentration of
other oxides (modifier oxides) which are added to Si02.
Addition of modifier oxides like alkali or alkaline-earth
oxides to the network forming oxides leads to the breakage
of Si-0-Si bonds creating non-bridging oxygens and the
modifier cations remain at the interstitials of the
network. In otherwords, the silica network is gradually
broken up as more of the alkali or alkaline-earth oxide is
added. If the concentration of the modifier oxide is
increased, the ratio of silicon to oxygen will be
decreased. That means more and more non-bridging oxygen
atoms will be formed and the network will be rather open.
In otherwords, if the alkali concentration is more :
eg., if there are two sodium ions to each silicon ion as
in Na 0 - SiO glass system) some of the tetrahedra will 2 2
be unlinked from the network of the linked tetrahedra.
In this case, the viscosity of the liquid phase will be
markedly lower and it becomes increasingly difficult to
form glasses at higher alkali concentrations.
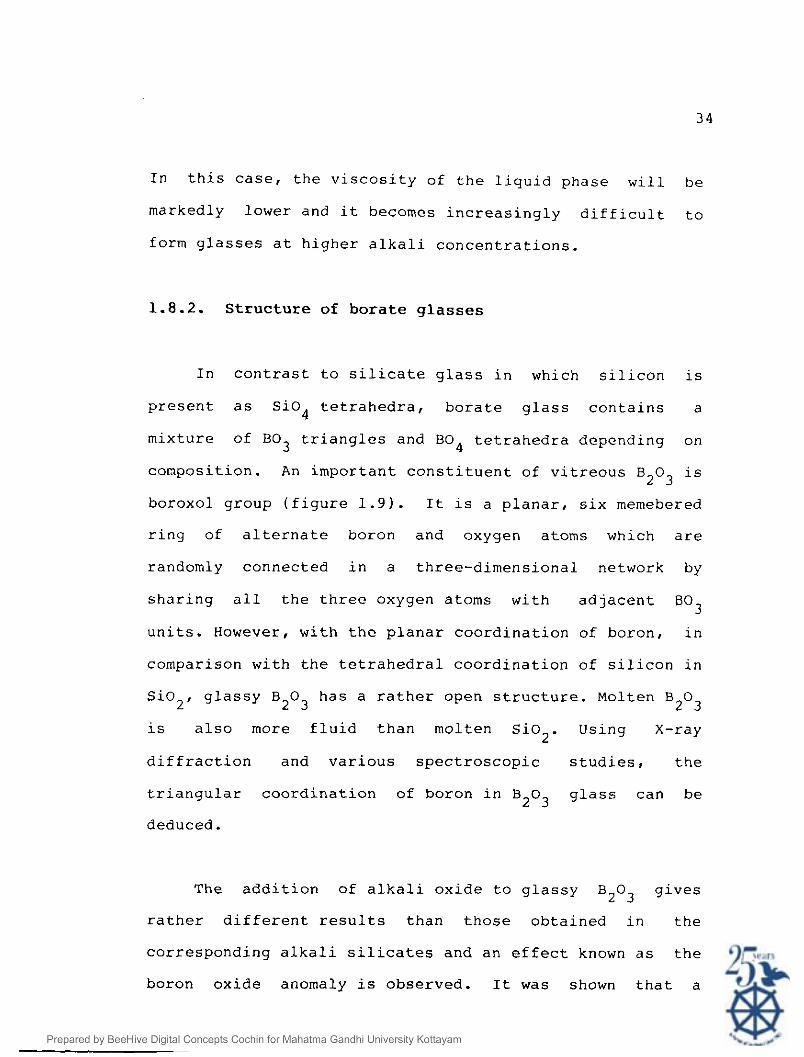
1.8.2. Structure of borate glasses
In contrast to silicate glass in which silicon is
present as SiO tetrahedra, borate glass contains a 4
mixture of B03 triangles and B04 tetrahedra depending on
conposition. An important constituent of vitreous B 0 is 2 3
boroxol group (figure 1.9). It is a planar, six memebered
ring of alternate boron and oxygen atoms which are
randomly connected in a three-dimensional network by
sharing all the three oxygen atoms with adjacent B03
units. However, with the planar coordination of boron, in
comparison with the tetrahedral coordination of silicon in
Si02, glassy B 0 has a rather open structure. Molten B 0 2 3 2 3
is also more fluid than molten SiO 2 -
Using X-ray
diffraction and various spectroscopic studies, the
triangular coordination of boron in B 0 glass can be 2 3
deduced.
The addition of alkali oxide to glassy B203 gives
rather different results than those obtained in the
corresponding alkali silicates and an effect known as the
boron oxide anomaly is observed. It was shown that a

Fig.l.9. Scnernatic representation of boroxol group B = Boron, 0 = Oxygen.

gradual change in the coordination number of boron from
three to four occurs as alkali oxide is added. By
combining Raman scattering studies and the NMR
investigations with the available crystallographic data,
structural groups present in these glasses have been
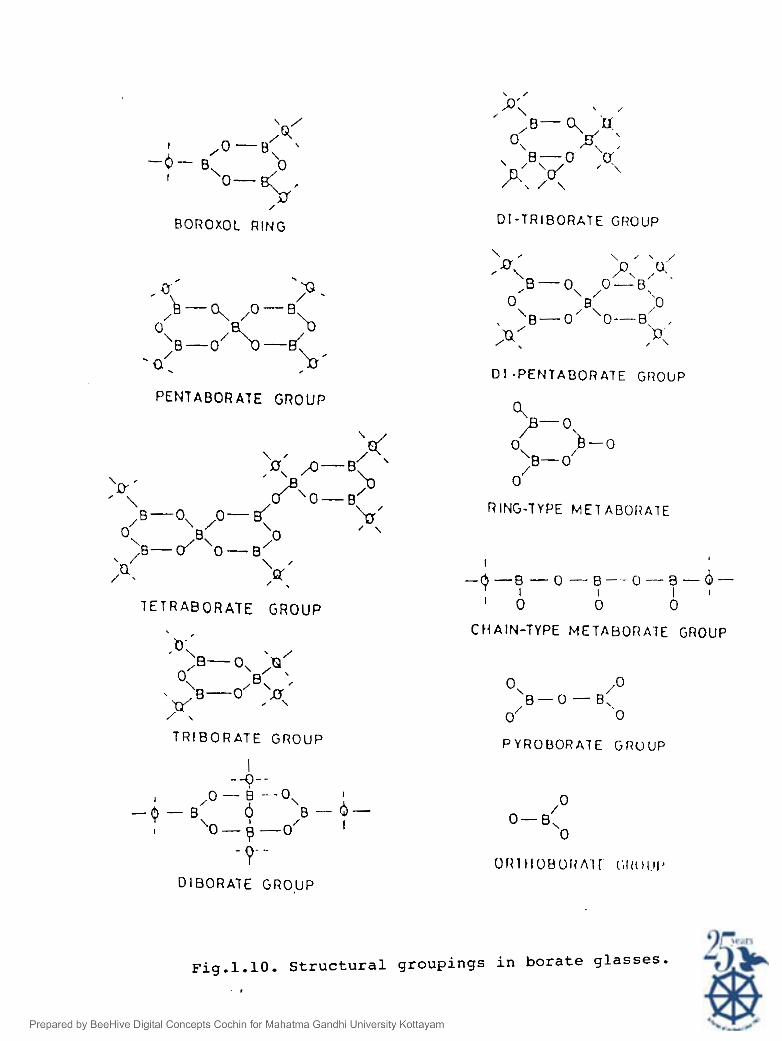
clearly identified. Figure 1.10 shows the several
structural groups present in various borate compounds.
Pure B 2 0 3 consists of planar BO units which are 3
randomly distributed in a three-dimensional network by
sharing all the three oxygen atoms with adjacent B03
units. The planar B 0 3 unit presumably involved in sp 2
hybridization, with the third orbital being vacant and
extending in direction perpendicular to the B03 plane.
This vacant orbital accepts an electron from the unpaired
electrons from the oxygen atoms, forming a partial double
bond.
The following modifications in the network can be
enhanced by the addition of network modifying oxides.
(a) Boron-oxygen-boron bonds may be broken by oxygen
anions (as in the case of the breakdown of silica network)
to form non-bridging atoms, (b) a filled orbital of an
oxygen anion may overlap with an empty p-orbital of a
boron atom resulting in a change of hybridization of the
3 boron atom to the sp tetrahedra arrangement leading to
BOROXOL R I N G
'B -0
P E N T A B O R A T E G R O U P
T E T R A B O R A T E G R O U P
T R I B O R A T E G R O U P
D l - T R I B O R A T E GROUP
D l - P E N T A B O R A T E GROUP
a
RING-TYPE M E I A B O I ? A l E
I
- 9 - B - 0 - 0 - 0 -
I A I 0 e -0 - 0
C t i AIN-TYPE M E T A B O R A l E GROUP
Fig.l.10. Structural groupings in borate glasses.

B04 tetrahedron with three bridging and one non-bridging
oxygen, (c) an oxygen atom may contribute an electron pair
to two BO units changing the coordination of the two 3
2 3 borons from sp to sp hybridization and with no non-
bridging oxygen.
Several attempts[32] were made to explain the
structure of borate glass on the basis of a number of
imaginative structural models, all of which were built
around the relatively unique ability of boron to exist
in two distinct coordination state. However NMR
studies[33,34] showed that the four coordinated boron
varies smoothly as x/(l-x) where x varied from 0 to
30 mol% modifier oxide without any unusual behaviour in
the critical range 15-20 mol% of modifier oxide. The B04
groups are bonded to the rest of the structure in four
directions and the structure is therefore tied together in
three dimensions rather than two. This will produce a
marked increase in the strength and tightness of the
Structure.
11 Bray has shown[26,281 using B NMR spectroscopy that
a gradual change in the coordination number of boron from
three fold to four occurs as alkali oxide is added to
B2°3' By the time about 30 mol% has been added,
approximately 40 per cent of the borons would have changed
to tetrahedral coordination and this is independent of the
nature of the alkali. In triangular coordination, the B 11
nucleus shows strong quadrupole coupling with a broad
resonance line whereas in tetrahedral coordination, the
quadrupole coupling is weak and the resonance is narrow.
Extensive investigations have been carried out on
crystalline and glassy borates by Krough-Moe[ZO] who
proposed a new model for the structure of borate glass.
Krough-Moe suggested that borate glasses are not merely a
random network of 80 triangles and B04 tetrahedra joined 3
at the corners, but, they actually contain well-defined
and stable groups as segments of the disordered frame
work. These borate groups which are included in the glass
structure should be indentical with the groupings which
occur in crystalline borates. From the experimental
results of thermodynamic[35] and infrared[36] studies the
structural groupings in borate glasses can be classified
into four different groupings. viz., boroxol ,
pentaborate, triborate and diborate groups (figure 1.10).
the pentaborate and triborate groups will always occur in
pairs and these pairs are referred to as tetraborate
groups.

Boron oxide anomaly
This is a peculiar property of borate glasses and
which cannot be seen in the boron-free glasses. In the
system Na20-B203, for example, viscosity of the melt
increases with increase in the alkali oxide content and
passes through a maximum at 16 mol% Na20. Similarly the
properties like coefficient of thermal expansion also show
either minimum or maximum around this composition. This
peculiar effect is known as boron oxide anomaly. A fully
accepted explanation of the boron oxide anomaly is not yet
reported. A partial explanation of the boron oxide
anomaly is that with small amounts of added alkali oxide,
some boron atoms change to tetrahedral coordination and
these act to 'tie-in' the network by increasing the
viscosity. Thus the boron to oxygen ratio, which is 1:1.5
in B203, increases towards the value 1:2, which is the
value in the vitreous B 0 as alkali oxide is added. A 2 3'
fully tetrahedral network could be achieved, in theory
even at 50 per cent alkali oxide, but it appears that long
before this situation is reached, the viscosity will start
to decrease again.
1.9. Research work undertaken in the present investigation
Preparation of glassy materials and the study of
their physical properties have gained much importance due
to their immense applications. Continued efforts which
may throw more light on the properties of already
prepared glasses and to synthesize new glassy materials
exhibiting practically useful properties are relevent in
view of the role glassy materials are expected to play in
technological and scientific areas.
The research work presented in this thesis consist of
the properties of the quarternary glass systems CaO-B203-
A1 0 -Na20 and CaO-B 0 -A1203-Fe203. 2 3 2 3 The glass system
CaO-B 0 -A1203 2 3
usually known as cabal glasses is
characterized by a very high electrical resistance due to
the lack of mobile charge carriers. The incorporation of
an alkali oxide like Na 0 or a transition-metal oxide like 2
Fe203 in cabal glass is expected to generate either
mobile ions or electrons, respectively, which may enhance
the conductivity of the glass system. In the present
investigation, the d.c and a.c conductivity, and
dielectric constant of the glass systems CaO-B 0 -A1 0 - 2 3 2 3
Na20 and CaO-B 0 -A1203-Fe203 are systematically studied 2 3
for different compositions of the glasses and over a wide
range of temperature. The structure of the glasses is

investigated using laser Raman spectroscopy. Ultrasonic
velocities in the glass samples have been measured using
ultrasonic pulse-echo overlap technique and thereby the
elastic constants of the glasses of different compositions
have been estimated.

References
1. Robert H. Doremus, "Glass Science", John Wiley & Sons, Inc. p.4 (1973).
2. Ingram M.D. and Vincent C.A., Chem. Soc. Ann. Repts. A23 (1977).
3. Ravaine D., J. Non-Cryst. Solids 38, 353 (1980).
4. Tuller H.L., Button D.P. and Uhlmann D.R., J. Non- Cryst. Solids 40, 93 (1980).
5. Souquet J.L., A. Rev. Mater. Sci. 11, 211 (1981).
6. Ingram M.D., J. Non-Cryst. Solids 73, 247 (1985).
7. Angell C.A., Solid State Ionics 9, 3 (1983).
9. Morey G.W., "The Properties of Glasses", 2nd Edition, Reinhold, N.Y. (1954).
10. Stanworth J.E., J. Soc. Glass. Technol. 30, 56 (1946).
11. Secrist D.R. and Mackenzie J.D., "Modern Aspects of the Vitreous State", Vo1.3, Butterworths, London (1960).
12. Elliot S.R., "Physics of Amorphous Materials", Longmann, London (1982).
13. Angel1 C.A., J. Chem. Educ. 47, 583 (1970).
14. Rawson M., "Proceedings of the IV International Congress on Glass", Imprimorice Chaix, Paris, p.62 (1956).
15. Goldschmidt V.M., Trans. Faraday. Soc. 25, 253 (1929).
16. Zachariasen W.H., J. Am. Ceram. Soc. 54, 3841 (1932).
17. Warren B.E., X-ray Diffraction, Addison Wesley (1969).
Smekal A., J. Soc. Glass Technol. 35, 411 (1951).
Sun K.H., J. Am. Ceram. Soc. 30, 277 (1947).
Krough-Moe, J. Phys. Chem. Glasses, 1, 26 (1960).
St. Barth and Feltz A., Solid State Ionics, 34, 41 (1989).
Ingram M.D., Phys. Chem. Glasses, 28, 215 (1987).
Ahmed M.M., Hogarth C.A and Ghauri M.A., J. Mater. Sci. Lett. 3, 341 (1984).
Lapp J.C. and Shelby J.E., J. Am. Ceram. Soc. 68, 368 (1985).
Kukjiam C.R. and Douglas R.W., Phys. Chem. Glasses, 1, 19 (1960).
Bray P.J., Hintenlang D.E., Mulkern R.V. et al., J. Non-Cryst. Solids, 56, 27 (1972).
Muller-Warmuth W. and Eckert H., Phys. Rep. 88, 92, 41 (1982).
Bray P.J. and Gravina S.J., Mater. Sci. Res. 19, 1 (1985).
Konijnendijk W.L. and Stevels J.M., J. Non-Cryst. Solids 18, 307 (1975).
Meera B.N., Sood A.K., Chandrabhas N. and Ramakrishna J., J. Non-Cryst. Solids 126, 224 (1990).
Videane J. J., Portier J. and Piriou B., J. Non- Cryst. Solids 48, 385 (1982).
Pye L.D., Frechette V.D. and Kredil N.J., "Borate Glass", Plenum Press (1977).
Savabsib S.E., Forskubd E. and Krough Moe J., J. Phys. Chem. 66, 174 (1962).
Bray P.J. and O'Keefe J.G.. Phys. Chem. Glasses 4, 37 (1963).
Krough-Moe, J. Phys. Chem. Glasses 3, 101 (1962).
Krough-Moe, J. Phys. Chem. Glasses 6, 46 (1965).

CHAPTER 2
EXPERIMENTAL TECHNIQUES

CHAPTER 2
EXPERIMENTAL TECHNIQUES
2.1. Introduction
The present work deals with the preparation of
certain borate glass systems and study of their physical
properties using different experimental techniques. First
of all the amorphous nature of the prepared glass system
was confirmed by recording the X-ray diffraction patterns.
The structure of the glass system was studied with the
help of laser Raman spectra. d.c and a.c conductivity and
dielectric constant studies were also undertaken. Finally,
ultrasonic techniques were used to determine the
ultrasonic velocity in glass systems of different
compositions and thereby to determine the elastic
constants of the glasses. A brief description of the
various instruments used in the present study is given
in the following sections.
2.2. Preparation of glass samples
The preparation of the glass samples was carried out
by the splat-quenching technique which is described in

detail in section 3.7 of chapter 3. A horizontal muffle
furnace was used for melting the glass forming mixture
and the melt was quenched by using the quenching device
consisting of two circular brass discs (figure 2.1).
2.3. Measurement of d.c conductivity
d.c conductivity measurments were carried out by
keeping the glass samples in a specially fabricated
stainless steel conductivity cell. The schematic diagram
of the conductivity cell is shown in figure 2.2. This
consists of a steel vessel of about 20 cm diameter and
40 cm height with a wall of thickness of about 1 cm.
Another cylindrical brass vessel 5 cm in diameter and
50 cm in height with a wall of thickness 0.2 cm is placed
inside the outer cylindrical vessel. At the bottom end of
the inner cylindrical vessel there is an arrangement
consisting of a pair of spring-loaded electrodes. The
glass samples for conductivity measurements can be held
gently between these electrodes. The temperature of the
sample can be varied by adjusting the current through a
heater filament. A chromel-alumel thermocouple is used
for the measurement of temperature.

Fig. 2.1 Quenching device used for the preparation of glass samples.

Fig. 2 . 2 Cross-Sectional view of the conductivity cell.
- 1. MultalicChambor 3 - DNC Camectiano 5. Cold L l w e r 7. Electrodes 9 . Spring loaded iscmws
1 . Vacuum PUIUP
2 . O -.rlryl 4 l lmtor Coll G. Sample 8. TeRm insulator
10. Teflon washore
For measuring the resistance of the sample, a very
sensitive and accurate electrometer (Keithley Model 617
programmable electrometer) was used. Figure 2.3
represents the block diagram of the experimental set up
for the measurement of d.c conductivity with the Keithley
electrometer. Keithley mode 1 617 programmable
electrometer is a very sensitive and accurate instrument
to measure the charge, current, voltage and resistance
directly. There is 4 1/2 digit display which includes
4 1/2 digit mantissa plus a two digit alpha numeric
exponent and autoranging is included for all functions and
ranges.
Another important advantage of this electrometer is
its use as a constant voltage source. The voltage source
can be adjusted between -102.35 V and +102.4 V in 50 mV
increments, and has a maximum output of 2 mA.
In the present study, the resistance of the sample
was measured by constant voltage method[l,21. In this
mode, the measured resistance is automatically calculated
in accordance with the familiar formula R = V/I where R
is the resistance, V is the voltage and I is the current.
The simple circuit diagram for conductivity measurement is
given in figure 2.4.

Fig.2.3. Block diagram of the experimental set up for the measurement of d.c conductivity using Keithley Electrometer.

Fig. 2.4 Circuit diagram for the measurement of d.c conductivity.
2.4. Measurement of dielectric constant and a.c
conductivity
Dielectric constant and a.c conductivity measurements
were made with the help of a 4 1/2 digit display Hewlett-
Packard 4192A LF Impedance Analyser. This instrument can
measure 11 impedance parameters (R,X,L,C,D,Q, etc.). The
built-in frequency synthesiser can be set from 5 Hz to
13 MHz with a maximum resolution of 1 MHz. Test signal
level is variable from 5 mV to 1.1V with mV resolution.
Also, an internal d.c bias voltage source provides 2 35V
at 10 mV increments. Thus, the HP 4192A LF impedance
analyser can evaluate components and entire circuits at
near actual operating conditions. The frequency can be
varied in steps of 0.001 Hz (5 Hz to 10 KHz), 0.01 Hz
(10 KHz to 100 KHz), 0.1 Hz (100 KHz to 1 MHz), 1 Hz
(1 MHz to 13 MHz) with a frequency accuracy of - + 50 ppm.
2.5. Ultrasonic measurements
The widely used method for making velocity and
attenuation coefficient measurements in solids and liquids
is the pulse technique introduced by Pellam and Galt[3]
in 1946. A pulse of sinusoidal voltage is applied to a
piezo electric transducer that is in contact with the
sample. The transducer converts the electrical pulse into

a pulse of ultrasonic waves which is transmitted in to the
medium.
The pulse-echo overlap technique was used in the
present studies for the measurements of the ultrasonic
velocity in glass systems of different compositions.
Pulse-echo overlap (PEO) method
The pulse-echo overlap ( P E O ) method is a versatile
and highly accurate technique for measuring the velocity
of ultrasonic waves in solids. The absolute accuracy
arises from the fact that the method is capable of
overlapping accurately from any cycle of one echo to the
corresponding cycle of the next echo and thus avoid the
phase shift properly[4]. This accuracy exceeds the
accuracy of other methods like pulse superposition method
and long pulse technique.
Figure 2.5 represents the block diagram of the
arrangement for making the pulse-echo overlap measurements
with broad band pulses. The basic principle of the
measurements is as follows: Take two signals of interest
and make them overlap on the oscilloscope by driving

Fig. 2.5 Pulse-echo overlap system.
1 - Crt. JY-= 'v'
Verlicol
'n P'
T
btecied Echoes - .
r
r
v R. F kiodel 2470 knpedence
Automatic
Model 7700 Pulse
Modulator d
Receivcr 0
O s c i b s c o p
L
I
Slroba
1
7 0 0 Seriu R . F.
Plug - h
,- 0- Z.Arl# Inpt
1-
I Y
SF '
A
A.G.C , . w1
Attenuotlon Divided Recorder $nc
hlodel 1228 , y 0 d e Oivtde-
b o l Delol( ht eno o n e r o t a
Intans.
i
-
C W + 11p1
L
r ~ q u c r r y Counter
- Modek 1 1 0
"'I% ' Rero Iton fmqucncy Source
' C.W.
mpr) L
the x-axis with a frequency whose period is the travel
time between the signals of interest. Then one signal
appears on one sweep of the oscilloscope and the other
signal appears on the next sweep. The x-axis sweep
frequency is supplied by the c.w oscillator as shown in
figure 2.5. For jitter-free overlap the signals of
interest must be synchronized with the phase of the c.w
voltage. This condition is achieved by generating the
repetition rate of the input pulse from the phase of the
c.w voltage by a frequency divider. Division by a large
integer (1000) allows all the echoes from one pulse to be
attenuated before the next pulse is applied. The output
of the frequency divider is a trigger signal synchronous
with the phase of the c.w voltage. The trigger signal
triggers the main pulser, which pulses the transducer. A
diode limited circuit keeps the input pulse from
overloading the amplifier. The main pulser also triggers
two intensifying pulses which are applied to the cathode-
ray tube to intensify the trace. This feature is
necessary to distinguish the two signals of interest from
the rest of the echoes in the trace. In operation, the
oscilloscope intensity is tuned down so that only the two
signals of interest (intesified by the two strobe pulses)
are visible. Overlap is achieved by adjusting the c.w

frequency such that its period is equal to the time
between the signals of interest. The echoes under correct
overlapped condition are shown in figure 2.6. The c.w
frequency is counted using the frequency counter and the
travel time is the reciprocal of the frequency. Knowing
the thickness of the sample, the velocity of the
ultrasonic waves in the sample can be calculated.
In the present study the ultrasonic velocities in the
glass samples were determined using a Matec ultrasonic
velocity system consisting of a high resolution fequency
source (Matec Model 1101, decade divider and dual delay
generators (Matec Model 122B), a pulse modulator and
receiver (Matec Model 7700) and a RF plug-in (Matec Model
755) having the frequency range 1 MHz to 20 MHz. The
frequency measurements were carried out using a frequency
counter (Aplab 1112) and the echo overlap was made with
the help of an oscilloscope (PHILIPS PM 3206). For
longitudinal and transverse velocity measurements
respectively X and Y cut quartz transducers of frequency
3 MHz were used. The transducers were bonded to the glass
samples using salol as the bonding material. The
overlapped broad band echoes from the pulse-echo overlap
system are as shown in figure 2.6.

Fig. 2.6 Overlapped broadband echoes from the pulse echo
overlap system.

2.6 Laser Raman spectroscopy
Among the various techniques used for understanding
the structure of glasses, laser Raman spectroscopy has
attracted much importance[5,6]. Generally, it is
difficult to give a complete theoretical interpretation of
the Raman spectra of glasses. However, it is feasible to
derive information on the presence of various structural
groups in glassy materials by comparison of their laser
Raman spctra with those of the corresponding crystalline
compounds. Raman spectra of crystalline materials are
used as finger prints for the identification of the
specific groups in glasses.
In the present study a DILOR 2 2 4 laser Raman
spectrometer was used for recording the spectra of the
glass samples.

References
1. Martin L., Methods of Experimental Physics, Vo1.6 Part B, (Solid State Physics) Academic Press (1959).
2. Tallan N.M., "Electrical Conductivity in Ceramics and Glass", Part A , Ed. Tallan N.M., Marcel Dekker. Inc. N.Y. (1974).
3. Pellam J.L. and Gatt J.K., J. Chem. Phys. 14, 608 (1946).
4. Papadakis E.P., Physical Acoustics: Principles and Methods, Ed. Mason W.P. and Thurston R.N., Vo1.12, Academic Press, N.Y. (1976).
5. Konijnendijk W.L. and Stevels J.M., J. Non-Cryst. Solids 18, 307 (1975).
6. Meera B.N. and Ramakrishna J., J. Non-Cryst. Solids 159, 1 (1993).

CHAPTER 3
D. C. CONDUCTIVITY STUDIES ON Ca0-B2@AI2O3-Na20
AND Ca0-B2O3Al2O3-Fe203 GLASS SYSTEMS

CHAPTER 3
D.C. CONDUCTIVITY STUDIES ON Ca0-B203-A1203-Na20 AND
CaO-B 0 -A1 0 -Fe203 GLASS SYSTEMS 2 3 2 3
3.1. Introduction
The ternary glass system CaO-B 0 -A1203 generally 2 3
known as cabal glasses is characterized by a very high
electrical resistance due to the lack of mobile charge
carriers. The incorporation of an alkali oxide like Na20
or a transition metal oxide like Fe 0 in cabal glass is 2 3
expected to generate either mobile ions or electrons,
respectively, which may enhance the conductivity of the
glass system. This chapter is a detailed account of the
study of d.c conductivity of the quarternary glass systems
Ca0-B203-A1 0 -Na20 and CaO-B 0 -A1203-Fe 0 2 3 2 3 2 3'
This
chapter is divided to 3 parts. Part I gives a brief
review of the d.c conductivity studies on oxide glasses
containing alkali oxides and those containing transition
metal oxides. Part I1 of this chapter deals with the
investigations carried out on the d.c conductivity of the
quarternary glass system Ca0-B203-A1 0 -Na20. 2 3
Part I11 consists of the studies carried out on d.c
conductivity of the glass system Ca0-B203-A1 0 -Fe203. 2 3

PART I
REVIEW OF D.C CONDUCTIVITY STUDIES ON OXIDE GLASSES
CONTAINING ALKALI/TRANSITION-METAL OXIDES
3.2. Introduction
The study of electrical properties of glasses has
gained much interest now-a-days due to the increasing
applications in engineering and technological fields.
Glasses have acknowledged advantages over crystalline
electrolytes including physical isotropy, the absence of
grain boundaries, continuously varying composition and
good workability. With regard to electrical conductivity
in glasses, generally, two kinds of mechanism are
observed. (i) ionic conduction and (ii) polaronic or
electronic conduction. In glasses containing alkali
oxides, like Na20, K20 and Cs20 conduction is due to the
motion of alkali ions which are more mobile than other
ions. In glasses containing transition-metal oxides like
Fe203 or V 0 the conduction is through the hopping of 2 5'
electrons and is usually referred to as polaronic
conduction.

3.3. D.C conductivity studies on oxide glasses containing
alkali oxides - a review
Recently there has been renewed interest in the
properties of vitreous ionic conductors[l-41. Ionic
conduction in glasses has been discussed by many
scientists[5-81. It was known for many years that glasses
containing alkali ions are essentially solid cationic
electrolytes, the current being carried by the relatively
mobile alkali ions. The mobility of these ions is much
larger than that of the network-forming ions at all
temperatures. When the current is carried completely by
the alkali ions, their transference number is unity, and
the conduction characteristics are determined by the
concentration and mobility of the alkali ions.
In glasses containing alkali oxides, the direct
current electrical conductivity can be understood in terms
of a thermally activated process which involves ionic
defects similar to the "Frenkel Defects" found in
crystalline substances. For the calculation of activation
energy for ionic conduction the most acceptable and widely
used theory is the theory proposed by Anderson and
Stuart[91. This theory with certain modifications was
used by Hakim and Uhlmann[lO] in the study of electrical
conductivity of glasses containing alkali oxides. They
measured the activation energy values and it was found
that the values were in good agreement with the values
calculated from the Anderson and Stuart's theory. Later
this theory was extended to the alkali containing borate,
silicate, phosphate and sulphate glasses exhibiting "mixed
cation effect". Eventhough the theory proposed by
Anderson and Stuart does not specifically take into
account the random structure of the glasses and is based
on certain approximations, the theory contains the
essential features of the ionic conduction in glasses. It
has been seen that this is the most suited way to explain
and discuss the ionic conduction in glasses.
As the temperature is increased, the electrical
conductivity of a glass system rapidly increases and over
a considerable temperature range the conductivity can be
expressed by the Arrhenius type equation
G = 6, exp (-E/KT) ... (3.1) where E is the activation energy for conductivity, 6 is
the d.c electrical conductivity, T o is the pre-
exponential factor and T is the absolute temperature.
The logarithmic version of this expression is usually
referred to as Rasch-Hinrichsen relation[ll].
log y = A + B/T
where A and B are constants.
The activation energy and the electrical conductivity
show a discontinuity at the transformation range
corresponding to the freezing of the glass structure at
this temperature. In this connection it is of interest to
note that the electrical conductivity of a quenched glass
(an open network structure) is larger than that of an
annealed glass (dense - network structure). In the
molten range, the conductivities of glasses are sometimes
shown to vary with temperature as
6 = 6, exp (-AT + B T ~ + .... ) ... ( 3 . 3 )
The overriding effect of composition on the
conductivity of glasses is related to the type and amount
of modifier ion present, particularly alkali ion.
Electrical conductivity measurements in alkali silicate,
alkali borate and alkali germanate glasses have been
extensively carried out. Generally, in alkali silicates,
a rapid increase in the conductivity is observed on
addition of alkali oxide to vitreous silica upto
20-30 mol% and at higher concentrations, the conductivity
lie in the range 10 -14 -1 -1 to ohm cm (at 2 5 0 ~ ~ ) as
the alkali concentration increases from 0 to 30 mol%.
For the same sodium ion concentration the conductivity is
found to decrease when divalent earth oxides like CaO,
MgO, BaO or PbO replace a part of the B 0 or SiO to form 2 3 2
ternary systems[7,12,14]. This results from the fact that

the larger modifier ions plug up the migration paths
through the lattice. By virtue of their larger size and
higher charge, these ions are not themselves so easily
mobile. The results of a systematic investigation of this
effect in Na20-RO-Si02 glasses containing 20 mol% Na20
and 20 mol% RO (where RO is divalent earth oxide)
indicate that the effectiveness of an oxide in increasing
the resistivity increases smoothly as the radius of the
divalent metal ion increases.
The alkali borate glasses are classified into two
groups based on the conductivity measurements. Group I
consists of alkali borate glasses containing potassium,
rubidium and cesium and Group I1 consists of glass
containing sodium and lithium. A linear increase in
conductivity was observed with the increase of alkali
oxide content from 8% to 25% for the glasses belonging to
Group I but for the glasses belonging to Group 11, the
linear increase of conductivity starts at a concentration
of 2 mol% of alkali oxide. As in the case of silicate
glasses, borate glasses containing potassium have lower
conductivity than sodium and lithium borate glasses.
Mazurin[l5] has reviewed conductivity studies in alkali
silicate, borate and alkali germanate glasses reported
till 1965.
Investigations on the dependence of conductivity on
composition in the case of binary silicate glasses have
been reported by different workers - Seddon et a1.[16] in
Na 0-SiO Kuznetsov and Meljnikova[l?] in Na 0-SiO K O- 2 2 ' 2 2 ' 2
Si02 and Kuznetsov[l8] in Li 0-SiO systems. The most 2 2
significant feature of Kuznetsor's result is the change of
slope which occurs at the composition of about 33 mol%.
This change becomes more pronounced when the temperature
is further increased. A similar result was observed in
sodium silicate also at 33 mol%, whereas in potassium
silicate the change in the slope was observed at about
22 mol%. This behaviour has been discussed by Stevels[l9]
and it is found that the composition 33 mol% of Ma20
corresponds to the point at which there is, on an average,
one non-bridging oxygen per silicon tetrahedron. Because
of this a significant structural change takes place which
is reflected in the resistivity-composition curve.
The dependence of activation energy on the chemical
composition of alkali silicate glasses R20-Si02 where
R = Na, K or Cs were studied by Hakim et a1.[201. The
activation energy values were found to be decreasing with
the increase of the alkali oxide content in the glass
system. It was also observed that the conductivity
increases with the increase of the concentration of alkali
content and temperature. The experimental results were

explained and discussed on the basis of the model proposed
by Anderson and Stuart with some slight modifications in
the assumption regarding the jump distance. They assumed
that the jump distance is the average interionic
separation in the glass, or it has a constant small value
varying only slightly with composition. The activation
energy calculated with this assumption was found to be in
good agreement with the experiments.
Temperature dependence of conductivity of R20-B 0 2 3
glass system (R-alkali metal) were studied by
Han et a1.[21]. and Matusita et a1.[22]. They found that
the conductivity follows the Arrhenius type equation.
Conductivity was found to increase with the increase in
the alkali concentration. The value of activation energy
of this glass system increased initially (upto 8 mol%) and
then decreased smoothly with further increase of the
alkali oxide. The latter behaviour was explained by the
model proposed by Anderson and Stuart.
Temperature dependence of conductivity of lithium
based borate, silicate and phosphate glasses have been
reported by several workers[14,23,25]. They observed that
conductivity increases with the increase in lithium
content in the glass system. The values of conductivity
-1 -1 at 550K are of the order of 10-~0hm cm and activation

energy values are of the order 0.6 eV and hence such
glasses are usually referred to as fast ionic conductors.
Konijnendijk[26] in 1975 investigated temperature
dependence of electrical conductivity of lithium, sodium
or potassiun borosilicate glasses. He observed a
dependence of activation energy and conductivity on the
concentration of the alkali oxide content. The
temperature dependence of conductivity was found to obey
the Arrhenius type equation and the value of activation
energy was found to obey with increase in the alkali
content.
Reports on electrical conductivity studies on sodium
borosilicate and lithium borosilicate glass system made by
Otto[27] also establishes the temperature dependence of
electrical conductivity. The conductivity was found to
obey the Arrhenius type equation6= exp (+/KT).
Otto[27] observed that conductivity increases with the
concentration of the alkali oxide content. For a given
mol% of the alkali oxide, the activation energy was found
to be decreasing linearly with increasing Si02 content.
Studies on d.c. conductivity of borate glass systems of
Na20-B 0 and PbO-B203 containing metallic granules were 2 3
reported by Chakraborthy et a1.[28] in 1980. The
conductivity measurements were made in the temperature
range 30 to 2 0 0 ~ ~ . They reported that conduction below
1 2 0 ~ ~ arises on account of electron tunneling between two
metallic particles, whereas at high temperatures, above
120°c the conduction is controlled by ionic transport.
Conductivity and activation energy measurements on
lithium containing borate glasses (Li20-B 0 ) had been 2 3
reported by Abu Sekkina[23]. In this study the activation
energy is found to remain constant upto about 12 molB of
Li 0 and beyond 12 mol% of Li20 the activation energy 2
falls down rapidly. Abu Sekkina[23] has explained the
results interms of "Boron anomaly" involving the
conversion of three coordinated borons with four
coordinated borons with the concentration of lithium
oxide upto about 12 rnol%. Further addition of Li20
to the glass system leads to reconversion of four
coordinated borons to three coordinated borons.
Anavekar et a1.[29] have reported the d.c. electrical
conductivity of B ~ ~ ~ - Z ~ O - N ~ 0 glass system as a function 2
of temperature. The results indicate that the activation
+ . energy of Na Ions is independent of ZnO concentration.
The activation energy values corresponding to high and low
temperatures are reported to be markedly different. The
results have been discussed on the basis of cluster model
of glasses[30].

Soppe et a1.[31] have reported ionic conductivity
studies in (B203) 1-x-y -(Li20)-(LiC1 glasses. 2 Y
They
observed that activation energy decreases with the
increase of Li20 content. They suggested that the
addition of LiC12 to the glass system probably does not
influence the glass structure, but its presence
drastically increase the ionic conductivity which cannot
be accounted for the increased number of charge carriers
only. They also observed that the activation energy
associated with the conductivity of ~ i + ions is reduced
by the pressure of ~ 1 - I ions.
Dependence of alkali oxide content on the d.c.
conductivity of Na 0-CaO-SiO glasses was studied by 2 2
Catchiny[32]. These studies were intended to establish
the correlation between the conductivity of glasses and
the structural units present in the glass. Martin[33]
reported the dependence of d.c. conductivity on the
concentration of Na 0 upto 6 mol% in B 0 -A1 0 -Na 0 glass 2 2 3 2 3 2
system. He observed a conductivity maximum and an
activation energy minimum for a particular concentration
A1 0 and CaO. Effect of addition of LiNbO on Of B2°3' 2 3 3
the conductivity of Li 0-B 0 glass system was reported by 2 2 3
Rokade et a1.[34] in the temperature range 400 to 714 K.
The maximum enhancement in conductivity is by two orders
of magnitude due to incorporation of 20 mol% LiNb03.

Experimental results were discussed on the basis of
concentration and mobility of ~ i + ions.
Sudhakar Rao et a1.[35] reported the d.c conductivity
and activation energy of Na 0 containing zinc phosphate 2
glasses over a temperature range 300-400 K. The electrical
properties of Li20-B 0 doped with 2 3 A1203 have been
reported by Kurek et a1.[36] in 1989. They observed an
increase in activation energy and a decrease in
conductivity with the doping of A1203. This behaviour may
be due to the change in the glass structure causing
changes not only in migration entropy but also in other
quantities determining 6,. They concluded that A1203
partially dissolved in the glass and caused high
activation energy and low conductivity.
Electrical conductivity studies on multicomponent
lithium fluoroborate glasses have been reported by
Bohem et a1.[37]. Below the normal glass transition
temperature, Bohem et a1.[37] have observed an isothermal
shift in the conductivity of the glass system. They also
noted a dependence of conductivity on the temperature of
annealing of the glass. The results were discussed on the
basis of the secondary relaxation process as in the case
of polymer glasses. The electrical conductivity of Li20-
BaO-Si02 and Na20-Mg0-5i02 glasses were measured at

temperatures ranging from room temperature to 4 5 0 ~ ~ by
Matusita et a1.[381. They also measured the transport
+ . numbers for Na Lon in the glass system. It was found
that the alkali ion plays a significant role in enhancing
the conductivity and the conductivity decreased markedly
as the alkali oxide was substituted by an alkaline earth
oxide.
Glasses containing A1 0 3, Ga203, Bi203 and Li20 have
been prepared and their conductivity measurements have
been reported by Glass et a1.[39]. They observed that
these glasses exhibit reasonably high ionic conductivity
and low electronic conductivity for Li20 concentrations
exceeding 50 mol%. The conductivity increases rapidly
with increasing Li20 concentration but does not differ
greatly from system to system despite the large difference
in the ionic radii of the trivalent cations, ~ l ~ + , Ga 3+
3 + and Bi . A simple model for this behaviour was also
discussed.
3.4. D.C conductivity studies on oxide glasses containing
transition-metal oxide - a review
Inorganic oxide glasses containing transition-metal
oxides like Fe203, V205, etc. are known to be electronic
semiconductors and the first report on semiconducting

properties of glasses appeared in the year 1954[40].
Since then most studies have been on systems based on
glasses of phosphates, although semiconducting oxide
glasses based on other glass formers like silicates,
borates, etc. were made. Early works on semiconducting
transition metal oxide containing inorganic oxide glasses
have been reviewed by Mackenzie[ll]. More recent
reviewers upto 1978 have treated semiconducting oxide
glasses as a part of the general problem of electrical
properties of non-crystalline materials or were concerned
with only the phosphates[45,46]. In 1982, Murawski[46]
reviewed the studies on the electrical properties of
silicate, borate, phosphate and telluride glasses
containing the transition-metal oxide, Fe20g.
Wong et a1.[47] have pointed out that iron in borate
and silicate glasses can be either tetrahedral or
octahedral coordinated. They have also observed that the
four-fold coordinated trivalent iron has significant
influence on the electrical conduction. Kuznetzove and
Teshomski[48] have suggested that in iron silicate
glasses, the electron transport is only through octahedral
3 + coordinated Fe . The Fe04 tetrahedra has atleast one
negative charge which hinders the approach of the
electron. The glass must contain a weakly bonded oxygen
atom to allow iron to acquire four-fold coordination. The
number of weakly bonded oxygen atoms increase with
decrease of the field of modifier ions. Magnetic
susceptibility and Mossbauer spectroscopy[49] studies have
shown that fraction of Fe ions at octohedral sites
increase with increase in the ionic potential of the
cation modifier. Therefore, the conductivity is found to
depend upon the type of the modifier atom present in the
glass.
Conductivity of CaO-B 0 -Fe203 glass system 2 3
containing varying concentrations of Fe 0 from 10 to 2 3
23 mol% have been studied over a temperature range from
200 to 700 K by Gawish and Saleh[50]. They observed that
conductivity increases and activation energy decreases
with the concentration of Fe 0 as well as with 2 3
temperature upto 20 mol% Fe203. In glasses containing
more than 20 mol% Fe 0 the conductivity showed large and 2 3'
rapid decrease. This abrupt change in the electrical
conductivity and activation energy has been attributed to
partially crystalline nature of glasses containing more
than 20 mol% of Fe203. Conductivity studies on iron oxide
containing barium borate[51] and calcium silicate[52]
glasses have been reported and the results are similar to
those of CaO-B203-Fe 0 glasses. Anderson and Mc Crone[53] 2 3
have reported studies on lead silicate glasses containing
Fe203. They suggested that the spatial positions of the

Fe ions are not random in the glass for which the Fe203
concentration is more than 10 mol%. Most of the Fe ions
are situated in some kind of clusters containing various
numbers of Fe ions. Charge transport takes place along
the chains of clusters and it is possible that in the case
of small amounts of Fe 0 direct current conductive paths 2 3'
do not connect all the clusters. In such a case, change
of conductivity with concentration of Fe ions should be
very high as has been observed in iron containing borate
and silicate glasses[4l].
The Mossbauer spectroscopic studies in iron
containing phosphate glasses[54,55,56] indicate octahedral
2+ . coordination for ~ e ~ + and Fe lons. The detailed study
of Taragin et a1.1571 confirmed the octahedral
coordination of Fe ions in phosphate glasses. Taragin et
al. have also found that Debye temperatures for Fe 2+ and
Fe 3+ are different. This fact indicates a difference in
the way the ions are incorporated in the glass structure.
Conductivity studies on V 0 -B 0 glass system have 2 5 2 3
been reported by Sharma et a1.[58]. They observed a high
temperature conduction phenomenon for this glass system
and concluded that this may be due to the adiabatic
hopping. They also observed that conductivity increases
with the V205 concentration.

Matusita et a1.[59], Yun et a1.[60] and Catching[61]
have reported the electrical conductivity of lead
silicate, lead phosphate and lead borate glasses
containing the transition-metal iron. These glasses
exhibit interesting results because lead is basically
amphoteric in nature and in these glasses lead is
considered as a part of the network. The investigators
have observed an appreciable increase in conductivity in
the borate glass system when the ratio PbO/B203 is
increased.
The electrical resistivity of iron containing lead
borate glasses was measured over a temperature range 300-
700 K by Ardelean[62]. He observed that resistivity
increases with the iron content and the resistivity is a
2 + function of Fe /Fetotal ratio. The glass samples with
Fe203 concentration greater than 15 molt show two
activation energies for conduction. This change in the
activation energy may be attributed to the charge transfer
between the iron ions in different positions at higher
temperatures. The experimental results on conductivity
was discussed on the basis of the polaronic hopping model.
In iron containing borate and silicate glasses, glass
formation regions are much narrower than in phosphate
systems, generally less than 20 mol% Fe203[63-651. The

maximum concentration of Fe203 depends on the kind of
network modifiers and on the melting conditions. The
structural study of iron-silicate and iron borate glasses
has showed that Fe ions are not randomly distributed and
some magnetic inhomogenities exist in these glasses. The
model of Anderson and Mc Crone1531 proposes that a great
majority of Fe ions are situated in relatively well-
ordered clusters containing various number of Fe ions.
Most of the Fe ions exist in pairs or groups of three and
are antiferromagnetically coupled within these groups.
within each structure the nearest neighbour inter-ion
distance and relative orientations are assumed to be very
similar to those in the crystalline oxides (Fe 0 2 3' Fe304'
FeO). The average cluster sizes depend on the iron
concentration and heat treatment.
Electrical studies on BaO-B203 glasses containing
Fe203, '2'5 or CuO have been reported by
Bandyopadhyaya et a1.[66]. They observed that electrical
resistivity and activation energy values decrease with the
increase of transition-metal oxide concentration. They
also observed that the values of resistivity and
activation energy of glasses containing mixed transition
metal oxides are less than that of glasses containing
single transition metal-oxide.

The electrical conductivity of iron containing barium
borate glass system have been studied as a function of
heat treatment and r-ray irradiation by Sanad et a1.[67].
Electrical conductivity of the untreated glass samples
increases with the increase of Fe203 upto 5 mol%, then
decreases at 7.5 mol% and then again increases with
increase in concentrations. They have concluded that this
behaviour may be due to the entrance of iron into the
glass network positions at low Fe 0 concentration and at 2 3
higher concentration it acts like a network modifier so
that the conduction is electronic and ionic. The ionic
behaviour may be due to the ~ a ~ + ions.
Sanad et a1.[67] have observed that the activation
energy increases with increase in the concentration of
Fe203. This behaviour is opposite to the general
observation that the activation energy decreases with the
increase in the concentration of the transition metal
oxide (Fe203) in glasses containing transition-metal
oxide. The peculiar behaviour of iron containing barium
borate glasses may be due to the change in coordination of
boron from B03 to B04 with increase in concentration of
Fe203. Sanad et a1.[67] observed partial crystallization
to occur in these glasses when the glass samples were heat
treated. The values for activation energy and resistivity
of the heat-treated samples were found to be less than
those of the untreated samples.
Bansal et a1.[681 have reported a detailed study of
electrical resistivity of barium borate glasses containing
the transition metal oxide, V205. They observed that
resistivity and activation energy values increase with the
concentration of BaO concentration whereas B2°3 has
negligible effect on the resistivity and activation energy
values. Temperature dependence of resistivity on V205-
BaO-K 0-ZnO glass system was reported by Kawamoto et 2
a1.[69] for various concentration of V 0 from 30 to 70 2 5
mol%. They observed that over the temperature range 300-
500 K, change in resistivity is linear and that the
magnitude of the resistivity is hardly affected by the
type of modifier oxide and its concentration. The values
of activation energy and the resistivity were found to be
markedly dependent on the redox ratio of vanadium and the
total vanadium present. They noticed that the presence of
modifiers in the glass system has very little influence on
the hopping process and have suggested that the changes in
the electrical properties may be due to the structural
changes of vanadium in these glasses.

PART I1
STUDY OF D.C. CONDUCTIVITY IN Ca0-B203-A1203-Na20
GLASS SYSTEM
3.5. Introduction
The glass system Ca0-B203-A1 0 usually known as 2 3
cabal glass is generally a poor conductor of electricity.
+ The incorporation of mobile carriers like Na in this
glass system will enhance the conductivity. The study of
the influence of ~ a + ions on the conductivity of the glass
system Ca0-B203-A1 0 -Na 0 was taken up in the present 2 3 2
2 + investigation. The divalent Ca ions and the trivalent
~1 3+ + ions present in the glass may block the Na ion in
its conduction process. Hence to make the present study
systematic and complete, the variation of the electrical
conductivity of the glasses with variation in the mole
percentage of Na20, A1203 and CaO have been investigated
in detail. The variation of conductivity of the glass
system has been studied systematically over a temperature
range from 300 to 523 K.

3.6. Experimental details
3.6.1. Glass composition
Three series of glass system CaO-B 0 -A1 0 -Na 0 with 2 3 2 3 2
the following general formulae were prepared for the
present studies:
Series (i) 10caO-(75-x)B 0 -15A1 0 -xNa20; 2 3 2 3
x = 15r18r21r24r27.
Series (ii) 10Ca0-(75-y)~~O~-yAl 0 -15Na20; 2 3
y = 5,10,15,20
Series (iii) zCaO-(70-z)B 0 -15Al 0 -15Na 0; 2 3 2 3 2
Five glass samples of the first series containing
varying concentrations of Na20 from 15 to 27 mole
percentage (mol?.) and constant concentration of A1203 and
CaO as listed in table 3.1 were prepared. Similarly the
other series of glass samples were prepared either with
varying concentration of CaO (5 to 20 mol%) and constant
concentrations of Na20 and A1203 (table 3.2) or with
varying the concentration of A1 0 (5 to 20 mol%) and with 2 3
constant concentrations of Na20 and CaO (table 3.3).

Table 3.1. Chemical composition of glass samples.
Composition (mol%) Sample No. ..........................................
CaO
Table 3.2. Chemical composition of glass samples.
Composition (mol % ) Sample No. .........................................
CaO B2°3 A1203 Na20
--
Table 3.3. Chemical composition of glass samples.
Composition (mol % ) Sample No. ..........................................
CaO B2°3 A1203 Na20

3.6.2. Preparation of glass samples
Reagent grade orthoboric acid (H3B03), aluminium
oxide (A1203), sodium carbonate (Na2C03) and calcium
carbonate (CaC03) were used for the preparation of the
glass samples. Appropriate mole percentages (table 3.1,
3.2 and 3.3) of these chemicals were mixed and thoroughly
ground in a mortar to get a homogeneous mixture. The
mixed charge was then taken in a crucible and was placed
in a horizontal muffle furnace. The temperature of the
muffle furnace was increased in steps of 50°c and the
mixture was sintered at about 673 K to eliminate water
from orthoboric acid and carbon dioxide from sodium
carbonate as well as from calcium carbonate. The
temperature of the muffle furnace was increased in steps
until the mixture melted at about 1223 K and the melt was
kept at that temperature for another two hours to ensure
its homogeneity. The melt was then quenched quickly by
the method of splat-quenching using the quenching device
mentioned in Section 2.2 of Chapter 2. Circular brass
discs of 2 mm thickness and having hole of diameter 15 mm
at the centre was used to get the glass samples of uniform
shape. The melt solidifies quickly producing a circular
disc of transparent glass sample. The samples were found
to be non-hygroscopic. Since, the cooling of the
homogeneous melt was a rapid one, internal stresses may
develop during solidification of the liquid phase to the
glassy phase. In order to avoid these internals
mechanical stresses, the glass samples prepared were
annealed at about 675 K, which is below the glass
transition temperature (Tg), for about four hours and were
cooled to room temperature gradually.
The amorphous nature of the prepared glass samples
was confirmed by X-ray diffraction. Figure 3.1 shows the
X-ray diffraction chart of a typical glass sample.
After annealing, both surfaces of the samples were
first polished with fine silicon carbide powder and then
with fine grade emery paper. Glass samples of thickness
about 1.5mm and diameter lmm with parallel plane surfaces
were thus obtained. In order to get a reliable data on
electrical conductivity, there must be good electrical
contacts between the electrodes and the experimental glass
sample. To achieve this, a thin circular film of silver
was vapour deposited on both sides of the sample by vacuum
deposition technique.


3.6.3. Measurement of d.c conductivity in CaO-B 0 -A1 0 - 2 3 2 3
Na 0 glass system 2
For the measurement of the direct current electrical
conductivity of the prepared glass samples, two-probe
method which follows the direct application of Ohm's law
was used. The experimental glass sample was introduced
between the two chromium-plated copper electrodes of the
stainless steel conductivity cell described in Section 2.3
of Chapter 2. Due to the conductive coating of silver on
the surfaces of the conductivity cell, good electrical
contact between the sample and the electrodes was
established.
The experimental glass sample could be heated to
different fixed temperatures by adjusting the current
through the heater coil of the conductivity cell. To
measure the resistance of the sample at any temperature, a
constant voltage of 50 V was applied across the sample
from the constant voltage source of a Keithley (model No.
617) electrometer. (The electric field was applied only
for a short duration of about a few seconds to avoid the
effects of polarisation). The resitance ( R ) of the sample
was measured using the Keithley electrometer in the V/I
mode as described in Section 2.3 of Chapter 2. The
resistivity ( P ) of the sample was calculated using the

formula p = RA/1, where A is the area of one of the
electrodes and 1 the thickness of the glass sample. The
c reciprocal of the resistivity gives the condu,tivity. The
conductivity of samples of different composition were
determined for different temperatures (which were
0 maintained constant within + 0.1 C) and are tabulated in - tables 3.4 to 3.6.
3.7. Results and discussion
The d.c electrical conductivity (table 3.4 to 3.6)
of three series, of quarternary glass system CaO-B 0 - 2 3
A1 0 -Na20 had been investigated systematically over a 2 3
temperature range from about 300 K to 525 K. The plots of
logarithm of conductivity (ln6) against reciprocal of
temperature (1000/T) for all glass samples were found to
be straightlines with positive slopes (figure 3.2 to 3.4)
satisfying the Arrhenius type equation:
b = bo exp ( -Ea/KT) ..... (3.1)
Where 6 , the d.c electrical conductivity, fGt the pre-
exponential factor, Ea, the activation energy for
conduction, k, the Boltzmann's constant and T, the
temperature.

Table 3.4 Variation of d.c. conductivity with temperature Of CaO-B 0 -A1 0 -Na 0 glass system for different $oicen$ratio?is of Na 0
2
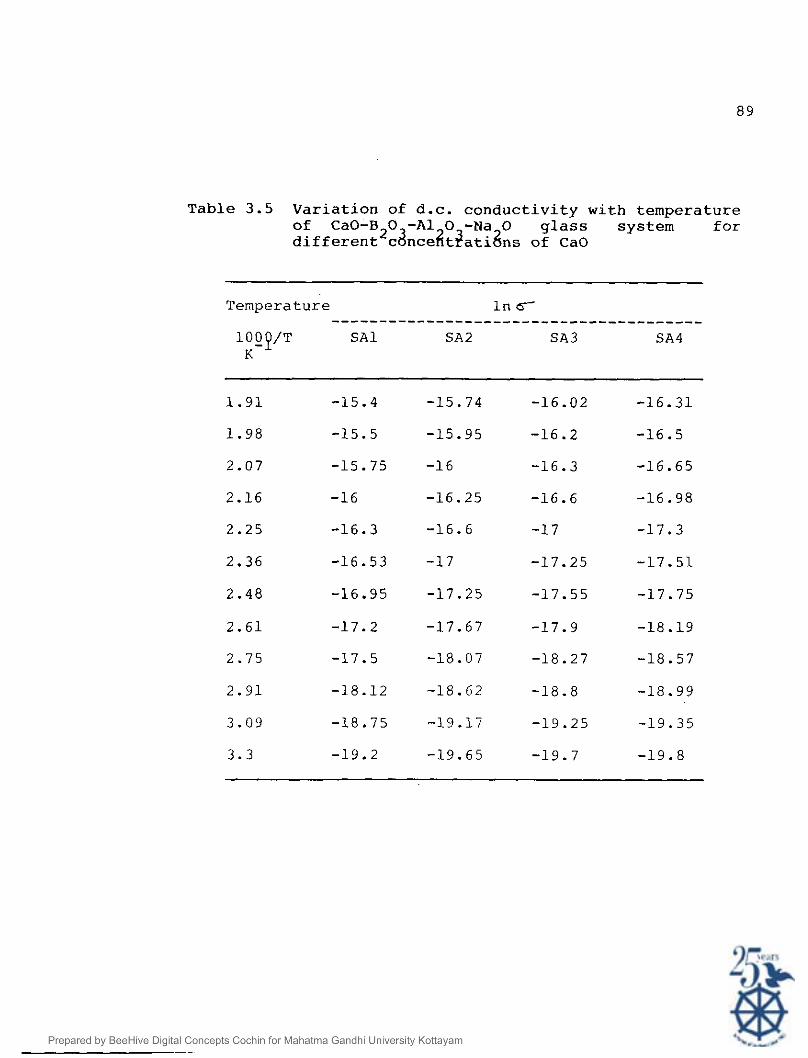
.e 3.5 Variation of d.c. conductivity w i t h temperature of CaO-B 0 - A 1 0 -Na 0 glass system for dif f erent2c&ce&t$ati6ns of CaO
Temperature l n C ....................................... 100P/T - S A l S A 2 S A 3 S A 4
K

Table 3 . 6 Variation of d.c. conductivity with temperature of CaO-B 0 - A 1 0 -Na 0 glass system for different2canceAt2ati8ns of A 1 0
2 3
Temperature l n 6

10001 T K ' Figure 3.2
V a r i a t i o n o f d . c c o n d u c t i v i t y w i t h t e m p e r a t u r e o f CaO-B 0 -A1 0 -Na 0 glass s y s t e m f o r d i f f e r e n t c6ni!ent?!a?iong of NaZO.

l O O O / T K-' Figure 3.3
Variation of d.c conductivity with temperature of CaO-B 0 - A 1 0 -Na 0 glass system for different cgnJent$a?iong of CaO.
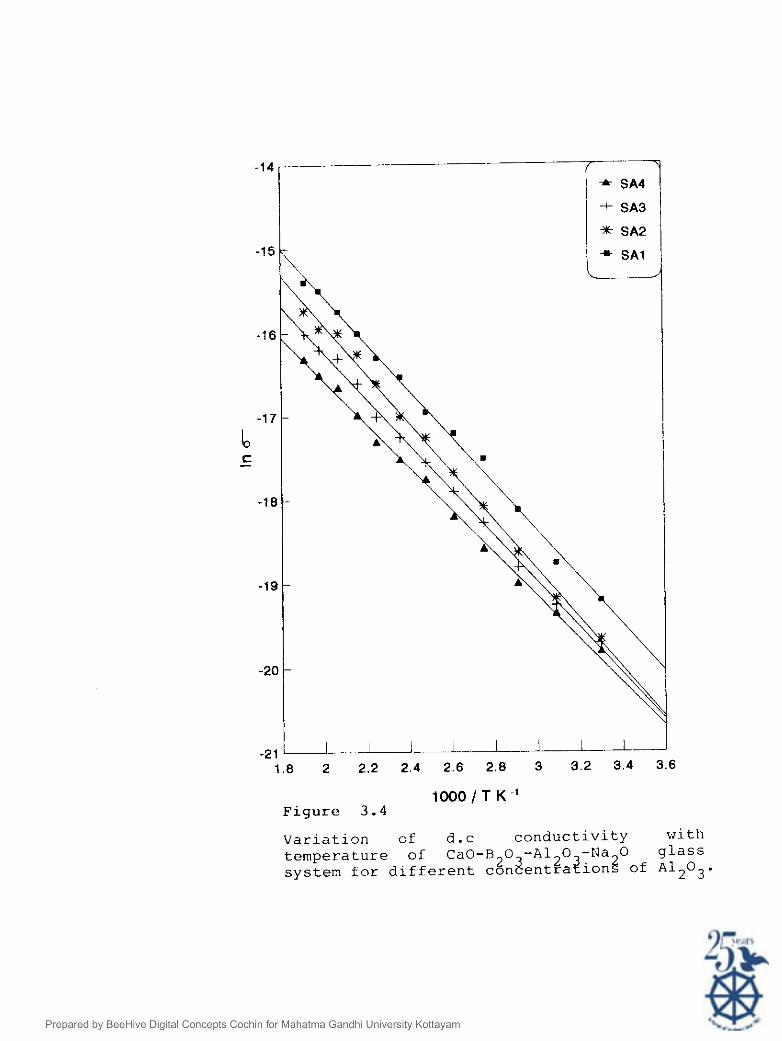
1000 /T K 1 Figure 3.4
Variation of d.c conductivity with
temperature of CaO-A 0 -A1 0 -Na 0 glass system for different cgn$ent?agiong of A l 2 O 3 .

From the experimental results given in table 3.4 to
3.6 and from figure 3.2, it is observed that d.c
conductivity of glass samples containing constant
concentration of A1203 and CaO increases with the
concentration of Na 0. It is also observed that the slope 2
of l n 6 Vs 1000/T graph decreases with the increase of the
concentration of Na20, showing a decrease in the
activation energy. It has been reported that in glases
containing mixed oxides (including an alkali oxide), the
alkali ions will be more mobile in an electric field
compared to other divalent and trivalent ions because of
the smaller ionic radius as well as the lower activation
energy for the alkali ions[10,18,29,70,71]. The alkali
ions ( ~ a + ions) are usually weakly bound to the oxygen
atoms and as the temperature is increased more ~ a + ions
will be rendered free to drift under the applied electric
field resulting in an enhanced conductivity. In addition,
at a given temperature, conductivity should increase with
increase in mole percentage of Na 0 and this also will 2
lead to an increase in the number of mobile charge
carriers. The experimental results are in good agreement
with reported results of variation of conductivity with
temperature and concentration of alkali oxides in similar
inorganic glass systems[18,21,22]. Since the
concentration of CaO and A1203 are kept constant in the
first series of glasses, the number of relatively immobile
Ca 2 + and ~ 1 ~ ' ions remains almost same in this series of
glass system. Therefore, their contribution in enhancing
the conductivity of the glass system should be negligible
and the observed increase in conductivity of the glass
system should be wholly due to the alkali ions ( ~ a + ions).
The present study shows that the insulator-like cabal
glass system (Ca0-B203-A1203) can be made conducting to a
+ reasonable extent by incorporating Na ions and the
increase in conductivity can be controlled by controlling
the concentration of Na 0 in the glass system. This point 2
is important in view of the fact that, inspite of the
ability of divalent and trivalent ions, in blocking the
+ + . movement of monovalent ions (Na ions), the Na Ions are
not completely blocked even by a large concentration of
CaO and A1203, and appreciable conductivity is observed in
the present system.
Activation energy values are calculataed from the
slope of i n 6 Vs 1000/T plot for each glass system i
containing varying concentration of Na20 (figure 3.2)
studied. As can be seen from the figure 3.5, activation
energy decreases with the increase of Na 0 concentration 2
for the first series of glass system. The observed
experimental results of activation energy can be discussed
with the Anderson and Stuart Model[9]. This model gives a
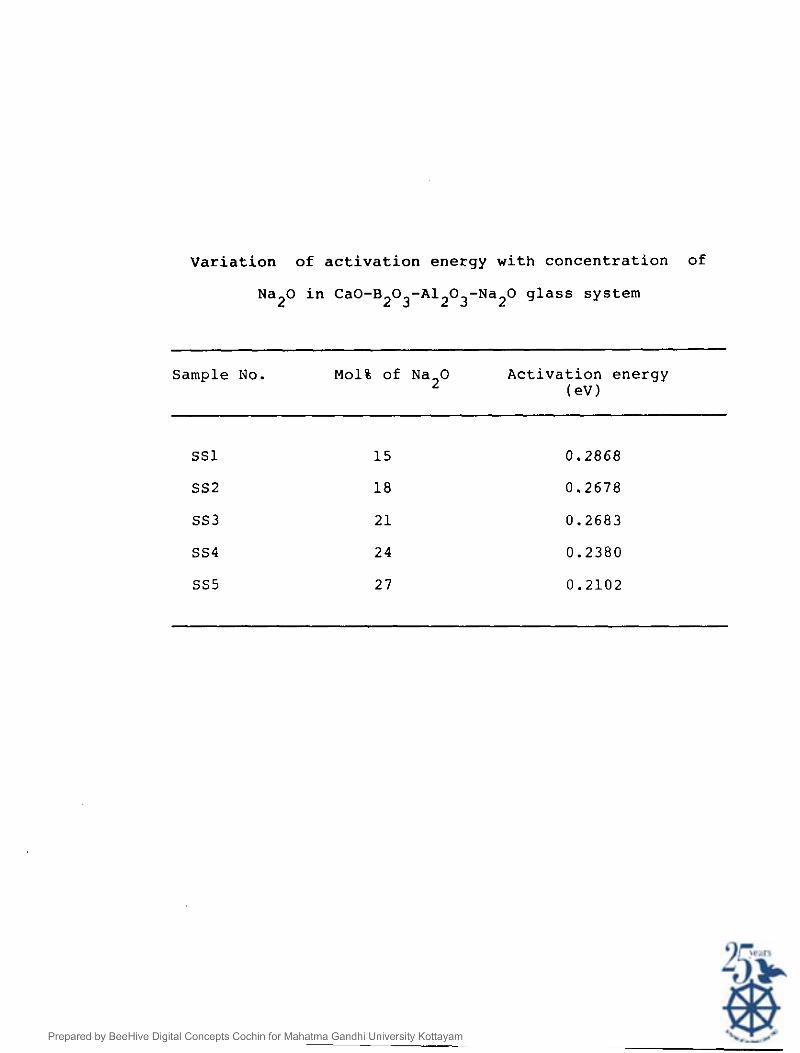
Variation of activation energy with concentration of
Na 0 in CaO-B 0 -A1 0 -Na 0 glass system 2 2 3 2 3 2
Sample No. Activation energy (eV)

! 1 0 . 1 8 ~ - i 1
12 15 18 2 1 24 27 30
Concentration of Na,O (mol %)
Figure 3 .5
Variation of activation energy with the concentration of Na20.

definition for activation energy as the sum of
electrostatic energy and strain energy needed to move the
alkali ions ( ~ a + ions in the present case) from one site
to another. When the alkali concentration is increased
the electrostatic energy decreases because of the decrease
in the alkali-alkali distance, whereas the strain energy
increases, and the three coordinated boron changes to a
four coordinated one as a result of which the network
becomes more compact. This leads to a decrease in
activation energy. Similar types of results (decrease in
activation energy with the increase of alkali oxide
concentration) has been observed in various glass
system[10,14,26,72].
Table 3.5 and figure 3.3 show the variation of d.c
electrical conductivity with temperature ranging from 300
to 525 K for samples of Ca0-B203-A1 0 -Na20 glass system 2 3
of the second series (table 3.2) containing varying
concentration of CaO and constant concentration Na 0 and 2
A1203. It is obvious from the figure 3.3 that the
conductivity increases with temperature. This is as
expected since the current carriers in this series of
glass system are also alkali ions ( ~ a + ions) and hence the
conductivity should obey the Arrhenius type equation
6 = Co exp (-Ea/k.T). It s also evident from the
figure 3.3 that the conductivity decreases when the

concentration of CaO is increased. Since the glass system
studied in the present work contains an alkali oxide
(Na20), the conductivity should be mainly due to the
+ . monovalent alkali ions (Na Ions). In this system, the
presence of alkaline earth divalent ions (ca2+ ions) block
the conduction path of the highly mobile ~ a + ions and the
C a 2 + ions apparently fit into the voids in the network.
2+ . The covalent character of the Ca lons causes the metal
ions to bond more strongly to the oxygen of the network
inhibiting mobility of these ions and resulting in a
decrease in the electrical conductivity. When the
concentration of CaO content in the glass system is
increased, the blocking action by the ca2+ ions will be
more pronounced and as a result conductivity should
decrease. Similar results have been reported for alkali
oxide glass containing alkaline-earth oxides[7,14,24].
Since the concentration of Na 0 and A1 0 remains constant 2 2 3
throughout this series of glass system (table 3.2), their
effect on the change in conductivity remains almost the
same.
Values of conductivity measured for the third series
(Table 3.3) of glass system containing varying
concentrations of A1203, and constant concentration of
Na20 and CaO over a temperature range 300-525 K are listed
in table 3.6. Figure 3.4 shows the variation of

In CT with 1000/T of the glass system of the third series.
The solid lines are the best fit lines which follow
Arrhenius type equation. As can be seen from the
figure 3.5, the conductivity increases as the temperature
is increased. Such a variation can be understood by
noting that alkali ions (~a' ions) are the main charge
carriers in this series of glass system. From
figure 3.4 it is also observed that the conductivity
decreases with the increase in the concentration of A1203.
The decrease in conductivity may be due to the blocking
action of ~1~'ions. According to Huang etcd . [72] the
conductivity of a glass system decreases when B203 is
replaced by A1203, which is explained as due to smaller
electronegativity. The decrease in conductivity of this
series of glass system may also be attributed to the
increased polarisation of ~ 1 ~ ' ions. (Polarization effet
3 + is more for ~ 1 ~ ' ions than for B ions). It appears to
be a universal law that the conductivity of glasses
containing the same alkali oxide content increases with
the increase of the electronegtivity and polarization of
cations taking part in the network of the glass
structure[73]. Since the concentration of CaO is kept
constant, the blocking action by Ca " ions is almost
invarient.

3.8. Conclusion
A systematic study of d.c electrical conductivity of
the Na20 containing cabal glass system had been studied
over a wide range of composition and for a temperature
range from 300 to 523 K. The conductivity of the glass
system had been found to depend on the concentrations of
Na20, CaO and A1203. The experimental results have been
discussed on the basis of the ionic conducting models and
other existing theories. It had been found that the
highly resistive cabal glass system can be made conducting
to a reasonable extent with the incorporation of the
alkali oxide, Na20.

PART I11
STUDY OF D.C CONDUCTIVITY IN Ca0-B203-A1203-Fe203
GLASS SYSTEM
3.9. Introduction
As mentioned in Section 3.5 of this Chapter, cabal
glass CaO-B 0 -A1203 has high electrical resistance and 2 3
the incorporation of charge carriers in it will enhance
its conductivity. The d.c conductivity of the glass
system CaO-B 0 -A1 0 -Na 0 has been systematically 2 3 2 3 2
studied and these studies have been described in Part I1
of this chapter. In this section the author discusses the
investigations on the d.c conductivity of Ca0-B203-A1203-
Fe203 glass system which may be consider to be the cabal
glass system containing Fe 0 a transition-metal oxide. 2 3'
The effects of concentration of Fe 0 2 3' A1203 and CaO and
temperature on the conductivity of the glass system were
studied in detail.
3.10. Experimental details
For the conductivity measurements, three series of
glass samples with following general formulae were
prepared.

Series ( i ) 20Ca0-(70-x) B 0 -10A1 0 -x Fe203; 2 3 2 3
x = 2, 4, 6 and 8.
Series (ii) yCa0-(85-x) B 0 -10Al 0 -5Fe203 2 3 2 3
y = 15, 18, 21 and 24.
Series (iii) 20Ca0-(75-x) B203-zAl 0 -5Fe 0 2 3 2 3
z = 3, 6, 9 and 12.
Four glass samples of the first series containing
varying concentration of Fe 0 and constant concentrations 2 3
of A1203 and CaO (Table 3.7) were prepared. Similarly,
the other two series of glass samples were prepared either
with varying concentration of CaO and constant
concentrations of Fe203 and A1203 (Table 3.8) or with
varying concentration of A1203 and constant concentrations
of Fe203 and CaO (Table 3.9).
chemically pure materials procured from BDH were used
to prepare the CaO-B 0 -A1 0 -Fe203 2 3 2 3 glass system.
Appropriate amounts of analar grade chemicals of
orthoboric acid (H BO 1, aluminium oxide (A1203), ferric 3 3
oxide (Fe203) and calcium carbonate (CaC03) were mixed and
melted in a horizontal muffle furnace at about 1450 K.
The melt was quenched to form glass samples of uniform
thickness and shape. The samples were annealed as
discussed in Section 3.6.2 of this Chapter. The amorphous

Table 3.7. Chemical composition of glass samples.
Composition (mol%) Sample No. ..........................................
CaO
Table 3.8. Chemical composition of glass samples.
Composition (mol % ) Sample No. .........................................
CaO B2°3 A1203 Fe20
Table 3.9. Chemical composition of glass samples.
Composition (mol % ) - Sample No. ..........................................
CaO B2°3 *l2'3 Fe20

nature of the glass samples were confirmed using X-ray
diffraction. The X-ray diffraction chart of a typical
glass sample is given in figure 3.6. Samples with diameter
about 10 mm and thickness about 1.5 mm were selected for
electrical conductivity measurements. Both the surfaces of
the glass samples were polished using fine silicon carbide
powder and with fine grade emery paper. Conducting
silver was vapour deposited on both the surfaces of the
glass samples to act as electrodes.
The resistance of all the glass samples were measured
over a temperature range from 300-525 K using Keithley
Model 715 electrometer in the V/I mode as described in
Part 11, Section 3.6.3 of this Chapter. Knowing the
thickness of the glass samples and area of the electrodes,
the d.c conductivity (6) was calculated at different
temperatures and the values are tabulated in tables 3.10
to 3.12.
3.11. Results and discussion
The d.c conductivity values of the first
series of glass samples (table 3.7) at different
temperatures are listed in tables 3.10. The schematic
representation of the variation of in 6 as a
function of 1000/T is as shown in the figure 3.7.
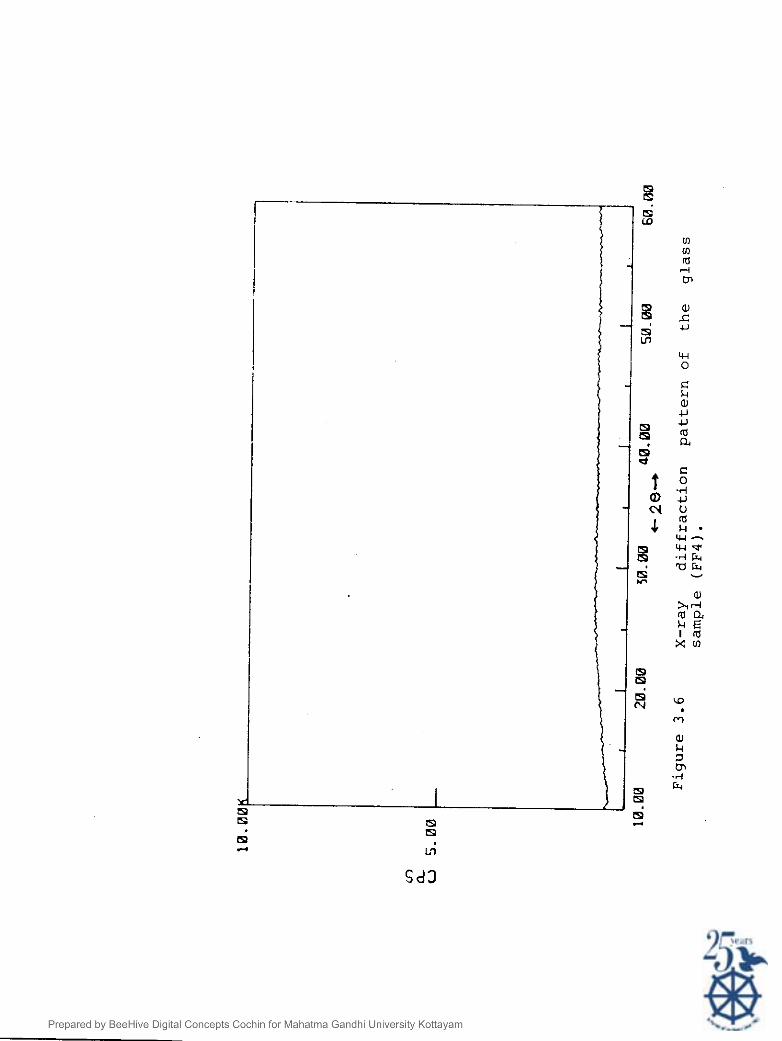

Table 3.10 Variation of d.c. conductivity with temperature of CaO-B 0 -A1 0 -Fe 0 glass system for different2cdnceAtSati6nG of Fe203
Temperature l n 6 ....................................... 10GP/T TF1 FF2 FF3 FF4 K

Table 3.11 Variation of d.c. conductivity with temperature of CaO-B 0 - A 1 0 -Fe 0 glass system for dif f erent2cance8t$ati8nz of CaO
Temperature In b ....................................... 100P/T FC1 FC 2 FC3 FC4 K
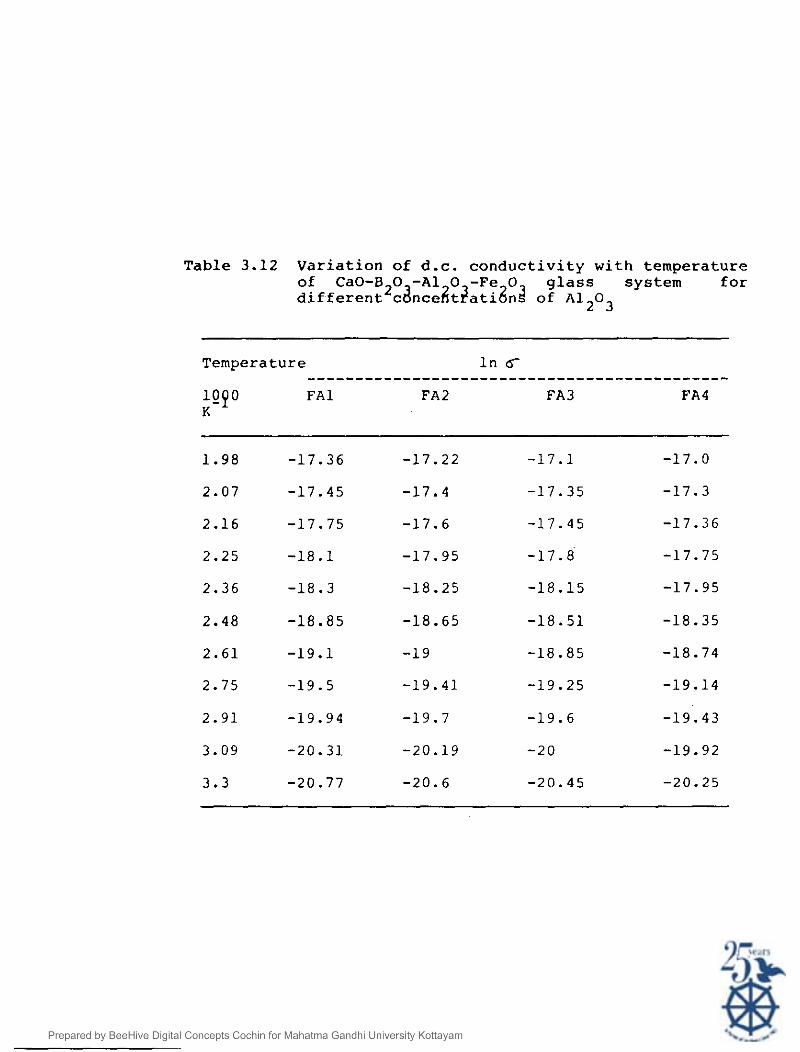
.e 3 . 1 2 V a r i a t i o n of d . c . c o n d u c t i v i t y w i t h t e m p e r a t u r e of CaO-B 0 -A1 0 -Fe 0 g lass s y s t e m for d i f f e r e n t 2 c d n c e i i t 2 a t i 2 n 2 of ~ 1 ~ 0 ~
Temperature I n 6 ............................................ li?p FA1 FA2 FA3 FA4 K
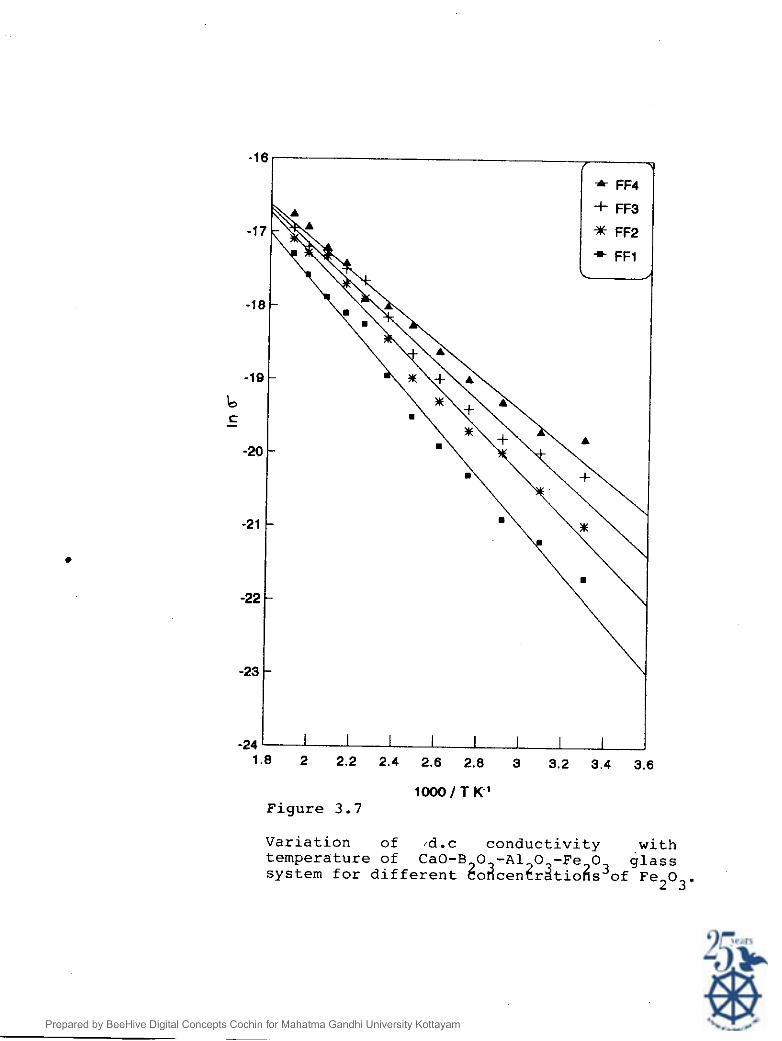
10001 T K-' Figure 3.7
Variation of 8d.c conductivity with temperature of CaO-B 0 - A 1 0 -Fe 0 glass system for different ?!odcen?r~tio~s30f Fe 0
2 3 '

1000/ T K' Figure 3 . 8
V a r i a t i o n o f d . c c o n d u c t i v i t y w i t h t e m p e r a t u r e o f CaO-B 0 - A 1 0 -Fe 0 g l a s s s y s t e m f o r d i f f e r e n t Zor4cen?rdt ioAs30f CaO.

F i g u r e 3 .9
V a r i a t i o n o f d . c c o n d u c t i v i t y w i t h t e m p e r a t u r e o f CaO-B 0 - A 1 0 -Fe O 3 g l a s s s y s t e m f o r d i f f e r e n t $oi?cen$ra t ioAs o f A 1 2 0 3 .

It can be observed from the table 3.10. and from figure
3.7 that conductivity of these glass samples increases
with temperature as a result of thermal agitation and show
that the glass system is a semiconducting one. It is also
observed that the conductivity increases with the
concentration of Fe 0 in the CaO-B 0 -A1 0 -Fe 0 2 3 2 3 2 3 2 3
glass
system. The basic conduction mechanism in glasses
containing a transition metal oxide (Fe203) consists of
the transfer of charges from one valence state to the next
valence state of the transition metal ion. In otherwords
conduction is due to a transfer of electron between the
two neighbouring metal ions of different valency. These
localised states, seperated from the conduction band by an
average energy, will be distributed over a range of
barriers because of the randomly fluctuating field of the
disordered structure[50,67]. In the present case
conduction occurs due to an electron hopping directly
2 + between the occupied (Fe ) and unoccupied ( ~ e ~ + ) ion
sites. This process is shown schematically as:
2 + The hopping of electrons from the Fe to Fe 3 + state is
apparently not impeded by the relatively large separation
of these ions, nor by the presence of oxygen around them.
When the concentration of Fe203 content in the CaO-B 0 - 2 3
A1 0 -Fe203 glass system increases, the number of hopping 2 3

of carriers between the different valence states also
increases and hence the conductivity increases. Since the
glass system contain CaO and A1 0 the divalent Ca 2 3' 2+ and
trivalent ~ 1 ~ ' ions also have their small ionic
contribution to the conductivity. But their contribution
to the conductivity is almost constant in all glass
samples of series (i) since their concentration is kept
constant. The experimental results obtained for the d.c
conductivity and their variation with temperature and
concentration of Fe 0 do agree with the results reported 2 3
by several investigators on borate, phosphate and
germanate glass systems containing iron oxide[49,70,73].
The experimental values obtained for conductivity,
at different temperatures for the glass samples belonging
to series(ii1 and series(iii) (table 3.8 and 3.9
respectively) are listed in table 3.11 and 3.12. The
graphical representations of the variation of i * ~ with
temperature are shown in the figure 3.8 and 3.9. As it
is seen from the figures 3.8 and 3.9, conductivity
increases with temperature and with the concentration of
CaO and A1 0 2 3'
Eventhough the mobility of Ca 2+ ions is
+ . less compared with the mobility of the Na Ions, in the
2 + absence of alkali ions the divalent alkaline earth (Ca )
ions act as modifier ions which help to increase the
conductivity. Therefore, in this system of glass

conduction occurs as a total effect of ionic and
electronic motion. When the concentration of CaO is
2 + increased, the number of Ca ions taking part in the
conduction will also be more which results in an enhanced
conductivity. Since the concentration of Fe 0 and A1203 2 3
were kept constant throughout this series of glass system,
their contribution in the enhancement of conductivity
remain almost same. From figure 3.9 it is obvious that
the conductivity increases with the concentration of
A1203. The increase of conductivity with the A1203
concentration may be attributed to the increasing number
of non-bridging oxygens.
3.12. Conclusion
The d.c conductivity of the quarternary glass system
CaO-B 0 -A1 0 -Fe 0 had been studied over a temperature 2 3 2 3 2 3
range 300 to 523 K. The conductivity had been found to
depend on the concentrations of Fe 0 CaO and A1203 and 2 3'
the temperature. The experimental results have been
discussed on the basis of the existing theories. It had
been found that the highly resistive ternary glass system,
Ca0-B203-A1203 can be made conducting to an appreciable
extent by the addition of the transition-metal oxide,
FeZ03.

References
1. Ingram M.D. and Vincent C.A., Chem. Soc. Ann. Repts. A23 (1977).
2. Ravaine D., J. Non-Cryst. Solids 38, 353 (1980).
3. Tuller H.L., Button D.P. and Uhlmann D.R., J. Non- Cryst. Solids 40, 93 (1980).
4. Ingram M.D., Phys. Chem. Glasses 28, 215 (1987).
5. Oven A.E., J. Non-Cryst. Solids 35, 999 (1980).
6. Hughes K. and Isard J.O., In "physics of Electrolytes", Vol.1, 355, ed. Hladik J., Academic Press, London (1972).
7. Morey G.W., "The Properties of Glasses", 2nd Edn., Reinhold, N.Y. (1954).
8. Doremus R.H., "Introduction to Glass Science", Academic Press, N.Y. (1975).
9. Anderson 0.L and Stuart D.A., J. Am. Ceram. Soc. 37, 573 (1954).
10. Hakim R.H. and Uhlmann D.R., Phys. Chem. Glasses 12, 132 (1971).
11. Rasch E. and Hinrichsen F., Z. Electrochem, 14, 41 (1908).
12. Owen A.E., "Progress in Ceramic Sciences", Vo1.3, p.77, Ed. J. Burke, Perqamon Press, N.Y. (1963).
13. Hench L.L. and Schaake H.F., "Introduction to Glass Science", p.583, Eds. Stevans H.J. and La Course W.C., Academic Press, N.Y. (1972).
14. Mazurin O.V., "Electrical Properties of Glasses", Consultant Bureau, N.Y. (1965).
15. Mazurin O.V. and Brailovski R.V., Sov. Phys. Solid State, 2, 243 (1960).
16. Seddon E., Tippet E. and Turner W.E.S., J. Soc. Glass. Tech. 16, 450 T (1932).
17. Kuznetsov A.Ya and Meljnikova I.G., Zhur. Fiz. Khim. 24, 1204 (1950).

Kuznetsov A.Ya., Zhur. Fiz. Khim., 33, 1492 (1959).
Stevels J.M., "Electrical Properties of Glasses", Handbuch der physik, V.20, P.350, Spinger Verlag (1957).
Hakim R.H. and Uhlrnann D.R., Phys. Chem. Glasses 12, 132 (1971).
Han Y.H., Kreidle N.J. and Day D.E., J. Non-Cryst. Solids 30, 241 (1979).
Matusita, Ito M., Kamiya. K and Sakka. S., Yogo- Kyokai-Shi, 10, 496 (1976).
Abu Sekkina M.M., Megahed A.A and Gohar I.A., Glass Ceram. Bull. 31, 28 (1984).
Mazurin O.V. and Lev. E. Ya., Izv. Vuzov. Fiz. 3, 43 (1960).
Smedly S.I. and Angel1 C.A., Solid State Ionics, 7, 21 (1978).
Konijnedijk O., Phylips Res. Repts. Suppl. 1, 182 (1975).
Otto K and ~ilberg M.E., J. Am. Ceram. Soc. 51, 326 (1968).
Chakraborthy D and Chakraborthy. S., J. Non-Cryst. Solids 38, 295 (1980).
Anavekar R.V., Devaraj N. and Ramakrishna J., J. Mater. Sci. Bull. 31, 28 (1984).
Rao K.J and Rao C.N.R., Mater. Res. Bull-17, 1337 (1982).
Soppe Jr. W., Aldenkamp F and Hatagon H.W., J. Non- Cryst. Solids 1, 351 (1987).
Catching O.O., J. Appl. Phys. 52, 116 (1981).
Martin S.W., Solid St. Ion. 18, 472 (1986).
Rokade S., Singh K. and Deshpande V.K., Solid St. Ion. 18, 374 (1986).
Sudhakar Rao D., Kavt P.P. and Parvathi B., J. Mat. Sci. Lett. 9, 748 (1990).

Kurek P., Nourinski J.L. and Jakbowski W., Solid St. Ion. 36, 246 (1989).
Bohem L. and Angel1 C.A., Mater. Res. Bull. 15, 421 (1980).
Matusita K., Takayamas and Sakkas, J. Non-Cryst. Solids 40, 149 (1980).
Glass A.M., J. Appl. Phys. 51, 3756 (1980).
Denton E.P., Rawson H. and Stanworth J.E., 173, 1030 (1954).
Mackcenzie, In: "Modern Aspects of Vitreous State", Vo1.3., ed. Mackenzie J.D., Butterworths, London p.126 (1964).
Owen A. E., Contemp. Phys. 11, 257 (1970).
Owen A.E., J. Non-Cryst. Solids 25, 370 (1977).
Sayer M. and Mansingh A. , Phys. Rev. B6, 4629 (1972).
Kinser D.L. and Wilson L.K., In : "Recent Advances in Science and Technology of Materials, ed. A. Bishay, Plenum Press, New York, 77 (1974).
Murawski, J. Mater. Sci. 17, 2155 (1982).
Wong C. and Angell C.A., "Glass by Spectroscopy", Marcel1 Dekker, N.Y. (1975).
Kuznetsov A.Ya. and Tsekhomskii V.A., "Electrical properties and Structure on Glasses" Vo1.4, p.136 Consultant Bureau, N.Y. (1965).
Firzov V.M., Petrovykh N.V. and Litwinov P.I., Proceedings of the 10th International Congress on Glass, Kyoto (1974).
Gawish M. and Salesh M.N., J. Appl. Phys. 47. 5349 (1976).
Bandyopadhyay A.K. and Isard J.O., Proceeding of the 7th International Conference on Amorphous and Liquid Semiconductors, 683 (1977).
Zertsalova J.N., "Electrical Properties and Structure of Glass", Vo1.4, p.141, Consultant Bureau, N.Y. (1965).

Anderson R.A. and Mc Crone R.K., J. Non-Cryst. Solids 14, 112 (1974).
Karikijian C.R. and Sigety, Phys. Chem. Glasses, 9, 73 (1968).
Sawicki J.B., Sawicka and Gzowski, Phys. Stat. Solidi. A41, 173 (1977).
Vaugham J.G., Wilson L.K. and Kinser D.L., Bull. Amer. Ceram. Soc. 52, 384 (1977).
Taragin M.F., Eisensteni J.C. and Meller W., Ibid., 13, 29 (1972).
Sharma B.K., Dube D.C. and Mansingh A., J. Non- Cryst. Solids 65, 39 (1984).
Matusita K., Ito M., Kamiya K. and Sakka S., Yogo- Kyokai-Shii, 10, 496 (1976).
Yun Y.H. and Bray P.J., J. Non-Cryst. Solids 27, 363 (1978).
Catching O.O., J. Appl. Phys. 52, 116 (1981).
Ardelean I., Solid St. Commn. 27, 697 (1978).
Hiroshima H. and Yoshida T., Proceedings of 11th International Congress on Glass, Pragne, 11, 365 (1977).
Firsov V.M., Petrovykh N.V. and Litwinov P.I., proceedings of the 10th International Congress on Glass, Kyoto, Ceram Soc. of Japan, 7, 73 (1974).
Gdula K.A. and Tompkins, Glass Technol. 11, 164 (1970).
Bandyopadhyaya A.K. and Isand J.O., J. Phys. D 10, L99 (1977).
Sanad A.M., Kashif I., Abou Al-Azma M., Khaled M.A. and Farouk H., J. Mater. Sci. 21, 230 (1986).
Bansal T.K. and Mendiradatta R.G., Phys. Chem. Glasses 28, 242 (1987).
Kawamoto Y., Fukuzuka M., Ohta Y. and Imai M., Phys. Chem. Glasses 20, 54 (1979).

70. S e d d o n T i p p e t E. a n d T u r n e r W.E.S., J. S o c . G l a s s Tech . 1 6 , 450 T ( 1 9 3 2 ) .
71. M a c k e n z i e J . D . , J . Am. Ceram. S o c . 47 , 2 1 ( 1 9 6 4 ) .
72. O t t o K . , P h y s . Chem. Glasses 7 , 29 ( 1 9 6 6 ) .
73 . Huang P.N. a n d Huang X.H. , S o l i d S t . I o n i c . 3 6 t 59 ( 1 9 8 9 ) .
74 . Kennedy T.N. a n d M a c k e n z i c J . D . , P h y s . Chem. Glasses 8 , 1 6 9 ( 1 9 6 7 ) .

CHAPTER 4
DIELECTRIC CONSTANT AND kc. CONDUCTIVITY STUDIES ON
Ca0-B20341203-Na20 AND CaO-B20+i1203-Fe203 GLASS SYSTEMS
CHAPTER 4
DIELECTRIC CONSTANT AND A.C CONDUCTIVITY STUDIES ON
CaO-B 0 -A1 0 -Na 0 AND CaO-B 0 -A1 0 -Fe 0 2 3 2 3 2 2 3 2 3 2 3
GLASS SYSTEMS
4.1. Introduction
Dielectric characteristics of glasses are of
increasing importance as the field of solid state
electronics continues to expand rapidly. The principal
applications of glassy dielectrics are as capacitance
elements in electronic circuits and as electrical
insulators. For these applications the properties of most
concern are the dielectric constant, dielectric loss
factor, and the dielectric strength. New devices and new
applications are continually increasing the frequency
range and the range of environmental conditions,
particularly temperature, that are of practical interest.
Numerous publications have been devoted to the study
of dielectric constant, a.c. conductivity and other
properties in the alternating fields in alkali oxide
containing oxide glasses[l-31, transition metal oxide

containing semiconducting glasses[4-71 and in a wide range
of superionic glasses[8-111. The study of dielectric
properties of glasses has attracted a great deal of
attention because of their promising utility in various
fields of interest to human beings. Due to their
application in solid high energy density batteries[l2,13]
and in some electrochemical devices[l4,15], the superionic
conducting glasses are extensively studied. The
frequency dependent conductivity and dielectric constant
provides important information on the ionic or electronic
transport mechanism in disordered materials. It can give
an insight into the structure of the materials since the
localised electronic states within the material are
created due to the presence of disorder in the atomic
configuration and/or the composition.
This chapter is divided into three parts. Part I
gives a brief review of the dielectric constant and a.c
conductivity studies in alkali oxide containing and
transition metal oxide containing oxide glasses. Part I1
gives a detailed account of the present studies conducted
by the author on the dielectric constant and a.c
conductivity of the quarternary glass system CaO-B 0 - 2 3
A1 0 -Na20. Part 111 is a detailed description of the 2 3
study of dielectric constant and a.c conductivity of the
quarternary glass system CaO-B 0 -A1203-Fe203. 2 3
PART I
REVIEW OF DIELECTRIC CONSTANT AND A.C CONDUCTIVITY STUDIES
ON OXIDE GLASSES CONTAINING ALKALI/TRANSITION METAL OXIDE
4.2. Review
A brief report of the dielectric constant, dielectric
loss and a.c. conductivity studies on inorganic oxide
glasses containing alkali oxide or transition metal oxide
is given in this section.
Study of a.c conductivity of several systems of
chalcogenide glasses and oxide glasses containing
transition metal oxide[5-81 have been reported. But
comparatively less work have been reported on inorganic
glasses containing alkali oxide. Bottger et a1.[9]
has reviewed the work up to 1976 on the hopping
conductivity in ordered and disordered solids.
It is observed that the dielectric constant,
dielectric loss, a.c electrical conductivity etc. always
depend on the frequency of the alternating field and the
temperature of the substance. In inorganic glasses
containing alkali oxide, the conduction and the dielectric
relaxation take place as a result of the local motion of
the trapped alkali ions around the non-bridging
oxygens[l0,ll]. However recent experimental and
theoretical advances[l2-151 suggested that the frequency
dependence of conductivity could also be due to the jump
diffusion of mobile ions as in the case of d.c
conductivity.
It is now well accepted that the general condition
for semiconducting behaviour in transition-metal oxide
glasses is that the transition-metal ion should be
capable of existing in more than one valence state, so
that the conduction can take place by the transfer of
electrons from low valence state to high valence state.
Possible oxides include those of Ti, V, Cr, Mn, Fe, Co,
Ni, Cu, Mo and W. The properties of these oxides are
much less fully understood than those of the classical
semiconductors such as silicon and germanium. The
vanadium system has been studied most thoroughly[l6-181
among the above said oxides.
It is not yet clear whether the electrical properties
are best described by an energy-band scheme as indicated
by Morin[l91 for some oxides or by hopping between
localized states as explained by Mott[ZO], and Austin and
Mott[21].

A review of the dielectric properties of glasses
investigated upto 1964 has been given by Mackenzie(221.
Reviews on the conduction processes are made by Mott[ZO],
Austin and Mott[21] and Owen[23]. The investigations on
the dielectric conductivity mechanism in ordered and
disordered solids were reviewed by Bottger et a1.[91 in
1976.
The frequency and temperature dependence of
conductivity, dielectric properties, infrared absorption
and EPR studies of semiconducting phosphate glasses were
reported by Sayer et a1.[8]. The examination of
conduction process in semiconducting phosphate glasses
suggests that a polaron model is applicable with some
evidence that hopping occurs in the adiabatic regime. It
was also found that the polaron interactions have to be
considered[81. Sayer et al. measured the a.c conductivity
and dielectric constant over a frequency range 0.1 -
100 KHz and a temperature range from 77 to 400 K and
observed that the conductivity increased with
temperature. These results were similar to the results
published in the case o f othersemiconducting
glasses[6,24]. At low temperature the frequency
dependence of the a.c conductivity was shown to be of the
f orm GaC O( as where S is about 0.85. This type of
behaviour is well-known in amorphous systems and has been
attributed to the relaxation times arising from local
order[6,24].
The frequency dependence of electrical conductivity
of semiconducting phosphate glasses containing tungsten
were studied by Mansingh et al.[25]. They observed that
the measured a.c conductivity depends strongly on the
frequency according to the relation c C w ] = A OS
where 0 < s < 1. The weak frequency dependence is due to
the contribution of d.c conductivity to the measured a.c
conductivity. Mansingh et a1.[25] also reported that the
conductivity increases with the concentration of the
tungsten oxide content.
a.c conductivity of binary V 0 -P 0 2 5 2 5 glasses
containing 40, 50, 50 and 70 mol% V205 was measured at
temperatures between 100 and 423 K and for frequencies up
to 100 MHz by Murawski et a1.[26]. The results were
interpreted in terms of the Long's polaron hopping model.
The polaron parameters calculated from the above model are
in good agreement with the values obtained by other
means[8].
Bogomolova et a1.[271 reported the a.c and d.c
electrical conductivity studies of some semiconducting
barium vanadate glasses doped with Fe 0 2 3'

The a.c electrical resistivity, dielectric constant,
and dielectric loss of calcium borate glass system
containing the transition-metal oxide (Fe203) was
investigated by Saleh et a1.[28] in order to determine the
conduction models of the system. Saleh et a1.[28]
prepared the glass system containing different iron
concentration of molar composition (70-x)B 0 -30CaO-xFe 0 2 3 2 3
with x upto 32 mol%. The electronic properties are
measured from 77 to 8 0 0 ~ ~ in the frequency range 20 Hz to
100 KHz. They observed that the glasses with Fe203
content less than 20 mol% were amorphous, while those
containing from 20 to 23 mol% were devitrified. It was
also observed that increasing the iron oxide content in
this glass system caused an increase in the d.c
conductivity, the a.c conductivity, the dielectric
constant, and the frequency of the dielectric loss peak.
Thermoelectric power measurements of the glass system
indicated that all glasses studied were n-type. The
experimental results of Saleh et a1.[28] on a.c and d.c
conductivity and its variation with frequency and
temperature support the idea of a hopping conduction
mechanism, for glasses less than 20 mol% Fe203 and a
diffusive conduction mechanism for calcium borate glasses
having Fe203 greater than 20 mo18.

Duran et a1.[29] reported some electrical properties
of phosphate glasses containing alkaline-earth oxide doped
with CuO. They observed a frequency and temperature
dependence on the dielectric constant, loss tangent and
a.c conductivity of the glass system. These properties
are also dependent on the concentration of CuO and hence
+ on the redox ratio Cu /Cutotal.
In 1987, Hassan et a1.[30] reported the a.c
conductivity, (cc), of copper phosphate semiconducting
glasses with different composition. They measured the
dielectric constant, a.c conductivity etc. in the
frequency range from lo2 to lo7 Hz and over the
temperature range from 300 to 513 K. Hassan et a1.[30]
observed a frequency and temperature dependence of
dielectric constant and a.c conductivity of this glass
system. The observed frequency dependence of conductivity
was expressed as G - C ~ ) ~ S where 0.7 < s < 1 up to 1 MHz.
At frequencies above 1 MHz the conductivity obeys an
equation of the form 6 ~ ~ ) d w S where s > 1. The
increase in conductivity at higher frequencies was
explained as follows: As the frequency increases the hops
will become shorter and shorter and in the limit of
interatomic distances, will no longer be randomly
distributed and will settle to a frequency dependence
2 which tends t o w [30].
Electrical conductivity studies (both d.c and a.c) on
semiconducting glasses of presodimium and calcium
containing copper phosphate glasses were reported by
Mohammed et a1.[311.
These glasses exhibit frequency dependence of a.c
conductivity and the main feature of a.c measurements was
that the observed frequency dependence in the measured
range could be expressed as 6 - - Gtotal -6d.c
= A@'. ac
The same type of behaviour was reported by Lynch and
Sayer[32] for vanadium phosphate glasses.
Dielectric properties and internal friction of
borate glass system containing mixed alkali was
investigated by Th. Van Gemert et a1.1331. They observed
that the dielectric properties of mixed alkali borate
glasses are completely analogous to the dielectric
properties of silicate and phosphate glasses. They also
reported a strong linear dependence of the dielectric
properties of the glass system on the concentration of
alkali oxide.
The electric and dielectric properties of ternary
inorganic glass containing alkali oxide (Na20-Mg0-Si02)
were studied by Abelard et a1.[34] over a frequency range

from 1 Hz to 100 K Hz and a temperature range from 350 - 600 K using the impedance spectroscopy. Similar types of
works on dielectric properties were also reported
earlier[35-371. Abelard et a1.[34] observed, a dependence
of dielectric relaxation on the concentration of the
+ . alkali ion (Na Ion). It has been proved that dispersion
+ arises from the motion of alkali (Na ) ions. Experimental
data were interpreted with the help of Continuous Time
Random Walk (CTRW), formalism developed by Sher and Lax
which assumes that all the alkali ions are mobile but with
different mobilities[34].
Kawamura et a1.[381 in 1987 reported some
measurements on a.c conductivity of borate glasses
containing mixed alkali oxides. The complex a.c
conductivity was measured in the range from 5 Hz to
500 KHz and for wide range of temperature. They observed
an increase in the conductivity with the frequency as well
as with temperature. Kawamura et a1.[38] concluded that
frequency dependence of a.c conductivity at lower
frequency region is due to the interfacial impedance or
space-charge polarisation[l2,39]. They also suggested
that the frequency dependence of conductivity in alkali
containing oxide glasses is a kind of dielectric
relaxation and may be due to the local motion of the
trapped alkali ions around the non-bridging oxygens.

Studies on the dielectric constant and conductivity
relaxation of Li20-B203-WO glasses weLr reported by 3
Huang et a1.1401. In ion containing glasses, the
dielectric properties mainly arise from the motion of
ions. The free energy barriers impeding the ionic
diffusion, however, can be expected to vary from site to
site, and hence there may be different ionic motions in
glasses. The first is the rotation of ions around their
negative sites. The second is the short-distance
transport, i.e., ions hop out of sites with low free-
energy barriers and tend to pile up at sites with high
free-energy barriers in the electric field direction in
d.c or low frequency electric field or oscillate between
the sites with high frequency barriers in an a.c electric
field. Huang et a1.[40] have indicated that both the first
and second motions make a contribution to the dielectric
constant of glasses.
The effect of sodium and molybdenum phosphate glasses
have been studied by d.c and a.c conductivity measurements
over a wide temperature range by Tarsikka et a1.[41] in
1990. The observed experimental results indicate that the
electronic contribution to d.c conductivity increases with
molybdenum concentration. It is difficult to seperate the
ionic conduction from electronic conduction. a.c

conductivity measurements reported by them showed a
dependence of a.c conductivity on frequency of the applied
electric field and the conductivity was found to obey the
relation caC = A a S , where s is a parameter. The value
of s evaluated from the relation c
= A m S is
comparable to those evaluated from the hopping over
barrier model[30]. The dielectric relaxation frequency
for these glasses has been observed to be 1.5 KHz in the
temperature range of 100-200 K.

PART I1
STUDY OF DIELECTRIC CONSTANT AND A.C CONDUCTIVITY IN
Ca0-B203-A1203-Na20 GLASS SYSTEM
4.3. Introduction
In this part the author reports a detailed study of
the dielectric constant and a.c conductivity in
quarternary glass system CaO-B 0 -A1203-Na20. 2 3 The
dependence of a.c conductivity and dielectric constant on
the concentrations of Na20, CaO and A1 0 and temperature 2 3
tias studied systematically.
4.4. Experimental Details
4.4.1. Glass composition and measurement of dielectric
constant and a.c conductivity
Three series of the glass system Ca0-B203-A1203-Na20
containing different concentrations of Na 0 , CaO and A1203 2
and of compositions as given below were prepared for the
present investigation:
Series (i) 10 CaO - 60 B203 - 15 A1203 - 15 Na20 ..SSl
10 CaO - 51 B203 - 15 A1203 - 24 Na20 ..SS4
Series (ii) 5 CaO - 65 B203 - 15 A1203 - 15 Na20 ..SCl
20 CaO - 50 B203 - 15 A1203 - 15 Na20 ..SC4
Series (iii) 10 CaO - 70 B203 - 5 A1203 - 15 Na20 ..SAl
10 CaO - 55 B203 - 20 AI2O3 - 15 Na20 ..SA4
Reagent grade chemicals (99% purity or better)
acquired from BDH were used for the preparation of the
glass samples. The glass samples were prepared by
following a procedure exactly similar to that described in
Section 3.6.2 of Chapter 3. Amorphous nature of the glass
samples was confirmed by the X-ray diffraction patterns.
Glass samples of uniform thickness about 1 mm and diameter
about lOmm were selected for the dielectric studies. Both
the faces of the glass samples were polished and coated
with a thin layer of silver paint to act as electrodes.
The electrical measurements of the glass samples were made
6 in the frequency range lo2 to 10 Hz. The dielectric
constant measurements were carried out by holding the
glass sample in a sample holder which could be heated to
different temperatures. The temperature of the sample
which could be maintained constant with an accuracy of
0 0.1 C was measured using a chromel-alumel thermocouple.
Dielectric constant and a.c conductivity measurements were
taken over a temperature range from 300 to 425 K.

Direct measurements of capacitance and dielectric
loss factor tand (D) in the glass samples were made by
a Hewlett-Packard impedance analyser (type 4192A LF)
having a frequency range of 5Hz to 13MHz. In these
measurements an a.c signal of 500 Vrms was applied across
the sample. Zero offset adjustments were made for
different frequency ranges to ensure the precision of the
measurements. Dielectric constant was derived from the
measured values of capacitance after eliminating the lead
and fringe capacitance.
4.5. Results and Discussion
(i) Dielectric constant
The real part of the dielectric constant ( ) of
the glass samples of the Ca0-B203-A1 0 -Na20 system was 2 3
determined for a wide range of composition using the
formula[421
where c, the capacitance of the glass sample in pico
farads t, the thickness of the sample in centimeters and
A, the area of cross-section of the electrodes in square
centimeters. The dielectric constant values obtained at

different temperatures and frequencies are tabulated in
table 4.1 to 4.6. Figures 4.1 to 4.6 represents the
variation of the real part of the dielectric constant
( E' ) with frequency of the glass samples at different
temperatures.
From the figures 4.1 to 4.6, it is clear that the
dielectric constant of all the series of glass systems
increases slightly with increase in temperature. The slow I
variation of the dielectric constant ( E ) with temperature
is the usual trend in ionic conducting materialsr431. The
temperature has a complicated influence on the dielectric
constant. Generally, increasing the temperature of the
material decreases the dielectric polarisation. The
increase of ionic distance due to the temperature
influences the ionic and the electronic polarisation.
Similarly the changes in the ionic polarisation are not
very large even assuming the presence of some dipoles and
their contribution to the dielectric constant[441. From
Debye's theory[44], it is known that the dielectric I
constant ( E ) is proportional to the temperature. Contrary
to this theory the ~eported results[471 indicate a slight
increase in the real part of the dielectric constant with
temperature. The present results are also in good
agreement with the reported results.

Table 4.1 Variation of dielectric constant with frequency for the sample SS1 at different temperatures
Frequency Dielectric constant KHz ..............................................
3231: 348K 373K 398K 423K
Table 4.2 Variation of dielectric constant with frequency for the sample SS4 at different temperatures
Frequency Dielectric constant KHz ..............................................
323K 348K 373K 398K 423i:
.5 13.31 13.61 14.10 14.78 15.39 1 12.91 13.01 13.24 13.45 13.96 10 12.62 12.72 12.91 12.96 12.98 3 0 12.51 12.62 12.86 12.92 12.94 5 0 12.35 12.45 12.79 12.80 12.89 7 0 12.00 12.31 12.59 12.65 12.69 100 12.22 12.47 12.50 12.58 12.40 300 12.13 12.35 12.40 12.45 12.15 500 12.06 12.27 12.35 12.40 12.07 700 12.01 12.23 12.33 12.38 12.01 1000 11.98 12.21 12.30 12.36 11.96 3000 11.97 12.21 12.27 12.35 11.89

Table 4.3 Variation of dielectric constant with frequency for the sample SC1 at different temperatures.
Frequency Dielectric constant KHz ..............................................
323R 348K 373K 398K 423K
Table 4.4 Variation of dielectric constant with frequency for the sample SC4 at different temperatures
Frequency Dielectric constant KHz ..............................................
323K 348K 373K 398K 423K
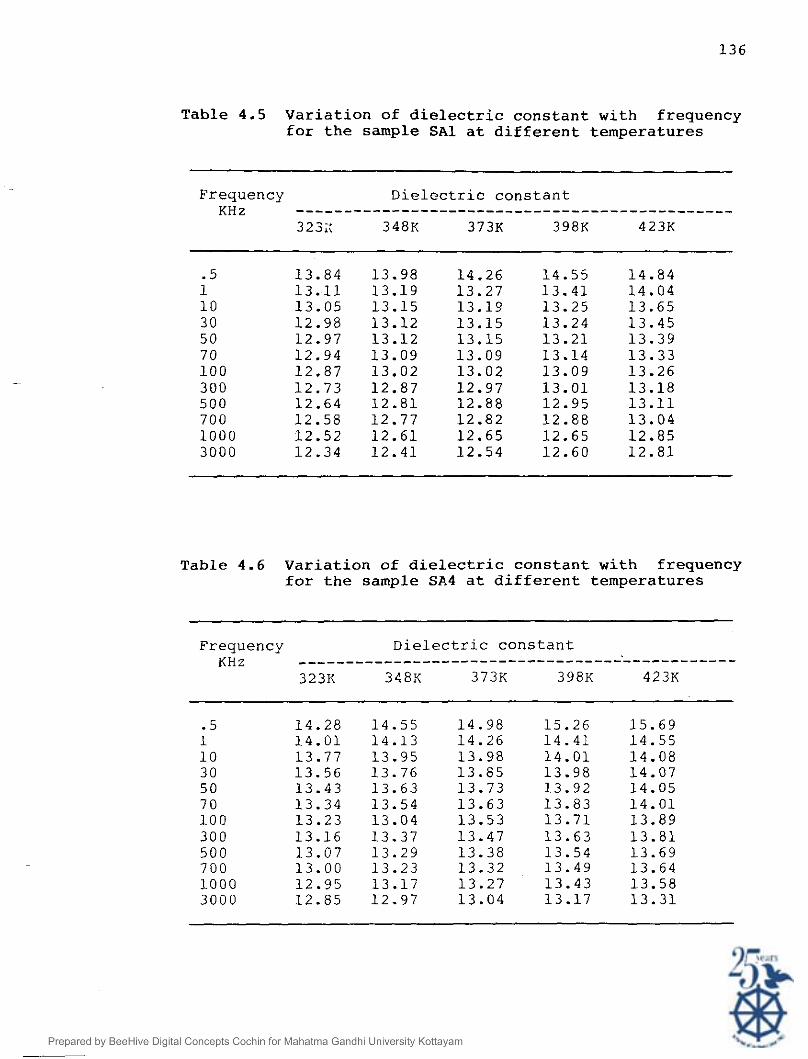
Table 4.5 Variation of dielectric constant with frequency for the sample SA1 at different temperatures
Frequency Dielectric constant KHz ..............................................
323;; 348K 373K 398K 423K
Table 4.6 Variation of dielectric constant with frequency for the sample SA4 at different temperatures
Frequency Dielectric constant KHz ..............................................
3231: 348K 373K 398K 423K
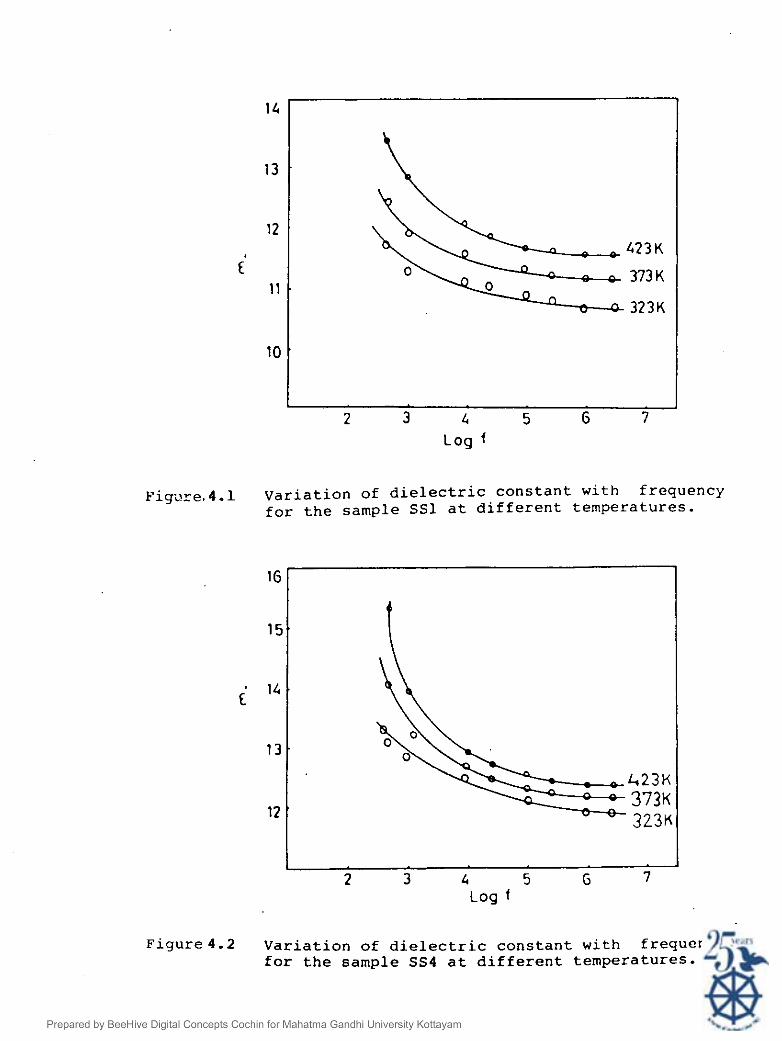
Log f
Figare.4.l Variation of dielectric constant with frequency for the sample SS1 at different temperatures.
Figure4.2 Variation of dielectric constant with frequency for the sample SS4 at different temperatures.

Log f
Figure4.3 Variation of dielectric constant with frequency for the sample SC1 at different temperatures.
Figure4.4 Variation of dielectric constant with frequency for the sample SC4 at different temperatures.

Figure4.5 Variation of dielectric constant with frequency for the sample S A ~ at different temperatures.
Figure4.6 Variation of dielectric constant with frequency for the sample SA4 at different temperatures.

As is seen from figures 4.1 to 4.6 value of &I
decreases monotonically with the increase of the frequency
of the applied electric field. Since the glass system
+ under the present study contains alkali ions (Na ions),
the dielectric properties mainly arise due to the movement
of these ions. The free energy barriers impeding the
ionic diffusion can be expected to vary from site to site,
so there are different types of ionic motions in
glasses[47]. The first is the rotation of ions around
their negative sites. The second is the short distance
transport, i.e., ions hop out of sites with low free
energy barriers or oscillate between the sites with high
free energy barriers in an a.c electric field. Both the
first and second type of motion make a contribution to
enhance the value of real part of dielectric constant of
the glass samples[44]. The decrease in dielectric
constant with frequency may also be due to the increase in
leakage current which is normally attributed to a
dielectric constant reduction[47]. The variation of€'
must be mainly due to the space - charge polarisation upto lo4 Hz and at higher frequencies it must be due to the
rontributions from ionic, dipolar and electronic
polarisation[46].
It is seen from figure 4.7 that the real part of the
dielectric constant &I increases with the concentration of
Na20 in the CaO-B203- A1 0 -Na20 glass system. When the 2 3
concentration of the alkali oxide is more, the number
+ density of the alkali ions (Na ions) increases and the
structure of the glass system gets modified so as to
benefit the ion motions, there by increasing the
polarisation. These factors lead to an increase in the
dielectric constant[47]. Since the concentrations of
A1203 and CaO are kept constant in the first series of the
glass system, their contribution for the enhancement of
remains almost constant in both the glass samples. Hence
the increase in & I , in the case of glass samples of the
+ . first series must be due to the increase in Na lons[47].
It is also observed from the figure 4.8 and 4.9 that the
value of &' increases slightly with the concentration of
CaO and A1203 respectively (for glass samples belonging to
series ii and iii respectively). This may also be due to
2 + the increased polarisation of Ca and ~ 1 ~ ' ions in the
corresponding glass systems[45,46]. It is inferred that
+ Na ions are much more effective in increasing the value
of than ca2+ or A13+ ions.

Ficpre4.7 Variation of dielectric constant with frequency for different concentrations of Na20.
Figure4.8 Variation of dielectric constant with frequency for different concentrations of CaO.

Figure4.9 Variation of dielectric constant with frequency for different concentrations of A1203.
1G
15.
1 4 .
E' 13.
12
2 3 4 5 G 7 8 Log t
'
Ter?p = 423 Y
& 5 3 4 SAl
.
(ii) a.c. conductivity
The a.c conductivity of the glass samples were
calculated using the formula Cac = d k o , whereo = 2TI f,
f is the frequency of the alternating field applied, 5" ,
the imaginary part of the dielectric constant and
Eo is the dielectric constant of the free space[8,57].
The measured a.c conductivity values of CaO-B 0 - 2 3
A 1 0 -Na 0 glass system containing two different 2 3 2
concentrations of Na20, A1203 and CaO at different
temperatures and frequencies are given in table 4.7 to
4.12. Figures 4.10 to 4.15 represent the variations of
a.c conductivity with frequency at different temperatures.
From figures 4.10 to 4.15 it is obvious that the a.c
conductivity increases with frequency of the applied
field and also with temperature. As the temperature
increases, more and more ions can dissociate and get over
high free-energy barriers to take part in the conduction
and hence the conductivity increases. The a.c
conductivity (6 ) is found to depend on the frequency (U) a c
of the applied a.c field according to the relation:
5 c = A ', where A is a constant, where s, is a
parameter and (a= Znf), the angular frequency. In glass
samples containing an alkali oxide variation in

Table 4.7 Variation of a.c conductivity with frequency for the sample S S 1 at different temperatures
Frequency a.c. conductivity KHz
323K 348K 373K 398K 423K
Table 4.8 Variation of a.c conductivity with frequency for the sample SS4 at different temperatures
Frequency a.c. conductivity KH 2
323K 348K 373K 398K 423K
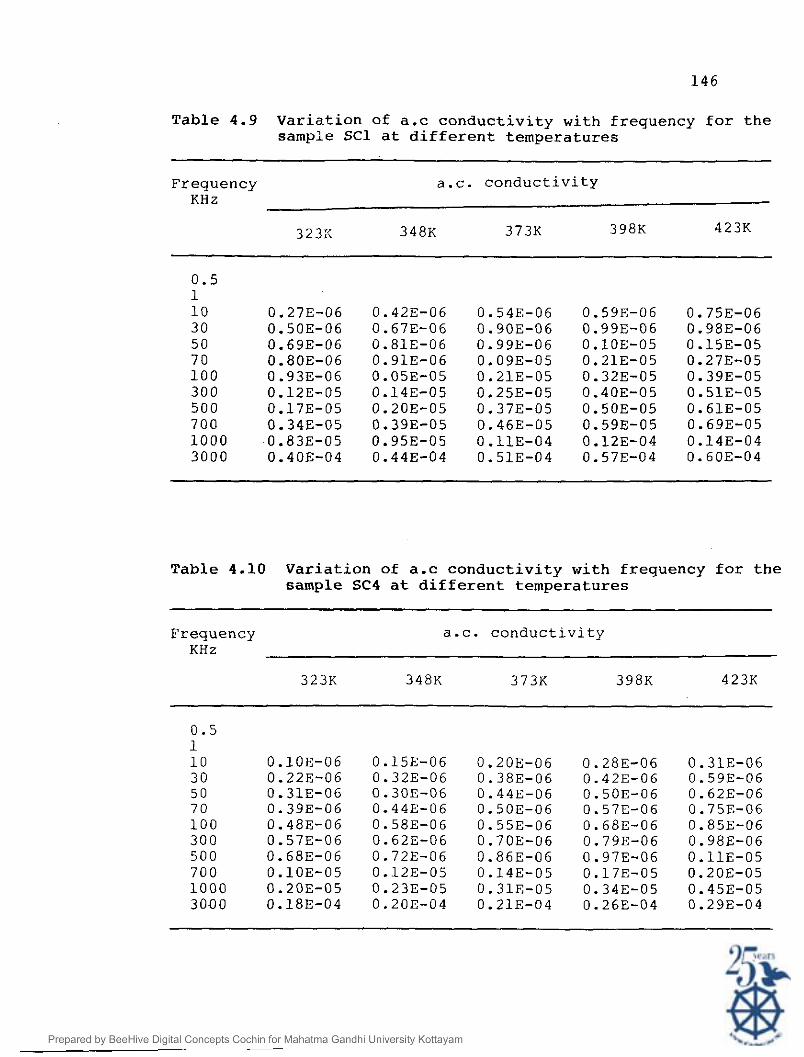
Table 4.9 Variation of a.c conductivity with frequency for the sample SC1 at different temperatures
Frequency a.c. conductivity KHz
323K 348K 373K 398K 423K
Table 4.10 Variation of a.c conductivity with frequency for the sample SC4 at different temperatures
Frequency a.c. conductivity K H z
323K 348K 373K 398K 423K
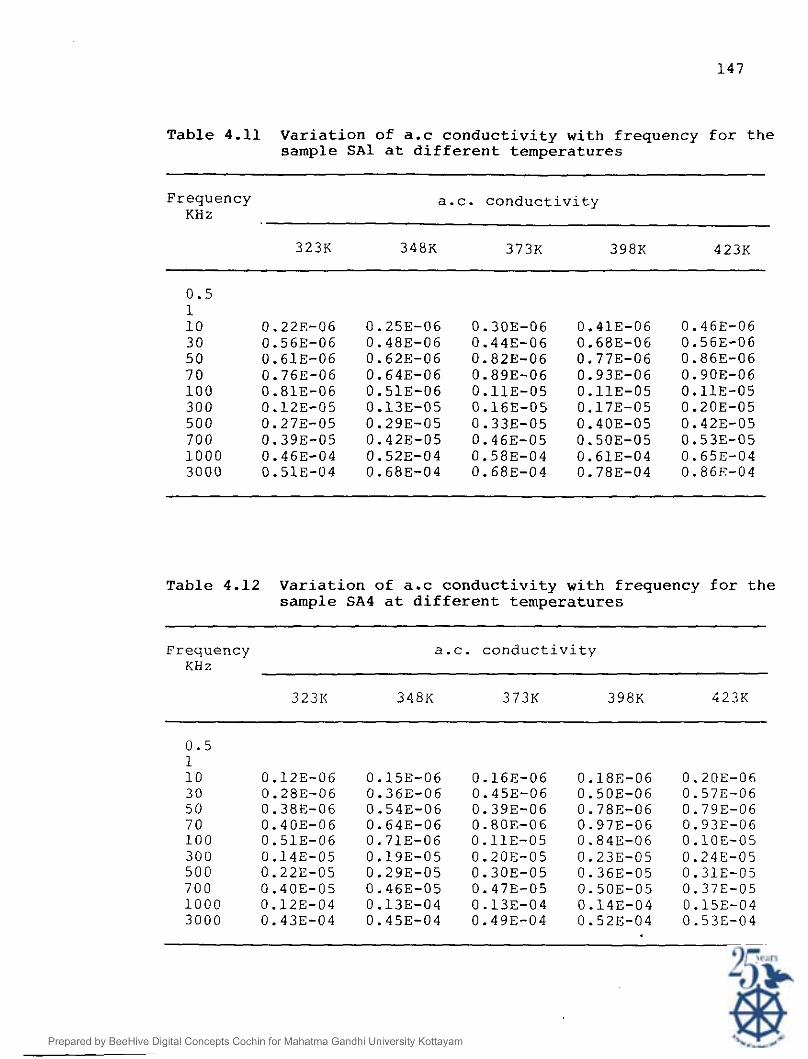
Table 4 . 1 1 Variation of a.c conductivity with frequency for the sample SA1 at different temperatures
Frequency a.c. conductivity K H z
3 2 3 K 3 4 8 K 3 7 3 K 3 9 8 K 4 2 3 K
0 .5
Table 4 . 1 2 Variation of a.c conductivity with frequency for the sample SA4 at different temperatures
Frequency a . c . conductivity K H z

Figure.4.10 Variation of a.c conductivity with frequency for different temperatures.(sample SS1).
Figure4.11 Variation of a.c conductivity with frequency for different ternperatures.(sample 554).

-77 log l
Figure4.12 Variation of a.c conductivity with frequency for different temperatures.(sample SC1).
Figure4.13 Variation of a.c conductivity with frequency for different ternperatures.(sample S C 4 ) .

Ficpre4.14 Variation of a.c conductivity with frequency for different ternperatures.(sarnple S A l ) .
Figure4.15 Variation of a.c conductivity with frequency for different temperatures.(sample S A 4 ) .

conductivity with frequency may be attributed to a kind of +
dielectric relaxation of the local motion of the Na ions
around the non-bridging oxygens[lO,ll]. However, recent
experimental and theoretical studies[l2-151 suggest that
the frequency dependent conductivity can also be due to a
t . jump diffusion of the mobile alkali ions (Na Ions) as in
the case of d.c conductivity. Pike[50], ~pringlet[51] and
Elliot[52] have suggested that the frequency dependent
conductivity in alkali oxide containing glasses is due to
the hopping over inequivalent barriers of the charge
carriers in the glass system. At low frequency region the
enhancement of conductivity with frequency may be
attributed to the interfacial imped&?ce or space-charge
polarisation[l2,39]. At higher frequencies, the rate of
increase of conductivity of the glass system studied is
found to be slightly higher and this may be a continuation
of the low frequency process[481. As the frequency
increases the hopes will become shorter and in the limit
of interatomic distances, will no longer be randomly
distributed and the conductivity will settle to a
frequency dependence which tends to w S where s is
slightly greater than unity[8]. This type of behaviour is
well-known in amorphous systems and has been attributed to
the distribution of relaxation times arising from the
disorder[48,49].
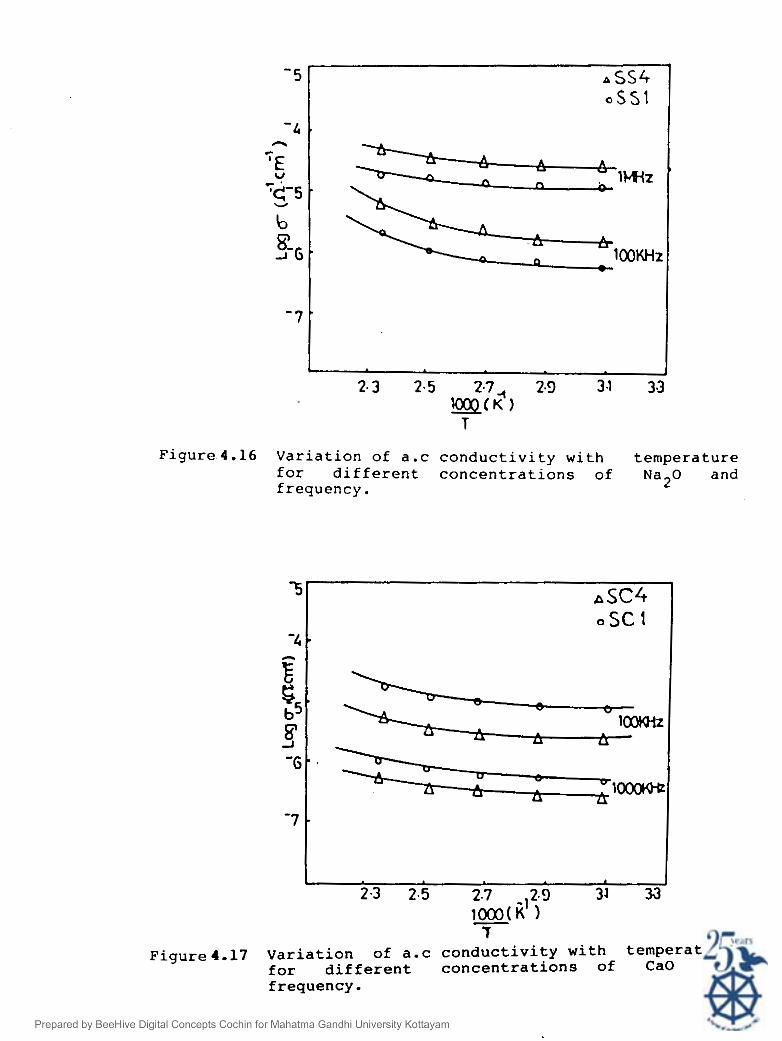
Figure4.16 Variation of a.c conductivity with temperature for different concentrations of NaZO and frequency.
Figure4.17 Variation of a.c conductivity with temperature for different concentrations of CaO and frequency.

Figure4.18 Variation of a.c conductivity with temperature for different concentrations of A 1 2 0 3 and frequency.
- -rE -'-5 'S
b . 8'. J G
'
KHz
As it is seen from figure 4.16 that a.c conductivity
increases with concentration of Na20. This is
attributed to the increase in number of mobile carriers
taking part in the conductivity mechanism when the
concentration of Na 0 increases. From figure 4.17 and 2
4.18, it is obvious that a.c conductivity of the glass
system studied decreases with the concentration of CaO and
Al2O3, respectively. This may be attributed to the
blocking action of ca2+ ions in the case of the glass
samples belonging to the second series and due to the
electronegativity of the ~ 1 ~ ' ions for the third series.
4.6. Conclusion
CaO-B 0 -A1 0 -Na20 glasses containing different 2 3 2 3
concentrations of Fe203, CaO and A1203 were prepared.
The variation of dielectric constant and a.c conductivity
(6;;c) was studied over a temperature range from 300 to
425 K. The value of real part of the dielectric constant
and a.c conductivity was found to decrease with the
frequency and increases with temperature and to depend on
the concentration of the constituents.

PART 111
STUDY OF DIELECTRIC CONSTANT AND A.C CONDUCTIVITY IN
Ca0-B203-A1203-Fe203 GLASS SYSTEM
4.7. Introduction
It is now well accepted that the general condition
for semiconducting behaviour in transition metal oxide
containing oxide glasses is that the transition metal ion
should be capable of existing in more than one valence
state, so that conduction can take place by the transfer
of electrons from low to high valence state[52]. The
frequency dependence of electrical conductivity and
dielectric constant of these types of glasses have been
the subject of detailed theoretical and experimental
investigations[53,54]. a.c conductivity (6;;C) due to
hopping conduction has been reported to increase with
frequency) w according to the relation s cacd
where s is a parameter. Such a frequency dependence,
which has been attributed to a wide distribution of
relaxation times due to distribution of jump distanceL551
and barrier heights[50], has been observed in a wide range
of low mobility materials[56]. In this chapter, the author
presents the investigations carried out to study the
frequency and temperature dependence of dielectric

constant ( &' ) and a.c conductivity ( Cat) in CaO-B203- AL o -Fe 0
2 3 2 3 ' Effects of change in the concentration of
Fe203, CaO, and A 1 0 on the values of & and 6ac 2 3
have
been discussed on the basis of the existing theories.
4.8. Experimental Details
Three series of glass samples containing different
concentrations of Fe 0 CaO and A1203 and of different 2 3'
compositions as given below were prepared for the present
study.
Series (i) 20 CaO - 68 B203 - 10 A1203 - 2 Fe203 ..FFl
20 CaO - 62 B203 - 10 A1203 - 8 Fe203 ..FF4
Series (ii) 5 CaO - 80 B 0 2 3
- 10 A1203 - 5 Fe 0 ..FC1 2 3
20 CaO - 65 B203 - 10 A1203 - 5 Fe203 ..FC4
Series (iii) 20 CaO - 80 B203 - 5 A1203 - 5 Fe203 . . F A 1
20 CaO - 65 B203 - 20 A1203 - 5 Fe203 ..FA4
The details of the preparation of the glass samples
are described in Section 3.6.2 of Chapter 3. The
I experimental set up and the measurements of & and loss
factor tan 6 (D) are exactly similar to those given in
Section 4.4.1 of this chapter. The capacitance (c) and
loss factor tan 6 for different samples at different
temperatures were measured.

4.9. Results and Discussion
(i) Dielectric constant
The real part of the dielectric constant ( E' ) was
calculated with the help of the relation[42].
at different temperatures and for different concentration
of Fe203, CaO and A1203. The calculated values of the I
real part of the dielectric constant ( & ) are tabulated
in table 4.13 to 4.18. For a given composition of the
glass system, the value of &' were found to decrease with
temperature. The variation of &I with frequency
and temperature is schematically represented in figures
4.19 to 4.24.
As is seen from figures 4.19 to 4.24, the value of I
dielectric constant ( & ) decreases monotonically with
the frequency of the applied alternating field for all the
glass samples studied. The decrease in the value of
with the frequency may be due to an increase in the
leakage current with the increase in frequency which is I
normally attributed to a capacitance reduction[30]. Since&
is a measure of the capacitance, the value of &' should
decrease with the frequency of the alternating field
applied[ 301.

Table 4.13 Variation of dielectric constant with frequency for the sample FF1 at different temperatures
Frequency Dielectric constant
(KHz) 3231: 348K 373K 398K 423K
Table 4.14 Variation of dielectric constant with frequency for the sample FF4 at different temperatures
Frequency Dielectric constant ........................................... (KHz) 323K 348K 373K 398K 423K

Table 4.15 Variation of dielectric constant with frequency for the sample FC1 at different temperatures
Frequency ~ielectric constant ___________________------------------------ (KHz) 323K 348K 373K 398K 423K
.5 10.58 10.89 11.19 11.50 11.98 1 10.39 10.65 10.81 11.21 11.58 10 10.28 10.50 10.65 11.01 11.22 30 10.17 10.42 10.52 10.95 11.01 5 0 10.12 10.38 10.50 10.87 10.91 7 0 10.06 10.35 10.47 10.76 10.89 100 10.03 10.30 10.41 10.71 10.78 300 10.00 10.27 10.37 10.65 10.74 500 9.95 10.21 10.32 10.61 10.71 700 9.94 10.19 10.30 10.56 10.68 1000 9.92 10.17 10.28 10.53 10.65 3000 9.81 10.09 10.19 10.38 10.49
Table 4.16 Variation of dielectric constant with frequency for the sample FC4 at different temperatures
-- --
Frequency Dielectric constant ........................................... (KHz) 3231: 348K 373K 398K 423K
- .-
700 11.25 11.62 11.75 11.91 11.96 1 OOG 11.21 11.55 11.49 11.85 11.89 3000 11.07 11.14 11.25 11.34 11.38

Table 4.17 Variation of dielectric constant with frequency for the sample FA1 at different temperatures
Frequency Dielectric constant ..........................................
(KHz) 323K 348K 373K 398K 423K
Table 4.18 Variation of dielectric constant with frequency for the sample FA4 at different temperatures
Frequency Dielectric constant
(KHz) 3231: 348K 373K 398K 423K
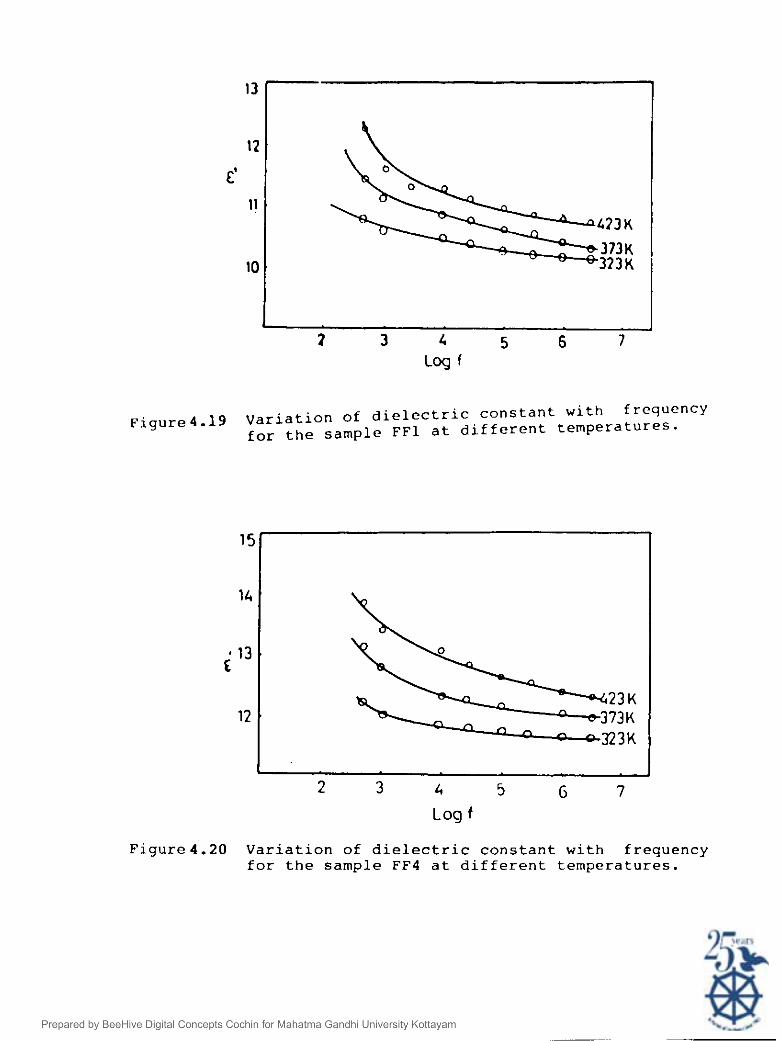
15'
14
12
2 3 4 5 0 7
Log f
13
12
C'
11
10
Figure4.20 Variation of dielectric constant with frequency for the sample FF4 at different temperatures.
373K . 313K
1 3 I 5 6 7
Loq f
Figure4.19 Variation of dielectric constant with frequency for the sample FF1 at different temperatures.

Figure4.21 Variation of dielectric constant with frequency for thc sample FC1 at different temperatures.
Figure4.22 Variation of dielectric constant with frequency for the sample FC4 at different temperatures.

Figure4.23 Variation of dielectric constant with frequency for the sample FA1 at different temperatures.
14 '
1 3 '
373K
2 -
3 4 5 6 7 0
Log f
F i g ~ r ~ 4 . 2 4 Variation of dielectric constant with frequency for the sample FA4 at different temperatures.

Figures 4.19 to 4.24 represents the variation of
&I with frequency and temperature of the glass samples
belonging to the series (i). It is clear from the I
figures 4.25 that the value of & increases with the Fe203
concentration in the glass system. This may be due to
the increased number of electrons participating in the
polarization process. When concentration of Fe203
increases, the number of electrons involved in the I
polarization will also be more. Since & is a direct
measure of polarisation/unit volume, & should increase
with the concentration of Fe 0 2 3' The value of &' may
also depend on the concentration CaO and A1203. i.e., on
the polarization of ca2+ and ~ 1 ~ + ions in the glass
system. Since the concentration of CaO and A1203 were
kept constant in the glass samples of first series, their
contribution to & remains constant. Therefore, the
variation in 6' must be due to the Fe 0 content alone. 2 3 I
Similarly, it is observed that the value of increases
with the concentration of CaO and A1 0 of the 2nd and 3rd 2 3
series of glass system respectively (figures 4.26 and
4.27). This may also be due to the increased
polarization effect of ca 2+ and A1 3+ ions in the
corresponding systems[46]. In these series of glass
systems, since the concentration of Fe203 was kept I
constant the contribution to & remains almost same in

Fiqurc4.25 Variation of dielectric constant with frequency for different concentrations of ft 0 2 3
Fiqure4.26 Variation of dielectric constant with frequency for different concentrations of CaO.
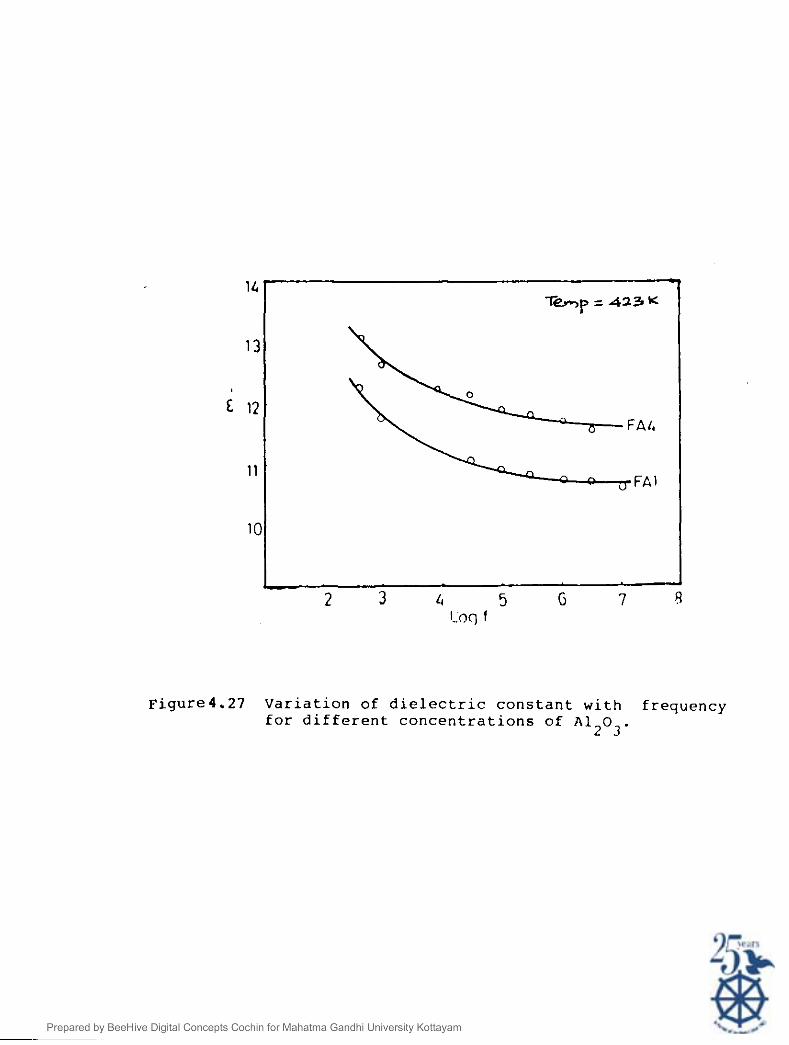
~iqure4.27 Variation of dielectric constant with frequency for different concentrations of A 1 0
2 3 '
both the series. Similar results of increase in the value
of E with the concentration of transition metal oxide
were reported by many investigators[8,28,30].
(ii) a.c. Conductivity
a.c conductivity was calculated from the relation
given in Section 4.5 of this chapter, in the frequency
6 range lo2 to 10 Hz and over a temperature range 300 to
425 K for Fe203 containing glasses of different
composition. The a.c conductivity values calculated are
tabulated in tables 4.19 to 4.24. The graphical
representation of the conductivity with frequency and
temperatures are as shown in figures 4.28 to 4.33. It
was observed that in all samples CaC increases with
temperature as expected for normal semiconductors. As is
seen from the figures 4.28 to 4.33, conductivity increases
with the frequency of the applied field for all series of
Ca0-B203-A1 0 -Fe203 glass system. 2 3
The conduction in these type of glasses is mainly due
to the polaronic hopping and due to the motion of ions.
Since in the first series, the concentration of CaO and
A1203 were kept constant the ionic conductivity part
remains almost same in these series. Therefore the

Table 4. 19 Variation of a.c. conductivity with frequency for the sample FF1 at different temperatures
Frequency a.c. conductivity
(KHz) 323K 348K 373K 398K 423K
0 . 5
Table 4. 2 0 Variation of a.c. conductivity with frequency for the sample FF4 at different temperatures
Frequency a.c. conductivity ................................................
(KHz) 323K 348K 373K 398K 423K

Table 4. 21 Variation of a.c. conductivity with frequency for the sample FC1 at different temperatures
Frequency a.c. conductivity ................................................
(KHz ) 323K 348K 373K 398K 423K
Table 4. 22 Variation of a.c. conductivity with frequency for the sample FC4 at different temperatures
Frequency a.c. conductivity ................................................ (KHz) 323K 348K 373K 398K 423K

Table 4. 23 Variation of a.c. conductivity with frequency for the sample FA1 at different temperatures
Frequency a.c. conductivity ................................................ (KHz) 323:: 348X 373K 3 9 8 ~ 423K
Table 4. 24 Variation of a.c. conductivity with frequency for the sample FA4 at different temperatures
Frequency a.c. conductivity ................................................
(KHz) 323K 348K 373K 398K 423K
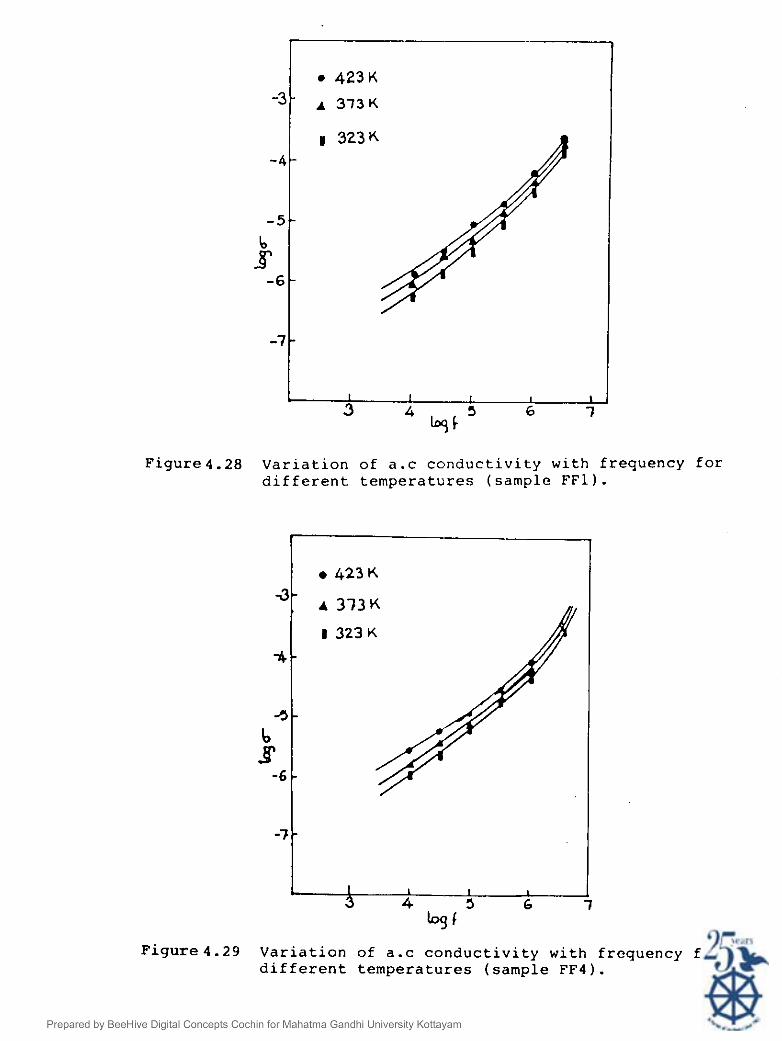
Figure4.28 Variation of a.c conductivity with frequency for different temperatures (sample FF1).
Figure4.29 Variation of a.c conductivity with frequency for different temperatures (sample FF4).

E'igure4.30 Variation of a.c corlductivity with frequency for different temperatures (sample FC1).
~igure4.31 Variation of a.c conductivity with frequency for
different temperatures (sample FC4).

Figure4.32 Variation of a.c conductivity with frequency for different temperatures (sample FA^).
Figure4.33 Variation of a.c conductivity with frequency for different temperatures (sample F A 4 ) .

variation in cat is due to the increase in concentration of Fe203. i-e., due to polaronic hopping. This conduction
mechanism can be discussed as follows. It is now well
accepted that in transition metal oxide containing
glasses, transition metal i'3n must be in more than one
valence state, so that conduction can take place by the
transfer of electron from the low to the high valence
states. In the present glass system containing Fe 0 the 2 3'
ions will be in different localised states and mainly in
Fe2+ state. In these glasses, the conduction may occur by
2 + electrons hopping directly between the occupied (Fe )
3 + and unoccupied (Fe ) sites according to the schematic
representation.
Since in the present work, the glass under study
contains low iron concentration, the above proposed
conduction mechanism may explain the thermally activated
conduction (because of the amorphous nature of the glass),
and in this case the likelihood that a large fraction of
the carrier will be trapped and the potentially high
density of localised states makes it necessary to consider
direct hopping for transport[23,24]. The carrier may be
imagined as spending its time trapped at a particular
localised state and making more or less transition to
neighbouring empty trapsL281.

~t low frequencies the variation of rac was found
to be slightly less compared with that at higher
frequencies. At higher frequencies the hops will become
shorter and, in the limit of interatomic distances, will
no longer be randomly distributed and will settle to a
frequency dependence to = A m s ; 5 > 1 where O = 271f; ac
f is the frequency of the applied alternating field. The
present experimental results on < in this glass system ac
support the idea of hopping of carriers between the iron
ions (Fe 2 + 3+ and Fe ) in the different valence states
following the band model suggested by Austin and Mott[21].
This type of behaviour is well known in amorphous systems
and has been attributed to the distribution of relaxation
times arising from the disorder[49].
From the figure 4.34, it is obvious that increasing
the iron oxide content in the glass system belongs to
series (i) caused an increase in the a.c conductivity.
This may be due to the increased number of electrons
hopping between the states of different valencies. This
type of results which support the idea of hopping
conduction mechanism is reported in oxide glasses
containing transition-metal oxides[28]. Since in this
series of glass samples, the concentration of CaO and
A1203 are kept constant, their contribution in enhancing
the conductivity remains almost same.

Figure4.34 Variation of a.c conductivity with temperature For different concentration of Fe2o3 and . - frequency.
Figure4.35 Variation of a.c conductivity with temperature for different concentration of CaO and frequency.

Figure4.36 Variation of a.c conductivity with ternperatvre for different concentration of A I Z O j 2nd frequency.

In the present study it is also observed from
figure 4.35 and 4.36 that a.c conductivity increases
with the concentration of CaO and A1203 in the 2nd and 3rd
series of glass system respectively. This may be due to
2+ . the increased ionic conductivity by the Ca Ions and the
non-bridging oxygens.
4.10. Conclusion
Ca0-B203-A1203-Fe 0 2 3
glasses containing different
concentration of Fe 0 CaO and A1203 were prepared. The 2 3'
variation of dielectric constant and a.c conductivity with
frequency, concentrations of Fe203, CaO and A1203 were
studied over a temperature range 300 to 425 K. The value
of real part of the dielectric constant was found to
decrease with the frequency and increases with
temperature. Also values of rac was found to be
dependent on the concentration of the constituents and the
frequency.

References
1. Owen A.E. and Robertson J.M., J. Non-Cryst. Solids, 4, 208 (1.970).
2. Kitao M., Araki F. and Yamada S., Phys. Stat. ~olidi, 37, K 119 (1976).
3. Lakatos L.I. and Abkowitz M., Phys. Rev., B 8, 1791 (1971).
4. Bishop S.C., Taylor P.C., Mitchell D.L. and Sack L.H., J. Non-Cryst. Solids, 5, 351 (1971).
5. Linsley G.S., Owen A.E. and Hayatec F.N., J. Non- Cryst. Solids, 4, 228 (1970).
6. Sayer M., Mansingh A., Reyes A. and Rosenblatte J.M., J. Appl. Phys., 42, 2857 (1971).
7. Thurzo I., Baromock B. and Donpovcc J., J. Non-Cryst. Solids, 28, 177 (1978).
8. Sayer M. and Mansingh M., Phys. Rev. 86, 4629 (1972).
9. Bottyer H. and Brykein V.V., Phys. Stat. Sol.(b), 78, 415 (1976).
10. Charls R.J., J. Appl. Phys., 32, 1115 (1961).
11. Tomozawa in: Treatise on Materials Science, ed. Hanney H. (Academic Press, New York) (1977).
12. Kaaamura J. and Shimoji M., J. Non-Cryst. Solids, 79, 367 (1986).
13. Dyre J.C., Phys. Lett., 108 A , 457 (1985).
14. Abelard P. and Baumard J.P., Solid State Ionics, 14, 61 (1984).
15. Ishii T., Pro. Theor. Phys., 73, 1084 (1985).
16. Schmid A.P., J. Appl.. Phys., 39, 3140 (1968).
17. Munakata M., Solid State Electron, 1, 159 (1960).

Landsberger F.R. and Bray P.J., J. Chem. Phys., 53, 2757 (1970).
Morin, Phys. Lett., 3, 34 (1959).
Mott N.F., J. Non-Cryst. Solids, 1, 1 (1968).
Austin 1.G and Mott N.F., Adv. Phys., 18, 41 (1969).
Mackenzie J.D., in "Modern Aspects of the V ~ ~ K ~ O U S State", edited by Mackenzie J.D., Butterworths, London p.126 (1965).
Owen A.E., Contemp. Phys., 11, 257 (1970).
Mansingh A., Reyes J.M. and Sayer M., J. Non-Cryst. Solids, 7, 76 (1972).
Mansingh A., Tandon R.P. and Vaid J.K., Phy. Rev., 21, 4829 (1980).
Murauski L., Phil. Mag., 50, L69 (1984).
Bogomolova L.D, Classova M.P., Kalygina V.M., Reiman S.I., Spsibkina S.N. and Filatova I.V., J. Non- Cryst. Solids, 85, 170 (1986).
Saleh C1.N. and Gawish M.M., J. Appl. Phys. 51, 459 (1980).
Duran A., Jurado J.R. and Fernandez N.J.M., J. Non- Cryst. Solids.
Hassan M.A., Hogarth C.A. and Moridi G.R., Phys. Stat. Sol. (a), 101, 537 (1987).
Muhammed Osman A.E., Hassan M.A. and Hogarth C.A., J. Efater. Sci., 24, 3560 (1989).
Lynch G.F. and Sayer M. J. Appl. Phys., 42, 2587 (1971).
Th. Van Gemert W.J., vas Ass. H.M.J.M. and Stevels J . M . , J. Non-Cryst. Solids, 16, 281 (1974).
Abelard P. and Barnard J.F., Solid State Ionics, 14, 61 (1984).

Taylor H.E., Part I J. Soc. Glass Tech., 41, 350 (1957). Part I1 J. Soc. Glass Tech., 43, 124 (1959).
Charles R.J., J. Appl. Phys. 32, 1115 (1961).
Barton J.L., Veres et Refr., 20, 328 (1966).
Kawamura J., Sato R., Mishina S. and Shimoji M., Solid State Ionics, 25, 155 (1987).
Bottelberghs P.H., in: Solid Electrolytes, eds., Hagen Muller P. and Van Cool W., Academic Press, N.Y. (1978).
Huang P., Huang X. and Gam F., J. Non-Cryst. Solids, 112, 318 (1989).
Tarsikka P.S. and Singh B., J. Non-Cryst. Solids, 124, 221 (1990).
Brahim E. and Malika O., Phase ~ransitions, 12, 121 (1988).
S ~ y t h C.P., "Dielectric Behaviour and Structure", p.132, Mc Graw Hill, New York (1955).
Pandit A.K, Singh R.K., Ansari T.H., Singh R.A. and Wanklyn B . N . , J. Phys. Chem. Solids, 54, 769 (1993).
Hassan A.M., Hagarth C.A. and Moridi G.R., Phys. Stat. Solidi (a), 101, 537 (1987).
Kinqerv W.D., Bowen H.K. and Uhlman D.R. w~nfroduction to Ceramics", John-Willey and Sons, N.7 11976).
Huang Pengnian and Huang Xihuai, J. Non-Cryst. Solids, 112, 318 (1989).
Owen A.E. and Robertson J.M., J. Non-Cryst. Solids, 2, 40 (1970).
Mansingh A., Tandon R.T. and Valid J.D., J. Phys. Chem. Solids, 36, 1267 (1975).
Pike G.E., Phys. Rev., 6B, 1572 (1972).
Springlett B.R., J. Non-Cryst. Solids, 15, 179 (1974).

52. ~lliot S.R., Phil. Mag., 36, 1291 (1977).
53. Mott N.F. and Daris E.A., "Electronic Processes in on-Crystalline Materials", Oxford , Clarendon (1971).
54. Bottger M. and Bryksin, Phys. Stat. Sol., B9, 78 (1976).
55. Pollak M. and Gebalte T.H., Phys. Rev., 122, 1742 (1961).
56. Johnscher A.K., J. Non-Cryst. Solids, 8, 293 (1972).
57. Elliot S.R., Physics of Amorphous Materials, John Wiley & Sons, Inc., N.Y., p.412 (1984).

CHAPTER 5
LASER RAMAN STUDIES ON QUARTERNARY GLASS SYSTEMS
CaO-B2Qd1203-Na20 AND Ca0-6203-Al203-Fe203
CHAPTER 5
LASER RAMAN STUDIES ON QUARTERNARY GLASS SYSTEM
Ca0-B203-A1 O-Na 0 AND Ca0-B203-A1203-Fe203 2 3 2
5.1. Introduction
Amorphous materials are characterized by the absence
of long-range order in the arrangement of atoms and their
structure is generally described in terms of a short-range
order. Structural studies of glasses have been carried
out using different experimental techniquesll-51. Laser
Raman spectroscopy has been widely used for the
investigation of structure of different types of
glasses[6-lo]. Particularly, a number of investigations
on borate glasses have been reported[ll-151. A
comprehensive review of Ranan studies on borate glasses
has been published by ~onijnendilk and Stevels[ll]. Very
recently, Meera and Ramakrishna have reviewed the later
studies on these type of glasses[l2].
In this chapter, the author presents laser Raman
studies on the quarternary glass systems CaO-B 0 -A1203- 2 3
Na20 and CaO-B 0 -A1 0 -Fe 0 2 3 2 3 2 3 ' A brief review of the
Raman studies on borate glasses is also included in this
chapter.

5.2. A Short Review
As pointed out by Konijnendijk et al.[ll], the
interpretation of Raman spectra of borate glasses is not
straight forward and usually information on the structural
units present in different glass systems is obtained by
comparison of the Raman spectra of the glasses with those
of borate compounds whose crystal structure is known.
This is based on the assumption that structural units or
groups in glasses resemble the units or groups in
comparable compounds[ll,l3]. The structure of glasses has
been the topic of many theoretical investigation[l4,151.
Two basic approaches viz., random network
hypothesis[l6,17] and the crystallite model[l7] have been
proposed for the description of structure of disordered
naterials[l2]. According to the first hypothesis the
fundamental polyhedra present in crystals (eg., Si04 in
S i 0 2 crystals) exist as such as in the corresponding
qlasses. These polyhedra are connected together by
allowing sone degree of bond angle distortion and more or
less complete freedom for value of dihedral angles. This
theory has been applied with considerable success to
explain the structure of amorphous Si, Ge and As.
According to the second hypothesis a glass consists of
subnicroscopically ordered regions which are connected
together by a disordered structure. But this model does
not enjoy much experimental support[l21.

The structure of borate glasses is best described by
the group model primarily suggested by Krog-Moe[l8]. This
model is based on the assumption that structural units or
groups present in oxide melts or oxide glasses resemble
the units or groups present in the corresponding
crystalline compound. In the analysis of Raman spectra of
borate glasses, the Raman spectra of crystalline compounds
are used as the finger prints for the identification of
specific groups in the corresponding glasses. The
different types of borate groups presently known are given
in figure 1.10 (Chapter 1)[11]. The structural and
physical properties of B203 glasses have been investigated
by many workers[ll,l9-301. The main feature of the Raman
spectrum of B203 glasses is a narrow, intense and
strongly polarized band centered at 806 ~m-~[25,25a,16,33].
Mozzie and Warren[31] from X-ray diffraction experiments
have shown that vitreous B203 is primarily built up of
boroxol ring which are linked together, and a small
number of B03 unit, which are not part of the boroxol
rings, linked randomly to the boroxol groups. This was
also suggested by other workers[Zla]. This conclusion was
based on the fact that the strongest peak in the Raman
Spectra of B203 glasses at 806 cm-I coincide with a
strong Raman peak in several boroxol derivatives. Since
this peak is strongly polarized it must be due to a
totally systematic vibration. Parsons[32] and Krogh-

Moe[21 ] attributed this peak to a trigonal deformation of
the boroxol ring. This suggestion has also been supported
by the theoretical calculation of the vibrational spectra
of boroxol groups with different groups attached to the
boroxol ring[33]. In contrast with the Raman spectrum of
Vitreous B 0 the Ranan spectrum of crystalline B 0 does 2 3' 2 3
not have a peak at 806 cm-I indicating the absence of
boroxol rings[34]. Crystal structure of crystalline B2°3
has been shown to consist of BO triangles and not boroxol 3
rings[35].
The Raman spectra of B203 glasses have also been
reported to be characterized by a weak and broad band
centered around 1260cm-1[22,28,29,30]. This band has been
reported to be originating from the delocalized B-0
stretch involving both the ring and network
contribution[28]. The band has the characteristics of a
Continuous Random Network (CRN) mode[30] indicating that
B203 glass is made up of continuous random network of
boroxol rings.
The Raman spectra of vitreous B 0 undergo pronounced 2 3
change on the addition of other oxides like alkali oxide,
alkaline earth oxide, combination of alkali oxides and
alkaline earth or A1203. The Raman spectra of binary

alkali borate glasses: x R 0-(1-x)B 0 (R=Li, Na, K, Rb, 2 2 3
Cs) containing upto 70 mol% of alkali oxide have been
extensively studied by many researchers[11,23,26,36-431.
The Raman spectra of alkali borate glasses containing
different alkali ions show a close resemblance[ll,l21.
The nost prominant characteristic of binary alkali borate
glasses for low concentration of alkali oxide is the peak
at 806 cm-l. Upon increasing the alkali oxide content the
intensity of this peak of 806cm-1 decreases and a new
peak starts developing at about 770cm-I. At 20 mol% of
alkali oxide the 806cm-' peak appears only as a shoulder
of 770 cm-' peak and in the case of sodium and cesium
borate glasses the 806 cm-' peak completely disappears at
a concentration of 25 mol% of the alkali oxide[ll,l2]. As
the alkali oxide concentration increases beyond 30 mol%,
the peak at 770 cm-' shifts towards lower frequency. At
alkali oxide concentrations in the range 20-35 mol%, the
strongest peak is observed in the range 770-755 cm-I.
Since 806 cm-' peak is characteristic of the boroxol
group, it is obvious that on the addition of alkali oxide
to boron oxide, the boroxol groups are converted into
other groups. Also, the disappearance of the 806 cmbl
peak at about 25 mol% of alkali oxide indicates that
vitreous boron oxide structure is not made up of random
network of B 0 3 triangles, since at 25 mol% alkali oxide

not all these B03 triangles with three bridging oxygen
ions can be converted into other types of groups[lll.
Frorn the studies of binary sodium and potassium borate
glasses, Konijnendijk[ll] has shown that the peak which
arises at about 770 cm-I is due to a symmetric breathing
vibration of a six-membered borate ring with one B04
tetrahedra[24]. Through a comparison of the Raman spectra
of sodium and potassium borate glasses containing 20 mol%
alkali oxide with the spectra of various alkali borate
compounds, Konijnendijk has concluded that tetraborate
groups, that is, a couple consisting of one pentaborate
and one triborate group are formed in the concentration
range 0-20 mol% alkali oxide at the expense of boroxol
rings. This conclusion was also confirmed by IR spectra,
X-ray analysis, NMR studies and melting point
depressions[18,24,44,45].
Konijnendijk has also concluded that in the
composition range 20-35 mol% alkali oxide, the tetraborate
groups are gradually replaced by diborate groups upon
increasing the alkali oxide content. At about 33 mo18 of
alkali oxide, the network is built up mainly of diborate
groups with minor number of loose BO triangles, loose BO 3 4
tetrahedra with ring-type metaborate groups probably also
present. This picture has also been confirmed by the NMR
measurements of Rhee and Bray[45]. Konijnendijk has

assigned the peak at 7 5 5 cm-l to diborate groups. Raman
spectra of alkali borate glasses with high alkali content
-1 contain a peak at 755 cm . Bri1[24] has attributed this
peak to the presence of dipentaborate groups which result
from the incorporation of a second B04 tetrahedron into a
pentaborate group. (i.e.. this peak arises out of the
presence of groups containing two BO tetrahedra). For 4
still higher concentration of alkali oxide, loose diborate
and loose BO groups giving rise to a peak around 500 cm - 1 4
-1 . are also formed. The peak at 5 6 0 cm in the case of
alkali concentration of about 50 mol% has not been
conclusively assigned by Konijnendijk, though he
tentatively assigned the peak to isolated diborate groups.
The peaks at 630, 730, 8 2 0 and 9 4 0 cm-I in glasses
containing alkali oxide concentration between 4 0 and
50 mol% have been attributed to groups containing non-
4- bridging oxygen viz., pyroborate groups (B205) and
3- orthoborate units (B03) , ring type metaborate and chain
type metaborate groups from a comparative study of spectra
of these glasses with those of compounds containing these
groups[ll]. The presence of a peak at 760 cm-1 in the
spectra of glasses containing upto about 50 mol% of alkali
oxide is attributed to the presence of a significant
number of BO units, probably in diborate groups. 4

Recently the assignments of the peak centered at
755 cm-I by Konijnendijk[ll] has been questioned by Irion
et a1.[37]. ~rogh-Moe[46] and Matinez-Ribll et a1.[41]
studied the Raman spectra of zinc diborate and lithium
diborate which contain diborate groups, and observed no
-1 . peak at 755 cm in the spectrum of either material but
observed peaks around 1050, 980 cm-l for ZnO-2B203 and at
1035, 930 and 980 cm-l for Li20-2B203. It is now well
accepted that diborate groups are identified by the
-1 presence of a peak around 1100 cm [37,41-43,121.
In a very recent review Meera et a1.[12] have indicated
that only the simultaneous occurrence of peaks around 930,
770, 650 and 500 cm-l is a reliable indication of the
presence of pentaborate groups. Thus it appears that in
alkali borate glasses containing upto 25 mol% of alkali
oxide, boroxol rings are converted to pentaborate groups
and not to tetraborate or triborate groups[ll].
Raman spectra of binary borate glasses containing
alkaline-earth ions with general formula RO:B203 for
R=Ba, Ca, Sr, Mg and Pb have been reported[23,40,48,49].
In Raman spectra of 0.20 Ba0-0.80 B 0 the most prominant 2 3'
- 1 peak is the one at 775 cm and peak at 806 cm - 1 is
totally absent. This indicates that in this glass no
boroxol groups are present and all the BaO is used for the
formation of B04 units. It may be thought that the B04

tetrahedra are connected to each other, so that one Ba 2 +
ion can compensate for the negative charge of two B04
units close to one another[ll,l2]. It has been concluded
that it is reasonable to consider the borate network in
the 0.20 Ba0-0.80 B 0 glasses to be consisting primarily 2 3
of tetraborate groups[l2]. The peaks at 930, 650 and
485 cm-1 in the Raman spectra of this glass show the
existence of pentaborate groups. In Raman spectra of
binary glasses containing 30 mol% alkaline-earth (Ba, Ca,
- 1 Sr), the most prominent peak appears at around 755 cm
showing close similarity to the Raman spectra of alkali
borate glasses. However, in the Raman spectra of 30 mol%
barium and calcium borate glasses the high frequency band
a2pears to be more intense and occurs at a lower
- 1 frequency (1300 cm ) than in the alkali borate
glasses[l2]. Detailed study of the glass system x MgO-
(100-x) B 2 0 3 over its glass forming region has been
reported[40,121. The prominent peaks for different values
- 1 - 1 of x are at 806 cm and 785 cm for x > 44.4 mol$, and
785 cm-' and 690 cm-l for x=50 mo1%[12]. Raman studies of
binary borate glasses containing cations other than
alkaline earths have been reported in systems RO-B 0 with 2 3
R = Cd, Pb, Bi, Zn, Si and Ge[48,50,51,52,53,54]. In
cadmium borate glasses, the 806 cm-' peak due to boroxol
rings is present for glasses containing as much as 42.8
mol% CdO. Also the spectrum contains a peak centered

- 1 around 775 cm , which decreases in intensity and shifts
to lower frequency as the CdO content increases. The
simultaneous presence of peaks at 775, 945, 640 and
510 cm-' indicates the presence of pentaborate groups in
these glasses. The shift towards lower frequency of the
775 cm-l peak with increase in the concentration of CdO
shows the formation of dipentaborate groups. The band
- 1 around 1100 cm corresponding to the diborate groups is
present in the spectrum for the range of comp~sition from
33.3 mol% to 52.4 mol% of Cd0[48,12]. CdO is both a
network former and a network modifier. The slower
consumption of boroxol rings in cadmium borate glasses is
due to the formation of diborate groups (i.e., groups with
connected BO units) as well as due to incorporation of 4
CdO in the network as network former. An interesting
feature of the cadmium borate glasses is the presence of
- 1 the intense high frequency band centered around 1390 cm
which is assigned to B-0 vibrations occuring in large
borate network[12,48,55]. The high intensity of this band
suggests that the CdO is less capable (compared to alkali
and magnesium ions) of breaking the network into smaller
groups like pyroborate and orthoborate but results in the
formation of non-bridging oxygens connected to large
borate network[l2,48].

The Raman spectra of xZnO- (100-x) B203 for x between
50 and 65 mol% show no significant changes with increase
in the ZnO concentration[l2,51]. The spectra consists
only of broad bands and the nature of the spectra does not
improve on annealing the glasses[l2]. The Raman results
support the network forming tendency of ZnO but its role
in network modification is not clearly known[l2].
The replacement of an alkali oxide by another alkali
oxide in borate glasses is reported to cause a non linear
variation in their physical properties. This effect known
as mixed alkali effect has also been reported in the Raman
study of glasses[56]. The ratio of the intensity of the
-1 , 770 cm peak to that of 806 cm-' peak is observed to be
greater in the binary calcium borate glasses than in the
binary lithium borate glasses[56]. But, when LiZO is
replaced by Cs20, the intensity ratio I 770/~806
does not
vary linearly. For a given amount of total alkali content
a distinct minimum is observed in the 1770/1806
v s
CS O/(CS20 + Li20) behaviour. The result has been 2
explained on the basis of weak electrolyte mode1[57,581.
According to this model, mixed alkali effect is due to the
preferential formation of mixed alkali pairs resulting in
the formation of non-bridging oxygens. The formation
of non-bridging oxygens destroys the six membered rings
resulting in the decrease of 770 cm - 1 peak[12,561. The

Raman spectra of ternary glass system Ca0-Na20-B203 iS
reported to be similar to that of binary sodium borate
containing the same amount of B 0 [59]. But the behaviour 2 3
of Mg0-Na20-B 0 glass is reported to be different[40,59]. 2 3
Another important glass system reported to have been
studied using Raman spectroscopy in ternary systems
containing A1 0 2 3' The effect of incorporation of A1203 in
alkali and alkaline-earth borate glasses has been
investigated by many workers[ll,601. In glasses of
composition 20 K20-80 B203, incorporation of A1203 of
concentration from 10 to 20 mo18 results in an increase of
the intensity of the 806 cm-I band and a decrease of the
-1 . peak at 770 cm in the Raman spectra. Addition of
20 mol% of A1 0 results in the disappearance of 770 cm - 1 2 3
peak. This indicates that the addition of A1203 leads to
a decrease in the number of BO tetrahedra, and boroxol 4
groups are formed again. A1203 is probably incorporated
in the structure as A10 units. The oxygens of Na 0 do 4 2
not convert B03 units to BO units but get used up for the 4
formation of A104 tetrahedra[ll,60]. However, no Raman
peaks corresponding to A104 tetrahedra are observed in the
Raman spectra[ll,60]. Similar results have also been
reported for Mg0.A1203.B203 glasses[ll]. Raman studies of
ternary alkali borosilicate and borogermanate glasses have
also been reported [11,61,62].
Raman spectra of quarternary glasses have not been
extensively studied. The latest review of Raman studies
of borate glasses does not indicate such studies on
quarternary glasses.
5.3. Work Undertaken in the Present Study
The author reports the study of Raman spectra of the
quarternary glass systems Na 0-CaO-B 0 -A1203 and Fe203- 2 2 3
CaO-B 0 -A1203 2 3 in this chapter. It was found that the
Raman scattering is poor in the Ca0-B203-A1 0 -Fe 0 2 3 2 3
glass system. The effects on the Raman bands of the
variations in the concentrations of Na20, CaO, A1203 and
Fe203 were investigated. For comparison,the laser Raman
spectrum of cabal glass CaO-B 0 -A1203 had also been 2 3
recorded. The band corresponding to the boroxol units at
- 1 806 cm [11,12] is absent in the spectra of the glass
system Ca0-B203-A1 0 -Na 0 2 3 2 while weak scattering
corresponding to this band is present in some of the
spectra of the glass system CaO-B 0 -A1 0 -Fe 0 2 3 2 3 2 3 - But
peaks corresponding to other borate groups viz.,
pentaborate, diborate, etc. are present in all the
spectra.
5.4. Experimental Details
The procedure for the preparation of the samples are
described in Section 3.7 of Chapter 3. Glass samples of
thickness about: 1 m were chosen for the Raman studies.
The spectra were recorded at room temperature in the
stokes region using Dilor Z 24 Raman spectrometer using
the 488 nm line of the A=+ laser as the exciting
radiation and with a power of about 70 mW incident on the
samples. The scattered radiation was measured at an angle
of 90° from the incident laser beam.
5.5. Results and Discussion
The laser Raman spectrum of the cabal glass CaO-B203
A1203 and the spectra of the glass systems Ca0-B203-A1203-
Na20 and CaO-B 2 3 0 -A1 2 3 0 -Fe203 for different concentrations
of the components are shown in figure 5.1 to 5.13. The
spectra of the different systems of glasses are discussed
in the following sections.
(i) Ca0-B203-A1203 (cabal) glass system
The laser Raman spectrum of the cabal glass system
for a typical composition of 20Ca0-65B 0 -15A1203 is shown 2 3
in figure 5.1. The most prominent feature of the spectrum
-1 is the broad band centered around 795 cm . It has been
reported[11,20,21,29] that the most prominent feature of
the Raman spectrum of vitreous B 0 is a sharp band 2 3
centered around 806 cm-1 and that when an alkali oxide is
added to B203, the intensity of the peak at 806 cm-1
- 1 decreases and another peak develops at 770 cm . The
806 cm-I peak disappears for alkali oxide concentration of
about 20 mol%. The 806 cm-l peak has been assigned to
boroxol rings by Bril et a1.[24] and others[ll,l2]. In
the present study the peak at 795 cm-1 which is close to
- 1 806 cn may be assigned to boroxol rings. Konijnendijk
had assigned at 770 cm-l to tetraborate groups formed at
the expense of boroxol rings. But the assign ment of the
770 crn-I peak to tetraborate groups has been indicated to
be ambiguous by Meera et a1.[12]. These authors have
pointed out that both triborate and tetraborate groups
give rise to the 770 cm-I band and a weak band at 930crn-I
but no band in the 660 crn-1 -1 region. Hence the 770 cm
band alone cannot be taken to indicate the presence of a
particular groups. Meera et a1.[12] has also indicated
that the simultaneous occurance of peaks around 930, 770,
650 and 500cm-I is a reliable proof of the presence of
sentaborate group. In the present study, the band around
-1 940 Cm-l, 480cm-1 and the shoulder around 770cm together
-1 with noticeable scattering around 650 cm may be
attributed to pentaborate groups. From the prominance of

-1 . the peak at 795 cm it may be inferred that the structure
of the glass is made up of a continuous random network of
boroxol rings . It may also be inferred that the boroxol
rings have started transformation into pentaborate group
at the composition 20Ca0-65B 0 -15A1203. 2 3 ~ r f i [241 had
-1 shown that a peak around 500 cm corresponds to loose
diborate and loose B04 groups. In figure 5.1 the broad
-1 peak centered around 480 cm which is close to 500 cm -1
may be considered to be an indication of these groups.
The peaks around 1100cm-~ may be attributed to diborate
groups in conparison with reported results[12,37,41-431.
The band centered around 1436 cm-I may be assigned to
B-0 vibrations occuring in large borate network in
comparison with the band around 1390 cm-l in cadmium
borate[52,59] and other borate glasses[l2]. It has been
reported that Raman spectra of binary borate glass system
RO:B203 (R= Ba,Ca,Sr) containing about 30 mol% of RO, are
dominated by a band at 755 cn-1 due to dipentaborate
qrouss. In the present study even though the combined
concentration of CaO and A1203 exceeds 30 mol%, there is
no identifiable band but only a weak scattering around
755 cra - 1 indicating the lack of a large percentage of
dipentaborate groups.
In comparison with the reported spectra of binary and
ternary glasses[ll,l2], it nay be concluded that the

structure of the cabal glass with composition 20Ca0-
65B 0 -15A1203 consists mainly of a continuous random 2 3
network of boroxol rings. Small percentages of pentaborate
and diborate groups and loose diborate and loose B04
groups are also present in the glass. The broad peak of
- 1 appreciable intensity around 1436 cm is a strong
indication of continuous random network. The addition of
CaO and A1203 (total concentration 35 mol%) does not
break the network into smaller groups like pyroborate and
orthoborate. This factor may be considered to be
contributing to the large intensity of the 795 cm-l peak
(which is closed to 806 cm-l) in the present study.
(ii) Ca0-B203-A1 0 -Na 0 glass system 2 3 2
(a) Variation of concentration of Na 0 2
The Raman spectra of the quartenary glass system
CaO-B 0 -A1203-Na20 for two different concentrations of 2 3
Na20 (15 and 24 111018) are given in figure 5.2 and 5.3. The
most prominent peak in the spectrum for lower concentration
of Ma20 is a broad and intense peak centered around
783 cm-I where as this peak around 778 cm -1 has much
lower intensity in the spectrumof the glass with higher
concentration of Na20. In the present study it may be
inferred that the glass of composition 10Ca0-60B203-
15A1203-15Na20 is mainly built up of tetraborate groups
and as the concentration of Na 0 is increased to 24 mol%, 2
the tetraborate groups convert to diborate groups. The
- 1 much reduced intensity of the 778 cm band in the
spectrum for larger concentration of Na20 (figure 5.3)
clearly shows that the glass is not made up of mainly
tetraborate groups.
Meera et a1.[12] have reported that the presence of
pentaborate groups may be concluded from the simultaneous
occurance band at 770, 930 and 616 cm-l along with the
-1 considerable scattering in the 500 cm region. In
figure 5.2 the shoulder around 770 cm-l, in the band
centered around 915 cm-' (close to 930cm-I) and the weak
band at 673 (close to 666) cm-I along with considerable
scattering around 481 cm-I may be considered to be an
indication of pentaborate groups. In figure 5.3 the
- 1 scattering in the region 472 cm is the most prominent
feature of the spectrum and this along with appreciable
-1 scattering around 770 cm and 670 cm-1 and the band
-1 centered around 918 cm may be interpreted as an
indication of the predominance of pentaborate group in the
structure of the glass containing larger mol% of
Na20 (24 mol%). In comparison with the reported
results[l6,17] the weak bands around 1000 cm-I in
figure 5.2 and that around 1040 cm-' in figure 5.3 may be
assigned to diborate group which night have resulted from

the conversion of a few tetraborate group to diborate
group. The bands around 481 cm-I in figure 5.2 and
472 cm-1 in figure 5.3 when interpreted independently
(from the band at 783, 915 and 673) leads to the
conclusion that the glass system with the lower (15 mol%)
as well as higher (24 mol%) Na 0 concentration contain 2
loose diborate group and loose B04. The high frequency
band around 1443 cm-I -1 for lower and around 1436 cm for
higher concentration Na 0 indicate the presence of B-0 2
vibrations occuring in a large borate network[ll,l21. The
lower intensity of the high frequency band shows that at
higher concentration (24 mol%) of Na20 smaller groups
such as pyroborate and orthoborate are predominently
present in the structure of the glass.
Comparing figure 5.2 and 5.3 with figure 5.1 it may
seen that the addition of a fourth component (Na20 in
this case) does not affect the structure of the glass to
a great extent.
(b) Variation of concentration of CaO
The spectra for the glass system CaO-B 0 -A1203-Na20 2 3
containing two differnt concentrations of CaO are given in
figure 5.4 and 5.5. For lower CaO content (5 mol%) the
most prominant feature of the spectrum (figure 5.5) is a

narrow band around 798 cm-l. This band is very close to
band corresponding to the boroxol rings ( 806 cm-l) and
hence indicates the predominance of the boroxol rings in
the structure of glass. A band around 770 cm-1 also
appears as a shoulder on the low frequency side of the
798 cm-I band indicating that other groups have started
to develop at the expense of boroxol groups. The
- 1 simultaneous presence of shoulder around 770 cm , the
bands around 458 and 650 cm-1 and the weak band around
900 cm-I is an indication of a small percentage of
pentaborate group. The broad peak around 485 cm - 1
indicates the presence of diborate and loose B04
groups[l7]. The band around 1460 cm-I must be due to
delocalized B-0 stretches[l7]. The presence of the weak
band 650 cm-I indicates ring type metaborate groups.
When the concentration of CaO in the glass system is
increased to 15 mol%, conspicuously different features
develop in the spectrum. The most prominent peak is
around 770 cm-1 -1 while there is no peak around 800 cm . Another conspicuous feature of figure 5.5 in comparison
with figure 5.4 is the existence of broad, somewhat
-1 intense peak around 910 cm . The strongest peak at
773 cm-I - 1 together with the peaks around 910 and 473 cm ,
and weak band around 650 cm-1 may be attributed to
pentaborate groups. This clearly shows that as the

concentration of CaO is increased, the boroxol rings
convert into pentaborate group and at a concentration
c 15 mol% of CaO all the boroxol rings have undergone this
transformation. From a comparison of figure 5.4 and
figure 5.5, it may be noted that the features representing
pentaborate groups are stronger for larger concentration
of CaO (figure 5.5) than for smaller concentration
(figure 5.4) which indicates that at larger concentration
of CaO, there is a larger concentration of pentaborate
groups. The peak around 473 cm-l is an indication of the
existence of loose borate and loose BO group[l2]. 4 The
larger intensity of the high frequency peak around
1460 cm-I at higher CaO concentration (figure 5.5) shows
the 8-0 vibrations occuring in a large borate network and
leads to the inference that large concentration of CaO
helps in maintaining the network without breaking into
smaller groups.
( c ) Variation of concentration of A1203
The main features of the spectrum of the glass system
for lower concentration of A1 0 (figure 5.6) are a narrow 2 3
strong peak around 765 cm-l and a broad strong peak
- 1 centerrd around 1473 cm-l. The peak around 765 cm may be
considered to be close to 770 cm-l. The strong band at
- 1 -1 765 cm tosether with bands around 950 and 650 cm , and

-1 the weak band around 500 cm may be attributed to
pentaborate groups. The complete absence of a band around
806 cn-I indicates that complete transformation boroxel
rings into other groups like pentaborate groups has taken
place. It has heen reported that in the case of alkali
borate glasses, the 806 cm-I band completely disappears
at about 25 mol% concentration of alkali oxide. In the
- 1 present case the complete disappearance 806 cm band at a
concentration 5 mol% A1203 in the glass system 10 CaO-
5A1 0 -65B 0 -20Na 0 may be considered to be in agreement 2 3 2 3 2
with the above result con sidering the fact that the
total mol% of additives (35 mol%) to B203 exceeds 25.
Also the broad but strong band around 1473 cm -' is an
indication of the predominance of B-0 vibrations in the
network which also shows that the network is maintained
without breaking into smaller group.
The spectrum (figure 5.7) for larger concentration
A1203 (20 mol$) in the glass system 10 Ca0-50 B 0 - 2 3
20Al 0 -20Na20 appears very much different from that for 2 3
lower concentration of A1 0 (figure 5.6) the strong and 2 3
somewhat sharp band at 772 cm-l is the prominant feature
of the spectrum. The strong bands centered around
466 cm-l, around 950 cm -1 and the strongest band at
-1 -1 772 Cn , and the scattering around 650 cm which
appears as a shoulder on the low frequency side of the
band at 772 cm-l, may be attributed to pentaborate groups.

The prominance of all these bands indicates the strong
concentration of pentaborate groups in the spectrum. The
strong, broad band around 1420 cm-I is assigned to B-0
vibrations occuring in large borate network. The strong
-1 band around 465 cm also indicates the presence of loose
diborate and loose BO groups. Thus comparing figures 5.6 4
and 5.7 with the spectrum cabal glass (figure 5.1) it is
seen that in the glass system containing A1203 total
conversion of boroxol groups into pentaborate groups has
taken place. In addition it may be inferred that the
borate network is maintained without breaking into smaller
groups like pyroborate and orthoborate groups in the glass
system containg A1 0 2 3 '
(iii) CaO-B 0 -A1 0 -Fe o glass system 2 3 2 3 2 3
In the Raman scattering experiments it was found
that the scattering of glasses containing Fe 0 is very 2 3
poor. Hence Raman spectra of glasses containing only low
concentration of Fe 0 had been recorded in the present 2 3
study.
(a) Variation of concentration of Fe 0 2 3
The laser Raman spectra of the glass system CaO-B o - 2 3
A1 0 -Fe203 for two different concentration of Fe203 are 2 3

given in figure 5.8 and 5.9. The spectrum of the samples
for lower concentration (2 mol%) of Fe 0 2 3
(figure 5.8)
consists of bands around 795, 442 and 1305 cm-l. Also weak
scattering is present in the regions around 650 and
- 1 -1 900 cm . The band around 795 cm which is close to the
- 1 band corresponding to boroxol ring (806 cm ) indicates
the predominance of boroxol rings in the structure of the
glass. The somewhat strong and broad band around 442 cm -1
indicates the presence of loose diborate and loose B04
groups. The broad band around 1305 cm-' may be assigned to
delocalized B-0 stretches occuring in large borate
- 1 network. The shoulder around 770 cm and the band around
442 cm-I together with weak scattering around 650 and
- 1 950 crn may be considered asthe proof of the presence of
a small concentration of pentaborate groups in the glass
structure. From the presence of bands around 795 and
1305 cm-1 it may be inferred that the structure of the
glass conslsts of continuous random network of boroxol
rings[ll,l2].
For larger concentration of Fe 0 the scattering was 2 3
found to be very weak. In the spectrum in figure 5.9 the
peak around 795 cm-l has almost disappeared and a new,
very weak peak around 770 cm-' has appeared. Also there
is a weak scattering around 450 cm -1 indicating the
presence of loose diborate and loose B04 groups. Even

though the scattering is poor for the entire range
scanned, the peak showing the characteristic band of a
continuous random network shows up clearly around
1421 cm-l.
(b) Variation of concentration of CaO
The effects of variation of concentration of CaO on
the laser Raman spectra of CaO-B 0 -A1 0 -Fe 0 are shown 2 3 2 3 2 3
in figure 5.10 and 5.11. For lower concentration
(15 mol%) of CaO, the prominent bands are around 801 and
690 cmW1 (figure 5.10). In addition, there is a broad
band around 1325 cm-l. The line around 801 cm-l is very
close to the band corresponding to the boroxol rings and
hence this band indicates the presence of boroxol rings in
the glass. The band around 690 cm-I which is more
- 1 intense than that around 801 cm has to be assigned to
either ring type metaborate (usually around 630 cm-l) or
chain type metaborate (usually around 730 cm-l) which are
observed in binary alkali borate glasses[l7]. Since the
simultaneous occurrence of bands around 930, 770, 650 and
- 1 500 cm alone is a reliable indication of the presence of
the pentaborate groups, the band around 690 cm-l which is
- 1 close to 650 cm cannot be assigned to pentaborate
e cjroups. The broad band cent,red around 1325 cm-1 is
assigned to the delocalized B-0 stretching.

When the concentration of CaO is increased to 24 mol%
noticeable changes occur in the Raman spectra
(figure 5.11). There is a band of appreciable intensity
(though not the most prominent band) around 803 cm-I
indicating the presence of boroxol rings. There is no band
-1 around 700 cm but there exists a band around 532 cm -1
which may be assigned to loose B04 and loose diborate
groups (metaborate groups are not present in this glass
containing larger mol% of CaO). The band around 972 cm-I
nay be considered to be close 1110 cm-1 indicating the
presence of diborate groups. There is also a band around
- 1 1230 cm . From these observations it may be inferred that the variation of CaO does not affect the structure of this
glass which consists of random network of boroxol rings.
(c) Variation of concentration of A1 0 2 3
The effect of variation of A1 0 on the Raman spectra 2 3
of CaO-B 0 -A1 0 -Fe 0 2 3 2 3 2 3 glasses for two different
concentrations of A1 0 are shown in figure 5.12 and 5.13. 2 3
The spectrum of the glass containing lower concentration
(3 mol%) of A1203 shows peaks around 775, 455 and
- 1 1321 cn . Also there is weak scattering around 950 and
-1 -1 . 650 cn . The absence of the 806 cm is an indication of
total conversion of boroxol rings into other groups. The
-1 peak around 775 cm-' (which is close to 770 cm , and
455 cmcl together with weak scattering around 650 and
950 cm-I may be attributed to pentaborate groups. The band
around 455 cm-1 alone is an indication of the presence of
loose BO and loose diborate groups. The prominent peaks 4
around 1321 cm-I is characteristic of a continous random
network.
The spectrum corresponding to the larger
concentration of A1 0 (figure 5.13) is almost similar to 2 3
that in figure 5.12 except that an additional weak peak
- 1 appears around 1034 cm which may be assigned to diborate
- 1 yrou~s[l2]. The band around 777 cm which is close to
-1 - 1 770 cm together with the band around 475 cm and weak
- 1 -1 scattering around 680 cm and 900 cm may be considered
- 1 as an indication of pentaborate groups. The 806 cm peak
is absent in figure 5.13 also showing the non-existence of
- 1 boroxol rings. The peak around 475 cm shows the presence
of loose diborate and loose BO groups as in the case of 4
glass containins lower concentration of A1203. The
evidence for the structure of the glass to be made up of
a continuous ra~dom network is given by the existence of
prominent band around 1332 cm-l. It has been reported in
the case of ternary glasses containing A1203 that addition
- 1 of A1203 to binary alkali borate glasses causes 806 cm
peak to recur. But in the present study it is seen that
-1 the 806 cm peak corresponding to boroxol rings does

not appear even in the glass system of composition 20Ca0-
66B 0 -9A1203-5Fe 0 2 3 2 3'
(iv) General discussion
The laser Raman spectrum of cabal glass 20Ca0-65B203-
15A1203, and the spectra of the quarternary glass
systems Na 0-CaO- B 0 -A1 0 2 2 3 2 3 and Fe 0 -Ca0-B203-A1203
2 3
for different concentrations of the constituents have been
recorded. The spectra have been discussed in the light of
the Krogh-Moe hypothesis and in comparison with the
spectra of reported binary and ternary glass systems. The
structure of vitreous B 0 is a continuous random network 2 3
of boroxol rings. It is seen that in cabal glass
consisting of CaO, B 0 and A1203, the structure is mainly 2 3
built up of random network of boroxol rings, but the
addition of CaO and A1203 to B203 has caused. some
percentage of boroxol rings transform mainly to
pentaborate groups and to a fewer number of other groups
like diborate groups, loose diborate and loose BO groups. 4
The addition of a fourth oxide, Ma2O, is seen to
affect the structure of the ternary cabal glass very much.
Smaller concentration (15 mol%) of Na20 is found to cause
a convertion of boroxol rings to pentaborate groups while
a larger concentration (24 mol%) causes almost complete
conversion of the boroxol groups to pentaborate groups and
a fewer number of other groups like diborate, loose
diborate and loose B04 groups. The variation of
concentration of CaO in the quarter nary glass system Na 0 2
-CaO-B 0 -A1 0 is found to have a profound influence on 2 3 2 3
the structure of the glass. When the concentration of CaO
is small ( 5 mol%) the structure is found to be mainly
built up of boroxol groups while at a larger concentration
(15 mol%) boroxol groups have completely converted into
pentaborate groups. The change in the concentration of
A1203 in the glass is also found to influence the
structure of the glass. At lower concentration of A1203
( 5 nol%) the glass structure is found to consist of
mainly pentaborate groups along with appreciable number of
other groups. The scattering of this glass sample is
found to be weak and not to indicate the predominance of a
particular group. But at higher concentration (20 mol%)
of A1203, the spectrum clearly indicates the large
concentration of pentaborate groups in the structure of
the glass.
The spectra of all the glass samples containing
different concentrations of Na20, CaO and A1203 exhibit
clearly the band characteristic of a random network of
the glass.

The addition of Fe203 as the fourth component to the
ternary cabal glass CaO-B O -A1203 badly affects the 2 3
quality of the Raman spectra. The scattering is very poor
for all the samples analysed. At low concentration
( 2 mol%) of Fe203 the structure is found to be mainly
built up of boroxol rings and a fewer number of
pentaborate groups. But as the concentration of Fe203
is increased to 9 mol% the scattering is very poor and the
features of the spectrum indicate that pentaborate groups
are the main constituents of the glass structure. The
variation of concentration of CaO is found not to have
much effect on the structure; the indications from the
spectra point to the predominance of boroxol rings along
with fewer number of other gjroups. The variation of
concentration of A1203 also does not affect the structure
drastically but larger concentration of A1203 is found to
improve the quality of the Raman spectrum. It is found
that the structure of the glass is not altered by the
variation in the concentration of A1 0 and that the 2 3
structure is mainly built-up of pentaborate groups along
with a smaller nxnber of diborate groups, loose diborate
and loose B04 groups. The band characteristic of the
random network of the glass is predominantly present in
the spectra of all the glass samples analysed.

Figure 5.1 Laser Raman Spectrum of 20Ca0-65B203-15A1203 glass
Figure 5.2 Laser Raman Spectrum of 10Ca0-60B203-15Al 0 -15Na20
glass 2 3

Figure 5 - 3 Laser Raman spectrum of 10ca0-51~ o - 1 5 ~ 1 ~ 0 ~ - 2 4 N a ~ o 2 3
glass
Figure 5.4 Laser Raman Spectrum of 5CaO-658 0 -15Al 0 -1SNa20 glass 2 3 2 3

2 -
E 2 4 4 4 p. 0 0
0 W W
1500 1000 500 WAVE NUMBER ( C d )
Figure 5.5 Laser Raman Spectrum of 15Ca0-55B 2 0 3 -15A1203-15Na20
glass
1500 1OOO 500
WAVE NUMBER (C*' )
Figure 5.6 Laser Raman Spectrum of 10Ca0-65B203-5A1 2 0 3 -20Na20 glass

Figure 5.7 L a s e r Raman Spec t rum of 10Ca0-50B203-20A1203-20Na2~ g l a s s
F i g u r e 5.8 L a s e r Raman Spec t rum of 20Ca0-68B 0 -10A1 0 -2FeZOj g l a s s 2 3 2 3
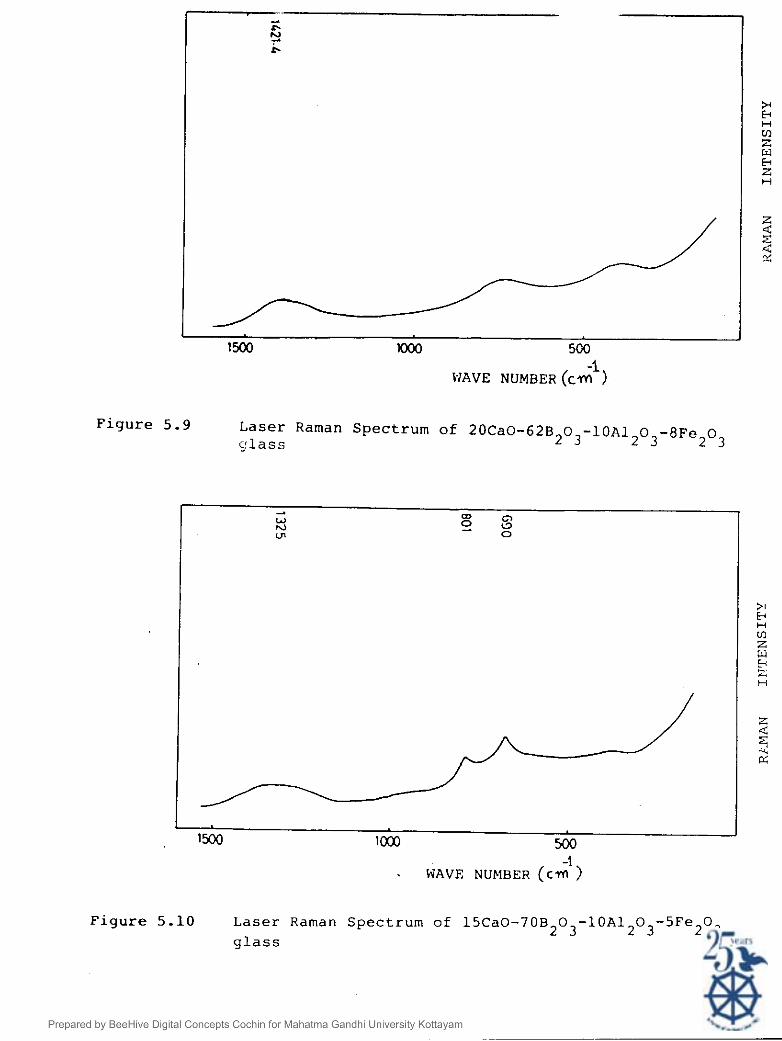
Figure 5.9 Laser Raman Spectrum of 20Ca0-62B 0 -10A1 0 -8Fe203 ylass 2 3 2 3
&
L. N - t.
1500 .
X)o 500
-1 , WAVE NUMBER (cm )
* E- H m Z W b Z H
z 4 x d a
Figure 5.10 Laser Raman Spectrum of 15Ca0-70B 0 -10A1 0 -5Fe203 2 3 2 3 glass
-1 WAVE NUMBER ( ~ 7 n )

Figure 5.11 Laser Raman Spectrum of 2 4 ~ a 0 - 6 1 ~ ~ 0 ~ - 1 0 A 1 ~ 0 ~ - 5 F e ~ O ~
glass
Figure 5.12 Laser Rarnan Spectrum of 20Ca0-728 0 - 3 A 1 0 -5Fe203 2 3 2 3
glass

Figure 5.13 Laser Raman Spectrum of 20Ca0-66B 0 -9A1 0 -5Fe20 glass
2 3 2 3
9 3 I. -4
I. m 3
Is00 loo0
>I H H LI] Z W H Z H
Z
2 x
500 I
WAVE NUMBER (CTI I ' )

5.6. Conclusion
The laser Raman spectrum of the ternary cabal glass
CaO-B 0 -A1 0 and the quarternary glass systems CaO-B 0 - 2 3 2 3 2 3
A 1 0 -Na20 and CaO-B 0 -A1 0 -Fe203 2 3 2 3 2 3 have been recorded.
The spectra have been discussed in the light of reported
spectra of binary and ternary glasses. It is found that
the addition of alkali and other oxides to B 0 2 3
results
in the transformation of boroxol groups, which are the
basic structural units in vitreous B 0 into polyborate 2 3'
groups. The Raman spectra of all the glass samples
analysed in the present study indicate the random nature
of the network of the glass. It is found that Raman
spectroscopy can be effectively made use of in identifying
the structural groups present in the glass.
Reference
1. Sakka S., Kozuka H., Fukumi K. and Miyaji F., J. Non-Cryst. Solids, 123, 176 (1990).
2. Meera B.N., Sood A.K., Chandrabhas N. and Ramakrishna J., J. Non-Cryst. Solids, 126, 224 (1990).
3. Harris I.A., Jnr. and Bray P.J., Phys. and Chem. Glasses, 25, 69 (1984).
4. Govinda Rao, Band Rao K.J, J. Chem. Soc., Faraday Trans., 84(6) 1773 (1988).
5. Prabhakar S., Rao K.J. and Rao C.N.R., Proc. R. Soc. Lond. , 429, 1 (1990).
6. Galeener F.L. and Geissberg, J. de Phys., 43, 343 (1982).
7. Daisuke Katto., J. Appl. Phys., 47, 5344 (1976).
8. Shibatta N.,Horighghi M. and Eadachir, J. Non-Cryst. Solids, 45, 115 (1981).
9. Gan Fuxi, Acta. Optica Sinica, 4, 339 (1984).
10. Chen H., Huang G., Mao H. and Gan F., J. Non-Cryst. Solids, 80, 152 (1986).
11. Konijnendijk W.C. and Stevels J.M., J. Non-Cryst. Solids, 18, 307 (1975).
12. Meera B.N. and Ramakrishna J., J. Non-Cryst. Solids 159, 1 (1993).
13. Maroni V.A. and Cairus E.J., J. Chem. Phys., 52, 4915 (1970).
14. Shcker R. and Ganon R.W., Phys. Rev. Lett., 25 222 (1970).
15. Gaskell P.H., Trans. Faraday Soc., 62 (1966) 1493.
16. Zachariasen W . H . , J. Amer. Chem. Soc., 54, 3841 (1932).
17. Elliot S.R., Physics of Amorphous Platerials (Longman, New York) 1984.
18. Krogh-Moe J., ~hys. Chem. Glasses, 3, 101 (1962).

Kujumjelis J., Z. Phys., 100, 221 (1936).
Goubeau J. and Keller H., 2. Anorg. Chem., 272, 363 (1953).
Krogh-Moe J., Phys. Chem. Glasses, 6, 46 (1965).
Krishnan R.S., Indian J. Pure. Appl. Phys., 9, 916 (1971).
~onijnendijk W.L., Philips Res. Rep. Suppl., No.1, 243 (1975).
Bril T.W., Philips Res. Rep. Suppl., No.2, 111 (1976).
Galeener F.L., Mikkelsen J.C. Jr., Geils R.H. and ~ o s b y W.J, Appl. Phys. Lett., 32, 34 (1978).
Konijnendijk W.L. and Stevels J.M., Borate Glasses - Structure, Properties and Applications (Plenum, New York) 259 (1978).
Furukatra T. and White W.B., Phys. Chem. Glasses, 21, 85 (1980).
Walrafen G.E., Samanta S.R. and Krishnan P.N., J. Chem. Phys., 72, 113 (1980).
Galeener F.L., Lucovsky G. and Mikkelsen J.C. Jr., Phys. Rev., B 22, 3983 (1980).
Windisch C.F. Jr. and Risen W.M. Jr., J. Non-Cryst. Solids, 48, 307 (1982).
Mozzi R.L. and Warren B.E., J. Appl. Cryst., 3, 251 (1970).
Parsons J.L., J. Chem. Phys., 33, 1860 (1960).
Kristiansen L.A. and Krogh-Moe J., Phys. Chem. Glasses, 9, 96 (1968).
Bronswijk J.P. and Strijks E., J. Non-Cryst. Solids. 24, 145 (1977).
Gurr G.E., Montgomery P.W., Knutspm C.D. and Gorres B.T., Acta. Cryst., B 26, 906 (1970).
White W.B., Brawer S.A., Furukawa T., and Mc Carthy G.J., Borate Glasses - Structures, Properties and Applications (Plenum, New York) 281 (1978).

Irion M.M., Couzi A., Levasseur, Reau J.M., and Borethous J.C., J. Solid State Chem., 31, 285 (1980).
Lorosch J., Couzi M., Pelous J., Vacher R., and Levasseur A., J. Non-Cryst. Solids, 69, 1 (19841).
Kamitsos E.I., Karakassides M.A. and Chryssikos G.D., J. Phys. Chem., 90, 4528 (1986).
Kamitsos E.I., Karakassides M.A. and Chryssikas G.D., J. Phys. Chem. 91, 1073 (1987).
Kamitsos E.I., Karakassides M.A., and Chryssikos G.D., Phys. Chem. Glasses, 28, 203 (1987).
Kamitsos E.I. and ~arakassides M.A., Phys. Chem. Glasses, 30, 19 (1989).
Kamitsos E.I., Karakassides M.A. and Chryssikos G.D., Phys. Chem. Glasses, 30, 229 (1989).
Krogh-Moe J., Phys. Chem. Glasses, 3, 208 (1962).
Rhee C. and Bray P.J., Phys. Chem. Glasses, 12, 165 (1971).
Krogh-Moe J., Acta. Cryst., B 24, 179 (1968).
Martinez-Ripou M., Martinez-Carreram S. and Gareia- Blanco S., Acta. Cryst., B 27, 672 (1970).
Chryssikos G.D., Kamitsos E.I. and Risen W.M. Jr., J. Non-Cryst. Solids, 93, 155 (1987).
Komijnendijk W.L. and Ver Weij H., J. An. Ceram. SOC. 59, 193 (1976).
Meera B . N . , Sood A.K., Chandrabhas N. and Ramakrisha J., J. Non-Cryst. Solids, 126, 224 (1990).
55. Meeva B.N., Victor D., ~ u t h u S., Chandrabhas N., Sood A.K. and Ramakrisha J., J. Non-Cryst. Solids (Communicated).
56. Furukawa T. and White W.B., J. Am. Cram. Ere., 64, 443 (1981).
57. Goring R., Kuripp K. and Nass H., Phys. Stat. Solids A , 72, 623 (1982).
C h a k r a b o r t y I . N . a n d C h o u d r a l e R.A. S r . , J . Non- C r y s t . S o l i d s , 8 1 , 7 1 ( 1 9 8 6 ) .
Furukawa T. a n d W h i t e W.B., J . Mater. S c i . , 1 5 , 1 6 4 8 ( 1 9 8 0 ) .
Soppe W . , K l e e r e b e z e r n J. a n d Den H a r t o g H . W . , J. Non-Crys t . S o l i d s , 9 3 , 1 4 2 ( 1 9 8 7 ) .
bloyrnihan C.T. a n d L e s i k a r A . Y . , J. A m e r . C e r a n . SOC. 6 4 , 40 ( 1 9 8 1 ) .
J a i n H . J . , P e t e r s o n N.L., J . Amer. C e r a m . S o c . , 6 6 , 1 7 4 ( 1 9 8 2 ) .
~ o n i j n e n d i j k W.L., Phys . Chem. Glasses, 1 7 , 205 ( 1 9 7 6 1 .
Fukunaga J . a n d O t a R., J. Mon-Cryst . S o l i d s , 9 5 , 9 6 , 2 7 1 ( 1 9 8 7 ) .
Furukawand T. a n d W h i t e W.B., J. Mater. S c i . , 1 6 , 2686 ( 1 9 8 1 ) .
C h a k r a b o r t y I . N . a n d C o n d r a t e R.A. S r . , Commun. Am. Cerarn. S o c . , C-71 ( 1 9 8 3 ) .
CHAPTER 6
ULTRASONIC STUDIES ON Ca0-B203-A1203-Na20
AND Ca0-B203-AI2O3-Fe203 GLASS SYSTEMS

CHAPTER VI
ULTRASONIC STUDIES ON Ca0-B203-A1203-Na20 and
CaO-B 0 -A1203-Fe203 GLASS SYSTEMS 2 3
6.1. Introduction
There is an ever increasing interest in the
measurement of elastic properties of solids using
ultrasonic methods, due to their non-destructive nature.
Elastic and acoustical properties of glasses are
si9nificant from the point of view of their application in
special devicesli]. The main reason for extensive
ultrasonic investigations of solids is the need for
elastic properties of materials like crystals, alloys,
plastics, ceramics, glasses and so on in a variety of
applications. The development of electronic circuits has
resulted in a variety of techniques, ranging in precision
from a per cent to a hundredth of per cent under various
conditions of temperature and pressure. The older static
and dynamic methods of measuring elastic constants of
large samples have gained wide acceptance due to their
simplicity. Among the various newer techniques pulse echo
methods are useful where measurements of highest precision
are needed.

An ultrasonic investigation of solids will help to
understand various solid state phenomena such as grain and
domain boundary effects in metals, ferromagnetic and
ferroelectric materials, the diffusion of atoms, molecules
and vacancies through a solid, the motion of imperfection
such as dislocations as well as the interaction between
the lattice sound vibrations and free electrons in metals
at low temperatures. All these effects are studied by
measuring elastic properties, internal friction properties
and their change with temperature, frequency and applied
electric field[2-41.
The measurement of elastic constants of solids is of
considerable interest and significance to both science and
technology. This measurement yields valuable information
reqarding the forces operative between the atoms or ions
in a solid. Since the elastic properties describe the
mechanical behaviour of materials, this information is of
fundamental importance in interpreting and understanding
the nature of bonding in the solid state. When a material
is subjected to a stress it will get strained and within
the elastic limit stress applied on a material is directly
proportional to strain (Hooke's law). The proportionality
constant relating the stress and strain is the modulus of
elasticity or the elastic constant. Commonly there are
three types of elastic constants[5]. They are (i) Young's

modulus (Y) (ii) Bulk modulus ( K ) and (iii) Rigidity or
shear modulus ( G ) . The Young's modulus relates a
unidirectional stress to the resultant strain. It also
represents the resistance to traction along the axis of a
thin bar or rod. The Bulk modulus ( K ) provides a good
link between the macroscopic elasticity theory and the
atomistic view points such as lattice dynamics. Basically
'l- it relates the pressure with volume st,ain. The shear
modulus (G) shows the relation between shear stress and
shear strain. In addition to the above elastic constants
there is a longitudinal modulus (L ) determined from the
velocity of propagation of longitudinal waves through a
solid. The kinds and number of elastic constants for
non-isotropic solids like crystals have been discussed by
various workers like Huntinqton[6], Nye[7It
Bhagavantam[B], Hearmon[9,10], Federov[ll], Musgrave[l2]
and others, and the use of physical acoustics to study the
properties of solids has been discussed by Mason[13-151.
Amorphous materials like glasses exhibit some unique
properties which are not usually found in other
engineering materials. These materials lack the long-
ranye periodicity in the arrangement of atoms. The study
of the propagation and attenuation of waves in
c,lasses[16,17] is of special and vital significance due to
the observation of anomalous specific heat[l8] and thermal

conductivity at low temperature[l9]. The ever increasing
study of glasses is also due to their anomalous physical
properties apart from practical applications[2]. Inspite
of the immense use of ultrasonic techniques in
understanding the structure and properties of glasses only
a limited number of reports have appeared on such studies.
Ultrasonic studies on binary alkali oxide and other oxide
glasses have been reported. The studies of ternary
glasses are sparse, while on quarternary glasses are
almost totally lacking. A brief review of the latest
ultrasonic studies in binary and ternary glasses is given
in the following section.
6.2. Ultrasonic Investigations in Oxide Glasses - A Brief Review
The ever increasing interest in the investigation of
5lasses is motivated by their widespread practical
application and the fact that they exhibit a number of
anomalous physical properties, which suggest specific
structural singularities that differentiate the glassy
state of matter from the crystalline as well as the
ordinary amourphous state[21. So far, however, a unified
theory of the glassy state of matter has failed to emerge,
and so the specific structure of glasses continue to
be less than fully understood. These specific attributes

are extremely pronounced, in particular, in the acoustical
properties of glasses, primarily in the composition and
temperature dependence of the velocity and absorption of
ultrasonic waves[2,20]. For that reason a great many
publications have been devoted to the investigation of
glasses by ultrasonic methods. A brief review of the
earlier works on ultrasonic studies of inorganic glasses
is given in this section.
Reports on ultrasonics investigations on glasses up
to 1976 have been reviewed by Kul'bitskaya et a1.[20]
In 1985 Kodama[21] reported the elastic properties
of barium borate glasses. By making use of the ultrasonic
pulse echo overlap method, ultrasonic velocities in barium
borate glasses were measured at 298 K over the single
phase composition range. The results of the elastic
constant measurements of the glasses as a function of
composition were discussed with the help of the relation
wv2 2 2 = ( a Vm/ and ) which was derived from the
Sm finite elastic strain theory, where M is the molar mass, V
the velocity of the longitudinal or transverse wave, Urn per
the internal energy unit mole, nH the Lagranqean strain
component specifying the sound wave, and Sm the molar
entropy. Based on this relation, elastic internal
energies per unit mole of the glasses are determined as

functions of composition in relation to the behaviour of
N4r the fraction of boron atoms in tetrahedral
coordination.
Elastic constants and structure of the glass system
Co 0 -P 0 had been determined by Higazy et a1.[21] by the 3 4 2 5
ultrasonic techniques at 15 MHz. They found that Young's,
bulk, shear and longitudinal moduli and the Poisson ratio
are sensitive to the composition of the glass. From the
ultrasonic data obtained, it was found that the glass
system could be divided into three "compositional
regions". This behaviour had been qualitatively
interpreted in terms of the cobalt coordination, crosslink
densities, interatomic force constants and atomic ring
sizes. They also presented a full discussion of effects
of annealing on elastic properties of the cobalt phoskhab
glasses.
Ultrasonic sound velocities behaviour in silver
borate glasses were investigated by Carimi et a1.[23].
They studied the sound velocity of 5 MHz longitudinal and
transverse waves in silver iodide - silver borate glasses
and observed in the 77-430 K temperature range the
presence of dispersive effects, whose contribution
increased with the AgI content. These effects arise from
+ the thermally activated jumps of Ag ions, between nearly

equivalent positions available in the glassy network. The
whole behaviour was explained by the overlap of two
different mechanisms, the relaxational one and the one
coming out from the anharmonicity of the system. This
last effect implies, in a quasi-harmonic approximation, a
linear temperature dependence of the elastic constants in
all the explored ranges.
The velocity and absorption coefficient o f
longitudinal ultrasonic waves of frequency 5 and 10 MHz in
molten glassy Na 0-SiO K 0-SiO and PbO-SiO and molten 2 2' 2 2 2'
Na 0-B 0 and PbO-B 0 were measured by means of the 2 2 3 2 3
pulse-echo method at 300 to 1600 K by Kazuhira
Nagata et a1.[24]. They observed that the velocity of
sound decrease with increasing ternprature and decreased
rapidly near the transition temperature of the glass
system. The mean free path of phonons was also estimated
from the velocity of ultrasonic sound, thermal
conductivity, and specific heat capacity.
The temperature dependence of 15 MHz ultrasonic bulk
wave velocity in the range 4 to 600 K in Moo3-P205 glass
system was reported by Bridge et a1.[25] in 1987. They
concluded that a complete understanding of temperature
gradients of elastic moduli in glasses generally requires
the measurement of both acoustic wave velocity and wave
absorption as a function of temperature, so that the
relaxational contribution to the gradients can be computed
and substrated from the experimental gradients.
Damodaran et al.[26] reported the elastic properties
of lead containing MOO -P 0 glasses using ultrasonic 3 2 5
velocity measurements at 10 MHz. They observed that the
composition dependence of elastic moduli, Poisson's ratio
and the Debye temperature were consistant with a
structural model proposed by Selvaraj et a1.1271.
According to this model lead acts both as a network former
and as a network modifier in different composition
regimes. They suggested that the incorporation of lead
into the network is accompanied by the conversion of
three-connected tetrahedra into four-connected tetrahedra
in the network. Longitudinal and shear velocities were
found to decrease gradually as the concentration of PbO
increased. The results were interpreted with the help of
the structural model proposed by Selvaraj et a1.[27].
Ultrasonic studies and calculation of elastic and
thermodynamic properties of alkaline earth containing
silicate glasses were investigated by Batti et a1.[28].

They made an effort to test the model proposed by
Makishima and Mackenzie[29,30] for the direct calculation
of the Young's modulus of silicate glasses of different
compositions. Batti et a1.[31] also studied the
softening temperature and Debye temperature for the
alkaline earth silicate glasses.
They also reported[32] the attenuation and velocity
measurements of ultrasonic waves in strontium borate
glasses and their elastic properties. They observed a
variation of velocity, attenuation, longitudinal modulus
and coefficient of thermal expansion of the glasses with
the frequency of the ultrasonic waves.
Ultrasonic velocities in Vanadium-barium-borate
glasses were measured at 298 K by making use of the
ultrasonic pulse-echo technique at three frequencies by
Anand Pal Singh et a1.[33]. They calculated the molecular
weight, packing density, mean atomic volume and effective
number of atoms in these glass samples. They also
calculated the longitudinal modulus of elasticity,
internal friction and thermal expansion coefficient with
the help of the ultrasonic propagation velocity. They
observed that the values of ultrasonic velocity and the
dynamic modulus of elasticity exhibit considerable
variation at each frequency due to variation in structure
and composition of the glass. Values of longitudinal
modulus were found to increase with the B203 content and
with the frequency of the ultrasonic waves. The results
of ultrasonic, X-ray and infrared measurements on xBaO-
(0.9-x)B203-0.10Fe203 glasses have been reported recently
by Anand Pal Singh et a1.[34]. They have concluded that
introduction of Fe203 in the matrix of BaO-B 0 softens 2 3
the material and that Fe203 do not enter the boron-oxygen
network but, after dissociation into Fe3+ and 02-, sit in
cavities inside the structure.
Ultrasonic studies in sodium borate glasses were
reported by Sidkey et a1.[35] in 1990. They observed
that ultrasonic velocity increased as the sodium oxide
concentration was increased upto 27.2 mol%. A similar
trend was observed in the case of Young's, bulk and shear
moduli. The increase in velocity was attributed to the
increase in packing density due to a decrease of B203, and
therefore an increase in the B04 groups and consequently
occupation of the intersticies by the alkali ions. They
compared the experimental results with those calculated
theoretically from equation derived by Makishima and
Mackenzie[29,30]. They also studied the boron anomaly and
the results showed that this anomaly should appear at
concentrations of sodium oxide above 28 mol%.

Padake et a1.[36] investigated ultrasonic velocity,
and absorption in ZnO - B203 glasses at 2 MHz frequency
for different temperatures. They observed a peak in the
value of attenuation for all glasses and the velocity was
found to be decreasing with increase of temperature.
Experimental results were explained on the basis of
tunneling defect atom and the structural mechanism which
is totally responsible for the strong absorption in
glasses. Ultrasonic studies in binary zinc borate glasses
xZn0-(1-x) B203 were also reported by Singh et al. in
1992[371. They had calculated the elastic moduli of the
glasses and compared the results with those predicted by
P,lakishima-Machenzie mode1[29,30].
Temperature dependence of velocity of longitudinal
and transverse ultrasonic waves in V 0 -P 0 glass 2 5 2 5
system was investigated by Mukherjee et a1.[381. The
experimental results showed that unlike most of the
glasses having tetrahedrally coordinated structures, '2'5-
'2'5 glasses which contain both tetrahedral and octahedral
structures[39] do not indicate any minimum in the
variation of sound velocity with temperature but instead
show a steady decrease of velocity with a small negative
temperature coefficient.
Recently Kodama[40] reported ultrasonic velocity in
potassium borate glasses as a function of concentration of
K20. They observed a strong dependence of the ultrasonic
velocity on the concentration of K20.
The elastic properties of these glasses were analysed
in terms of the three structural units, on the assumption
that these structural units have their respective elastic
constants. They have shown that the elastic constants of
these structural units are defined on the basis of the
elastic internal energy due to deformation.
Ultrasonic velocity and elastic properties of the
ternary glass system Sr0-Ba0-B203 were reported very
recently by Anand Pal Singh et a1.[41]. They observed that
ultrasonic velocity and acoustic impedance in these
glasses increased with the concentration of strontium
oxide. The role of SrO and BaO (modifier) was shown to be
diametrically opposite to their role in silicate glasses.
The elastic moduli of these glasses were obtained making
use of Makishima and Mackenzie mode1[29,30].

6.3. Theory
The ultrasonic velocity in solids yields the
appropriate elastic modulus of the mode being propagated.
The relation can be expressed as
Where P is the density of the solid and M is the
apgropriate combination of the elastic moduli of the
solid. The combination depends on the mode of
propagation, and the mode in turn depends on the
interaction of the wave with the boundaries of the solid.
Since solids can sustain shearing strains elastically,
they will support the propagation of waves with transverse
as well as longitudinal particle motion. The moduli of
materials are influenced by many physical phenomena which
may in turn be studied by measuring the ultrasonic wave
velocities.
Within the elastic limit, majority of solids obey
Hooke's law which states that stress is directly
proportional to strain. Then,

Where p is the normal (tensile) stress and is the
strain. E is the moduli of elasticity. Similarly the
shear stress 1 is directly proportional to the shear
strain.
where G is the modulus of elasticity in shear. When a
sample is extended in tension, there is an accompanying
decrease in thickness; the ratio of the thickness
decrease to the length increase in the Poisson's ratio 6
where A d and ~l are the change in thickness and length,
and d and 1 are original thickness and length
respectively.
Poisson's ratio relates the Young's modulus and shear
modulus by the following equation.
This relationship is only applicable to an isotropic
body in which there is only one value for the elastic

constant independent of direction. Generally this
equation is a good approximation for glasses and for most
polycrystalline ceramic materials.
Under conditions of isotropic pressure the applied
pressure P is equivalent to a stress of -P in each
principal directions. In each principal direction, we
have a relative strain.
The relative volume change is given by
The Bulk modulus K defined as the isotropic pressure
divided by the relative volume change is given by
The elastic constants of the solids are calculated
from the measured densities and the velocities of
longitudinal (VL) and transverse (Vs) ultrasonic waves 5 ,
using the following expressions[$2].

Longitudinal modulus L = 2 "L ..... (6.9)
-~
Shear modulus G = P V s 2 ..... (6.10) Bulk modulus K = L - (4/3) G ..... (6.11)
1-2 (VS/VL) 2 Poisson's ratio 6 = -------------
2 ..... (6.12) 2-2 (VS/VL)
Young's modulus E = (1 +6 ) 2G ..... (6.13)
6.4. Work Undertaken in the Present Study
In the present study two systems of quarternary
glasses CaO-B 0 - A1203-~a 0 and CaO-E 0 -A1 0 -Fe 0 2 3 2 2 3 2 3 2 3
containing different concentrations of Ma20 and Fe203
respectively were prepared. Longitudinal and transverse
ultrasonic velocity in these glasses were determined using
ultrasonic pulse echo overlap technique. The elastic
moduli and Poisson's ratio with concentration of Na20 and
Fe 0 are discussed. 2 3
6.5. Experimental Details
Two systems of ylass samples 10Ca0-(75-x) B 0 -15 2 3
A1 0 -xNa 0, x varying from 15 to 24 mol% and 20 2 3 2
CaO-(70-y) B 0 - 10 A1203 - y Fe203, y varying from 2 to 2 3
8 mol% were prepared as described in Section 3620f
Chapter 3. Glass samples of thickness about 10 mm and
with smooth and parallel end faces were obtained.

Velocity of longitudinal and transverse ultrasonic waves
in the glass samples were determined using Matec 7700
ultrasonic velocity system and using respectively x cut
and y cut quartz transducers each of frequency 3 MHz. The
block diagram of the experimental set up (figure 2 . 5 ) and
the procedure for the measurement of the ultrasonic
velocity are described in detail in Section 2 . 5 of
Chapter 2 . The path length of the ultrasonic waves in the
glass samples were determined by measuring the thickness
of the glass samples using a micrometer. Longitudinal and
transverse ultrasonic velocity in the glass samples
containing different concentrations of Na 0 and Fe203 were 2
determined. The density of the glass samples were
measured making use of Archimede's principle and using
water as the immersion liquid.
6.6. Results and Discussions
Longitudinal ( V L ) and transverse ( V ) velocities of T *
ultrasonic waves of frequency 3 MHz in quarteAnary glass
systems CaO-B 0 -A1203-Ba20 and 2 3 CaO-B 0 -A1 0 -Fe203 2 3 2 3
containing different concentrations of Na20 and Fe203,
respectively, are given in table 6.1. The density of the
glass samples was found to increase with increase in the
concentration of Na 0 and Fe203. 2 It is seen from
figure 6.1 and 6.2 that both VL and VT increase almost

Table 6.1
Variation of ultrasonic velocities, Poisson's ratio and elastic moduli in CaO-B 0 -Al 0 -Na 0 (SS) with varying concentration of Na 0 and in CaO-B 0 -Al 0 -Fe 0 ?F$)
2 3 2 2
with varying concentration of P$ 3 2 3 2 3 2 3
Sample Longitudinal Transverse Dens'ty Poisson's Longitudinal Shear Bulk Young's f Name velocity velocity kg/m ratio modulus modulus modulus modulus
m/sec m/sc K bar K bar K bar K bar

Figure 6.1 Variation of longitudinal and transverse velocities in CaO-B 0 -A1 0 -Na 0 with varying concentrations20? N~;O! 2
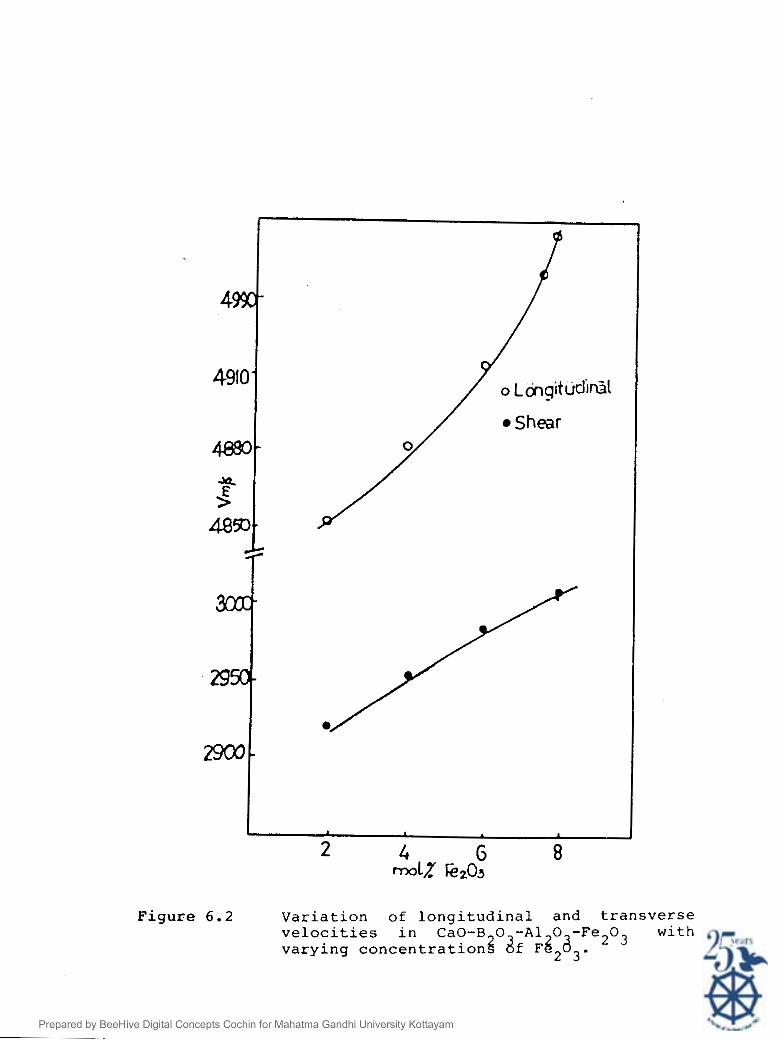
Figure 6.2 Variation of longitudinal and transverse velocities in CaO-B 0 -A1 0 -Fe203 with varying concentration$ df ~ 6 ~ d ~ .

regularly with the concentration of Na20 or Fe203. But
the rate of increase of V is greater than that of VT for L
both the glass systems investigated. The values of the
three elastic constants and the ~oisson's ratio evalu ated
usins expressions 6.9 to 6.13 are given in tables 6.1.
It is seen that for both the glass systems the modulii of
elasticity show almost a regular increase over the entire
variation of concentration of Na 0 and Fe 0 [figure 6.3 2 2 3
and 6.4). But the Poisson's ratio exhibit a reverse trend
(figure 6.5 and 6.6).
From X-ray diffraction studies by Biscoe and
Warren[43] had pointed out that as an alkali oxide is
added to B203, the coordination of boron which is 3 in
B203 changes to 4. It is known for some time that the
physical properties of binary borate - glasses display
unusual trends with change in their composition. This
behaviour known as "boron oxide anomaly", has been
investigated by many workers. Internal friction studies
of sodium borate glasses[44,45] showed that this anomaly
occurs at 15 mo18 of alkali oxide, while Abe screening
theoryL461 suggested the saturation of BO to occur at 4
16 mol%. But ultrasonic studies of Gladkov and
Tarasov[47] showed this anomaly to occur at 35 mol% Na20.

Figure 6.3 Variation of elastic constants in CaO-8 0 - iil 2 o 3 -Na20 with varying concentrations2 a t Na20.

Figure 6 . 4 Variation of elastic constants in CaO-B 0 - A1203-Fe203 with varying concentrations2 af Fe 0
2 3'

Figure 6.5 Variation of Poisson's ratio in CaO-B 0 - A 1 2 0 3 -Na20, with varying concentrations2 a f Na203.
Figure 6.6 Variation of Poisson's ratio in CaO-B 0 - A1203-Fe 0 with varying concentrations2 df Fe203. 2 3

Recent ultrasonic studies by Sidkey et a1.1351 on sodium
borate glasses have showed that both longitudinal and
transverse ultrasonic velocity in sodium borate glasses
and the elastic constants increased with concentration of
Na20 upto 27 mol%. The increase in ultrasonic velocity
has been attributed to an increase in packing density due
to the transformation of coordination of boron from 3 to 4
and consequent occupation of the intersticies by the
alkali ions. But once BO groups get saturated, non- 4
bridging oxygens start appearing producing a loose
structure. This phenomenon was not observed by
Sidkey et a1.[35] upto a concentration of 28 mol% of Na20.
In these studies Poisson's ratio was found to increase
with increase in Na 0 concentration. They pointed out 2
that addition of Na 0 changes the coordination of boron 2
from three to four making the glass strong and rendering
maximum rigidity. KodamaI401 have measured the elastic
properties of potassium borate glasses as a function of
concentration of K 0 and analysed the elastic properties 2
in terms of the three structural units represented by Bg3,
+ X+B g26 and K B o4 , where P) represents a bridging
- oxysen and 0 a non-bridging oxygen, on the assumption
that the three structural units have their respective
elastic constants. It was shown numerically that the
structural unit B B 4 increases the rigidity of the glass
+ whereas the unit K ~(3~0- decreases it.

In the present ultrasonic investigations both the
longitudinal and transverse ultrasonic velocities were
found to increase with concentration of Na 0 and Fe203. 2
Also the elastic constants showed almost a regular
increase with concentration of Na20 or Fe203. These
results may be explained by making use of the results of
ultrasonic investigations on binary borate glasses
reported in the literature[35,40] as is done in the case
of laser Raman spectra where results from the Raman
studies of binary glasses are made use of in the
interpretation of spectra of ternary and quarternary
glasses[48,49]. Results of laser Raman studies (Chapter 5
of this thesis) of the ternary glass CaO-B 0 -A1203 showed 2 3
that the structure of the glass consists of mainly boroxol
rings containing only bridging oxygen. When Na20 is added
to this glass system (so that the resultant glass is CaO-
B 0 -A1203- Na20) the structure was found to consist 2 3
mainly of tetraborate groups and at high concentration of
Na 0 pentaborate groups were formed (Chapter 5 of this 2
thesis). A few percentage of diborate-pentaborate and
other groups having bridging oxygens were also detected
in this structure. The main structural units in
quarternary glass CaO-B 0 -A1 0 -Fe203 were found to be 2 3 2 3
boroxol rings for low concentration of Fe 0 where as at 2 3
high concentration boroxol rings transform into other
9roups all having only bridging oxygens (Chapter 5).

In these transformations boron undergo a change from three
coordinated to four coordinate @"and it is reported that
the presence of B a 4 increases the rigidity of the
glass[40]. It has also been reported that in the case of
binary sodium borate glasses as the concentration of Na20
is increased the packing density increased due a
transformation of coordination of boron from 3 to 4 and
consequent occupation of the intensities by the alkali
ions[35]. The increase in ultrasonic velocity and the
elastic moduli in the present study may also be attributed
to the increase in packing density and rigidity of the
c,lass samples as the concentration of Na20 or Fe20j is
increased. The laser Raman spectra indicated the presence
of a few loose diborate and loose B04 groups. Their
concentration should be small since a large concentration
of these groups should Lead to a decrease in the rigidity
of the glass resulting in the decrease of ultrasonic
velocity and the elastic constants, whereas an increase in
these quantities were observed. Poisson's ratio had been
reported to be increasing with alkali oxide concentration
in binary oxide glasses[35], while it had been observed
to decrease upto a certain concentration of ZnO and then
increase in the case of zinc oxide glasses[37]. In the
present study, Poisson's ratio showed a regular decrease
with increase in concentration of both Na 0 and Fe203. 2
The regular variation of ultrasonic vel(-~ities and the
elastic constants of the two systems of quarternary
glasses investigated in the present study show that the
transformation of the structural groups in these glasses
to other groups is systematic and does not cause a
disruption of the structure which is also supported by the
Raman scattering results (Chapter 5 of thls thesis) that
the Ranan peak characteristic of a continuous random
network was prominently present in the spectra of all the
$lass samples investigated. The ultrasonic velocity or
the elastic constants do not show a decreasing trend in
any of the glasses. This may be attributed to the reason
that within the variation in Na 0 and Fe 0 studied, B 0 4 2 2 3
groups do not get saturated and show a trend for the
fornation of nonbridging oxygens leading to a loose
structure.
6.7. Conclusion
Ultrasonic velocity of longitudinal and transverse
waves of frequency 3 ElHz has been determined in two
quarternary glass systems. The elastic constants and
Poisson's ratio have been evaluated. The increase in the
values of ultrasonic velocity and elastic constants has
been attributed to an increase in the packing density and
rigidity of the glass samples as a result of a
transformation of the coordination of boron from 3 to 4
when the concentration of Na 0 and Fe 0 respectively in 2 2 3
the two systems of glasses is increased. It is also
concluded that the transformation of the groups
constituting the structure of the glass into other groups
on increasing the concentration of Na 0 or Fe 0 does not 2 2 3
affect the rigidity of the glass so that the random
continuous network of glass is maintained.

References
1. True11 R., Elbaurin C. and Chick B.B., Ultrasonic Eiethods in Sold State Physics, Academic Press, N.Y. (1965).
~opkins I.L. and Kukijian C.R., in Physical Acoustics, ed., Mason W.P., Vol. 2B, Academic Press, p.91 (1965).
Heydernanna P.L.M., Rev. Sci. Instr., 42, 983 (1971).
Kul'bitskaya I.l.N., Romanov V.P. and Shutilov V.A., Sov. Phys. Acoust., 19, 399 (1974).
Bhatia A.B., Ultrasonic Absorption, Clarendon Press, Oxford (1967).
Muntigton H.B., The Elastic Constants of Crystals, ed., Seitz F. and Turnbul D., "Solid State Physics", Advances in Research and Applications, Vo1.7, p.213, Academic Press, N.Y. (1958).
Nye J.F. "Physical Properties of Crystals", Oxford University Press, N.Y. (1960).
Bhayavantan S., "Crystal Symmetry and Physical Properties", Academic Press, New York (1966).
Mearrnon R.F.S., Advan. Phy., 5, 323 (1956).
10. Hearrnon.R.F.S., "Introduction to Applied Anisotropic Elasticity", Oxford Press (1961).
11. Federov E.S., "Synrnetry of Crystals", Polycrystal Book Service (1971).
12. Kusgrave N.J.P., "Crystal Acoustics", Holden-day, San Francisco (1970).
13. 'lason W.P., "Physical Acoustics and Properties of Solids" Van Nostrand. Reinhold, Princeton, New Jersey (1950).
14. llason W.P., "Piezoelectric Crystals and their Application to Ultrasonics", Van Nostrand-Reinhold, Princeton, New Jersey (1950).
15. Ilason M.P., "Crystal Physics of Interaction Processes", Academic Press, Inc., N.Y. (1966).

16. Anderson P.W., Malperin B.I. and Varma C.M., Phil. Mag., 25, 1 (1972).
17. Phillip W.A., J. Low Temp. Phys., 7, 351 (1972).
Ng. D and Sladek R.J., Phys. Rev., B11, 4017 (1975).
Claytor T.N. and Sladek R.J., Phys. Rev. B18, 10, 5842 (19781,
Kul'bitskaya M.N. and Shytilor V.A., J. Sov. Phys. Acous t . , 451 (1976).
Kodana M., Phys. & Chern. Glasses, 26, 105 (1985).
Higazy A.A. and Bridge B., J. Non-Cryst. Solids, 81 (1985).
Carini G., Cutroni M., Federico M. and Tripodo G., Solid St. Ion., 18 & 19, 415 (1986).
Kazuhira Uasata, Katsurni Ohira, Hisao Yarnada and - Kazuhiro S. Goto, Metall. Trans., 18B, 549 (1987).
Bridge B. and pate1 N.D., J. Mat. Sci., 22, 781 (1987).
Danodaran K.V., Selvaraj V. and Rao K.J., Mater. Res. Bul., 23, 1151 (1988).
Selvaraj V. and Rao K.J., J. Non-Cryst. Solids, (1988).
Bhatti S.S. and Santokh Singh, Acustica, 65, 2 6 1 (1988).
Makishima A. and Mackenzie J.D., J. Non-Cryst. Solids, 12, 35 (1975).
i.lakishima A. and Mackenzie J.D., J. Non-Cryst. Solids, 17, 147 (1975).
Bhatti S.S. and Anand Pal Singh, Acustica, 68, 181 (1989).
Bhatti S.S. Santokh Singh, J. Pure and Appl. Ultrason, 8, 101 (1986).
Anand Pal Singh, Gurjit and Bhatti S.S., 11, 49 (1989).

Anand P a l S i n g h , Kanwar J i t S i n g h a n d B h a t t i S.S., J. P u r e and Appl . U l t r a s o n . , 1 2 , 70 ( 1 9 9 0 ) .
S i d k e y M . A . , Abd-Ei F a t t a h , Abd-Ei L a t i f a n d N a k h l a R . I . , J . P u r e a n d A p p l . U l t r a s o n , 1 2 , 9 3 ( 1 9 9 0 ) .
P a d a k e S.V., Yawale S .P . a n d Adgaokar C.S. , P r o c . I n t . Cong. U l t r a s o n . , C - 1 ( 1 9 9 0 ) .
Kanbrar J i t S i n g h , S i n g h D.P. a n d B h a t t i S .S . , J . P u r e a n d Appl . U l t r a s o n . , 1 4 ( 1 9 9 2 ) .
M u k h e r j e e S . , Basu C. a n d Ghosh U.S., J . A c o u s t . S o c . I n d . , 3 & 4 , 57 ( 1 9 9 0 ) .
J a n a k i r a m a Rao BH. V . , J. Am. Ceram. Soc . , 1 8 , 311 ( 1 9 6 5 ) .
Kodama M . , J . Non-Crys t . S o l i d s , 1 2 7 , 6 5 ( 1 9 9 1 ) .
Anand P a l S i n g h a n d B h a t t i S . S . , J . P u r e a n d A p p l . U l t r a s o n . , 1 4 , 3 6 ( 1 9 9 2 ) .
B o r j e s s o n L. a n d T o r e l l L .M. , P h y s . L e t t . , 1 0 7 A , 1 9 0 ( 1 9 8 5 ) .
B i s c o e J. a n d W a r r e n B.E., J . Am. Ceram. S o c . , 2 1 , 287 ( 1 9 3 8 ) .
K a r s c h K.M. a n d J e n c k e l E . , G l a s t e c h B e r . , 3 4 , 397 ( 1 9 6 1 ) .
Coenen PI. ,, 2 . E l e k r o c h e n . , 6 5 , 903 ( 1 9 6 1 ) .
Abe, J . Am. Ceram. S o c . , 3 5 , 284 ( 1 9 5 2 ) .
G l a d k o v A.V. a n d T a r a s o v V . V . , . T h e S t r u c t u r e o f Glass , V o l . 1 1 , C o n s u l t a n t s B u r e a u , N . Y . ( 1 9 6 0 ) .
K o n i j n e n d i j k W.L. a n d S t e v e l s J . M . , J . Non-Crys t . S o l i d s , 1 8 , 307 ( 1 9 7 5 ) .
Pieera B.N. a n d R a r n a k r i s h n a J . , J. Non-Crys t . S o l i d s . 1 5 9 , 1 ( 1 9 9 3 ) .