Embed Size (px)
Citation preview
INFLECTION POINT July 2013
© 2 0 1 3 F O R T I G E N T , L L C
Ryan and Barclay work in the Alternative Investments group at Fortigent, LLC, a provider of differentiated outsourced wealth management solutions for finan-cial institutions and independent advisory firms. They welcome feedback and can be reached at [email protected] or [email protected]
FORTIGENT, LLC 2600 TOWER OAKS BLVD., SUITE 300 ROCKVILLE, MARYLAND 20852
MANAGED FUTURES:
Cyclical Trough or Structural Impairment?
Analysis & Proposed Solutions
BY RYAN DAVIS, CAIA & BARCLAY LEIB
INTRODUCTION Systematic trend-followers, commonly referred to as “managed futures” funds, have long been an important
component of institutional and high net worth portfolios. These strategies’ unique ability to go both long and
short in a vast array of global financial markets has historically produced a return profile highly uncorrelated to
traditional markets. More recently, however, many investors have come to question the asset class amid poor
performance in the post-global financial crisis (GFC) period. In this paper we explore the recent struggles of the
managed futures industry, discuss what the future may hold for such strategies, and offer suggestions for navi-
gating this space moving forward.
BACKGROUND
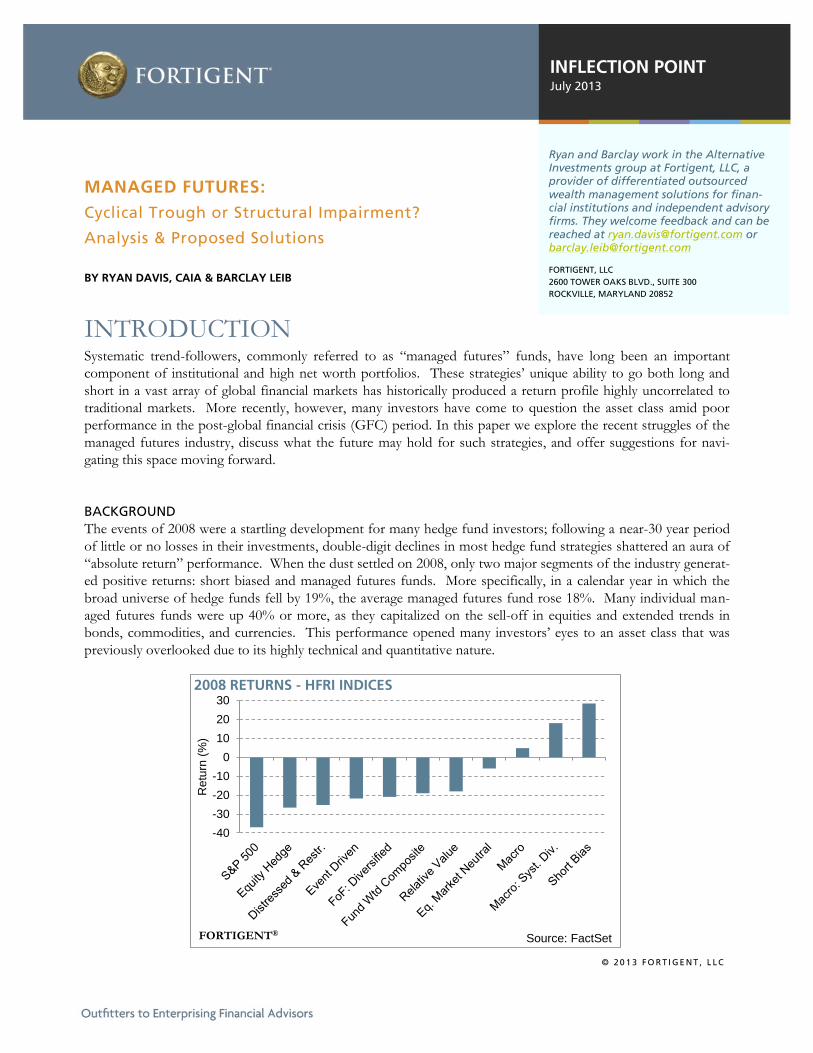
The events of 2008 were a startling development for many hedge fund investors; following a near-30 year period
of little or no losses in their investments, double-digit declines in most hedge fund strategies shattered an aura of
“absolute return” performance. When the dust settled on 2008, only two major segments of the industry generat-
ed positive returns: short biased and managed futures funds. More specifically, in a calendar year in which the
broad universe of hedge funds fell by 19%, the average managed futures fund rose 18%. Many individual man-
aged futures funds were up 40% or more, as they capitalized on the sell-off in equities and extended trends in
bonds, commodities, and currencies. This performance opened many investors’ eyes to an asset class that was
previously overlooked due to its highly technical and quantitative nature.
-40
-30
-20
-10
0
10
20
30
Re
turn
(%
)
2008 RETURNS - HFRI INDICES
FORTIGENT®Source: FactSet
F O R F I N A N C I A L P R O F E S S I O N A L U S E O N L Y © 2 0 1 3 F O R T I G E N T , L L C
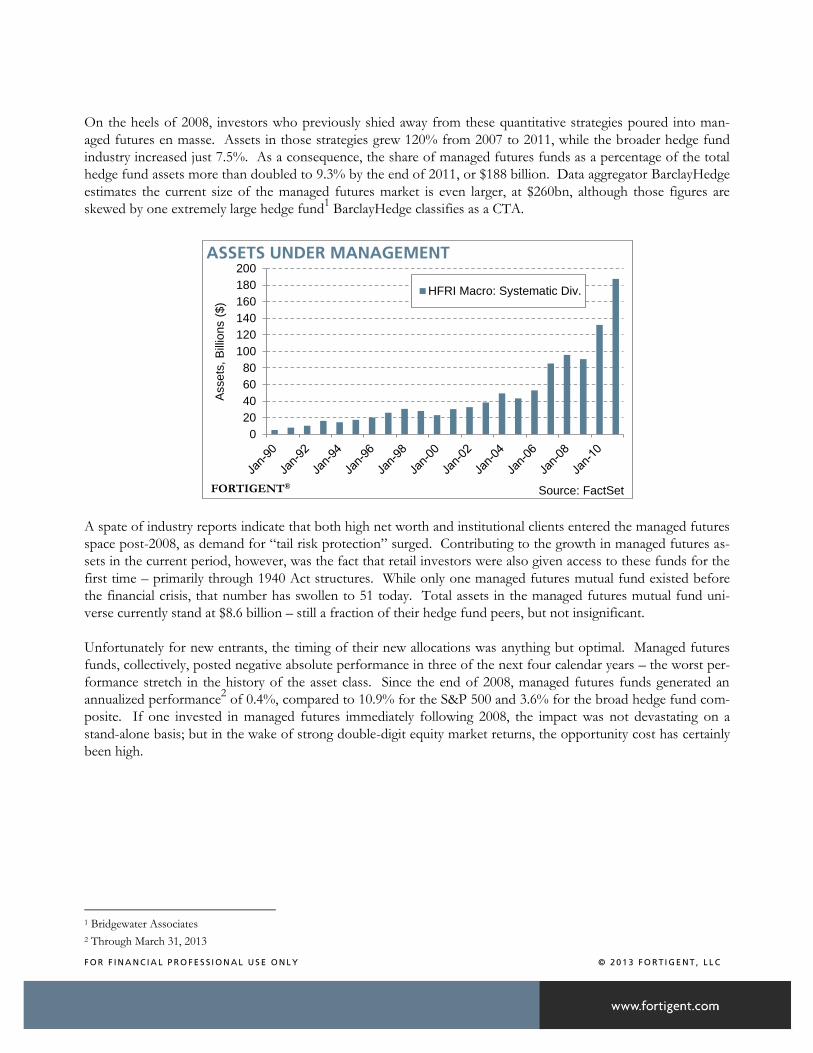
On the heels of 2008, investors who previously shied away from these quantitative strategies poured into man-
aged futures en masse. Assets in those strategies grew 120% from 2007 to 2011, while the broader hedge fund
industry increased just 7.5%. As a consequence, the share of managed futures funds as a percentage of the total
hedge fund assets more than doubled to 9.3% by the end of 2011, or $188 billion. Data aggregator BarclayHedge
estimates the current size of the managed futures market is even larger, at $260bn, although those figures are
skewed by one extremely large hedge fund1 BarclayHedge classifies as a CTA.
A spate of industry reports indicate that both high net worth and institutional clients entered the managed futures
space post-2008, as demand for “tail risk protection” surged. Contributing to the growth in managed futures as-
sets in the current period, however, was the fact that retail investors were also given access to these funds for the
first time – primarily through 1940 Act structures. While only one managed futures mutual fund existed before
the financial crisis, that number has swollen to 51 today. Total assets in the managed futures mutual fund uni-
verse currently stand at $8.6 billion – still a fraction of their hedge fund peers, but not insignificant.
Unfortunately for new entrants, the timing of their new allocations was anything but optimal. Managed futures
funds, collectively, posted negative absolute performance in three of the next four calendar years – the worst per-
formance stretch in the history of the asset class. Since the end of 2008, managed futures funds generated an
annualized performance2 of 0.4%, compared to 10.9% for the S&P 500 and 3.6% for the broad hedge fund com-
posite. If one invested in managed futures immediately following 2008, the impact was not devastating on a
stand-alone basis; but in the wake of strong double-digit equity market returns, the opportunity cost has certainly
been high.
1 Bridgewater Associates
2 Through March 31, 2013
0
20
40
60
80
100
120
140
160
180
200
Assets
, B
illio
ns (
$)
ASSETS UNDER MANAGEMENT
HFRI Macro: Systematic Div.
FORTIGENT®Source: FactSet
F O R F I N A N C I A L P R O F E S S I O N A L U S E O N L Y © 2 0 1 3 F O R T I G E N T , L L C
HISTORICAL REVIEW Managed futures investing received its first major academic backing by John Lintner in 1983 with his classic pa-
per, “The Potential Role of Managed Commodity-Financial Futures Accounts (and/or Funds) in Portfolios of
Stocks and Bonds.” Lintner concluded that, “the combined portfolios of stocks (or stocks and bonds) after in-
cluding…managed futures accounts (or funds) show substantially less risk at every possible level of expected
return than portfolios of stocks (or stocks and bonds) alone.” Managed futures strategies proliferated and gained
further notoriety in the 1980’s with the success of trend-following investors such as John Henry and David Har-
ding.
Since then, a range of academic studies have validated the historical efficacy of managed futures investments and
the benefits of inclusion into diversified, traditional portfolios.3 Edwards and Park (1996), for example, found
that an equally weighted portfolio of either CTAs or commodity pools “increases the portfolio’s Sharpe ratio by
as much as 28%. The primary reason for this result is the low correlation between managed futures returns and
the returns on other portfolio assets…” More recent studies such as one by Ibbotson Associates of CTA data
between 1980 and 2005 illustrated an asset class that generated superior returns to US equity markets with similar
volatility levels. Because of the uncorrelated nature of this performance, however, the authors concluded that
layering in an allocation to managed futures to a traditional stock bond portfolio improved the overall risk-
adjusted return – i.e. improved the efficient frontier in a mean-variance framework.
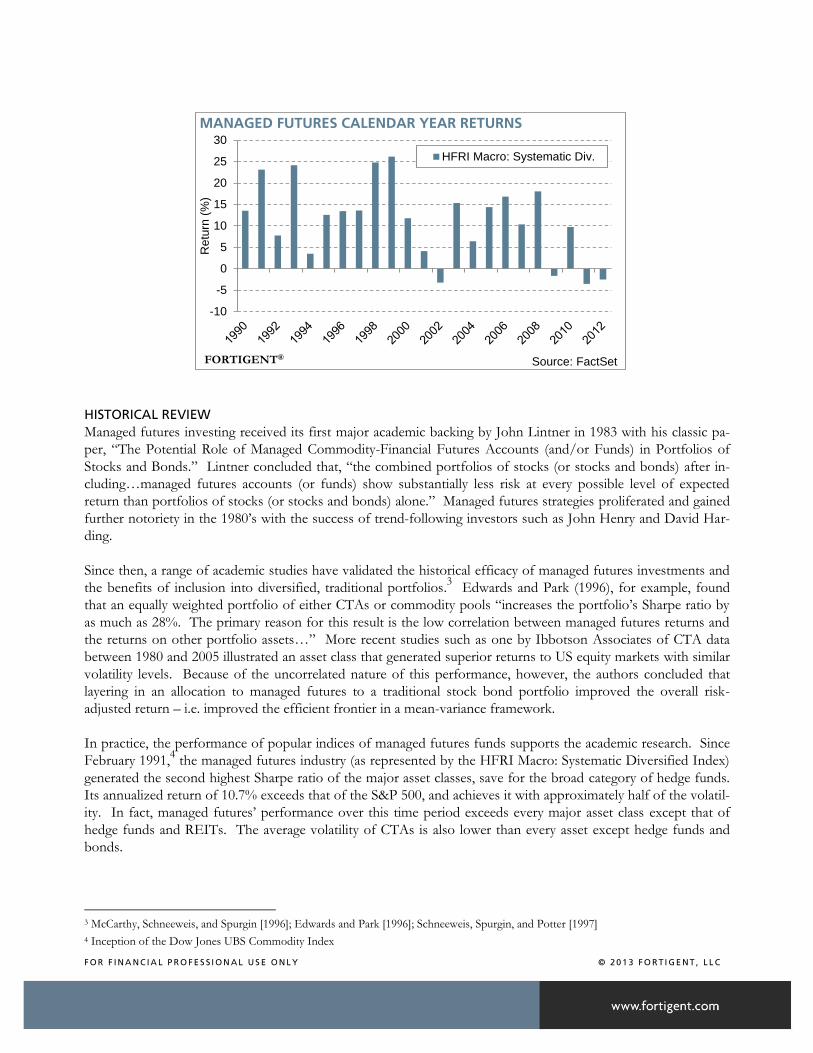
In practice, the performance of popular indices of managed futures funds supports the academic research. Since
February 1991,4 the managed futures industry (as represented by the HFRI Macro: Systematic Diversified Index)
generated the second highest Sharpe ratio of the major asset classes, save for the broad category of hedge funds.
Its annualized return of 10.7% exceeds that of the S&P 500, and achieves it with approximately half of the volatil-
ity. In fact, managed futures’ performance over this time period exceeds every major asset class except that of
hedge funds and REITs. The average volatility of CTAs is also lower than every asset except hedge funds and
bonds.
3 McCarthy, Schneeweis, and Spurgin [1996]; Edwards and Park [1996]; Schneeweis, Spurgin, and Potter [1997]
4 Inception of the Dow Jones UBS Commodity Index
-10
-5
0
5
10
15
20
25
30
Re
turn
(%
)
MANAGED FUTURES CALENDAR YEAR RETURNS
HFRI Macro: Systematic Div.
FORTIGENT®Source: FactSet
F O R F I N A N C I A L P R O F E S S I O N A L U S E O N L Y © 2 0 1 3 F O R T I G E N T , L L C
-20
-10
0
10
20
30
40
Retu
rn (
%)
3YR ANNUALIZED ROLLING RETURNS
HFRI Macro: Systematic Div.
S&P 500
FORTIGENT®Source: FactSet
The comprehensive risk management inherent to CTAs result in this mitigated volatility profile, but its impact is
most evident in the return distributions. Next to fixed income, managed futures display the most attractive draw-
down characteristics of the major asset classes. During the measured time period, only managed futures and
bonds experienced a maximum drawdown in the single digits. Although hedge fund strategies generated a supe-
rior return with less volatility than managed futures, they were not necessarily less risky, as evidenced by a
maximum drawdown of more than 20%. This is due to the negative skewness and kurtosis of the hedge fund
category’s return distribution, indicating there are fatter “tails” for such strategies. Of the major categories, only
managed futures strategies featured positive skewness. This suggests managed futures is one of the few asset
classes that mitigate left tail risk effectively.
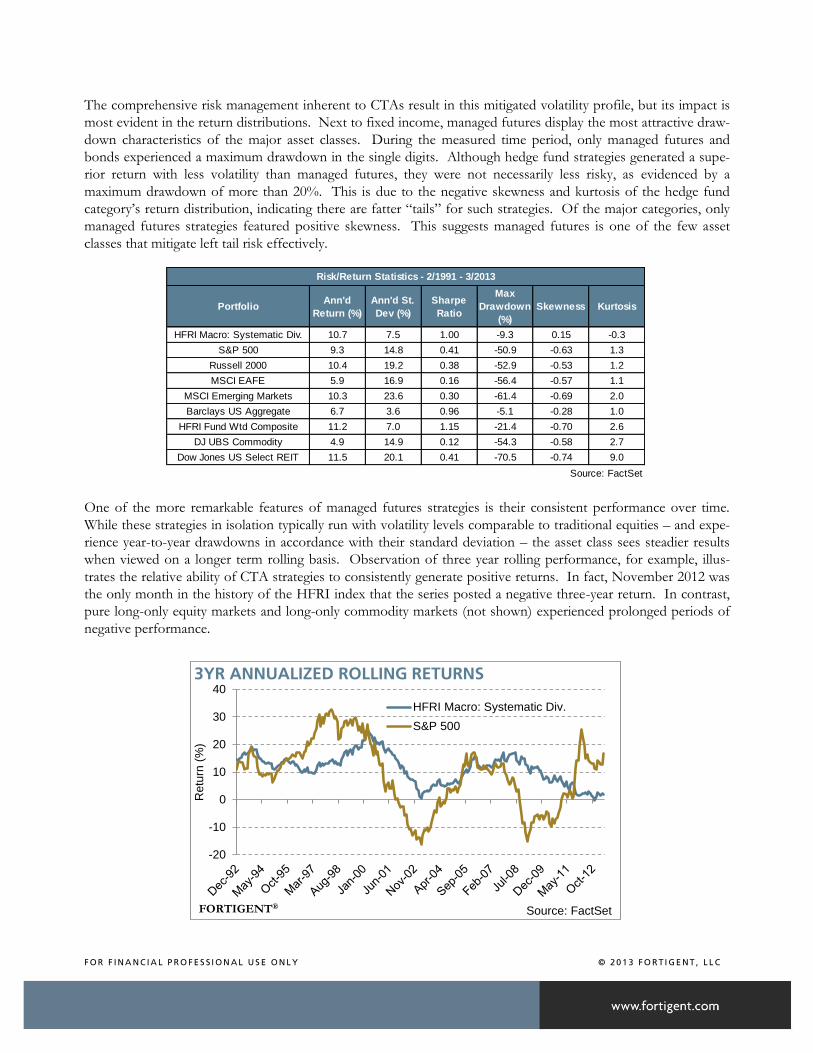
One of the more remarkable features of managed futures strategies is their consistent performance over time.
While these strategies in isolation typically run with volatility levels comparable to traditional equities – and expe-
rience year-to-year drawdowns in accordance with their standard deviation – the asset class sees steadier results
when viewed on a longer term rolling basis. Observation of three year rolling performance, for example, illus-
trates the relative ability of CTA strategies to consistently generate positive returns. In fact, November 2012 was
the only month in the history of the HFRI index that the series posted a negative three-year return. In contrast,
pure long-only equity markets and long-only commodity markets (not shown) experienced prolonged periods of
negative performance.
PortfolioAnn'd
Return (%)
Ann'd St.
Dev (%)
Sharpe
Ratio
Max
Drawdown
(%)
Skewness Kurtosis
HFRI Macro: Systematic Div. 10.7 7.5 1.00 -9.3 0.15 -0.3
S&P 500 9.3 14.8 0.41 -50.9 -0.63 1.3
Russell 2000 10.4 19.2 0.38 -52.9 -0.53 1.2
MSCI EAFE 5.9 16.9 0.16 -56.4 -0.57 1.1
MSCI Emerging Markets 10.3 23.6 0.30 -61.4 -0.69 2.0
Barclays US Aggregate 6.7 3.6 0.96 -5.1 -0.28 1.0
HFRI Fund Wtd Composite 11.2 7.0 1.15 -21.4 -0.70 2.6
DJ UBS Commodity 4.9 14.9 0.12 -54.3 -0.58 2.7
Dow Jones US Select REIT 11.5 20.1 0.41 -70.5 -0.74 9.0
Source: FactSet
Risk/Return Statistics - 2/1991 - 3/2013
F O R F I N A N C I A L P R O F E S S I O N A L U S E O N L Y © 2 0 1 3 F O R T I G E N T , L L C
Despite the longer-term consistency, returns at present do have the appearance of a slow overall trend downward. Some might argue that we are simply at a periodic performance trough, similar to the one witnessed in late 2002. On the other hand, there are some structural changes in financial markets and the CTA industry that could be grounds for a more persistent degradation in alpha generation. Differentiating between a cyclical trough in per-formance and a secular trend toward lower returns is of course the key issue to examine.
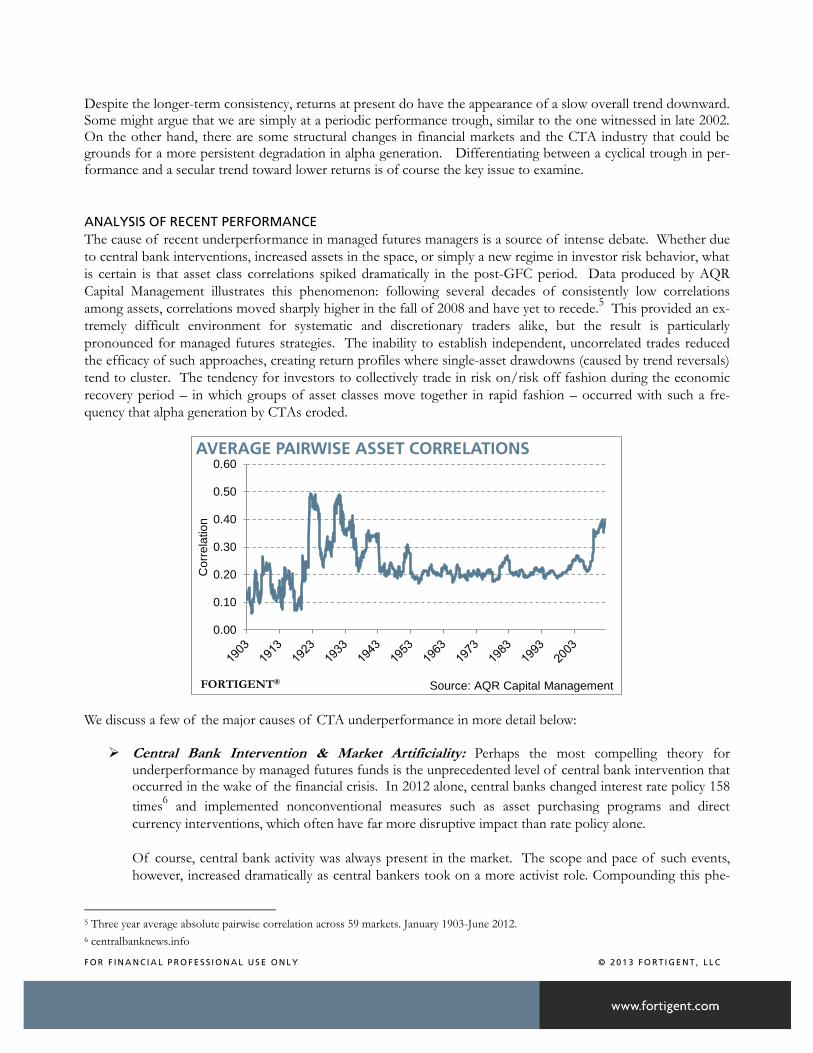
ANALYSIS OF RECENT PERFORMANCE The cause of recent underperformance in managed futures managers is a source of intense debate. Whether due
to central bank interventions, increased assets in the space, or simply a new regime in investor risk behavior, what
is certain is that asset class correlations spiked dramatically in the post-GFC period. Data produced by AQR
Capital Management illustrates this phenomenon: following several decades of consistently low correlations
among assets, correlations moved sharply higher in the fall of 2008 and have yet to recede.5 This provided an ex-
tremely difficult environment for systematic and discretionary traders alike, but the result is particularly
pronounced for managed futures strategies. The inability to establish independent, uncorrelated trades reduced
the efficacy of such approaches, creating return profiles where single-asset drawdowns (caused by trend reversals)
tend to cluster. The tendency for investors to collectively trade in risk on/risk off fashion during the economic
recovery period – in which groups of asset classes move together in rapid fashion – occurred with such a fre-
quency that alpha generation by CTAs eroded.
We discuss a few of the major causes of CTA underperformance in more detail below:
Central Bank Intervention & Market Artificiality: Perhaps the most compelling theory for underperformance by managed futures funds is the unprecedented level of central bank intervention that occurred in the wake of the financial crisis. In 2012 alone, central banks changed interest rate policy 158
times6 and implemented nonconventional measures such as asset purchasing programs and direct
currency interventions, which often have far more disruptive impact than rate policy alone.
Of course, central bank activity was always present in the market. The scope and pace of such events,
however, increased dramatically as central bankers took on a more activist role. Compounding this phe-
5 Three year average absolute pairwise correlation across 59 markets. January 1903-June 2012.
6 centralbanknews.info
0.00
0.10
0.20
0.30
0.40
0.50
0.60
Corr
ela
tion
AVERAGE PAIRWISE ASSET CORRELATIONS
FORTIGENT® Source: AQR Capital Management
F O R F I N A N C I A L P R O F E S S I O N A L U S E O N L Y © 2 0 1 3 F O R T I G E N T , L L C
nomenon is the rise in influence of emerging market central banks; global financial markets are now sub-
ject to the competing economic interests of a much wider swathe of sovereigns today compared to 20
years ago.
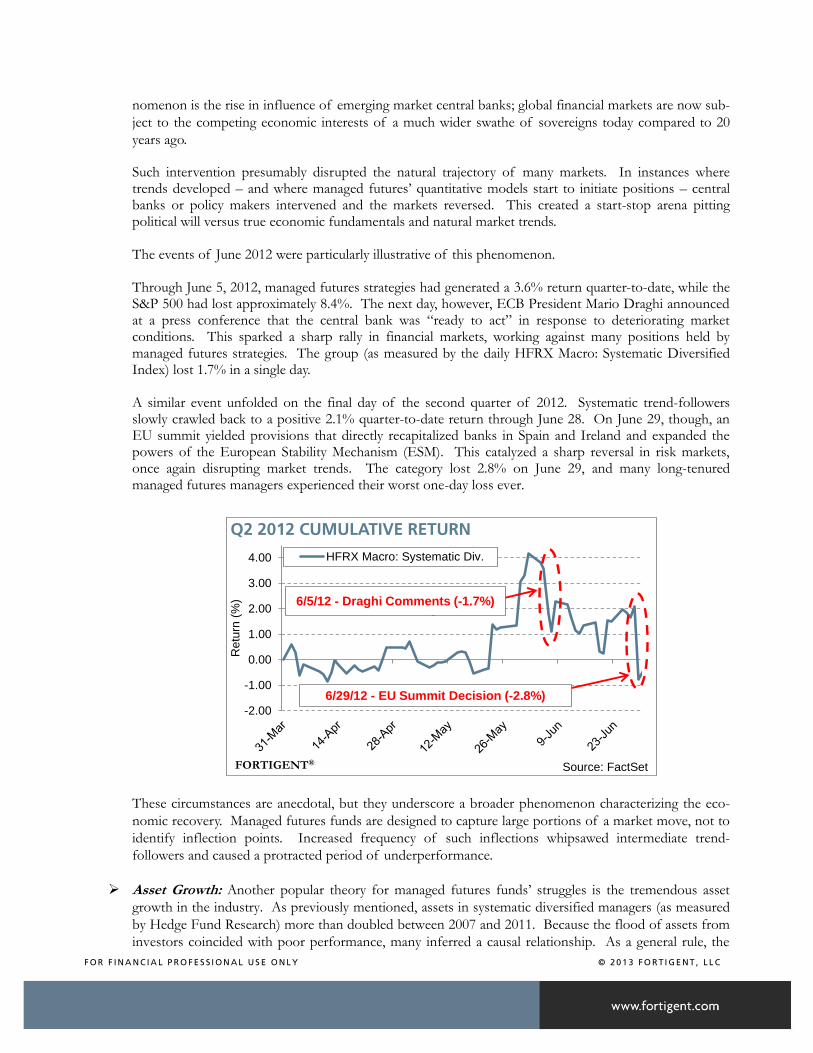
Such intervention presumably disrupted the natural trajectory of many markets. In instances where trends developed – and where managed futures’ quantitative models start to initiate positions – central banks or policy makers intervened and the markets reversed. This created a start-stop arena pitting political will versus true economic fundamentals and natural market trends. The events of June 2012 were particularly illustrative of this phenomenon.
Through June 5, 2012, managed futures strategies had generated a 3.6% return quarter-to-date, while the S&P 500 had lost approximately 8.4%. The next day, however, ECB President Mario Draghi announced at a press conference that the central bank was “ready to act” in response to deteriorating market conditions. This sparked a sharp rally in financial markets, working against many positions held by managed futures strategies. The group (as measured by the daily HFRX Macro: Systematic Diversified Index) lost 1.7% in a single day.
A similar event unfolded on the final day of the second quarter of 2012. Systematic trend-followers slowly crawled back to a positive 2.1% quarter-to-date return through June 28. On June 29, though, an EU summit yielded provisions that directly recapitalized banks in Spain and Ireland and expanded the powers of the European Stability Mechanism (ESM). This catalyzed a sharp reversal in risk markets, once again disrupting market trends. The category lost 2.8% on June 29, and many long-tenured managed futures managers experienced their worst one-day loss ever.
These circumstances are anecdotal, but they underscore a broader phenomenon characterizing the eco-
nomic recovery. Managed futures funds are designed to capture large portions of a market move, not to
identify inflection points. Increased frequency of such inflections whipsawed intermediate trend-
followers and caused a protracted period of underperformance.
Asset Growth: Another popular theory for managed futures funds’ struggles is the tremendous asset
growth in the industry. As previously mentioned, assets in systematic diversified managers (as measured
by Hedge Fund Research) more than doubled between 2007 and 2011. Because the flood of assets from
investors coincided with poor performance, many inferred a causal relationship. As a general rule, the
-2.00
-1.00
0.00
1.00
2.00
3.00
4.00
Retu
rn (
%)
Q2 2012 CUMULATIVE RETURN
HFRX Macro: Systematic Div.
FORTIGENT®Source: FactSet
6/5/12 - Draghi Comments (-1.7%)
6/29/12 - EU Summit Decision (-2.8%)
F O R F I N A N C I A L P R O F E S S I O N A L U S E O N L Y © 2 0 1 3 F O R T I G E N T , L L C
potential for alpha generation erodes in the face of increased assets and strained capacity, holding all oth-
er factors constant.
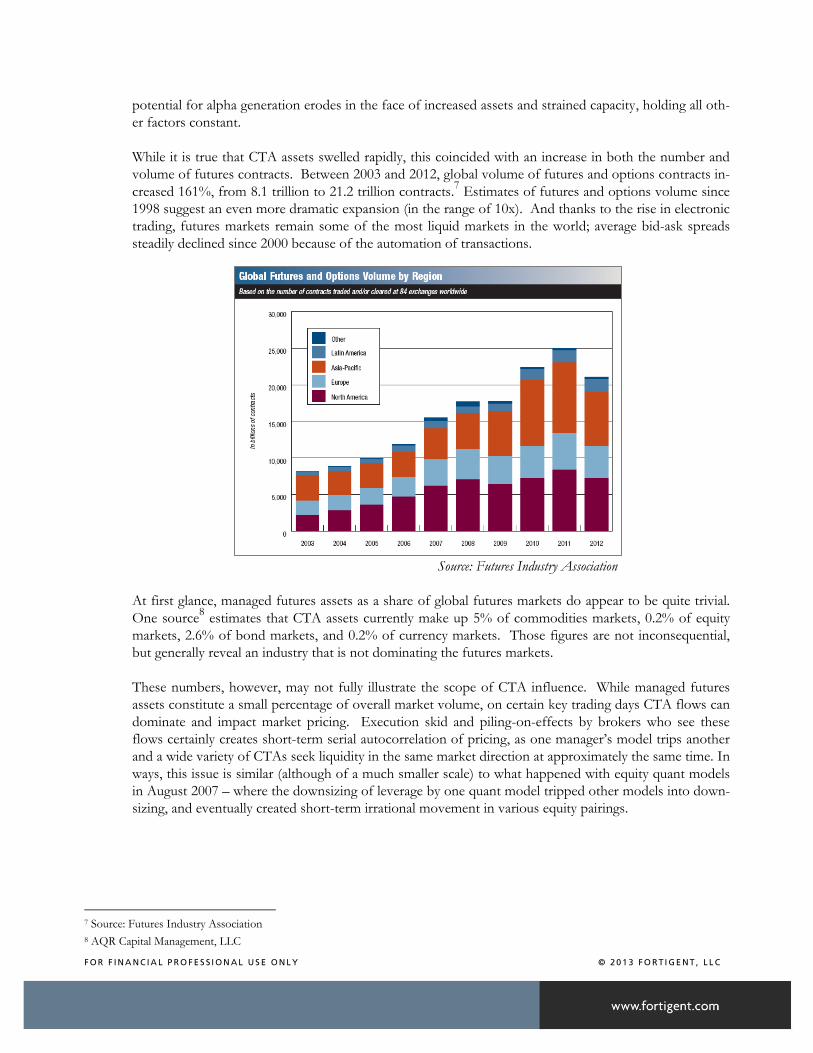
While it is true that CTA assets swelled rapidly, this coincided with an increase in both the number and
volume of futures contracts. Between 2003 and 2012, global volume of futures and options contracts in-
creased 161%, from 8.1 trillion to 21.2 trillion contracts.7 Estimates of futures and options volume since
1998 suggest an even more dramatic expansion (in the range of 10x). And thanks to the rise in electronic
trading, futures markets remain some of the most liquid markets in the world; average bid-ask spreads
steadily declined since 2000 because of the automation of transactions.
Source: Futures Industry Association
At first glance, managed futures assets as a share of global futures markets do appear to be quite trivial.
One source8 estimates that CTA assets currently make up 5% of commodities markets, 0.2% of equity
markets, 2.6% of bond markets, and 0.2% of currency markets. Those figures are not inconsequential,
but generally reveal an industry that is not dominating the futures markets.
These numbers, however, may not fully illustrate the scope of CTA influence. While managed futures
assets constitute a small percentage of overall market volume, on certain key trading days CTA flows can
dominate and impact market pricing. Execution skid and piling-on-effects by brokers who see these
flows certainly creates short-term serial autocorrelation of pricing, as one manager’s model trips another
and a wide variety of CTAs seek liquidity in the same market direction at approximately the same time. In
ways, this issue is similar (although of a much smaller scale) to what happened with equity quant models
in August 2007 – where the downsizing of leverage by one quant model tripped other models into down-
sizing, and eventually created short-term irrational movement in various equity pairings.
7 Source: Futures Industry Association
8 AQR Capital Management, LLC
F O R F I N A N C I A L P R O F E S S I O N A L U S E O N L Y © 2 0 1 3 F O R T I G E N T , L L C
Unfortunately, it is difficult to generate a cohesive conclusion on this topic; the distinction between cor-
relation and causation of recent poor performance is certainly blurred in this instance. What does appear
more certain is that, at the very least, CTAs had to become more sophisticated in their execution to min-
imize market impacts and to avoid detrimental front running by other parties.
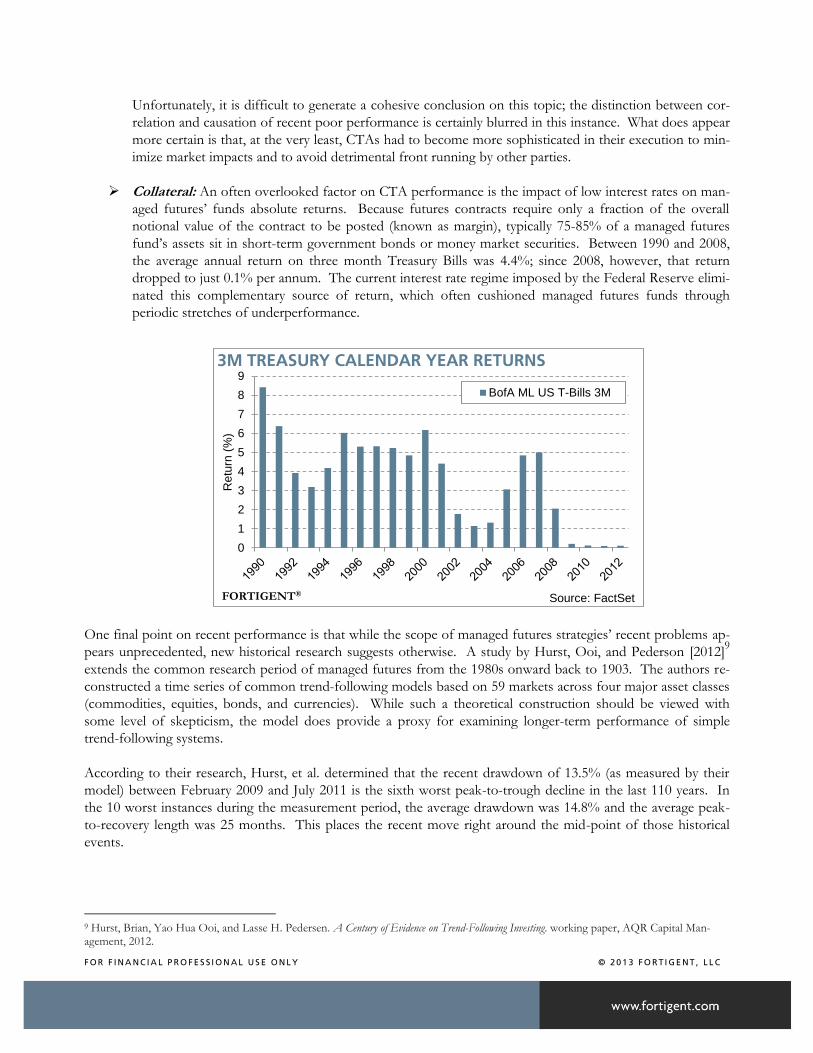
Collateral: An often overlooked factor on CTA performance is the impact of low interest rates on man-
aged futures’ funds absolute returns. Because futures contracts require only a fraction of the overall
notional value of the contract to be posted (known as margin), typically 75-85% of a managed futures
fund’s assets sit in short-term government bonds or money market securities. Between 1990 and 2008,
the average annual return on three month Treasury Bills was 4.4%; since 2008, however, that return
dropped to just 0.1% per annum. The current interest rate regime imposed by the Federal Reserve elimi-
nated this complementary source of return, which often cushioned managed futures funds through
periodic stretches of underperformance.
One final point on recent performance is that while the scope of managed futures strategies’ recent problems ap-
pears unprecedented, new historical research suggests otherwise. A study by Hurst, Ooi, and Pederson [2012]9
extends the common research period of managed futures from the 1980s onward back to 1903. The authors re-
constructed a time series of common trend-following models based on 59 markets across four major asset classes
(commodities, equities, bonds, and currencies). While such a theoretical construction should be viewed with
some level of skepticism, the model does provide a proxy for examining longer-term performance of simple
trend-following systems.
According to their research, Hurst, et al. determined that the recent drawdown of 13.5% (as measured by their
model) between February 2009 and July 2011 is the sixth worst peak-to-trough decline in the last 110 years. In
the 10 worst instances during the measurement period, the average drawdown was 14.8% and the average peak-
to-recovery length was 25 months. This places the recent move right around the mid-point of those historical
events.
9 Hurst, Brian, Yao Hua Ooi, and Lasse H. Pedersen. A Century of Evidence on Trend-Following Investing. working paper, AQR Capital Man-agement, 2012.
0
1
2
3
4
5
6
7
8
9
Retu
rn (
%)
3M TREASURY CALENDAR YEAR RETURNS
BofA ML US T-Bills 3M
FORTIGENT®Source: FactSet
F O R F I N A N C I A L P R O F E S S I O N A L U S E O N L Y © 2 0 1 3 F O R T I G E N T , L L C
THE CASE FOR MANAGED FUTURES
The critical question for investors at this juncture is whether managed futures strategies still make sense for their
portfolios moving forward. Performance during the past four years served to shake the confidence of many in-
vestors in this space, with some going so far as to proclaim the CTA model broken. There are a number of items
worth discussing that influence the answer to that question.
Risk On/Risk Off: The first, and most important, issue at hand is the potential decline in risk on/risk
off trading dominating financial markets since the European Debt Crisis erupted in early 2010. Any de-
cline in this phenomenon would be a welcomed development for traditional CTA trend-followers, as
they depend on independent, uncorrelated assets to generate successful portfolio positions.
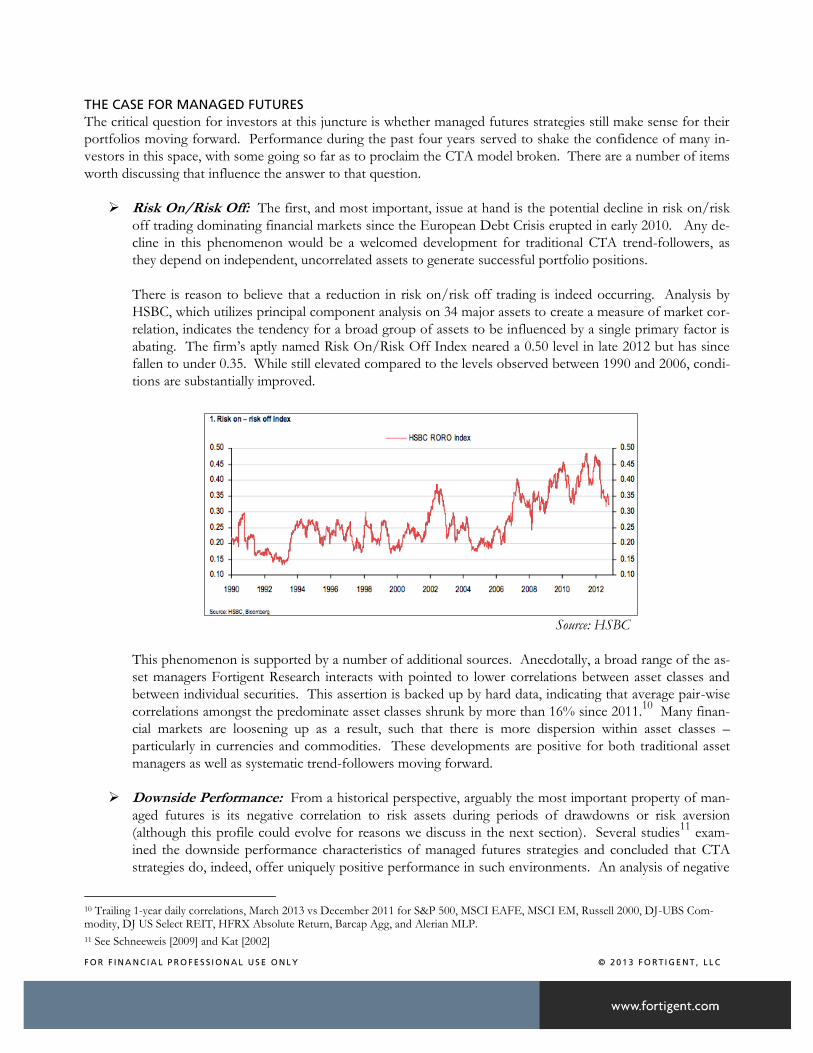
There is reason to believe that a reduction in risk on/risk off trading is indeed occurring. Analysis by
HSBC, which utilizes principal component analysis on 34 major assets to create a measure of market cor-
relation, indicates the tendency for a broad group of assets to be influenced by a single primary factor is
abating. The firm’s aptly named Risk On/Risk Off Index neared a 0.50 level in late 2012 but has since
fallen to under 0.35. While still elevated compared to the levels observed between 1990 and 2006, condi-
tions are substantially improved.
Source: HSBC
This phenomenon is supported by a number of additional sources. Anecdotally, a broad range of the as-
set managers Fortigent Research interacts with pointed to lower correlations between asset classes and
between individual securities. This assertion is backed up by hard data, indicating that average pair-wise
correlations amongst the predominate asset classes shrunk by more than 16% since 2011.10
Many finan-
cial markets are loosening up as a result, such that there is more dispersion within asset classes –
particularly in currencies and commodities. These developments are positive for both traditional asset
managers as well as systematic trend-followers moving forward.
Downside Performance: From a historical perspective, arguably the most important property of man-
aged futures is its negative correlation to risk assets during periods of drawdowns or risk aversion
(although this profile could evolve for reasons we discuss in the next section). Several studies11
exam-
ined the downside performance characteristics of managed futures strategies and concluded that CTA
strategies do, indeed, offer uniquely positive performance in such environments. An analysis of negative
10 Trailing 1-year daily correlations, March 2013 vs December 2011 for S&P 500, MSCI EAFE, MSCI EM, Russell 2000, DJ-UBS Com-modity, DJ US Select REIT, HFRX Absolute Return, Barcap Agg, and Alerian MLP.
11 See Schneeweis [2009] and Kat [2002]
F O R F I N A N C I A L P R O F E S S I O N A L U S E O N L Y © 2 0 1 3 F O R T I G E N T , L L C
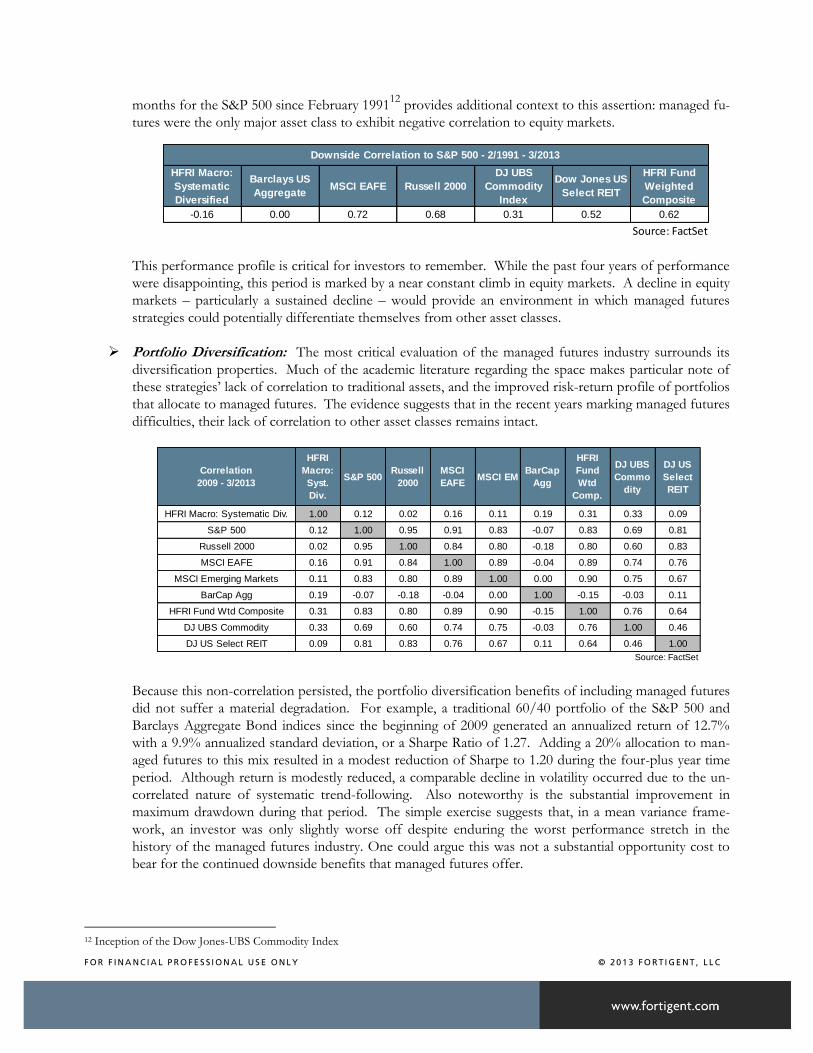
months for the S&P 500 since February 199112
provides additional context to this assertion: managed fu-
tures were the only major asset class to exhibit negative correlation to equity markets.
This performance profile is critical for investors to remember. While the past four years of performance
were disappointing, this period is marked by a near constant climb in equity markets. A decline in equity
markets – particularly a sustained decline – would provide an environment in which managed futures
strategies could potentially differentiate themselves from other asset classes.
Portfolio Diversification: The most critical evaluation of the managed futures industry surrounds its
diversification properties. Much of the academic literature regarding the space makes particular note of
these strategies’ lack of correlation to traditional assets, and the improved risk-return profile of portfolios
that allocate to managed futures. The evidence suggests that in the recent years marking managed futures
difficulties, their lack of correlation to other asset classes remains intact.
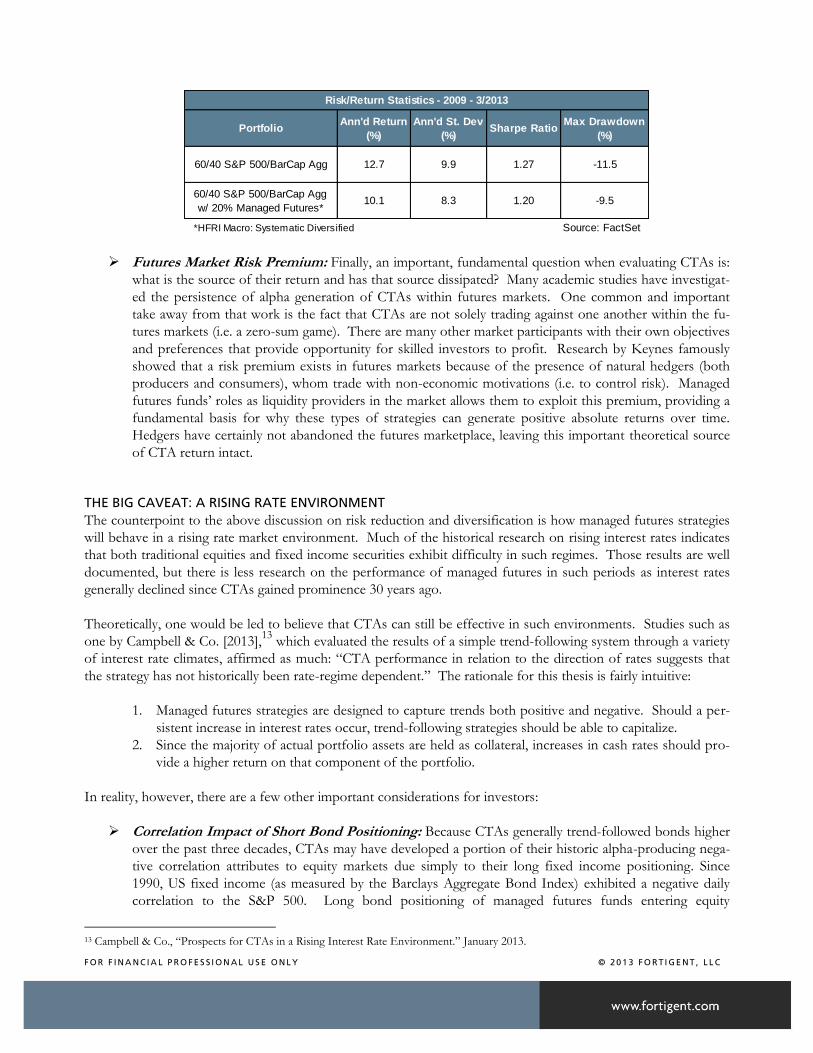
Because this non-correlation persisted, the portfolio diversification benefits of including managed futures
did not suffer a material degradation. For example, a traditional 60/40 portfolio of the S&P 500 and
Barclays Aggregate Bond indices since the beginning of 2009 generated an annualized return of 12.7%
with a 9.9% annualized standard deviation, or a Sharpe Ratio of 1.27. Adding a 20% allocation to man-
aged futures to this mix resulted in a modest reduction of Sharpe to 1.20 during the four-plus year time
period. Although return is modestly reduced, a comparable decline in volatility occurred due to the un-
correlated nature of systematic trend-following. Also noteworthy is the substantial improvement in
maximum drawdown during that period. The simple exercise suggests that, in a mean variance frame-
work, an investor was only slightly worse off despite enduring the worst performance stretch in the
history of the managed futures industry. One could argue this was not a substantial opportunity cost to
bear for the continued downside benefits that managed futures offer.
12 Inception of the Dow Jones-UBS Commodity Index
HFRI Macro:
Systematic
Diversified
Barclays US
AggregateMSCI EAFE Russell 2000
DJ UBS
Commodity
Index
Dow Jones US
Select REIT
HFRI Fund
Weighted
Composite
-0.16 0.00 0.72 0.68 0.31 0.52 0.62
Source: FactSet
Downside Correlation to S&P 500 - 2/1991 - 3/2013
Correlation
2009 - 3/2013
HFRI
Macro:
Syst.
Div.
S&P 500Russell
2000
MSCI
EAFEMSCI EM
BarCap
Agg
HFRI
Fund
Wtd
Comp.
DJ UBS
Commo
dity
DJ US
Select
REIT
HFRI Macro: Systematic Div. 1.00 0.12 0.02 0.16 0.11 0.19 0.31 0.33 0.09
S&P 500 0.12 1.00 0.95 0.91 0.83 -0.07 0.83 0.69 0.81
Russell 2000 0.02 0.95 1.00 0.84 0.80 -0.18 0.80 0.60 0.83
MSCI EAFE 0.16 0.91 0.84 1.00 0.89 -0.04 0.89 0.74 0.76
MSCI Emerging Markets 0.11 0.83 0.80 0.89 1.00 0.00 0.90 0.75 0.67
BarCap Agg 0.19 -0.07 -0.18 -0.04 0.00 1.00 -0.15 -0.03 0.11
HFRI Fund Wtd Composite 0.31 0.83 0.80 0.89 0.90 -0.15 1.00 0.76 0.64
DJ UBS Commodity 0.33 0.69 0.60 0.74 0.75 -0.03 0.76 1.00 0.46
DJ US Select REIT 0.09 0.81 0.83 0.76 0.67 0.11 0.64 0.46 1.00
Source: FactSet
F O R F I N A N C I A L P R O F E S S I O N A L U S E O N L Y © 2 0 1 3 F O R T I G E N T , L L C
Futures Market Risk Premium: Finally, an important, fundamental question when evaluating CTAs is:
what is the source of their return and has that source dissipated? Many academic studies have investigat-
ed the persistence of alpha generation of CTAs within futures markets. One common and important
take away from that work is the fact that CTAs are not solely trading against one another within the fu-
tures markets (i.e. a zero-sum game). There are many other market participants with their own objectives
and preferences that provide opportunity for skilled investors to profit. Research by Keynes famously
showed that a risk premium exists in futures markets because of the presence of natural hedgers (both
producers and consumers), whom trade with non-economic motivations (i.e. to control risk). Managed
futures funds’ roles as liquidity providers in the market allows them to exploit this premium, providing a
fundamental basis for why these types of strategies can generate positive absolute returns over time.
Hedgers have certainly not abandoned the futures marketplace, leaving this important theoretical source
of CTA return intact.
THE BIG CAVEAT: A RISING RATE ENVIRONMENT The counterpoint to the above discussion on risk reduction and diversification is how managed futures strategies
will behave in a rising rate market environment. Much of the historical research on rising interest rates indicates
that both traditional equities and fixed income securities exhibit difficulty in such regimes. Those results are well
documented, but there is less research on the performance of managed futures in such periods as interest rates
generally declined since CTAs gained prominence 30 years ago.
Theoretically, one would be led to believe that CTAs can still be effective in such environments. Studies such as
one by Campbell & Co. [2013],13
which evaluated the results of a simple trend-following system through a variety
of interest rate climates, affirmed as much: “CTA performance in relation to the direction of rates suggests that
the strategy has not historically been rate-regime dependent.” The rationale for this thesis is fairly intuitive:
1. Managed futures strategies are designed to capture trends both positive and negative. Should a per-
sistent increase in interest rates occur, trend-following strategies should be able to capitalize.
2. Since the majority of actual portfolio assets are held as collateral, increases in cash rates should pro-
vide a higher return on that component of the portfolio.
In reality, however, there are a few other important considerations for investors:
Correlation Impact of Short Bond Positioning: Because CTAs generally trend-followed bonds higher
over the past three decades, CTAs may have developed a portion of their historic alpha-producing nega-
tive correlation attributes to equity markets due simply to their long fixed income positioning. Since
1990, US fixed income (as measured by the Barclays Aggregate Bond Index) exhibited a negative daily
correlation to the S&P 500. Long bond positioning of managed futures funds entering equity
13 Campbell & Co., “Prospects for CTAs in a Rising Interest Rate Environment.” January 2013.
PortfolioAnn'd Return
(%)
Ann'd St. Dev
(%)Sharpe Ratio
Max Drawdown
(%)
60/40 S&P 500/BarCap Agg 12.7 9.9 1.27 -11.5
60/40 S&P 500/BarCap Agg
w/ 20% Managed Futures*10.1 8.3 1.20 -9.5
*HFRI Macro: Systematic Diversified Source: FactSet
Risk/Return Statistics - 2009 - 3/2013
F O R F I N A N C I A L P R O F E S S I O N A L U S E O N L Y © 2 0 1 3 F O R T I G E N T , L L C
downdrafts proved pivotal in mitigating the initial negative impact of long equity exposure. In the future,
a similar scenario where CTA bond exposure is flat or even short (a likely phenomenon in a rising rate
environment), losses would not only be fully felt but could also be exacerbated as a flight to safety trade
sends bond prices higher. The historic downside performance and diversification benefits of CTAs,
therefore, may be structurally eroded in a new interest rate regime.
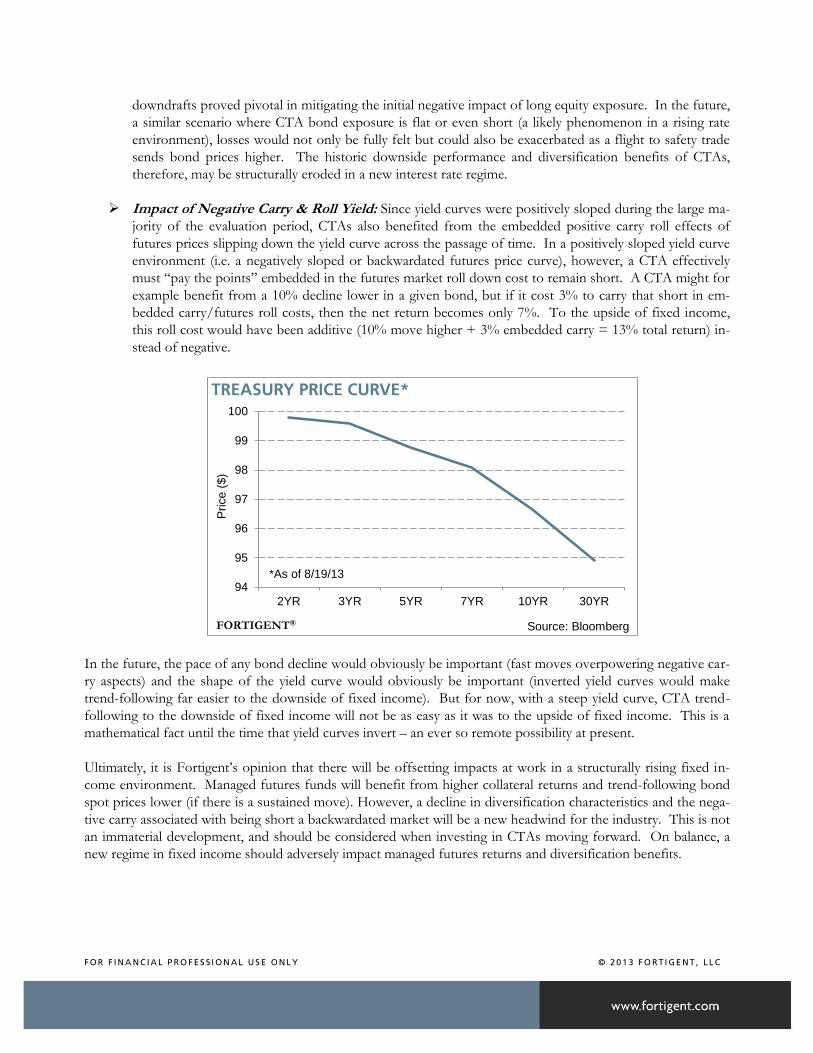
Impact of Negative Carry & Roll Yield: Since yield curves were positively sloped during the large ma-
jority of the evaluation period, CTAs also benefited from the embedded positive carry roll effects of
futures prices slipping down the yield curve across the passage of time. In a positively sloped yield curve
environment (i.e. a negatively sloped or backwardated futures price curve), however, a CTA effectively
must “pay the points” embedded in the futures market roll down cost to remain short. A CTA might for
example benefit from a 10% decline lower in a given bond, but if it cost 3% to carry that short in em-
bedded carry/futures roll costs, then the net return becomes only 7%. To the upside of fixed income,
this roll cost would have been additive (10% move higher + 3% embedded carry = 13% total return) in-
stead of negative.
In the future, the pace of any bond decline would obviously be important (fast moves overpowering negative car-
ry aspects) and the shape of the yield curve would obviously be important (inverted yield curves would make
trend-following far easier to the downside of fixed income). But for now, with a steep yield curve, CTA trend-
following to the downside of fixed income will not be as easy as it was to the upside of fixed income. This is a
mathematical fact until the time that yield curves invert – an ever so remote possibility at present.
Ultimately, it is Fortigent’s opinion that there will be offsetting impacts at work in a structurally rising fixed in-
come environment. Managed futures funds will benefit from higher collateral returns and trend-following bond
spot prices lower (if there is a sustained move). However, a decline in diversification characteristics and the nega-
tive carry associated with being short a backwardated market will be a new headwind for the industry. This is not
an immaterial development, and should be considered when investing in CTAs moving forward. On balance, a
new regime in fixed income should adversely impact managed futures returns and diversification benefits.
94
95
96
97
98
99
100
2YR 3YR 5YR 7YR 10YR 30YR
Price (
$)
TREASURY PRICE CURVE*
FORTIGENT® Source: Bloomberg
*As of 8/19/13
F O R F I N A N C I A L P R O F E S S I O N A L U S E O N L Y © 2 0 1 3 F O R T I G E N T , L L C
PROPOSED PATH FORWARD
Given the possibility for a structural shift in CTA efficacy, how does one address these issues within portfolios?
Fortigent has a few immediate suggestions.
First, do not panic and eliminate CTAs completely from your portfolio. The above issues may mean that CTAs
in general are facing a more difficult return-generating environment, but they do not eliminate all of the diversifi-
cation benefits of CTAs. As long as general market correlations loosen up somewhat – as they appear to be
doing at present -- CTAs should start to perform a bit better. One of the key attributes of CTAs is their ability to
generate profit in a variety of asset classes, not just fixed income; the aforementioned increase in dispersion of in-
dividual commodities, currencies, and equity markets should still offer fertile ground for alpha capture and returns
independent of other traditional portfolio allocations.
However, in the selection of a CTA, it may be increasingly important to choose managers with less em-
bedded fixed income exposure and more exposure to other assets (soft commodities, metals, energies,
etc.). At the very least, investors should seek managers with an appreciation for the above fixed income
issues and a proposed modeling solution to it – either via trade time horizon, sizing, or other methods.
Fortunately, many managed futures firms are taking it upon themselves to adapt to the changes occurring in fi-
nancial markets. While the universe has long been dominated by intermediate term trend-followers, asset
managers are spending considerable time and effort in developing new alternatives. This may include different
time periods of evaluation (shorter or longer term), the addition of new contracts or non-traditional data sets, or
the establishment of so-called “non-trend” strategies. These efforts are designed to increase the efficacy of sys-
tematic strategies and to provide diversification to traditional intermediate trend-following. We discuss some of
those initiatives below:
Short-Term Trading: Shorter-term trend-following strategies are gaining greater prominence due to
their success in the recent market environment (perhaps due to the shorter half-life of trends due to cen-
tral bank activity). Increased computing horsepower, the rise in high frequency trading capabilities, and
greater accumulation of intra-day data is contributing to the growth of these strategies. These systems
may follow data as short as minutes or hours out to a few months, whereas most intermediate trend-
followers trade within a 6-12 month time frame. Many prominent managed futures managers today im-
plement some combination of shorter and longer term models to produce more robust signals that
succeed in different market cycles.
Non-Trend Strategies: The proliferation of non-trend strategies has been swift. Such models rely on
different systems to generate buy and sell signals, and can also rely on non-price data. For example, some
strategies quantify fundamental information to identify potential trading opportunities. Counter-trend
models rely on price data to predict market trend reversals. Other systems aim to identify similar histori-
cal instances of price movement or fundamental data to select the most optimal trade for that
environment (i.e. pattern recognition). The algorithms for such models and methodologies can become
exponentially complex as researchers refine and add to their techniques.
Non-Traditional Data Sets: A so-called “arms race” has emerged among the largest CTAs, in which
teams of PhDs and highly trained academics are scouring non-standardized data sets to discover new
anomalies to exploit. Indeed, non-traditional data is a hot new avenue for managers to differentiate
themselves. Analyzing data that has not been traditionally used in academia or in financial studies can
produce new opportunities for profit. This may include weather forecasts, social media trends, or histor-
ical data that has not yet been databased. London-based CTA Winton, for example, the largest in the
world with over $20 billion in assets, reportedly “sends researchers to libraries and archives across the
F O R F I N A N C I A L P R O F E S S I O N A L U S E O N L Y © 2 0 1 3 F O R T I G E N T , L L C
world to find numbers held in books and on microfilms. It has found barley and sesame prices from an-
cient Babylon, and English wheat prices going back to 1209.”14
Recently researchers at Gallup found
samplings of increasingly negative social mood on websites such as Facebook as a more useful predictor
of Arab Spring violence than any trailing economic statistics. A group called Topsy Labs now uses big
data to produce full scale indices of social website word usage that may be indicative of social and there-
by predictive of investment mood as well. They analyze billions of conversations in real time. Some of
this type of analysis is already becoming integrated into the more sophisticated CTA programs.
Non-Futures Contracts: One other development within the industry is the use of new instruments
within CTA portfolios. For example, prominent managers have begun trading cash securities such as in-
dividual stocks and bonds, other derivatives like CDS and swaps, as well as more esoteric instruments like
energy power contracts. The risk with such trading is that they are often less liquid, may have higher
transaction costs, and can require higher capital commitments than traditional futures and forwards.
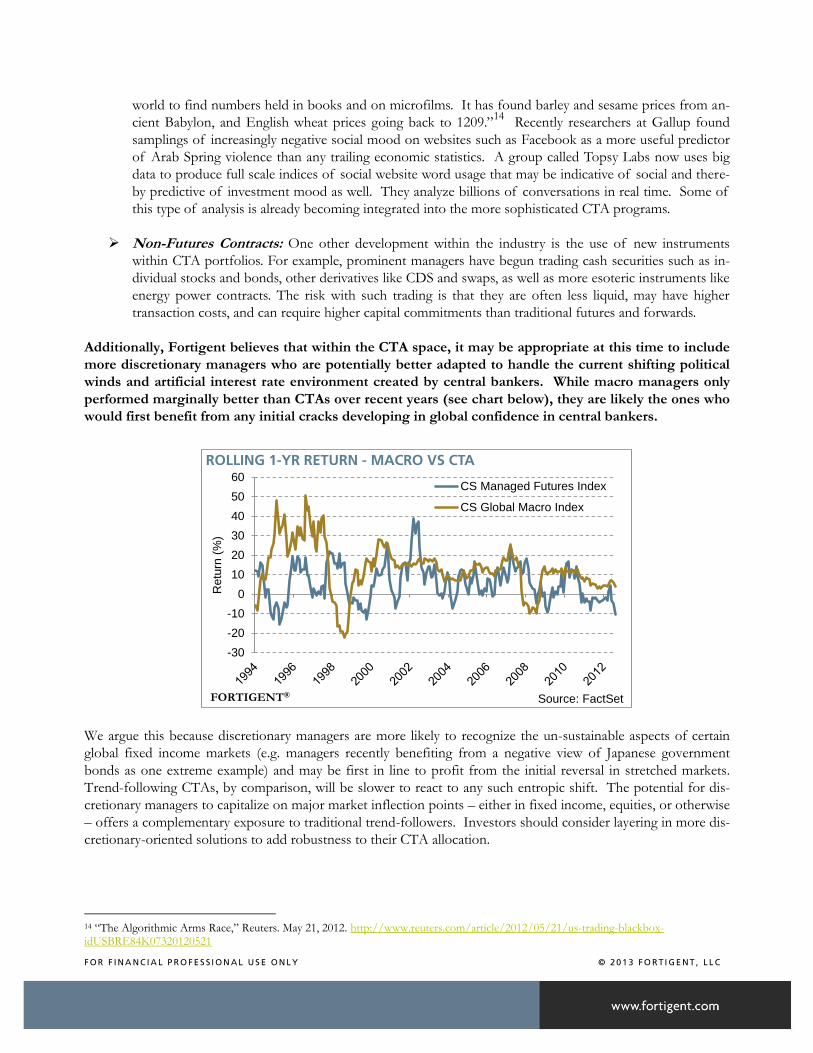
Additionally, Fortigent believes that within the CTA space, it may be appropriate at this time to include
more discretionary managers who are potentially better adapted to handle the current shifting political
winds and artificial interest rate environment created by central bankers. While macro managers only
performed marginally better than CTAs over recent years (see chart below), they are likely the ones who
would first benefit from any initial cracks developing in global confidence in central bankers.
We argue this because discretionary managers are more likely to recognize the un-sustainable aspects of certain
global fixed income markets (e.g. managers recently benefiting from a negative view of Japanese government
bonds as one extreme example) and may be first in line to profit from the initial reversal in stretched markets.
Trend-following CTAs, by comparison, will be slower to react to any such entropic shift. The potential for dis-
cretionary managers to capitalize on major market inflection points – either in fixed income, equities, or otherwise
– offers a complementary exposure to traditional trend-followers. Investors should consider layering in more dis-
cretionary-oriented solutions to add robustness to their CTA allocation.
14 “The Algorithmic Arms Race,” Reuters. May 21, 2012. http://www.reuters.com/article/2012/05/21/us-trading-blackbox-idUSBRE84K07320120521
-30
-20
-10
0
10
20
30
40
50
60
Retu
rn (
%)
ROLLING 1-YR RETURN - MACRO VS CTA
CS Managed Futures Index
CS Global Macro Index
FORTIGENT® Source: FactSet
F O R F I N A N C I A L P R O F E S S I O N A L U S E O N L Y © 2 0 1 3 F O R T I G E N T , L L C
CONCLUSION Fortigent Research believes that managed futures strategies continue to play an important role in investor portfo-
lios. While alpha generation has waned in recent years, we believe this is primarily due to cyclical factors in the
marketplace. There is preliminary evidence that this adverse environment may be dissipating.
More importantly, managed futures strategies continue to provide important diversification benefits for diversi-
fied portfolios. Correlation levels for CTAs are significantly below those seen in other traditional hedge fund
categories, and provide a positively skewed performance profile not evident in other strategies. These diversifica-
tion benefits made up for performance deterioration of the asset class since 2009, resulting in no material decline
in risk-adjusted performance for diversified portfolios. This suggests the opportunity cost of holding managed
futures allocations is far from unbearable.
With that said, the impending shift in interest rate regime does present a potential structural issue for CTA per-
formance moving forward. One may want to consider managers with less fixed income-centric programs since
the correlation benefits of trend-following that particular asset class could become more problematic. Favoring
programs with diversifying non-trend exposures and different portfolio time horizons should help mitigate this
issue. For the immediate future, we would also favor manager pools with more discretionary influences as they
may be better equipped to capitalize on the dislocations caused by overly accommodative central banks.
As always, ongoing manager due diligence is paramount to navigate this new and more complex world. The uni-
verse of discretionary and non-trend oriented managers is much more heterogeneous than that of intermediate
trend-followers, presenting more potential pitfalls for investors. Careful evaluation of individual strategies, and
understanding how they potentially complement your existing portfolio, remains critical.
F O R F I N A N C I A L P R O F E S S I O N A L U S E O N L Y © 2 0 1 3 F O R T I G E N T , L L C
IMPORTANT DISCLOSURES This report is for illustrative purposes only. Past performance is not indicative of future results. The infor-mation contained in this report has been gathered from sources we believe to be reliable, but we do not guarantee the accuracy or completeness of such information, and we assume no liability for damages result-ing from or arising out of the use of such information. The performance numbers displayed herein may have been adversely or favorably impacted by events and economic conditions that will not prevail in the future. The index is unmanaged and does not incur man-agement fees, transaction costs or other expenses associated with investable products. It is not possible to directly invest in an index. All returns reflect the reinvestment of dividends and other income. The reader must understand that to the extent any opinions are expressed, all such opinions reflect observa-tion and/or judgments as of that particular date. Due to various factors, including changing market conditions, such discussion may no longer be reflective of current position(s) and/or recommendation(s). Ac-cordingly, the reader should consult with a financial professional of the reader’s choosing in determining whether any such opinion, observation, or recommendation is appropriate for a reader’s individual situation (of which the publisher has and expresses no knowledge or opinion). The information presented herein was prepared by employees of Fortigent, LLC. This information is not meant as a guide to investing, or as a source of specific investment recommendations, and Fortigent makes no implied or express recommendations concerning the manner in which any client’s accounts should or would be handled, as appropriate investment decisions depend upon the client’s investment objectives. The information is general in nature and is not intended to be, and should not be construed as legal or tax ad-vice. In addition, the information is subject to change and, although based upon information Fortigent considered reliable, is not guaranteed as to accuracy or completeness. Fortigent make no warranties with re-gard to the information or results obtained by its use and disclaims any liability arising out of the use of, or reliance on, the information. This document is not an offer to sell or the solicitation of an offer to purchase an interest in any fund. Any such offer or solicitation will only be made by means of the Confidential Private Offering Memorandum of the fund (and any amendment thereto) and only in those jurisdictions where permitted by law. Advisors should refer to the Confidential Private Offering Memorandum for more complete information. The enclosed materials are for the exclusive use of financial professionals. They have not been approved by Fortigent’s compliance department for distribution to clients or prospective clients. All materials have been obtained from one or more commercial databases and investment management firms that are not affiliated with Fortigent. The information contained herein is believed to be reliable, but Fortigent does not guarantee the accuracy or completeness of such information nor does it assume liability for damages resulting from or arising out of the use of such information. Please consult your legal or compliance counsel prior to the distri-bution of this information. Understanding Private Fund Investment: The attributes of private funds may vary greatly from those of pub-licly offered securities. Private funds:
• Often engage in leveraging and other speculative investment practices that may increase the risk of investment loss;
• May be highly illiquid; • Are not required to provide periodic pricing or valuation information to investors; • May involve complex tax structures and delays in distributing important tax information; • Are not subject to the same regulatory requirements as mutual funds; and • Often charge high fees.
FOR FINANCIAL PROFESSIONAL USE ONLY. THIS DOCUMENT HAS NOT BEEN APPROVED FOR CLIENT USE.