Embed Size (px)
Citation preview

Monetary Policy Council
March 2018
Inflation Report

Inflation Report – March 2018
2
The Inflation Report presents the Monetary Policy Council's assessment of the macroeconomic developments
influencing inflation. The projection of inflation and GDP presented in Chapter 4 was prepared at the
Economic Analysis Department of Narodowy Bank Polski (NBP). In terms of the contents, works on the
projection were supervised by Piotr Szpunar, Director of the Economic Analysis Department. The projection
was prepared with the use of the NECMOD macroeconomic model. The NBP Management Board approved
the submission of the projection to the Monetary Policy Council. The inflation projection is one of the inputs
to the Monetary Policy Council's decision-making process.
The time frame of the analysis presented in the Report is conditioned by the availability of macroeconomic
data. In turn, the periodisation of the analysis (breakdown into sub-periods) is conditioned by the
development of particular variables. The cut-off date for the data in this Report was 22 February 2018.
This Inflation Report is a translation of NBP’s Raport o inflacji in Polish. In case of discrepancies, the original
prevails.

3
Summary 5
External developments 7
1.1 Economic activity abroad 7
1.2 Inflationary developments abroad 9
1.3 Global commodity markets 10
1.4 Monetary policy abroad 11
1.5 International financial markets 12
Domestic economy 15
2.1 Consumer prices 15
2.2 Demand and output 16
2.3 Financial situation in the enterprise sector 21
2.4 Labour market 22
2.5 Monetary policy and asset markets 24
2.6 Money and credit 26
2.7 Balance of payments 28
Box: Poland and other European countries in the light of the macroeconomic imbalance
procedure 29
Monetary policy in November 2017 – March 2018 33
Projection of inflation and GDP 47
4.1 Summary 48
4.2 External environment 50
4.3 Polish economy in 2018-2020 53
4.4 Current versus previous projection 65
4.5 Forecast uncertainty sources 68
The voting of the Monetary Policy Council members in October 2017 – January 2018 73
Contents

Inflation Report – March 2018
4

5
Summary
Summary
The global economy continues to recover. Good economic conditions remain, in particular, in Poland’s
major trading partners. In the second half of 2017, GDP growth increased in the euro area, the Central
and Eastern European economies and the United States, while in the major emerging market economies
it was somewhat weaker than in the first half of 2017.
Despite favourable global economic conditions, inflation in the external environment of the Polish
economy remains moderate. This is supported by relatively low core inflation and lower global prices of
agricultural commodities than in the previous year.
Given the still moderate inflation in the euro area – despite good economic conditions – the European
Central Bank (ECB) keeps interest rates close to zero, including a negative deposit rate. At the same time,
the ECB continues to purchase financial assets, although it has reduced the scale of monthly purchases.
In the United States – amid very strong labour market conditions and the expected stabilisation of
inflation close to the Federal Reserve target – the gradual tightening of monetary policy continues.
Global equity prices, following a long period of growth, in February 2018 declined temporarily, which
was related to the increase in the scale of the expected hikes in the fed funds rate. The decline in global
equity prices was accompanied by a rise in bond yields, in particular in the United States. Alongside this,
in view of the favourable economic outlook for emerging market economies, government bond yields in
these countries rose only slightly, while their currencies strengthened.
Annual consumer price growth in Poland remains moderate due to still limited, although gradually
rising, internal demand pressure and low import price growth. This is accompanied by weakening
energy price growth. The main driver pushing up inflation is the high, yet declining, food price growth.
Economic conditions in Poland remain favourable, with GDP growth picking up markedly in the second
half of 2017. Increasing consumer demand – supported by rising employment and accelerating wages,
very good consumer sentiment and disbursement of benefits – continues to be a significant driver of
GDP growth. In 2017 Q4, there was also a strong recovery in investment. Investment accelerated mainly
in the public sector, however gross fixed capital formation in the corporate sector probably increased as
well. The growth in economic activity was additionally supported by rising exports, benefiting from
good economic conditions in the external environment of the Polish economy. At the same time, amid
accelerating domestic demand, imports growth also increased. As a result, net exports had a negative
contribution to GDP growth in 2017 Q4. Sectoral decomposition of GDP growth indicates that in the
second half of 2017, services and industry continued to make significant contributions to GDP growth,
while construction played a growing role.
Gradually rising demand in the economy supports further growth in labour demand, which translates
into continued increase in employment growth and decline in unemployment. Consequently, the
position of employees in wage negotiations is improving, and the share of companies forecasting wage
increases is rising, which supports a pickup in wage growth in the economy. This is accompanied by
faster GDP growth, translating into an increase in labour productivity growth. Accordingly, growth in
unit labour costs remains moderate.

6
Inflation Report – March 2018
Continued favourable economic conditions are accompanied by growth in broad money aggregate (M3),
which is mainly accounted for by the increase in the current deposits of households and companies. In
2017, the growth of broad money supply continued to be driven by a stable rise in loans to the non-
financial sector at the rate slightly lower than the nominal GDP growth rate. Household loans are still the
most important source of lending growth, although corporate loans are also increasing markedly.
The Monetary Policy Council keeps NBP interest rates unchanged, including the reference rate at 1.50%.
The majority of market participants currently expect NBP interest rates to remain stable in 2018, while
some of them await an increase in the NBP rates further ahead.
In recent months, government bond yields in Poland have been relatively stable, despite a significant
growth of yields in developed markets. At the same time, equity prices in Poland have declined,
reflecting a change in sentiment in the global financial markets, and strong data on the Polish economy
has supported the appreciation of the zloty against all the major currencies. In the residential real estate
market, high demand is accompanied by further increase in supply of flats. In effect, flat prices increased
moderately. In the commercial real estate market, in turn, stable demand translated into slightly
decreasing rents.
Strong domestic economic conditions are accompanied a balanced current account position. This was
due to a high trade surplus in the second half of 2017, coupled with a significant primary income deficit.
As the inflow of EU funds gradually rose, so did the surplus on the capital account in the second half of
2017, while the financial account balance was close to zero.
The Report is structured as follows: Chapter 1 presents the analysis of economic conditions in the
external environment of the Polish economy in terms of their impact on inflation developments in
Poland. These developments and the domestic factors that might affect them have been described in
Chapter 2. Minutes of the Monetary Policy Council decision-making meetings held in November 2017 –
February 2018, together with the Information from the meeting of the Monetary Policy Council in March 2018
are presented in Chapter 3. Minutes of the MPC meeting held in March will be published on 29 March
2018 and so will be included in the next Report. The Monetary Policy Council voting records from the
meetings held between October 2017 and January 2018 can be found in Chapter 5. This Report also
includes a box: Poland and other European countries in the light of the macroeconomic imbalance procedure.
Chapter 4 of the Report presents the projection for inflation and GDP based on the NECMOD model,
which is one of the inputs into the Council's decision-making process on the NBP interest rates. In line
with the projection – prepared under the assumption of unchanged NBP interest rates and taking into
account data available until 16 February 2018 – there is a 50-percent probability that the annual price
growth will be in the range of 1.6-2.5% in 2018 (against 1.6-2.9% in the November 2017 projection), 1.7-
3.6% in 2019 (compared to 1.7-3.7%) and 1.9-4.1% in 2020. At the same time, the annual GDP growth –
according to this projection – will be with a 50-percent probability in the range of 3.5-5.0% in 2018
(against 2.8-4.5% in the November 2017 projection), 2.8-4.8% in 2019 (compared to 2.3-4.3%) and 2.6-4.6%
in 2020.

7
1. External developments
External developments
1.1 Economic activity abroad
The global economy continues to recover. Still
favourable economic conditions in many countries
are supported by – apart from rising consumer
demand – growth of investment activity and
recovery in global trade (Figure 1.1).
Good economic conditions continue in particular
in Poland’s major trading partners. In the euro
area, annual GDP growth in the second half of 2017
was higher than in the previous half year (in 2017
Q3 and Q4, 2.7% and 2.7% y/y respectively, Figure
1.2). Economic growth continues to be driven
primarily by domestic demand, particularly
private consumption, with a positive contribution
of investment outlays. Further growth of domestic
demand in the euro area is backed by the gradual
rise in employment and wages, the optimism of
consumers and enterprises, and the continued
expansionary monetary policy of the European
Central Bank (see Chapter 1.4 Monetary policy
abroad). The pickup in the euro area economic
activity is increasingly supported by growing
exports, related to the recovery in both intra- and
extra-euro area trade, the latter despite the
appreciation of the euro.
Favourable economic conditions in the euro area
are boosting exports of the CEE economies.
However, it is domestic demand that continues to
be the main driver of the relatively fast GDP
growth persisting in these economies (Figure 1.3).
The ongoing rise in consumption, underpinned by
high wage growth and further employment
growth, is accompanied by a gradual recovery in
investment demand.
In the United States, GDP growth in the second
half of 2017 also increased (to 2.3% and 2.5% y/y in
Q3 and Q4, Figure 1.4). Consumer demand
Figure 1.1 GDP growth and global economic activity indicators
(y/y)
Source: Bloomberg, Centraal Planbureau, Eurostat, IMF data,
NBP calculations. GDP, industrial output and retail sales – GDP-weighted average annual growth in economies
comprising 80% of global GDP in 2016. Exports – global export growth rate estimated by
Centraal Planbureau.
Figure 1.2 GDP growth in the euro area and its components (y/y)
Source: Eurostat data, NBP calculations.
Figure 1.3 Economic growth and its selected components in
countries of Central and Eastern Europe (y/y)
Source: Eurostat data, NBP calculations. GDP-weighted annual growth rate of the total GDP, private consumption and gross fixed
capital formation in non-euro area Central and Eastern European EU member states (excluding
Poland).
-20
-15
-10
-5
0
5
10
15
20
-20
-15
-10
-5
0
5
10
15
20
02q1 05q1 08q1 11q1 14q1 17q1
per cent
GDP
Industrial output
Retail sales
Exports
-8
-6
-4
-2
0
2
4
6
-8
-6
-4
-2
0
2
4
6
04q1 07q1 10q1 13q1 16q1
per cent
Net exportsChange in inventoriesPublic consumptionInvestmentPrivate consumptionGDP
-40
-30
-20
-10
0
10
20
30
-9
-6
-3
0
3
6
9
05q1 08q1 11q1 14q1 17q1
per cent
GDP (lhs)
Consumption (lhs)
Investment (rhs)

8
Inflation Report – March 2018
continues to be the main driver of growth in the US
economy, amid rising employment and wages, as
well as increasing wealth of households, mainly
due to the growth in the prices of financial assets
(see Chapter 1.5 International financial markets). The
growth in economic activity in the United States is
also backed by further rise in corporate
investment. The pickup in corporate investment in
the second half of 2017 was accompanied by a
slight increase in annual export growth.
In the United Kingdom, GDP growth remains
moderate, although in the second half of 2017 it
was slightly lower than in the previous half year
(Figure 1.4). This was accounted for by a
weakening of investment growth associated with
the heightened uncertainty about the shape of the
Brexit agreement. Private consumption growth
was also lower than in the first half of the year,
held back by the negative growth in real wages.
Alongside that, the rise in economic activity is
increasingly supported by exports, whose growth
is driven by the recovery in global trade, together
with the exchange rate of the British pound
weaker than a year earlier.
In the major emerging market economies, GDP
growth at the end of 2017 was somewhat lower
than in the first half of 2017 (Figure 1.5). In Russia,
this was mainly due to a slowdown in investment,
following its strong but temporary rise in the
second quarter, which was to a large extent
associated with the implementation of investment
projects in the extractive industry. The fall in
export growth related to the strengthening of the
ruble also lowered GDP growth. In China, a slight
decline in GDP growth reflected a drag from
weakening investment growth, resulting from the
deliberate actions by the government to reduce
demand in the housing market and gradually
restrain output in heavy industry. At the same
time, the pickup in exports gave a boost to China's
Figure 1.4 Economic growth in selected advanced economies (y/y)
Source: Bloomberg data.
Figure 1.5 Economic growth in selected emerging market
economies (y/y)
Source: Bloomberg data.
-8
-6
-4
-2
0
2
4
6
-8
-6
-4
-2
0
2
4
6
05q1 08q1 11q1 14q1 17q1
United States
United Kingdom
per cent
-15
-10
-5
0
5
10
15
20
-15
-10
-5
0
5
10
15
20
05q1 08q1 11q1 14q1 17q1
per cent
China Russia

9
1. External developments
1 Factors holding down core inflation include legislative changes regarding health care and cuts in the prices of telephone
subscriptions.
GDP. The steady rise in consumer demand also
continues to add to economic growth in this
country.
1.2 Inflationary developments abroad
Despite favourable global economic conditions,
inflation in the external environment of the Polish
economy remains moderate (Figure 1.6). This is
supported by relatively low core inflation. The
relatively weak growth in food prices, accounted
for the lower global prices of agricultural
commodities than in the previous years, also has a
curbing effect on the growth of global inflation. In
turn, global energy commodity prices, including
oil prices, increased in the second half of 2017,
which translated into higher energy price growth
(see chapter 1.3 Global commodity markets).
In the euro area, inflation remains below the ECB's
definition of price stability ( in January 2018 it
stood at 1.3% y/y; Figure 1.7). It is held back by the
persistently low core inflation, whose growth has
been contained by the still weak wage growth. The
latter is partly related to the still elevated
unemployment rate in some countries of the euro
area, and also the weak wage increases agreed
under collective bargaining agreements. Consumer
price growth is additionally limited by the stronger
exchange rate of the euro than a year ago.
In the United States, inflation is still higher than in
most other advanced economies. This is backed by
the economic recovery evolving there over past
few years and reflected in good labour market
conditions, including the significantly lower
unemployment rate than its long-term average.
Despite this, core inflation is lower than in 2016,
which, however, is to a large extent due to
temporary factors.1
Figure 1.6 CPI inflation globally and in selected economies (y/y)
Source: Bloomberg data, NBP calculations. World – GDP-weighted average consumer price inflation in economies comprising 80% of
global GDP. Central and Eastern Europe – GDP-weighted annual CPI inflation in the non-euro
area Central and Eastern European EU member states (excluding Poland). United States –
annual CPI inflation. Euro area – annual HICP inflation.
Figure 1.7 Core inflation indices in the United States, the euro
area and Central and Eastern Europe (y/y)
Source: Bloomberg data, NBP calculations. United States – annual CPI inflation excluding food and energy prices. Euro area – annual
HICP inflation excluding unprocessed food and energy prices. Central and Eastern Europe –
GDP-weighted annual HICP inflation excluding food and energy prices in in the non-euro area
CEE EU member states (excluding Poland).
-4
-2
0
2
4
6
8
10
-4
-2
0
2
4
6
8
10
05m1 08m1 11m1 14m1 17m1
per cent
World
United States
Euro area
Central and Eastern Europe
0
1
2
3
4
5
6
0
1
2
3
4
5
6
05m1 08m1 11m1 14m1 17m1
per cent
United States
Euro area
Central and Eastern Europe

10
Inflation Report – March 2018
In the Central and Eastern European region, in
turn, inflation rose in the second half of 2017,
supported by a pickup in GDP growth and
relatively fast wage growth. Inflation was also
driven by a strong rise in food prices, mainly
related to temporary supply constraints in the
markets of some foodstuffs. However, despite the
gradual increase in price growth, inflation rates in
the majority of countries in the region still remain
below their long-term averages (Figure 1.7).
1.3 Global commodity markets
Over the recent past, prices of most energy
commodities have risen again to remain higher
than in the previous year, while agricultural
commodity prices have continued to fall (Figure
1.8; Figure 1.9; Figure 1.10).
Oil prices – after a temporary decline in early
February 2018 connected with some deterioration
in sentiment in the global financial markets (see
Chapter 1.5 International financial markets) – have
recently increased again (Figure 1.9). The rise in
prices of this commodity was mainly due to the
cuts in oil production by the Organisation of
Petroleum Exporting Countries (OPEC) and some
other oil exporters, along with continued growth in
demand for this commodity amid favourable
global economic conditions. As a result, global oil
stocks systematically declined, thus boosting oil
prices. The rise in oil prices is, however, contained
by the increase in shale oil production in the
United States.
Prices of other energy commodities – following an
earlier fall in the wake of the decline in oil prices –
have also increased in the recent period (Figure
1.9). Coal prices continued to rise, driven mainly
by high demand on the part of Asian countries. In
particular, demand from China rose, accompanied
by the simultaneous restrictions in coal production
by some Chinese producers. In turn, natural gas
prices in the recent period have been affected,
Figure 1.8 Commodity price index
Source: Bloomberg data, NBP calculations. Thomson Reuters/CoreCommodity CRB index, which is an arithmetic average of prices for the
following 19 commodity futures: aluminium, unleaded gasoline, cocoa, coffee, copper, corn,
cotton, crude oil, gold, heating oil, hogs, live cattle, natural gas, nickel, orange juice, silver,
soybeans, sugar and wheat.
Figure 1.9 Energy commodity prices
Source: Bloomberg data, NBP calculations. USD/b – price expressed in US dollar per barrel of oil. USD/MMBTu – price expressed in US
dollar of British Thermal Unit, i.e. unit representing a quantity of energy required to raise the
temperature of 1 pound (approx. 0.45 kg) of water by 1°F (slightly more than 0.5°C).
Figure 1.10 Index of agricultural commodity prices
Source: Bloomberg data, NBP calculations. Index of agricultural prices includes prices of wheat, colza, pork, potatoes, sugar, cocoa, coffee,
skimmed milk powder, butter and frozen concentrated orange juice. The weights reflect the
consumption structure of Polish households.
0
20
40
60
80
100
120
0
20
40
60
80
100
120
12m1 13m1 14m1 15m1 16m1 17m1 18m1
index,Jan-12=100
0.0
2.5
5.0
7.5
10.0
12.5
15.0
0
25
50
75
100
125
150
12m1 13m1 14m1 15m1 16m1 17m1 18m1
Crude oil (Brent, USD/b, lhs)
Coal (USD/t, lhs)
Gas (USD/MMBtu, rhs)
75
80
85
90
95
100
105
110
115
120
75
80
85
90
95
100
105
110
115
120
12m1 13m1 14m1 15m1 16m1 17m1 18m1
index,
Jan-12=100

11
1. External developments
2 Temporary factors increasing the prices of natural gas in December 2017 included the worsening weather conditions in the United
Kingdom, the pipeline leak in the North Sea and the explosion of the pipeline in Austria.
3 High cereal stocks, high production of oilseeds, meat and dairy products, as well as low feed costs have all contributed to the fall
in prices of agricultural products.
4 In accordance with the decision of October 2017, the ECB purchased EUR 60 billion assets per month until the end of 2017, and
from January 2018 the scale of monthly purchases amounts to EUR 30 billion. The asset purchase programme is intended to be
continued at least until September 2018.
except for changes in oil prices, by increased gas
consumption for heating purposes and one-off
factors.2
Prices of most agricultural commodities have fallen
in recent months, despite the continued robust
consumption growth in the global economy (see
Chapter 1.1 Economic activity abroad). The high
supply of agricultural commodities, supported by
their relatively low production costs and
significant stocks of some agricultural products,
contributed to the decline in their prices (Figure
1.10). 3
1.4 Monetary policy abroad
Given the still moderate inflation in the euro area
(see Chapter 1.2 Inflationary developments abroad) –
despite good economic conditions (see Chapter 1.1
Economic activity abroad) – the European Central
Bank (ECB) keeps interest rates close to zero,
including a negative deposit rate. As a result,
short-term interbank interest rates remain
negative. At the same time, the ECB continues to
purchase financial assets, although – according to
its earlier decision – in 2018 it has reduced the scale
of monthly purchases (Figure 1.11).4 Moreover, the
ECB still expects its interest rates to remain at their
present levels well past the horizon of the net asset
purchases. Consequently, market participants do
not expect changes in the ECB interest rates in the
coming quarters (Figure 1.12). At the same time,
the ECB has declared that it will reinvest the
principal payments from maturing securities
purchased under the quantitative easing
programme for an extended period of time after
the end of its net asset purchases, which will help
Figure 1.11 Total assets of the major central banks with a forecast
Source: FRED data, NBP calculations. Forecast until September 2018: for the Eurosystem under an assumption of growth by 30 billion
EUR per month, for the Bank of Japan under an assumption of extrapolation of the growth rate
observed in period from 2017 Q2 to 2017 Q4, for the Federal Reserve System under an
assumption of a decline in accordance with the Fed’s reinvestment policy principles and taking
into account maturity structure of the Treasuries held by the central bank.
Figure 1.12 Historical and expected interest rates of the ECB
Source: Bloomberg data. Expected interest rates based on the overnight index swaps for the rates on the deposit facility
and the main refinancing operations.
0
110
220
330
440
0
50
100
150
200
07m1 09m1 11m1 13m1 15m1 17m1
Eurosystem (lhs)
Federal Reserve System (lhs)
Bank of Japan (rhs)
index,Jan-12=100
index,Jan-12=100
-0.50
-0.25
0.00
0.25
0.50
0.75
1.00
1.25
1.50
1.75
2.00
-0.50
-0.25
0.00
0.25
0.50
0.75
1.00
1.25
1.50
1.75
2.00
12m1 14m1 16m1 18m1
Deposit facility
Main refinancing operations
per cent

12
Inflation Report – March 2018
preserve expansionary monetary conditions.
By contrast, in the United States, amid very strong
labour market conditions and the prospect of a
stabilisation of inflation close to the Federal
Reserve (Fed) target, the gradual tightening of
monetary policy continues. In 2017, the Fed raised
the target range for the fed funds rate three times
(each time by 0.25 percentage points) to 1.25-1.50%.
The median projection of the members of the
Federal Open Market Committee (FOMC) indicates
three further interest rate hikes in 2018 (in total by
0.75 percentage points). In recent months, due to
improvement in economic outlook, market
expectations regarding fed funds rate hikes have
strengthened and also indicate an increase by 0.75
percentage points in 2018 (Figure 1.13). At the
same time, the Fed is gradually reducing its
balance sheet by limiting the reinvestment of
assets, which additionally contributes to the
tightening of monetary conditions in the United
States (Figure 1.11).
Most of the other central banks in advanced
economies are keeping interest rates close to zero.
Additionally, the Bank of Japan is continuing its
quantitative easing programme, while the Swiss
National Bank declares its readiness to carry out
currency interventions in order to prevent an
excessive appreciation of the Swiss franc.
Alongside this, in some advanced economies
central banks are gradually limiting the scale of
monetary policy accommodation. In particular, in
recent months interest rates were raised in the
Czech Republic, Canada, and South Korea.
In some of the emerging market economies, in
turn, central banks continued to reduce interest
rates amid relatively low inflation (Figure 1.14).
1.5 International financial markets
Following a long period of growth, in February
2018 global equity prices fell temporarily, while
their volatility increased markedly. The fall in
Figure 1.13 Historical and expected interest rates in the United
States (midpoint of the target range for the fed funds rate)
Source: Bloomberg and Fed data. Market expectations based on fed funds futures contracts.
Figure 1.14 Central banks’ interest rates in major emerging
market economies
Source: Bloomberg data.
Figure 1.15 Risk assessment measures in global financial markets
Source: Bloomberg data.
0.0
0.5
1.0
1.5
2.0
2.5
3.0
3.5
4.0
0.0
0.5
1.0
1.5
2.0
2.5
3.0
3.5
4.0
12m1 14m1 16m1 18m1 20m1
Fed funds rate
Market expectations (as of 22 February 2018)
Market expectations (as of 25 October 2017)
FOMC projection (as of 13 December 2017)
per cent
4
6
8
10
12
14
16
18
4
6
8
10
12
14
16
18
12m1 13m1 14m1 15m1 16m1 17m1 18m1
Brazil India
China Russia
per cent
0
100
200
300
400
0
60
120
180
240
07m1 09m1 11m1 13m1 15m1 17m1
Spread between the yields on the government bondsin the US and in emerging market economies (lhs)
Spread between the yields on bonds of the lowestand the highest investment grade in the US (lhs)
VIX index (rhs)
index, Jan-12=100
index, Jan-12=100

13
1. External developments
equity prices was related to the increase in the
scale of the expected Fed interest rate hikes (see
Chapter 1.4 Monetary policy abroad). However, so
far, this has not been accompanied by a rise in risk
assessment in other markets (Figure 1.15; Figure
1.16). Continued relatively positive sentiment was
underpinned by stronger global economic recovery
(see Chapter 1.1 Economic activity abroad) amid still
accommodative monetary conditions in many
major economies, including the euro area and
Japan.
The temporary fall in global equity prices was
accompanied by an increase in bond yields (Figure
1.17). Yields rose, in particular, in the United States
as the expectations of interest rate hikes by the Fed
strengthened. In the euro area, in turn, bond yields
rose to a slightly lesser extent and remained very
low. This was backed by the expected continuation
of the accommodative monetary policy by the ECB.
In view of the favourable economic outlook for
emerging market economies, government bond
yields in these markets rose only slightly, despite a
significant increase in bond yields in the United
States.
The favourable outlook for emerging market
economies was also conducive to the appreciation
of the currencies of some of these economies,
mainly against the US dollar (Figure 1.18). At the
same time, in response to the stronger-than-
expected improvement in economic conditions in
the euro area, the euro also strengthened markedly
against the US dollar, and following this so did the
currencies of the Central and Eastern Europe.
Figure 1.16 Global equity prices
Source: Bloomberg data. Advanced economies – MSCI World Equity Index, emerging market economies
– MSCI Emerging Markets Equity Index.
Figure 1.17 Global bond yields
Source: Bloomberg data.
Figure 1.18 Exchange rates of emerging markets currencies and
the euro against the US dollar (rise indicates appreciation)
Source: Bloomberg data. Emerging market economies – MSCI Emerging Market Currency Index; Central and Eastern
Europe – GDP-weighted average of exchange rates of the Polish zloty, the Czech koruna, and
the Hungarian forint against the US dollar.
40
80
120
160
200
40
80
120
160
200
07m1 09m1 11m1 13m1 15m1 17m1
Emerging market economies
Advanced economies
index, Jan-12=100
-1
0
1
2
3
4
5
6
-1
0
1
2
3
4
5
6
07m1 09m1 11m1 13m1 15m1 17m1
United States Germany
per cent
60
75
90
105
120
135
150
70
80
90
100
110
120
130
07m1 09m1 11m1 13m1 15m1 17m1
Emerging market economies (lhs)
Euro (lhs)
Central and Eastern Europe (rhs)
index,Jan-12=100
index,Jan-12=100

Inflation Report – March 2018
14

2. Domestic economy
15
Domestic economy
5 Data on inflation in January 2018 may be revised as a result of the change in the weights in the CPI basket carried out by GUS at
the beginning of each year. Due to the preliminary nature of the data, GUS has not published information on price changes of all
the components of the CPI basket.
6 In 2017 Q3 import price growth stood at 1.5% y/y compared to 1.4% y/y in the previous quarter.
7 The annual growth in prices of heating fuels was the result of an increase in coal prices, both globally and in the domestic market,
where quality standards were tightened as part of measures to reduce air pollution.
2.1 Consumer prices
Annual consumer price growth in Poland remains
moderate (in January 2018 it stood at 1.9% y/y5;
Figure 2.1) due to still limited, although gradually
rising, internal demand pressure (Figure 2.3). At
the same time, import price growth continues low,
due to moderate inflation in the major trading
partners of Poland and a stronger zloty than a year
ago.6 This is accompanied by weakening energy
price growth. However, the main driver pushing
up inflation is the high, yet declining, food price
growth.
Core inflation is still low despite a pickup in
consumption growth (Figure 2.2). The persistence
of core inflation at a low level is supported by a
further decline in the prices of non-food goods
(-0.7% y/y in December 2017), coupled with stable
growth in services prices in recent months
(2.6% y/y).
Annual growth of energy prices in 2017 was
significantly higher than in previous years,
although in recent months it gradually decelerated,
mainly due to the declining annual growth of fuel
prices. The decline in the annual growth of fuel
prices was mainly caused by the fading of the
statistical base effects related to strong growth in
oil prices at the end of 2016. Another factor
containing fuel price growth was the appreciation
of the zloty. The decrease in fuel price growth was
accompanied by higher annual growth in prices of
heating fuels.7
Figure 2.1 Composition of CPI inflation (y/y)
Source: GUS data, NBP calculations.
Figure 2.2 Core inflation indices (y/y)
Source: GUS data, NBP calculations.
Figure 2.3 Inflation index of goods sensitive to domestic
economic conditions (y/y)
Source: GUS data, NBP calculations. The aggregate of the CPI components sensitive to changes in domestic economic conditions.
For more on the index calculation methodology, see: Hałka, A., Kotłowski, J. (2014), Does the
domestic Output Gap Matter for Inflation in a Small Open Economy, Eastern European Economics,
vol. 52.
-4
-2
0
2
4
6
8
-4
-2
0
2
4
6
8
01m1 04m1 07m1 10m1 13m1 16m1
per cent
Food and non-alcoholic beverages
Energy
Goods
Services
CPI
-4
-2
0
2
4
6
8
10
-4
-2
0
2
4
6
8
10
01m1 04m1 07m1 10m1 13m1 16m1
per centVariability interval of core inflation indices
Inflation excluding most volatile prices
Inflation excluding food and energy prices
Inflation excluding administered prices
15% trimmed mean
-2
0
2
4
6
8
10
-2
0
2
4
6
8
10
01m1 04m1 07m1 10m1 13m1 16m1
per cent
Inflation Report – March 2018
16
Higher food prices than a year earlier were
connected, in particular, with lower domestic
supply of most fruit and some vegetables (the
effect of unfavourable weather conditions in spring
and summer 2017). The prices of meat, dairy
products and butter increased as well, which was
driven by the temporary decline in their
production around the world, amid continued
high global demand. Internal demand also rose
along with rising household income, which
additionally supported higher growth of domestic
food prices.
In recent months, annual producer price growth
slowed down, despite the persistent robust growth
of industrial output (Figure 2.4). This was due to
the waning of statistical base effects related to the
growth of some commodity prices at the end of
2016 and also the appreciation of the zloty. At the
same time, growth in export producer prices
decelerated more sharply than domestic producer
prices.
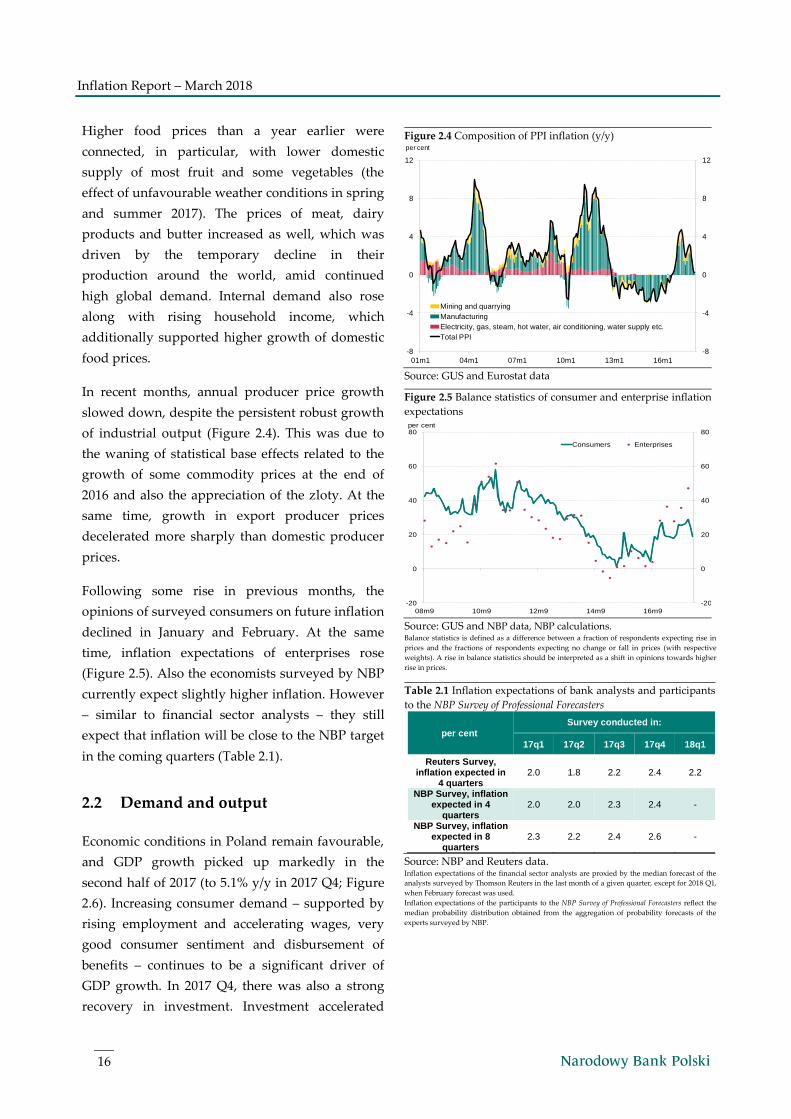
Following some rise in previous months, the
opinions of surveyed consumers on future inflation
declined in January and February. At the same
time, inflation expectations of enterprises rose
(Figure 2.5). Also the economists surveyed by NBP
currently expect slightly higher inflation. However
– similar to financial sector analysts – they still
expect that inflation will be close to the NBP target
in the coming quarters (Table 2.1).
2.2 Demand and output
Economic conditions in Poland remain favourable,
and GDP growth picked up markedly in the
second half of 2017 (to 5.1% y/y in 2017 Q4; Figure
2.6). Increasing consumer demand – supported by
rising employment and accelerating wages, very
good consumer sentiment and disbursement of
benefits – continues to be a significant driver of
GDP growth. In 2017 Q4, there was also a strong
recovery in investment. Investment accelerated
Figure 2.4 Composition of PPI inflation (y/y)
Source: GUS and Eurostat data
Figure 2.5 Balance statistics of consumer and enterprise inflation
expectations
Source: GUS and NBP data, NBP calculations. Balance statistics is defined as a difference between a fraction of respondents expecting rise in
prices and the fractions of respondents expecting no change or fall in prices (with respective
weights). A rise in balance statistics should be interpreted as a shift in opinions towards higher
rise in prices.
Table 2.1 Inflation expectations of bank analysts and participants
to the NBP Survey of Professional Forecasters
per cent
Survey conducted in:
17q1 17q2 17q3 17q4 18q1
Reuters Survey, inflation expected in
4 quarters 2.0 1.8 2.2 2.4 2.2
NBP Survey, inflation expected in 4
quarters 2.0 2.0 2.3 2.4 -
NBP Survey, inflation expected in 8
quarters 2.3 2.2 2.4 2.6 -
Source: NBP and Reuters data. Inflation expectations of the financial sector analysts are proxied by the median forecast of the
analysts surveyed by Thomson Reuters in the last month of a given quarter, except for 2018 Q1,
when February forecast was used.
Inflation expectations of the participants to the NBP Survey of Professional Forecasters reflect the
median probability distribution obtained from the aggregation of probability forecasts of the
experts surveyed by NBP.
-8
-4
0
4
8
12
-8
-4
0
4
8
12
01m1 04m1 07m1 10m1 13m1 16m1
per cent
Mining and quarrying
Manufacturing
Electricity, gas, steam, hot water, air conditioning, water supply etc.
Total PPI
-20
0
20
40
60
80
-20
0
20
40
60
80
08m9 10m9 12m9 14m9 16m9
Consumers Enterprises
per cent

2. Domestic economy
17
8 In 2017 Q3, local government investment grew by 48.8% y/y.
mainly in the public sector, however gross fixed
capital formation in the corporate sector probably
increased as well. The growth in economic activity
was additionally supported by rising exports,
benefiting from strong economic conditions in the
external environment of the Polish economy. At
the same time, amid accelerating domestic
demand, imports growth increased as well.
Consequently, net exports had a negative
contribution to GDP growth in 2017 Q4.
2.2.1 Consumption
Consumer demand continues to be an important
driver of GDP growth. In the second half of 2017,
private consumption growth remained close to its
level recorded in the first half-year (4.8% y/y in
2017 Q3 and 4.9% y/y in 2017 Q4; Figure 2.7).
Consumption growth is supported by rising
household disposable income due to the continued
increase in employment, a pickup in wage growth
and the disbursement of benefits under the
“Family 500 plus” programme. Robust consumer
sentiment also has a positive effect on
consumption growth (Figure 2.8). However, real
private consumption growth is limited by a rise in
consumer prices, which is higher than in previous
years.
2.2.2 Investment
Investment picked up markedly in the second half
of 2017 (to 11.3% y/y in 2017 Q4; Figure 2.9). Gross
fixed capital formation rose on the back of
accelerated public investment, coupled with a
recovery in corporate investment. Housing
investment also continued to rise.
Public investment growth accelerated significantly
in the second half of 2017 as the absorption of EU
funds gradually increased. The pickup in public
investment concerned, in particular, investment of
local government units.8
Figure 2.6 GDP growth and its components (y/y)
Source: GUS data.
Figure 2.7 Growth in private consumption and wage bill in the
national economy (y/y)
Source: GUS data, NBP calculations.
Figure 2.8 Consumer confidence indicators
Source: GUS data, NBP calculations. The dashed line denotes raw data, while the solid line denotes HP filtered data.
-6
-3
0
3
6
9
12
-6
-3
0
3
6
9
12
03q1 06q1 09q1 12q1 15q1
per cent
Private consumption
Gross fixed capital formation
Change in inventories
Net exports
Public consumption
GDP
-4
0
4
8
12
16
20
-2
0
2
4
6
8
10
04q1 06q1 08q1 10q1 12q1 14q1 16q1
per centper cent
Private consumption (lhs)
Payroll in the national economy (real, rhs)
-50
-40
-30
-20
-10
0
10
-50
-40
-30
-20
-10
0
10
04m1 06m1 08m1 10m1 12m1 14m1 16m1 18m1
Current consumer confidence indicator
Leading consumer confidence indicator

Inflation Report – March 2018
18
In 2017 Q3, investment outlays of a substantial part
of enterprises also rose, yet due to a fall in the
investment outlays of energy firms, investment
growth of the whole sector remained negative. In
2017 Q4, the recovery in investment extended
already to the entire sector. Considering the
optimistic demand outlook and high capacity
utilisation, corporate investment activity will
probably gather pace in 2018. This is indicated by
the findings of NBP surveys, according to which
firms are planning to increase both the number and
the scale of investment projects for
implementation.
In the second half of 2017, housing investment
growth also gained momentum. Robust housing
demand is supported by an increase in households'
disposable income, which boosts their capacity to
finance home purchases, especially given the
relatively low interest on loans. At the same time,
households' propensity to make such investments
is also high, owing to very strong sentiment of
those agents, including highly positive assessments
of their future financial situation.
2.2.3 Public finance
In view of the favourable economic conditions,
rising employment and acceleration in wage
growth, as well as improved tax collection, mainly
in the case of VAT, the performance of the general
government sector (ESA2010) in 2017 probably
improved significantly compared to 2016 (at that
time the deficit of the sector amounted to 2.5% of
GDP). This is indicated by very good data on the
general government balance after the first three
quarters of 2017 and the low state budget deficit in
2017 (PLN 25.4 billion; Figure 2.10). The good
outturn of the state budget was a result of a
significant increase in budget revenue (11.4% y/y),
amid relatively low expenditure growth (4.2% y/y).
Fiscal policy in 2018 will be similar to that
implemented in 2017. On the revenue side, a
Figure 2.9 Investment in the economy and its major components
(y/y)
Source: GUS data, NBP calculations. NBP estimates, seasonally adjusted
Figure 2.10 State budget balance
Source: Ministry of Finance data.
-20
-10
0
10
20
30
-20
-10
0
10
20
30
04q1 07q1 10q1 13q1 16q1
per cent
Residential real estate investmentPublic investmentCorporate investmentGross fixed capital formation
-5
-4
-3
-2
-1
0
-5
-4
-3
-2
-1
0
1999 2002 2005 2008 2011 2014 2017
per cent of GDP

2. Domestic economy
19
9 In this chapter, the GUS data on exports and imports of goods in PLN terms is analysed. Trends in trade of services are not
described, as no detailed data on the breakdown of the value of trade by the type of service and its destination is available.
continuation of measures to improve tax collection
(VAT and income taxes) is expected to generate
additional revenue of 0.6% of GDP, while keeping
the most important tax rates unchanged (except for
the increase in the tax free amount in the case of
personal income tax). In turn, further growth in
capital expenditure of the general government
sector (including the co-financing of projects
implemented with EU funds under the financial
framework 2014-2020) and higher social
expenditure connected with the lowering of the
statutory retirement age will to a large extent be
offset by lower growth in expenditure on public
consumption. In particular, this will result from the
wage freeze for the majority of budget sector
employees assumed in the Budget Act for 2018.
In 2018 the deficit of the general government sector
(ESA2010) is expected to remain at a similar level
to that of 2017.
2.2.4 External trade
Favourable economic conditions at home and in
the external environment of the Polish economy
are conducive to a further increase in Poland’s
foreign trade turnover.9
In the second half of 2017, the value of exports rose
at a pace close to its multi-year average (Figure
2.11). However, in 2017 Q4 export growth slowed
down somewhat when compared to Q3, which was
partially accounted for by a fall in trade within the
global supply chains.
Export growth is supported by strong economic
conditions in the euro area, translating into fairly
robust growth of sales to this economy across all
the main categories of goods. At the same time,
export growth is contained by the persistent
slowdown in imports of passenger cars in the euro
area. The growth in Polish exports is also fuelled
Figure 2.11 Contribution to export growth by destination (y/y)
Source: GUS data, NBP calculations.
Figure 2.12 Nominal and real effective exchange rate (rise indicates appreciation)
Source: BIS data.
Figure 2.13 Contribution to import growth by commodity (y/y)
Source: GUS data, NBP calculations. Data based on GUS classification of the main product categories for the value of Polish exports
and imports in zlotys. “Other” comprises passenger cars, motor gasoline and goods else not
classified.
-10
0
10
20
30
40
-10
0
10
20
30
40
01q1 04q1 07q1 10q1 13q1 16q1
per cent
euro area Other EU member states
Former USSR countries Other countries
Overall
80
90
100
110
120
130
80
90
100
110
120
130
01m1 04m1 07m1 10m1 13m1 16m1
index2010 = 100
Nominal effective exchange rate
Real effective exchange rate
-20
-10
0
10
20
30
40
50
-20
-10
0
10
20
30
40
50
01q1 04q1 07q1 10q1 13q1 16q1
per cent
Intermediate goods Consumer goods
Capital goods Other
Overall

Inflation Report – March 2018
20
10 Industrial output growth in the second half of 2017 amounted to 7.2% on average, compared to 5.7% on average in the first half
of the year.
by the gradual rebound in sales to the former USSR
countries, which has been ongoing since 2016.
As a result, in the second half of 2017, Polish
external sales were rising at a faster pace than
global exports, which suggests that the
competitiveness of Polish production remains
strong. The significant rise in Polish exports took
place despite the zloty exchange rate stronger than
a year ago. The profitability of exports in euro
terms remained high, whereas at the end of 2017
the average exchange rate of the zloty against the
US dollar approached the borderline export
profitability exchange rate as declared by
enterprises (Figure 2.12).
The value of Polish imports, in turn, grew in the
second half of 2017 at roughly the same rate as in
2017 Q2 (Figure 2.13), despite the appreciation of
the zloty, which had a downward effect on import
prices. This was due to a slight acceleration in
growth of import volumes across all the major
groups of goods, which was related to the
continued rise in domestic demand and exports
that are characterised by considerable import
intensity.
2.2.5 Output
Sectoral decomposition of GDP growth indicates
that economic growth encompasses all sectors. In
the second half of 2017, services and industry
continued to make significant contributions to
GDP growth, while construction played a larger
role than in the first half of the year (Figure 2.14).
Business conditions in industry remained
favourable. Output growth in the second half of
2017 was higher than in the first half of the year
and exceeded its multi-year average.10 The pickup
in economic activity in industry stemmed from
faster growth in consumer and intermediate goods
Figure 2.14 Growth of gross value added by sectors (y/y)
Source: GUS data, NBP calculations. 2017 Q4 data implied from GUS annual data.
Figure 2.15 Construction and assembly output growth by
construction objects (y/y)
Source: GUS data, NBP calculations.
-2
0
2
4
6
8
10
-2
0
2
4
6
8
10
04q1 07q1 10q1 13q1 16q1
per cent
Non-market services Market services and agriculture
Construction Industry
Total value added
-30
-20
-10
0
10
20
30
-30
-20
-10
0
10
20
30
10q1 12q1 14q1 16q1
per cent
Residential buildingsCivil engineering worksNon-residential buildingsConstruction and assembly output overall

2. Domestic economy
21
11 In the second half of 2017, construction and assembly output growth stood at 15.9%, compared to 8.0% in the first half of the
year. However, in 2017 Q4 the recovery in this sector slowed down somewhat compared to 2017 Q3 due to slower output growth
in construction of roads, railways and power networks, and a marked slowdown in construction of office and commercial
buildings.
output, supported by both rising external demand
(see Chapter 1.1 Economic activity abroad) and stable
growth in domestic consumer demand. In 2017 Q4,
along with the recovery in domestic investment,
growth in production of investment goods also
increased. Resilient business confidence and strong
growth in industrial output in January indicate
that the positive trends in this sector will continue
in the coming quarters.
Output growth in construction, positive since the
beginning of 2017, was higher in the second half of
the year than in the first half (Figure 2.15).11
January data indicates the continuation of this
trend in 2018 Q1. The recovery in construction
output was supported by gradually rising
absorption of EU funds from the financial
framework 2014-2020 that translated into growth
in infrastructure construction. Due to the pickup in
the growth of construction of office, commercial
and industrial buildings, output growth in
commercial construction also increased. At the
same time, output in residential construction
continued to rise.
Business conditions in market services also remain
favourable. The rate of growth in this sector’s
value added is stable and slightly higher than its
multi-year average. Available data indicates that
trade as well as transportation and storage
continue to be the main drivers of growth in this
sector (Figure 2.16).
2.3 Financial situation in the enterprise
sector
The favourable economic conditions are conducive
to maintaining good financial performance in the
enterprise sector. High domestic and foreign
Figure 2.16 Growth of gross value added in market services by
branches (y/y)
Source: GUS data, NBP calculations.
Figure 2.17 Gross financial result of enterprises and its
components
Source: GUS data, NBP calculations. Data from the survey conducted by GUS on revenues, costs, financial outcome and investment
(based on F-01/I-01 forms).
-6
-4
-2
0
2
4
6
8
10
-6
-4
-2
0
2
4
6
8
10
08q1 10q1 12q1 14q1 16q1
per cent Professional, scientific and technical activities Real estate activities
Financial and insurance activity Information and communication
Accomodation and catering Transportation and storage
Trade Market services
-30
-20
-10
0
10
20
30
40
50
-30
-20
-10
0
10
20
30
40
50
01q1 04q1 07q1 10q1 13q1 16q1
PLN billion Result on extraordinary events
Financial result from the sale
Result on other operating activity
Result on financial operations
Gross financial result
`

Inflation Report – March 2018
22
demand for Polish products is boosting sales
revenue (growth of 9.2% in 2017 Q3). This is
accompanied by an increase in sales costs –
particularly rapid in the case of raw materials –
which, however, has been slightly slower than
growth in sales revenue. As a result, profit from
sales, i.e. the core business activity of enterprises,
was higher than a year ago (by 14.4%; Figure 2.17).
The improved sales result applied to almost all
sectors, although the strongest growth in profit,
supported by rising prices of energy commodities,
was seen in the energy and mining sectors.
Alongside this, the result on other business
activities was significantly lower in 2017 Q3 than in
the corresponding period of 2016, when it
temporarily rose sharply due to the sale of fixed
assets by some enterprises. Despite the fall, the
result on these activities was close to the long-term
average, and the gross financial result of
enterprises improved (by 8.1% y/y).
Profitability and liquidity indicators also point to
the sound financial position of enterprises. Despite
the increase in costs, sales profitability rose, and
net turnover profitability was close to the level
recorded in 2016 Q3 (Table 2.2). At the same time,
the share of profitable firms remains sizable. The
liquidity position of enterprises continues to be
high, although it was somewhat lower due to
rising operational costs.
2.4 Labour market
Gradually increasing demand in the economy
supports further growth in labour demand, as
Table 2.2 Selected financial efficiency ratios in the enterprise sector
percent 2016 2017
q1 q2 q3 q4 q1 q2 q3
Sales profitability
ratio 4.9 5.1 5.0 5.0 5.1 4.6 5.2
Net turnover
profitability 4.2 5.5 4.2 3.1 4.4 5.3 4.1
Percentage of
profitable enterprises
(sa)
76.5 76.4 75.8 75.2 75.2 74.3 74.4
1st degree liquidity
ratio 37.4 37.2 38.5 38.8 37.4 35.3 36.3
Source: GUS data, NBP calculations. Data from the survey conducted by GUS on revenues, costs, financial outcome and investment
(based on F-01/I-01 forms).
Figure 2.18 Annual growth in employment and economically
active population
Source: GUS data, NBP calculations. People working in the economy (LFS) is a survey-based estimate of the number of working
persons, regardless of employment relationship. Employment in the economy denotes the
enterprise-reported average number of persons performing paid work at the end of each
reporting period. This data does not comprise, among others, businesses employing up to 9
persons, individual farmers, persons contributing to a family business free of charge and
persons working under civil law employment contracts. In addition, data on average
employment in the enterprise sector does not cover the public sector and sole proprietors.
-6
-4
-2
0
2
4
6
8
-6
-4
-2
0
2
4
6
8
01q1 04q1 07q1 10q1 13q1 16q1
per centPeople working in the economy (LFS)
Employment in the economy
Employment in the enterprise sector
Economically active population

2. Domestic economy
23
12 In January 2018, the number of vacancies posted at labour offices rose by 17.8% y/y, while the Job Offer Barometer, measuring
the number of vacancies posted online, rose by 21.1% y/y.
13 Annual growth in the number of working persons according to the LFS is lower than growth in employment in the corporate
sector mainly due to the switch of employees from temporary forms of employment – and perhaps also the grey economy – to
permanent contracts. In 2017 Q4, the number of people employed on temporary contracts fell by 3.9% y/y, while the number of
those employed on permanent contracts increased by 2.5% y/y. In 2017 Q4, the fall in the number of both individual farmers (by
8.0% y/y) and the assisting family members (by 7.6% y/y) also contributed to the decline in growth in the number of working
persons according to the LFS. Employment growth in the enterprise sector is, in turn, increased by the annual update by GUS of
the sample of companies employing more than nine employees.
indicated by the rising number of vacancies.12 High
labour demand translates into further employment
growth (Figure 2.18), as evidenced by both the
Labour Force Survey data (LFS; the number of
working persons rose by 0.5% y/y in 2017 Q4) and
the corporate sector data (employment rose by
3.8% y/y in January 2018).13
Growth in employment, which has already lasted
for 5 years, takes place amid relatively stable
labour supply (Figure 2.18). The impact of the
decline in the working age population (by 0.4% y/y
in 2017 Q4) on labour supply is limited by the
growth in labour force participation among the
young (20-24 years old) and pre-retirees (55-64
years old). High demand for employees and
stronger wage growth than in previous years
encourage to enter and remain in the labour
market. At the same time, according to preliminary
LFS data, labour force participation in 2017 Q4
remained at a similar level as in the previous
quarter.
Employment growth amid stable labour supply
translates into a further fall in unemployment, as
indicated by both the LFS and the labour office
data (unemployment stood at 4.5% in 2017 Q4 and
6.3% after seasonal adjustment in January 2018,
respectively; Figure 2.19). Therefore, a growing
number of employers are reporting vacant
positions (42% of companies in 2017 Q4).
Alongside this, the percentage of companies that
Figure 2.19 Unemployment rate, seasonally adjusted data
Source: GUS data, NBP calculations Seasonally adjusted NBP data. There are two reasons for the difference between the registered
unemployment rate and the LFS rate: 1) the definition of an unemployed person is different, 2)
the definition of the population to which the number of the unemployed is referred is
different.
Figure 2.20 Annual wage growth in the economy and in the
enterprise sector (nominal and real).
Source: GUS data.
0
5
10
15
20
25
0
5
10
15
20
25
01m1 03m1 05m1 07m1 09m1 11m1 13m1 15m1 17m1
per cent
LFS unemployment rate (quarterly data)
Registered unemployment rate (monthly data)
-4
0
4
8
12
16
-4
0
4
8
12
16
01q1 04q1 07q1 10q1 13q1 16q1
per centReal wage in the economy
Real wage in the enterprise sector
Nominal wage in the economy
Nominal wage in the enterprise sector

Inflation Report – March 2018
24
14 NBP Quick Monitoring Survey. Economic climate in the enterprise sector, NBP, January 2018.
15 NBP Quick Monitoring Survey. Economic climate in the enterprise sector, NBP, January 2018.
16 The increase in wage growth resulted partly from one-off factors, including higher than a year ago bonuses in the mining
industry and severance payments for persons who retired after the Act reducing the statutory retirement age came into force. In
January 2018, wages in the corporate sector grew at a similar pace as in 2017 Q4 (7.3% y/y against 7.6% in 2017 Q4).
consider problems with finding employees as a
barrier to development stands only at 9.7%.14
Consequently, the position of employees in wage
negotiations is improving and the share of
companies forecasting wage increases is rising (to
39.4% in 2017 Q4 from 18.8% in the previous
quarter).15 This is reflected in the acceleration in
wage growth in the economy (to 7.1% y/y in 2017
Q4; Figure 2.20).16
The higher wage growth than in previous years is
accompanied by a pickup in labour productivity
growth, stemming from an acceleration in GDP
growth. As a result, growth in unit labour costs
remains moderate (Figure 2.21).
2.5 Monetary policy and asset markets
The Monetary Policy Council keeps NBP interest
rates unchanged, including the reference rate at
1.50%. The majority of market participants
currently expect NBP interest rates to remain stable
in 2018, while some of them await an increase in
the NBP rates further ahead (Figure 2.22).
2.5.1 Financial market
In recent months, government bond yields in
Poland have been relatively stable, while yields in
developed markets, particularly in the United
States, have increased markedly (see Chapter 1.5
International financial markets; Figure 2.23). Yields
on 10-year government bonds currently stand at
3.4%.
In turn, after an earlier increase, equity prices in
Poland have declined over the recent past. The fall
in equity prices reflected a change in sentiment in
Figure 2.21 Growth of unit labour cost in the economy (y/y) and
its determinants
Source: GUS data, NBP calculations Labour productivity growth is a factor limiting unit labour cost growth; hence in the graph it
assumes negative values.
Figure 2.22 NBP reference rate and FRA-implied 3M interest rate
(as of 22 February 2018)
Source: NBP and Bloomberg data, NBP calculations.
Figure 2.23 Polish government bond yields
Source: Bloomberg data.
-6
-4
-2
0
2
4
6
8
10
12
-6
-4
-2
0
2
4
6
8
10
12
01q1 04q1 07q1 10q1 13q1 16q1
per cent
Nominal wages
Labour productivity
Unit labour costs
0
1
2
3
4
5
0
1
2
3
4
5
12m1 14m1 16m1 18m1
per cent
0
1
2
3
4
5
6
0
1
2
3
4
5
6
12m1 13m1 14m1 15m1 16m1 17m1 18m1
2Y 5Y 10Y
per cent

2. Domestic economy
25
17 For more information on the situation in the real estate market in Poland see the NBP report: Information on home prices and the
situation in the housing and commercial real estate market in Poland in 2017 Q3, NBP, December 2017. 18 In 2017 Q3, the pool of housing subsidies under the “Flat for the Young” scheme for 2017 was used up. At the beginning of 2018,
Bank Gospodarstwa Krajowego (BGK) started to accept applications for 2018, i.e. for the last year of the operation of the scheme.
During two days in January 2018 BGK accepted 12.7 thousand applications, which exhausted the pool of housing subsidies for this
year (PLN 381 million).
the global markets and took place despite positive
signals coming from the Polish economy (Figure
2.24).
At the same time, strong data on the Polish
economy has supported the appreciation of the
zloty against all the major currencies, including the
euro (by 3.4% since the beginning of October 2017),
the US dollar (by 8.4%) and the Swiss franc (by
4.0%; Figure 2.25). The zloty has strengthened most
significantly against the US dollar due to the
appreciation of the euro against this currency (see
Chapter 1.5 International financial markets).
2.5.2 Real estate market17
Situation in the real estate market in Poland is
mixed. In the residential real estate market, high
demand is accompanied by further increase in the
supply of flats, which contributes to a moderate
increase in their prices (Figure 2.26; Figure 2.27). In
the commercial real estate market, in turn, demand
is stable, while supply is high and rising, which
translates into slightly decreasing rents.
Demand for flats is supported by rising
employment and higher growth in wages (see
Chapter 2.4 Labour market), along with very good
consumer sentiment. Other factors behind the
increase in home sales include the relatively low
cost of mortgage loans and the expected relatively
high profitability of home rental as compared with
other forms of household investment. Demand for
housing was also supported by the government
scheme “Flat for the Young”, although its impact
was marginal.18
High demand for housing and the optimistic
expectations for trends in the residential real estate
Figure 2.24 The main stock market index in Poland (WIG)
Source: Bloomberg data.
Figure 2.25 Zloty exchange rate (rise indicates appreciation)
Source: Bloomberg data.
Figure 2.26 Residential construction in Poland (4-quarter rolling
sum)
Source: GUS and REAS data, NBP calculations. Sales data is based on 6 major markets in Poland (Warszawa, Kraków, Trójmiasto, Wrocław,
Poznań i Łódź)
80
100
120
140
160
180
80
100
120
140
160
180
12m1 13m1 14m1 15m1 16m1 17m1 18m1
index, Jan-12=100
80
90
100
110
120
80
90
100
110
120
12m1 13m1 14m1 15m1 16m1 17m1 18m1
EUR/PLN USD/PLN CHF/PLN
index, Jan-12=100
0
50
100
150
200
100
150
200
250
300
07q1 09q1 11q1 13q1 15q1 17q1
Ty
siąc
e
Dwellings sold (rhs)
Dwellings completed (lhs)
Building permits (lhs)
Dwellings under construction (lhs)
thousands thousands

Inflation Report – March 2018
26
19 In 2017 Q4 transaction housing prices in the 17 largest cities rose by an average of 2.9% y/y in the primary market and by 4.8%
y/y in the secondary market. The observed price increases were to a certain extent driven by larger sales of high quality, prime
location dwellings.
market in the coming quarters incline developers
to further increase housing supply (Figure 2.26).
This is evidenced by the steadily rising number of
building permits issued and dwellings under
construction. Despite the expanding supply, the
average selling time of flats in the primary market
is gradually declining, which indicates that the
shortage of housing supply is likely to worsen.
Moreover, given some rise in the prices of building
materials and a pickup in wage growth (see
Chapter 2.4 Labour market), construction costs
increased somewhat. Against this backdrop, prices
in the residential real estate market are rising
moderately.19
Alongside that, in the commercial real estate
market, demand for rental remains stable. At the
same time, supply is growing strongly, which is
reflected in large space of commercial real estate
put into use and being under construction. This
development mainly refers to office and retail real
estate. Robust growth of supply in commercial real
estate market is underpinned by low profitability
of comparable investments in the external
environment of the Polish economy and high
availability of external funding amidst very low
interest rates abroad, including in the euro area
(see Chapter 1.4 Monetary policy abroad). As a result,
supply in this market exceeds demand, which is
evidenced by relatively high vacancy rate.
Consequently, rents in the commercial real estate
market are declining slightly.
2.6 Money and credit
After several quarters of slowdown, growth in the
broad money aggregate (M3) stabilised in the
second half of 2017 (in 2017 Q3 and Q4, M3 growth
Figure 2.27 Average prices of flats in major cities in Poland
Source: NBP calculations based on the NBP survey. PM – primary market, SM – secondary market. Transaction prices – an average weighted with
the share of the housing stock in a given city in the total housing stock. Aggregate of 6 cities
consists of: Gdańsk, Gdynia, Kraków, Łódź, Poznań, Wrocław, whereas of 10 cities: Białystok,
Bydgoszcz, Katowice, Kielce, Lublin, Olsztyn, Opole, Rzeszów, Szczecin i Zieloną Górę.
Figure 2.28 Composition of M3 growth (y/y)
Source: NBP data. The category Other covers deposits of non-monetary financial institutions and local government
units, repurchase agreements between banks and non-banking sector as well as debt securities
with maturity up to 2 years issued by banks.
2 500
3 500
4 500
5 500
6 500
7 500
8 500
9 500
2 500
3 500
4 500
5 500
6 500
7 500
8 500
9 500
07q1 09q1 11q1 13q1 15q1 17q1
PLN/sq m
PM 6 cities PM 10 cities PM Warsaw
SM 6 cities SM 10 cities SM Warsaw
-5
0
5
10
15
20
25
-5
0
5
10
15
20
25
07m1 09m1 11m1 13m1 15m1 17m1
Cash in circulation
Households deposits
Corporate deposits
Other
M3 monetary agregate
percent

2. Domestic economy
27
20 In this chapter, growth in the broad money aggregate (M3) and loans is defined as the three-month average of the annual growth
in transaction changes in the given quarter.
21 Current deposits are funds deposited on current accounts, savings accounts or other forms of deposits, which can be at sight and
without any or significant costs paid in the form of cash or used for the regulation of payments.
22 In this chapter, lending growth for a given sector is defined as the annual growth of transaction changes in receivables of the
monetary financial institutions from this sector.
23 In the second half of 2017, growth in the net indebtedness of the central government sector in banks gave the strongest boost to
broad money growth.
24 Senior loan officer opinion survey on bank lending practices and credit conditions. 2018 Q1, NBP, February 2018. In the case of housing
loans, an additional driver of demand for loans in 2017 Q3 was the "Flat for the Young" scheme. At the same time,, a slight
tightening of credit standards by the banks contained growth of household loans.
stood at 5.7% y/y; Figure 2.28).20 The main driver of
M3 growth was the increase in current household
and corporate deposits.21
In 2017, the growth of broad money supply
continued to be driven by a stable rise in loans to
the non-financial sector22, which for over a dozen
quarters has been running close to nominal GDP
growth.23 Consequently, the ratio of outstanding
loan portfolio of non-financial sector to GDP was
stable and stood at around 51% at the end of 2017
Q4.
Household loans continued to be the most
important source of lending growth. For several
years growth of these loans has been stable (in 2017
Q4 it stood at 4.9% y/y; Figure 2.29), and currently
it is driven almost equally by the increasing debt
from consumer and housing loans. However,
consumer loan growth remains significantly higher
than housing loan growth (8.1% y/y and 3.4% y/y
respectively in the second half of 2017). At the
same time, the growth rate of zloty-denominated
housing loans continued to be relatively high,
while the fall in FX housing loans deepened
slightly. The increase in household loans is
supported by the favourable labour market
conditions and the relatively low interest rate on
loans. Demand for housing loans is additionally
fuelled by a reduction in loan margins, and for
consumer loans by a reduction in non-interest
costs.24
Corporate loans also made a significant
Figure 2.29 Composition of growth in loans to households (y/y)
Source: NBP data. The category Other loans covers operating and investment loans to microenterprises.
Figure 2.30 Composition of growth in loans to companies (y/y)
Source: NBP data. The category Other loans covers i.a. loans for security purchases and export loans.
-10
0
10
20
30
40
50
-10
0
10
20
30
40
50
07m1 09m1 11m1 13m1 15m1 17m1
Housing loansConsumer loansOtherTotal households loans
percent
-10
0
10
20
30
-10
0
10
20
30
07m1 09m1 11m1 13m1 15m1 17m1
Other
Short-term loans
Investment loans
Total corporate loans
proc.

Inflation Report – March 2018
28
25 Senior loan officer opinion survey on bank lending practices and credit conditions. 2018 Q1, NBP, February 2018.
contribution to the rise in lending to the non-
financial sector. Growth of these loans in the
second half of 2017 was slightly higher than in the
first half of the year (7.5% y/y against 6.1% y/y
respectively; Figure 2.30). In particular, growth of
corporate loans was supported by the recovery in
investment. However, a slight tightening by banks
of credit standards and terms on loans (the
collateral requirements were increased and non-
interest loan costs were raised) constrained
corporate loan growth.25 The tightening of the
banks’ lending policy mainly affected loans to
small and medium-sized enterprises.
2.7 Balance of payments
Strong domestic economic conditions support a
balanced current account position. In 2017 Q3, the
current account balance improved significantly to
reach 0.2% of GDP. Monthly data for the period
October-December suggest that current account
remained balanced also in 2017 Q4, at 0.1% of GDP
(in terms of a four-quarter rolling sum; Figure
2.31). The balanced current account position in the
second half of 2017 was primarily due to a high
trade surplus. A factor which helped to keep the
trade balance positive was the rising surplus in
trade in services. At the same time, the recovery in
Polish goods exports in the second half of 2017 was
accompanied by faster growth in goods imports,
which translated into a lower balance in goods
trade. Alongside that, the balance of primary
income remained significantly negative, which was
mainly driven by a deficit in investment income (in
particular, with regard to income from direct
investment).
As the inflow of EU funds, especially those from
the European Regional Development Fund and the
Cohesion Fund, gradually rose, so did the surplus
on the capital account in the second half of 2017.
Given the positive current account balance, the
Figure 2.31 Current account balance (4-quarter rolling sum)
Source: NBP data. Data for Q4 based on preliminary monthly data on balance of payments for the period October-
December 2017 and NBP estimates of nominal GDP in 2017 Q4.
Figure 2.32 Financial account balance (4-quarter rolling sum)
Source: NBP data. A positive value of the balance means an increase in Polish net assets (net outflow of capital
from Poland). Data for Q4 based on preliminary monthly data on balance of payments for the
period October-December 2017 and NBP estimates of nominal GDP in 2017 Q4.
-10
-8
-6
-4
-2
0
2
4
6
-10
-8
-6
-4
-2
0
2
4
6
05q1 07q1 09q1 11q1 13q1 15q1 17q1
per cent of GDPBalance in secondary income
Balance in goods
Balance in services
Balance in primary income
Current account
Current and capital account
-15
-10
-5
0
5
10
-15
-10
-5
0
5
10
05q1 08q1 11q1 14q1 17q1
per cent of GDP
Official reserve assetsBalance in other investmentBalance in portfolio investmentBalance in direct investmentFinancial account
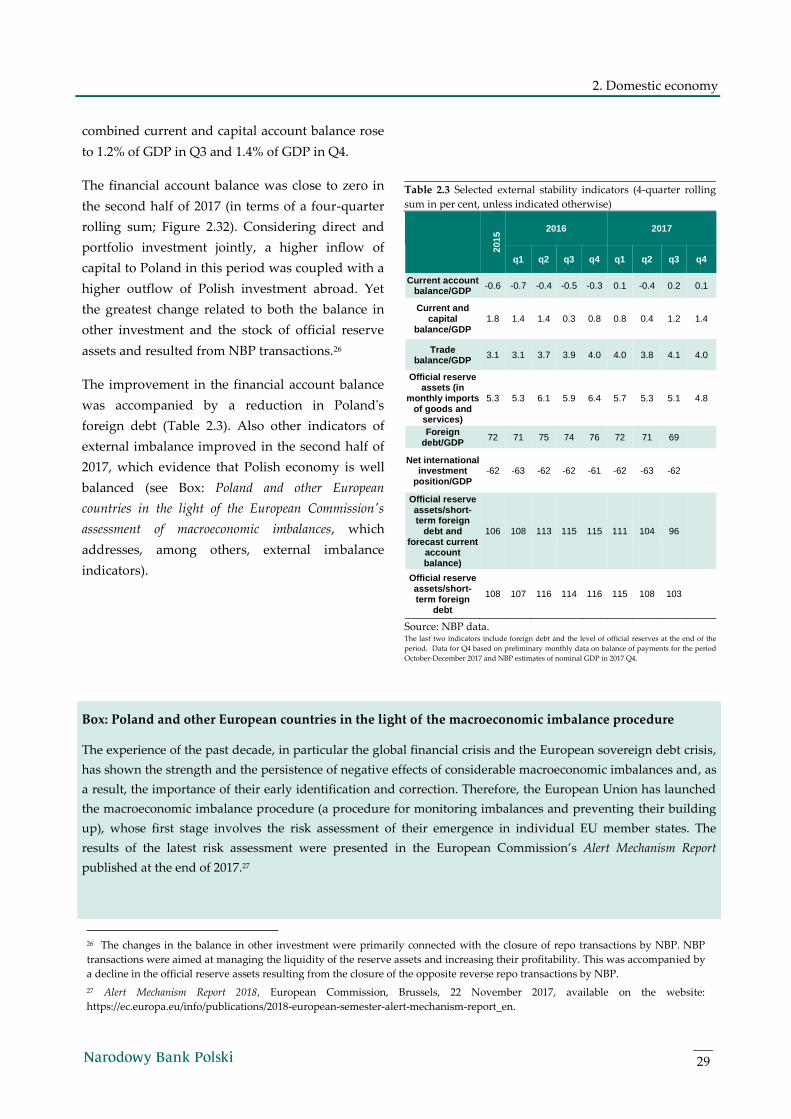
2. Domestic economy
29
26 The changes in the balance in other investment were primarily connected with the closure of repo transactions by NBP. NBP
transactions were aimed at managing the liquidity of the reserve assets and increasing their profitability. This was accompanied by
a decline in the official reserve assets resulting from the closure of the opposite reverse repo transactions by NBP.
27 Alert Mechanism Report 2018, European Commission, Brussels, 22 November 2017, available on the website:
https://ec.europa.eu/info/publications/2018-european-semester-alert-mechanism-report_en.
combined current and capital account balance rose
to 1.2% of GDP in Q3 and 1.4% of GDP in Q4.
The financial account balance was close to zero in
the second half of 2017 (in terms of a four-quarter
rolling sum; Figure 2.32). Considering direct and
portfolio investment jointly, a higher inflow of
capital to Poland in this period was coupled with a
higher outflow of Polish investment abroad. Yet
the greatest change related to both the balance in
other investment and the stock of official reserve
assets and resulted from NBP transactions.26
The improvement in the financial account balance
was accompanied by a reduction in Poland's
foreign debt (Table 2.3). Also other indicators of
external imbalance improved in the second half of
2017, which evidence that Polish economy is well
balanced (see Box: Poland and other European
countries in the light of the European Commission's
assessment of macroeconomic imbalances, which
addresses, among others, external imbalance
indicators).
Table 2.3 Selected external stability indicators (4-quarter rolling
sum in per cent, unless indicated otherwise)
201
5 2016 2017
q1 q2 q3 q4 q1 q2 q3 q4
Current account balance/GDP
-0.6 -0.7 -0.4 -0.5 -0.3 0.1 -0.4 0.2 0.1
Current and capital
balance/GDP 1.8 1.4 1.4 0.3 0.8 0.8 0.4 1.2 1.4
Trade balance/GDP
3.1 3.1 3.7 3.9 4.0 4.0 3.8 4.1 4.0
Official reserve assets (in
monthly imports of goods and
services)
5.3 5.3 6.1 5.9 6.4 5.7 5.3 5.1 4.8
Foreign debt/GDP
72 71 75 74 76 72 71 69
Net international investment
position/GDP -62 -63 -62 -62 -61 -62 -63 -62
Official reserve assets/short-term foreign
debt and forecast current
account balance)
106 108 113 115 115 111 104 96
Official reserve assets/short-term foreign
debt
108 107 116 114 116 115 108 103
Source: NBP data. The last two indicators include foreign debt and the level of official reserves at the end of the
period. Data for Q4 based on preliminary monthly data on balance of payments for the period
October-December 2017 and NBP estimates of nominal GDP in 2017 Q4.
Box: Poland and other European countries in the light of the macroeconomic imbalance procedure
The experience of the past decade, in particular the global financial crisis and the European sovereign debt crisis,
has shown the strength and the persistence of negative effects of considerable macroeconomic imbalances and, as
a result, the importance of their early identification and correction. Therefore, the European Union has launched
the macroeconomic imbalance procedure (a procedure for monitoring imbalances and preventing their building
up), whose first stage involves the risk assessment of their emergence in individual EU member states. The
results of the latest risk assessment were presented in the European Commission’s Alert Mechanism Report
published at the end of 2017.27

Inflation Report – March 2018
30
28 This is only a slightly smaller number of countries than in the previous years. Countries subject to an in-depth review include:
Bulgaria, Croatia, Cyprus, France, Spain, the Netherlands, Ireland, Germany, Portugal, Slovenia, Sweden and Italy.
The criteria for assessing macroeconomic imbalances in the European Commission's report are currently based
on 14 macroeconomic indicators broken down into three groups: indicators of external imbalance and
competitiveness, indicators of internal imbalance and labour market indicators. For each indicator, the European
Commission has set thresholds which, if exceeded, may indicate excessive imbalances in a given economy. In
order to obtain a more complete assessment of the risk of imbalances in the EU Member States, the European
Commission additionally analyses almost 30 macroeconomic variables. Basing on the conclusions from the data
analysis, the Commission identifies the member states to be examined in an in-depth review. On the basis of this
review, the Commission identifies imbalances, assesses their scale and, if necessary, issues appropriate
recommendations for the member state.
Figure B.1 Number of countries qualified by the European
Commission for an in-depth review and the number of
indicators beyond the indicative threshold breaches
Figure B.2 Number of in-depth reviews carried out by the
European Commission and the number of indicators beyond
the indicative threshold breaches
Source: European Commission’s data, NBP’s calculations. The timeline indicates the years in which the European Commission undertakes an in-
depth review. The chart does not cover labour market indicators, which were first
included in the 2016 report.
Source: European Commission’s data, NBP’s calculations. Countries in stability support programme program are not considered in the
macroeconomic imbalance procedure. The chart does not cover labour market
indicators, which were first included in the 2016 report.
In its latest report, the European Commission pointed out that the scale of imbalances in the EU member states is
decreasing due to strengthening competitiveness of the countries most affected by the European sovereign debt
crisis, deleveraging, as well as the economic recovery in the entire EU. However, according to the Commission,
the pace of decline in imbalances has slowed down, and new risks have emerged in some countries. On the one
hand, external imbalances and high indebtedness of the private sector, already observed before the global
financial crisis, persist in many EU countries. On the other hand, the Commission’s report draws attention to
internal imbalances building up in some countries, most notably as a result of a significant rise in home prices. In
consequence, the European Commission considered it justified to undertake an in-depth review for 12 member
states (Figure B.1).28
Similarly to the previous Alert Mechanism Reports, also according to the latest one, based on 2016 data, Poland is
one of the most balanced economies in the European Union. This is also indicated by the most up-to-date data
(for 2017 Q3, Table B.1). The private and public sector debt of in Poland is among the lowest in the European
Union, and the financial sector liabilities are growing at a moderate pace. The rise in home prices is also slower
than in the majority of the euro area and Central and Eastern European countries. At the same time, the scale of
both the decline in the unemployment rate and the increase in economic activity in Poland markedly exceeds the
EU average. The improvement of price competitiveness, reflected in relatively unit labour cost growth, results in
a continuing foreign trade surplus and the equilibrium of the current account balance. Importantly, Poland is also
50
60
70
80
90
100
0
4
8
12
16
20
2012 2013 2014 2015 2016 2017 2018
In-depth reviews (lhs)
Threshold breaches (rhs)
0
2
4
6
8
Irela
nd (
IE)
Spa
in (
ES
)
Cro
atia (
HR
)
Cyp
rus (
CY
)
Fra
nce (
FR
)
Esto
nia
(E
E)
Port
ugal (P
T)
Belg
ium
(B
E)
Gre
ece
(G
R)
Un
ited K
ingd
on (
UK
)
Luxem
bourg
(LU
)
Austr
ia (
AT
)
Malta (
MT
)
Bulg
aria (
BG
)
Hu
ngary
(H
U)
Latv
ia (
LV
)
Fin
land
ia (
FI)
Lithuan
ia (
LT
)
Sw
eden (
SK
)
The N
eth
erla
nds (
NL)
De
nm
ark
(D
K)
Germ
any (
DE
)
Italy
(IT
)
Slo
venia
(S
I)
Slo
vakia
(S
K)
Ro
mania
(R
O)
Pola
nd (
PL)
Cze
ch R
ep. (C
Z)
Total number of in-depth reviews
Average number of threshold breaches
Maximum or minimum number of threshold breaches

2. Domestic economy
31
one of few countries with the risk of imbalances remaining low in the entire period analysed by the European
Commission (Figure B.2).
Table B.1 Average values of economic indicators in 2017 Q3 against the respective thresholds
Source: data of the European Commission, Eurostat, ECB, International Trade Organization, Bank of International Settlements,
OECD, national central banks, national statistical offices, NBP’s calculations. The above table might differ from that presented in the Commission’s Alert Mechanism Report due to data actualisation and a slightly different methodology used due to limited data
availability. In particular, the share in global exports concerns goods only (without services), while the real effective exchange rate is calculated in accordance with the BIS methodology. In
the case of the real exchange rate and unit labour costs, the European Commission has set two thresholds, more restrictive for the euro area countries and less restrictive for non-euro area
EU countries.
Over past few years Poland has been exceeding solely the net international investment position threshold, which
concerns the difference between foreign assets and liabilities. Negative net international investment position is,
however, typical of catching-up economies, since they tend to import more capital from abroad. The European
Commission acknowledges that breaching that particular threshold is not an indication of macroeconomic
imbalances. At the same time, the Commission highlights the favourable structure of Poland’s foreign liabilities,
emphasising i.a. that approximately a half of Poland’s foreign liabilities are foreign direct investments. Moreover,
almost 2/3 of them are stable forms of external financing (non-debt instruments, including, among others, equity
and reinvestment of profits). As the Commission points out, Poland’s net external debt, which excludes the
abovementioned liabilities, was systematically declining in recent years to reach 32% in 2017 Q3 (6 percentage
points less than just three years before). Moreover, the risk associated with a significantly negative net
international investment position is mitigated by a high level of foreign exchange reserves.
The net international investment position criterion is not met by more than a half of the EU member states. These
include, in particular, other emerging market economies with a similar structure of foreign liabilities. However,
most other EU member states with high net international investment position have a less-favourable structure of
foreign financing.
To sum up, Poland continues to be one of few EU countries with a highly balanced economy, with no external
imbalances similar to many member states. The level of public and private debt is low and real estate prices are
growing at a moderate pace. Out of the 14 criteria excessive imbalance procedure criteria, Poland does not meet
that concerning the net international investment position. Yet, due to the favourable structure of foreign
liabilities, it does not imply macroeconomic imbalance, and the scale of the deviation from the threshold should
be diminishing along with the convergence process of the Polish economy.
Threshold AT BE CY DE EE ES IE FI FR GR IT LU LV LT MT NL PT SI SK BG CZ DK HR HU PL RO SE UK
Current account balance, 3-
year average (% GDP) -4;6 2.6 -0.1 -3.3 8.2 2.2 1.6 7.6 -0.5 -0.7 -1.2 2.3 5.1 0.0 -1.3 7.4 8.8 0.4 5.5 -1.5 2.9 1.0 8.1 2.6 4.5 -0.3 -1.8 4.4 -5.3
Net international investment
position (% GDP) -35 5.5 50.7 -121.4 58.2 -33.9 -83.7 -176.7 -3.1 -24.6 -139.3 -7.9 27.2 -58.2 -40.1 63.7 64.1 -105.0 -31.4 -64.0 -41.5 -24.9 52.9 -62.1 -60.3 -62.2 -50.8 8.3 -10.4
REER, 3-year average (%) ±5 & ±11 0.5 1.4 -5.0 -1.4 2.1 -2.4 -3.7 -1.7 -2.2 -4.1 -2.3 -0.6 1.7 3.1 -0.1 -1.4 -0.2 -1.5 -2.6 -0.3 6.7 -0.2 -1.2 1.6 -4.5 -6.5 -3.4 -3.7
Export market share, 5-year
change (%) -6 2.8 -0.5 92.7 6.1 -7.1 12.6 17.4 -6.6 -3.1 -1.9 4.1 -13.1 3.9 6.9 -42.0 3.1 9.6 19.7 8.9 15.4 16.5 0.6 33.8 11.2 27.7 24.4 -9.5 -4.4
Unit labour costs, 3-year
change (%) 9 & 12 3.9 1.4 -1.5 5.5 13.9 0.6 -15.5 -1.7 2.1 -0.1 2.5 6.2 12.0 18.8 0.6 -0.5 1.4 2.3 7.1 10.9 7.7 5.0 -5.8 5.9 7.0 10.5 2.8 6.9
House price index, 3-year
change (%) 6 2.7 2.3 0.6 1.9 0.8 5.3 11.4 0.6 3.1 -1.5 -2.0 3.2 6.9 3.9 3.6 8.3 9.2 5.4 5.4 7.0 9.6 2.8 2.8 7.7 1.9 4.9 5.7 2.8
Private sector credit f low (%
GDP) 14 0.5 0.2 0.6 1.2 1.1 1.4 11.4 1.8 2.1 1.4 -0.7 3.7 0.3 1.5 2.2 0.6 0.2 0.0 2.8 1.6 1.2 1.4 -0.1 0.3 0.4 0.2 -0.4 2.3
Private sector debt (% GDP) 133 140.8 175.8 335.9 107.4 120.4 142.6 264.5 145.6 148.4 108.9 113.1 419.0 92.3 65.5 131.3 225.6 179.2 77.0 98.6 112.6 88.7 207.5 99.5 87.3 82.6 53.1 234.4 143.3
General government debt (%
GDP) 60 80.4 107.0 103.2 65.1 8.9 98.7 72.1 60.4 98.4 177.4 134.1 23.4 38.3 39.4 54.9 57.0 130.8 78.4 51.3 25.6 35.1 36.9 81.0 72.4 52.0 35.7 38.6 86.5
Unemployment rate, 3-year
average (%) 10 5.8 8.0 13.5 4.3 6.4 20.2 8.7 9.0 10.1 23.8 11.8 6.2 9.6 8.4 4.9 6.1 11.4 8.2 10.2 8.0 4.2 6.1 14.0 5.6 6.5 6.1 7.1 5.0
Total f inancial sector liabilities,
y/y (%) 16.5 0.1 -1.1 2.3 4.4 5.1 4.8 6.1 -8.1 6.1 -2.1 5.6 2.8 4.5 11.2 5.1 0.9 1.9 4.9 8.7 6.8 30.5 1.0 2.9 19.8 7.6 7.9 8.8 10.8
Activity rate, 3-year change
(pps) -0.2 0.9 0.5 -0.6 0.5 2.9 -0.1 0.6 1.4 0.7 0.9 1.8 0.4 3.2 2.0 3.6 0.9 1.6 3.9 1.8 2.4 2.6 0.7 -0.5 4.1 1.7 1.6 0.8 0.6
Long-term unemployment rate,
3-year change (pps) 0.5 0.4 -1.1 -3.5 -0.6 -1.3 -5.5 -3.8 0.2 -0.1 -4.0 -1.1 0.2 -1.1 -1.8 -1.0 -1.0 -3.8 -1.9 -4.1 -3.4 -1.7 -0.5 -5.7 -1.9 -2.1 -0.7 -0.2 -0.9Youth unemployment rate, 3-
year change (pps) 2 -0.4 -2.1 -10.0 -1.1 -2.0 -16.0 -6.9 -0.5 -1.7 -9.6 -7.5 -7.2 -4.2 -6.1 -1.9 -3.7 -8.6 -8.2 -10.4 -9.4 -7.5 -1.0 -19.0 -9.6 -9.0 -6.8 -3.7 -4.3
Euro area member states Ex-euro area EU member states

Inflation Report – March 2018
32

3. Monetary policy in November – March 2018
33
Monetary policy in November 2017 – March
2018
At the meetings between November 2017 and March 2018 the Council kept the NBP interest rates unchanged
at the following levels: reference rate 1.50%, lombard rate 2.50%, deposit rate 0.50%, rediscount rate 1.75%.
What follows in the next part of the chapter are the previously published Minutes of the Monetary Policy
Council decision-making meetings held between November 2017 and February 2018 as well as the Information
from the meeting of the Monetary Policy Council in March 2018. Minutes of the Monetary Policy Council decision-
making meeting in March 2018 will be published on 29 March, and thus included in the next Report.
Minutes of the Monetary Policy Council decision-
making meeting held on 8 November 2017
Members of the Monetary Policy Council discussed
macroeconomic developments abroad analysing
their impact on economic conditions in Poland. It
was indicated that GDP growth in the euro area in
2017 Q3 was close to that observed in the first half
of the year, thus significantly higher than in the
previous year. It was pointed out that GDP growth
in the euro area was still driven mainly by growth
in consumption, although in 2017 Q3 it was
probably accompanied by a recovery in investment
and exports. It was underlined that, according to
the November projection, in 2018 economic
conditions in this economy would remain
favourable, although GDP growth would slow
down slightly. While analysing economic
conditions in other economies, it was pointed out
that in 2017 Q3 economic growth in the United
States – despite the negative impact of adverse
weather conditions on economic activity – was
close to that observed in the previous quarter. In
China, in turn, GDP growth decelerated somewhat
in 2017 Q3.
Referring to price developments in the world
economy, it was underlined that inflation abroad
remained moderate, and continued good economic
conditions in many economies were not
accompanied by a significant rise in inflationary
pressure. It was judged that the observed
weakened correlation between economic
conditions and price growth could result from
several structural factors. The opinion was
expressed that under current conditions the risk of
a sharp rise in inflation in the majority of
developed countries was limited. However, certain
Council members drew attention to the recent
slight increase in price growth in some economies.
While analysing commodity price developments, it
was pointed out that oil prices were higher than in
the previous month, but that in recent days there
had been signs of their stabilisation. It was judged
that oil prices were boosted by the decrease in oil
inventories, as well as expectations of a possible
extension of the agreement between oil exporting
countries. Certain Council members were of the
opinion that fundamental factors – in particular,
the elastic supply of shale oil in the United States –
should lower oil prices in the coming quarters.
Referring to remaining energy commodities, other
Council members drew attention to the
significantly higher coal prices compared to the
first half of the year.
Regarding monetary policy abroad, it was
highlighted that the European Central Bank was
keeping interest rates close to zero, including the

Inflation Report – March 2018
34
deposit rate below zero, and continued to
announce that they would remain at their current
levels even after the end of the asset purchase
programme. At the same time, the ECB extended
the duration of the asset purchase programme to at
least September 2018, while limiting the monthly
scale of purchases by half from 2018. In turn, in the
United States, the Federal Reserve began reducing
its balance sheet, although – as it was stressed – the
scale of monetary expansion was being reduced
gradually.
While discussing developments in Poland's real
economy, the Council members judged that GDP
growth in 2017 Q3 was probably higher than in the
previous quarter. It was emphasised that economic
growth was still driven primarily by increasing
consumer demand, supported by rising
employment and wages, disbursement of benefits
and very good consumer sentiment. It was
underlined that the faster construction and
assembly output growth than in the first half of the
year pointed to a probable recovery in investment.
However, certain Council members pointed out
that information incoming in the last month –
including data on industrial output, construction
and assembly output, and the PMI – was somewhat
worse than earlier readings.
It was indicated that – in accordance with the
November projection – in 2018 the favourable
economic conditions were expected to continue,
although GDP growth would probably slow down.
It was underlined that the expected weakening in
economic activity in the euro area, including in
Germany, would result in some slowdown in
economic growth. The gradual fading of the
statistical effects of the "Family 500 plus"
programme would also dampen GDP growth. At
the same time, the recovery in both public and
corporate investment should support GDP growth
next year. However, certain Council members
assessed that the scale of the recovery in
investment in 2018 – particularly corporate
investment – was subject to significant uncertainty.
Moreover, it was pointed out that even with the
expected investment growth, the investment rate in
the economy would remain relatively low.
However, other Council members were of the
opinion that the increasing scale of child benefit
payments along with the rising birth rate, the
improvement in the financial situation of some
consumers due to the lowering of the statutory
retirement age, and in 2019 also the possible
increase in social benefits and wages in the budget
sector, could boost GDP growth.
With reference to labour market conditions,
attention was drawn to the gradual growth in
employment and fall in unemployment. It was
underlined that this was accompanied by higher
wage growth in enterprises and faster rise in unit
labour costs than in the previous quarters. While
certain Council members drew attention to the high
growth in the wage bill in enterprises, other
Council members underlined that in September
wage growth in the corporate sector had slowed
down somewhat. It was judged that the inflow of
foreign employees to Poland as well as higher
labour force participation among Poles continued
to contain wage growth.
It was pointed out that in the coming years wage
growth and unit labour cost growth – according to
the November projection – would increase slightly.
At the same time, some Council members stressed
that there was still uncertainty about the impact of
the lowering of the statutory retirement age on
labour supply and wage pressure, although –
according to certain of these members – the scale of
this impact would be reduced by the high
proportion of non-working persons among those
retiring. Certain Council members expressed the
opinion that the low propensity of firms to increase
wages amid high competition and a fall in
profitability in the recent period could contain
wage growth in the coming quarters. However,
other Council members pointed out that a possible

3. Monetary policy in November – March 2018
35
restriction to the inflow of foreign employees and a
likely increase in wage pressure in the budget
sector could lead to faster than expected wage
growth.
When analysing price developments in Poland, it
was pointed out that the annual consumer price
growth remained moderate. Some Council
members underlined that in October annual
inflation had decreased somewhat. These Council
members stressed that price growth was currently
driven up by the rise in oil and food prices, thus
the factors beyond the direct impact of domestic
monetary policy. At the same time, internal
inflationary pressure remained – in the assessment
of these Council members – limited, and no
significant influence of accelerated wage growth on
consumer price growth could be seen. Certain
Council members also underlined that price
growth took place amid continued moderate
lending growth. Other Council members, in turn,
drew attention to the increase in all core inflation
measures in the recent period, which – in their
assessment – indicated an intensification of
domestic inflationary pressure. These Council
members also pointed to a certain increase in the
inflation expectations of households and
enterprises as well as the gradually rising producer
price growth.
While discussing the outlook for price growth, it
was indicated that according to the November
projection, it would gradually rise to reach the
annual average level of 2.3% in 2018 and 2.7% in
2019. The majority of Council members recognised
that the results of the November projection
indicated that in the coming years inflation would
remain close to the target. However, some Council
members underlined that the inflation path in the
November projection was higher than in the
previous forecasting round, and that in 2019
inflation would exceed 2.5%. These Council
members judged that the expected inflation growth
would be driven by an intensification of domestic
inflationary pressure as evidenced by the forecast
growth in both core inflation and the value added
deflator. They also pointed out that inflation could
be higher than forecast by the current projection
due to the possible stronger growth in wage and
cost pressure. Certain of these Council members
drew attention to higher coal prices compared to
the previous year, which – in their opinion – would
boost production costs of many goods, including
food products, and would impact directly the
prices of some consumer goods.
While discussing NBP monetary policy, the
Council decided that currently interest rates should
remain unchanged. The Council judged that –
given the available information – in the coming
years inflation would run close to the inflation
target. As a result, the current level of interest rates
was conducive to keeping the Polish economy on a
sustainable growth path and maintaining
macroeconomic stability.
The majority of Council members expressed the
opinion that, taking into account the present
information, interest rates were also likely to
remain stable in the coming quarters. These
Council members judged that the stabilisation of
interest rates would allow to meet the inflation
target, which – as they underlined – is of a
symmetric nature. At the same time, taking into
account the expected slowdown in GDP growth in
the coming years, it was indicated that a
stabilisation of interest rates would support the
maintenance of balanced economic growth,
including the expected recovery in investment.
Moreover, these Council members pointed out that
the need to take into account monetary conditions
in the immediate environment of the Polish
economy, including the prospect of maintaining
negative interest rates in the euro area next year,
also spoke in favour of keeping the current level of
interest rates.

Inflation Report – March 2018
36
In the opinion of some Council members, should
data and forecasts incoming in the following
quarters suggest a more marked intensification of
inflationary pressure, it might be justified to
consider an increase in the NBP interest rates in the
quarters to come. In the opinion of these Council
members, interest rate decisions should take into
account in particular the impact of negative real
interest rates on lending, asset prices and savings in
the Polish economy, as well as growth in the unit
variable costs. An opinion was also expressed that
future decisions of the Council should account for
developments in inflation expectations. Certain of
these Council members judged that a possible
increase in interest rates would have a limited
impact on investment growth.
A view was expressed that in the event of a
significant decline in economic indicators
accompanied by a marked deterioration in
consumer and corporate sentiment, in the longer
run it might be justified to consider a decrease in
interest rates.
Some Council members underlined that in the face
of uncertainty about the determinants of monetary
policy in the longer term, the March projection of
inflation and GDP would be an important
prerequisite for an assessment of its prospects.
The Council decided to keep the NBP interest rates
unchanged: the reference rate at 1.50%, the
lombard rate at 2.50%, the deposit rate at 0.50%, the
rediscount rate at 1.75%.
During the meeting the question of lowering the
reserve requirement ratio on funds raised from
domestic entities for at least a two-year period was
also discussed. It was indicated that this ratio
currently stood at 3.5%. Taking into consideration
that funds raised from abroad for the same period
are not subject to reserve requirements, it was
judged that it would be justified not to calculate
reserve requirements also for the remaining funds
raised for at least a two-year period, which would
mean the equal treatment of such funds. It was
indicated that the application of uniform reserve
requirement ratios for all funds raised for at least 2
years would bring the Polish reserve requirement
system closer to the solutions applied by the
Eurosystem. Moreover, it was pointed out that the
introduction of the discussed change could help to
lower the scale of the maturity mismatches
between assets and liabilities of Polish institutions
subject to mandatory reserve requirements.
The Council adopted a resolution according to
which the reserve requirement ratio for funds
raised for at least a two-year period will stand at
0%. The resolution will come into force on 1 March
2018 and will apply starting with the reserve
requirement to be maintained from 30 April 2018.
Minutes of the Monetary Policy Council decision-
making meeting held on 5 December 2017
Members of the Monetary Policy Council discussed
macroeconomic developments abroad, analysing
their impact on economic conditions in Poland. It
was emphasised that recovery continued in the
global economy, as reflected in the data on
industrial output, labour market, sentiment of
economic agents and international trade. It was
indicated that the recovery in international trade
was supporting economic conditions in the euro
area, where economic growth remained higher
than in 2016. Attention was also drawn to
improvement in labour market conditions in the
euro area. Yet, it was observed that the
unemployment rate in this economy, in spite of
ongoing decline, was still higher than before the
global financial crisis. During the discussion on the
external environment of the Polish economy, it was
indicated that economic conditions in the United
States remained favourable, while industrial output
growth in this economy had accelerated and
employment reached record highs, translating into

3. Monetary policy in November – March 2018
37
higher than in previous quarters retail sales
growth.
Referring to price developments in the world
economy, it was underlined that, despite the global
recovery, inflation abroad remained moderate. It
was assessed that this was caused by the
persistently weak domestic inflationary pressure in
many countries. It was observed that core inflation
remained low in many advanced economies. It was
highlighted that price growth was moderate
particularly in the immediate environment of the
Polish economy, most notably in the euro area, and
also in Central and Eastern Europe in spite of a
sizeable economic recovery and robust wage
growth there. It was indicated that in recent years
the links between economic conditions, wage
growth and inflation had weakened in many
countries.
While analysing commodity price developments, it
was pointed out that oil prices were higher than in
previous quarters, yet signs of their stabilisation
had appeared in recent weeks. It was observed that
the prices of this commodity might remain stable in
the coming quarters. The Council members
stipulated flexible supply of shale oil in the United
States and some producers striving to retain their
market shares as the likely factors behind the
stabilisation of oil prices. With reference to the
remaining energy commodities, it was indicated
that prices of coal and natural gas were higher than
in previous quarters.
Regarding monetary policy abroad, it was
highlighted that the Federal Reserve had started
reducing its balance sheet in October, and that in
December it would probably raise its interest rates.
However, it was observed that uncertainty
persisted as to the scale and timing of further
interest rate rises by the US central bank. Moreover,
in this part of the discussion it was emphasised that
the European Central Bank was keeping interest
rates close to zero, including the deposit rate below
zero, and continued to purchase financial assets. It
was also observed that the ECB was still
announcing that interest rates would remain at
their current levels, even after the end of the asset
purchase programme. It was emphasised that in
other countries in the immediate environment of
the Polish economy, particularly in Central and
Eastern Europe, interest rates also remained close
to zero.
Turning to developments in Poland's real economy,
the Council members pointed out that annual GDP
growth had accelerated to 4.9% in 2017 Q3, i.e. it
was higher than envisaged in the projection. It was
observed that growth was still driven primarily by
consumer demand, supported by rising
employment and wages, disbursement of benefits
and very good consumer confidence. It was also
indicated that stronger than projected GDP growth
was mainly due to a significantly higher export
growth rate related to the recovery in the external
environment of the Polish economy, particularly in
the euro area. It was underlined that gross fixed
capital formation had also risen in 2017 Q3, albeit
at a slower pace than expected in the projection.
Attention was drawn to the fact that the rise in
investment had resulted mainly from higher public
investment. In this context, it was observed that
investment growth in firms outside the mining and
energy sectors had increased substantially in 2017
Q3. Yet, certain Council members emphasised that
the level of corporate investment was still lower
than before 2016.
It was judged that the favourable economic
conditions would continue in Poland in the coming
quarters, although GDP growth might decelerate
slightly in the following years. Economic activity
will still be supported by stable consumption
growth, accompanied with a further rise in
investment growth rate. As certain Council
members emphasised, the latter is indicated by the
rising absorption of EU funds. Yet, these members
noted that the trend had so far been observed

Inflation Report – March 2018
38
mainly in the public sector. It was also judged that,
given high capacity utilisation and a concurrent
rise in demand, a further rise in the corporate
investment growth rate was likely in the coming
quarters. However, gradual fading of the statistical
effects of the "Family 500 plus" programme and the
expected deceleration of economic growth in the
euro area would contain GDP growth.
With reference to labour market conditions, it was
noted that the number of persons working in the
economy had continued to rise, albeit at a slower
pace than in previous quarters and, consequently,
the unemployment rate continued to fall. It was
highlighted that, although in the corporate sector
growth in wages and wage bill had accelerated
somewhat, in the entire economy wage growth had
remained stable in 2017 Q3. It was judged that
wage growth in the economy could have been
limited by the wage freeze in the public sector, and,
possibly, a slower pace of wage growth in smaller
enterprises, which employ a large proportion of
workers. It was stressed that, in line with the most
recent data, the wages of a considerable part of the
employed were still only slightly higher than the
minimum wage, additionally curbing inflationary
pressure. Attention was also drawn to the
relatively high labour participation rate which,
along with a significant number of foreign
employees, may be containing wage growth in
Poland. Certain Council members emphasised,
however, that the percentage of companies with
wage growth increasing faster than labour
productivity growth was lower than in the
previous year. It was also underlined that unit
labour cost growth in the entire economy had
decelerated considerably in 2017 Q3. As a result,
the majority of the Council members judged that
despite low unemployment and recruitment
difficulties reported by some companies, the labour
market did not generate any significant inflationary
pressure for the time being.
As regards inflationary developments in Poland, it
was pointed out that annual consumer price
growth had increased in November to 2.5%. It was
noted that the main factors behind the rise in
inflation was high food price growth and markedly
higher than in previous years energy price growth.
It was also pointed out that the higher energy price
growth was associated with rising energy
commodity prices in the global markets. In
addition, it was emphasised that core inflation net
of food and energy prices remained low, despite
relatively high consumption growth.
When discussing the outlook for inflation, the
majority of the Council members assessed that,
given the available information, inflation would
remain close to the target over the projection
horizon. These members pointed out that core
inflation was likely to rise only gradually in the
following quarters. It was judged that the price
growth would most likely be contained by low
inflation in the environment of the Polish economy
and a decline in GDP growth rate expected in the
coming quarters. In addition, statistical base effects
would dissipate in the coming months, which
should constrain growth in energy prices.
At the same time, some Council members drew
attention to the upside risks to inflation. In their
opinion, low corporate investment might translate
into weaker labour productivity growth, thus
boosting unit labour costs and inflation in the
longer term. They also expressed the opinion that
ongoing low investment in the mining and energy
sectors could prop up energy price growth. Certain
Council members argued that costs incurred by
natural gas importers could be increased due to the
requirement to hold natural gas reserves.
While discussing NBP monetary policy, the
Council decided that currently interest rates should
remain unchanged. The Council judged that the
current interest rate level helped to keep the Polish
economy on a sustainable growth path and

3. Monetary policy in November – March 2018
39
maintain macroeconomic stability. It was pointed
out that in the light of the available information,
inflation would remain close to the target in the
projection horizon. At the same time, attention was
drawn to external trade surplus, persisting despite
relatively fast GDP growth, as well as to the fact
that lending growth remained close to nominal
GDP growth.
The majority of the Council members expressed an
opinion that, taking into account the present
information, interest rates were also likely to
remain stable in the coming quarters. These
Council members judged that the stabilisation of
interest rates would continue to help meet the
inflation target, while supporting the maintenance
of balanced economic growth, including the further
expected recovery in investment. Moreover, these
Council members pointed out that the need to take
into account the monetary conditions in the
immediate environment of the Polish economy also
spoke in favour of keeping the current level of
interest rates.
In the opinion of some Council members, should
data and forecasts incoming in the following
quarters suggest a more marked intensification of
inflationary pressure, most notably associated with
a possibility of a stronger acceleration in wage
growth, it might be justified to consider an increase
in the NBP interest rates in the quarters to come. In
the opinion of these Council members, interest rate
decisions should also take into account the impact
of negative real interest rates on lending, asset
prices and savings in the Polish economy. The
Council members judged that developments in
inflation expectations would also be important for
monetary policy decisions.
A view was expressed that in the event of a
significant decline in economic indicators
accompanied by a marked deterioration in
consumer and corporate sentiment, in the longer
run it might be justified to consider a decrease in
interest rates.
The Council decided to keep the NBP interest rates
unchanged: the reference rate at 1.50%, the
lombard rate at 2.50%, the deposit rate at 0.50% and
the rediscount rate at 1.75%.
During the meeting the remuneration on the
required reserve was also discussed. Certain
Council members pointed out that decreasing the
remuneration on the required reserve should help
manifest its mandatory character. The majority of
the Council members pointed out that the
remuneration of the required reserve, combined
with the decision not to calculate the reserve
requirement ratio on funds raised from domestic
entities for at least a two-year period, should help
to lower the scale of the maturity mismatches
between assets and liabilities of Polish institutions
that are subject to mandatory reserve requirements.
An opinion was also expressed that the reserve
requirement system should not be modified until
the decision not to calculate the reserve
requirements on funds raised from domestic
entities for at least a two-year period came into
effect.
The Council adopted a resolution on the
remuneration on the required reserve. In line with
this resolution, the remuneration of the required
reserve will amount to 0.50%. The resolution comes
into force on 1 January 2018.
Minutes of the Monetary Policy Council decision-
making meeting held on 10 January 2018
Members of the Monetary Policy Council discussed
macroeconomic developments abroad, analysing
their impact on economic conditions in Poland. It
was observed that the recovery continued in the
global economy, which was accompanied by a
further rise in international trade. It was pointed
out that the recovery in economic activity in the
euro area continued, supported by improving
Inflation Report – March 2018
40
labour market conditions, very strong business
confidence and robust external demand. The recent
upward revisions of the 2018 GDP growth forecasts
in this economy were brought to attention. Other
developments referred to in the course of the
discussion included the favourable economic
conditions in the United States and only a slight
weakening of activity in China.
Referring to price developments in the world
economy, it was underlined that, despite the global
recovery, inflation abroad remained moderate. It
was assessed that this was caused by the
persistently weak domestic inflationary pressure in
many countries and the disinflationary factors
related to global supply chains. In particular, the
still moderate price growth in the euro area was
highlighted, along with the downward revision of
the 2018 core inflation forecasts for this economy.
While analysing developments in commodity
prices, it was pointed out that oil prices had risen
recently. It was noted that the rise had mainly
resulted from reductions in output and inventories
of oil, and from the extension of the agreement
concluded by oil-exporting countries. Some
Council members expressed the opinion that a
stabilisation of oil prices was likely in the coming
quarters, which would be supported by higher
supply of shale oil from the United States.
Regarding monetary policy abroad, it was
highlighted that despite the improvement in the
outlook for economic conditions in the euro area,
the European Central Bank had not changed its
monetary policy stance. The ECB was keeping
interest rates close to zero, including the deposit
rate below zero, and continued its financial asset
purchases. Moreover, the ECB was still announcing
that interest rates would remain at their current
levels, even after the end of the asset purchase
programme.
While discussing the developments in Poland’s real
economy, it was assessed that the GDP growth in
2017 Q4 had probably been close to that observed
in 2017 Q3. It was highlighted that growth was still
driven primarily by consumer demand, supported
by rising employment and wages, disbursement of
child benefits and very high consumer confidence.
Available data also reveal accelerated investment
growth, although, as it was emphasised, this was
mainly due to a pickup in public investment. At
this point certain Council members highlighted the
fact that growth of private investment, which is to a
greater extent reliant on the expected return and
risk than public investment, remained weak. These
members observed that a rise in corporate high-
tech investment was important for the prospective
competitiveness of the Polish economy. It was also
pointed out that the relatively fast growth of
exports, supported by the recovery in the
immediate environment of the Polish economy,
including Germany, was an additional driver of
GDP growth.
With reference to the prospects for economic
growth, it was assessed that economic conditions
would continue to be favourable in the coming
quarters, although GDP growth would probably
slow down compared to its rate in the second half
of 2017. Despite the gradual fading of the statistical
effects of the "Family 500 plus" programme, rising
consumption will continue to support economic
growth. At the same time, a further pickup in
investment growth is anticipated, as signalled by
the increasing absorption of EU funds. Some
Council members judged that given the need for
firms to expand their production capacity amid the
persistently robust demand, corporate investment
growth would also accelerate in the coming
quarters. Moreover, exports would add to
economic activity growth. Some Council members
emphasised that the increase in external sales may
be higher than previously expected due to the
improvement in the outlook for economic growth

3. Monetary policy in November – March 2018
41
in the euro area. At the same time, some Council
members expressed the opinion that the pace of
export growth may be dragged down by the
exchange rate of the zloty having strengthened on
the previous quarters. In the opinion of other
Council members, in turn, the level of the exchange
rate was still higher than the average export
profitability exchange rate as declared by
enterprises. These members also emphasised the
considerable import intensity of export production,
limiting its sensitivity to exchange rate changes.
Analysing the developments in the labour market,
it was observed that despite the recruitment
difficulties reported by some companies,
employment in the corporate sector continued to
rise strongly. It was indicated that this was
accompanied by faster growth in corporate sector
wages than in previous quarters. In effect, wage bill
growth was also higher, yet, as some Council
members stressed, it did not exceed industrial
output growth. As a result, the majority of the
Council members judged that the labour market
did not generate any significant inflationary
pressure for the time being. In the opinion of some
Council members, the coming quarters may see a
further acceleration in wage growth in companies.
However, wage growth in the entire economy will
continue to be contained by the wage freeze in the
public sector as well as an increase in the labour
force participation rate and a further inflow of
employees from the East. At the same time, it was
underscored that unit labour cost growth will be
dampened by higher GDP growth in 2018 than
previously expected. Certain Council members
assessed, however, that wage pressure in the
coming quarters may increase substantially. These
members pointed to the risk of pay demands
arising in the public sector, and a likely rise in
demand for labour related to a further investment
recovery. At the same time, they judged that the
potential for a further increase in both labour force
participation rate and inflow of foreign workers is
limited. Certain Council members were of the
opinion that after the lowering of the statutory
retirement age labour supply would be contained
as a considerable part of the eligible employees
would retire. Yet other Council members
underlined that the scale of this impact would be
limited due to the high proportion of non-working
persons among those retiring and a probability that
many retired employees would remain active in the
labour market.
While analysing inflationary developments in
Poland, it was pointed out that the annual
consumer price growth had decreased in
December. It was noted that inflation was still
being boosted by high food prices. At the same
time, core inflation net of food and energy prices
remained low due to the moderate growth in prices
of services and the continued fall in prices of
goods. In the opinion of the majority of the Council
members, this indicated limited demand pressure.
Certain Council members also underlined that
price growth took place amid continued moderate
lending growth. It was also pointed out that there
was a marked slowdown in producer price growth
despite a significant increase in industrial output.
Referring to the outlook for inflation, it was noted
that in the coming months changes in energy and
food prices, as well as the so-called statistical base
effects, would have a strong impact on price
developments. It was underlined that low price
growth in the environment of the Polish economy
and the stronger zloty than in the previous year
would continue to have a curbing effect on
inflation growth. The majority of the Council
members judged that in the light of the current
information the average level of inflation in 2018
would be somewhat lower than 2.5%, and in the
projection horizon would remain close to the
inflation target. Some Council members
emphasised that such an assessment is consistent
with the expectations of financial analysts. Certain
Council members drew attention to a rise in

Inflation Report – March 2018
42
consumer and enterprise inflation expectations in
the recent period. They also pointed to the expected
higher growth in prices of services in 2018
compared to 2017, which, in the opinion of these
Council members, could be evidence of growing
demand pressure.
While discussing NBP monetary policy, the
Council decided that currently interest rates should
remain unchanged. The Council judged that –
given the available information – inflation would
remain close to the inflation target over the
projection horizon. As a result, the current interest
rate level helped to keep the Polish economy on a
sustainable growth path and maintain
macroeconomic stability.
The majority of the Council members expressed the
opinion that, taking into account current
information, interest rates were also likely to
remain stable in the coming quarters. These
members judged that the stabilisation of interest
rates would continue to help meet the inflation
target, while supporting the balanced economic
growth, including the further expected recovery in
investment. Moreover, these Council members
pointed out that the need to take into account the
monetary conditions in the immediate environment
of the Polish economy, including the likelihood of
the maintenance of negative interest rates in the
euro area, also spoke in favour of keeping the
current level of interest rates in the coming
quarters.
In the opinion of some Council members, should
data and forecasts incoming in the following
quarters suggest a more marked intensification of
inflationary pressure than expected, most notably
associated with a possibility of a stronger
acceleration in wage growth, it might be justified to
consider an increase in the NBP interest rates in the
quarters to come. In the opinion of these Council
members, developments in inflation expectations
would also be important for monetary policy. At
the same time, these members emphasised that in
the light of recently released data the risk of a
marked increase in inflationary pressure was lower
than previously assumed. A view was expressed
that in the event of a significant decline in
economic indicators accompanied by a marked
deterioration in consumer and corporate sentiment,
in the longer run it might be justified to consider a
decrease in interest rates. However, it was
underlined that currently, faced with a very
favourable economic situation and very strong
business confidence, there was little likelihood of a
decrease in interest rates in the coming quarters. It
was also pointed out that the March projection of
inflation and GDP would be an important
prerequisite for an assessment of the outlook for
monetary policy.
The Council decided to keep the NBP interest rates
unchanged: the reference rate at 1.50%, the
lombard rate at 2.50%, the deposit rate at 0.50%, the
rediscount rate at 1.75%.
Minutes of the Monetary Policy Council decision-
making meeting held on 7 February 2018
Members of the Monetary Policy Council discussed
macroeconomic developments abroad, analysing
their impact on the Polish economy. It was
observed that a marked recovery continued in the
global economy. In particular, it was noted that
GDP data confirmed a further recovery in
economic activity in the euro area, which was
supported by improving labour market conditions,
rising business confidence and growth in
international trade. Attention was also drawn to
the continued favourable economic conditions in
the United States and the stabilisation of GDP
growth in China.
Referring to price developments in the world
economy, it was underlined that, despite the global
recovery, inflation abroad remained moderate,
which was the result of a weakening of the

3. Monetary policy in November – March 2018
43
relationship between price growth and economic
activity observed in many countries. It was
assessed that this was caused by disinflationary
factors related, among others, to the impact of
globalisation of the markets for factors of
production. As a result, core inflation in many
developed economies was still subdued. In
particular, it was pointed out that despite the
significantly lower unemployment than in previous
years, price growth remained low in the euro area,
including in Germany.
While analysing developments in commodity
prices, it was indicated that oil prices and the prices
of other energy commodities had increased
recently. It was noted that the rise had mainly
resulted from the reductions in output and
inventories of oil, amid growing demand for this
commodity due to ongoing recovery in global
economic growth. It was also pointed out that the
depreciation of the US dollar was an additional
driver of higher oil prices. Moreover, some Council
members underlined that in the wake of the rise in
oil prices, the prices of natural gas had also
increased. It was indicated that an important factor
affecting global commodity prices was the
reduction of coal usage in China, alongside an
increase in the country's demand for oil and gas.
Regarding monetary policy abroad, it was noted
that despite the improvement in economic
conditions in the euro area, the European Central
Bank had not changed its monetary policy stance.
The ECB was keeping interest rates close to zero,
including the deposit rate below zero, and
continued its financial asset purchases, although –
as announced earlier – at the reduced monthly
scale. The ECB had also not modified its
communication regarding future decisions. It was
pointed out that this could have been caused by the
recent appreciation of the euro, which increased
uncertainty about the pace of the return of inflation
to the ECB target. As a result, the ECB was still
announcing that interest rates would remain at
their current levels, even after the end of the asset
purchase programme.
While discussing the developments in Poland’s real
economy, it was assessed that the 2017 GDP data
indicated that the good economic conditions
continued, accompanied by an increasingly
balanced structure of economic growth. It was
highlighted that growth was still driven primarily
by domestic demand, including consumer demand,
supported by rising employment and wages,
disbursement of benefits and very good consumer
confidence. Available data also signal a recovery in
investment, although – as emphasised at the
meeting – mainly in public investment. However, it
was judged that in 2017 Q4 corporate gross fixed
capital formation had probably increased as well.
Moreover, regarding the structure of GDP growth,
it was underlined that in 2017 growth was also
driven by strong external demand reflected in a
positive contribution of net exports to GDP growth
in the second half of 2017.
With reference to the economic growth outlook, it
was assessed that an upward revision of the
forecast path of GDP growth in Poland could be
expected. In the opinion of the Council members,
favourable economic conditions will continue in
the coming quarters, although GDP growth will
probably slow down slightly compared to the
second half of 2017.
GDP growth will continue to be supported by
rising consumption, yet the statistical effects of the
"Family 500 plus" programme will gradually fade.
At the same time, a further revival in investment,
including private investment, is expected. Certain
Council members pointed out that private
investment growth was of major significance to the
competitiveness of the Polish economy. These
members observed that corporate investment
growth may, in particular, act as a driver of labour
productivity growth in the future, which will

Inflation Report – March 2018
44
mitigate the impact of a potential further
acceleration of wages on prices.
In the opinion of the Council members, domestic
economic activity in the coming quarters should
also be supported by favourable conditions abroad.
Yet some Council members observed that in line
with the forecasts of international institutions,
growth in the largest economies would probably
start slowing down as of the beginning of 2019.
Certain Council members pointed out that the
global growth outlook would, in particular, be
affected by the sentiment in the global financial
markets, which has recently weakened somewhat.
Moreover, some Council members expressed the
opinion that even amid a sustained relatively high
GDP growth abroad, export growth might be
hampered by the stronger exchange rate of the
zloty than in the previous months. In turn, in the
opinion of other Council members, the zloty
exchange rate is still higher – especially against the
euro – than the average export profitability
exchange rate as declared by enterprises, while
high import intensity of export production
additionally limits its sensitivity to exchange rate
movements.
Referring to the developments in the labour
market, it was indicated that despite the
recruitment difficulties reported by some firms,
employment in the corporate sector continued to
rise strongly. It was pointed out that rising
employment was accompanied by a further decline
in unemployment and a higher wage growth. At
the same time, the Council members observed that
the wage freeze in the public sector was a factor
constraining wage growth. Also the rise in the
labour participation ratio and a further inflow of
workers from the East had a dampening effect on
wage growth.
The majority of the Council members judged that
the labour market was not, so far, generating
substantial inflationary pressure, and the rise in
unit labour costs in the economy remained
moderate. Yet certain Council members indicated
the rising number of enterprises with wages
growing faster than labour productivity.
Furthermore, these Council members argued that
in the coming quarters wage pressure might
increase, as there was a risk of wage demands
arising in the public sector, and – after the lowering
of the statutory retirement age – further retirements
of a substantial part of eligible employees. Other
Council members, however, underlined that the
impact of retirements on labour supply had so far
been limited due to the high proportion of non-
working persons among those retiring, and a
probability that many retired employees would
remain active in the labour market.
While analysing inflationary developments in
Poland, it was pointed out that the annual
consumer price growth had decreased at the end of
2017 and that core inflation net of food and energy
prices remained low. Some Council members
emphasised that core inflation in 2017 Q4 had been
running below the level envisaged in the
November NBP projection, despite higher than
expected GDP growth. Weaker growth of producer
prices was also pointed out. The majority of the
Council members were of the opinion that
inflationary pressure remained limited.
Referring to the outlook for inflation, it was
observed that moderate price growth in the
external environment of the Polish economy and
the stronger zloty than in the previous year would
continue to have a curbing effect on price
developments. The majority of the Council
members judged that in the light of current
information inflation in the next two years would
be running close to the inflation target. Certain
Council members argued that hitherto inflation
might had been dampened by the structural
changes increasing price competitiveness in retail
trade. These Council members believed, however,
that the role of this factor might weaken in the

3. Monetary policy in November – March 2018
45
future. At the same time, these Council members
pointed to the likely upward revision of the
expected inflation path in the coming years.
While discussing NBP monetary policy, the
Council decided that currently interest rates should
remain unchanged. The Council judged that
despite accelerated economic growth inflation in
Poland was still running at moderate rates. As a
result, the current level of interest rates is
conducive to keeping the Polish economy on the
sustainable growth path and maintaining
macroeconomic stability.
The majority of the Council members expressed the
opinion that, taking into account current
information, interest rates were also likely to
remain stable in the coming quarters. These
Council members judged that the stabilisation of
interest rates would continue to help meet the
inflation target, while supporting the balanced
economic growth, including the expected further
recovery in investment. Moreover, these Council
members pointed out that the need to take into
account the monetary conditions in the immediate
environment of the Polish economy, including the
likelihood of the maintenance of negative interest
rates in the euro area, also spoke in favour of
keeping the current level of interest rates in the
coming quarters.
In the opinion of some Council members, should
data and forecasts incoming in the following
quarters suggest a more marked intensification of
inflationary pressure than currently expected, it
might be justified to consider an increase in the
NBP interest rates in the quarters to come. It was
also pointed out that the March projection of
inflation and GDP would be an important
prerequisite for an assessment of the outlook for
monetary policy.
A view was expressed that in the event of a
significant decline in economic indicators
accompanied by a marked deterioration in
consumer and corporate sentiment, in the longer
run it might be justified to consider a decrease in
interest rates.
The Council decided to keep the NBP interest rates
unchanged: the reference rate at 1.50%, the
lombard rate at 2.50%, the deposit rate at 0.50%, the
rediscount rate at 1.75%.
Information from the meeting of the Monetary
Policy Council held on 6-7 March 2018
The Council decided to keep the NBP interest rates
unchanged: reference rate at 1.50%, lombard rate at
2.50%, deposit rate at 0.50%, rediscount rate at
1.75%.
The global economic conditions continue to
improve. The euro area data for GDP in 2017 Q4
signal that the economy continues to grow faster
than in previous years. This is driven by an
improvement in the labour market conditions,
good sentiment of economic agents, and stronger
world trade growth. In the United States, economic
conditions also remain favourable, although GDP
growth in 2017 Q4 slowed down slightly. In China,
in turn, GDP growth was relatively stable in 2017.
Despite the ongoing global recovery, inflation
abroad remains moderate, on the back of
persistently low domestic inflationary pressure in
many countries, and lower than in the previous
year global agricultural commodity prices. At the
same time, prices of some other commodities,
including oil, are higher than a year ago.
The European Central Bank keeps interest rates
close to zero, including the deposit rate below zero,
while still purchasing financial assets. The US
Federal Reserve, in turn, continues to gradually
reduce its balance sheet, signalling further interest
rate increases in the future.

Inflation Report – March 2018
46
In Poland, annual GDP growth in 2017 Q4 stood at
5.1%. Growth is still primarily driven by domestic
demand, including consumer demand, supported
by rising employment and an acceleration in wage
growth, disbursement of benefits and very strong
consumer sentiment. At the same time, 2017 Q4
saw a marked recovery in investment. The pickup
in investment was primarily observed in the public
sector, although gross fixed capital formation of
enterprises probably increased as well. Growth in
economic activity is also supported by strong
external demand.
Despite the acceleration in economic growth,
annual consumer price growth continues to run at
a moderate level. At the same time – although
wage growth increased– inflation net of food and
energy prices remains low.
The Council became acquainted with the results of
the March projection of inflation and GDP,
prepared under the assumption of unchanged NBP
interest rates. In line with the March projection
based on the NECMOD model, there is a 50-
percent probability that the annual price growth
will be in the range of 1.6-2.5% in 2018 (against 1.6-
2.9% in the November 2017 projection), 1.7-3.6% in
2019 (compared to 1.7-3.7%) and 1.9-4.1% in 2020.
At the same time, the annual GDP growth –
according to this projection – will be with a 50-
percent probability in the range of 3.5-5.0% in 2018
(against 2.8-4.5% in the November 2017 projection),
2.8-4.8% in 2019 (compared to 2.3-4.3%) and 2.6-
4.6% in 2020.
In the Council's assessment, current data and the
results of the projection indicate a favourable
outlook for growth in economic activity in Poland,
despite an expected slight slowdown in GDP
growth in the coming years. In line with the
projection, in the monetary policy transmission
horizon inflation will remain close to the inflation
target. As a result, the Council judges that the
current level of interest rates is conducive to
keeping the Polish economy on a sustainable
growth path and maintaining macroeconomic
stability.
The Council adopted Inflation Report – March 2018.

4. Projection of inflation and GDP
47
Projection of inflation and GDP
This inflation and GDP projection was prepared by the Economic Analysis Department of
Narodowy Bank Polski and presents a forecast of economic developments under the assumption
of the unchanged NBP interest rates. In terms of the contents, works on this projection were
supervised by Piotr Szpunar, Director of the Economic Analysis Department. The process was
coordinated by the Macroeconomic Forecasts Division of the Economic Analysis Department.
Using the macroeconomic model NECMOD29, the projection was prepared as the outcome of an
iterative process, in the course of which the paths of some variables were adjusted if they diverged
from NBP experts’ economic intuition based on their knowledge of economic processes. The
Management Board of NBP approved the projection to be submitted to the Monetary Policy
Council. The projection constitutes one of the inputs to the Monetary Policy Council's decision-
making process concerning the NBP interest rates.
The March projection based on the NECMOD model covers the period from 2018 Q1 to 2020 Q4.
The starting point for the projection is 2017 Q4.
The cut-off date for the data used in this Projection is 16 February 2018.
29 Current version of the documentation of the model is available at the NBP website
http://www.nbp.pl/homen.aspx?f=/en/publikacje/raport_inflacja/necmod.html

Inflation Report – March 2018
48
4.1 Summary
In the second half of 2017, the Polish economy
was in the expansion phase – GDP growth
reached 5%y/y, the highest since 2011. In line with
expectations from the November projection,
private consumption remains the main
component of growth in this period. Gross fixed
capital formation also picked up significantly. The
fast economic growth of last year was
accompanied by a positive (and higher than in
2016) current and capital account balance, while
the surplus in trade in goods and services reached
a record high.
In the projection horizon GDP growth will
gradually slow down from the high levels
recorded in the second half of 2017. Private
consumption will remain the main component of
growth in domestic demand , due to the
continued improvement in the labour market
situation, which has a positive impact on
household disposable income and sentiment.
However, in the years 2018-2020 the role of
investment in economic growth will increase,
connected with the need to expand the productive
potential of the Polish economy and the growing
absorption of EU structural funds from the
current financial framework 2014-2020. The low
level of interest rates and the resulting low cost of
credit will have a favourable impact on domestic
demand. However, economic growth will be
restricted by the slowdown in GDP growth in the
euro area compared to 2017, which is forecast for
2018-2020.
Robust GDP growth led to the closure in the
second half of 2017 of the output gap, which had
been negative since 2012. In the coming years the
output gap will grow, reaching 1.8% of the
potential product at the end of the projection
horizon. The size of the output gap allows the
Figure 4.1 GDP (y/y %)
Source: GUS data, NBP calculations.
-1
0
1
2
3
4
5
6
7
8
-1
0
1
2
3
4
5
6
7
8
15q1 16q1 17q1 18q1 19q1 20q1 20q4
90% 60% 30% Central path

4. Projection of inflation and GDP
49
conclusion that in the coming years there will be
an increase in demand pressure in the whole
economy and the improvement in the economic
situation will gradually translate into domestic
inflation growth. Wage growth exceeding labour
productivity growth, as forecast in the projection
horizon, will contribute to higher inflation. The
pickup in wage growth will be supported by the
continued robust demand for labour on the part
of enterprises amid limited supply of labour.
However, inflation in Poland will be limited by
the continued low import price growth connected
with the appreciation of the effective exchange
rate of the zloty, low inflation abroad and
expectations of a decline in energy commodity
prices.
In the light of the above determinants, consumer
price inflation will gradually rise in the projection
horizon and in the years 2019-2020 will run
slightly higher than 2.5%.
The scale and length of the recovery in the global
economy will have a significant impact on the
expected development of the projection scenario.
At the same time, future growth rates in the
developed economies are fraught with
uncertainty connected with the persistence of a
reduced rate of productivity growth amid low
investment growth. Among domestic factors,
developments in effective labour supply are a
significant risk factor to the path of inflation and
GDP. It is difficult to assess to what extent the
positive structural changes in the labour market
observed in the recent period, leading to an
increase in economic activity of people in the age
group above 45, will continue in the projection
horizon.
The assessment of the likelihood of the above-
mentioned risk factors materialising points to a
nearly symmetrical distribution of risks to CPI
inflation (Figure 4.2). However, in the long-term
projection horizon a lower path of GDP growth
Figure 4.2 CPI inflation (y/y, %)
Source: GUS data, NBP calculations
-2
-1
0
1
2
3
4
5
6
7
-2
-1
0
1
2
3
4
5
6
7
15q1 16q1 17q1 18q1 19q1 20q1 20q4
90% 60% 30% Central path Inflation target

Inflation Report – March 2018
50
than in the central scenario is somewhat more
likely, which is reflected in the fan chart for this
variable (Figure 4.1).
4.2 External environment
In the current projection the economic outlook of
Poland's most important trading partners is more
favourable than in the previous forecasting
round, however, the assumption of faster growth
in the United States than in the euro area has been
upheld. The upward revision of future GDP
growth in both of these economies is to a large
extent related to better than expected economic
indicators for the second half of 2017. The more
optimistic forecast of the investment path in the
United States is also driven by the positive impact
of the significant corporate tax cuts, introduced
by the US administration earlier than assumed in
the November projection. In turn, the more
favourable outlook for economic growth in the
United States, as well as for world trade will
support the export activity of enterprises in the
euro area. However, similarly to the November
round, it is expected that the scale of economic
recovery abroad in the projection horizon will
decrease, amidst still slow labour productivity
growth and unfavourable demographic changes.
The relatively high GDP growth recorded in the
euro area in 2017 will continue in 2018, while
private consumption will remain the main driver
of this growth. Rising employment and growing
assets of households, low interest rate and wide
availability of consumer credit (Figure 4.4), as
well as the reduction of fiscal burdens in certain
Member States, will have a positive impact on
private consumption. In 2018 corporate
investment will accelerate, driven by the expected
improvement in internal and external demand,
currently high degree of capacity utilisation and
low level of gross capital spent on the
Figure 4.3 GDP abroad (y/y, %)
Source: Bloomberg, Eurostat data, NBP calculations.
Table 4.1 GDP abroad-March projection versus November
projection
2017 2018 2019
GDP in Euro Area (y/y, %)
March 2018 2.5 2.3 1.8
November 2017 2.2 1.9 1.6
GDP in United States (y/y, %)
March 2018 2.3 2.6 2.5
November 2017 2.2 2.4 2.1
GDP in United Kingdom (y/y, %)
March 2018 1.8 1.7 1.6
November 2017 1.6 1.4 1.7
Source: NBP calculations.
-2
0
2
4
6
8
-2
0
2
4
6
8
11q1 12q1 13q1 14q1 15q1 16q1 17q1 18q1 19q1 20q1 20q4
Euro area United States United Kingdom

4. Projection of inflation and GDP
51
modernisation of machinery in recent years. The
contribution of net exports to GDP growth of the
euro area will remain positive in 2018, although it
will run at a lower level than in 2017, as a result of
an improvement in domestic demand, boosting
imports.
In the years 2019-2020, GDP growth in the euro
area will decelerate, driven by the slowdown in
growth of all its main components. Private
consumption dynamics will decline due to
gradually rising inflation, affecting negatively
disposable household income in real terms. In
turn, weakening domestic and external demand,
combined with high debt in the private sector and
low profit growth, will incline firms to cut back
investment activity.
Similarly to the euro area, private consumption
will also remain the most important component
of economic growth in the United States in the
projection horizon. The continued positive
consumer sentiment will be supported by the
favourable situation on the labour market and
high net worth of households, driven by the
increase of the value of their assets and the end of
the deleveraging process. The tax cuts for
households and enterprises planned in 2018 will
act as an additional important driver of the
demand in the United States. In the years 2018-
2019 corporate investment growth will be
relatively strong, due to the lower fiscal burdens,
weakening of the US dollar, recovery in industry
and improvement in the outlook for the global
economy. In 2018 enterprises are expected to
increase also their inventories. Economic growth
in the projection horizon will be curbed by the US
economy reaching the full employment. This
process, combined with the ageing of society, will
result in a gradual reduction in the contribution
of employment to the growth of potential GDP .
Against the background of GDP growth in the
euro area and the United States, economic activity
Figure 4.4 Interest rate abroad (%)
Source: Bloomberg data, NBP calculations.
Figure 4.5 EUR/USD exchange rate
Source: Bloomberg data, NBP calculations.
-1.0
-0.5
0.0
0.5
1.0
1.5
2.0
2.5
3.0
3.5
4.0
-1.0
-0.5
0.0
0.5
1.0
1.5
2.0
2.5
3.0
3.5
4.0
11q1 12q1 13q1 14q1 15q1 16q1 17q1 18q1 19q1 20q1 20q4
Euro area United States United Kingdom
1.0
1.1
1.2
1.3
1.4
1.5
1.0
1.1
1.2
1.3
1.4
1.5
11q1 12q1 13q1 14q1 15q1 16q1 17q1 18q1 19q1 20q1 20q4
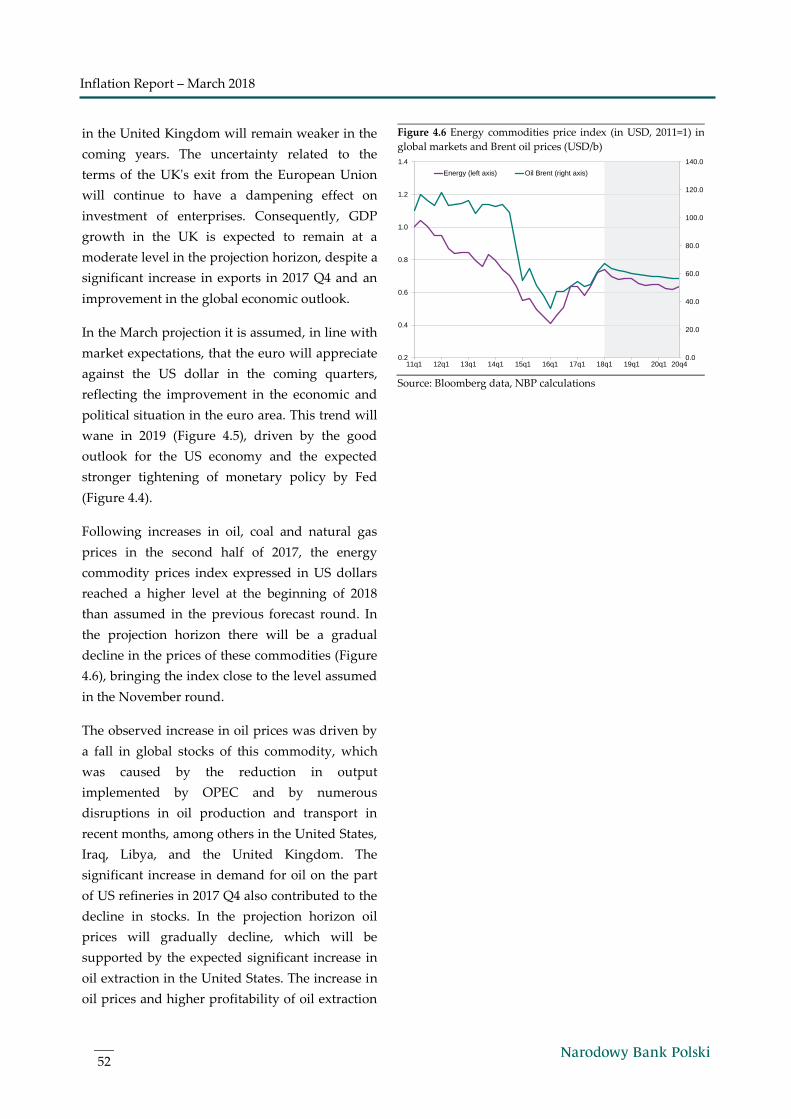
Inflation Report – March 2018
52
in the United Kingdom will remain weaker in the
coming years. The uncertainty related to the
terms of the UK's exit from the European Union
will continue to have a dampening effect on
investment of enterprises. Consequently, GDP
growth in the UK is expected to remain at a
moderate level in the projection horizon, despite a
significant increase in exports in 2017 Q4 and an
improvement in the global economic outlook.
In the March projection it is assumed, in line with
market expectations, that the euro will appreciate
against the US dollar in the coming quarters,
reflecting the improvement in the economic and
political situation in the euro area. This trend will
wane in 2019 (Figure 4.5), driven by the good
outlook for the US economy and the expected
stronger tightening of monetary policy by Fed
(Figure 4.4).
Following increases in oil, coal and natural gas
prices in the second half of 2017, the energy
commodity prices index expressed in US dollars
reached a higher level at the beginning of 2018
than assumed in the previous forecast round. In
the projection horizon there will be a gradual
decline in the prices of these commodities (Figure
4.6), bringing the index close to the level assumed
in the November round.
The observed increase in oil prices was driven by
a fall in global stocks of this commodity, which
was caused by the reduction in output
implemented by OPEC and by numerous
disruptions in oil production and transport in
recent months, among others in the United States,
Iraq, Libya, and the United Kingdom. The
significant increase in demand for oil on the part
of US refineries in 2017 Q4 also contributed to the
decline in stocks. In the projection horizon oil
prices will gradually decline, which will be
supported by the expected significant increase in
oil extraction in the United States. The increase in
oil prices and higher profitability of oil extraction
Figure 4.6 Energy commodities price index (in USD, 2011=1) in
global markets and Brent oil prices (USD/b)
Source: Bloomberg data, NBP calculations
0.0
20.0
40.0
60.0
80.0
100.0
120.0
140.0
0.2
0.4
0.6
0.8
1.0
1.2
1.4
11q1 12q1 13q1 14q1 15q1 16q1 17q1 18q1 19q1 20q1 20q4
Energy (left axis) Oil Brent (right axis)
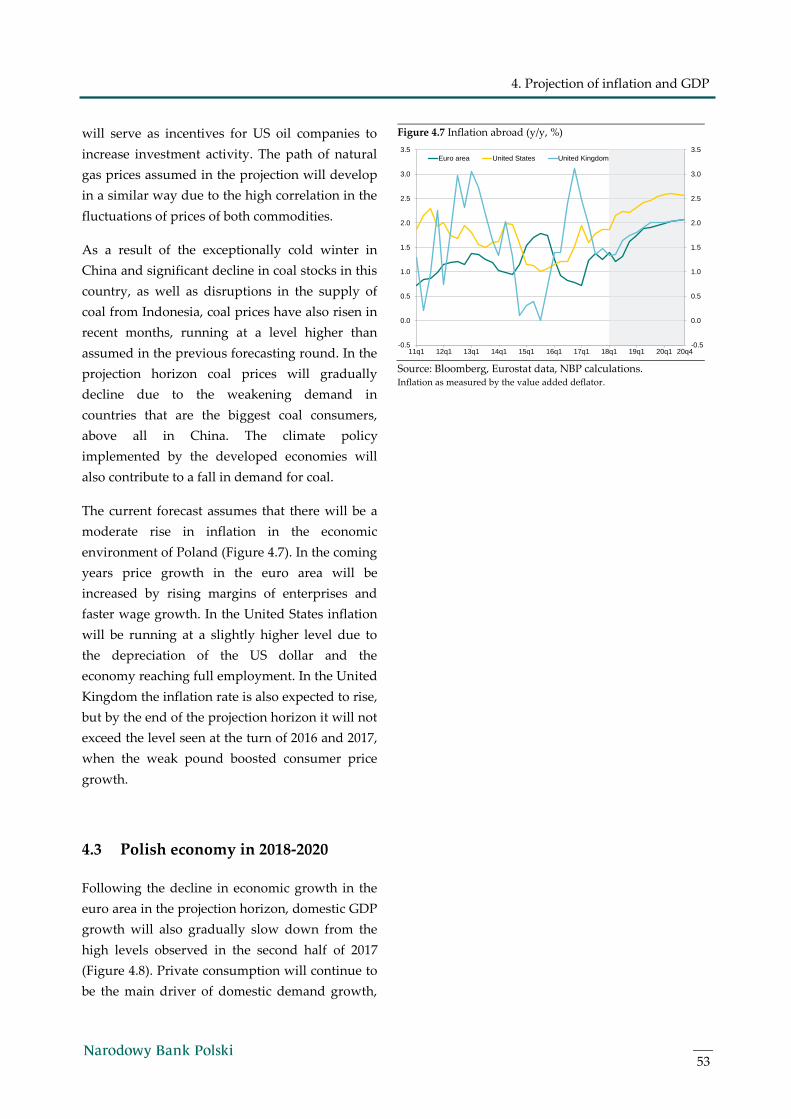
4. Projection of inflation and GDP
53
will serve as incentives for US oil companies to
increase investment activity. The path of natural
gas prices assumed in the projection will develop
in a similar way due to the high correlation in the
fluctuations of prices of both commodities.
As a result of the exceptionally cold winter in
China and significant decline in coal stocks in this
country, as well as disruptions in the supply of
coal from Indonesia, coal prices have also risen in
recent months, running at a level higher than
assumed in the previous forecasting round. In the
projection horizon coal prices will gradually
decline due to the weakening demand in
countries that are the biggest coal consumers,
above all in China. The climate policy
implemented by the developed economies will
also contribute to a fall in demand for coal.
The current forecast assumes that there will be a
moderate rise in inflation in the economic
environment of Poland (Figure 4.7). In the coming
years price growth in the euro area will be
increased by rising margins of enterprises and
faster wage growth. In the United States inflation
will be running at a slightly higher level due to
the depreciation of the US dollar and the
economy reaching full employment. In the United
Kingdom the inflation rate is also expected to rise,
but by the end of the projection horizon it will not
exceed the level seen at the turn of 2016 and 2017,
when the weak pound boosted consumer price
growth.
Figure 4.7 Inflation abroad (y/y, %)
Source: Bloomberg, Eurostat data, NBP calculations. Inflation as measured by the value added deflator.
4.3 Polish economy in 2018-2020
Following the decline in economic growth in the
euro area in the projection horizon, domestic GDP
growth will also gradually slow down from the
high levels observed in the second half of 2017
(Figure 4.8). Private consumption will continue to
be the main driver of domestic demand growth,
-0.5
0.0
0.5
1.0
1.5
2.0
2.5
3.0
3.5
-0.5
0.0
0.5
1.0
1.5
2.0
2.5
3.0
3.5
11q1 12q1 13q1 14q1 15q1 16q1 17q1 18q1 19q1 20q1 20q4
Euro area United States United Kingdom

Inflation Report – March 2018
54
due to the continued improvement in the labour
market and positive sentiment of households
(Figure 4.9). At the same time, in the years 2018-
2020 the contribution of investment will increase,
together with the rebuilding of the productive
potential of the Polish economy and the inflow of
EU funds from the current financial framework
2014-2020.
As demand and cost pressure mount over in
2018-2020, core inflation will gradually pick up
(Figure 4.10). Growing demand pressure is
reflected in the widening of the positive output
gap in the projection horizon together with the
growth of consumer and investment spending. At
the same time, the growing problems of
enterprises related to the shortage of labour
supply will translate into wage growth exceeding
the growth of labour productivity. However, the
scale of inflation growth will be limited by the
low import prices growth connected with an
appreciation of the effective exchange rate of the
zloty, low inflation abroad and expected decline
in energy commodity prices. In addition, in the
coming quarters the impact of temporary factors
boosting the food price inflation will fade (Figure
4.10).
Domestic demand
In 2018-2020 private consumption growth will
run close to 4%, remaining the key component of
economic growth (see Figure 4.9, Figure 4.11).
Developments in the labour market will have a
positive impact on the level of household
expenditure – a further fall in the unemployment
rate and the maintenance of relatively high wage
growth are expected. The optimistic sentiment of
economic agents, reflected in the record-high
results of consumer surveys, should also
strengthen consumption.30 In particular, the
declarations of households indicate positive
Figure 4.8 Economic growth
Source: GUS data, NBP calculations.
Figure 4.9 GDP growth (y/y,%) – breakdown
Source: GUS data, NBP calculations.
30 Consumer sentiment survey January 2018, GUS, January 2018.
-1
0
1
2
3
4
5
6
-1
0
1
2
3
4
5
6
11q1 12q1 13q1 14q1 15q1 16q1 17q1 18q1 19q1 20q1 20q4
GDP (q/q) (%) GDP (y/y, %)
-2
-1
0
1
2
3
4
5
6
7
8
-2
-1
0
1
2
3
4
5
6
7
8
17q1 18q1 19q1 20q1 20q4
Consumption Gross fixed capital formation
Change in inventories Net exports
GDP

4. Projection of inflation and GDP
55
trends regarding important purchases, as well as
diminishing concerns about the future economic
situation of the country and the threat of
unemployment. In the projection horizon,
consumption growth will also be supported by
the low level of interest rates having a favourable
impact on the cost of financing consumer
spending with loans.
Despite the positive conditions for consumption,
consumer demand growth will gradually slow
down in the years 2018-2020. This is primarily
due to the fading impact of the "Family 500 plus"
child benefit scheme introduced in 201631 and
higher inflation, which will curtail households’
purchasing power.
After almost two years of decline, in 2017 Q4
gross fixed capital formation of enterprises has
probably picked up (Figure 4.13). Growing
absorption of EU funds had a positive influence
on corporate investment activity at the end of
2017, and a further increase in the number of
projects part-financed from the EU budget is
forecast in the projection horizon (Figure 4.12).
This tendency is indicated by the improved firms’
assessment of planned investments in sections
with high absorption of EU funds, i.e. in
construction, supply of water, transport, and the
energy sector.32
Domestically-funded corporate investment
expenditure will also increase in the projection
horizon (Figure 4.13). The currently low rate of
investment, accompanied by a very high degree
of corporate capacity utilisation (reported both in
NBP and GUS studies) suggest the need to
rebuild the fixed asset base. At the same time, the
economic recovery has led to a marked
improvement in demand and output forecasts as
Figure 4.10 CPI inflation (y/y, %) – breakdown
Source: GUS data, NBP calculations.
Figure 4.11 Private and public consumption
Source: GUS data, NBP calculations.
31 Additional child benefit, due to the intertemporal consumption smoothing mechanism, increased consumption growth not only
in 2016, but also significantly in 2017.
32 NBP Quick Monitoring Survey. Economic climate in the enterprise sector, NBP, January 2018.
0.0
0.5
1.0
1.5
2.0
2.5
3.0
3.5
0.0
0.5
1.0
1.5
2.0
2.5
3.0
3.5
17q1 18q1 19q1 20q1 20q4
Core inflation Food prices
Energy prices CPI inflation
-8
-6
-4
-2
0
2
4
6
8
10
12
-8
-6
-4
-2
0
2
4
6
8
10
12
11q1 12q1 13q1 14q1 15q1 16q1 17q1 18q1 19q1 20q1 20q4
Private consumption (y/y, %)
Public consumption (y/y, %)

Inflation Report – March 2018
56
voiced by enterprises.33 Upbeat sentiment among
companies is also reflected in the results of GUS
surveys of business tendency in industry,
construction and commerce.34 The purchase of
fixed assets financed by loans or leasing is
facilitated, in turn, by the historically low interest
rates, although own funds remain the main
source of financing for corporate investment .35 In
view of these favourable conditions, according
NBP surveys36, the propensity to undertake new
investments is clearly increasing among
enterprises. At the same time, a large group of
respondents is planning to expand the scale of
investment projects already implemented.
After a sharp fall in 2016, public investment in
2017 picked up markedly, primarily due to an
increase in expenditure of local government units.
The rise resulted from a growing absorption of
EU funds from the current financial framework.
The development of investment expenditure in
the public sector is much more closely related to
the absorption of the funds from the EU budget
than in the case of corporate expenditure. The
Ministry of Development’s data37 on agreements
for the use of funds under the individual
operational programmes indicate that a further
strong increase in capital expenditure of the
general government sector can be expected in the
coming quarters (Figure 4.12). In the years 2019-
2020, the inflow of EU transfers will continue to
rise, although at a slower pace than assumed for
2018, translating into a slower growth rate of
public investment.
Figure 4.12 Expenditure financed with EU funds (in PLN billion)
– breakdown
Source: NBP calculations.
33 NBP Quick Monitoring Survey. Economic climate in the enterprise sector, NBP, January 2018.
34 Koniunktura w przemyśle, budownictwie, handlu i usługach, GUS, January 2018 (available in Polish only).
35 NBP Quick Monitoring Survey. Economic climate in the enterprise sector, NBP, January 2018. According to the results of these
surveys, newly started investments are most often financed by own funds (50.5% of investors), and twice as rarely by bank loans.
36 NBP Quick Monitoring Survey. Economic climate in the enterprise sector, NBP, January 2018.
37 List of projects implemented from European funds in Poland in 2014-2020, Ministry of Development,
https://www.funduszeeuropejskie.gov.pl/strony/o-funduszach/projekty/lista-projektow/lista-projektow-realizowanych-z-
funduszy-europejskich-w-polsce-w-latach-2014-2020/
0
25
50
75
100
125
0
25
50
75
100
125
2016 2017 2018 2019 2020
Public sector capital investment Common Agricultural Policy
Public sector current expendit. Enterpr., mainly capital
Agricul. Fund for Rural Dev. Human capital
EU transfers

4. Projection of inflation and GDP
57
The residential housing market is currently in an
expansionary phase, which is reflected in the
number of dwellings ready for occupancy, whose
12-month average has exceeded the highest value
reached in the previous cycle in the years 2008-
2009. Yet, unlike in 2006-2008, growing demand,
is met to a large extent by a high supply of
dwellings limiting price growth, which stems,
among others, from the improved efficiency of
this market. Moreover, in contrast to the previous
expansion, despite the pickup in lending, the
transactions continue to be financed with a
significant contribution of households' own
funds.38
In the projection horizon, housing investment will
grow at a slightly faster pace than GDP.
Household demand will be stimulated by a rising
disposable income and low interest rates creating
space to increase the financing of real estate
purchases with loans. The scale of the recovery in
this market may be reduced, however, by the
effects of certain implemented regulatory
changes. This concerns, in particular, the
currently effective stricter rules for transactions in
real estate forming Agricultural Property Stock of
the State Treasury, including land for
development, and the termination in 2018 of the
"Flat for the Young" programme. On the other
hand, the Individual Housing Accounts project,
will have a positive impact on the housing
supply, but due to a highly lagged effect of this
programme, in the projection period they will
have no influence on the development segment.
In the projection it is assumed that until the end
of 2018 public consumption growth will remain
much lower than the forecast GDP growth. This
assumption results from the provisions of the
2018 Budget Act, which envisage a relatively slow
growth in the current expenditure of budgetary
units and spending on targeted subsidies of other
Figure 4.13 Gross fixed capital formation (y/y, %) – breakdown
Source: GUS data, NBP calculations.
38 Information on home prices and the situation in the housing and commercial real estate market in Poland in 2017 Q3, NBP, December 2017.
-6
-4
-2
0
2
4
6
8
10
12
14
16
-6
-4
-2
0
2
4
6
8
10
12
14
16
17q1 18q1 19q1 20q1 20q4
GFCF enterprises GFCF public sector GFCF housing GFCF

Inflation Report – March 2018
58
sector units. In particular, the 2018 Budget Act
provides for a further freeze on wages of some
public sector employees. Due to the lack of
detailed information on the continuation of
measures aimed at limiting general government
sector spending in the years 2019-2020, the
growth rate of these expenditures has been set to
be consistent with a neutral fiscal policy stance.
This means that in this period public
consumption growth will pick up and reach a
level slightly higher than the GDP growth rate.
Current and capital account balance
The balance of payments statistics of the Polish
economy are favourable – in 2017 the surplus in
trade in goods and services reached a record high
level, while the positive current and capital
account balance improved (Figure 4.14). The
achievement of a high trade surplus was
supported by the relatively high competitiveness
of the Polish economy and growing external
demand related to the acceleration of global GDP
growth. At the same time, the current and capital
account surplus in 2017 was lowered by a
persistent high primary income deficit. Higher
earnings of foreign investors in Poland relative to
that of Polish investors abroad result both from
the higher amount of invested capital, and by its
higher rate of return.
In the years 2018-2019, following the decrease in
trade surplus, a fall in the total balance of the
current and capital account is expected, although
it will remain positive (Figure 4.14). Relatively
high import volume growth related to the
expected growth in investment demand in the
Polish economy, including corporate investment
characterised by relatively higher import
intensity, will contribute to the deterioration of
the trade surplus (Figure 4.15). The forecast
slowdown in economic growth in the euro area
and the expected appreciation trend of the real
effective exchange rate of the zloty, limiting the
Figure 4.14 Current and capital account balance (percent of GDP)
- breakdown
Source: GUS data, NBP calculations.
Figure 4.15 Foreign trade
Source: GUS data, NBP calculations.
-6
-4
-2
0
2
4
6
8
10
-6
-4
-2
0
2
4
6
8
10
2016 2017 2018 2019 2020
Goods and services Primary income
Secondary income Capital account
Current and capital account
-3
-2
-1
0
1
2
3
4
5
-15
-10
-5
0
5
10
15
20
25
11q1 12q1 13q1 14q1 15q1 16q1 17q1 18q1 19q1 20q1 20q4
Net exports contribution (percentage points, right axis)
Exports (y/y, %, left axis)
Imports (y/y, %, left axis)
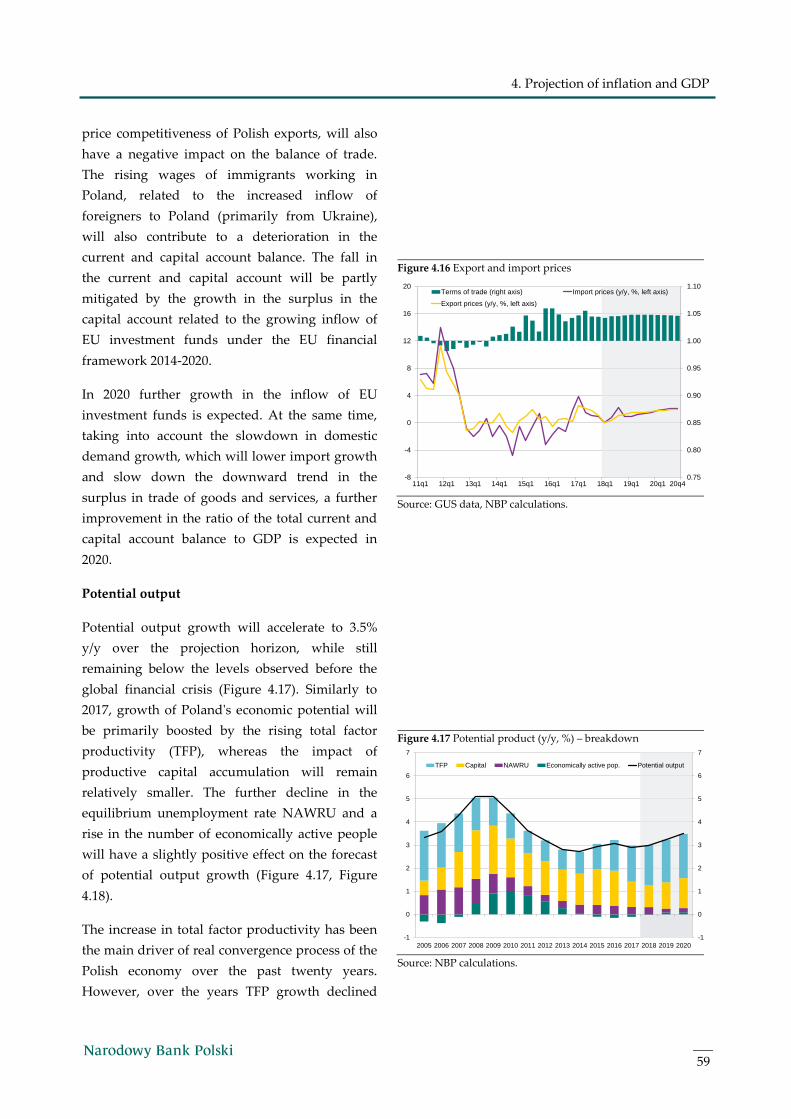
4. Projection of inflation and GDP
59
price competitiveness of Polish exports, will also
have a negative impact on the balance of trade.
The rising wages of immigrants working in
Poland, related to the increased inflow of
foreigners to Poland (primarily from Ukraine),
will also contribute to a deterioration in the
current and capital account balance. The fall in
the current and capital account will be partly
mitigated by the growth in the surplus in the
capital account related to the growing inflow of
EU investment funds under the EU financial
framework 2014-2020.
In 2020 further growth in the inflow of EU
investment funds is expected. At the same time,
taking into account the slowdown in domestic
demand growth, which will lower import growth
and slow down the downward trend in the
surplus in trade of goods and services, a further
improvement in the ratio of the total current and
capital account balance to GDP is expected in
2020.
Potential output
Potential output growth will accelerate to 3.5%
y/y over the projection horizon, while still
remaining below the levels observed before the
global financial crisis (Figure 4.17). Similarly to
2017, growth of Poland's economic potential will
be primarily boosted by the rising total factor
productivity (TFP), whereas the impact of
productive capital accumulation will remain
relatively smaller. The further decline in the
equilibrium unemployment rate NAWRU and a
rise in the number of economically active people
will have a slightly positive effect on the forecast
of potential output growth (Figure 4.17, Figure
4.18).
The increase in total factor productivity has been
the main driver of real convergence process of the
Polish economy over the past twenty years.
However, over the years TFP growth declined
Figure 4.16 Export and import prices
Source: GUS data, NBP calculations.
Figure 4.17 Potential product (y/y, %) – breakdown
Source: NBP calculations.
0.75
0.80
0.85
0.90
0.95
1.00
1.05
1.10
-8
-4
0
4
8
12
16
20
11q1 12q1 13q1 14q1 15q1 16q1 17q1 18q1 19q1 20q1 20q4
Terms of trade (right axis) Import prices (y/y, %, left axis)
Export prices (y/y, %, left axis)
-1
0
1
2
3
4
5
6
7
-1
0
1
2
3
4
5
6
7
2005 2006 2007 2008 2009 2010 2011 2012 2013 2014 2015 2016 2017 2018 2019 2020
TFP Capital NAWRU Economically active pop. Potential output

Inflation Report – March 2018
60
due to the gradual exhaustion of possible further
increase in productivity via the improvement in
production factor allocation, as well as the import
of technology through foreign direct investment39.
In recent years the downward trend of TFP
growth in Poland has been reversed and the
pickup in growth of total factor productivity is
expected to continue over the projection horizon.
The increase in TFP growth will be supported,
among others, by the further improvement in the
quality of human capital, expressed, among
others, by the growing share of population with
higher education in the age group 44 and over, as
well as the increase in innovation performance of
the Polish economy and improvement in its
position in the global value chains.
The growing stock of productive capital will also
boost potential product growth. However, due to
the decline in investment rate as a result of a
decrease in investment expenditure in the public
sector in 2016 and in the corporate sector in 2016-
2017, the growth rate of gross fixed capital
formation over the projection horizon will be
lower than in previous years.
The growth of economic potential will be
supported by the favourable situation in the
labour market, which in turn will facilitate an
increase in labour force participation (Figure
4.19). In particular, this effect will concern pre-
retirees (50-59/64 years old), whose labour force
participation is still significantly lower than in
Western European countries. At the same time as
a result of the lowering of the statutory retirement
age as of 1 October 2017, the labour force
participation rate in the oldest age group will
probably decline. Moreover, potential output
growth in the projection horizon will be limited
by the continuation of negative demographic
trends observed in Poland, i.e. the ageing and
shrinking of the population. This trend is
Figure 4.18 Unemployment
Source: GUS data, NBP calculations.
Figure 4.19 Change in economically active population (thous.,
y/y)
Source: GUS data, NBP calculations.
39 Potencjał innowacyjny gospodarki: uwarunkowania, determinanty, perspektywy, NBP, May 2016 (available in Polish only).
-4
-2
0
2
4
6
2
4
6
8
10
12
11q1 12q1 13q1 14q1 15q1 16q1 17q1 18q1 19q1 20q1 20q4
Unemployment gap (percentage points., right axis)
Unemployment (%, left axis)
NAWRU (%, left axis)
-300
-200
-100
0
100
200
300
400
500
600
-300
-200
-100
0
100
200
300
400
500
600
2011 2012 2013 2014 2015 2016 2017 2018 2019 2020
Demographic structurePopulationParticipation rate (population 60/65+ years of age)Participation rate (population 45-59/64 years of age)Participation rate (population 25-44 years of age)Participation rate (population 15-24 years of age)Labour force

4. Projection of inflation and GDP
61
corroborated by the declining size of the cohorts
entering the labour market and the increased
share of persons in the post-productive age
(LFS)40. However, the presence of immigrants,
especially Ukrainian citizens, on the domestic
labour market, has a positive impact on labour
supply41.
Output gap
In line with the current projection, the output gap
which has been negative since 2012 closed in the
second half of 2017. In the coming years the
positive output gap will grow and at the end of
the projection horizon will stand at 1.8% of
potential output (Figure 4.20). Thus, production
capacity growth will lag behind GDP growth. The
increase in demand pressure in the economy as a
whole, reflected in the rising output gap, will
gradually translate into an increase in CPI
inflation in the coming years.
Labour market
After a sharp increase in the number of employed
persons in recent quarters (see Chapter 2.4 Labour
market) employment growth is expected to slow
down over the projection horizon (Figure 4.21).
Although the determinants of demand for labour
remain favourable, as suggested, among others,
by the forecasts of the employment declared by
the enterprises surveyed by NBP42 reaching the
highest level since 2007, along with the gradual
slowdown in GDP growth, slower growth in
demand for labour is expected in the coming
years. Growth in the number of employed
persons will also increasingly be held back by the
limited supply of employees. The number of the
Figure 4.20 Output gap
Source: GUS data, NBP calculations.
Figure 4.21 Employment and labour force participation
Source: GUS data, NBP calculations.
40 The NECMOD model distinguishes four age groups. The term "persons in the post-productive age" refers to the oldest group,
covering women aged 60 and over, and men over 65. The boundaries of this age group do not change with the change in the
retirement age.
41 Immigrants have a positive impact on the potential of the Polish economy, but due to the definition of Polish residents used in
the LFS survey, they are included in the cohorts of the economically active and the employed only to a limited extent according to
this methodology.
42 NBP Quick Monitoring Survey. Economic climate in the enterprise sector, NBP, January 2018.
-4
-3
-2
-1
0
1
2
3
4
5
6
7
-4
-3
-2
-1
0
1
2
3
4
5
6
7
11q1 12q1 13q1 14q1 15q1 16q1 17q1 18q1 19q1 20q1 20q4
Output gap (% potential output)
GDP (y/y, %)
Potential output (y/y, %)
53.0
53.5
54.0
54.5
55.0
55.5
56.0
56.5
57.0
57.5
-2
-1
0
1
2
3
4
5
6
7
11q1 12q1 13q1 14q1 15q1 16q1 17q1 18q1 19q1 20q1 20q4
Employment (y/y) (%, left axis)
Participation rate (%, right axis)

Inflation Report – March 2018
62
unemployed who could undertake employment is
small, which is reflected in the record low and
declining LFS unemployment rate (Figure 4.18,
Figure 4.22). As a result, enterprises face
mounting difficulties with finding suitable
employees, as reported by almost half of the
surveyed companies43. Another sign of this trend
is the growing number of job vacancies. Matching
demand and supply in the labour market will
therefore be achieved by higher intensity of
labour utilisation, supported by an increase in
expenditure on gross fixed capital formation
leading to capital deepening. Activation of
persons remaining outside the labour market will
also continue.
Falling unemployment, a large number of job
offers, and diminishing probability of losing a job
will result in the continuation of high wage
growth over the projection horizon exceeding
labour productivity growth (Figure 4.23). The
projection scenario of continuing high wage
growth is corroborated by the results of NBP
surveys pointing to a rise in the share of
companies forecasting wage increases44. At the
same time, the share of employees to benefit from
wage increases is at a relatively stable level, while
the value of the average wage rise has decreased
slightly45. The scale of future wage increases may
be dampened by the still small number of
companies declaring problems with finding
employees as a barrier to development46. The
presence of immigrants from Ukraine also
mitigates the growing wage pressure in the
economy.
Exchange rate
The current exchange rate of the zloty is below
the level resulting from fundamental factors. This
Figure 4.22 Change in unemployment rate - decomposition
Source: GUS data, NBP calculations.
Figure 4.23 Unit labour costs
Source: GUS data, NBP calculations.
43 NBP Quick Monitoring Survey. Economic climate in the enterprise sector, NBP, January 2018.
44 NBP Quick Monitoring Survey. Economic climate in the enterprise sector, NBP, January 2018.
45 NBP Quick Monitoring Survey. Economic climate in the enterprise sector, NBP, January 2018.
46 NBP Quick Monitoring Survey. Economic climate in the enterprise sector, NBP, January 2018.
-3
-2
-1
0
1
2
-3
-2
-1
0
1
2
11q1 12q1 13q1 14q1 15q1 16q1 17q1 18q1 19q1 20q1 20q4
Employment Labour force Unemployment rate (y/y)
-2
0
2
4
6
8
10
-2
0
2
4
6
8
10
11q1 12q1 13q1 14q1 15q1 16q1 17q1 18q1 19q1 20q1 20q4
Wages (y/y, %) Labour productivity (y/y, %) ULC (y/y, %)

4. Projection of inflation and GDP
63
is suggested, among other things, by the
improvement in the surplus on the current and
capital account in 2017. Despite the appreciation
in recent months, the exchange rate is still not a
barrier to export activity of Polish enterprises.47
Over the projection horizon, the effective
exchange rate of the zloty is expected to
strengthen and gradually approach the
equilibrium exchange rate. This is supported by
the forecasted growing inflow of EU transfers and
the high trade surplus, which will underpin the
positive balance on the total current and capital
account in 2018-2020. The appreciation of the
zloty over the projection horizon will also be
driven by the relatively low level of risk premium
related to, among others, a significant decline in
the general government deficit. The strengthening
of the zloty is also driven by the ongoing process
of real convergence of the Polish economy,
reflected in higher growth of the domestic
potential product relative to that of Poland’s main
trading partners. The scale of the expected zloty
exchange rate appreciation is partly curbed by the
declining interest rate disparity. This is a result of
the assumption of unchanged NBP interest rates
amid an expected increase in the cost of money in
the environment of the Polish economy. In
particular, over the projection horizon a
normalisation of monetary policy is expected in
the euro area as well as a continuation of the cycle
of interest rate hikes in the United States and the
United Kingdom. Due to the slight weakening of
the US dollar against the euro expected over the
projection horizon, the zloty will strengthen
slightly more against the US currency than the
single European currency.
Components of CPI inflation
CPI inflation in the current forecasting round will
follow a gradual upward trend and in the years
Figure 4.24 CPI and core inflation
Source: GUS data, NBP calculations.
47 NBP Quick Monitoring Survey. Economic climate in the enterprise sector, NBP, January 2018.
-2
-1
0
1
2
3
4
5
6
-2
-1
0
1
2
3
4
5
6
11q1 12q1 13q1 14q1 15q1 16q1 17q1 18q1 19q1 20q1 20q4
CPI inflation (y/y) (%) Core inflation (y/y) (%)

Inflation Report – March 2018
64
2019-2020 will run slightly above 2.5% (Figure
4.24).
The increase in CPI inflation in the years 2018-
2020, and especially in core inflation, will be
driven by rising cost and demand pressure in the
Polish economy (Figure 4.24). Firms’ difficulties
of finding suitably qualified personnel due to
insufficient labour supply will translate into wage
growth exceeding labour productivity growth. As
a result, unit labour cost growth will accelerate,
approaching the level of 3.5% y/y in 2018-2020
(Figure 4.23). Higher inflation will also be the
result of increasing demand pressure. Yet, the
sensitivity of prices to changes in domestic
economic conditions has decreased in recent
years48.
The impact of domestic factors on growth in CPI
inflation will be partly mitigated by the low
growth rate of import prices expected in the years
2018-2020, resulting from the persistence of
moderate price growth in the euro area and the
appreciation of the zloty. The rising costs for
businesses will also be curbed by the forecast
gradual decline in global energy commodity
prices over the projection horizon. This decline
will translate into lower growth of domestic
energy prices in the years 2019-2020. However,
low inflation of this category in 2018 will be the
result of a lower increase in charges for electricity
than in 2017 and the anticipated fall in natural gas
prices for households due to the expected end of
the arbitration proceedings between PGNiG and
Gazprom in the first half of 2018.
Despite the pro-inflation impact of demand and
cost factors, food price inflation in the years 2018-
2020 will not exceed the level of 2017 (Figure
4.25). The significant increase in food prices in
2017 was the result of lower availability of certain
Figure 4.25 Food and energy price inflation
Source: GUS data, NBP calculations.
48 Szafranek, Karol, 2017. Flattening of the New Keynesian Phillips curve: Evidence for an emerging, small open economy, Economic
Modelling, Elsevier, vol. 63(C), s. 334-348.
-6
-4
-2
0
2
4
6
8
10
12
-6
-4
-2
0
2
4
6
8
10
12
11q1 12q1 13q1 14q1 15q1 16q1 17q1 18q1 19q1 20q1 20q4
Food prices inflation (y/y) (%) Energy prices inflation (y/y) (%)

4. Projection of inflation and GDP
65
agricultural commodities and products (among
others, fruit, butter, milk, eggs), while the supply
of these products will gradually improve in line
with the assumptions in the projection. In
addition, the end of the production quota system
in the EU sugar market since October 2017 will
constrain food price growth in the coming
quarters.
4.4 Current versus previous projection
Data released after the cut-off date of the
November projection contributed to an upward
revision of the GDP growth forecast in 2018-2019
by 0.5-0.6 p.p., at the same time lowering slightly
the inflation path in the coming quarters (Table
4.2, Figure 4.26, Figure 4.28).
GDP
The upward revision of the GDP growth forecast
in the March projection for the years 2018-2019 is
driven by higher economic activity in 2017. In
comparison to the November projection, in 2017
the situation in Poland's foreign trade was
particularly favourable (Figure 4.27). The increase
in sales of own products, combined with an
upward revision of forecasts of economic activity
in the euro area and the United States, translates
into an improvement in the enterprises
expectations for the future. This is confirmed by
the results of the NBP Quick Monitoring Survey49
. The enterprises participating in the survey have
further raised their demand forecasts, at the same
time assessing their level of capacity utilisation as
close to full. At the same time, the percentage of
enterprises intending to embark on new large
investment projects in 2018 is growing, and the
total amount of expenditures planned by them is
also increasing. In addition, enterprises assess
Table 4.2 March projection versus November projection
2017 2018 2019
GDP (y/y, %)
March 2018 4.6 4.2 3.8
November 2017 4.2 3.6 3.3
CPI inflation (y/y, %)
March 2018 2.0 2.1 2.7
November 2017 1.9 2.3 2.7
Source: NBP calculations.
Figure 4.26 March projection versus November projection: GDP
growth (y/y, %)
Source: NBP calculations.
49 NBP Quick Monitoring Survey. Economic climate in the enterprise sector, NBP, January 2018.
-1
0
1
2
3
4
5
6
7
8
-1
0
1
2
3
4
5
6
7
8
14q1 15q1 16q1 17q1 18q1 19q1 19q4
90% 60% 30% Nov 17 Mar 18

Inflation Report – March 2018
66
their current level of inventories as too low - the
scale of shortages of finished goods inventories
exceeds that observed during the peak of the
business cycle in 2007. Including this information
has contributed to an upward revision of both the
forecast path of investment and changes in
inventories in the years 2018-2019.
Private consumption is another GDP component,
after gross capital formation, whose growth
outlook is currently assessed better than in the
November projection. In the years 2018-2019,
along with an improvement in the economic
situation, the forecast of the labour market
situation is more favourable, what is reflected in
faster growth in wage fund. In addition, the
gradual improvement in household sentiment
will have a favourable impact on the forecast of
private consumption – consumer confidence
indicators are still in the medium-term upward
trend reaching historically high levels.
After a record trade surplus in 2017 the space for
a further improvement in the contribution of net
exports to growth is limited, especially given the
expected appreciation trend of the zloty in the
following years. In addition, along with the faster
growth of import-intensive GDP components
such as investment and private consumption,
relatively strong import growth is expected, thus
reducing the contribution of net exports to GDP.
Therefore, in comparison to the November
projection, higher economic growth in the years
2018-2019 will be driven to a greater extent by
domestic demand and to a lesser extent by foreign
trade (Figure 4.27).
Inflation
In 2017, CPI inflation was 0.1 p.p. above
expectations from the November projection. This
was due to stronger food price growth in 2017 Q4
as a result of the lower supply of certain
agricultural commodities, primarily fruits,
Figure 4.27 Decomposition of deviations between March and
November projection: GDP growth (percentage points)
Source: NBP calculations.
The data presented in the chart may vary slightly from those in Table 4.2,
due to rounding of numbers to one decimal place.
Figure 4.28 March projection versus November projection: CPI
inflation (y/y, %)
Source: GUS data, NBP calculations.
-0.4
-0.2
0.0
0.2
0.4
0.6
0.8
1.0
-0.4
-0.2
0.0
0.2
0.4
0.6
0.8
1.0
2017 2018 2019
Private consumption Public consumption
Gross capital formation Net exports
GDP
-3
-2
-1
0
1
2
3
4
5
6
-3
-2
-1
0
1
2
3
4
5
6
14q1 15q1 16q1 17q1 18q1 19q1 19q4
90% 60% 30% Nov 17 Mar 18 Inflation target

4. Projection of inflation and GDP
67
vegetables, as well as dairy and fat products
(Figure 4.29). This effect will however gradually
fade over the course of 2018.
At the same time, core inflation was lower than
expected in 2017 Q4 and in January 2018. Weaker
readings of this indicator, despite higher
economic and wage growth, probably reflect a
lower sensitivity of price changes to economic
activity50 and indicate strong competition in the
domestic market. In addition, price growth was
lowered by the strengthening of the exchange rate
of the zloty, which translates into cheaper goods
imported from abroad. These factors are behind
the downward revision of the path of core
inflation in the March projection, while the scale
of the revision will diminish in 2019 as a result of
growing demand pressure in the economy and
the improving labour market situation.
Compared to the November projection, energy
price forecasts in the years 2018-2019 did not
change significantly. On the one hand, oil price
increases translated into higher domestic fuel
prices. On the other hand, this is mitigated by the
relatively stronger appreciation of the zloty
against the US dollar. Moreover, in January 2018
the increase in electricity prices, that was
expected in the previous forecasting round, did
not take place, which also contributed to the
downward revision of the energy price forecasts.
Data released after the cut-off date of the
November projection had the multidirectional
impact on the inflation path. In total, the forecast
for 2019 did not change compared to the previous
forecasting round, however, price growth in 2018
declined slightly.
Figure 4.29 Decomposition of deviations between March and
November projection: CPI inflation (percentage points)
Source: NBP calculations.
The data presented in the chart may vary slightly from those in Table 4.2,
due to rounding of numbers to one decimal place.
50 Szafranek, Karol, 2017. Flattening of the New Keynesian Phillips curve: Evidence for an emerging, small open economy, Economic
Modelling, Elsevier, vol. 63(C), pp. 334-348.
-0.4
-0.2
0.0
0.2
0.4
-0.4
-0.2
0.0
0.2
0.4
2017 2018 2019
Core inflation Food prices Energy prices CPI inflation

Inflation Report – March 2018
68
4.5 Forecast uncertainty sources
The central scenario of the projection, presenting
the most likely macroeconomic developments in
Poland, is subject to uncertainty reflected in the
fan charts (Figures 4.1 and 4.2). Its main source is
the further developments in the external
environment of the Polish economy as well as the
labour supply prospects in Poland. The balance of
sources of uncertainty points to a near-
symmetrical distribution of risks to CPI inflation
(Table 4.3). On the other hand, GDP growth may
run lower than in the central scenario over the
longer-term projection horizon. The asymmetry of
the balance of risks associated with the GDP
growth rate results from the higher probability of
the labour force running below the central
scenario’s assumptions. Under the assumption of
unchanged NBP reference rate, the probability of
CPI inflation running within the symmetrical
band for deviations from the NBP inflation target
of 2.5% (+/- 1 percentage point) gradually declines
from its current level of 86% to 41% at the end of
the projection horizon (Table 4.3). The most
significant uncertainty sources for the projection
are discussed below.
Table 4.3 Probability of inflation running:
Below 1.50%
Below 2.50%
Below 3.50%
Below the central
projection
In the range
(1.5-3.5%)
18q1 0.14 0.97 1.00 0.50 0.86
18q2 0.16 0.69 0.98 0.50 0.82
18q3 0.21 0.58 0.89 0.50 0.67
18q4 0.37 0.69 0.91 0.51 0.54
19q1 0.29 0.57 0.82 0.51 0.53
19q2 0.23 0.47 0.72 0.51 0.50
19q3 0.21 0.43 0.67 0.51 0.46
19q4 0.20 0.41 0.65 0.51 0.45
20q1 0.20 0.40 0.63 0.51 0.43
20q2 0.21 0.41 0.63 0.51 0.42
20q3 0.21 0.40 0.63 0.51 0.41
20q4 0.21 0.40 0.62 0.51 0.41
Source: NBP calculations.
Deterioration in the prospects of growth in the
global economy
The risk of a lower path of GDP growth in Poland
than in the baseline scenario is to a large extent
connected with the possibility of a weakening of
the global economic conditions.
Among the global factors, including those related
to an increase in geopolitical tensions, a significant
source of uncertainty for the projection is future
economic activity in the world’s largest economy –
the United States. Following the dynamic growth
of asset prices on the US stock markets in 2017, the
risk of their overvaluation has risen significantly.
Although recently the asset prices have fallen, this
does not rule out a stronger correction in the
projection horizon. Combined with the low saving
rate of households and high share of financial
assets in their wealth, this could lead to a marked
slowdown in growth of private consumption, and
consequently, lower GDP growth in the US
economy than assumed in the projection.
Future economic growth developments in the
United States, as well as in other developed
economies, are also fraught with uncertainty
connected with the continuation of low
productivity growth rate amid low investment
growth.

4. Projection of inflation and GDP
69
A risk for the GDP growth outlook in certain
European economies is also posed by the scale of
the future adjustment in the housing market in
response to the currently observed relatively high
real estate prices. Particularly serious
consequences for GDP growth would be observed
in countries characterised by high levels of
household debt.
The possibility of a downturn in global trade as a
result of a slowdown in the integration processes
of the global economy continues to be a source of
risk for the current projection. The uncertainty of
growth and inflation outlook is also related to the
terms on which the United Kingdom leaves the
European Union.
Improvement in global economic conditions
Should the risk factors strengthening the recovery
in global economic conditions materialise, the
GDP growth rate in Poland could reach a higher
level than in the baseline scenario of the
projection.
In particular, this would take place amid a
stronger impact of the tax reform in the United
States on the economic situation in this country
compared to the projection assumptions. Higher
GDP growth in the US economy may also be
related to the more favourable supply conditions
in this economy. Continuing relatively low
inflation rate may indicate that the decline in
growth of potential GDP in the United States
following the financial crisis was less significant
than assumed in the projection51.
The possibility of higher growth in the euro area
than assumed in the projection, is in turn
connected with the more pronounced rebound in
investment amid high internal and external
51 Olivier Coibion, Yuriy Gorodnichenko, Mauricio Ulate, 2018.
Real-Time Estimates of Potential GDP: Should the Fed Really
Be Hitting the Brakes?, Policy Futures, Center on Budget and
Policy Priorities.
demand accompanied by stronger corporate
sentiment. In the longer projection horizon a
higher GDP growth rate in the euro area may also
result from a stronger improvement in its
competitiveness due to structural reforms
implemented in some of the member countries.
Labour supply in Poland
The future labour force in Poland remains the
largest internal source of risk for the central
projection scenario. This is connected with the
difficulty in assessing how many people who are
entitled to retire under the current law that lowers
the retirement age become economically inactive.
The projection assumes that the favourable
situation in the labour market will encourage the
majority of people who are currently economically
active to stay in the labour market, but these
estimates are subject to significant uncertainty. It is
also difficult to assess to what extent the currently
observed positive structural changes in the labour
market, leading to an increase in economic activity
in the age group 45-59/64, will continue in the
projection horizon.
The materialisation of the above risk factors,
resulting in lower labour supply, restricting the
space to increase domestic production, would lead
to a slowdown in the economic growth rate in the
projection horizon.
Oil prices in the global markets
Changes in global prices of oil and of other energy
commodities continue to be a source of
uncertainty for the inflation path in the baseline
scenario. The OPEC supply policy remains
unspecified after the current restrictions on oil
production expire at the end of 2018. The forecasts
of the supply of shale oil in the United States are
also fraught with uncertainty due to the short
production history of the currently available
formations and the dynamic improvement of
drilling technology. Demand for oil in the

Inflation Report – March 2018
70
emerging Asian economies also add to the
uncertainty associated with the path of oil prices
assumed in the baseline scenario.

4. Projection of inflation and GDP
71
Table 4.4 Central path of inflation and GDP projection
2016 2017 2018 2019 2020
Consumer Price Index CPI (%, y/y) -0.6 2.0 2.1 2.7 3.0
Core inflation net of food and energy prices (%, y/y) -0.2 0.7 1.6 2.6 3.0
Food prices (%, y/y) 0.9 4.3 3.3 2.9 3.2
Energy prices (%, y/y) -3.8 3.3 2.0 2.5 2.5
GDP (%, y/y) 2.9 4.6 4.2 3.8 3.6
Domestic demand (%, y/y) 2.2 4.7 4.7 4.3 3.8
Private consumption (%, y/y) 3.9 4.8 4.1 3.9 3.7
Public consumption (%, y/y) 1.7 2.4 2.2 3.9 3.9
Gross fixed capital formation (%, y/y) -7.9 5.4 8.6 6.3 4.8
Contribution of net exports (percentage points y/y) 0.7 0.1 -0.4 -0.4 -0.2
Exports (%, y/y) 8.8 7.0 6.8 5.8 5.3
Imports (%, y/y) 7.9 7.4 7.8 6.7 5.7
Gross wages (%, y/y) 3.8 5.3 6.8 6.8 6.9
Total employment (%, y/y) 0.7 1.7 0.9 0.7 0.3
Unemployment rate (%) 6.2 4.8 3.9 3.5 3.3
NAWRU (%) 5.6 5.1 4.7 4.5 4.2
Labour force participation rate (%, y/y) 56.2 56.5 56.5 56.8 56.9
Labour productivity (%, y/y) 2.2 2.9 3.3 3.1 3.3
Unit labour cost (%, y/y) 1.7 2.5 3.3 3.7 3.5
Potential output (%, y/y) 3.1 2.9 3.0 3.2 3.5
Output gap (% potential GDP) -1.5 0.0 1.2 1.7 1.8
Index of agricultural commodity prices (EUR; 2011=1.0) 0.90 0.90 0.81 0.85 0.85
Index of energy commodity prices (USD; 2011=1.0) 0.50 0.64 0.70 0.66 0.63
Inflation abroad (%, y/y) 1.1 1.3 1.4 1.9 2.1
GDP abroad (%, y/y) 1.8 2.4 2.3 1.8 1.6
Current and capital account balance (%, GDP) 0.8 1.4 1.0 0.8 1.0
WIBOR 3M (%) 1.70 1.73 1.73 1.73 1.73
Source: Bloomberg, Eurostat, GUS, NBP calculations. LFS data on total employment, labour force participation rate and
unemployment rate. Index of agricultural prices is based on futures quoted mainly on European stock exchanges. Index includes
prices of wheat, oilseed, pork, potatoes, sugar, cocoa, coffee, skimmed milk powder, butter and frozen concentrated orange juice
allowing for weights reflecting the consumption structure of Polish households. The index of the prices of energy commodities
includes the prices of crude oil, coal and natural gas allowing for the consumption structure of these commodities in Poland.

Inflation Report – March 2018
72

5. The voting of the Monetary Policy Council members in October 2017 – January 2018
73
The voting of the Monetary Policy Council
members in October 2017 – January 2018
Date: 8 November 2017
Subject matter of motion or resolution:
Resolution No. 6/2017 of 8 November 2017 amending the resolution on the required reserve ratios
for banks, cooperative savings and credit unions and the National Association of Cooperative
Savings and Credit Unions and the remuneration of required reserves.
Voting of the MPC members:
For: A. Glapiński
G. M. Ancyparowicz
E. Gatnar
Ł. J. Hardt
E. M. Łon
R. Sura
K. Zubelewicz
J. Żyżyński
Against:
J. J. Kropiwnicki and E. J. Osiatyński were absent.
Date: 5 December 2017
Subject matter of motion or resolution:
Resolution No. 7/2017 of 5 December 2017 amending the resolution on the required reserve ratios
for banks, cooperative savings and credit unions and the National Association of Cooperative
Savings and Credit Unions and the remuneration of required reserves.
Voting of the MPC members:
For: A. Glapiński
E. Gatnar
J. J. Kropiwnicki
E. M. Łon
R. Sura
K. Zubelewicz
J. Żyżyński
Against: G. M. Ancyparowicz
Ł. J. Hardt
E. J. Osiatyński
Inflation Report – March 2018
74
Date: 19 December 2017
Subject matter of motion or resolution:
Resolution No. 8/2017 of 19 December 2017 on approving the Financial Plan of the National Bank
of Poland for 2018.
Voting of the MPC members:
For: A. Glapiński
G. M. Ancyparowicz
E. Gatnar
Ł. J. Hardt
J. J. Kropiwnicki
E. M. Łon
E. J. Osiatyński
R. Sura
J. Żyżyński
Against: K. Zubelewicz

www.nbp.pl