Embed Size (px)
Citation preview
Inflation in Armenia:What is happening to Armenian prices?
Nienke OomesInternational Monetary FundResident Representative in Armeniawww.imf.org/yerevan

Outline1. What is inflation targeting?2. How is CPI inflation measured in Armenia?3. Recent inflation developments4. Why did food prices increase in 2007?5. How does Armenia compare?6. Policy recommendations

1. What is inflation targeting?A monetary policy first introduced in New Zealand in 1990Central bank commits to a numerical inflation target, for example:
Target range: 1-3% in New ZealandPoint target: 2% in UK, 2.5% in NorwayPoint target plus range: 2+1% in Canada and Sweden
Central bank should not have targets for other variables (e.g., exchange rate, monetary aggregates)Central bank’s inflation forecast should approach the inflation target, and is central to monetary policyCentral banks need to be independent, transparent, and accountable (no secrecy)Fiscal policy should also support the inflation target

As of 2007, IT had been adopted by 27 countriesIT appears to be more successful than other monetary policy regimes (money targeting, exchange rate targeting) in stabilizing inflation and GDP growth

Inflation targeting in ArmeniaInitial phase of IT was introduced in Armenia in 2006Primary objective: ensure price stabilityInflation indicator: growth in consumer price index (CPI)Target band: 4% +1.5%Nominal anchor: inflation forecastTime horizon: 12 monthsOperational target: short-term interest rateMain instrument: repo (refinancing) operationAccountability and transparency: quarterly inflation report, quarterly minutes on interest rates, monthly press releases, minutes on interest rates after board meeting, CBA'smonthly Bulletin, biannual monetary program submitted to National Assembly, etc.

Inflation targets in Armenia
2006Target: 3%, later revised to 5+1.5 %Actual: 5.2%
2007Target: 3+1.5 %, later revised to 4+1.5 %Actual: 6.6 %
2008Target: 3+1.5 %, later revised to 4+1.5 %Actual: ?
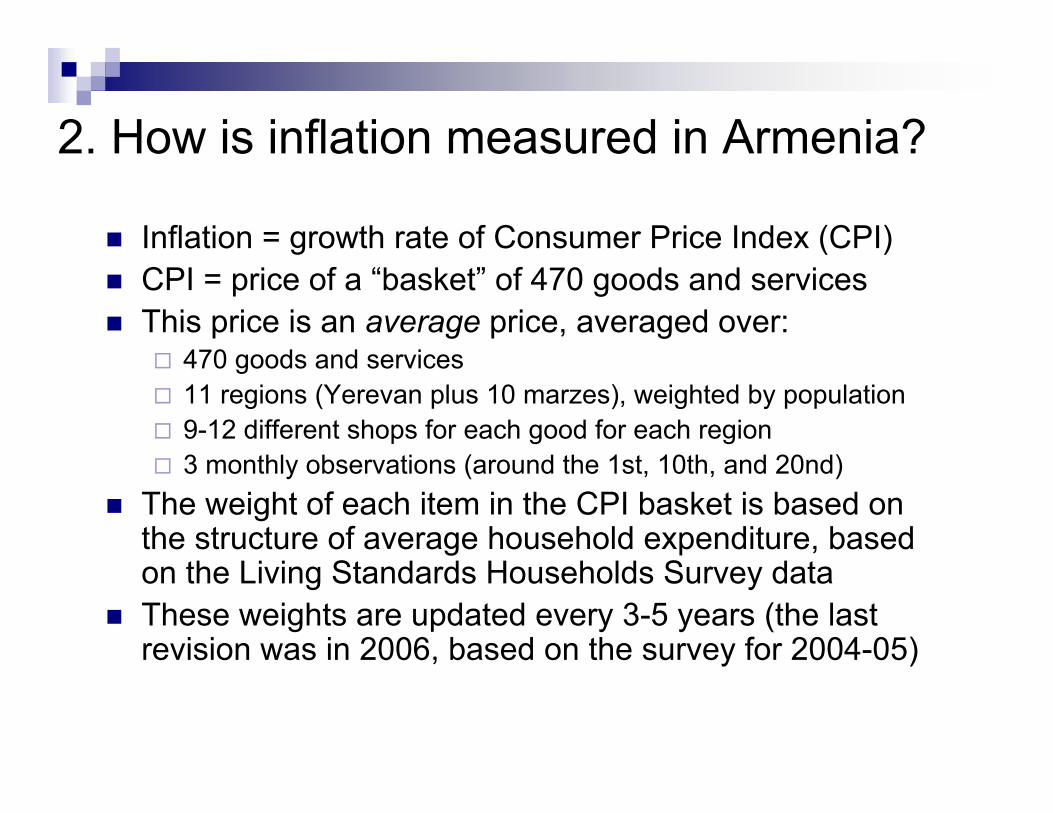
2. How is inflation measured in Armenia?
Inflation = growth rate of Consumer Price Index (CPI)CPI = price of a “basket” of 470 goods and servicesThis price is an average price, averaged over:
470 goods and services11 regions (Yerevan plus 10 marzes), weighted by population9-12 different shops for each good for each region3 monthly observations (around the 1st, 10th, and 20nd)
The weight of each item in the CPI basket is based on the structure of average household expenditure, based on the Living Standards Households Survey dataThese weights are updated every 3-5 years (the last revision was in 2006, based on the survey for 2004-05)

CPI weights of goods and servicesFOOD 53.9% SERVICES 29.9%Bread and cereals 14.9% Electricity 4.9%Meat 9.5% Hospital surgery services 4.3%Alcohol and tobacco 5.9% University education 2.5%Vegetables 4.7% Air transport 1.4%Milk 4.3% Gas 1.3%Oils and fats 4.1% Taxi rides 0.9%Fruit 2.6% Diagnostic care 0.9%Other 8.0% Other 13.6%
OTHER GOODS 16.2%Petrol 2.6%Washing powder 0.6%Liquid Gas 0.5%Color television 0.5%Water-soluble tablets, Aspirin UPSA 0.3%Trousers 0.3%Pills for heart disease 0.3%Other 11.1%

3. Recent inflation developments
-4
-2
0
2
4
6
8
10
Jan-04 Jan-05 Jan-06 Jan-07 Jan-08
Services inflationFood inflationOther goods inflationStatistical discrepancy

Inflation contributions(December 2007 / December 2006)
Weight Inflation Contribution
Food 53.9% 9.7% 5.2%Services 29.9% 3.2% 0.9%Other goods 16.2% 2.5% 0.4%
Total 100.0% 6.6% 6.6%

Composition of food inflation
-10
-5
0
5
10
15
Jan-03 Jan-04 Jan-05 Jan-06 Jan-07 Jan-08
Meat Fruit VegetablesBread and cereals Oils and fats Other

Food price contributions(December 2007 / December 2006)
Weight Inflation Contribution
Bread and cereals 14.9% 23.9% 3.6%Oils and fats 4.1% 29.2% 1.2%Fruit 2.6% 15.9% 0.4%Meat 9.5% 2.7% 0.3%Vegetables 4.7% -5.3% -0.3%Other food 18.2% 0.5% 0.1%
Total 53.9% 9.7% 5.2%

4. Why did food prices increase in 2007?
Higher world demand for foodHigh GDP growth (China, India)High energy prices → higher demand for corn (ethanol)
Lower world supply of foodBad weather (global warming?)High energy prices → using farmland for biofuels
Armenian food prices largely followed world pricesFood prices also increased in other countries

Higher world demand for food
High GDP growth, especially in China and India (40% of the world’s population)As people in India and China get richer, they want to eat more meat and dairy productsHigher demand for meat → higher demand for grain (it takes 7 kilos of grain to produce 1 kilo of beef)Higher grain prices → farmers switch to using corn for animals → higher corn pricesHigher oil prices → higher demand for biofuels (e.g., use corn to make ethanol) → higher corn prices (world corn prices roughly doubled in the last 2 years)

Lower world supply of foodBad wheat harvests in Ukraine, Russia, Egypt, AustraliaDrought in Australia → shortfall in Australian milk outputDroughts in northern and western China (27 million acres dried up)Floods in southern China (21.5 million acres drowned)Industrialization in China (Between 2000 and 2005, China lost over 3 million acres of farmland per year)Rapid decline of the EU share in the global dairy marketsHigher demand for biofuels → less land available for growing food → higher food prices

Armenian bread prices increased in line with Russian wheat export prices
Russian Wheat Export Prices and Armenian Bread Prices in USD (Index: December 2001 = 100)
Armenian bread prices
Russian wheat export prices
50
100
150
200
250
300
350
Dec-01
Jun-02
Dec-02
Jun-03
Dec-03
Jun-04
Dec-04
Jun-05
Dec-05
Jun-06
Dec-06
Jun-07
Dec-07

Armenian sunflower oil prices increased in line with U.S. prices
Sunflower oil prices in USD(Index: September 2002 = 100)
U.S. price of sunflower oil
Armenian price of sunflower oil
0
50
100
150
200
250
300
350
Dec-02
Jun-03
Dec-03
Jun-04
Dec-04
Jun-05
Dec-05
Jun-06
Dec-06
Jun-07
Dec-07

Armenian butter prices increased in line with (but less than) Oceania and the EU
Butter prices in USD(Index: December 2000 = 100)
Oceania butter price
Armenian butter price
EU butter price
0
50
100
150
200
250
300
350
400
450
500
Jan-01
Jul-01
Jan-02
Jul-02
Jan-03
Jul-03
Jan-04
Jul-04
Jan-05
Jul-05
Jan-06
Jul-06
Jan-07
Jul-07
Jan-08

Armenian sugar prices followed world sugar price increases, but did not fall
Refined Sugar Price in USD(Index: December 2004 = 100)
World refined sugar price
Armenian refined sugar
price
60
80
100
120
140
160
180
200
220
Dec-04 May-05 Oct-05 Mar-06 Aug-06 Jan-07 Jun-07 Nov-07

Rising inflation is a regional phenomenon
2
4
6
8
10
12
14
16
18
Dec-04
Mar-05
Jun-05
Sep-05
Dec-05
Mar-06
Jun-06
Sep-06
Dec-06
Mar-07
Jun-07
Sep-07
Dec-07
Average CIS inflation
Average CIS inflation excluding food
(Armenia, Azerbaijan, Georgia, Kazakhstan, Kyrgyz Republic, Tajikistan, and Uzbekistan)

5. How does Armenia compare?
Armenian inflation is relatively low compared to other CIS countriesArmenian prices are relatively low compared to prices in advanced countriesHowever, Armenian import prices are relatively high compared to other CIS countries

Armenian inflation is low compared to other CIS countries
7%
21%
11%
19%20% 20%
12%
Armen
ia
Azerba
ijan
Georgi
aKaza
khsta
n
Kyrgyst
an
Tajikis
tan
Uzbek
istan

02468
101214161820222426
Jan-05
Mar-05
May-05
Jul-05
Sep-05
Nov-05
Jan-06
Mar-06
May-06
Jul-06
Sep-06
Nov-06
Jan-07
Mar-07
May-07
Jul-07
Sep-07
Nov-07
Total CPI inflation
Non-food inflation
Azerbaijan

0
2
4
6
8
10
12
14
16
Jan-05
Mar-05
May-05
Jul-05
Sep-05
Nov-05
Jan-06
Mar-06
May-06
Jul-06
Sep-06
Nov-06
Jan-07
Mar-07
May-07
Jul-07
Sep-07
Nov-07
Total CPI inflation
Non-food inflation
Georgia
0
2
4
6
8
10
12
14
16
18
20
Jan-05
Mar-05
May-05
Jul-05
Sep-05
Nov-05
Jan-06
Mar-06
May-06
Jul-06
Sep-06
Nov-06
Jan-07
Mar-07
May-07
Jul-07
Sep-07
Nov-07
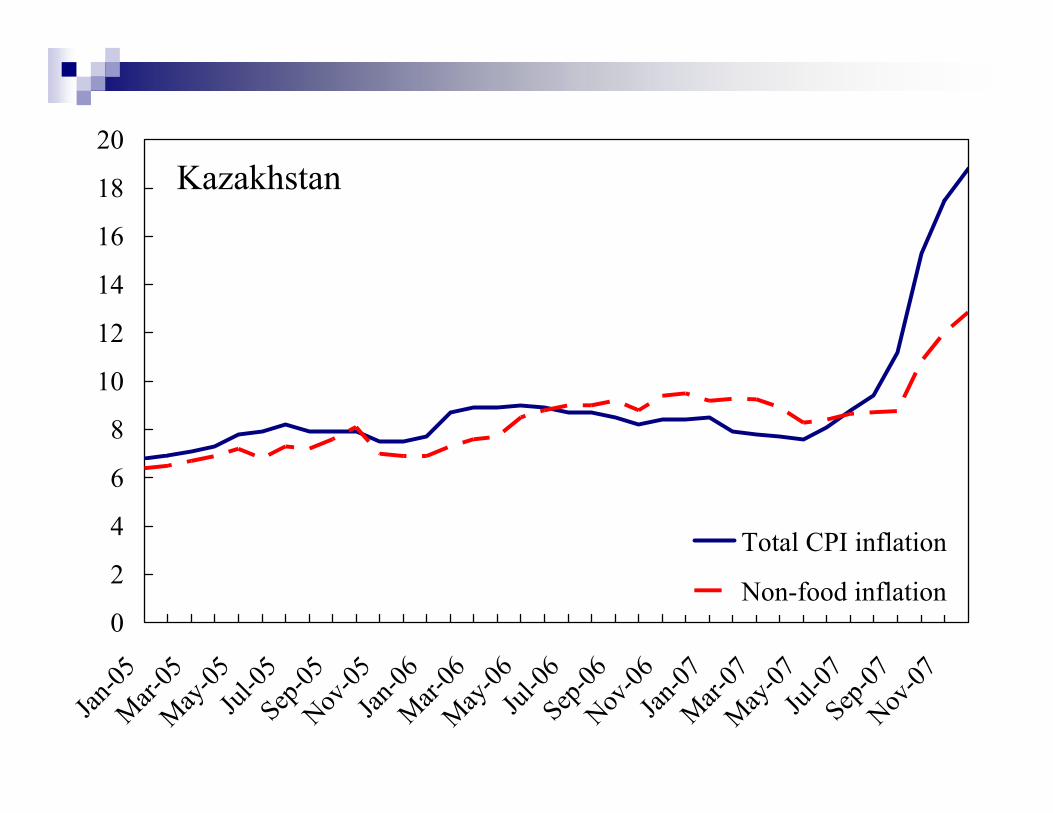
Total CPI inflation
Non-food inflation
Kazakhstan

02468
1012141618202224
Jan-05
Mar-05
May-05
Jul-05
Sep-05
Nov-05
Jan-06
Mar-06
May-06
Jul-06
Sep-06
Nov-06
Jan-07
Mar-07
May-07
Jul-07
Sep-07
Nov-07
Total CPI inflation
Non-food inflation
Kyrgyz Republic

02468
10121416182022
Jan-05
Mar-05
May-05
Jul-05
Sep-05
Nov-05
Jan-06
Mar-06
May-06
Jul-06
Sep-06
Nov-06
Jan-07
Mar-07
May-07
Jul-07
Sep-07
Nov-07
Total CPI inflation
Non-food inflation
Tajikistan

-4
-2
0
2
4
6
8
10
Jan-05
Mar-05
May-05
Jul-05
Sep-05
Nov-05
Jan-06
Mar-06
May-06
Jul-06
Sep-06
Nov-06
Jan-07
Mar-07
May-07
Jul-07
Sep-07
Nov-07
Total CPI inflation
Non-food inflation
Armenia

Why is inflation lower in Armenia?
Inflation targeting regimeRelatively little exchange rate interventionIncrease in interest rates
Tight fiscal policyLower gas import prices

Armenian prices are still low (but rising) in percent of U.S. prices
0
10
20
30
40
50
199319941995199619971998199920002001200220032004200520062007
Armenian price level in % of U.S. price level
Source: IMF, World Economic Outlook

Armenian bread prices are relatively highBread Prices in Capitals of Selected CIS Countries, October 2007(AMD per kilo)
0
100
200
300
400
500
600
Moldov
aAzer
baija
nTaji
kistan
Ukraine
Kyrgyz
Rep.
Belarus
Russia
Armen
iaKaza
khsta
n
Source: Inter-State Statistical Committee of the CIS
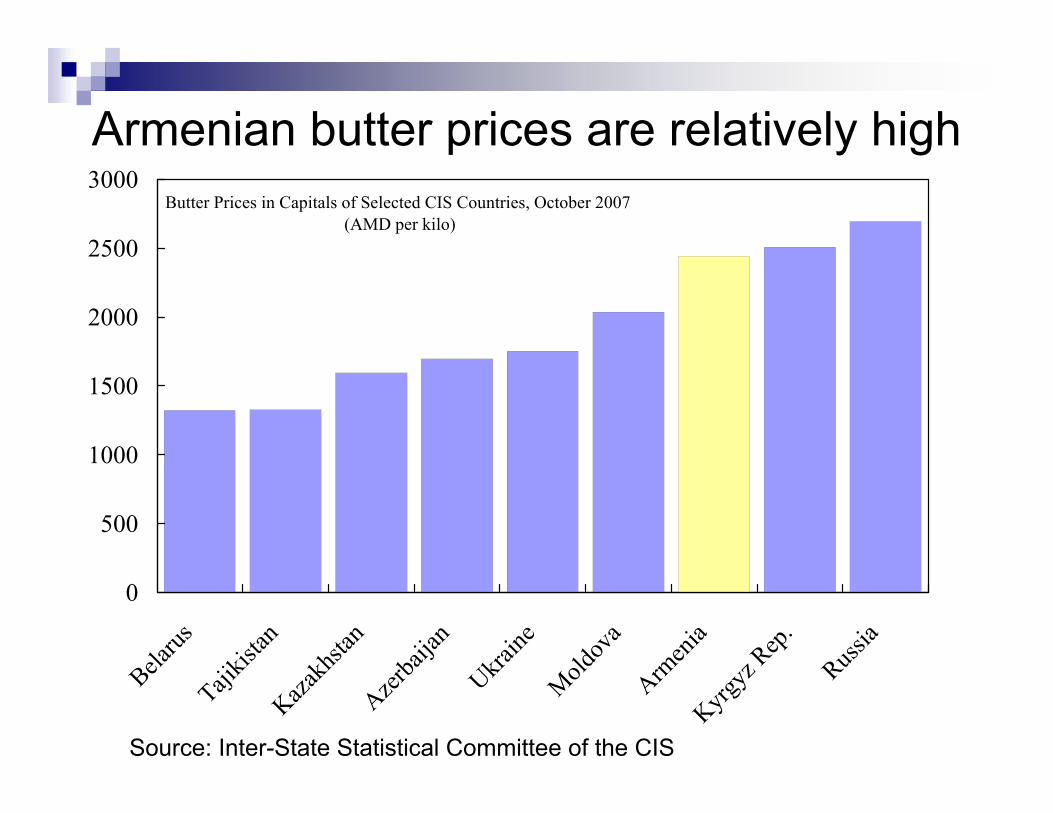
Armenian butter prices are relatively highButter Prices in Capitals of Selected CIS Countries, October 2007
(AMD per kilo)
0
500
1000
1500
2000
2500
3000
Belarus
Tajikis
tanKaza
khsta
nAzer
baija
nUkra
ineMold
ova
Armen
iaKyrg
yz Rep
.
Russia
Source: Inter-State Statistical Committee of the CIS
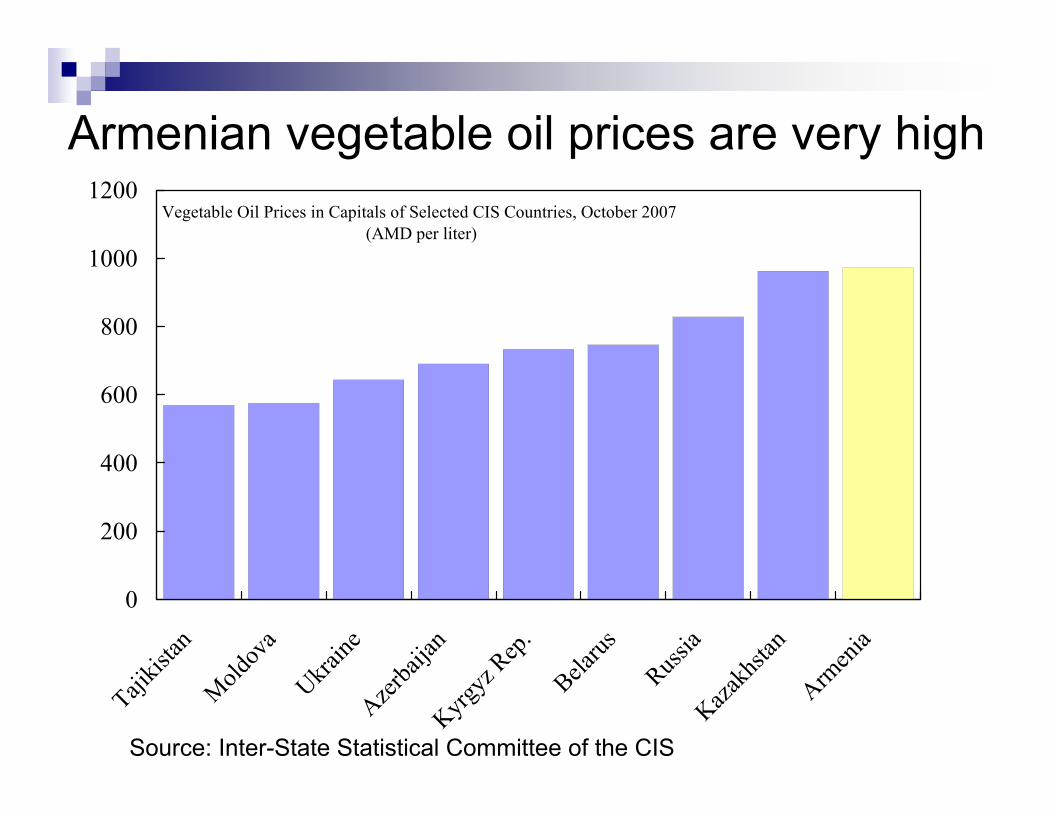
Armenian vegetable oil prices are very highVegetable Oil Prices in Capitals of Selected CIS Countries, October 2007
(AMD per liter)
0
200
400
600
800
1000
1200
Tajikis
tanMold
ova
Ukraine
Azerba
ijan
Kyrgyz
Rep.
Belarus
Russia
Kazakh
stan
Armen
ia
Source: Inter-State Statistical Committee of the CIS
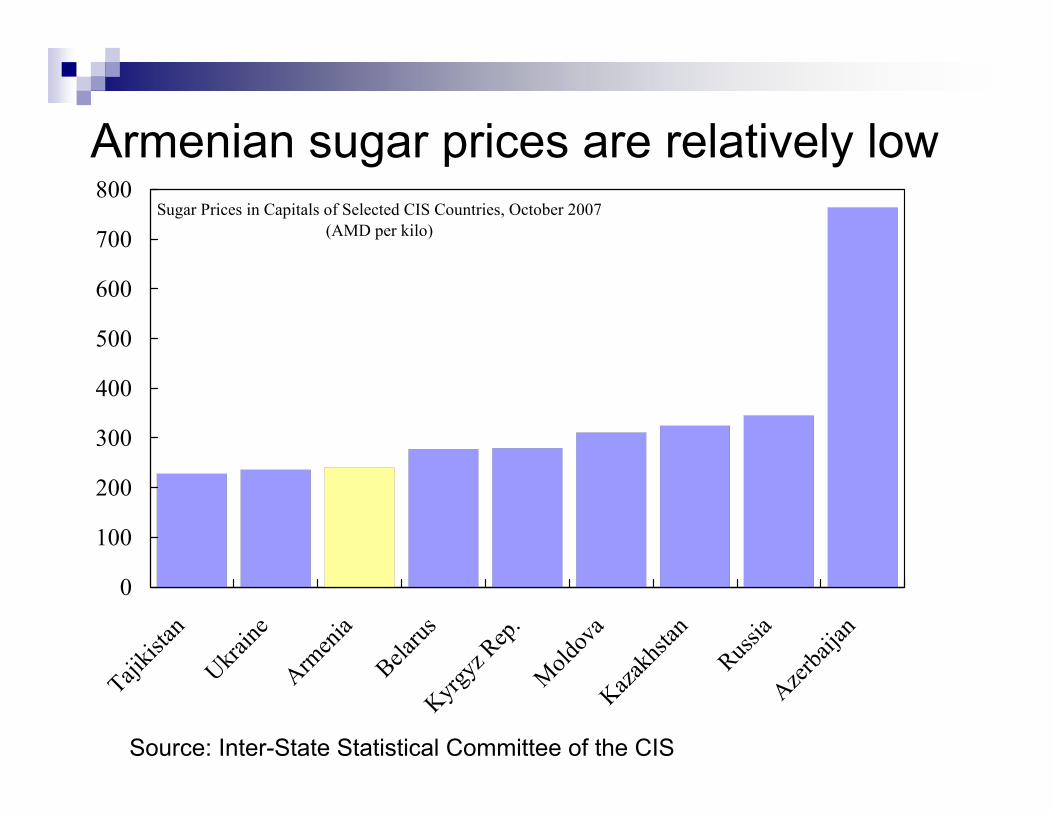
Armenian sugar prices are relatively lowSugar Prices in Capitals of Selected CIS Countries, October 2007
(AMD per kilo)
0
100
200
300
400
500
600
700
800
Tajikis
tanUkra
ineArm
enia
Belarus
Kyrgyz
Rep.
Moldov
aKaza
khsta
n
Russia
Azerba
ijan
Source: Inter-State Statistical Committee of the CIS
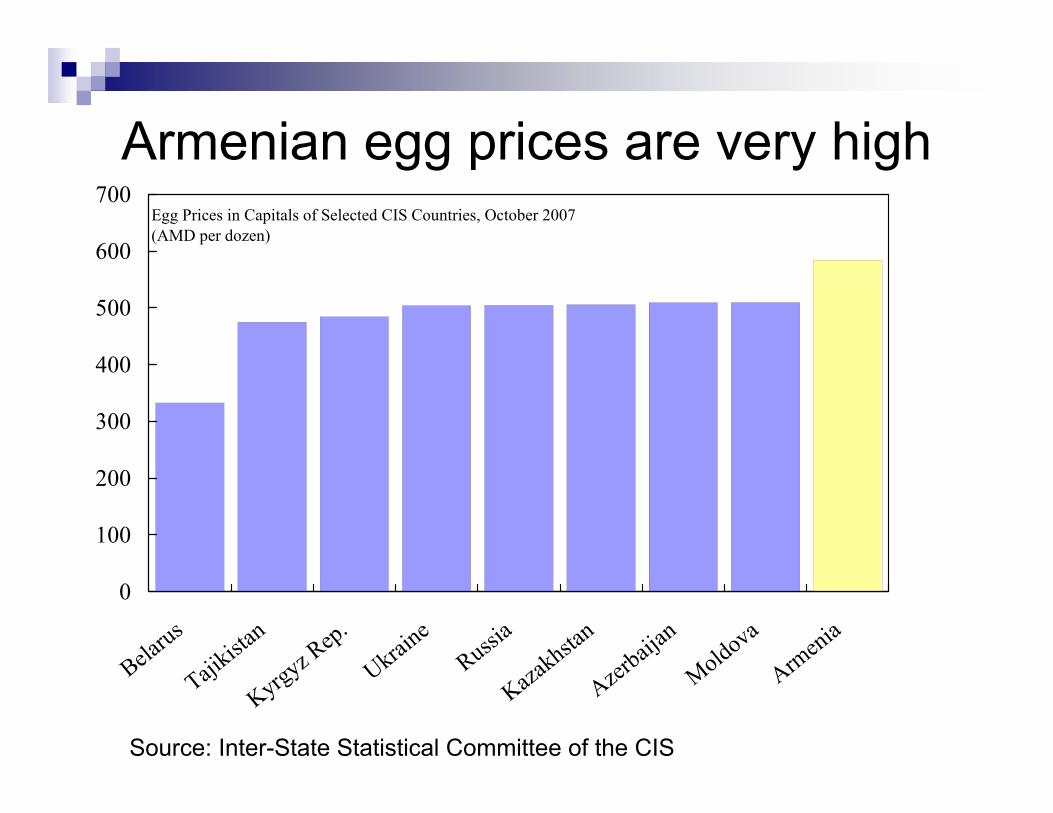
Armenian egg prices are very highEgg Prices in Capitals of Selected CIS Countries, October 2007(AMD per dozen)
0
100
200
300
400
500
600
700
Belarus
Tajikista
n
Kyrgyz Rep.
Ukraine
Russia
Kazakhsta
n
Azerbaija
n
Moldova
Armenia
Source: Inter-State Statistical Committee of the CIS

What explains Armenia’s relatively high import prices?
Transportation costsSmall country size (no economies of scale in packaging, distribution, marketing, etc)Imperfect information and high search costs for buyersLimited competition between sellersHigh exchange rate appreciation, combined with low pass-through

Inflationary risks in 2008
Large foreign exchange inflows (remittances, FDI, real estate, foreign aid)High GDP growth60% increase in pensionsFurther increases in food pricesFurther increases in energy prices

5. Policy recommendationsMake inflation targeting more effective
Increase competition between banksReduce dollarizationFurther develop financial marketsNot change targets in response to external shocksExtend IT horizon to several years
Facilitate reduction in Armenian import pricesImprove infrastructure → reduce transportation costsIncrease competition between importersStrengthen the Committee for the Protection of Economic Competition
Tighten fiscal policyLimit government expenditureRaise tax revenues
Increase the public’s knowledge of inflation targetingExplain how inflation is measuredExplain why inflation targets were missed