Embed Size (px)
Citation preview
University of New MexicoUNM Digital Repository
Biomedical Sciences ETDs Electronic Theses and Dissertations
7-1-2013
Inflammatory cytokines alter normal lipidmobilization in adipocytes.Nicholas Card
Follow this and additional works at: https://digitalrepository.unm.edu/biom_etds
This Thesis is brought to you for free and open access by the Electronic Theses and Dissertations at UNM Digital Repository. It has been accepted forinclusion in Biomedical Sciences ETDs by an authorized administrator of UNM Digital Repository. For more information, please [email protected].
Recommended CitationCard, Nicholas. "Inflammatory cytokines alter normal lipid mobilization in adipocytes.." (2013). https://digitalrepository.unm.edu/biom_etds/70
i
Nicholas Steven Card Candidate
Biomedical Sciences
Department
This thesis is approved, and it is acceptable in quality and form for publication:
Approved by the Thesis Committee:
Dr. Robert Orlando, Chairperson
Dr. William Garver
Dr. Yijuan Sun
ii
INFLAMMATORY CYTOKINES ALTER NORMAL LIPID
MOBILIZATION IN ADIPOCYTES.
by
NICHOLAS STEVEN CARD
B.S. CHEMISTRY & BIOLOGY
UNIVERSITY OF NEW MEXICO, 2007
THESIS
Submitted in Partial Fulfillment of the
Requirements for the Degree of
Master of Science
Biomedical Sciences
The University of New Mexico
Albuquerque, New Mexico
July, 2013

iii
DEDICATION
I would like to dedicate this to two people that have most driven my desire for
lifelong learning and have developed my passion for science, and scientific reasoning.
The first is Mrs. Leach, my high school genetics teacher. She showed me that I can be
successful even with challenging course work and that pursuit and patience is more
important than the grade itself. The other individual I would like to dedicate this to is my
Sensei and Master Instructor, Zane Church. He taught me the value of hard work,
knowledge, and perseverance.
iv
ACKNOWLEDGMENTS
I would like to take a moment to acknowledge several people who have made this
possible. I would first like to thank Dr. Robert Orlando, my mentor, for all the time,
advice, input, guidance, support, and encouragement that he has provided. Even before I
was in his lab he was going out of his way to give me guidance on a study abroad
opportunity I was interested in. His passion for teaching, education, and the learning
process has made an impression on me and increased my desire to also help educate and
teach others. I would like to thank him for allowing me the chance to sit through the
gastrointestinal (GI) medical block to gain a better understanding of clinical
biochemistry.
In addition to my mentor, I would like to thank my committee, Dr. William
Garver and Dr. Yijuan Sun, for their immense help and support. I would like to thank Dr.
Garver for the opportunity to work in collaboration with him on the Niemann-Pick
Disease Type C1 mouse project as well as work with his lab group, Dr. David Jelinek and
Joseph Castillo.
I’m very thankful for an individual who has been there every step of the way and
has gone out of her way to help me, teach me, and who has always been ready to listen
and problem-solve with me, Dr. Carolina Franco Nitta. She has been a tremendous
support, and I owe a lot to her for all of her help. She has been a great friend, tremendous
resource, as well as teacher to me.

v
Lastly, I would like to thank my family and friends. It is with their support and
encouragement that I was able to take on this challenge and succeed.
vi
INFLAMMATORY CYTOKINES ALTER NORMAL LIPID MOBILIZATION IN
ADIPOCYTES.
by
Nicholas Steven Card
B.S., Chemistry and Biology, University of New Mexico, 2007
ABSTRACT
Obesity is an increasing trend within the United States and the importance of addressing
both causation and effects of obesity are becoming more important. It has been shown
that environment, genetics, and social behavior factors can lead to an increased risk of
obesity. Obesity has also been associated with several negative health concerns including
increased risk for heart disease, cancer, poor nutrition, and diabetes, among others.
Beyond identifying individual factors that may lead to obesity, and be associated with it,
it is important to take into account complex obese biological systems which may have
multiple factors compounding any health problems. Evidence has shown that obese
adipose tissue can develop a state of chronic low grade inflammation with the presence of
pro-inflammatory cytokines. Normal physiological agents, such as β-adrenergic agonists
(for example epinephrine), can induce lipolytic function, though it has now also been
shown that these pro-inflammatory cytokines can also stimulate lipolysis. To begin
addressing the more complex issue of multiple obesity-related factors that contribute to
health problems, we looked at a direct multi-factor based compounding system. This
vii
system assessed the impact of multiple pro-inflammatory cytokines (Tumor Necrosis
Factor-alpha and Interleukin-6) in combination with a β-adrenergic agonist
(isoproterenol) to determine any combinatory effects on lipolytic function. Another
biological system we used to assess lipolytic regulation was that of a disease based mouse
model (Niemann-Pick Disease Type C1 Carrier – NPC1 +/-) which has been shown to
affect cholesterol transport and cause weight gain and even obesity. We assessed the
lipolytic impact that both of these systems may have. In the first system, assessments
showed that pro-inflammatory cytokines, in combination with a β-adrenergic response,
can induce an additive lipolytic stimulation. In the second system, decreased NPC1 gene
dosage appeared to have an impact on Hormone Sensitive Lipase (HSL) mRNA levels
and trends toward a decrease in glycerol release, an effective measure of lipolytic
function. In all, these findings demonstrate that complex obese biological systems
present multiple factors (either direct stimulating agents or indirect disease mechanisms)
that can have substantial effects on lipolytic function.
viii
TABLE OF CONTENTS
LIST OF FIGURES….…………………………………………………………………xii
LIST OF TABLES…………………………………….……….………………………xiii
CHAPTER 1 OVERALL INTRODUCTION.…… ………………..…………… ……1
1.1 Body Fatness & Health………………………..………………………………1
1.2 Body Mass Index….……………………………….…….……………………2
1.3 Obesity & Overweight Defined………………………………….……………3
1.4 Causes of Obesity……………………………………………………..………4
1.5 Fat Metabolism Obesity, Health Correlations & Effects…………..…………5
1.6 Obesity & Fat Metabolism……………………………………………………6
1.7 Fat Metabolism Pathways……………………………………………………8
1.8 Regulation of Fat Metabolism………………………………………………11
1.9 Detrimental Lipolytic Regulation……………………………………………13
CHAPTER 2…………………………………………………….………………………14
2.1 Introduction…………………………………………………………………14
2.1.1 Lipolysis & Normal Physiology……………………...……………………14
ix
2.1.2 Pathophysiology & Inflammation…………………………………………15
2.1.3 TNFα & IL-6…………………….…………………………………………15
2.1.4 Hypothesis & Specific Aims……….………………………………………17
2.2 Methods………………………………………………...……………………19
2.2.1 Cell Culture & Treatment….………………………………………………19
2.2.2 Glycerol Release Measurements…………………………..………………19
2.2.3 Statistical Analysis…………………………………………………………20
2.3 Results……………………………………………………….………………21
2.3.1 Lipid Mobilization…………………………………………………………21
2.3.2 Co-Stimulation of Fat Mobilization………………………….……………23
2.3.3 Triple-Stimulation of Fat Mobilization……………………………………25
2.4 Discussion……………….………………..…………………………………27
CHAPTER 3………………..………………..…….……………………………………28
3.1 Introduction…………………………………………………………………28
3.1.1 Niemann-Pick Disease…………………………………..…………………28
3.1.2 Niemann-Pick Disease Type C…………………………….………………28
3.1.3 Niemann-Pick Disease Type C1…………………………………………..29
x
3.1.4 NPC1 Carrier Mouse Model……..….……………………………………29
3.1.5 Hypothesis & Specific Aims……….…….……………………….………30
3.2 Methods……………….……………………………………………………31
3.2.1 Mice…………………….…………………………………………………31
3.2.2 Fat Pad Excision….………………………………….……………………31
3.2.3 Weight Normalization………………………………….…………………32
3.2.4 Glycerol Release Assay……………………………………………………32
3.2.5 Quantitative Real-Time PCR………………………………………………32
3.2.6 Statistical Analysis………………..…………………..……………………33
3.3 Results……………………………………………….………………………34
3.3.1 NPC1 Carrier Weight Differential…………………………………………34
3.3.2 NPC1 Carrier Glycerol Release Trend………………………….…………35
3.3.3 Lipolytic & Lipogenic Genes………………………….……..……………36
3.4 Conclusion…………….………….…………………………………………38
CHAPTER 4 OVERALL CONCLUSION……………………………………………40
4.1 Causes of Obesity Conclusion………….……………………………………40
4.2 Effects (Direct Lipolytic Regulation)…………………..……………………41
xi
4.3 Effects (Indirect Lipolytic Regulation)………..…….………………………42
4.4 Compounding Effects of Lipolysis………………..…………………………42
4.5 Future Studies……….…………………………….…………………………43
REFERENCES…………………..………………………...……………………………44
xii
LIST OF FIGURES
Figure-1.1: CDC Obesity Prevalence by State over a period of 20 years……………..….2
Figure-1.2: CDC Obesity Prevalence as a country over a period of 20 years………..….3
Figure-2.1: TNFα Time Curve………………..…………………………….………..….21
Figure-2.2: Isoproterenol Time Curve………………..…………………..…………….22
Figure-2.3: Isoproterenol Concentration Curve…………..……………..…..………….22
Figure-2.4: IL-6 Concentration Curve…………..…………………………..…….…….23
Figure-2.5: TNFα Co-Stimulation…………………………………….………..……….23
Figure-2.6: IL-6 Co-Stimulation……………………..……………..……….………….24
Figure-2.7: Single-Stimulation vs. Triple-Stimulation……...………...……..………….25
Figure-2.8: Co-Stimulation vs. Triple-Stimulation…………………………..………….26
Figure-3.1: F4-80 Real-Time PCR……………………………………..………….…….29
Figure-3.2: Body Weight……………………..………….……………………..……….34
Figure-3.3: Fat Pad Weight……………............………..……………………………….34
Figure-3.4: Glycerol Release Assay…..…………..………..………………..………….35
xiii
LIST OF TABLES
Table-3.1: Lipolytic Genes……..……..……..………………………………………….36
Table-3.2: Lipogenic Genes………..…………..……………………………………….36
Table-3.3: Transport/Translocation Genes…………..………………………………….37
1
INFLAMMATORY CYTOKINES ALTER NORMAL LIPID MOBILIZATION IN
ADIPOCYTES
Chapter 1: Overall Introduction:
1.1 Body Fatness & Health
Since first finding methods to characterize body fatness, links between body
fatness and a variety of health related issues has been discovered. The study of body
fatness and health has grown in both breadth and depth. It encompasses a variety of
academic disciplines such as: exercise science, nutrition, medical science, pharmacy,
even reaching into policy and social and behavioral sciences. (Bray & Popkin, 1998;
Clark, Goyder, Bissell, Blank, & Peters, 2007; Craig, Garthwaite, & Holloszy, 1987;
Glueck et al., 2001; Hankey, Eley, Leslie, Hunter, & Lean, 2004; Jaime & Lock, 2009;
Popkin & Gordon-Larsen, 2004) The depth of which can be seen through the amount of
funding for some of these disciplines by the National Institute of Health (NIH). Over the
past 4 years (2009 to 2012) NIH has allotted an average of $1.48 billion dollars towards
nutrition research. Beyond that they have allotted an average of $1.05 billion dollars
towards Diabetes research, and $809 million towards Obesity research, over that same
time period. Over the next two years (2013 and 2014) the average amounts for each
category will even exceed these numbers. (“NIH Categorical Spending -NIH Research
Portfolio Online Reporting Tools (RePORT),” n.d.)
2
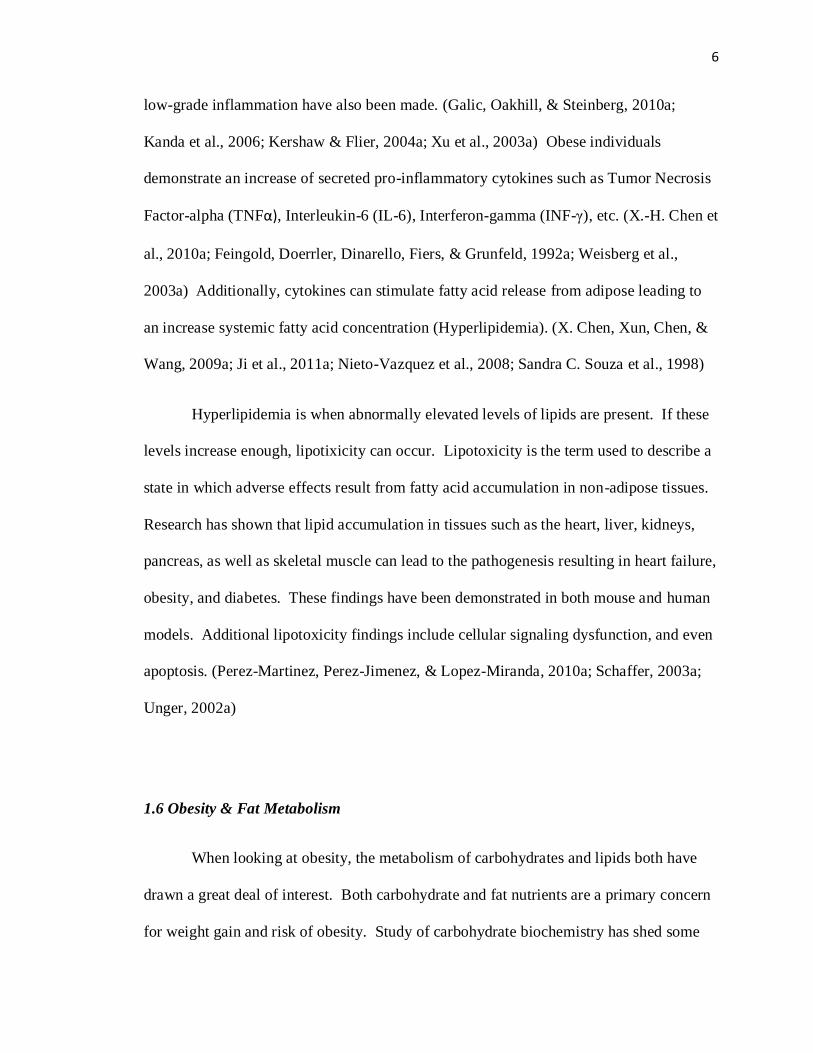
1.2 Body Mass Index
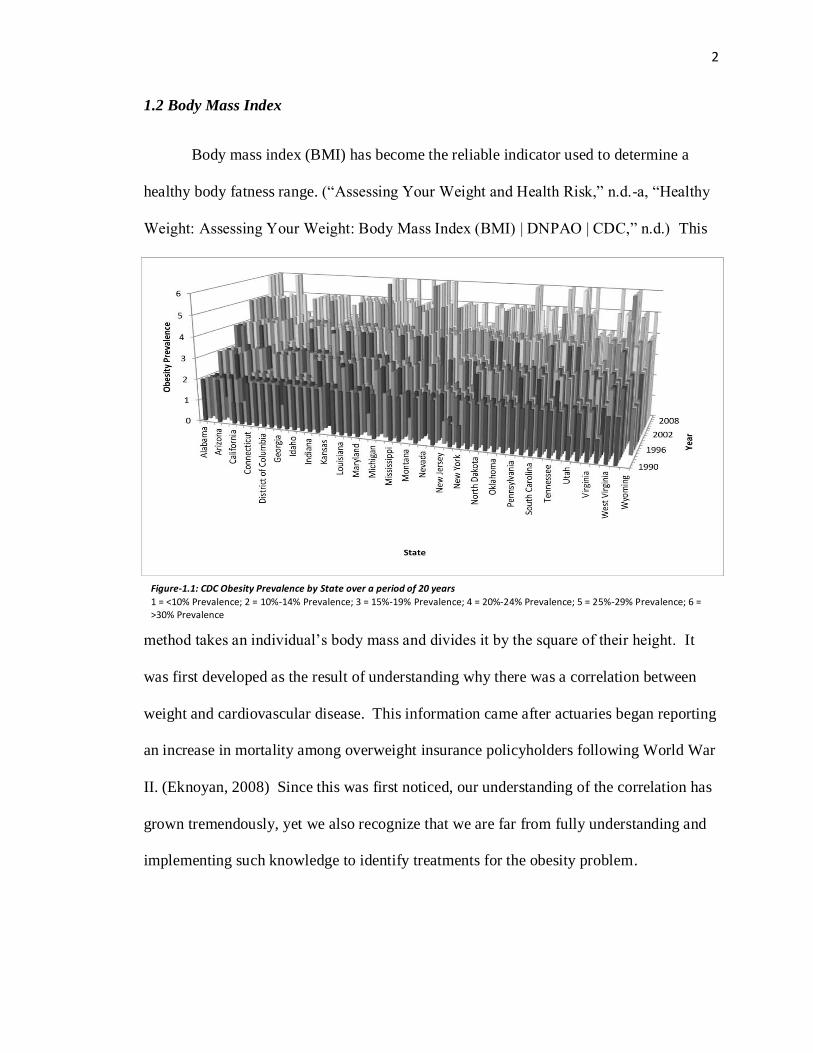
Body mass index (BMI) has become the reliable indicator used to determine a
healthy body fatness range. (“Assessing Your Weight and Health Risk,” n.d.-a, “Healthy
Weight: Assessing Your Weight: Body Mass Index (BMI) | DNPAO | CDC,” n.d.) This
method takes an individual’s body mass and divides it by the square of their height. It
was first developed as the result of understanding why there was a correlation between
weight and cardiovascular disease. This information came after actuaries began reporting
an increase in mortality among overweight insurance policyholders following World War
II. (Eknoyan, 2008) Since this was first noticed, our understanding of the correlation has
grown tremendously, yet we also recognize that we are far from fully understanding and
implementing such knowledge to identify treatments for the obesity problem.
Figure-1.1: CDC Obesity Prevalence by State over a period of 20 years
1 = <10% Prevalence; 2 = 10%-14% Prevalence; 3 = 15%-19% Prevalence; 4 = 20%-24% Prevalence; 5 = 25%-29% Prevalence; 6 = >30% Prevalence
3
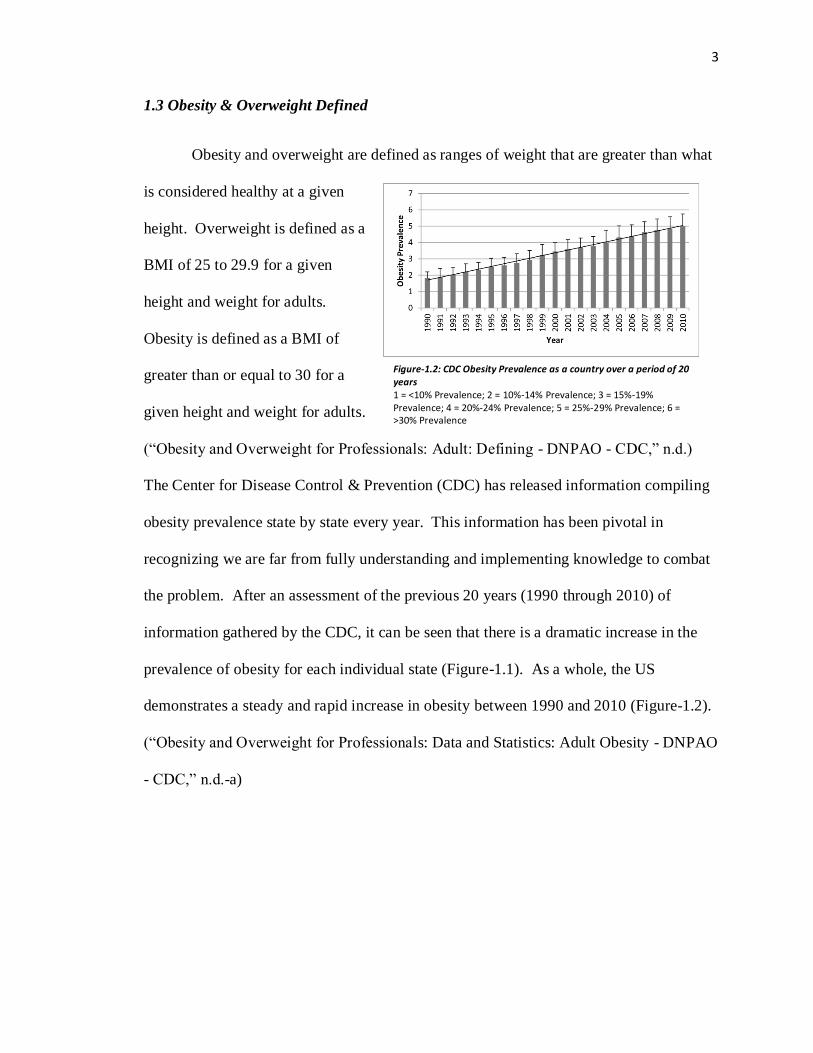
1.3 Obesity & Overweight Defined
Obesity and overweight are defined as ranges of weight that are greater than what
is considered healthy at a given
height. Overweight is defined as a
BMI of 25 to 29.9 for a given
height and weight for adults.
Obesity is defined as a BMI of
greater than or equal to 30 for a
given height and weight for adults.
(“Obesity and Overweight for Professionals: Adult: Defining - DNPAO - CDC,” n.d.)
The Center for Disease Control & Prevention (CDC) has released information compiling
obesity prevalence state by state every year. This information has been pivotal in
recognizing we are far from fully understanding and implementing knowledge to combat
the problem. After an assessment of the previous 20 years (1990 through 2010) of
information gathered by the CDC, it can be seen that there is a dramatic increase in the
prevalence of obesity for each individual state (Figure-1.1). As a whole, the US
demonstrates a steady and rapid increase in obesity between 1990 and 2010 (Figure-1.2).
(“Obesity and Overweight for Professionals: Data and Statistics: Adult Obesity - DNPAO
- CDC,” n.d.-a)
Figure-1.2: CDC Obesity Prevalence as a country over a period of 20 years 1 = <10% Prevalence; 2 = 10%-14% Prevalence; 3 = 15%-19% Prevalence; 4 = 20%-24% Prevalence; 5 = 25%-29% Prevalence; 6 = >30% Prevalence
4
1.4 Causes of Obesity
Obesity is said to be caused by a complex interplay between the environment,
genetics, and behavior. (Nguyen & El-Serag, 2010a) Environmental factors causing
obesity are often explained in a simple manner as being the result of energy intake in
excess of energy expenditure. These both independently have been shown to lead to
obesity and certainly in combination have that ability. (William H. Dietz & Gortmaker,
1985; Kant & Graubard, 2006a; Andrew M. Prentice & Jebb, 1995) Energy intake
commonly refers to consuming more food than required by the body to meet its daily
needs. Daily energy need consists of three components: the resting metabolic rate, diet-
induced thermogenesis, and activity-induced thermogenesis. (Donahoo, Levine, &
Melanson, 2004a) The resting metabolic rate (RMR; also known as basal metabolic rate)
is the cellular nutrition requirement necessary to maintain normal cellular function during
rest. Diet-induced thermogenesis (also known as the thermic effect of food) is the
nutrition requirement of the body for the processes involved in the break down, digestion,
and absorption of food particles. Activity-induced thermogenesis is the nutrition
requirements of the body in order to perform both exercise and non-exercise activities.
Diet-induced thermogenesis typically accounts for approximately 5% to 15% of an
individual’s daily energy expenditure. (Westerterp, 2004) In combination, all three
energy expenditure components should be equal with energy intake as a means to
maintain weight balance.
Beyond environmental factors, genetic studies have demonstrated that there are
strong correlations between genes and obesity. One gene of particular interest is the
obesity-associated gene (FTO rs9939609). In a genome-wide association study of 38,579
5
patients, Frayling et al. found that the incidence of obesity is increased by 1.67-fold in
patients that were homozygous for the FTO gene. (Andreasen et al., 2008a; Frayling et
al., 2007a; Hunt et al., 2008a) As of the 12th
update on the human obesity gene map, 253
quantitative trait loci (genetic-phenotype link) for human obesity related phenotypes had
been identified. (Rankinen et al., 2006) One study also found an association with obesity
and Niemann Pick Disease Type C1 (NPC1), a gene of interest which is discussed later in
chapter 3. (Meyre, Delplanque, Chèvre, Lecoeur, Lobbens, Gallina, Durand, Vatin,
Degraeve, Proença, et al., 2009a) Overall, a great deal of effort is being put into further
researching possible genetic links with obesity and still more studies are needed to further
illuminate the connection genetics has with obesity.
Lastly, behavior has also been shown to be linked with obesity. It has been
suggested that those individuals with a friend who is obese have a 57% increased risk of
becoming obese, those with a sibling who is obese had a 40% increased risk, and those
with a spouse who is obese had a 37% increased risk. (Nguyen & El-Serag, 2010a) This
indicates that one’s social interactions may impact their risk perhaps in an inadvertent
manner.
1.5 Fat Metabolism, Obesity, Health Correlations & Effects
Studies have shown that obesity and overweight are significantly correlated with
several health concerns including: diabetes, high blood pressure, high cholesterol, as well
as an overall poor health status.(“Assessing Your Weight and Health Risk,” n.d.-b;
Mokdad AH, 2003) Associations between obesity, macrophage infiltration, and chronic
6
low-grade inflammation have also been made. (Galic, Oakhill, & Steinberg, 2010a;
Kanda et al., 2006; Kershaw & Flier, 2004a; Xu et al., 2003a) Obese individuals
demonstrate an increase of secreted pro-inflammatory cytokines such as Tumor Necrosis
Factor-alpha (TNFα), Interleukin-6 (IL-6), Interferon-gamma (INF-γ), etc. (X.-H. Chen et
al., 2010a; Feingold, Doerrler, Dinarello, Fiers, & Grunfeld, 1992a; Weisberg et al.,
2003a) Additionally, cytokines can stimulate fatty acid release from adipose leading to
an increase systemic fatty acid concentration (Hyperlipidemia). (X. Chen, Xun, Chen, &
Wang, 2009a; Ji et al., 2011a; Nieto-Vazquez et al., 2008; Sandra C. Souza et al., 1998)
Hyperlipidemia is when abnormally elevated levels of lipids are present. If these
levels increase enough, lipotixicity can occur. Lipotoxicity is the term used to describe a
state in which adverse effects result from fatty acid accumulation in non-adipose tissues.
Research has shown that lipid accumulation in tissues such as the heart, liver, kidneys,
pancreas, as well as skeletal muscle can lead to the pathogenesis resulting in heart failure,
obesity, and diabetes. These findings have been demonstrated in both mouse and human
models. Additional lipotoxicity findings include cellular signaling dysfunction, and even
apoptosis. (Perez-Martinez, Perez-Jimenez, & Lopez-Miranda, 2010a; Schaffer, 2003a;
Unger, 2002a)
1.6 Obesity & Fat Metabolism
When looking at obesity, the metabolism of carbohydrates and lipids both have
drawn a great deal of interest. Both carbohydrate and fat nutrients are a primary concern
for weight gain and risk of obesity. Study of carbohydrate biochemistry has shed some
7
light on the role it plays in connection with obesity and BMI. Assessments have looked
at associations between glycemic load, glycemic index, as well as quality of carbohydrate
intake. Whole-grain intake has been shown to be inversely proportional to BMI, while
refined grain intake appears not to be. (van Dam & Seidell, 2007) High glycemic load
seems to be linked with lower BMI, while studies performed on glycemic index and its
link with BMI appears to be less consistent. (Gaesser, 2007) Lipid biochemistry is also
being looked at for links with obesity. Cross-sectional studies generally demonstrate that
the concentration of fat in the diet positively correlates with relative body mass.
Furthermore, intervention studies have shown that there is a consistent but short-lived
weight loss experienced by individuals placed on a low-fat diet. (Lissner & Heitmann,
1995) Due to weight gain being closely correlated with insulin sensitivity, particularly in
the abdominal region, recent interest has been brought to the quality of dietary fats. Of
particular importance for insulin sensitivity seems to be a diet lower in saturated fatty
acids and at least partially replaced, in appropriate situations, with mono- and
polyunsaturated fatty acids. (Riccardi, Giacco, & Rivellese, 2004) From these and other
studies, it is clear that the metabolism of carbohydrates and lipids can have a substantial
impact on obesity and obesity-related health concerns.
Lipid biochemistry is a complex field of study that includes many unique and
interconnected pathways. Lipid biochemistry can be divided into two general topic areas:
anabolism (biosynthesis) or catabolism (degradation of macromolecules). This includes
fatty acid synthesis and degradation, cholesterol biochemistry, triglyceride synthesis (fat
storage) and degradation (energy mobilization), lipoprotein biochemistry (lipids coupled
to proteins – commonly used for transport of cholesterol and triglycerides), and
8
membrane lipid biochemistry. (Styer, Tymoczko, & Berg, 2011) Obesity is largely
defined as an excess storage of fat in the form of triglycerides, making characterization of
those processes centering on the synthesis and degradation of triglycerides of central
importance to developing a better understanding of obesity. (“Obesity: MedlinePlus,”
n.d.)
1.7 Fat Metabolism Pathways
The process of fat storage by adipose tissue requires precursors of fatty acids and
glycerol, lipogenesis (combining fatty acids and glycerol to synthesize triglycerides), and
is balanced by the reverse process of lipolysis (the degradation of stored triglycerides).
Transport and translocation of fatty acids is key to the fat storage pathways allowing for
proper availability of triglyceride constituents. Albumin is a key systemic transport
protein allowing for fatty acid delivery to storage tissues such as the white adipose tissue
by overcoming solubility difficulties in plasma being a highly hydrophilic environment.
(Abumrad, Harmon, & Ibrahimi, 1998) Short chain fatty acids can diffuse through lipid
membranes, though long chain fatty acids require support proteins for this process. A
series of proteins known as Fatty Acid Binding Proteins (FABP) and Fatty Acid
Transport Proteins (FATP) along with CD36 are the primary proteins in this process.
(Large, Peroni, Letexier, Ray, & Beylot, 2004a; Pelsers, Stellingzoerff, & Van Loon,
2008a) The liver also makes triglycerides through the lipogenic processes and transports
these triglycerides to other tissues for use through via lipoproteins, chylomicrons, as well
as very low-density lipoproteins (VLDL). When VLDL is transported to adipose tissue,
9
Lipoprotein Lipase (LPL) activity releases fatty acids from VLDL particles to permit
transport into the cell. (Preiss-Landl, Zimmermann, Hämmerle, & Zechner, 2002; Wang
& Eckel, 2009)
Lipogenesis is the pathway involved with de novo synthesis of fatty acids from
acetyl-CoA precursors. This pathway is activated in response to excess dietary
carbohydrate intake, particularly that of glucose. Both the liver as well as adipose tissue
have been shown to perform lipogenesis with liver being the greatest contributor. (Hems,
Rath, & Verrinder, 1975; Large, Peroni, Letexier, Ray, & Beylot, 2004b) A key enzyme
complex for the synthesis of fatty acids is fatty acid synthase (FAS). (Large et al., 2004b)
Fatty acids are synthesized through a series of repetitive reactions, including
condensation, reduction, and dehydration reactions. (Styer et al., 2011) The result of
these series of reactions is a 16 carbon fatty acid, termed palmitate. Through the process
of lipogenesis, de novo fatty acid synthesis can provide a source of fatty acids for
immediate use by tissues for energy production or for long-term storage for energy needs
at a later time.
Triglyceride synthesis is the production of the storage form of fat. The
predominant storage site for triglycerides is in white adipose tissue. (“Adipose tissue. In:
Encyclopedia of Sports Medicine and Science - Google Scholar,” n.d.; Large, Peroni,
Letexier, Ray, & Beylot, 2004c; Zechner, Kienesberger, Haemmerle, Zimmermann, &
Lass, 2009a) Fatty acid availability may be the result of lipogenic processes or from oral
intake of short-chain or long-chain fatty acids. Synthesis of triglycerides is performed
through a series of acylation reactions using fatty acyl-CoA coupling these toa glycerol
3-phosphate backbone Glycerol 3-phosphate is actively synthesized within adipocytes in
10
glycolysis. Additionally, three fatty acyl-CoAs are required to construct a triglyceride.
(Styer et al., 2011) Following the triglyceride synthesis, support proteins participate in
storing triglycerides in the form of a cytosolic lipid droplet within the adipocyte until
fatty acids are needed during times of whole body energy depletion. (Murphy, Martin, &
Parton, 2009; Olofsson et al., 2008)
The lipolytic pathway mobilizes fatty acids from storage depots in adipose tissue,
in order to provide systemic availability of fatty acids and glycerol to accommodate
energy needs. A series of enzymes and regulatory proteins provide this function. Recent
finding have demonstrated that Adipose Triglyceride Lipase (ATGL) is the predominant
enzyme involved in the first step of fatty acid release from the triglyceride (three attached
fatty acids) to the diglyceride (two attached fatty acids) form. Regulatory proteins have
been identified that are critical to activation and control of lipolytic activity, in particular
the lipid droplet coat protein Comparative Gene Identification-58 (CGI-58). CGI-58 is
necessary for activation of ATGL. Afterwhich, Hormone Sensitive Lipase (HSL) then
continues the second step of the degradation process, being the primary enzyme involved
in diglyceride to monoglyceride (one fatty acid attached to the glycerol backbone)
degradation. The final step of triglyceride degradation involves the enzyme
Monoglyceride Lipase (MGL), which cleaves the last fatty acid from the glycerol
backbone, hydrolyzing the monoglyceride into its constituents. (Lass, Zimmermann,
Oberer, & Zechner, 2011a; Zechner, Kienesberger, Haemmerle, Zimmermann, & Lass,
2009b) Another key regulatory protein that is involved in lipolytic function is another
lipid droplet coat protein known as perilipin. Recent findings have demonstrated that
multiple perilipin isoforms are present on lipid droplets. The exact function of these
11
different isoforms is still being determined. Evidence has shown that perilipins can
restrict access to the lipid droplet surface preventing lipolytic function of cytosolic
lipases, such as ATGL and HSL. (Subramanian et al., 2004a; Wang et al., 2011) In all,
the lipolytic pathway for mobilization of fatty acids from the storage form is a complex
interplay between lipases and regulatory proteins, of which many of their interactions are
still incompletely understood.
1.8 Regulation of Fat Metabolism
Regulation of fat metabolism is an important component to health. Several
common regulators are known for their impact on fat metabolism. In a fed state, insulin
functions to stimulate the uptake of nutrients from the circulation, such as carbohydrates,
fats, and proteins, in order to store them for later use. (Foufelle & Ferré, 2002; Jaworski,
Sarkadi-Nagy, Duncan, Ahmadian, & Sul, 2007a; Koo, Dutcher, & Towle, 2001; Large,
Peroni, Letexier, Ray, & Beylot, 2004d) Besides facilitating nutrient uptake, insulin is
able to stimulate both glycogen and fat synthesis, as well as act as a potent inhibitor of
lipolysis. (Degerman et al., 1998)
Glucagon is the hormonal signal for energy mobilization (during a fasting state)
and has been shown to stimulate lipolysis. (Bertrand, Masoro, & YU, 1980; Brubaker &
Drucker, 2002; HECKEMEYER, BARKER, DUCKWORTH, & SOLOMON, 1983) A
more potent stimulator of lipolytic function than glucagon is β-adrenergic signaling, seen
during an exercise state.
12
Catecholamines, in particular epinephrine and norepinephrine, are the major
hormonal regulators of the lipolytic processes. There are three receptors named β1, β2,
and β3-adrenergic receptor, which respond to catecholamines inducing increased lipolytic
response. (Jaworski, Sarkadi-Nagy, Duncan, Ahmadian, & Sul, 2007b; Large, Peroni,
Letexier, Ray, & Beylot, 2004e) Upon catecholamine activation of the β-adrenergic
receptors, lipid droplet coat protein perilipin becomes phosphorylated by a cAMP-
dependent protein kinase (PKA), thus facilitating docking of lipases. (Subramanian et al.,
2004b) Lipolytic response is species and receptor specific for β-adrenergic receptors,
with β3-adrenergic receptors inducing the largest lipolytic response in rodents. (Langin,
2006a; Zechner, Kienesberger, Haemmerle, Zimmermann, & Lass, 2009c) Isoproterenol
is an effective artificial β3-adrenergic receptor agonist and stimulates lipolysis in rodents.
(Anthonsen, Rönnstrand, Wernstedt, Degerman, & Holm, 1998; Zimmermann et al.,
2004) For my studies, isoproterenol is used as a β3-adrenergic receptor agonist to mimic
a physiological catecholamine response.
Other agents have also been shown to be effective at stimulating or inhibiting fat
metabolism. Additional lipolytic stimulants include thyroid hormone, growth hormone,
as well as natriuretic peptide. Obesity-dependent pro-inflammatory cytokines secreted
into the local environment of adipose tissue have also been shown to stimulate lipolytic
function including TNFα and IL-6. (Chaves, Frasson, & Kawashita, 2011a) Agents that
are able to inhibit fat mobilization in some fashion include neuropeptide Y as well as
adenosine. (Jaworski, Sarkadi-Nagy, Duncan, Ahmadian, & Sul, 2007c) The importance
of understanding normal non-obese lipolytic regulation allows for improved recognition
of the serious nature of compounding lipolytic effects seen in an obese system.
13
1.9 Detrimental Lipolytic Regulation
The possibility for lipolytic dysregulation is becoming more important for the
field of obesity research. Up until recently, white adipose tissue (WAT) was thought to
be primarily just a storage site for fat. As health concerns such as obesity, type II
diabetes, and coronary heart disease have increased, further study of WAT has brought to
light new information increasing the implications that poor regulation of WAT activity
may have on an individual’s health. An important finding was that obese WAT exhibits
an inflammatory component. This inflammatory response includes adipose tissue’s
ability to express pro-inflammatory cytokines such as TNFα, IL-6, among others. (Galic
et al., 2010a; Kershaw & Flier, 2004a) It has also been shown in genetically obese
mouse models or mice made obese by a high fat diet that a large number of macrophages
are present in WAT. (Xu et al., 2003a) With the discovery of pro-inflammatory
cytokines in WAT, it has also been revealed that they in turn have an impact on fat
metabolism. (X.-H. Chen et al., 2010a; Jaworski, Sarkadi-Nagy, Duncan, Ahmadian, &
Sul, 2007d; Ji et al., 2011b; Langin & Arner, 2006a; Zechner, Kienesberger, Haemmerle,
Zimmermann, & Lass, 2009d)
14
Chapter 2: Effects of combined inflammatory cytokine and β-adrenergic stimulation
on lipid mobilization in 3T3-L1 adipocytes:
2.1 Introduction
2.1.1 Lipolysis & Normal Physiology
Lipolysis is an important pathway for individuals allowing for proper fat
mobilization and homeostasis. Several agents have been shown to have the ability to
stimulate lipolysis including: catecholamines, natriuretic peptide, and even glucagon.
(Chaves, Frasson, & Kawashita, 2011b) These agents allow for proper mobilization
during depleted energy states as well as periods of anabolic need. The roles of agents
such as adrenergic agonists, for example epinephrine and isoproterenol, as well as agents
such as glucagon have been pursued to better recognize their effect on lipolysis.
Glucagon is the hormone most commonly associated with stabilizing low blood glucose
levels. Glucagon’s effectiveness as a lipolytic stimulator has also been shown.
Catecholamines are potent stimulants of the lipolytic pathway and are frequently used to
study the pathway. (Jaworski, Sarkadi-Nagy, Duncan, Ahmadian, & Sul, 2007e)
Isoproterenol is used in these studies to mimic a lipolytic response to a physiological β-
adrenergic agonist.
15
2.1.2 Pathophysiology & Inflammation
Studies have shown that adipose tissue demonstrates properties of an endocrine-
like gland. (Galic, Oakhill, & Steinberg, 2010b; Kanda et al., 2006; Weisberg et al.,
2003b) As part of this finding, it has been established that adipose tissue of obese
individuals expresses an increased amount of pro-inflammatory proteins that can cause a
chronic low grade inflammation. (Fried, Bunkin, & Greenberg, 1998; Kanda et al., 2006;
Perreault & Marette, 2001; Samad, Yamamoto, Pandey, & Loskutoff, 1997; Sartipy &
Loskutoff, 2003; Visser M, 1999; Weyer et al., 2002) Independent of other problems
related to an increased adipose volume, pro-inflammatory cytokines alone have been
linked with a variety of negative health issues such as: hyperlipidemia, insulin resistance,
and even with poor sleep regulation resulting in fatigue. (Feingold, Doerrler, Dinarello,
Fiers, & Grunfeld, 1992b; Vgontzas et al., 1997) One mechanism which is being
carefully considered in relation to several of these health issues is that of the impact of
pro-inflammatory cytokines upon the lipolytic pathway. Of particular importance is the
ability of pro-inflammatory cytokines to be potent stimulators of fatty acid mobilization.
(Feingold et al., 1992b)
2.1.3 TNFα & IL-6
Two increasingly significant pro-inflammatory cytokines, Tumor Necrosis Factor
alpha (TNFα) and Interleukin-6 (IL-6), have been associated with increased lipolytic
stimulation. Studies have found that both TNFα and IL-6 are increased with obese non-
diabetics and diabetics as compared to lean controls. (Bastard et al., 2000)
16
Research on TNFα’s impact upon adipose metabolism has been found to be multi-
fold in facet. Clinically, TNFα has been linked with obesity, insulin resistance, as well as
with chronic inflammation. (Hotamisligil, Shargill, & Spiegelman, 1993; Nieto-Vazquez
et al., 2008) Mechanistically, TNFα influences a variety of components of adipose
metabolism including: uptake of fatty acids, the lipogenic and lipolytic pathways, and
even enzyme activity and adipokine regulation. (X. Chen et al., 2009a) Lipolytic
stimulation by TNFα has revealed it to be a potent agent in dysregulating lipid
homeostasis in an inflamed state. (Sandra C. Souza et al., 1998)
Recent research has begun to shed light on how involved IL-6 is in adipose
metabolism; however, unlike TNFα, IL-6’s impact on adipose metabolism is not as well
understood. Initial research has indicated IL-6 is connected to obesity and obesity related
health concerns. An inverse correlation has been shown between adipose tissue IL-6
content and insulin-responsiveness. (Bastard et al., 2002) Additionally, weight loss has
been shown to decrease IL-6 levels in human subjects. (Bastard et al., 2000) Evidence
has been presented suggesting that IL-6 is capable of stimulating lipolytic function. (Ji et
al., 2011a) Cytokines appear to be a key factor in mechanistic action that can correlate
obesity with many of its associated health concerns.
17
2.1.4 Hypothesis & Specific Aims
Complex biological systems have multiple lipolytic stimulating agents available
in an obese individual including inflammatory cytokines and beta-adrenergic agonists.
(Galic, Oakhill, & Steinberg, 2010c; Weisberg et al., 2003a) Any significant increase in
lipolytic stimulation may exacerbate a disease state, such as lipotoxicity. The hypothesis
developed to evaluate this concept was that pro-inflammatory cytokines, such as TNFα
and IL-6, augment β-adrenergic stimulation of the lipolytic pathway. To better determine
the lipolytic stimulating power of adipocytes having access to multiple agents
simultaneously, a 3T3-L1 cell culture model was used to assess cytokine and β-
adrenergic co-stimulation, as well as a triple-stimulation state with multiple cytokines and
β-adrenergic stimulation. 3T3-L1 adipocytes are an immortalized cell line that are
commonly used in adipocyte research. Following a differentiation protocol (described in
2.2.1) to generate mature adipocytes, these cells store triglycerides in lipid droplets that
are indistinguishable from normal adipocytes. In order to test this hypothesis, three
specific aims were developed to investigate its validity.
Specific aim #1: To determine the individual quantitative effects of TNFα, IL-6
or isoproterenol on fatty acid mobilization in 3T3-L1-derived adipocytes.
Specific aim #2: To measure the quantitative effects of combining isoproterenol
with TNFα OR IL-6 (dual stimulation) on fatty acid mobilization in 3T3-L1-derived
adipocytes
18
Specific aim #3: To determine the quantitative effects of combining isoproterenol
with TNFα AND IL-6 (triple stimulation) on fatty acid mobilization in 3T3-L1-derived
adipocytes.
19
2.2 Methods
2.2.1 Cell Culture and Treatment
3T3-L1 cells were purchased from American Type Culture Collection (ATCC,
Manassas, VA, USA), grown and differentiated in complete Dulbecco’s Modified Eagle
Medium (DMEM) with high-glucose and supplemented with 10% fetal bovine serum
(FBS). Cells were incubated at 37°C in a 5% CO2 environment. Briefly, 12-well
culture plates were coated with 1% gelatin prior to cell seeding. Cells were allowed to
come to confluency, and then differentiated by incubating cells for 3 days with 450µM 3-
isobutyl-1-methylxanthine, 250nM dexamethasone, and 167nM insulin, followed by 4
days supplementation with insulin alone. To confirm differentiation, visual inspection of
cells was performed to assess for lipid droplet formation as well as morphology changes
within the adipocytes. Experimentation occurred typically 7 days after induction of
differentiation. Before 24 hour treatment periods, cells were incubated with media with
only 10% FBS for a period of 24 hours unless otherwise specified. TNFα (Cell
Signaling, Danvers, MA), isoproterenol (Sigma-Aldrich, Saint Louis, MO), or IL-6
(eBioscience, San Diego, CA) treatment was performed using either a time course
treatment or a 24 hour treatment, as indicated.
2.2.2 Glycerol Release Measurement
Lipolytic determinations were made by assessing glycerol release in culture
medium. (Aboulaich, Chui, Asara, Flier, & Maratos-Flier, 2011; Lamb, Goldsmith,
Bennett, Finch, & Bell-Pedersen, 2011; Schleich & Teleman, 2009) Culture media was
20
collected and measured by spectrophotometer (Molecular Devices, SpectraMax Plus) at
540nm using free glycerol reagent (Sigma-Aldrich). Samples were compared to a
glycerol standard solution (Sigma-Aldrich) to quantify glycerol release.
2.2.3 Statistical Analysis
Statistical significance was determined by performed t-tests of data in Microsoft
Excel 2010. Statistical significance was determined if p-value < 0.05.
21
2.3 Results
2.3.1 Lipid Mobilization
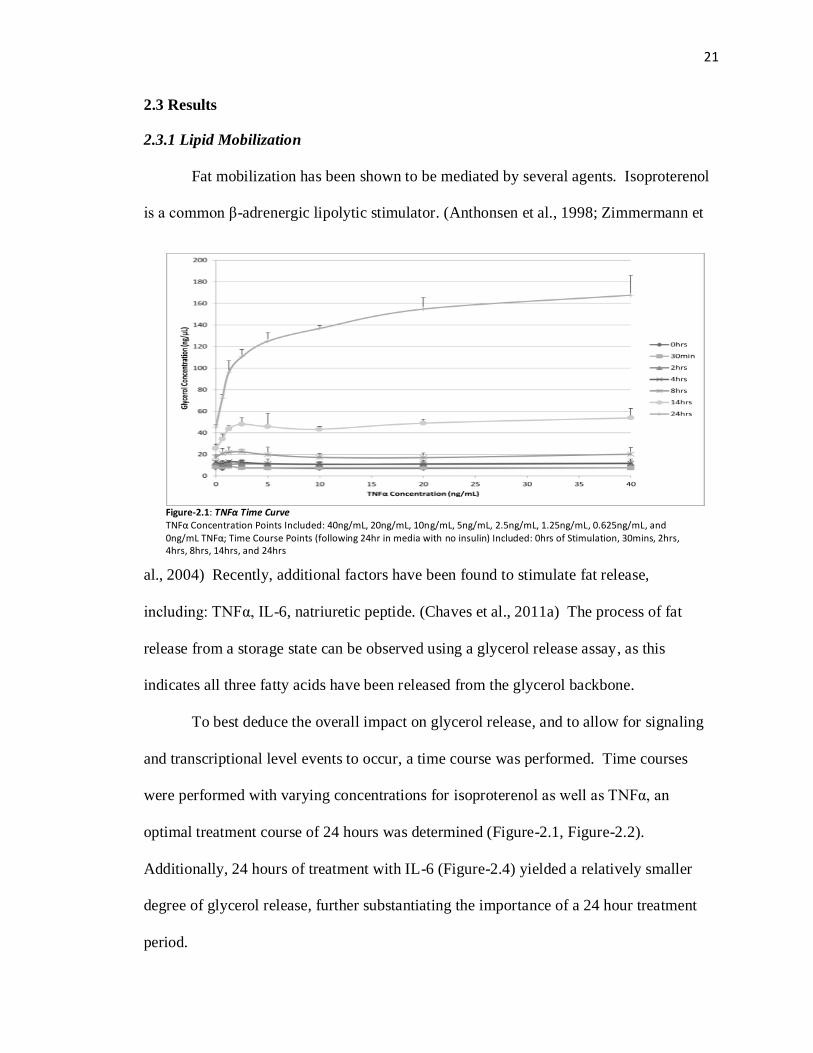
Fat mobilization has been shown to be mediated by several agents. Isoproterenol
is a common β-adrenergic lipolytic stimulator. (Anthonsen et al., 1998; Zimmermann et
al., 2004) Recently, additional factors have been found to stimulate fat release,
including: TNFα, IL-6, natriuretic peptide. (Chaves et al., 2011a) The process of fat
release from a storage state can be observed using a glycerol release assay, as this
indicates all three fatty acids have been released from the glycerol backbone.
To best deduce the overall impact on glycerol release, and to allow for signaling
and transcriptional level events to occur, a time course was performed. Time courses
were performed with varying concentrations for isoproterenol as well as TNFα, an
optimal treatment course of 24 hours was determined (Figure-2.1, Figure-2.2).
Additionally, 24 hours of treatment with IL-6 (Figure-2.4) yielded a relatively smaller
degree of glycerol release, further substantiating the importance of a 24 hour treatment
period.
Figure-2.1: TNFα Time Curve TNFα Concentration Points Included: 40ng/mL, 20ng/mL, 10ng/mL, 5ng/mL, 2.5ng/mL, 1.25ng/mL, 0.625ng/mL, and 0ng/mL TNFα; Time Course Points (following 24hr in media with no insulin) Included: 0hrs of Stimulation, 30mins, 2hrs, 4hrs, 8hrs, 14hrs, and 24hrs
22
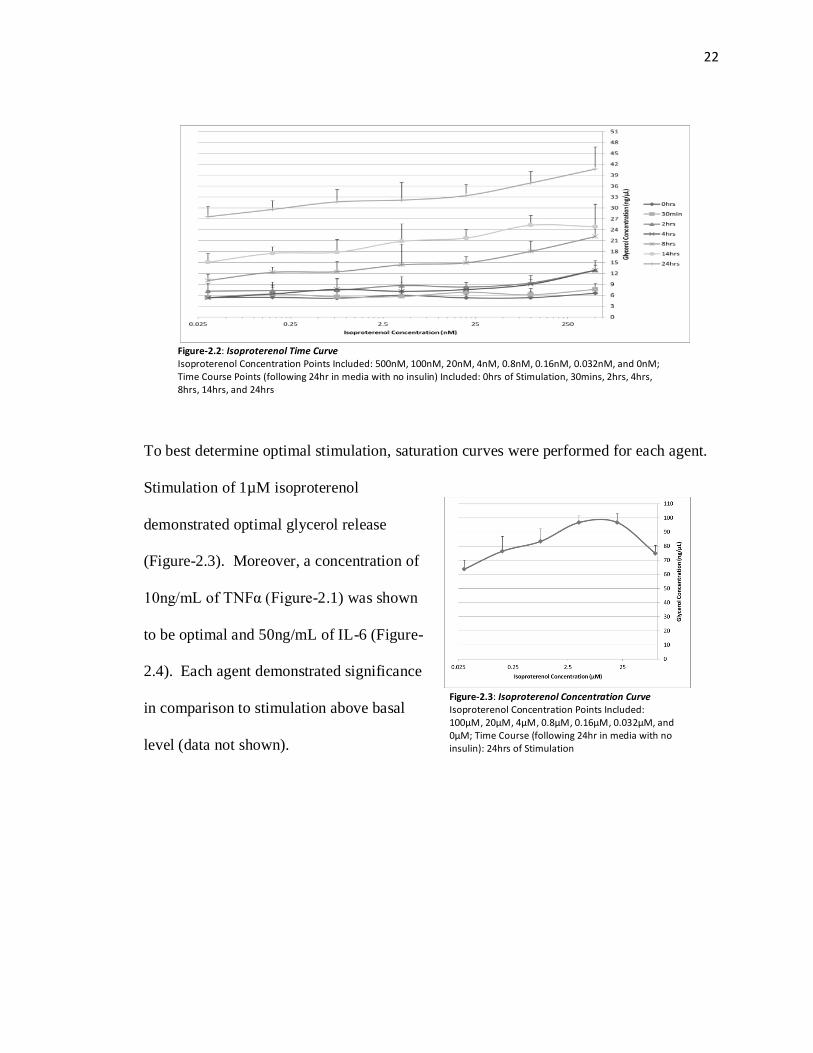
To best determine optimal stimulation, saturation curves were performed for each agent.
Stimulation of 1µM isoproterenol
demonstrated optimal glycerol release
(Figure-2.3). Moreover, a concentration of
10ng/mL of TNFα (Figure-2.1) was shown
to be optimal and 50ng/mL of IL-6 (Figure-
2.4). Each agent demonstrated significance
in comparison to stimulation above basal
level (data not shown).
Figure-2.3: Isoproterenol Concentration Curve Isoproterenol Concentration Points Included: 100µM, 20µM, 4µM, 0.8µM, 0.16µM, 0.032µM, and 0µM; Time Course (following 24hr in media with no insulin): 24hrs of Stimulation
Figure-2.2: Isoproterenol Time Curve Isoproterenol Concentration Points Included: 500nM, 100nM, 20nM, 4nM, 0.8nM, 0.16nM, 0.032nM, and 0nM; Time Course Points (following 24hr in media with no insulin) Included: 0hrs of Stimulation, 30mins, 2hrs, 4hrs, 8hrs, 14hrs, and 24hrs
23
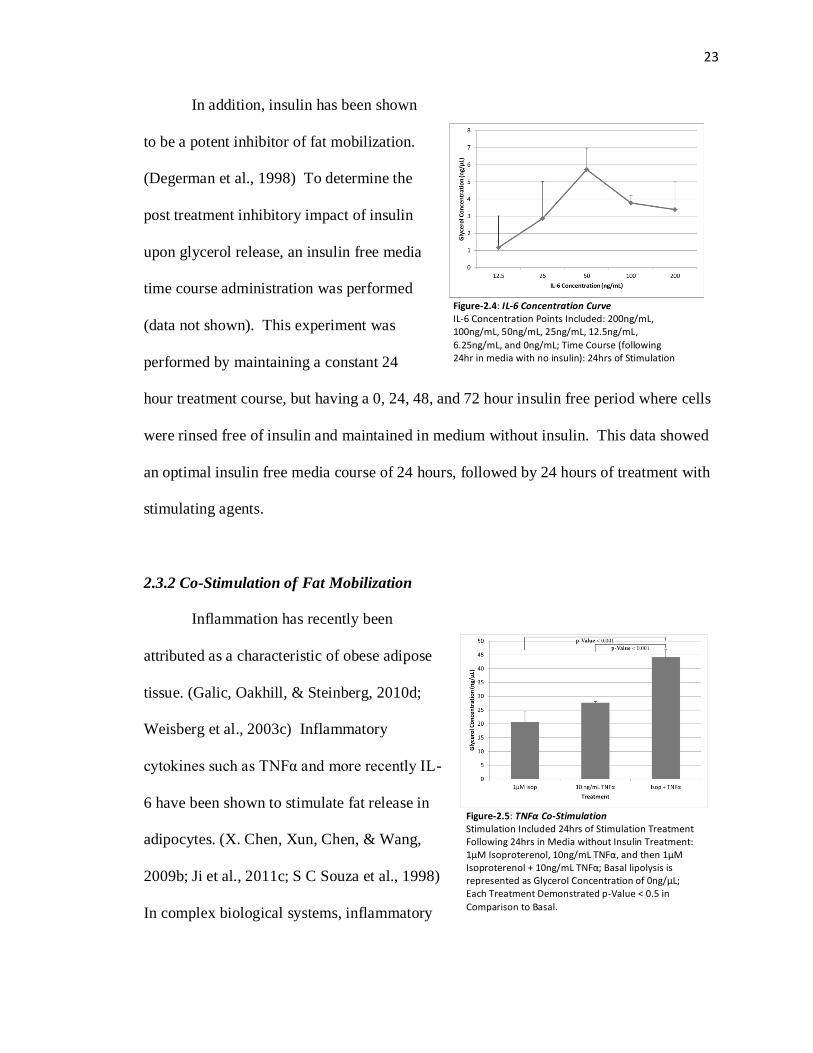
In addition, insulin has been shown
to be a potent inhibitor of fat mobilization.
(Degerman et al., 1998) To determine the
post treatment inhibitory impact of insulin
upon glycerol release, an insulin free media
time course administration was performed
(data not shown). This experiment was
performed by maintaining a constant 24
hour treatment course, but having a 0, 24, 48, and 72 hour insulin free period where cells
were rinsed free of insulin and maintained in medium without insulin. This data showed
an optimal insulin free media course of 24 hours, followed by 24 hours of treatment with
stimulating agents.
2.3.2 Co-Stimulation of Fat Mobilization
Inflammation has recently been
attributed as a characteristic of obese adipose
tissue. (Galic, Oakhill, & Steinberg, 2010d;
Weisberg et al., 2003c) Inflammatory
cytokines such as TNFα and more recently IL-
6 have been shown to stimulate fat release in
adipocytes. (X. Chen, Xun, Chen, & Wang,
2009b; Ji et al., 2011c; S C Souza et al., 1998)
In complex biological systems, inflammatory
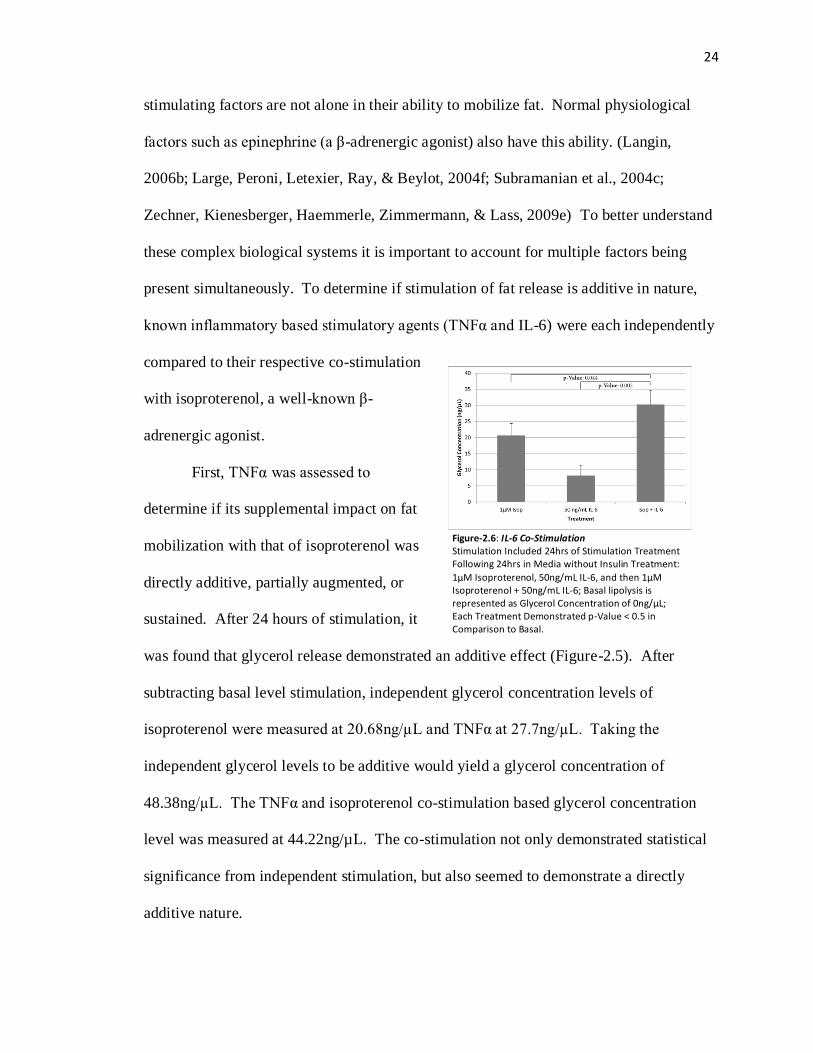
Figure-2.5: TNFα Co-Stimulation Stimulation Included 24hrs of Stimulation Treatment Following 24hrs in Media without Insulin Treatment: 1µM Isoproterenol, 10ng/mL TNFα, and then 1µM Isoproterenol + 10ng/mL TNFα; Basal lipolysis is represented as Glycerol Concentration of 0ng/µL; Each Treatment Demonstrated p-Value < 0.5 in
Comparison to Basal.
Figure-2.4: IL-6 Concentration Curve IL-6 Concentration Points Included: 200ng/mL, 100ng/mL, 50ng/mL, 25ng/mL, 12.5ng/mL,
6.25ng/mL, and 0ng/mL; Time Course (following 24hr in media with no insulin): 24hrs of Stimulation
24
stimulating factors are not alone in their ability to mobilize fat. Normal physiological
factors such as epinephrine (a β-adrenergic agonist) also have this ability. (Langin,
2006b; Large, Peroni, Letexier, Ray, & Beylot, 2004f; Subramanian et al., 2004c;
Zechner, Kienesberger, Haemmerle, Zimmermann, & Lass, 2009e) To better understand
these complex biological systems it is important to account for multiple factors being
present simultaneously. To determine if stimulation of fat release is additive in nature,
known inflammatory based stimulatory agents (TNFα and IL-6) were each independently
compared to their respective co-stimulation
with isoproterenol, a well-known β-
adrenergic agonist.
First, TNFα was assessed to
determine if its supplemental impact on fat
mobilization with that of isoproterenol was
directly additive, partially augmented, or
sustained. After 24 hours of stimulation, it
was found that glycerol release demonstrated an additive effect (Figure-2.5). After
subtracting basal level stimulation, independent glycerol concentration levels of
isoproterenol were measured at 20.68ng/µL and TNFα at 27.7ng/µL. Taking the
independent glycerol levels to be additive would yield a glycerol concentration of
48.38ng/µL. The TNFα and isoproterenol co-stimulation based glycerol concentration
level was measured at 44.22ng/µL. The co-stimulation not only demonstrated statistical
significance from independent stimulation, but also seemed to demonstrate a directly
additive nature.
Figure-2.6: IL-6 Co-Stimulation Stimulation Included 24hrs of Stimulation Treatment Following 24hrs in Media without Insulin Treatment:
1µM Isoproterenol, 50ng/mL IL-6, and then 1µM Isoproterenol + 50ng/mL IL-6; Basal lipolysis is represented as Glycerol Concentration of 0ng/µL; Each Treatment Demonstrated p-Value < 0.5 in Comparison to Basal.
25
After TNFα, IL-6 was then assessed for its supplemental ability to stimulate fat
release with isoproterenol. Again, after a 24 hour period of stimulation, glycerol release
was measured and an additive effect was measured (Figure-2.6). Independent glycerol
concentration levels were measured at 8.19ng/µL for IL-6 and isoproterenol was
measured at 20.68ng/µL. These independent values taken to be additive would yield a
value of 28.87ng/µL. The measured co-stimulation glycerol concentration was measured
at 30.3ng/µL. As was seen with TNFα, co-stimulation of IL-6 and isoproterenol again
showed statistical significance and seemed to demonstrate a directly additive nature.
2.3.3 Triple-Stimulation of Fat Mobilization
To better deduce how much of an impact multiple factors can have on fat
mobilization, an experiment was performed in which all three stimulating agents
(isoproterenol, TNFα, and IL-6) were combined. This type of a system was again
designed to be more demonstrative of a
complex biological system, with multiple
stimulating agents accessible to cells.
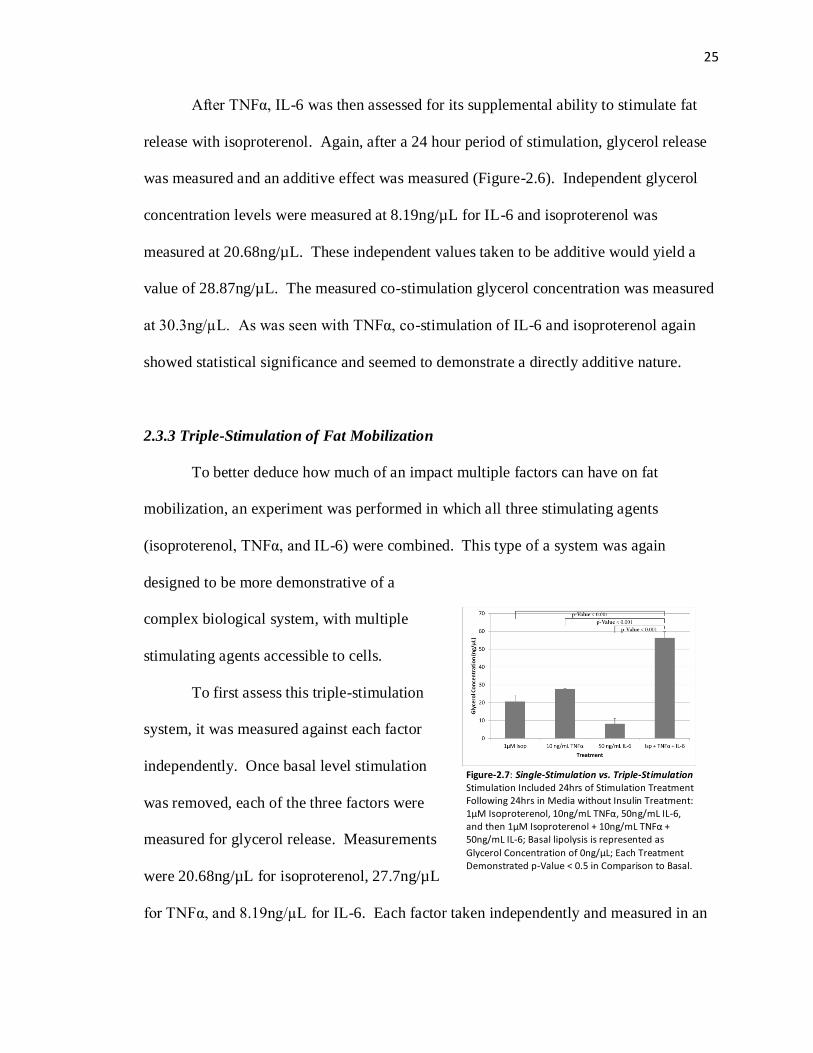
To first assess this triple-stimulation
system, it was measured against each factor
independently. Once basal level stimulation
was removed, each of the three factors were
measured for glycerol release. Measurements
were 20.68ng/µL for isoproterenol, 27.7ng/µL
for TNFα, and 8.19ng/µL for IL-6. Each factor taken independently and measured in an
Figure-2.7: Single-Stimulation vs. Triple-Stimulation Stimulation Included 24hrs of Stimulation Treatment Following 24hrs in Media without Insulin Treatment: 1µM Isoproterenol, 10ng/mL TNFα, 50ng/mL IL-6, and then 1µM Isoproterenol + 10ng/mL TNFα + 50ng/mL IL-6; Basal lipolysis is represented as
Glycerol Concentration of 0ng/µL; Each Treatment Demonstrated p-Value < 0.5 in Comparison to Basal.
26
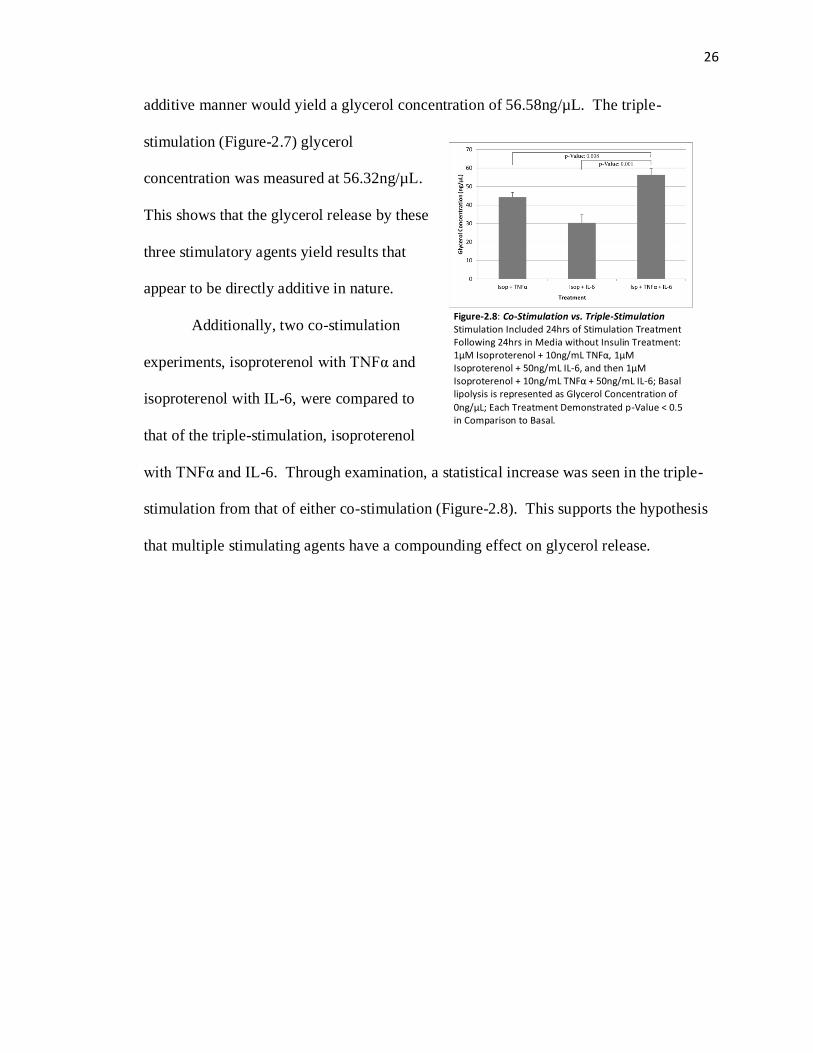
additive manner would yield a glycerol concentration of 56.58ng/µL. The triple-
stimulation (Figure-2.7) glycerol
concentration was measured at 56.32ng/µL.
This shows that the glycerol release by these
three stimulatory agents yield results that
appear to be directly additive in nature.
Additionally, two co-stimulation
experiments, isoproterenol with TNFα and
isoproterenol with IL-6, were compared to
that of the triple-stimulation, isoproterenol
with TNFα and IL-6. Through examination, a statistical increase was seen in the triple-
stimulation from that of either co-stimulation (Figure-2.8). This supports the hypothesis
that multiple stimulating agents have a compounding effect on glycerol release.
Figure-2.8: Co-Stimulation vs. Triple-Stimulation Stimulation Included 24hrs of Stimulation Treatment Following 24hrs in Media without Insulin Treatment: 1µM Isoproterenol + 10ng/mL TNFα, 1µM Isoproterenol + 50ng/mL IL-6, and then 1µM Isoproterenol + 10ng/mL TNFα + 50ng/mL IL-6; Basal lipolysis is represented as Glycerol Concentration of
0ng/µL; Each Treatment Demonstrated p-Value < 0.5 in Comparison to Basal.
27
2.4 Discussion
Previous findings have demonstrated that obese adipose tissue maintains a
chronic, low grade inflammation that is accompanied by the presence of pro-
inflammatory cytokines such as TNFα and IL-6. (Galic, Oakhill, & Steinberg, 2010e)
Normal physiological regulation of lipolytic processes are performed by factors such as
catecholamines (adrenergic agonists), among others. (Jaworski, Sarkadi-Nagy, Duncan,
Ahmadian, & Sul, 2007f) When a normal physiological regulation is supplemented by
inflammatory regulatory factors, the end result appears to be significantly more potent
activation of the lipolytic system than any single factor would independently.
When assessing true obese biological systems, all of these factors may be present
in an individual, and therefore determining the impact of a compounded lipolytic
stimulation may present even further detrimental effects on the system. Therapeutic
agents acting to combat insulin resistance, hyperlipidemia, and other health concerns,
must be able to take into account these compounding factors. Assessment of the
hypothesis that pro-inflammatory cytokines, such as TNFα and IL-6, additionally and
positively augment β-adrenergic stimulation of the lipolytic pathway showed that this
appears to be the case in a 3T3-L1 model system.
Signaling level events may further elucidate the mechanism of action for this
compounding lipolytic stimulation. In addition, it will be helpful to further evaluate the
impact of a co- and triple-stimulation using a diet induced obesity rodent model to further
elucidate the effects on the system after such stimulation.
28
Chapter 3: Glycerol Release in Niemann-Pick Disease Type C1 Carrier Mice:
3.1 Introduction
3.1.1 Niemann-Pick Disease
Niemann-Pick disease (NP) was first named from work performed by Albert
Niemann and Ludwig Pick. It is classified as Sphingomyelinase deficiency. NP is a
group of diseases that demonstrate lipid collection in organs such as the spleen, liver,
brain, and even white adipose tissue. There are four subtypes of NP classified as Type A,
B, C, and D. Each of these show a variety of symptoms based upon the organs impacted,
whether there is nervous system involvement, and age of occurrence. (“Niemann-Pick
disease - National Library of Medicine - PubMed Health,” n.d.-a; Patterson et al., 2012a;
Vanier, 2010)
3.1.2 Niemann-Pick Disease Type C
NP Type C (referred to as NPC) results when cholesterol and other lipids cannot
be properly broken down and therefore leads to increased cholesterol in the liver and
spleen and other lipid forms in the brain. NPC has two genes that have been associated
with it, of which gene 1 (NPC1) is present in approximately 95% of cases, while gene 2
(NPC2) is present in only 5% of the cases. (“Niemann-Pick disease - National Library of
Medicine - PubMed Health,” n.d.-b; Patterson et al., 2012b) Symptoms for NPC1
typically include: enlarged liver, spleen, jaundice, learning difficulties, intellectual
29
decline, seizures, slurred or irregular speech, tremors, difficulty moving limbs, and more.
(“Niemann-Pick disease - National Library of Medicine - PubMed Health,” n.d.-b)
3.1.3 Niemann-Pick Disease Type C1
The NPC1 gene codes for a membrane-bound protein that has multiple cholesterol
binding regions. The NPC1 protein is associated with the late endosomes, lysosome, and
trans-Golgi network and is believed to be involved in the transport of low density
lipoproteins (LDL) derived cholesterol from the late endosome/lysosome to other cellular
compartments. (Garver, Heidenreich, Erickson, Thomas, & Wilson, 2000; Higgins,
Davies, Chen, & Ioannou, 1999; Jelinek et al., 2012a; Liscum, Ruggiero, & Faust, 1989;
Meyre, Delplanque, Chèvre, Lecoeur, Lobbens, Gallina, Durand, Vatin, Degraeve,
Proença, et al., 2009b)
3.1.4 NPC1 Carrier Mouse Model
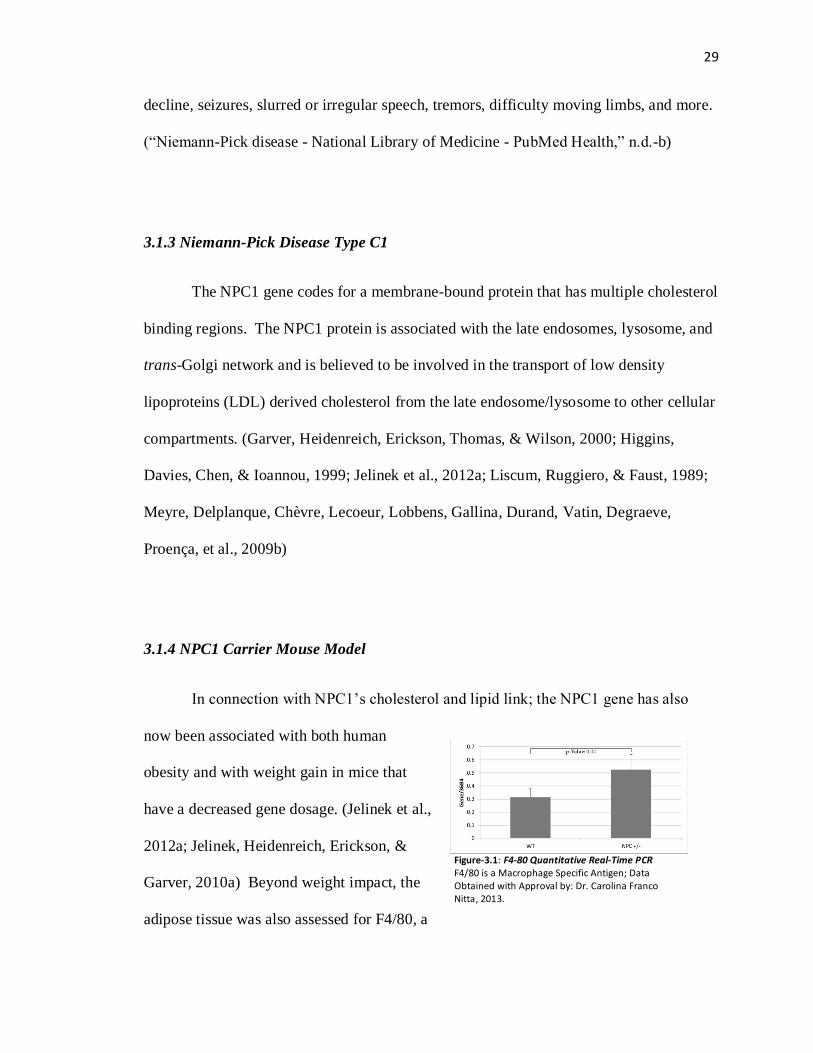
In connection with NPC1’s cholesterol and lipid link; the NPC1 gene has also
now been associated with both human
obesity and with weight gain in mice that
have a decreased gene dosage. (Jelinek et al.,
2012a; Jelinek, Heidenreich, Erickson, &
Garver, 2010a) Beyond weight impact, the
adipose tissue was also assessed for F4/80, a
Figure-3.1: F4-80 Quantitative Real-Time PCR F4/80 is a Macrophage Specific Antigen; Data Obtained with Approval by: Dr. Carolina Franco Nitta, 2013.
30
macrophage specific antigen. (Wellen & Hotamisligil, 2003) As shown in Figure-3.1,
NPC1 carrier (NPC1 +/-) status demonstrated a statistically significant increase in F4/80
as compared to wild-type. This finding shows that microphage infiltration is greater in
adipose from NPC1 carrier mice than wild-type, which infers an increased likelihood that
pro-inflammatory cytokines are present in the tissue. (Xu et al., 2003b) At this time the
consequence of inflammatory-induced lipolytic stimulation in the context of NPC1 gene
variants are still unknown.
3.1.5 Hypothesis & Specific Aims
To better understand the correlation between the obesity and NPC1, and possible effects
on lipolytic function, we hypothesize that decreased NPC1 gene dosage
(haploinsufficiency) results in increased fat pad weight by mechanisms that decrease
lipolytic genes. To best test this hypothesis we pursued three specific aims.
Specific aim #1: To confirm the body weight differential previously published
and to determine if differences in fat pad weight were also present.
Specific aim #2: To quantify lipolytic activity in wild type mice and NPC1 +/-
mice by measuring glycerol release.
Specific aim #3: To identify which genes involved in fat metabolism may be
alternatively regulated by the NPC1 carrier status.
31
3.2 Methods
3.2.1 Mice
Male NPC1+/+
and NPC+/-
(BALB/cJ genetic background) mice were raised at the
University of New Mexico Animal Research Facility following conditions reported
previously. (Jelinek, Heidenreich, Erickson, & Garver, 2010b) Mice were raised with 4
mice per cage, at a temperature maintained between 73°- 75°F, humidity of 46%-52%,
and light periods of 12-hour alternating light/dark cycle. Mice had free access to food
and water. All mice were placed on a 16 week high-fat diet and weighed weekly until
160 days, when they were harvested. After the 160 day period, NPC1+/+
mice weighed
an average 35.2g and NPC1+/-
mice weighed an average of 41.05g.
3.2.2 Fat Pad Excision
Following a 3-5 minute CO2 euthanization process, fur of the abdominal section
was cleaned with 70% alcohol solution and an incision approximately 2-cm in length was
made. From this incision the fat pad was excised and testes were removed. Fat pads
were weighed and placed in DMEM/high-glucose medium supplemented with 10% fetal
bovine serum (FBS). Part of the fat pad was placed in 6mL RNALater and stored at -
20°C for Quantitative Real-Time PCR analysis. The fat pad tissue in media was
incubated at 37°C in a 5% CO2 environment for a period of 24 hours.
32
3.2.3 Weight Normalization
Following a 24 hour incubation period, fat pad tissue was cut into whole pieces of
approximate weight of 0.1g to 0.15g. Tissue was weighed and recorded to normalize
glycerol release to the amount of tissue in each well.
3.2.4 Glycerol Release Assay
Lipolytic determinations were made by assessing glycerol release in culture
medium following a 4 hour incubation period. (Aboulaich et al., 2011; Lamb et al., 2011;
Schleich & Teleman, 2009) Culture media was collected and measured by
spectrophotometer (Molecular Devices, SpectraMax Plus) at 540nm using free glycerol
reagent (Sigma-Aldrich) as reported in chapter 2.2.2. Samples were compared to a
glycerol standard solution (Sigma-Aldrich) to quantify glycerol release.
3.2.5 Quantitative Real-Time PCR
Mouse adipose tissue was homogenized using a tissue homogenizer. RNA was
isolated using an RNAeasy Mini Kit (Qiagen, Valencia, CA) following the manufacturers
recommendations. RNA was then converted into a cDNA form using the High Capacity
cDNA Reverse Transcription Kit (Applied Biosystems). After this, cDNA from NPC1
carrier and wild-type mice was used for quantitative Real-Time PCR (qRT-PCR) using a
LightCycler 480 SYBR Green I Master Mix chemistry (Roche Diagnostics, Indianapolis,
IN) and analyzed on the LightCycler 480 instrument (Roche Diagnostics, Indianapolis,
33
IN). Expression levels of ATGL, HSL, MGL, LPL, CGI-58, PPARγ, Perilipin, Mal1,
CD36, FATP1, FATP4, Ascl1, GOT2, and FAS. FATP4, CGI-58, MGL, GOT2, FAS,
and ATGL genes were measured by a 3-step qtRT-PCR parameter with a pre-incubation
step at 95°C for 5 minutes, followed by amplification for 45 cycles at 95°C for 10
seconds, 60°C for 15 seconds, 72°C for 1 second . HSL, Perilipin, CD36, PPARγ, Mal1,
Ascl1, LPL, and FATP1 genes were run using a 2-step qtRT-PCR parameter with a pre-
incubation step at 95°C for 15 minutes, followed by amplification for 40 cycles at 95°C
for 15 seconds, and at annealing temperature for 1 minute. Gene expression changes
were calculated using a relative standard curve method (Livak, 1997) using 36B4 mRNA
levels for normalization.
3.2.6 Statistical Analysis
Statistical significance was determined by performed t-tests of data in Microsoft
Excel 2010. Statistical significance was determined if p-value < 0.05.
34
3.3 Results
3.3.1 NPC1 Carrier Weight Differential
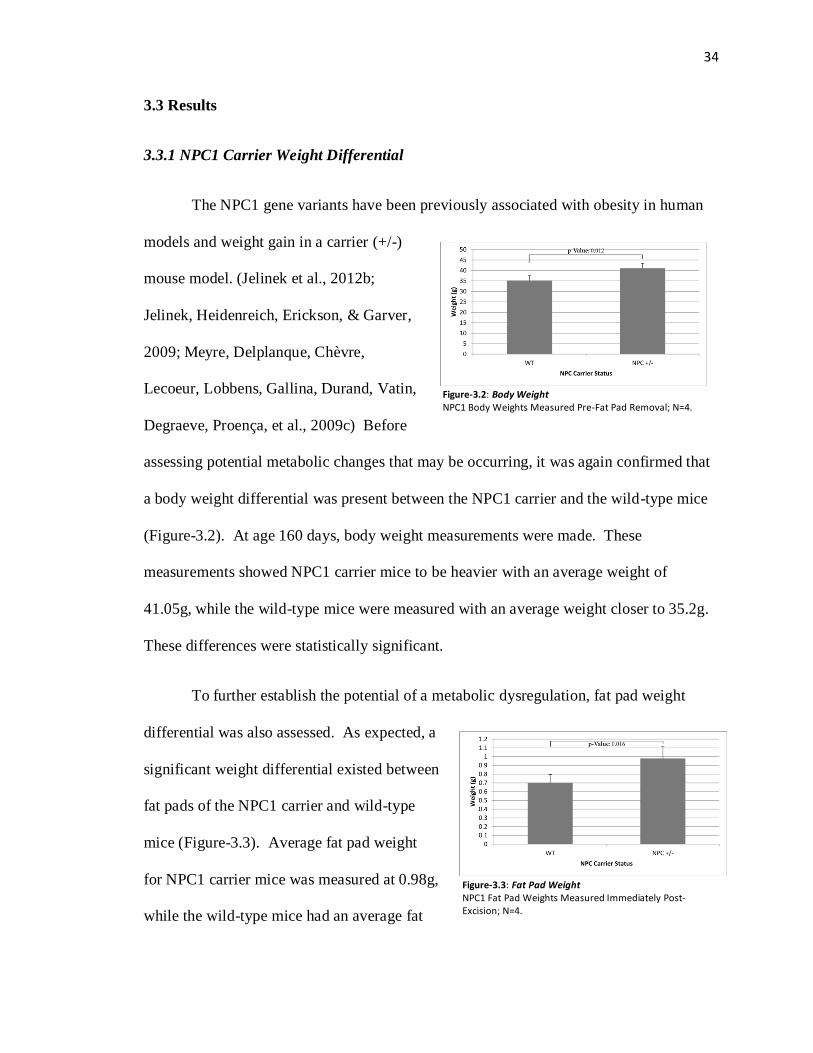
The NPC1 gene variants have been previously associated with obesity in human
models and weight gain in a carrier (+/-)
mouse model. (Jelinek et al., 2012b;
Jelinek, Heidenreich, Erickson, & Garver,
2009; Meyre, Delplanque, Chèvre,
Lecoeur, Lobbens, Gallina, Durand, Vatin,
Degraeve, Proença, et al., 2009c) Before
assessing potential metabolic changes that may be occurring, it was again confirmed that
a body weight differential was present between the NPC1 carrier and the wild-type mice
(Figure-3.2). At age 160 days, body weight measurements were made. These
measurements showed NPC1 carrier mice to be heavier with an average weight of
41.05g, while the wild-type mice were measured with an average weight closer to 35.2g.
These differences were statistically significant.
To further establish the potential of a metabolic dysregulation, fat pad weight
differential was also assessed. As expected, a
significant weight differential existed between
fat pads of the NPC1 carrier and wild-type
mice (Figure-3.3). Average fat pad weight
for NPC1 carrier mice was measured at 0.98g,
while the wild-type mice had an average fat
Figure-3.2: Body Weight NPC1 Body Weights Measured Pre-Fat Pad Removal; N=4.
Figure-3.3: Fat Pad Weight NPC1 Fat Pad Weights Measured Immediately Post-Excision; N=4.
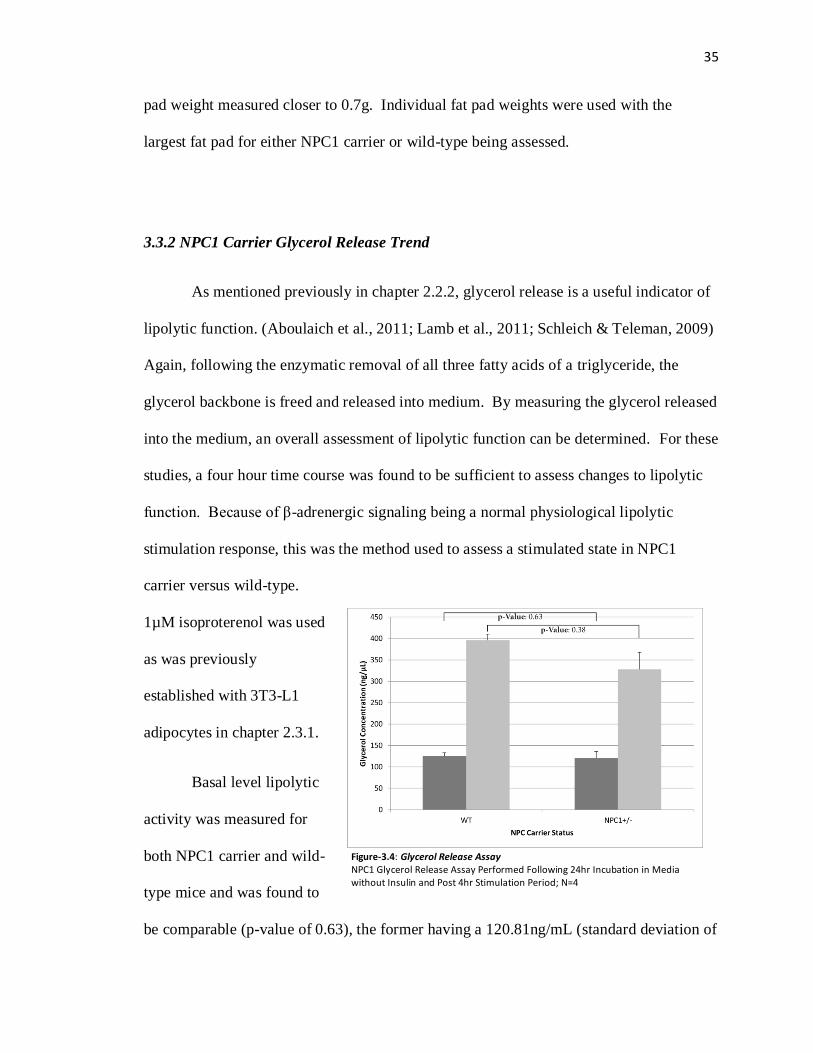
35
pad weight measured closer to 0.7g. Individual fat pad weights were used with the
largest fat pad for either NPC1 carrier or wild-type being assessed.
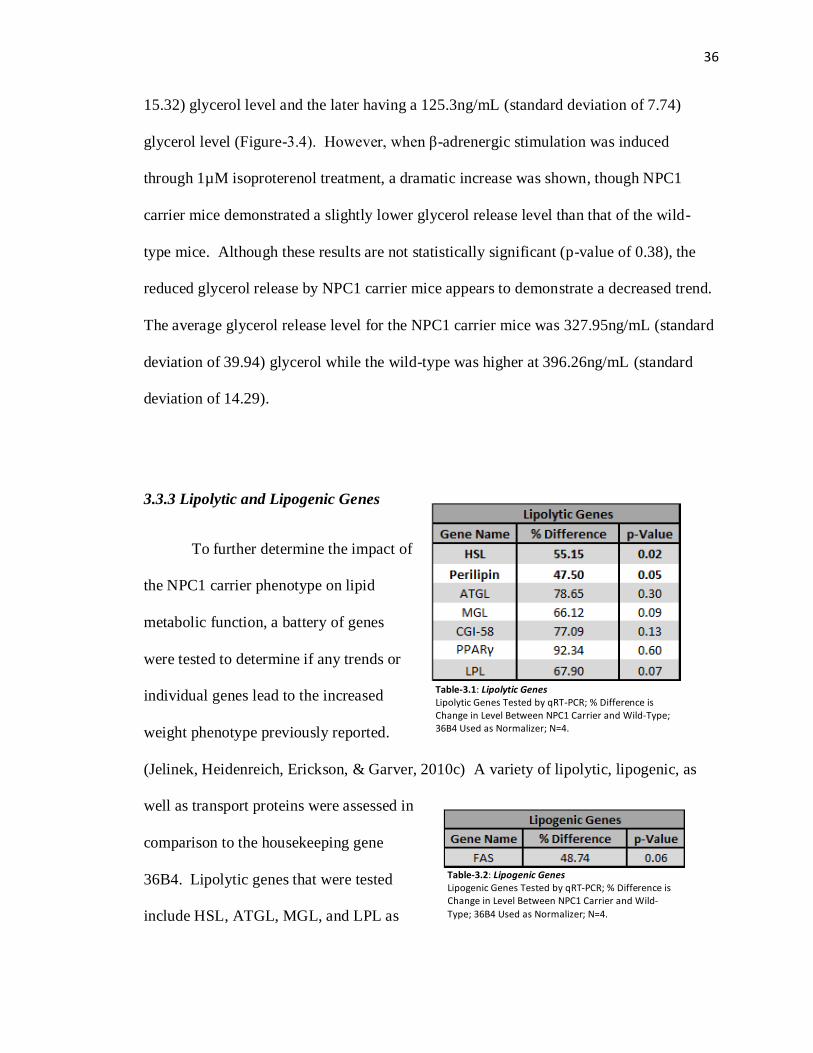
3.3.2 NPC1 Carrier Glycerol Release Trend
As mentioned previously in chapter 2.2.2, glycerol release is a useful indicator of
lipolytic function. (Aboulaich et al., 2011; Lamb et al., 2011; Schleich & Teleman, 2009)
Again, following the enzymatic removal of all three fatty acids of a triglyceride, the
glycerol backbone is freed and released into medium. By measuring the glycerol released
into the medium, an overall assessment of lipolytic function can be determined. For these
studies, a four hour time course was found to be sufficient to assess changes to lipolytic
function. Because of β-adrenergic signaling being a normal physiological lipolytic
stimulation response, this was the method used to assess a stimulated state in NPC1
carrier versus wild-type.
1µM isoproterenol was used
as was previously
established with 3T3-L1
adipocytes in chapter 2.3.1.
Basal level lipolytic
activity was measured for
both NPC1 carrier and wild-
type mice and was found to
be comparable (p-value of 0.63), the former having a 120.81ng/mL (standard deviation of
Figure-3.4: Glycerol Release Assay NPC1 Glycerol Release Assay Performed Following 24hr Incubation in Media without Insulin and Post 4hr Stimulation Period; N=4
36
15.32) glycerol level and the later having a 125.3ng/mL (standard deviation of 7.74)
glycerol level (Figure-3.4). However, when β-adrenergic stimulation was induced
through 1µM isoproterenol treatment, a dramatic increase was shown, though NPC1
carrier mice demonstrated a slightly lower glycerol release level than that of the wild-
type mice. Although these results are not statistically significant (p-value of 0.38), the
reduced glycerol release by NPC1 carrier mice appears to demonstrate a decreased trend.
The average glycerol release level for the NPC1 carrier mice was 327.95ng/mL (standard
deviation of 39.94) glycerol while the wild-type was higher at 396.26ng/mL (standard
deviation of 14.29).
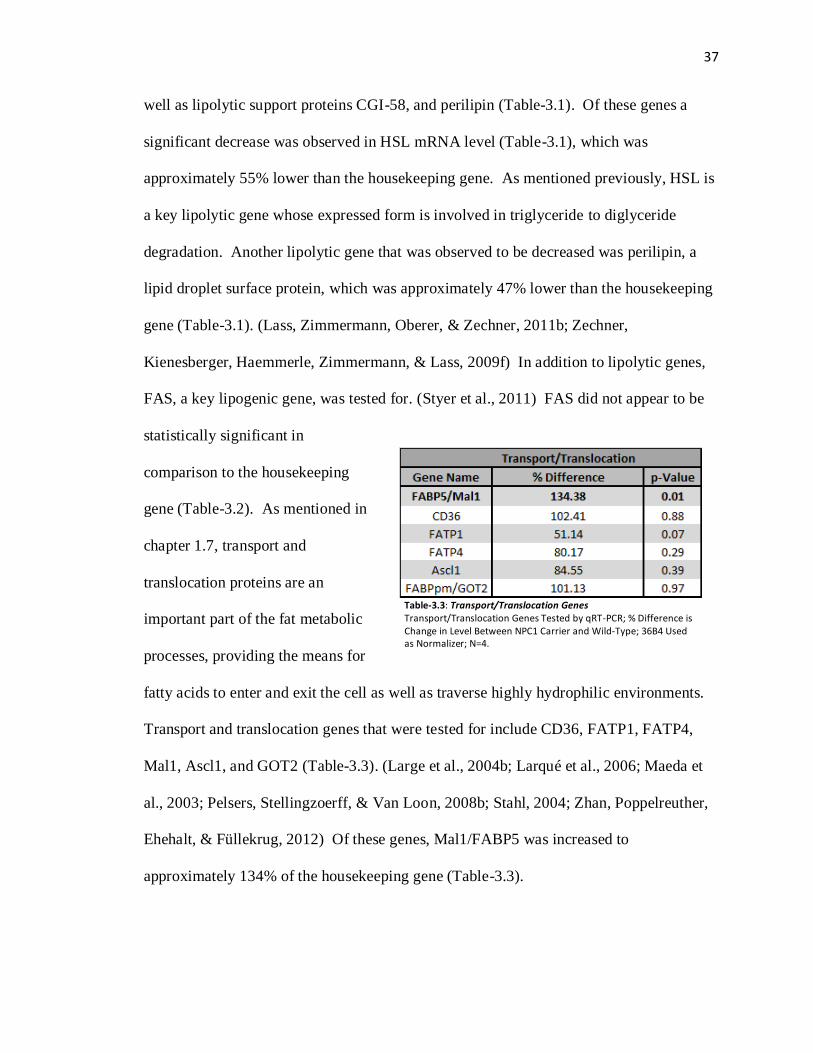
3.3.3 Lipolytic and Lipogenic Genes
To further determine the impact of
the NPC1 carrier phenotype on lipid
metabolic function, a battery of genes
were tested to determine if any trends or
individual genes lead to the increased
weight phenotype previously reported.
(Jelinek, Heidenreich, Erickson, & Garver, 2010c) A variety of lipolytic, lipogenic, as
well as transport proteins were assessed in
comparison to the housekeeping gene
36B4. Lipolytic genes that were tested
include HSL, ATGL, MGL, and LPL as
Table-3.2: Lipogenic Genes Lipogenic Genes Tested by qRT-PCR; % Difference is Change in Level Between NPC1 Carrier and Wild-
Type; 36B4 Used as Normalizer; N=4.
Table-3.1: Lipolytic Genes Lipolytic Genes Tested by qRT-PCR; % Difference is Change in Level Between NPC1 Carrier and Wild-Type; 36B4 Used as Normalizer; N=4.
37
well as lipolytic support proteins CGI-58, and perilipin (Table-3.1). Of these genes a
significant decrease was observed in HSL mRNA level (Table-3.1), which was
approximately 55% lower than the housekeeping gene. As mentioned previously, HSL is
a key lipolytic gene whose expressed form is involved in triglyceride to diglyceride
degradation. Another lipolytic gene that was observed to be decreased was perilipin, a
lipid droplet surface protein, which was approximately 47% lower than the housekeeping
gene (Table-3.1). (Lass, Zimmermann, Oberer, & Zechner, 2011b; Zechner,
Kienesberger, Haemmerle, Zimmermann, & Lass, 2009f) In addition to lipolytic genes,
FAS, a key lipogenic gene, was tested for. (Styer et al., 2011) FAS did not appear to be
statistically significant in
comparison to the housekeeping
gene (Table-3.2). As mentioned in
chapter 1.7, transport and
translocation proteins are an
important part of the fat metabolic
processes, providing the means for
fatty acids to enter and exit the cell as well as traverse highly hydrophilic environments.
Transport and translocation genes that were tested for include CD36, FATP1, FATP4,
Mal1, Ascl1, and GOT2 (Table-3.3). (Large et al., 2004b; Larqué et al., 2006; Maeda et
al., 2003; Pelsers, Stellingzoerff, & Van Loon, 2008b; Stahl, 2004; Zhan, Poppelreuther,
Ehehalt, & Füllekrug, 2012) Of these genes, Mal1/FABP5 was increased to
approximately 134% of the housekeeping gene (Table-3.3).
Table-3.3: Transport/Translocation Genes Transport/Translocation Genes Tested by qRT-PCR; % Difference is Change in Level Between NPC1 Carrier and Wild-Type; 36B4 Used as Normalizer; N=4.
38
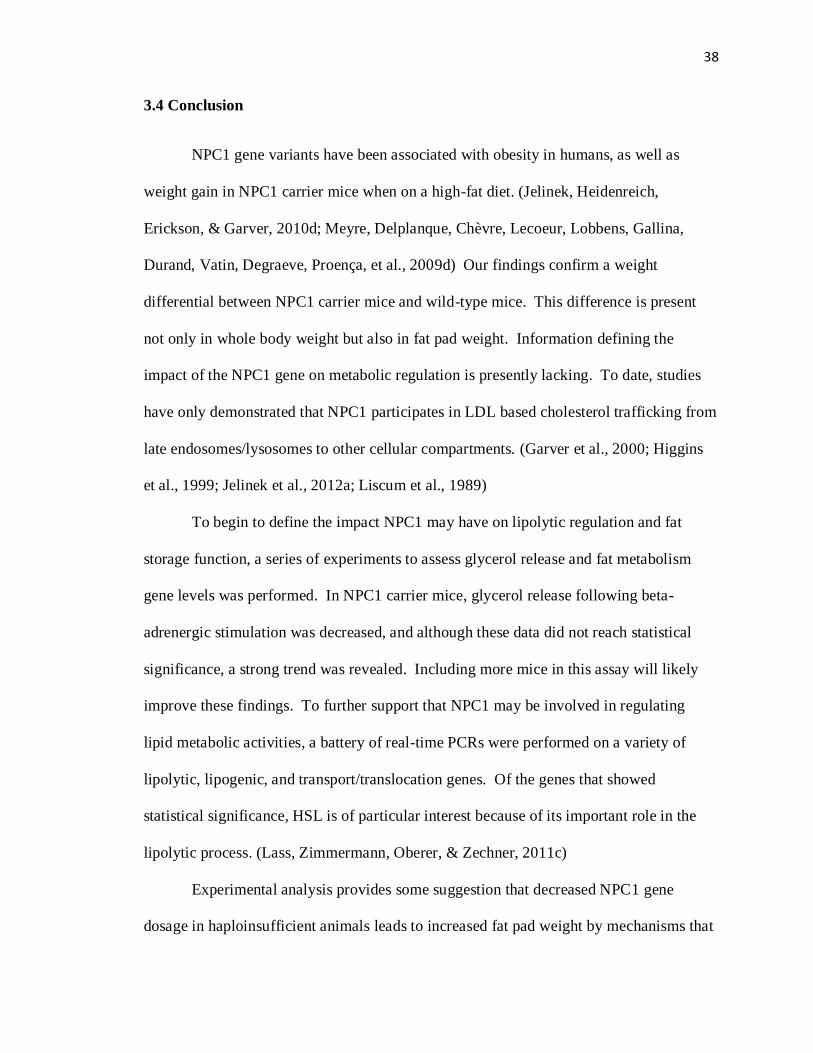
3.4 Conclusion
NPC1 gene variants have been associated with obesity in humans, as well as
weight gain in NPC1 carrier mice when on a high-fat diet. (Jelinek, Heidenreich,
Erickson, & Garver, 2010d; Meyre, Delplanque, Chèvre, Lecoeur, Lobbens, Gallina,
Durand, Vatin, Degraeve, Proença, et al., 2009d) Our findings confirm a weight
differential between NPC1 carrier mice and wild-type mice. This difference is present
not only in whole body weight but also in fat pad weight. Information defining the
impact of the NPC1 gene on metabolic regulation is presently lacking. To date, studies
have only demonstrated that NPC1 participates in LDL based cholesterol trafficking from
late endosomes/lysosomes to other cellular compartments. (Garver et al., 2000; Higgins
et al., 1999; Jelinek et al., 2012a; Liscum et al., 1989)
To begin to define the impact NPC1 may have on lipolytic regulation and fat
storage function, a series of experiments to assess glycerol release and fat metabolism
gene levels was performed. In NPC1 carrier mice, glycerol release following beta-
adrenergic stimulation was decreased, and although these data did not reach statistical
significance, a strong trend was revealed. Including more mice in this assay will likely
improve these findings. To further support that NPC1 may be involved in regulating
lipid metabolic activities, a battery of real-time PCRs were performed on a variety of
lipolytic, lipogenic, and transport/translocation genes. Of the genes that showed
statistical significance, HSL is of particular interest because of its important role in the
lipolytic process. (Lass, Zimmermann, Oberer, & Zechner, 2011c)
Experimental analysis provides some suggestion that decreased NPC1 gene
dosage in haploinsufficient animals leads to increased fat pad weight by mechanisms that

39
decrease lipolytic genes. To further investigate this, additional studies examining HSL
enzymatic activities are warranted.
40
Chapter 4: Overall Discussion:
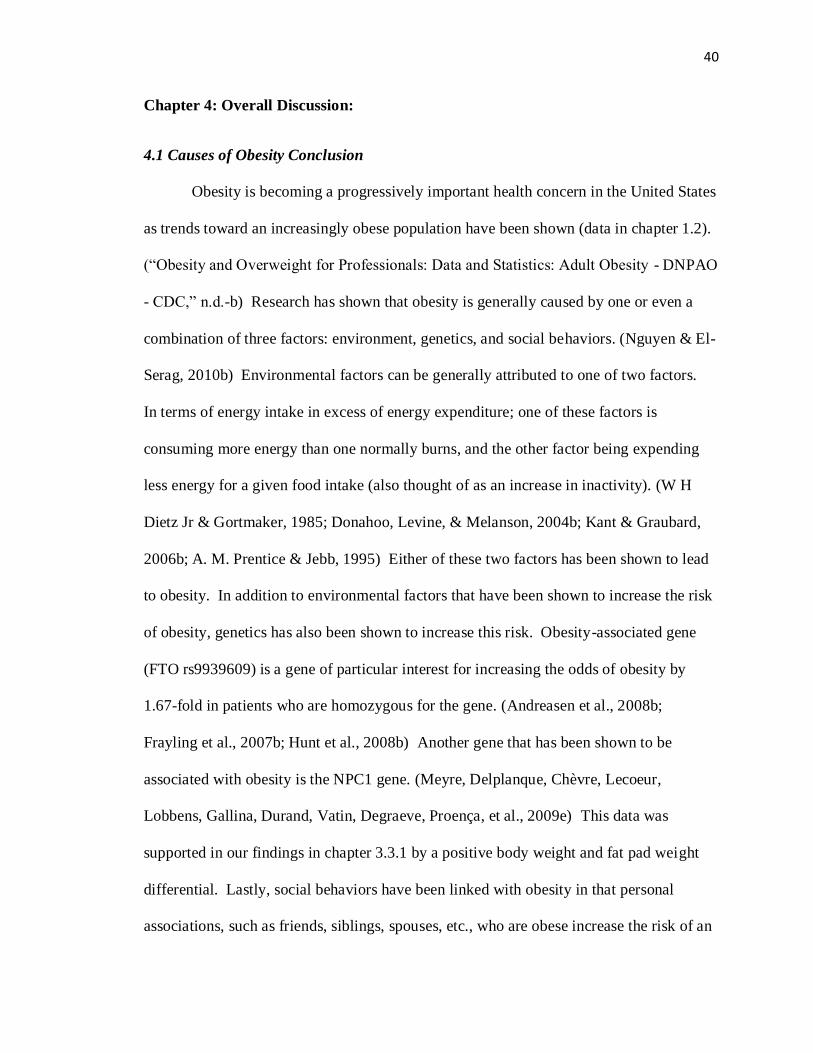
4.1 Causes of Obesity Conclusion
Obesity is becoming a progressively important health concern in the United States
as trends toward an increasingly obese population have been shown (data in chapter 1.2).
(“Obesity and Overweight for Professionals: Data and Statistics: Adult Obesity - DNPAO
- CDC,” n.d.-b) Research has shown that obesity is generally caused by one or even a
combination of three factors: environment, genetics, and social behaviors. (Nguyen & El-
Serag, 2010b) Environmental factors can be generally attributed to one of two factors.
In terms of energy intake in excess of energy expenditure; one of these factors is
consuming more energy than one normally burns, and the other factor being expending
less energy for a given food intake (also thought of as an increase in inactivity). (W H
Dietz Jr & Gortmaker, 1985; Donahoo, Levine, & Melanson, 2004b; Kant & Graubard,
2006b; A. M. Prentice & Jebb, 1995) Either of these two factors has been shown to lead
to obesity. In addition to environmental factors that have been shown to increase the risk
of obesity, genetics has also been shown to increase this risk. Obesity-associated gene
(FTO rs9939609) is a gene of particular interest for increasing the odds of obesity by
1.67-fold in patients who are homozygous for the gene. (Andreasen et al., 2008b;
Frayling et al., 2007b; Hunt et al., 2008b) Another gene that has been shown to be
associated with obesity is the NPC1 gene. (Meyre, Delplanque, Chèvre, Lecoeur,
Lobbens, Gallina, Durand, Vatin, Degraeve, Proença, et al., 2009e) This data was
supported in our findings in chapter 3.3.1 by a positive body weight and fat pad weight
differential. Lastly, social behaviors have been linked with obesity in that personal
associations, such as friends, siblings, spouses, etc., who are obese increase the risk of an
41
individual as well. Together these factors are all important to consider when addressing
the increasing trend seen.
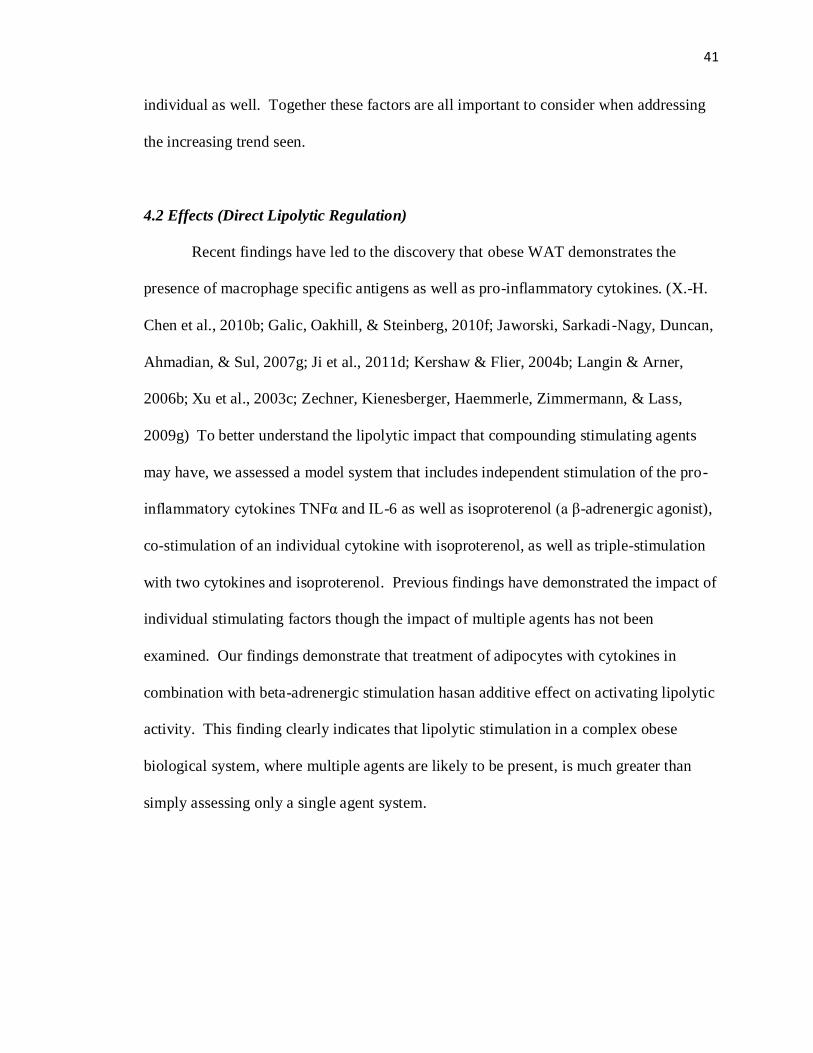
4.2 Effects (Direct Lipolytic Regulation)
Recent findings have led to the discovery that obese WAT demonstrates the
presence of macrophage specific antigens as well as pro-inflammatory cytokines. (X.-H.
Chen et al., 2010b; Galic, Oakhill, & Steinberg, 2010f; Jaworski, Sarkadi-Nagy, Duncan,
Ahmadian, & Sul, 2007g; Ji et al., 2011d; Kershaw & Flier, 2004b; Langin & Arner,
2006b; Xu et al., 2003c; Zechner, Kienesberger, Haemmerle, Zimmermann, & Lass,
2009g) To better understand the lipolytic impact that compounding stimulating agents
may have, we assessed a model system that includes independent stimulation of the pro-
inflammatory cytokines TNFα and IL-6 as well as isoproterenol (a β-adrenergic agonist),
co-stimulation of an individual cytokine with isoproterenol, as well as triple-stimulation
with two cytokines and isoproterenol. Previous findings have demonstrated the impact of
individual stimulating factors though the impact of multiple agents has not been
examined. Our findings demonstrate that treatment of adipocytes with cytokines in
combination with beta-adrenergic stimulation hasan additive effect on activating lipolytic
activity. This finding clearly indicates that lipolytic stimulation in a complex obese
biological system, where multiple agents are likely to be present, is much greater than
simply assessing only a single agent system.
42
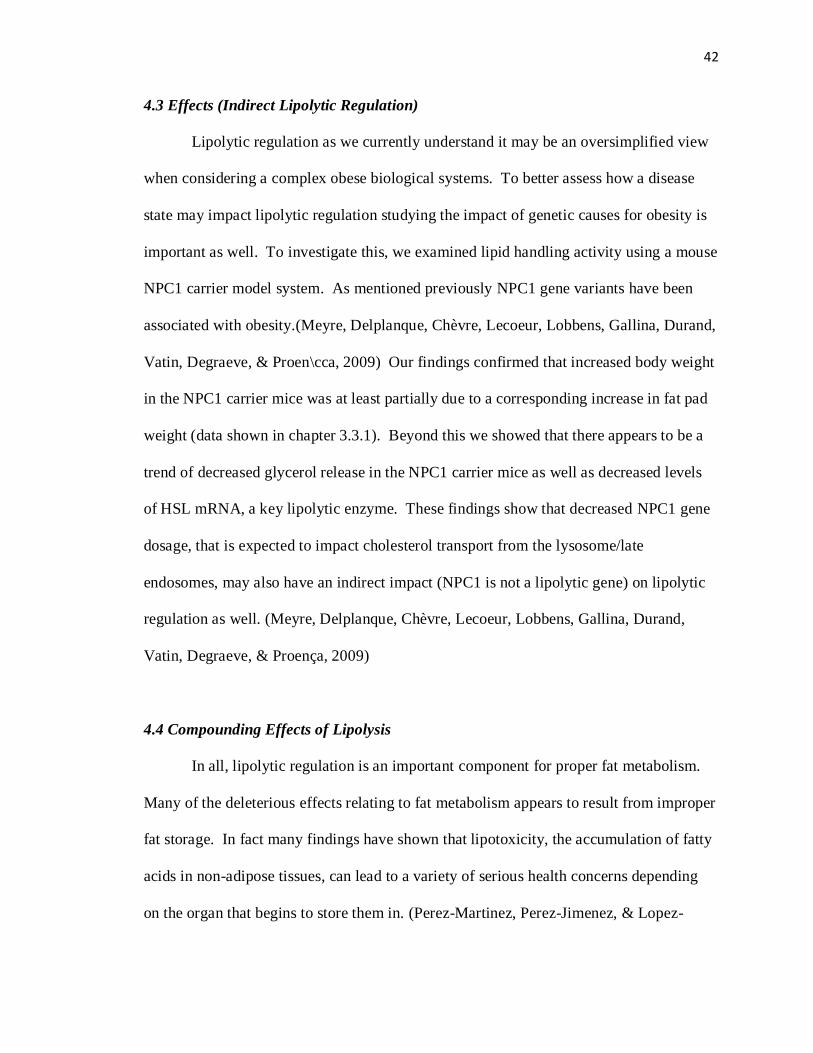
4.3 Effects (Indirect Lipolytic Regulation)
Lipolytic regulation as we currently understand it may be an oversimplified view
when considering a complex obese biological systems. To better assess how a disease
state may impact lipolytic regulation studying the impact of genetic causes for obesity is
important as well. To investigate this, we examined lipid handling activity using a mouse
NPC1 carrier model system. As mentioned previously NPC1 gene variants have been
associated with obesity.(Meyre, Delplanque, Chèvre, Lecoeur, Lobbens, Gallina, Durand,
Vatin, Degraeve, & Proen\cca, 2009) Our findings confirmed that increased body weight
in the NPC1 carrier mice was at least partially due to a corresponding increase in fat pad
weight (data shown in chapter 3.3.1). Beyond this we showed that there appears to be a
trend of decreased glycerol release in the NPC1 carrier mice as well as decreased levels
of HSL mRNA, a key lipolytic enzyme. These findings show that decreased NPC1 gene
dosage, that is expected to impact cholesterol transport from the lysosome/late
endosomes, may also have an indirect impact (NPC1 is not a lipolytic gene) on lipolytic
regulation as well. (Meyre, Delplanque, Chèvre, Lecoeur, Lobbens, Gallina, Durand,
Vatin, Degraeve, & Proença, 2009)
4.4 Compounding Effects of Lipolysis
In all, lipolytic regulation is an important component for proper fat metabolism.
Many of the deleterious effects relating to fat metabolism appears to result from improper
fat storage. In fact many findings have shown that lipotoxicity, the accumulation of fatty
acids in non-adipose tissues, can lead to a variety of serious health concerns depending
on the organ that begins to store them in. (Perez-Martinez, Perez-Jimenez, & Lopez-
43
Miranda, 2010b; Schaffer, 2003b; Unger, 2002b) Proper fat storage in adipocytes occurs
through a series of biochemical pathways that include triglyceride synthesis, lipogenesis,
transport and translocation of fatty acids, as well as lipolysis. Our findings demonstrate
that compounding treatment of adipocytes with multiple lipolytic activators, as well as
reduced gene dosage of NPC1, are capable of altering normal lipolytic regulation in
adipocytes.
4.5 Future Studies
Further study can provide additional information on the signaling mechanisms
involved in co- and triple-stimulation of the lipolytic processes. In addition, the findings
reported here need to be confirmed and extended in an in vivo model of obesity, such as
diet-induced obese mice. This will better represent a complex obese biological system
and provide essential physiological data. Additionally, to better determine indirect
mechanisms that effect lipolytic regulation, further study is needed to determine how a
decrease in lipolytic genes, in combination with increased stimulation from pro-
inflammatory cytokines, might impact a complex biological system.
44
References:
Aboulaich, N., Chui, P. C., Asara, J. M., Flier, J. S., & Maratos-Flier, E. (2011). Polymerase I and
Transcript Release Factor Regulates Lipolysis via a Phosphorylation-Dependent
Mechanism. Diabetes, 60(3), 757–765. doi:10.2337/db10-0744
Abumrad, N., Harmon, C., & Ibrahimi, A. (1998). Membrane transport of long-chain fatty acids:
evidence for a facilitated process. Journal of Lipid Research, 39(12), 2309–2318.
Adipose tissue. In: Encyclopedia of Sports Medicine and Science - Google Scholar. (n.d.).
Retrieved July 9, 2013, from
http://scholar.google.com/scholar?q=Adipose+tissue.+In%3A+Encyclopedia+of+Sports+
Medicine+and+Science&btnG=&hl=en&as_sdt=0%2C32
Andreasen, C. H., Stender-Petersen, K. L., Mogensen, M. S., Torekov, S. S., Wegner, L., Andersen,
G., … Hansen, T. (2008a). Low Physical Activity Accentuates the Effect of the FTO
rs9939609 Polymorphism on Body Fat Accumulation. Diabetes, 57(1), 95–101.
doi:10.2337/db07-0910
Andreasen, C. H., Stender-Petersen, K. L., Mogensen, M. S., Torekov, S. S., Wegner, L., Andersen,
G., … Hansen, T. (2008b). Low Physical Activity Accentuates the Effect of the FTO
rs9939609 Polymorphism on Body Fat Accumulation. Diabetes, 57(1), 95–101.
doi:10.2337/db07-0910
Anthonsen, M. W., Rönnstrand, L., Wernstedt, C., Degerman, E., & Holm, C. (1998).
Identification of Novel Phosphorylation Sites in Hormone-sensitive Lipase That Are
Phosphorylated in Response to Isoproterenol and Govern Activation Properties in Vitro.
Journal of Biological Chemistry, 273(1), 215–221. doi:10.1074/jbc.273.1.215
Assessing Your Weight and Health Risk. (n.d.-a). Retrieved July 9, 2013, from
http://www.nhlbi.nih.gov/health/public/heart/obesity/lose_wt/risk.htm#limitations
45
Assessing Your Weight and Health Risk. (n.d.-b). Retrieved July 9, 2013, from
http://www.nhlbi.nih.gov/health/public/heart/obesity/lose_wt/risk.htm
Bastard, J.-P., Jardel, C., Bruckert, E., Blondy, P., Capeau, J., Laville, M., … Hainque, B. (2000).
Elevated Levels of Interleukin 6 Are Reduced in Serum and Subcutaneous Adipose Tissue
of Obese Women after Weight Loss. Journal of Clinical Endocrinology & Metabolism,
85(9), 3338–3342. doi:10.1210/jc.85.9.3338
Bastard, J.-P., Maachi, M., Nhieu, J. T. van, Jardel, C., Bruckert, E., Grimaldi, A., … Hainque, B.
(2002). Adipose Tissue IL-6 Content Correlates with Resistance to Insulin Activation of
Glucose Uptake both in Vivo and in Vitro. Journal of Clinical Endocrinology &
Metabolism, 87(5), 2084–2089. doi:10.1210/jc.87.5.2084
Bertrand, H. A., Masoro, E. J., & YU, B. P. (1980). Maintenance of glucagon-promoted lipolysis in
adipocytes by food restriction. Endocrinology, 107(2), 591–595.
Bray, G. A., & Popkin, B. M. (1998). Dietary fat intake does affect obesity! The American journal
of clinical nutrition, 68(6), 1157–1173.
Brubaker, P. L., & Drucker, D. J. (2002). Structure-function of the glucagon receptor family of G
protein-coupled receptors: the glucagon, GIP, GLP-1, and GLP-2 receptors. Receptors
and Channels, 8(3-4), 179–188.
Chaves, V. E., Frasson, D., & Kawashita, N. H. (2011a). Several agents and pathways regulate
lipolysis in adipocytes. Biochimie, 93(10), 1631–1640.
Chaves, V. E., Frasson, D., & Kawashita, N. H. (2011b). Several agents and pathways regulate
lipolysis in adipocytes. Biochimie, 93(10), 1631–1640.
Chen, X., Xun, K., Chen, L., & Wang, Y. (2009a). TNF-α, a potent lipid metabolism regulator. Cell
Biochemistry and Function, 27(7), 407–416. doi:10.1002/cbf.1596
46
Chen, X., Xun, K., Chen, L., & Wang, Y. (2009b). TNF-alpha, a potent lipid metabolism regulator.
Cell biochemistry and function, 27(7), 407–416. doi:10.1002/cbf.1596
Chen, X.-H., Zhao, Y.-P., Xue, M., Ji, C.-B., Gao, C.-L., Zhu, J.-G., … Tong, M.-L. (2010a). TNF-α
induces mitochondrial dysfunction in 3T3-L1 adipocytes. Molecular and cellular
endocrinology, 328(1), 63–69.
Chen, X.-H., Zhao, Y.-P., Xue, M., Ji, C.-B., Gao, C.-L., Zhu, J.-G., … Tong, M.-L. (2010b). TNF-α
induces mitochondrial dysfunction in 3T3-L1 adipocytes. Molecular and cellular
endocrinology, 328(1), 63–69.
Clark, H. R., Goyder, E., Bissell, P., Blank, L., & Peters, J. (2007). How do parents’ child-feeding
behaviours influence child weight? Implications for childhood obesity policy. Journal of
public health (Oxford, England), 29(2), 132–141. doi:10.1093/pubmed/fdm012
Craig, B. W., Garthwaite, S. M., & Holloszy, J. O. (1987). Adipocyte insulin resistance: effects of
aging, obesity, exercise, and food restriction. Journal of applied physiology (Bethesda,
Md.: 1985), 62(1), 95–100.
Degerman, E., Landström, T. R., Wijkander, J., Holst, L. S., Ahmad, F., Belfrage, P., & Manganiello,
V. (1998). Phosphorylation and Activation of Hormone-Sensitive Adipocyte
Phosphodiesterase Type 3B. Methods, 14(1), 43–53. doi:10.1006/meth.1997.0564
Dietz, W H, Jr, & Gortmaker, S. L. (1985). Do we fatten our children at the television set? Obesity
and television viewing in children and adolescents. Pediatrics, 75(5), 807–812.
Dietz, William H., & Gortmaker, S. L. (1985). Do We Fatten Our Children at the Television Set?
Obesity and Television Viewing in Children and Adolescents. Pediatrics, 75(5), 807–812.
Donahoo, W. T., Levine, J. A., & Melanson, E. L. (2004a). Variability in energy expenditure and its
components. Current Opinion in Clinical Nutrition & Metabolic Care, 7(6), 599–605.
47
Donahoo, W. T., Levine, J. A., & Melanson, E. L. (2004b). Variability in energy expenditure and its
components. Current Opinion in Clinical Nutrition & Metabolic Care, 7(6), 599–605.
Eknoyan, G. (2008). Adolphe Quetelet (1796–1874)—the average man and indices of obesity.
Nephrology Dialysis Transplantation, 23(1), 47–51. doi:10.1093/ndt/gfm517
Feingold, K. R., Doerrler, W., Dinarello, C. A., Fiers, W., & Grunfeld, C. (1992a). Stimulation of
lipolysis in cultured fat cells by tumor necrosis factor, interleukin-1, and the interferons
is blocked by inhibition of prostaglandin synthesis. Endocrinology, 130(1), 10–16.
Feingold, K. R., Doerrler, W., Dinarello, C. A., Fiers, W., & Grunfeld, C. (1992b). Stimulation of
lipolysis in cultured fat cells by tumor necrosis factor, interleukin-1, and the interferons
is blocked by inhibition of prostaglandin synthesis. Endocrinology, 130(1), 10–16.
Foufelle, F., & Ferré, P. (2002). New perspectives in the regulation of hepatic glycolytic and
lipogenic genes by insulin and glucose: a role for the transcription factor sterol
regulatory element binding protein-1c. Biochemical Journal, 366(2), 377.
doi:10.1042/BJ20020430
Frayling, T. M., Timpson, N. J., Weedon, M. N., Zeggini, E., Freathy, R. M., Lindgren, C. M., …
McCarthy, M. I. (2007a). A Common Variant in the FTO Gene Is Associated with Body
Mass Index and Predisposes to Childhood and Adult Obesity. Science, 316(5826), 889–
894. doi:10.1126/science.1141634
Frayling, T. M., Timpson, N. J., Weedon, M. N., Zeggini, E., Freathy, R. M., Lindgren, C. M., …
McCarthy, M. I. (2007b). A Common Variant in the FTO Gene Is Associated with Body
Mass Index and Predisposes to Childhood and Adult Obesity. Science (New York, N.Y.),
316(5826), 889–894. doi:10.1126/science.1141634
Fried, S. K., Bunkin, D. A., & Greenberg, A. S. (1998). Omental and Subcutaneous Adipose Tissues
of Obese Subjects Release Interleukin-6: Depot Difference and Regulation by
48
Glucocorticoid. Journal of Clinical Endocrinology & Metabolism, 83(3), 847–850.
doi:10.1210/jc.83.3.847
Gaesser, G. A. (2007). Carbohydrate Quantity and Quality in Relation to Body Mass Index.
Journal of the American Dietetic Association, 107(10), 1768–1780.
doi:10.1016/j.jada.2007.07.011
Galic, S., Oakhill, J. S., & Steinberg, G. R. (2010a). Adipose tissue as an endocrine organ.
Molecular and cellular endocrinology, 316(2), 129–139.
Galic, S., Oakhill, J. S., & Steinberg, G. R. (2010b). Adipose tissue as an endocrine organ.
Molecular and cellular endocrinology, 316(2), 129–139.
Galic, S., Oakhill, J. S., & Steinberg, G. R. (2010c). Adipose tissue as an endocrine organ.
Molecular and cellular endocrinology, 316(2), 129–139.
Galic, S., Oakhill, J. S., & Steinberg, G. R. (2010d). Adipose tissue as an endocrine organ.
Molecular and Cellular Endocrinology, 316(2), 129–139. doi:10.1016/j.mce.2009.08.018
Galic, S., Oakhill, J. S., & Steinberg, G. R. (2010e). Adipose tissue as an endocrine organ.
Molecular and Cellular Endocrinology, 316(2), 129–139. doi:10.1016/j.mce.2009.08.018
Galic, S., Oakhill, J. S., & Steinberg, G. R. (2010f). Adipose tissue as an endocrine organ.
Molecular and cellular endocrinology, 316(2), 129–139.
Garver, W. S., Heidenreich, R. A., Erickson, R. P., Thomas, M. A., & Wilson, J. M. (2000).
Localization of the murine Niemann-Pick C1 protein to two distinct intracellular
compartments. Journal of Lipid Research, 41(5), 673–687.
Glueck, C. J., Fontaine, R. N., Wang, P., Subbiah, M. T., Weber, K., Illig, E., … McCullough, P.
(2001). Metformin reduces weight, centripetal obesity, insulin, leptin, and low-density
lipoprotein cholesterol in nondiabetic, morbidly obese subjects with body mass index
49
greater than 30. Metabolism: clinical and experimental, 50(7), 856–861.
doi:10.1053/meta.2001.24192
Hankey, C. R., Eley, S., Leslie, W. S., Hunter, C. M., & Lean, M. E. J. (2004). Eating habits, beliefs,
attitudes and knowledge among health professionals regarding the links between
obesity, nutrition and health. Public health nutrition, 7(2), 337–343.
doi:10.1079/PHN2003526
Healthy Weight: Assessing Your Weight: Body Mass Index (BMI) | DNPAO | CDC. (n.d.).
Retrieved July 9, 2013, from http://www.cdc.gov/healthyweight/assessing/bmi/
HECKEMEYER, C. M., BARKER, J., DUCKWORTH, W. C., & SOLOMON, S. S. (1983). Studies of the
biological effect and degradation of glucagon in the rat perifused isolated adipose cell.
Endocrinology, 113(1), 270–276.
Hems, D. A., Rath, E. A., & Verrinder, T. R. (1975). Fatty acid synthesis in liver and adipose tissue
of normal and genetically obese (ob/ob) mice during the 24-hour cycle. Biochemical
Journal, 150(2), 167–173.
Higgins, M. E., Davies, J. P., Chen, F. W., & Ioannou, Y. A. (1999). Niemann–Pick C1 is a late
endosome-resident protein that transiently associates with lysosomes and the trans-
Golgi network. Molecular genetics and metabolism, 68(1), 1–13.
Hotamisligil, G. S., Shargill, N. S., & Spiegelman, B. M. (1993). Adipose expression of tumor
necrosis factor-alpha: direct role in obesity-linked insulin resistance. Science, 259(5091),
87–91.
Hunt, S. C., Stone, S., Xin, Y., Scherer, C. A., Magness, C. L., Iadonato, S. P., … Adams, T. D.
(2008a). Association of the FTO Gene With BMI. Obesity, 16(4), 902–904.
doi:10.1038/oby.2007.126
50
Hunt, S. C., Stone, S., Xin, Y., Scherer, C. A., Magness, C. L., Iadonato, S. P., … Adams, T. D.
(2008b). Association of the FTO gene with BMI. Obesity (Silver Spring, Md.), 16(4), 902–
904. doi:10.1038/oby.2007.126
Jaime, P. C., & Lock, K. (2009). Do school based food and nutrition policies improve diet and
reduce obesity? Preventive medicine, 48(1), 45–53. doi:10.1016/j.ypmed.2008.10.018
Jaworski, K., Sarkadi-Nagy, E., Duncan, R. E., Ahmadian, M., & Sul, H. S. (2007a). Regulation of
Triglyceride Metabolism.IV. Hormonal regulation of lipolysis in adipose tissue. American
Journal of Physiology - Gastrointestinal and Liver Physiology, 293(1), G1–G4.
doi:10.1152/ajpgi.00554.2006
Jaworski, K., Sarkadi-Nagy, E., Duncan, R. E., Ahmadian, M., & Sul, H. S. (2007b). Regulation of
Triglyceride Metabolism.IV. Hormonal regulation of lipolysis in adipose tissue. American
Journal of Physiology - Gastrointestinal and Liver Physiology, 293(1), G1–G4.
doi:10.1152/ajpgi.00554.2006
Jaworski, K., Sarkadi-Nagy, E., Duncan, R. E., Ahmadian, M., & Sul, H. S. (2007c). Regulation of
Triglyceride Metabolism.IV. Hormonal regulation of lipolysis in adipose tissue. American
Journal of Physiology - Gastrointestinal and Liver Physiology, 293(1), G1–G4.
doi:10.1152/ajpgi.00554.2006
Jaworski, K., Sarkadi-Nagy, E., Duncan, R. E., Ahmadian, M., & Sul, H. S. (2007d). Regulation of
Triglyceride Metabolism.IV. Hormonal regulation of lipolysis in adipose tissue. American
Journal of Physiology - Gastrointestinal and Liver Physiology, 293(1), G1–G4.
doi:10.1152/ajpgi.00554.2006
Jaworski, K., Sarkadi-Nagy, E., Duncan, R. E., Ahmadian, M., & Sul, H. S. (2007e). Regulation of
Triglyceride Metabolism. IV. Hormonal regulation of lipolysis in adipose tissue. American
51
journal of physiology. Gastrointestinal and liver physiology, 293(1), G1–G4.
doi:10.1152/ajpgi.00554.2006
Jaworski, K., Sarkadi-Nagy, E., Duncan, R. E., Ahmadian, M., & Sul, H. S. (2007f). Regulation of
Triglyceride Metabolism.IV. Hormonal regulation of lipolysis in adipose tissue. American
Journal of Physiology - Gastrointestinal and Liver Physiology, 293(1), G1–G4.
doi:10.1152/ajpgi.00554.2006
Jaworski, K., Sarkadi-Nagy, E., Duncan, R. E., Ahmadian, M., & Sul, H. S. (2007g). Regulation of
Triglyceride Metabolism. IV. Hormonal regulation of lipolysis in adipose tissue. American
journal of physiology. Gastrointestinal and liver physiology, 293(1), G1–G4.
doi:10.1152/ajpgi.00554.2006
Jelinek, D., Castillo, J. J., Richardson, L. M., Luo, L., Heidenreich, R. A., & Garver, W. S. (2012a).
The Niemann-Pick C1 gene is downregulated in livers of C57BL/6J mice by dietary fatty
acids, but not dietary cholesterol, through feedback inhibition of the SREBP pathway.
The Journal of nutrition, 142(11), 1935–1942.
Jelinek, D., Castillo, J. J., Richardson, L. M., Luo, L., Heidenreich, R. A., & Garver, W. S. (2012b).
The Niemann-Pick C1 Gene Is Downregulated in Livers of C57BL/6J Mice by Dietary Fatty
Acids, but Not Dietary Cholesterol, through Feedback Inhibition of the SREBP Pathway.
The Journal of Nutrition, 142(11), 1935–1942. doi:10.3945/jn.112.162818
Jelinek, D., Heidenreich, R. A., Erickson, R. P., & Garver, W. S. (2009). Decreased Npc1 Gene
Dosage in Mice Is Associated With Weight Gain. Obesity, 18(7), 1457–1459.
doi:10.1038/oby.2009.415
Jelinek, D., Heidenreich, R. A., Erickson, R. P., & Garver, W. S. (2010a). Decreased Npc1 Gene
Dosage in Mice Is Associated With Weight Gain. Obesity (Silver Spring, Md.), 18(7),
1457–1459. doi:10.1038/oby.2009.415
52
Jelinek, D., Heidenreich, R. A., Erickson, R. P., & Garver, W. S. (2010b). Decreased Npc1 Gene
Dosage in Mice Is Associated With Weight Gain. Obesity (Silver Spring, Md.), 18(7),
1457–1459. doi:10.1038/oby.2009.415
Jelinek, D., Heidenreich, R. A., Erickson, R. P., & Garver, W. S. (2010c). Decreased Npc1 gene
dosage in mice is associated with weight gain. Obesity (Silver Spring, Md.), 18(7), 1457–
1459. doi:10.1038/oby.2009.415
Jelinek, D., Heidenreich, R. A., Erickson, R. P., & Garver, W. S. (2010d). Decreased Npc1 gene
dosage in mice is associated with weight gain. Obesity (Silver Spring, Md.), 18(7), 1457–
1459. doi:10.1038/oby.2009.415
Ji, C., Chen, X., Gao, C., Jiao, L., Wang, J., Xu, G., … Zhao, Y. (2011a). IL-6 induces lipolysis and
mitochondrial dysfunction, but does not affect insulin-mediated glucose transport in
3T3-L1 adipocytes. Journal of bioenergetics and biomembranes, 43(4), 367–375.
Ji, C., Chen, X., Gao, C., Jiao, L., Wang, J., Xu, G., … Zhao, Y. (2011b). IL-6 induces lipolysis and
mitochondrial dysfunction, but does not affect insulin-mediated glucose transport in
3T3-L1 adipocytes. Journal of Bioenergetics and Biomembranes, 43(4), 367–375.
doi:10.1007/s10863-011-9361-8
Ji, C., Chen, X., Gao, C., Jiao, L., Wang, J., Xu, G., … Zhao, Y. (2011c). IL-6 induces lipolysis and
mitochondrial dysfunction, but does not affect insulin-mediated glucose transport in
3T3-L1 adipocytes. Journal of bioenergetics and biomembranes, 43(4), 367–375.
doi:10.1007/s10863-011-9361-8
Ji, C., Chen, X., Gao, C., Jiao, L., Wang, J., Xu, G., … Zhao, Y. (2011d). IL-6 induces lipolysis and
mitochondrial dysfunction, but does not affect insulin-mediated glucose transport in
3T3-L1 adipocytes. Journal of bioenergetics and biomembranes, 43(4), 367–375.
53
Kanda, H., Tateya, S., Tamori, Y., Kotani, K., Hiasa, K., Kitazawa, R., … Kasuga, M. (2006). MCP-1
contributes to macrophage infiltration into adipose tissue, insulin resistance, and
hepatic steatosis in obesity. Journal of Clinical Investigation, 116(6), 1494–1505.
doi:10.1172/JCI26498
Kant, A. K., & Graubard, B. I. (2006a). Secular trends in patterns of self-reported food
consumption of adult Americans: NHANES 1971-1975 to NHANES 1999–2002. The
American Journal of Clinical Nutrition, 84(5), 1215–1223.
Kant, A. K., & Graubard, B. I. (2006b). Secular trends in patterns of self-reported food
consumption of adult Americans: NHANES 1971-1975 to NHANES 1999-2002. The
American journal of clinical nutrition, 84(5), 1215–1223.
Kershaw, E. E., & Flier, J. S. (2004a). Adipose Tissue as an Endocrine Organ. Journal of Clinical
Endocrinology & Metabolism, 89(6), 2548–2556. doi:10.1210/jc.2004-0395
Kershaw, E. E., & Flier, J. S. (2004b). Adipose Tissue as an Endocrine Organ. Journal of Clinical
Endocrinology & Metabolism, 89(6), 2548–2556. doi:10.1210/jc.2004-0395
Koo, S.-H., Dutcher, A. K., & Towle, H. C. (2001). Glucose and Insulin Function through Two
Distinct Transcription Factors to Stimulate Expression of Lipogenic Enzyme Genes in
Liver. Journal of Biological Chemistry, 276(12), 9437–9445.
doi:10.1074/jbc.M010029200
Lamb, T. M., Goldsmith, C. S., Bennett, L., Finch, K. E., & Bell-Pedersen, D. (2011). Direct
Transcriptional Control of a p38 MAPK Pathway by the Circadian Clock in Neurospora
crassa. PLoS ONE, 6(11). doi:10.1371/journal.pone.0027149
Langin, D. (2006a). Adipose tissue lipolysis as a metabolic pathway to define pharmacological
strategies against obesity and the metabolic syndrome. Pharmacological Research,
53(6), 482–491.
54
Langin, D. (2006b). Adipose tissue lipolysis as a metabolic pathway to define pharmacological
strategies against obesity and the metabolic syndrome. Pharmacological research: the
official journal of the Italian Pharmacological Society, 53(6), 482–491.
doi:10.1016/j.phrs.2006.03.009
Langin, D., & Arner, P. (2006a). Importance of TNFα and neutral lipases in human adipose tissue
lipolysis. Trends in Endocrinology & Metabolism, 17(8), 314–320.
doi:10.1016/j.tem.2006.08.003
Langin, D., & Arner, P. (2006b). Importance of TNFα and neutral lipases in human adipose tissue
lipolysis. Trends in Endocrinology & Metabolism, 17(8), 314–320.
doi:10.1016/j.tem.2006.08.003
Large, V., Peroni, O., Letexier, D., Ray, H., & Beylot, M. (2004a). Metabolism of lipids in human
white adipocyte. Diabetes & Metabolism, 30(4), 294–309. doi:10.1016/S1262-
3636(07)70121-0
Large, V., Peroni, O., Letexier, D., Ray, H., & Beylot, M. (2004b). Metabolism of lipids in human
white adipocyte. Diabetes & Metabolism, 30(4), 294–309. doi:10.1016/S1262-
3636(07)70121-0
Large, V., Peroni, O., Letexier, D., Ray, H., & Beylot, M. (2004c). Metabolism of lipids in human
white adipocyte. Diabetes & Metabolism, 30(4), 294–309. doi:10.1016/S1262-
3636(07)70121-0
Large, V., Peroni, O., Letexier, D., Ray, H., & Beylot, M. (2004d). Metabolism of lipids in human
white adipocyte. Diabetes & Metabolism, 30(4), 294–309. doi:10.1016/S1262-
3636(07)70121-0
Large, V., Peroni, O., Letexier, D., Ray, H., & Beylot, M. (2004e). Metabolism of lipids in human
white adipocyte. Diabetes & metabolism, 30(4), 294–309.
55
Large, V., Peroni, O., Letexier, D., Ray, H., & Beylot, M. (2004f). Metabolism of lipids in human
white adipocyte. Diabetes & metabolism, 30(4), 294–309.
Larqué, E., Krauss-Etschmann, S., Campoy, C., Hartl, D., Linde, J., Klingler, M., … Koletzko, B.
(2006). Docosahexaenoic acid supply in pregnancy affects placental expression of fatty
acid transport proteins. The American Journal of Clinical Nutrition, 84(4), 853–861.
Lass, A., Zimmermann, R., Oberer, M., & Zechner, R. (2011a). Lipolysis – A highly regulated multi-
enzyme complex mediates the catabolism of cellular fat stores. Progress in Lipid
Research, 50(1), 14–27. doi:10.1016/j.plipres.2010.10.004
Lass, A., Zimmermann, R., Oberer, M., & Zechner, R. (2011b). Lipolysis – A highly regulated
multi-enzyme complex mediates the catabolism of cellular fat stores. Progress in Lipid
Research, 50(1), 14–27. doi:10.1016/j.plipres.2010.10.004
Lass, A., Zimmermann, R., Oberer, M., & Zechner, R. (2011c). Lipolysis - a highly regulated multi-
enzyme complex mediates the catabolism of cellular fat stores. Progress in lipid
research, 50(1), 14–27. doi:10.1016/j.plipres.2010.10.004
Liscum, L., Ruggiero, R. M., & Faust, J. R. (1989). The intracellular transport of low density
lipoprotein-derived cholesterol is defective in Niemann-Pick type C fibroblasts. The
Journal of Cell Biology, 108(5), 1625–1636. doi:10.1083/jcb.108.5.1625
Lissner, L., & Heitmann, B. L. (1995). Dietary fat and obesity: evidence from epidemiology.
European journal of clinical nutrition, 49(2), 79–90.
Livak, K. J. (1997). ABI Prism 7700 sequence detection system. User bulletin, 2, 1–36.
Maeda, K., Uysal, K. T., Makowski, L., Görgün, C. Z., Atsumi, G., Parker, R. A., … Hotamisligil, G. S.
(2003). Role of the Fatty Acid Binding Protein mal1 in Obesity and Insulin Resistance.
Diabetes, 52(2), 300–307. doi:10.2337/diabetes.52.2.300
56
Meyre, D., Delplanque, J., Chèvre, J.-C., Lecoeur, C., Lobbens, S., Gallina, S., … Froguel, P.
(2009a). Genome-wide association study for early-onset and morbid adult obesity
identifies three new risk loci in European populations. Nature Genetics, 41(2), 157–159.
doi:10.1038/ng.301
Meyre, D., Delplanque, J., Chèvre, J.-C., Lecoeur, C., Lobbens, S., Gallina, S., … Froguel, P.
(2009b). Genome-wide association study for early-onset and morbid adult obesity
identifies three new risk loci in European populations. Nature Genetics, 41(2), 157–159.
doi:10.1038/ng.301
Meyre, D., Delplanque, J., Chèvre, J.-C., Lecoeur, C., Lobbens, S., Gallina, S., … Froguel, P.
(2009c). Genome-wide association study for early-onset and morbid adult obesity
identifies three new risk loci in European populations. Nature Genetics, 41(2), 157–159.
doi:10.1038/ng.301
Meyre, D., Delplanque, J., Chèvre, J.-C., Lecoeur, C., Lobbens, S., Gallina, S., … Froguel, P.
(2009d). Genome-wide association study for early-onset and morbid adult obesity
identifies three new risk loci in European populations. Nature genetics, 41(2), 157–159.
doi:10.1038/ng.301
Meyre, D., Delplanque, J., Chèvre, J.-C., Lecoeur, C., Lobbens, S., Gallina, S., … Froguel, P.
(2009e). Genome-wide association study for early-onset and morbid adult obesity
identifies three new risk loci in European populations. Nature Genetics, 41(2), 157–159.
doi:10.1038/ng.301
Meyre, D., Delplanque, J., Chèvre, J.-C., Lecoeur, C., Lobbens, S., Gallina, S., … Proença, C.
(2009). Genome-wide association study for early-onset and morbid adult obesity
identifies three new risk loci in European populations. Nature genetics, 41(2), 157–159.
57
Mokdad AH, F. E. (2003). PRevalence of obesity, diabetes, and obesity-related health risk
factors, 2001. JAMA, 289(1), 76–79. doi:10.1001/jama.289.1.76
Murphy, S., Martin, S., & Parton, R. G. (2009). Lipid droplet-organelle interactions; sharing the
fats. Biochimica et Biophysica Acta (BBA) - Molecular and Cell Biology of Lipids, 1791(6),
441–447. doi:10.1016/j.bbalip.2008.07.004
Nguyen, D. M., & El-Serag, H. B. (2010a). The Epidemiology of Obesity. Gastroenterology Clinics
of North America, 39(1), 1–7. doi:10.1016/j.gtc.2009.12.014
Nguyen, D. M., & El-Serag, H. B. (2010b). The Epidemiology of Obesity. Gastroenterology clinics
of North America, 39(1), 1–7. doi:10.1016/j.gtc.2009.12.014
Niemann-Pick disease - National Library of Medicine - PubMed Health. (n.d.-a). Retrieved July 9,
2013, from http://www.ncbi.nlm.nih.gov/pubmedhealth/PMH0002187/
Niemann-Pick disease - National Library of Medicine - PubMed Health. (n.d.-b). Retrieved July 9,
2013, from http://www.ncbi.nlm.nih.gov/pubmedhealth/PMH0002187/
Nieto-Vazquez, I., Fernández-Veledo, S., Krämer, D. K., Vila-Bedmar, R., Garcia-Guerra, L., &
Lorenzo, M. (2008). Insulin resistance associated to obesity: the link TNF-alpha. Archives
Of Physiology And Biochemistry, 114(3), 183–194. doi:10.1080/13813450802181047
NIH Categorical Spending -NIH Research Portfolio Online Reporting Tools (RePORT). (n.d.).
Retrieved July 9, 2013, from http://report.nih.gov/categorical_spending.aspx
Obesity and Overweight for Professionals: Adult: Defining - DNPAO - CDC. (n.d.). Retrieved July
9, 2013, from http://www.cdc.gov/obesity/adult/defining.html
Obesity and Overweight for Professionals: Data and Statistics: Adult Obesity - DNPAO - CDC.
(n.d.-a). Retrieved July 9, 2013, from http://www.cdc.gov/obesity/data/adult.html
Obesity and Overweight for Professionals: Data and Statistics: Adult Obesity - DNPAO - CDC.
(n.d.-b). Retrieved July 10, 2013, from http://www.cdc.gov/obesity/data/adult.html
58
Obesity: MedlinePlus. (n.d.). Retrieved July 9, 2013, from
http://www.nlm.nih.gov/medlineplus/obesity.html
Olofsson, S.-O., Boström, P., Andersson, L., Rutberg, M., Levin, M., Perman, J., & Borén, J. (2008).
Triglyceride containing lipid droplets and lipid droplet-associated proteins. Current
Opinion in Lipidology, 19(5), 441–447. doi:10.1097/MOL.0b013e32830dd09b
Patterson, M. C., Hendriksz, C. J., Walterfang, M., Sedel, F., Vanier, M. T., & Wijburg, F. (2012a).
Recommendations for the diagnosis and management of Niemann–Pick disease type C:
An update. Molecular genetics and metabolism, 106(3), 330–344.
Patterson, M. C., Hendriksz, C. J., Walterfang, M., Sedel, F., Vanier, M. T., & Wijburg, F. (2012b).
Recommendations for the diagnosis and management of Niemann–Pick disease type C:
An update. Molecular genetics and metabolism, 106(3), 330–344.
Pelsers, M. M. A. L., Stellingzoerff, T., & Van Loon, L. J. C. (2008a). The Role of Membrane Fatty-
Acid Transporters in Regulating Skeletal Muscle Substrate Use during Exercise. Sports
Medicine, 38(5), 387–399.
Pelsers, M. M. A. L., Stellingzoerff, T., & Van Loon, L. J. C. (2008b). The Role of Membrane Fatty-
Acid Transporters in Regulating Skeletal Muscle Substrate Use during Exercise. Sports
Medicine, 38(5), 387–399.
Perez-Martinez, P., Perez-Jimenez, F., & Lopez-Miranda, J. (2010a). n-3 PUFA and lipotoxicity.
Biochimica et Biophysica Acta (BBA) - Molecular and Cell Biology of Lipids, 1801(3), 362–
366. doi:10.1016/j.bbalip.2009.09.010
Perez-Martinez, P., Perez-Jimenez, F., & Lopez-Miranda, J. (2010b). < i> n</i>-3 PUFA and
lipotoxicity. Biochimica et Biophysica Acta (BBA)-Molecular and Cell Biology of Lipids,
1801(3), 362–366.
59
Perreault, M., & Marette, A. (2001). Targeted disruption of inducible nitric oxide synthase
protects against obesity-linked insulin resistance in muscle. Nature medicine, 7(10),
1138–1143.
Popkin, B. M., & Gordon-Larsen, P. (2004). The nutrition transition: worldwide obesity dynamics
and their determinants. International journal of obesity and related metabolic disorders:
journal of the International Association for the Study of Obesity, 28 Suppl 3, S2–9.
doi:10.1038/sj.ijo.0802804
Preiss-Landl, K., Zimmermann, R., Hämmerle, G., & Zechner, R. (2002). Lipoprotein lipase: the
regulation of tissue specific expression and its role in lipid and energy metabolism.
Current opinion in lipidology, 13(5), 471–481.
Prentice, A. M., & Jebb, S. A. (1995). Obesity in Britain: gluttony or sloth? BMJ : British Medical
Journal, 311(7002), 437–439.
Prentice, Andrew M., & Jebb, S. A. (1995). Obesity in Britain: gluttony or sloth? BMJ: British
Medical Journal, 311(7002), 437.
Rankinen, T., Zuberi, A., Chagnon, Y. C., Weisnagel, S. J., Argyropoulos, G., Walts, B., … Bouchard,
C. (2006). The Human Obesity Gene Map: The 2005 Update. Obesity, 14(4), 529–644.
doi:10.1038/oby.2006.71
Riccardi, G., Giacco, R., & Rivellese, A. . (2004). Dietary fat, insulin sensitivity and the metabolic
syndrome. Clinical Nutrition, 23(4), 447–456. doi:10.1016/j.clnu.2004.02.006
Samad, F., Yamamoto, K., Pandey, M., & Loskutoff, D. J. (1997). Elevated expression of
transforming growth factor-beta in adipose tissue from obese mice. Molecular
Medicine, 3(1), 37–48.
60
Sartipy, P., & Loskutoff, D. J. (2003). Monocyte chemoattractant protein 1 in obesity and insulin
resistance. Proceedings of the National Academy of Sciences of the United States of
America, 100(12), 7265–7270. doi:10.1073/pnas.1133870100
Schaffer, J. E. (2003a). Lipotoxicity: when tissues overeat. Current opinion in lipidology, 14(3),
281–287.
Schaffer, J. E. (2003b). Lipotoxicity: when tissues overeat. Current opinion in lipidology, 14(3),
281–287.
Schleich, S., & Teleman, A. A. (2009). Akt Phosphorylates Both Tsc1 and Tsc2 in Drosophila, but
Neither Phosphorylation Is Required for Normal Animal Growth. PLoS ONE, 4(7).
doi:10.1371/journal.pone.0006305
Souza, S C, de Vargas, L. M., Yamamoto, M. T., Lien, P., Franciosa, M. D., Moss, L. G., &
Greenberg, A. S. (1998). Overexpression of perilipin A and B blocks the ability of tumor
necrosis factor alpha to increase lipolysis in 3T3-L1 adipocytes. The Journal of biological
chemistry, 273(38), 24665–24669.
Souza, Sandra C., Vargas, L. M. de, Yamamoto, M. T., Lien, P., Franciosa, M. D., Moss, L. G., &
Greenberg, A. S. (1998). Overexpression of Perilipin A and B Blocks the Ability of Tumor
Necrosis Factor α to Increase Lipolysis in 3T3-L1 Adipocytes. Journal of Biological
Chemistry, 273(38), 24665–24669. doi:10.1074/jbc.273.38.24665
Stahl, A. (2004). A current review of fatty acid transport proteins (SLC27). Pflügers Archiv,
447(5), 722–727. doi:10.1007/s00424-003-1106-z
Styer, L., Tymoczko, J., & Berg, J. (2011). Biochemistry: a Short Course. W H Freeman & Co.
Subramanian, V., Rothenberg, A., Gomez, C., Cohen, A. W., Garcia, A., Bhattacharyya, S., …
Brasaemle, D. L. (2004a). Perilipin A Mediates the Reversible Binding of CGI-58 to Lipid
61
Droplets in 3T3-L1 Adipocytes. Journal of Biological Chemistry, 279(40), 42062–42071.
doi:10.1074/jbc.M407462200
Subramanian, V., Rothenberg, A., Gomez, C., Cohen, A. W., Garcia, A., Bhattacharyya, S., …
Brasaemle, D. L. (2004b). Perilipin A Mediates the Reversible Binding of CGI-58 to Lipid
Droplets in 3T3-L1 Adipocytes. Journal of Biological Chemistry, 279(40), 42062–42071.
doi:10.1074/jbc.M407462200
Subramanian, V., Rothenberg, A., Gomez, C., Cohen, A. W., Garcia, A., Bhattacharyya, S., …
Brasaemle, D. L. (2004c). Perilipin A mediates the reversible binding of CGI-58 to lipid
droplets in 3T3-L1 adipocytes. The Journal of biological chemistry, 279(40), 42062–
42071. doi:10.1074/jbc.M407462200
Unger, R. H. (2002a). Lipotoxic Diseases. Annual Review of Medicine, 53(1), 319–336.
doi:10.1146/annurev.med.53.082901.104057
Unger, R. H. (2002b). Lipotoxic Diseases. Annual Review of Medicine, 53(1), 319–336.
doi:10.1146/annurev.med.53.082901.104057
Van Dam, R. M., & Seidell, J. C. (2007). Carbohydrate intake and obesity. European Journal of
Clinical Nutrition, 61(S1), S75–S99. doi:10.1038/sj.ejcn.1602939
Vanier, M. T. (2010). Niemann-Pick disease type C. Orphanet Journal of Rare Diseases, 5, 16.
doi:10.1186/1750-1172-5-16
Vgontzas, A. N., Papanicolaou, D. A., Bixler, E. O., Kales, A., Tyson, K., & Chrousos, G. P. (1997).
Elevation of Plasma Cytokines in Disorders of Excessive Daytime Sleepiness: Role of
Sleep Disturbance and Obesity. Journal of Clinical Endocrinology & Metabolism, 82(5),
1313–1316. doi:10.1210/jc.82.5.1313
Visser M, B. L. (1999). ELevated c-reactive protein levels in overweight and obese adults. JAMA,
282(22), 2131–2135. doi:10.1001/jama.282.22.2131
62
Wang, H., Bell, M., Sreenevasan, U., Hu, H., Liu, J., Dalen, K., … Sztalryd, C. (2011). Unique
Regulation of Adipose Triglyceride Lipase (ATGL) by Perilipin 5, a Lipid Droplet-
associated Protein. Journal of Biological Chemistry, 286(18), 15707–15715.
doi:10.1074/jbc.M110.207779
Wang, H., & Eckel, R. H. (2009). Lipoprotein lipase: from gene to obesity. American Journal of
Physiology - Endocrinology And Metabolism, 297(2), E271–E288.
doi:10.1152/ajpendo.90920.2008
Weisberg, S. P., McCann, D., Desai, M., Rosenbaum, M., Leibel, R. L., & Ferrante, A. W. (2003a).
Obesity is associated with macrophage accumulation in adipose tissue. Journal of
Clinical Investigation, 112(12), 1796–1808. doi:10.1172/JCI200319246
Weisberg, S. P., McCann, D., Desai, M., Rosenbaum, M., Leibel, R. L., & Ferrante, A. W. (2003b).
Obesity is associated with macrophage accumulation in adipose tissue. Journal of
Clinical Investigation, 112(12), 1796–1808. doi:10.1172/JCI200319246
Weisberg, S. P., McCann, D., Desai, M., Rosenbaum, M., Leibel, R. L., & Ferrante, A. W., Jr.
(2003c). Obesity is associated with macrophage accumulation in adipose tissue. The
Journal of clinical investigation, 112(12), 1796–1808. doi:10.1172/JCI19246
Wellen, K. E., & Hotamisligil, G. S. (2003). Obesity-induced inflammatory changes in adipose
tissue. Journal of Clinical Investigation, 112(12), 1785–1788. doi:10.1172/JCI200320514
Westerterp, K. R. (2004). Diet induced thermogenesis. Nutrition & Metabolism, 1(1), 5.
doi:10.1186/1743-7075-1-5
Weyer, C., Yudkin, J. S., Stehouwer, C. D., Schalkwijk, C. G., Pratley, R. E., & Tataranni, P. A.
(2002). Humoral markers of inflammation and endothelial dysfunction in relation to
adiposity and in vivo insulin action in Pima Indians. Atherosclerosis, 161(1), 233–242.
63
Xu, H., Barnes, G. T., Yang, Q., Tan, G., Yang, D., Chou, C. J., … Chen, H. (2003a). Chronic
inflammation in fat plays a crucial role in the development of obesity-related insulin
resistance. Journal of Clinical Investigation, 112(12), 1821–1830.
doi:10.1172/JCI200319451
Xu, H., Barnes, G. T., Yang, Q., Tan, G., Yang, D., Chou, C. J., … Chen, H. (2003b). Chronic
inflammation in fat plays a crucial role in the development of obesity-related insulin
resistance. Journal of Clinical Investigation, 112(12), 1821–1830.
doi:10.1172/JCI200319451
Xu, H., Barnes, G. T., Yang, Q., Tan, G., Yang, D., Chou, C. J., … Chen, H. (2003c). Chronic
inflammation in fat plays a crucial role in the development of obesity-related insulin
resistance. Journal of Clinical Investigation, 112(12), 1821–1830.
doi:10.1172/JCI200319451
Zechner, R., Kienesberger, P. C., Haemmerle, G., Zimmermann, R., & Lass, A. (2009a). Adipose
triglyceride lipase and the lipolytic catabolism of cellular fat stores. Journal of Lipid
Research, 50(1), 3–21. doi:10.1194/jlr.R800031-JLR200
Zechner, R., Kienesberger, P. C., Haemmerle, G., Zimmermann, R., & Lass, A. (2009b). Adipose
triglyceride lipase and the lipolytic catabolism of cellular fat stores. Journal of Lipid
Research, 50(1), 3–21. doi:10.1194/jlr.R800031-JLR200
Zechner, R., Kienesberger, P. C., Haemmerle, G., Zimmermann, R., & Lass, A. (2009c). Adipose
triglyceride lipase and the lipolytic catabolism of cellular fat stores. Journal of Lipid
Research, 50(1), 3–21. doi:10.1194/jlr.R800031-JLR200
Zechner, R., Kienesberger, P. C., Haemmerle, G., Zimmermann, R., & Lass, A. (2009d). Adipose
triglyceride lipase and the lipolytic catabolism of cellular fat stores. Journal of Lipid
Research, 50(1), 3–21. doi:10.1194/jlr.R800031-JLR200
64
Zechner, R., Kienesberger, P. C., Haemmerle, G., Zimmermann, R., & Lass, A. (2009e). Adipose
triglyceride lipase and the lipolytic catabolism of cellular fat stores. Journal of lipid
research, 50(1), 3–21. doi:10.1194/jlr.R800031-JLR200
Zechner, R., Kienesberger, P. C., Haemmerle, G., Zimmermann, R., & Lass, A. (2009f). Adipose
triglyceride lipase and the lipolytic catabolism of cellular fat stores. Journal of Lipid
Research, 50(1), 3–21. doi:10.1194/jlr.R800031-JLR200
Zechner, R., Kienesberger, P. C., Haemmerle, G., Zimmermann, R., & Lass, A. (2009g). Adipose
triglyceride lipase and the lipolytic catabolism of cellular fat stores. Journal of Lipid
Research, 50(1), 3–21. doi:10.1194/jlr.R800031-JLR200
Zhan, T., Poppelreuther, M., Ehehalt, R., & Füllekrug, J. (2012). Overexpressed FATP1,
ACSVL4/FATP4 and ACSL1 Increase the Cellular Fatty Acid Uptake of 3T3-L1 Adipocytes
but Are Localized on Intracellular Membranes. PLoS ONE, 7(9), e45087.
doi:10.1371/journal.pone.0045087
Zimmermann, R., Strauss, J. G., Haemmerle, G., Schoiswohl, G., Birner-Gruenberger, R., Riederer,
M., … Hermetter, A. (2004). Fat mobilization in adipose tissue is promoted by adipose
triglyceride lipase. Science, 306(5700), 1383–1386.