Embed Size (px)
Citation preview

2010
AOG 2010Australasia Subsea Market – Further, Deeper, Harsher
Please note, this report is referenced from Infield Systems Ltd Subsea Report 2010‐2014
Julian Callanan
Infield Systems

Infield Systems Ltd
c
© Infield Systems Ltd. 2010 2
Agenda
1. Setting the scene– Further, Deeper, Harsher...– Gas and Australia– Gas market outlookGas market outlook
2.Australia market key cnumbers
– Further– Deeperp– Harsher
01/04/2010 3© Infield Systems Ltd. 2010

Setting the scene – Macro Context
88
Production Consumption
A backdrop of growing energy
80
82
84
86
MBB
L
Energy consumption shift
consumption from an increasingly diverse regional basis meant a tight constriction between production and
i h h 2006 2008
70
72
74
76
78MM Energy consumption shift
2003 to recent recession marked a shift in global consumption patterns
consumption through 2006 to 2008.
The offshore industry reacted by oin F rther Deeper and Harsherc
70
Energy consumption shiftDriven by rise of Asian regions
going Further, Deeper and Harsher...
Energy consumption shiftSpecifically China and India key prospective gas export marketsDriven by rise of Asian regions
01/04/2010 4© Infield Systems Ltd. 2010

Setting the scene – Further...
Fields on‐stream in the 1960’s
c
01/04/2010 5© Infield Systems Ltd. 2010

Setting the scene – Further...
Fields on‐stream in the 1970’s
c
01/04/2010 6© Infield Systems Ltd. 2010

Setting the scene – Further...
Fields on‐stream in the 1980’s
c
01/04/2010 7© Infield Systems Ltd. 2010

Setting the scene – Further...
Fields on‐stream in the 1990’s
c
01/04/2010 8© Infield Systems Ltd. 2010

Setting the scene – Further...
Fields on‐stream in the 2000’s
c
01/04/2010 9© Infield Systems Ltd. 2010

Setting the scene – Further...
Future fields to come on‐stream
c
01/04/2010 10© Infield Systems Ltd. 2010

Setting the scene – Deeper...
79 81 83 85 87 89 91 93 95 97 99 01 03 05 07 09
Year On-stream
MAX AVG MIN
954
350
500
1000
197
198
198
198
198
198
199
199
199
199
199
200
200
200
200
200
pth(
m)
Average Subsea Well WaterdepthAverage Subsea well depth now 964m, with good prospects for increase.
Deepest 2009 Subsea Wells• 2126, relating to PBR Tupi EWT2743 A d k ’ Ll d Rid 050 A l (AVP)
2126
1500
2000
2500
3000
Wat
er D
ep • 2743, Anadarko’s Lloyd Ridge 050 Atlas (AVP)
2934
Deepest 2010 Subsea Wells• 2934, Shell Tobago tied into Perdido Host
cSubsea Wells On‐stream and Water Depth Trends
6000m
Mariana TrenchBottom of the Mariana trench in
Abyssal PlainIf the max waterdepth trend line is extrapolated forwards, it would take 15 more years for the deepest point on the abyssal plain (6000m) to be technically feasible.
~30 years?
Deepest spot in the world >10,000m
10.000m
01/04/2010 11© Infield Systems Ltd. 2010

Setting the scene – Harsher...
USGS estimates yet to be
discovered reserves:discovered reserves:
• 90bbl
• 1 670tcf
Russia and the Arctic• Laying flags on the sea floor?• Exploration encouraged by salary?
• 1,670tcf
c
Shtokman• Delayed for 3 years
• Lack of funding• Design challenges• Delay to Nordstream• Gas market uncertainty• Gas market uncertainty
01/04/2010 12© Infield Systems Ltd. 2010

The recession and offshore markets
The global recession had a huge impact on the offshore industry:
• Oil Price Changes• The volatility of oil price has resulted in the deferral of many projectsy p y p j
• The oil price has recently stabilised between 60 and 80 dollars a barrel
• Above the majority of field sanction prices
• Credit crunchc
Credit crunch• Lack of access to capital has lead to the deferral of projects by those operators that either
are not cash rich or are exposed to investor unbundling, such as Smaller Independents(North Sea/Asia)( / )
• Supply Chain• Over the past 3 years the offshore industry has ‘overheated’ with significant price inflation
across the sectoracross the sector
• Oil companies’ tolerance of inflation has decreased in‐line with the oil price. Resulting in thesqueeze of the supply‐chain through the delay of awards and erosion of backlogs
01/04/2010 13© Infield Systems Ltd. 2010

Impact on the subsea industry – Reduction in tree awards
• Cost appetite has decreased which has led to a decline contractaward and project execution across the supply chain.
• Subsea trees awards are a good indicator for the strength of the 400
450
500Aker Solutions Cameron Dril‐Quip FMC GEOG VetcoGray Unknown
• Subsea trees awards are a good indicator for the strength of thewider subsea/SURF market as they are critical components andhave a long (1‐2 yr) construction time so important to order early.*
• Impact of supply chain squeezing is evident in the lack of awardsduring 2009.
• Reflective of conservative approach as operators attempt to reign in costs.
• Subsea Tree Awards stand at 75% of the past 5 year average. 200
250
300
350
400
ber o
f Sub
sea Tree
s
p y g• However, many trees expected to be installed in the future have
already been awarded. This gives confidence regarding futuresubsea related installation activity.
0
50
100
150
2003 2004 2005 2006 2007 2008 2009
Num
b
c2003 2004 2005 2006 2007 2008 2009
Award Year
400
500
600
Tree
s
Not Awarded Awarded
Petrobras tree award to Cameron• 138 PBR to Cameron order crucial i k i h b hi h
Early tree orders• Some trees are held in storage by il i h l i hi
100
200
300
Num
ber o
f Sub
sea in keeping these numbers high
• Awarded market 75% of where we would expect it to be
• Without PBR market would be about 50% of historic levels
oil companies so the relationship between award and execution is not constant.
• We spend a great deal of time trying to work out which tree orders will go to which project
0
100
2005 2006 2007 2008 2009 2010 2011 2012 2013 2014
On‐Stream Year
about 50% of historic levelsorders will go to which project.
01/04/2010 14© Infield Systems Ltd. 2010

Offshore Australia and gas – prospects for early recovery?
80
90
9,000
10,000
40
50
60
70
5,000
6,000
7,000
8,000
Onstream
ion (MMCFD
)
Asian regasification plants onstream
10
20
30
40
1,000
2,000
3,000
4,000
Plants
Producti onstream
Australian Offshore Gas Production
c 00
• Asia hit hard by downturn, however looking likely to return quickly to previously high growth trend.• Australia has a key role to play in meeting this
d denergy demand• However could shifts in gas availability start to change the game?IMF data
01/04/2010 15© Infield Systems Ltd. 2010

Gas Markets – Gas PricesKey Drivers & Trends• Oil and gas prices have historically been correlated (as the orange trend line shows below). When prices are low or high, correlation is the strongest. • Today’s gas prices are anomalously low; potentially due to an increase in gas supply, coupled with a decrease in demand.
12 Q1+2 2008Commodity boom, concern about supply meeting the demand of developing countries such as India and
8
10
cf)
China mixed with militant attacks in Nigeria, Piracy in the Gulf of Aden and the War between Russia and Georgia
(Supply Threats)
c
4
6
Gas Price ($
/mc
TodayOil price recovered quickly from recent lows Gas
2
4 Oil price recovered quickly from recent lows. Gas prices much more sluggish, a market which feels like it is moving towards over‐supply?
0
0 20 40 60 80 100 120 140 160
Oli Price ($/bbl)•
16

Gas Markets ‐ Shale Gas Key Drivers & Trends• North American Shale Gas has been the largest cause of increased gas supply. This has been seen at a time of reduced gas demand, and as such has worked to lower global gas prices.
North America – Shale Gas Production• Considered a ‘game changer’ in the gas markets – Shale Gas developments have been pioneered by Independent operators in North America. •Shale gas drove US estimated natural gas reserves up by 35% to 2074 trillion cubic feet in 2008. Shale gas production is forecasted to account for a quarter of US gas by 2025, up from around 10% in 2009.• Potential of Shale Gas will ensure sufficient
cPotential of Shale Gas will ensure sufficient
US gas supply for several years.
Europe – Shale Gas Exploration• Exploration of Shale Gas potential is being carried out by larger Integrated Oil Companies (IOCs) e.g. Exxon, Conoco Phillips• Mass production of European shale gas is unlikely in the short to mid term – due to technological and geographical factors.
Asia Shale Gas Exploration
•
• Abundant LNG supply being delivered to Europe – a consequence of reduction in gas demand in US. This is helping to keep gas prices low, and in turn lowering the potential of short term shale gas developments.
Asia – Shale Gas Exploration• China; PetroChina and Sinopec are in discussions with Royal Dutch Shell and BP respectively to study shale.• India; ONGC has teamed up with Schlumberger to develop unconventional plays.
17

Gas Markets – Long Term View
Key Drivers & Trends• The recent financial crisis, coupled with the current gas prices has resulted in a number of delays and cancellations to large scale gas projects. Examples include Shtokman, Ichthys and QatarGas 4.
Oil industry having to run faster to keep pace with gas growth.
• Short term gas prices are expected to remain stable ‐ enabling continued development of most gas projects.• In the longer term; a higher proportion of global energy demand will be represented by gas. Globally, there are larger gas reserves still undeveloped, and as such increased gas production is forecast.
80,000
90,000
100,000Oil
Gas300
350
400
s
Oil
Gas
c
30,000
40,000
50,000
60,000
70,000
Reserves MMBO
E
100
150
200
250
Num
ber o
f Fields
0
10,000
20,000
2010 2011 2012 2013 2014
0
50
2005 2006 2007 2008 2009 2010 2011 2012 2013 2014
•
Description:• Offshore oil production is a more mature industry when compared to it’s gas counterpart. As such, many of the large offshore oil reserves have already been developed. In order to maintain current oil production levels, and meet expected increases in oil demand – higher numbers of oil developments will be required. • There still remain a number of large offshore gas reserves which are undeveloped and would consequently help meet the forecasted increased in gas demand.
18

Agenda
1. Setting the scene– Macro Context– Further, Deeper, Harsher...– Gas and Australia– Gas market outlook
2.Australia subsea marketc
2.Australia subsea market awards and key numbers
– Further– DeeperDeeper– Harsher
01/04/2010 19© Infield Systems Ltd. 2010
Awards
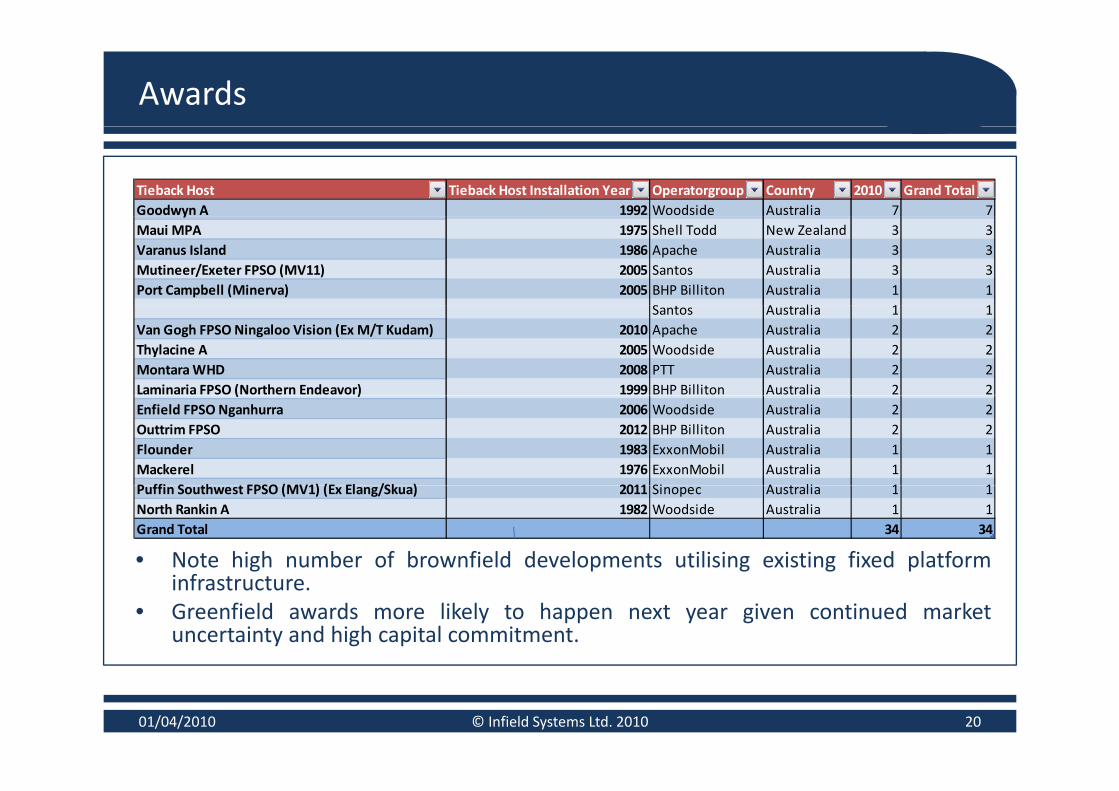
Tieback Host Tieback Host Installation Year Operatorgroup Country 2010 Grand TotalGoodwyn A 1992 Woodside Australia 7 7yMaui MPA 1975 Shell Todd New Zealand 3 3Varanus Island 1986 Apache Australia 3 3Mutineer/Exeter FPSO (MV11) 2005 Santos Australia 3 3Port Campbell (Minerva) 2005 BHP Billiton Australia 1 1
S A li 1 1Santos Australia 1 1Van Gogh FPSO Ningaloo Vision (Ex M/T Kudam) 2010 Apache Australia 2 2Thylacine A 2005 Woodside Australia 2 2Montara WHD 2008 PTT Australia 2 2Laminaria FPSO (Northern Endeavor) 1999 BHP Billiton Australia 2 2
c( )
Enfield FPSO Nganhurra 2006 Woodside Australia 2 2Outtrim FPSO 2012 BHP Billiton Australia 2 2Flounder 1983 ExxonMobil Australia 1 1Mackerel 1976 ExxonMobil Australia 1 1P ffi S th t FPSO (MV1) (E El /Sk ) 2011 Si A t li 1 1Puffin Southwest FPSO (MV1) (Ex Elang/Skua) 2011 Sinopec Australia 1 1North Rankin A 1982 Woodside Australia 1 1Grand Total 34 34
• Note high number of brownfield developments utilising existing fixed platformi finfrastructure.
• Greenfield awards more likely to happen next year given continued marketuncertainty and high capital commitment.
01/04/2010 © Infield Systems Ltd. 2010 20

Key Numbers...tale of the tape
2005‐2009 Australia Subsea Tale of the Tape 2010‐201479 Subsea Tree Installations (Units) 168
1,565 Subsea Tree Installations (US$m) 2,943153 Subsea Tree Awards (Units) 23798 Subsea Infrastructure Installations (Units) 206
c98 Subsea Infrastructure Installations (Units) 206
1,937 Subsea Infrastructure Installations (US$m) 3,617810 URF installations (km) 2,890
2,727 URF installations ($USm) 5,477824 Conventional Pipeline installations (km) 628882 Conventional Pipeline installations (US$m) 1,14038 Fields on‐stream 102
• The opportunity for those looking to contract to these markets is increased by the move intofurther, deeper waters, with harsher product.
01/04/2010 © Infield Systems Ltd. 2010 21

Further...
• Globally Australia is 3rd in terms of averagedistance between subsea installation and
• Maximum pipeline distance is alsoincreasing
1000
nearest associated infrastructure.
10
g
600
700
800
900
1000
Poseidon FPS Gas Export PLEM to Darwin LNG Terminal• 900km
R² = 0.574
6
7
8
9
10
KM
Scarborough PLEM – Exmouth Shore Terminal
Increasing average distance• Note data set includes distance from subsea installation to nearest infrastructure
c
200
300
400
500
600
2
3
4
5
Distance Shore Terminal
• 300km
0
1000
1
2005 2006 2007 2008 2009 2010 2011 2012 2013 2014 2015
Average annual distance to subsea installation from associated infrastructure
Maximum annual distance to subsea installation from associated infrastructureMaximum annual distance to subsea installation from associated infrastructure
01/04/2010 © Infield Systems Ltd. 2010 22

Deeper...
1,200
1,400
50,000
60,000Ultra‐deep
D
Deepwater Lag• Quite a long lag between Ultra‐deep water discoveries and
800
1,000
30,000
40,000
,
d Waterdp
eth (m
)
ves M
MBO
E
Deep
Shallow
Average of Water Depth (M)
Waterdepth band 2005‐2009 2010‐2014 % Change0 ‐ 300 956 2,396 151%301 1000 981 677 31%
c
200
400
600
10,000
20,000
Average
Field
Reserv (M)
Subsea Infrastructure Capex by waterdepth band
301 ‐ 1000 981 677 ‐31%1000+ 0 544 100%Grand Total 1,937 3,617 87%
00
1965
1967
1969
1971
1973
1975
1977
1979
1981
1983
1985
1987
1989
1991
1993
1995
1997
1999
2001
2003
2005
2007
2009
2011
2013
2015
2017
2019
2010Australian reserves by discovery yearNote: not offset for productionNote: not offset for production
01/04/2010 © Infield Systems Ltd. 2010 23

Harsher...
c
Storm paths around Australia 1950 ‐ 2007. Infield Systems Ltd Maps
01/04/2010 © Infield Systems Ltd. 2010 24

Conclusion
•Subsea market outlook is extremely positive for Australia
• We expect to see significant market growth in all core subsea markets, bar conventionalpipeline installation KMs
• We see in Australia, as in other offshore markets, a move towards ever more further, deeperand harsher projects.
c
01/04/2010 © Infield Systems Ltd. 2010 25

Thanks
Julian Callanan
Infield Systems
00 44 7854 095 210
c
01/04/2010 © Infield Systems Ltd. 2010 26

Disclaimer
The information contained in this document is believed to be accurate, but no representation or warranty, express or implied, is madeby Infield Systems Limited as to the completeness, accuracy or fairness of any information contained in it, and we do not accept anyy y p , y y , p yresponsibility in relation to such information whether fact, opinion or conclusion that the reader may draw. The views expressed arethose of the individual contributors and do not represent those of the publishers.
Some of the statements contained in this document are forward‐looking statements. Forward looking statements include but are notlimited to statements concerning estimates of recoverable hydrocarbons expected hydrocarbon prices expected costs numbers oflimited to, statements concerning estimates of recoverable hydrocarbons, expected hydrocarbon prices, expected costs, numbers ofdevelopment units, statements relating to the continued advancement of the industry’s projects and other statements which are nothistorical facts. When used in this document, and in other published information of the Company, the words such as "could,""estimate," "expect," "intend," "may," "potential," "should," and similar expressions are forward‐looking statements. Although theCompany believes that its expectations reflected in the forward‐looking statements are reasonable, such statements involve risk and
d b h l l ll b h h f d l kcuncertainties and no assurance can be given that actual results will be consistent with these forward‐looking statements. Variousfactors could cause actual results to differ from these forward‐looking statements including the potential for the industry’s projects toexperience technical or mechanical problems or changes in financial decisions, geological conditions in the reservoir may not result in acommercial level of oil and gas production, changes in product prices and other risks not anticipated by the Company. Since forward‐looking statements address future events and conditions, by their very nature, they involve inherent risks and uncertainties.g y y y
Copyright Infield Systems Limited 2010. Data, charts, images and information contained within this document are protected byinternational copyright and as such may not be copied, reproduced, transmitted or utilised in any form or format without the expresswritten permission of Infield Systems Limited.
01/04/2010 27© Infield Systems Ltd. 2010