Embed Size (px)
Citation preview
Inferring friendship network structureby using mobile phone dataNathan Eaglea,b,1, Alex (Sandy) Pentlandb, and David Lazerc
aSanta Fe Institute, 1399 Hyde Park Road, Santa Fe, NM 87501; bMIT Media Laboratory, Massachusetts Institute of Technology, E15–383, 20 Ames Street,Cambridge, MA 02139; and cDepartments of Political Science and Computer Science, Northeastern University, Boston, MA 02115
Edited by Susan Hanson, Clark University, Worcester, MA, and approved July 1, 2009 (received for review January 14, 2009)
Data collected from mobile phones have the potential to provideinsight into the relational dynamics of individuals. This papercompares observational data from mobile phones with standardself-report survey data. We find that the information from thesetwo data sources is overlapping but distinct. For example, self-reports of physical proximity deviate from mobile phone recordsdepending on the recency and salience of the interactions. We alsodemonstrate that it is possible to accurately infer 95% of friend-ships based on the observational data alone, where friend dyadsdemonstrate distinctive temporal and spatial patterns in theirphysical proximity and calling patterns. These behavioral patterns,in turn, allow the prediction of individual-level outcomes such asjob satisfaction.
engineering-social systems � relational inference � social network analysis �reality mining � relational scripts
The field devoted to the study of the system of humaninteractions—social network analysis—has been constrained
in accuracy, breadth, and depth because of its reliance onself-report data. Social network studies relying on self-reportrelational data typically involve both limited numbers of peopleand a limited number of time points (usually one). As a result,social network analysis has generally been limited to examiningsmall, well-bounded populations, involving a small number ofsnapshots of interaction patterns (1). Although important workhas been done over the last 30 years to analyze the relationshipbetween self-reported and observed behavior, much of the socialnetwork literature is written as if self-report data are behavioraldata.
There is, however, a small but emerging thread of researchexamining social communication patterns based on directlyobservable data such as e-mail (2, 3) and call logs (4, 5). Here,we demonstrate the power of collecting not only communicationinformation but also location and proximity data from mobilephones over an extended period, and compare the resultingbehavioral social network to self-reported relationships from thesame group. We show that pairs of individuals that reportthemselves as friends demonstrate distinctive behavioral signa-tures as measured only by the mobile phone data. Further, thesepurely objective measures of behavior show powerful relation-ships with key outcomes of interest at the individual level—notably, satisfaction.
The Reality Mining study followed 94 subjects using mobilephones preinstalled with several pieces of software that recordedand sent the researcher data about call logs, Bluetooth devicesin proximity of approximately five meters, cell tower IDs,application usage, and phone status (6, 7). Subjects were ob-served using these measurements over the course of nine monthsand included students and faculty from two programs within amajor research institution. We also collected self-report rela-tional data from each individual, where subjects were askedabout their proximity to, and friendship with, others. Subjectswere also asked about their satisfaction with their work groupFull details on data collection and variable construction areavailable in the SI Text. We will hereafter refer to data collected
purely from mobile phones as ‘‘behavioral’’ data as opposed to‘‘self-report’’ data.
We conducted three analyses of these data. First, we examinedthe relationship between self-report and behavioral data. Sec-ond, we analyzed whether there were behaviors identified in themobile phone data that were characteristic of friendship. Third,we studied the relationship between behavioral data and indi-vidual satisfaction.
ResultsBehavioral Versus Self-Report Data. The reliability of existingmeasures for relationships has been the subject of sharp debateover the last 30 years, starting with a series of landmark studiesin which it was found that behavioral observations were surpris-ingly weakly related to reported interactions (8–10). There aremultiple layers of cognitive filters that influence whether asubject reports a behavior (11). Existing research suggests thatpeople are good at recalling long-term, but not short-term, socialstructures (12). We examine whether there are systematic biasesin recall that have been observed in other areas with respect tohuman memory (13), specifically, whether there are recency andsalience biases in recall of physical proximity. A recency bias isone where memories are biased toward recent events. A saliencebias is one where memories are biased toward more vivid events.Here, we capture recency by the quantity of interactions in afixed period preceding the survey, and salience by whether theindividual in question is a friend or nonfriend.
We test for recency and salience biases by comparing self-reported proximity to observed proximity, examining whetherself-reports were biased toward recent and salient proximity.Specifically, subjects were asked about their typical proximity tothe other individuals in the study. These self-reports werecompared with average daily proximity based on the Bluetoothscans. Although most (69%) observed proximity �0 was re-ported as nonproximity, when proximity was reported, it wastypically overestimated: The average reported proximity was 87min per day whereas the average observed proximity was only 33min per day. We also found that for proximity �0, friends weremuch more accurate at reporting proximity than nonfriends. Inthis case, there was a statistically significant but small correlationbetween observed and reported proximity among individualswho worked together but did not consider each other friends (r �.155, P � 0.001), whereas there was a substantially strongerrelationship for friends (r � .412, P � 0.001). Additionally, wefound that when subjects were asked about long-term proximitypatterns, recent proximity had a large and significant (P � 0.001)
Author contributions: N.E., A.S.P., and D.L. designed research; N.E. and A.S.P. performedresearch; N.E. and D.L. contributed new reagents/analytic tools; N.E. and D.L. analyzeddata; and N.E. and D.L. wrote the paper.
The authors declare no conflict of interest.
This article is a PNAS Direct Submission.
See Commentary on page 15099.
1To whom correspondence should be addressed. E-mail: [email protected].
This article contains supporting information online at www.pnas.org/cgi/content/full/0900282106/DCSupplemental.
15274–15278 � PNAS � September 8, 2009 � vol. 106 � no. 36 www.pnas.org�cgi�doi�10.1073�pnas.0900282106

effect on self-reports, independent of the long-term observedproximity. Fig. 1 shows that this recency effect peaks when weuse a seven-day window for recent interactions, suggesting thatindividuals recall of information about their interactions beginsto degrade after approximately one week.
Relational Scripts. Observing intrinsically cognitive relationships,such as friendship or love, is a fundamentally different challenge
than observing whether two people are near each other. It is clear,for example, that two individuals can be friends without anyobservable interactions between them for a given period. Context,however, especially spatial and temporal, is likely to be an importantindicator of particular types of relationship, where spending acouple of hours in close proximity at a location away from work ona Saturday night is quite different from spending a couple of hoursin close proximity at work on a Wednesday afternoon, for example.Here, we borrow from cognitive science the idea of scripts (14, 15).Specifically, we examine whether proximity, location, and timecluster together in a predictable fashion and whether these behav-ioral patterns, in turn, predict friendship.
Fig. 2 captures the average hour-by-hour levels of proximityfor symmetric friend and nonfriend dyads, as well as asymmetricdyads. Proximity is generally much higher for friends, but timeand location are important predictors as well, where the ratio ofproximity off hours outside work is much higher for friends thannonfriends. We therefore divided proximity into variables cor-responding to on campus/off campus, daytime/nights (separatedat 8 a.m. and 8 p.m.), weekend proximity, and phone commu-nication. A factor analysis (Table 1) revealed that two factorscapture most of the variance in these variables. The first factor,which loads most heavily on proximity at work during thedaytime is labeled ‘‘in-role,’’ as it represents traditional behaviorbetween colleagues. The second factor, which loads most heavilyon off-campus proximity in the evening and on weekends, islabeled ‘‘extra-role’’ and is representative of behaviors outsidethe work environment. As depicted in Fig. 3, by using just theextra-role factor from this analysis, it is possible with a singleparameter to accurately predict 96% of symmetric reports ofnonfriendship and 95% reports of symmetric friendship. That is,we can accurately predict self-reported friendships based only onobjective measurements of behavior because the strong culturalnorms associated with social constructs such as friendshipproduce differentiated and recognizable patterns of behavior.
Unsurprisingly, the factor scores for nonreciprocal friendshipsfall systematically between the reciprocal friendship dyads andthe nonfriend dyads. This probably reflects the fact that friend-
Fig. 1. The effect of recency on self-report data. When subjects were askedto report their general proximity patterns, the survey responses were biasedin favor of recent behavior. Although the correlation is lowest when onlyusing observed behavior during the day before the survey, as we expand theobservational time window to seven days, the correlation between the self-report and observed behavior increases. However, expanding the time win-dow beyond seven days results in a decreasing correlation, leading us toconclude that subjects recall of information about their interactions begins todegrade after approximately one week.
Fig. 2. Probability of proximity. Proximity probabilities at work and off campus for symmetric friend, asymmetric friend, and nonfriend dyads. Probability ofproximity is calculated for each hour in the week and is generally much higher for friends than nonfriends. However, it is also apparent that asymmetric andsymmetric friend dyads have different temporal and spatial patterns in proximity, with symmetric friends spending more time together off campus in theevenings.
Eagle et al. PNAS � September 8, 2009 � vol. 106 � no. 36 � 15275
SOCI
AL
SCIE
NCE
SSE
ECO
MM
ENTA
RY

ships are not categorical in nature, and that nonreciprocalfriendships may be indicative of moderately valued friendshipties. Thus, inferred friendships may actually contain more in-formation than is captured by surveys that are categorical innature. A pairwise analysis of variance using the Bonferroniadjustment shows that data from friendships, nonreciprocalfriendships, and reciprocated nonfriend relationships do indeedcome from three distinct distributions (F � 9.2, P � 0.005).
It is clear that there is enormous redundancy in these data,where proximity of a pair one week is correlated with proximitythe next week. We find that for most of the proximity variables,observation for two weeks will largely replicate the data weproduced here from nine months of observations, where themedian correlation of two weeks with the full nine months ofdata for each of the components of the factor analysis variedfrom a low of 0.38 (for phone communication) to a high of 0.82(for proximity at work during the day).
The longitudinal nature of the study also enabled us to trackhow the reported and observed relationships changed during theacademic year. The differences in reported friendships over thecourse of the nine months can be explained as a combination ofboth reporting error (e.g., dyads failing to report a particularrelationship when completing the survey) or the evolution of therelationships (e.g., dyads who become friends between Januaryand May). Fig. 4 shows the extra-role factor distributions cal-culated by using only dyadic behavior from September until
January. It is clear that when both sets of dyads report they werenot friends in January, the autumn behaviors of the dyads thatsubsequently report a friendship in May are quite distinct fromthe autumn behaviors of the dyads who consistently reportedthey were not friends during both January and May surveys. Thisfinding suggests that the observational data are capturing infor-mation about relationships that self-reports are missing.
Predicting Satisfaction Based on Behavioral Data. The precedingmethod still results in a high number of apparent false positives,because there are almost 50� as many mutual nonfriendships asthere are mutual friendships. In particular, only 21 of the 67predicted mutual friendships were reported in the surveys.However, this likely understates the accuracy of the behavior-based inference of friendship, because the self-report measurefor friendship itself is probably not perfectly reliable. To com-pare the validity of these two measures of friendship, we examinethe effectiveness of both measures in predicting social integra-tion in work groups. We compare two predictive models, onebased on self-reported friendship and one based on an inferredmeasure of friendship using the dyadic weights associated withthe factor analysis described in Relational Scripts (see Fig. 1). Inboth models, the predictors are the number of friendships—with
Table 1. Factor analysis loadings
Variable name Specific variance Factor 1: Extra-role Factor 2: In-role
Work proximity, weekdays, 8 a.m.–8 p.m. 0.005 �0.119 1.07Work proximity, weekdays, 8 p.m.–8 a.m. 0.568 0.555 0.144Work proximity, weekends 0.642 0.501 0.137Off-campus proximity, weekdays, 8 a.m.–8 p.m. 0.310 0.691 0.195Off-campus proximity, weekdays, 8 a.m.–8 p.m. 0.240 0.946 �0.123Off-campus proximity, weekends 0.291 0.914 �0.119Phone communication 0.806 0.469 �0.047
For relationship inference, based on a promax rotation, it is possible to divide the dyadic variables into the two factors above: in-roleand extra-role communication. In-role communication consists of the behaviors typically associated with colleagues whereas extra-rolecommunication corresponds to more personal behavior such as proximity on Saturday nights or at home.
Fig. 3. Normalized extra-role histograms. The distributions of a pair ofcolleagues extra-role communication factor scores segmented by relation-ship. Ninety-five percent (21/22) of the symmetric friendships have extra-rolescores above 5, whereas ninety-six percent (901/935) of symmetric nonfriendshave extra-role scores below 5. The 28 asymmetric friends have more behav-ioral variance, drawing from behaviors characteristic of both nonfriends andfriends.
Fig. 4. A histogram of the extra-role distribution generated from behavioraldata collected from September to January for two sets of dyads. The red binsrepresent the dyads that consistently confirmed they were not friends on boththe January and May survey (n � 2153). The yellow bins represent the dyadsthat confirmed they were not friends on the January survey, but at least oneindividual named the other as a friend on the May survey (n � 32). Clearlythese two sets of dyads come from distinct distributions; potential explana-tions for the yellow distribution could be survey error in January (i.e., thefriendships existed, but were not reported in January), or that the dyads’behavior during the autumn was indicative of budding friendships that theyonly became aware of during the subsequent year.
15276 � www.pnas.org�cgi�doi�10.1073�pnas.0900282106 Eagle et al.
a dummy for zero friendships to capture nonlinearities (positiveexpected relationship), the average proximity to friends while atwork (positive expected relationship), and phone communica-tion with friends while at work (negative expected relationship).
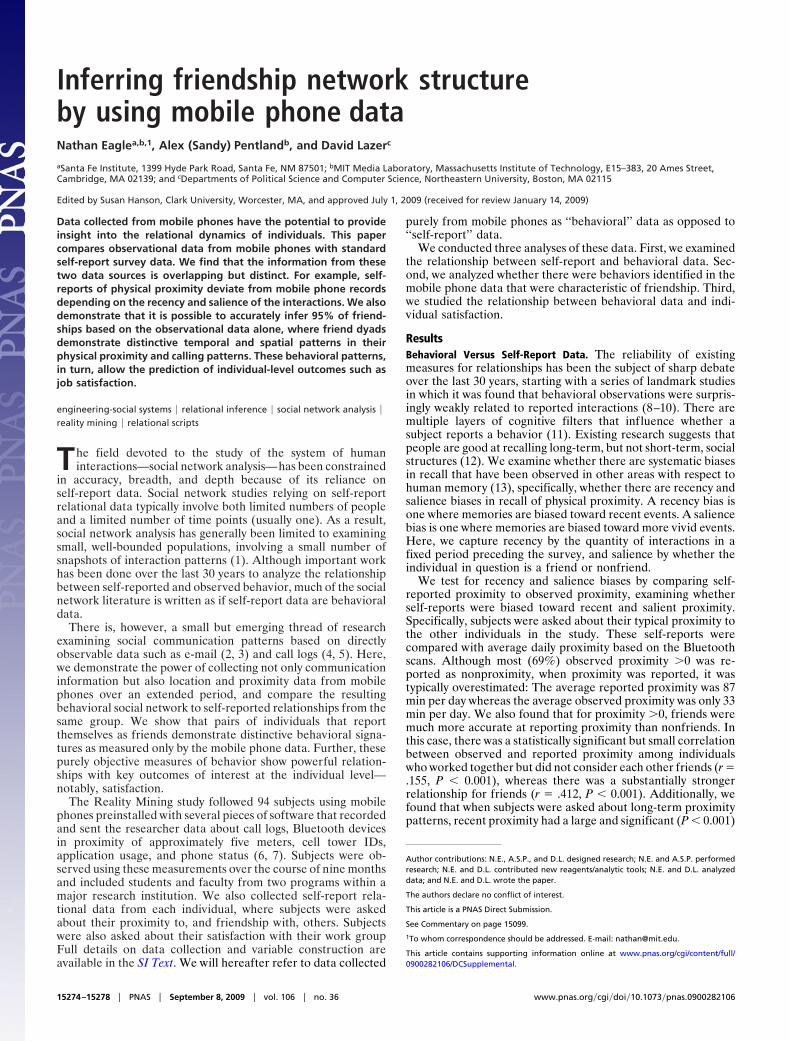
The relationship between satisfaction and interactions pat-terns, shown in Table 2, was exactly as predicted, that is, havingfriends—especially ones to whom you were near at work—predicted satisfaction with the work group, and calling friendswhile at work was associated with lack of satisfaction with thework group. What is important, from the perspective of thispaper, is that the inferred friendship network (see Fig. 5)produced substantively identical results to the self-report model,with a slightly improved fit. These nearly identical results suggestthat it is possible to accurately infer subjective job satisfactionbased solely on behavioral data, validating the inferred measureof friendship.
DiscussionData collected from mobile phones have the potential to provideinsight into the underlying relational dynamics of organizations,communities and, potentially, societies. At the microlevel, thesemethods provide, for example, a new approach to studyingcollaboration and communication within organizations—allowing the examination of the evolution of relationships overtime. Leveraging these behavioral signatures to accurately char-acterize relationships in the absence of survey data also has thepotential to enable the quantification and prediction of macrosocial network structures that were heretofore unobservable.There is no technical reason why data like these cannot becollected from millions of people throughout the course of theirlives. Furthermore, although the collection of such data raisesserious privacy issues that need to be considered (16–18), the
potential for achieving important societal goals, from urbanplanning to public health, is considerable.
This paper thus offers a necessary first step, linking thepredominant existing methodologies to collect social networkdata based on self-reports to data that can be collected auto-matically via mobile phones. Our results suggest that behavioralobservations from mobile phones, as a complement to self-report surveys, provide insight not just into observable behaviorbut also into purely cognitive constructs, such as friendship andindividual satisfaction. Although the specific results are surelyembedded within the social milieu in which the study wasgrounded, the critical next question is how much these patternsvary from context to context.
Materials and MethodsOur extensive set of longitudinal behavioral data were collected by using100 specially programmed Nokia 6600 smartphones. Details about theexperimental design, the subject pool, data collection protocols, and adescription of the dyadic variable construction are provided in the SI Text,Figs. S1–S7 and Tables S1 and S2.
Data collected from these mobile phones consist of cellular tower transition,Bluetooth device discovery scans, and communication events. Although mostcellular towers have ranges extending several square kilometers, in typical urbansettings tower densities are significantly higher. Each tower has been assigned anID that is logged by the mobile phones in our study. By using the tower IDs andrespective transition timings (time stamps when the phone is handed off be-tween cellular towers), we are able to estimate location and movement. Con-ducting periodic Bluetooth scans at 5-min intervals has generated �4 millionproximity events in the dataset. For each proximity event, we have logged thetwo proximate Bluetooth phones, the current associated cellular tower for eachof the phones, and the time and date of the event. Because all of the phones arescanning every five minutes, if two subjects were together for 100 min therewould be a total of 40 recorded proximity events. We therefore approximateeach proximity event to be representative of a 2.5-min time interval. To estimatethe amount of proximity at a particular location such as ‘‘work’’, we multiply this
Fig. 5. Inferred, weighted friendship network vs. reported, discrete friendship network. Frame A shows the inferred friendship network with edge weightscorresponding to the factor scores for factor 2, extra-role communication. Frame B shows the reported friendship network. Node colors highlight the two groupsof colleagues, first-year business school students (brown) and individuals working together in the same building (red).
Table 2. Ordinary least squares regression of relationship between satisfaction and interaction patterns
Model MC self-report ModelCMC
observational
Friendship dummy, equals 1 no friends (sr) �0.370*(0.175) Friendship dummy (inf) �0.392*(0.170)Number of reciprocatedfriendships (sr) 0.377*(0.166) Number of friends (inf) 0.483** (0.164)Average proximity tofriends (sr) while at work 0.719** (0.176) Average proximity to friends (inf) while at work 0.698** (0.188)Phone communication with friends (sr) while at
work�0.497** (0.171) Phone communication with friends (inf) while
at work�0.571** (0.182)
Adjusted r2 0.161 Adjusted r2 0.180
Models are based on a combination of self-report or inferred relational and interaction data. N � 94 for all models, with *P�0.05, and **P�0.01, two-tailedtest.
Eagle et al. PNAS � September 8, 2009 � vol. 106 � no. 36 � 15277
SOCI
AL
SCIE
NCE
SSE
ECO
MM
ENTA
RY

time interval by the number of proximity events that involved the cellular towersassociated with that location.
Analysis of the dyadic variables was performed by using the nonparametricmultiple regression quadratic assignment procedure (MRQAP), a standard tech-nique to analyze social network data. The MRQAP technique treats squarenetwork matrices as distinct variables that can be incorporated into a regressionby sampling from a repeated permutation to generate a random estimate of therelationship between multiple matrices. We performed additional tests on the
dyadic variables by using the results from a factor analysis with a variety ofrotations to assess the robustness of the friendship edge prediction.
ACKNOWLEDGMENTS. The authors would like to thank Mika Raento fortechnical support, Devon Brewer for useful comments, and Nokia for financialsupport and mobile phone donation. N. E. was supported by the Santa FeInstitute. N. E. and A. P. were sponsored by the Massachusetts Institute ofTechnology Media Laboratory.
1. Wasserman S, Faust K (1994) Social Network Analysis: Methods and Applications(Cambridge Univ Press, New York).
2. Kossinets G, Watts D (2006) Empirical analysis of an evolving social network. Science311:88–90.
3. Ebel H, Mielsch L, Bornholdt S (2002) Scale-free topology of e-mail networks. Phys RevE 66:35103.
4. Aiello W, Chung F, Lu L (2000) A random graph model for massive graphs. Proceedingsof the Thirty-Second Annual ACM Symposium on Theory of Computing (Associationfor Computing Machinery, New York) pp. 171–180.
5. Onnela J, et al (2007) Structure and tie strengths in mobile communication networks.Proc Natl Acad Sci 104:7332–7336.
6. Eagle N, Pentland A (2006) Reality mining: Sensing complex social systems. PersonalUbiquitous Comput 10:255–268.
7. Raento M, Oulasvirta A, Petit R, Toivonen H (2005) ContextPhone: A prototypingplatform for context-aware mobile applications. IEEE Pervasive Computing 4:51–59.
8. Bernard HR, Killworth PD (1977) Informant accuracy in social network data II, HumComm Res 4:3–18.
9. Killworth PD, Bernard HR (1976) Informant accuracy in social network data. Hum Org35:269–286.
10. Marsden P (1990) Network data and measurement. Ann Rev Sociol 16:435–463.11. Freeman L (1992) Filling in the blanks: A theory of cognitive categories and the
structure of social affiliation. Soc Psychol Q 55:118–127.12. Freeman L, Romney A, Freeman S (1987) Cognitive structure and informant accuracy.
Am Anthropol 89:310–325.13. Frensch P (1994) Composition during serial learning: A serial position effect. J Exp
Psychol Learn Mem Cognit 20:423–443.14. Abelson R (1981) Psychological status of the script concept. Am Psychol 36:715–729.15. Krackhardt D (1990) Assessing the political landscape: Structure, cognition, and power
in organizations. Admin Sci Q 35:342–369.16. Butler D (2007) Data sharing threatens privacy.Nature 449:644–645.17. Anonymous (2007) A matter of trust: Social scientists studying electronic interactions
must take the lead on preserving data security. Nature 449:637–638.18. Lazer D, et al. (2009) Computational social science. Science 323:721–723.
15278 � www.pnas.org�cgi�doi�10.1073�pnas.0900282106 Eagle et al.