Embed Size (px)
Citation preview
INF3470/4470: Digital Signal ProcessingMATLAB Introduction
Carl Inge C. Nilsen
January 2007
Carl Inge C. Nilsen INF3470/4470: Digital Signal ProcessingMATLAB Introduction
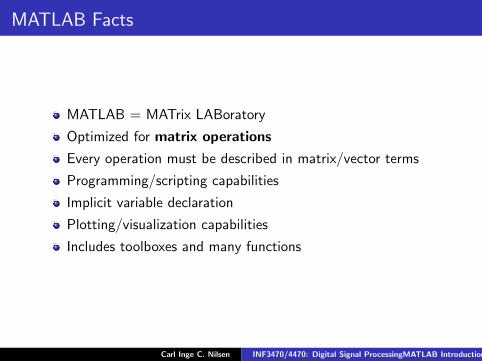
MATLAB Facts
MATLAB = MATrix LABoratory
Optimized for matrix operations
Every operation must be described in matrix/vector terms
Programming/scripting capabilities
Implicit variable declaration
Plotting/visualization capabilities
Includes toolboxes and many functions
Carl Inge C. Nilsen INF3470/4470: Digital Signal ProcessingMATLAB Introduction
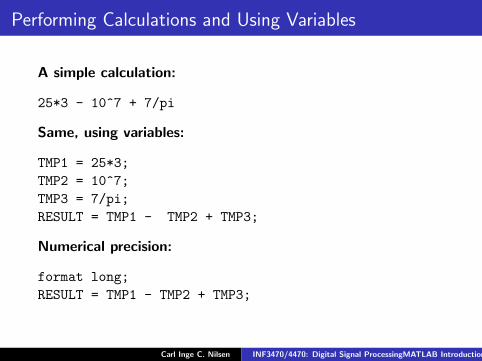
Performing Calculations and Using Variables
A simple calculation:
25*3 - 10^7 + 7/pi
Same, using variables:
TMP1 = 25*3;TMP2 = 10^7;TMP3 = 7/pi;RESULT = TMP1 - TMP2 + TMP3;
Numerical precision:
format long;RESULT = TMP1 - TMP2 + TMP3;
Carl Inge C. Nilsen INF3470/4470: Digital Signal ProcessingMATLAB Introduction
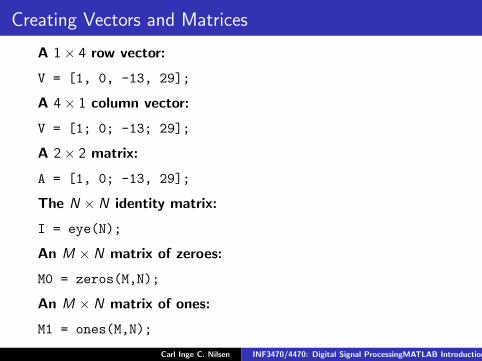
Creating Vectors and Matrices
A 1× 4 row vector:
V = [1, 0, -13, 29];
A 4× 1 column vector:
V = [1; 0; -13; 29];
A 2× 2 matrix:
A = [1, 0; -13, 29];
The N × N identity matrix:
I = eye(N);
An M × N matrix of zeroes:
M0 = zeros(M,N);
An M × N matrix of ones:
M1 = ones(M,N);
Carl Inge C. Nilsen INF3470/4470: Digital Signal ProcessingMATLAB Introduction
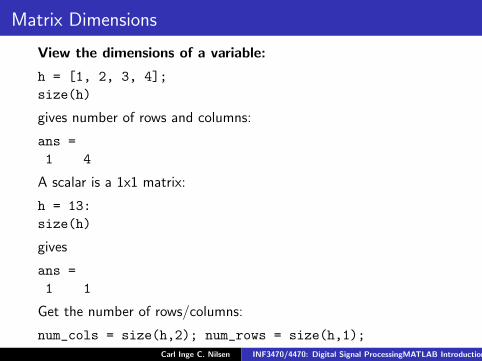
Matrix Dimensions
View the dimensions of a variable:
h = [1, 2, 3, 4];size(h)
gives number of rows and columns:
ans =1 4
A scalar is a 1x1 matrix:
h = 13:size(h)
gives
ans =1 1
Get the number of rows/columns:
num_cols = size(h,2); num_rows = size(h,1);Carl Inge C. Nilsen INF3470/4470: Digital Signal ProcessingMATLAB Introduction
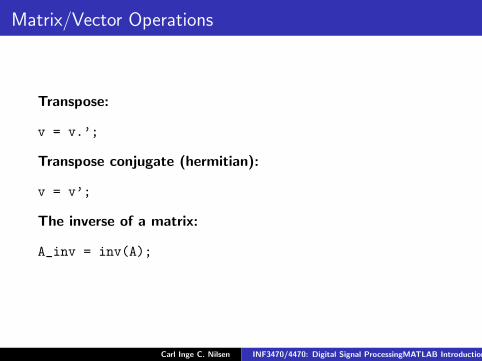
Matrix/Vector Operations
Transpose:
v = v.’;
Transpose conjugate (hermitian):
v = v’;
The inverse of a matrix:
A_inv = inv(A);
Carl Inge C. Nilsen INF3470/4470: Digital Signal ProcessingMATLAB Introduction
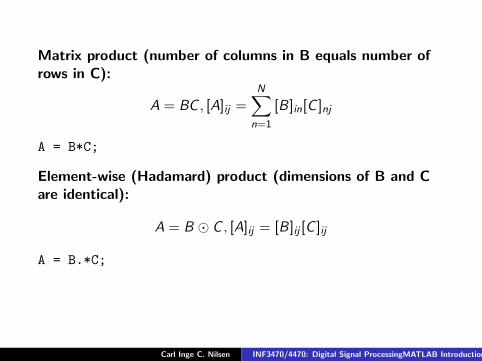
Matrix product (number of columns in B equals number ofrows in C):
A = BC , [A]ij =N∑
n=1
[B]in[C ]nj
A = B*C;
Element-wise (Hadamard) product (dimensions of B and Care identical):
A = B � C , [A]ij = [B]ij [C ]ij
A = B.*C;
Carl Inge C. Nilsen INF3470/4470: Digital Signal ProcessingMATLAB Introduction
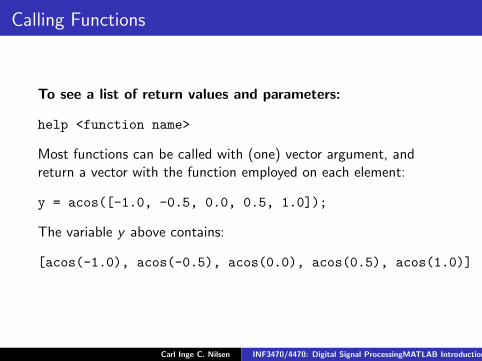
Calling Functions
To see a list of return values and parameters:
help <function name>
Most functions can be called with (one) vector argument, andreturn a vector with the function employed on each element:
y = acos([-1.0, -0.5, 0.0, 0.5, 1.0]);
The variable y above contains:
[acos(-1.0), acos(-0.5), acos(0.0), acos(0.5), acos(1.0)]
Carl Inge C. Nilsen INF3470/4470: Digital Signal ProcessingMATLAB Introduction
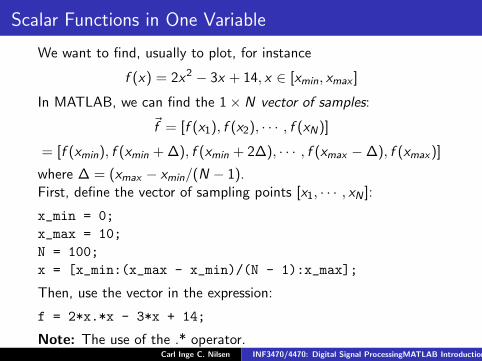
Scalar Functions in One Variable
We want to find, usually to plot, for instance
f (x) = 2x2 − 3x + 14, x ∈ [xmin, xmax ]
In MATLAB, we can find the 1× N vector of samples:
~f = [f (x1), f (x2), · · · , f (xN)]
= [f (xmin), f (xmin + ∆), f (xmin + 2∆), · · · , f (xmax −∆), f (xmax)]
where ∆ = (xmax − xmin/(N − 1).First, define the vector of sampling points [x1, · · · , xN ]:
x_min = 0;x_max = 10;N = 100;x = [x_min:(x_max - x_min)/(N - 1):x_max];
Then, use the vector in the expression:
f = 2*x.*x - 3*x + 14;
Note: The use of the .* operator.Carl Inge C. Nilsen INF3470/4470: Digital Signal ProcessingMATLAB Introduction
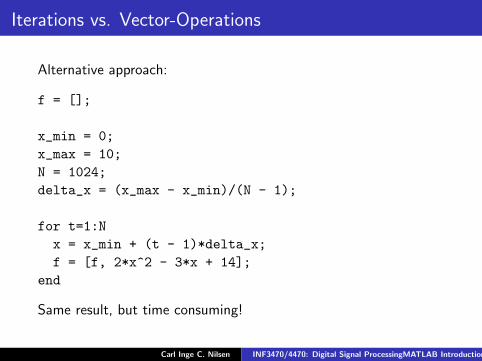
Iterations vs. Vector-Operations
Alternative approach:
f = [];
x_min = 0;x_max = 10;N = 1024;delta_x = (x_max - x_min)/(N - 1);
for t=1:Nx = x_min + (t - 1)*delta_x;f = [f, 2*x^2 - 3*x + 14];
end
Same result, but time consuming!
Carl Inge C. Nilsen INF3470/4470: Digital Signal ProcessingMATLAB Introduction
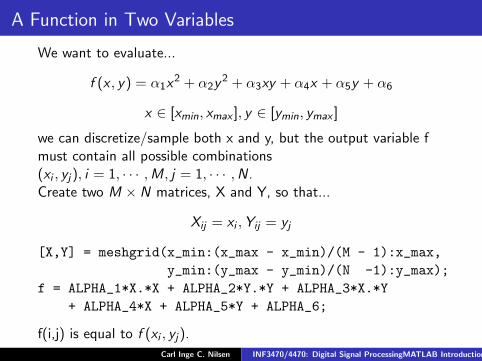
A Function in Two Variables
We want to evaluate...
f (x , y) = α1x2 + α2y
2 + α3xy + α4x + α5y + α6
x ∈ [xmin, xmax ], y ∈ [ymin, ymax ]
we can discretize/sample both x and y, but the output variable fmust contain all possible combinations(xi , yj), i = 1, · · · ,M, j = 1, · · · ,N.Create two M × N matrices, X and Y, so that...
Xij = xi ,Yij = yj
[X,Y] = meshgrid(x_min:(x_max - x_min)/(M - 1):x_max,y_min:(y_max - y_min)/(N -1):y_max);
f = ALPHA_1*X.*X + ALPHA_2*Y.*Y + ALPHA_3*X.*Y+ ALPHA_4*X + ALPHA_5*Y + ALPHA_6;
f(i,j) is equal to f (xi , yj).
Carl Inge C. Nilsen INF3470/4470: Digital Signal ProcessingMATLAB Introduction
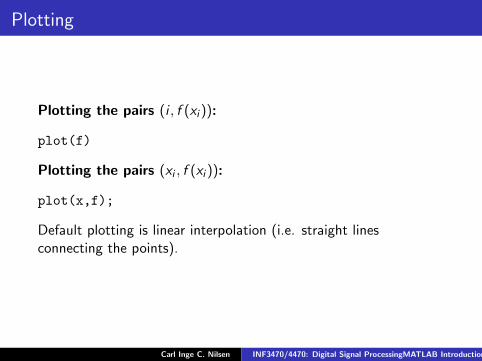
Plotting
Plotting the pairs (i , f (xi )):
plot(f)
Plotting the pairs (xi , f (xi )):
plot(x,f);
Default plotting is linear interpolation (i.e. straight linesconnecting the points).
Carl Inge C. Nilsen INF3470/4470: Digital Signal ProcessingMATLAB Introduction
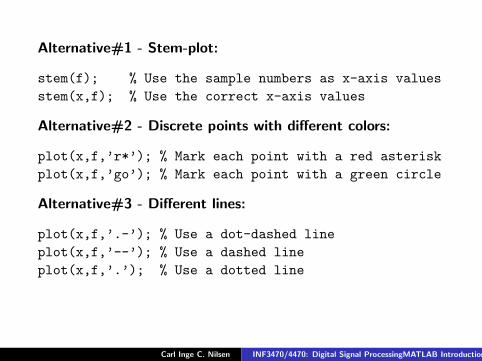
Alternative#1 - Stem-plot:
stem(f); % Use the sample numbers as x-axis valuesstem(x,f); % Use the correct x-axis values
Alternative#2 - Discrete points with different colors:
plot(x,f,’r*’); % Mark each point with a red asteriskplot(x,f,’go’); % Mark each point with a green circle
Alternative#3 - Different lines:
plot(x,f,’.-’); % Use a dot-dashed lineplot(x,f,’--’); % Use a dashed lineplot(x,f,’.’); % Use a dotted line
Carl Inge C. Nilsen INF3470/4470: Digital Signal ProcessingMATLAB Introduction
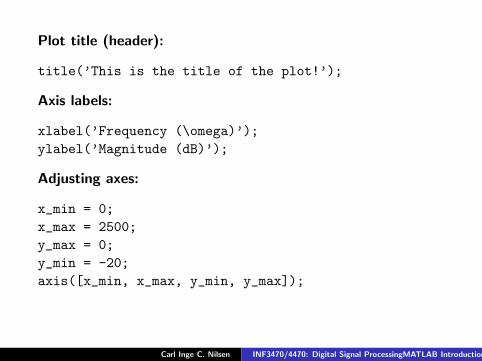
Plot title (header):
title(’This is the title of the plot!’);
Axis labels:
xlabel(’Frequency (\omega)’);ylabel(’Magnitude (dB)’);
Adjusting axes:
x_min = 0;x_max = 2500;y_max = 0;y_min = -20;axis([x_min, x_max, y_min, y_max]);
Carl Inge C. Nilsen INF3470/4470: Digital Signal ProcessingMATLAB Introduction
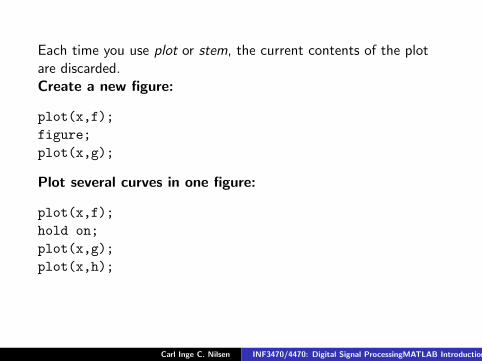
Each time you use plot or stem, the current contents of the plotare discarded.Create a new figure:
plot(x,f);figure;plot(x,g);
Plot several curves in one figure:
plot(x,f);hold on;plot(x,g);plot(x,h);
Carl Inge C. Nilsen INF3470/4470: Digital Signal ProcessingMATLAB Introduction
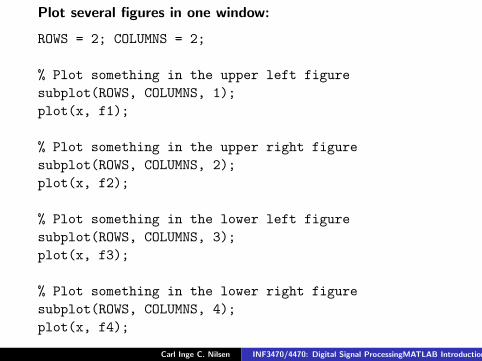
Plot several figures in one window:
ROWS = 2; COLUMNS = 2;
% Plot something in the upper left figuresubplot(ROWS, COLUMNS, 1);plot(x, f1);
% Plot something in the upper right figuresubplot(ROWS, COLUMNS, 2);plot(x, f2);
% Plot something in the lower left figuresubplot(ROWS, COLUMNS, 3);plot(x, f3);
% Plot something in the lower right figuresubplot(ROWS, COLUMNS, 4);plot(x, f4);
Carl Inge C. Nilsen INF3470/4470: Digital Signal ProcessingMATLAB Introduction
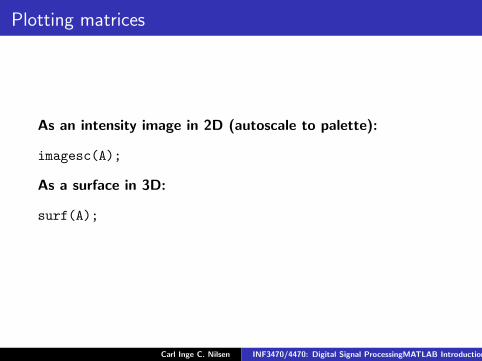
Plotting matrices
As an intensity image in 2D (autoscale to palette):
imagesc(A);
As a surface in 3D:
surf(A);
Carl Inge C. Nilsen INF3470/4470: Digital Signal ProcessingMATLAB Introduction
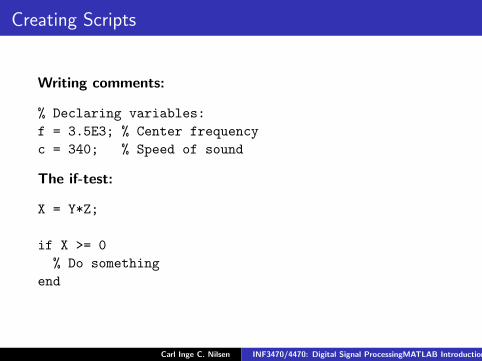
Creating Scripts
Writing comments:
% Declaring variables:f = 3.5E3; % Center frequencyc = 340; % Speed of sound
The if-test:
X = Y*Z;
if X >= 0% Do something
end
Carl Inge C. Nilsen INF3470/4470: Digital Signal ProcessingMATLAB Introduction
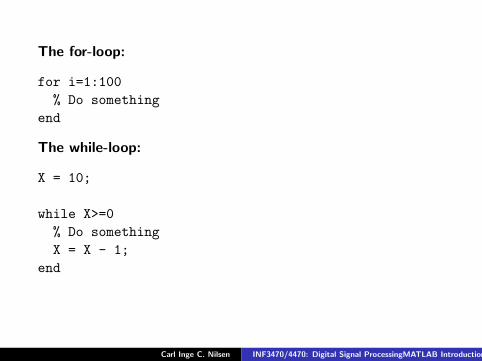
The for-loop:
for i=1:100% Do something
end
The while-loop:
X = 10;
while X>=0% Do somethingX = X - 1;
end
Carl Inge C. Nilsen INF3470/4470: Digital Signal ProcessingMATLAB Introduction
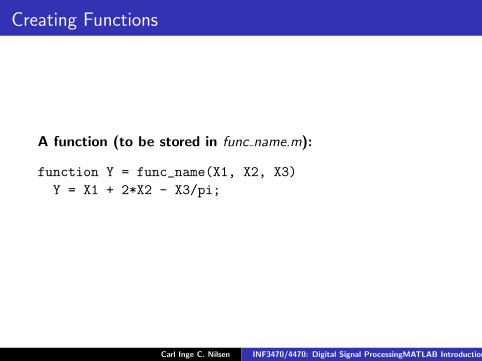
Creating Functions
A function (to be stored in func name.m):
function Y = func_name(X1, X2, X3)Y = X1 + 2*X2 - X3/pi;
Carl Inge C. Nilsen INF3470/4470: Digital Signal ProcessingMATLAB Introduction
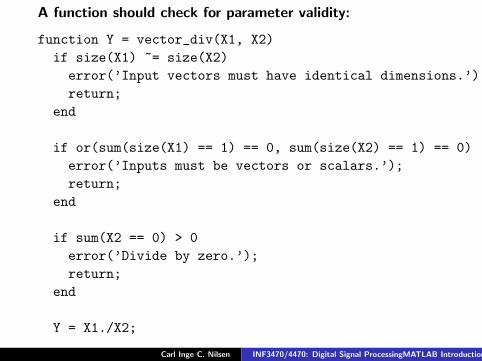
A function should check for parameter validity:
function Y = vector_div(X1, X2)if size(X1) ~= size(X2)
error(’Input vectors must have identical dimensions.’);return;
end
if or(sum(size(X1) == 1) == 0, sum(size(X2) == 1) == 0)error(’Inputs must be vectors or scalars.’);return;
end
if sum(X2 == 0) > 0error(’Divide by zero.’);return;
end
Y = X1./X2;
Carl Inge C. Nilsen INF3470/4470: Digital Signal ProcessingMATLAB Introduction
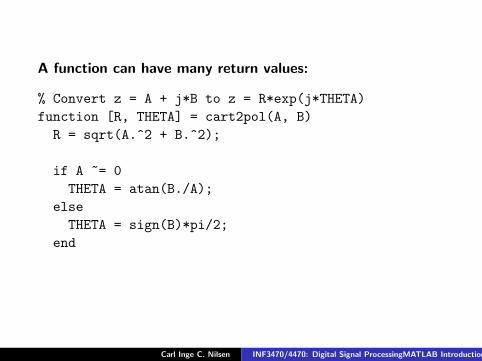
A function can have many return values:
% Convert z = A + j*B to z = R*exp(j*THETA)function [R, THETA] = cart2pol(A, B)
R = sqrt(A.^2 + B.^2);
if A ~= 0THETA = atan(B./A);
elseTHETA = sign(B)*pi/2;
end
Carl Inge C. Nilsen INF3470/4470: Digital Signal ProcessingMATLAB Introduction