Embed Size (px)
Citation preview
UW BOTHELL POLICY JOURNAL, 2012 31
Environmental justice has been defined as, “every-one is entitled to equal protection and equal en-
forcement of environmental, health, housing, land use, transportation, energy and civil rights laws and regula-tions” (Bullard et al., 2008). Part of this environmen-tal justice equation involves the spatial distribution of industrial facilities. Policies have been put in place to protect the public from health and other impacts asso-ciated with some industrial facilities such as factories, landfills and hazardous waste facilities, which can emit toxic pollutants and deal with hazardous materials. Sit-ing policies are enacted to ensure that these industries are not in residential areas and the risks to the public are minimized. That being said, studies have found that despite siting policies factories, landfills and hazard-ous waste facilities have been placed near low income, minority populations and communities that have few resources to combat industry placement (Abel, 2008; Atlas, 2001; Bullard et al., 2008; Kreig, 2009). These communities are bearing an unequal burden of health impacts from the facilities near where they live. This unjust distribution of industrial activities and hazardous materials is the focus of my study, but with a twist.
Equitable distribution issues concerning these indus-trial facilities have been studied over the years, but there is little evidence that anyone has examined industrial scale renewable energy siting in regards to equitable distribution of facilities. Renewable energy facilities consist of: solar, geothermal, wave, and wind power; and it is the last source, wind power, which I will exam-ine in this paper. Wind farms bring impacts on public health and the environment just like other large indus-tries, but the siting regulations only take into account each wind farm on its own. Siting policies need to take into account not only the placement of wind farms in
INEQUITABLE DISTRIBUTION: WIND FARMS AND WASTE FACILITIES IN THE PACIFIC NORTHWESTShawn Friang
ABSTRACT: Inequitable distribution in environmental justice is defined as one group bearing an excessive burden of en-vironmental hazards. This concept has been applied to large industrial facilities such as waste disposal sites and nuclear power plants, but has not been used in reference to “green” renewable energy facilities such as wind farms. A case study was conducted of the town of Arlington, Oregon, home to two of Waste Management’s largest waste facilities and seven wind farms. After mapping the facilities and areas of health impact, the results revealed a small community dealing with multiple risk burdens from these facilities. Wind farms and waste site locations throughout the Pacific Northwest were mapped and indicated inequitable distributions of these facilities in other areas. If the distribution of these facilities is concentrating hazards in already burdened communities, why are there not better sitting policies to avoid this incident, especially for green energy facilities?
respect to other large scale facilities such as hazardous waste facilities, but also in respect to the other wind farm development in the area and the combined impact they have on the community.
Pressures on local utility companies to meet their Re-newable Portfolio Standards (RPS) percentages each year has added to the rush to establish renewable en-ergy facilities. This has led to a flurry of wind farm construction and there are communities with multiple wind farms surrounding them. This is where the ineq-uitable distribution comes into question. Multiple wind farms in one area concentrate the health impacts asso-ciated with wind farm activity. Do the wind farm siting policies concentrate the associated hazards in areas that are already overburdened by other kinds of polluting facilities?
A case study of Arlington, Oregon is used to establish a foundational understanding of the spatial distribution of facilities at the county level in order to evaluate dis-tributions of other wind and waste facilities throughout the Pacific Northwest and the health impacts that mul-tiple industrial facilities could have on the community.
Methods
Arlington is a small rural community in Gilliam County in northern Oregon with a local population of 586, one-third of the entire county population (U.S. Census Bureau, 2011). Waste Management North-west’s Chemical Waste Facility and Colombia Ridge Landfill and Re-cycling are both based near Arlington and they receive more than 120 million tons of waste materials each year from surrounding communities; including Seattle and Portland. According to the Or-egon Department of Energy, Energy Facility Siting
32 UW BOTHELL POLICY JOURNAL, 2012
website this rural community is also home to six op-erating large-scale wind farms with a total of 430 wind turbines. There are another five even larger wind farms in the permitting process or under construction total-ing another 1300 turbines for this area alone (Energy Facility Siting, 2011). This combination of hazardous facilities and wind farms together in one place make Arlington a good candidate for a case study of spatial distributional issues in regards to wind power genera-tion and other industrial facilities.
In order to determine whether wind farm communities were bearing an unfair burden, I first had to assess how to measure health risks from facilities. The Biennial Re-port from the United States Environmental Protection Agency (EPA) is used to measure the health risk to in-dividuals from various types of industries producing or handling hazardous waste. The focus was to follow the health risks over time to determine which facilities har-bored the most risk to the public. The health risk data were overlaid with the census data to determine the pro-portion of the public affected, by which facilities and to what extent (Atlas, 2001). I used the EPA’s Biennial report of hazardous facilities to locate and assess risk from the Waste Management sites to determine the risk buffer or area of impact from the waste facilities within five miles. In a study by Troy D. Abel about Toxic Re-lease Inventory (TRI) facilities in St. Louis, one kilo-meter km buffer rings were used to assess the risk levels to the community (2008). Abel’s study found that risks for facilities differed by site and mapping each site indi-vidually provided more accurate risks to the local com-munity (Abel, 2008). This method helps to define the health risks at different distances from a wind turbine.
I then had to determine how to measure areas at risk. In the siting of a wind facility the Oregon Department of Energy: Energy Facility Siting setback (distance from a residence) requirements are: “(a) all facility compo-nents must be at least 3,520 feet from the property line of properties zoned residential use or designated in the Gilliam County Comprehensive Plan as residential” (Energy Facility Siting, 2011). Being that most of Ar-lington is farm land I also included the siting rules for non-residential areas, “If (a) does not apply, the certifi-cate holder shall maintain a minimum distance of 1,320 feet, measured from the centerline of the turbine tower to the center of the nearest residence existing at the time of tower construction” (Energy Facility Siting, 2011). I used U.S. Census Tiger shape files to determine the Oregon zoning and mapped that using ARCGIS, a com-puter program used to map spatial data, to identify the
residential areas. Umatilla County, near Gilliam Coun-ty, passed regulations approving a two mile setback for noise from wind turbine to a residence, which was the setback pushed by activist groups like the Blue Moun-tain Alliance and Friends of the Grande Ronde Valley (Tipler, 2011). I chose buffer zones of 1,320 feet and two miles around each wind turbine to represent the Or-egon State siting requirements for a wind farm and the conservative estimate from activist groups for setbacks from wind turbines, respectively.
To understand the distribution of the wind turbines, we need tmeasure if the placement of the wind turbines is significantly clustered or dispersed in the study area. The distribution of facilities was analyzed within a Geographic Information Systems (GIS) framework. I used ARCGIS to map out the locations of each wind turbine on wind farms within a radius of five miles from the city limits of Arlington, Oregon and the sites of the waste facilities in that same study area. Using the county as a study area, I used the nearest neighbor index, a statistical tool, to evaluate the average distance from each wind turbine to every other wind turbine to determine if the turbines are clustered, random or dis-persed (Mitchell, 2009, p. 88-91). The nearest neighbor index is calculated using:
where R is the nearest neighbor ratio and is the dis-tribution of the observed points and is a theoretical distribution, d is the distance to the nearest neighbor, n is the number of wind turbines, i and j are the target point and every other features, respectively, and A is the study area.
In order to assess the extent of the distribution of the wind turbines, we need to test if the distribution is by chance. The statistical significance of the distribution ratio is tested using the Z-score equation:The constant .26136 is used to represent the random distribution of points based on a circle. This will show the distribution of the wind turbines in respect to the county.
Friang
with SE being the standard error calculated as:
UW BOTHELL POLICY JOURNAL, 2012 33
Inequitable Distribution
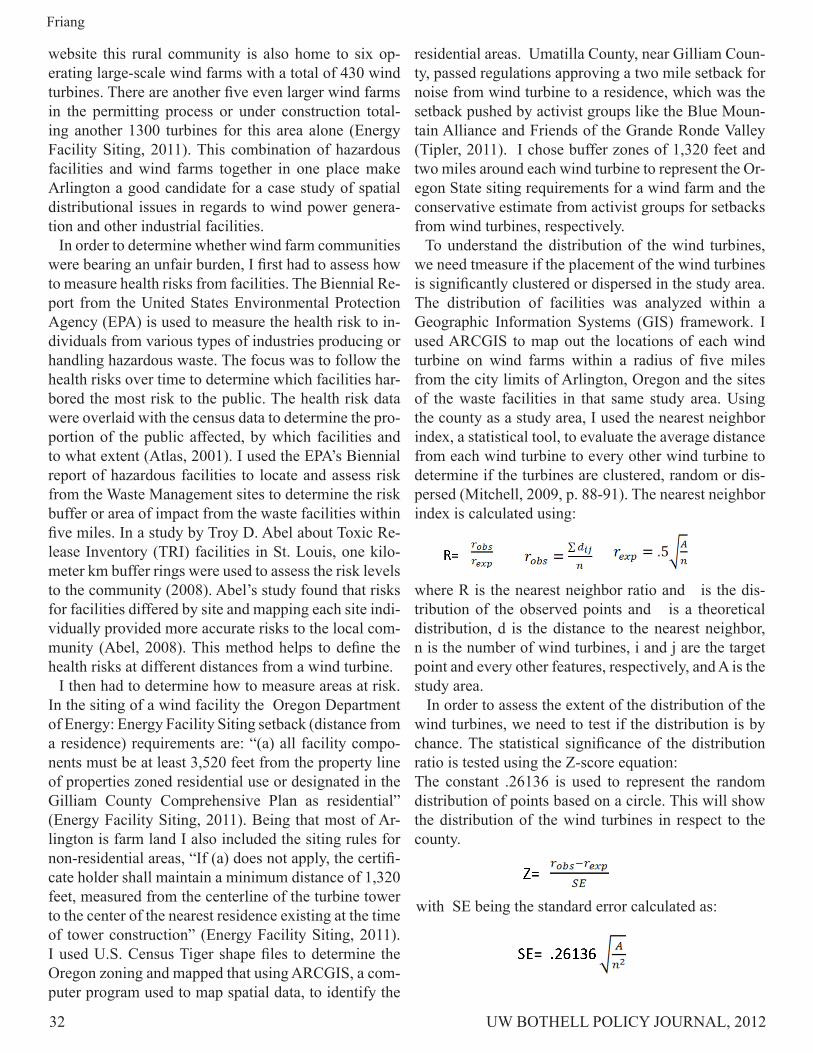
Map
1. W
ind
turb
ine
and
was
te fa
cilit
y lo
catio
ns in
Arli
ngto
n, O
rego
n.
Win
d an
d W
aste
Fac
ilitie
s in
Arli
ngto
n, O
rego
n
34 UW BOTHELL POLICY JOURNAL, 2012
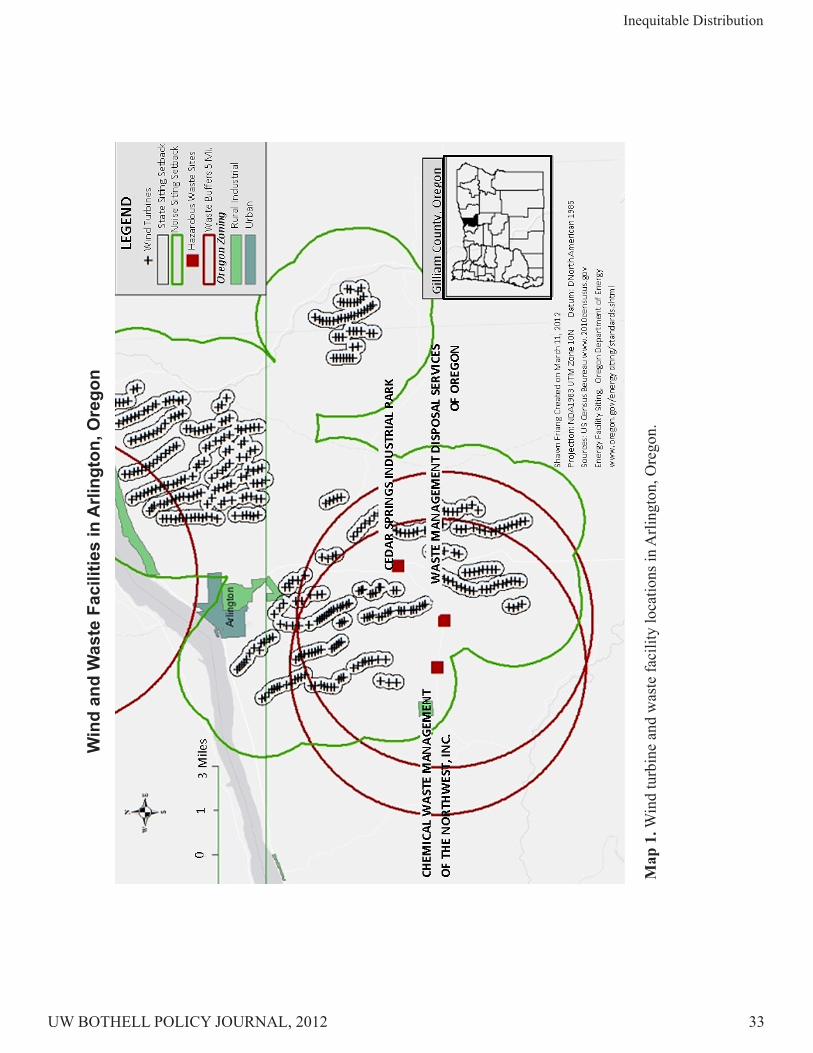
It is also important to understand the extent of the dis-tribution at various distances within the study area, in order to determine if the distribution is random or not. I used the K-function, another statistical test, to evaluate the distribution of turbines at different scales (Mitchell, 2009, pp. 98-99). The K-function is calculated using:
L is the value at any given distance d and n is the number of wind turbines, k(ij) is the weight (1 if d_ij≤0 and 0 if d_ij>0) i and j are the target point and every other fea-tures with a distance d, respectively, and A is the study area. This produces a graph with an expected value for any given distance in a random distribution shown as a line at a 45 degree angle and then plots the L value for the function. If the observed L values are above the expected values, the sample is clustered and if below it is dispersed. My null hypothesis is that the distribu-tion of the wind turbines is random. A null hypothesis is the assertion that there is no relationship between what is being studied, such as the wind turbine place-ment is merely by chance. This graph also displays a confidence envelope which shows the upper and lower boundaries of a random distribution. If the
observed values are outside the confidence envelope then they are statistically significant and the distribu-tion is not due to chance.
Even if the statistical tests show an inequitable dis-tribution of wind turbines in Arlington, it does not nec-essarily mean that this same pattern is repeated else-where. To test this idea, I mapped the locations of the waste facilities and wind farms in Washington, Idaho, and Oregon and analyzed them for distribution and if they were sited in small, rural communities. I gathered the location information for each municipal landfill from Oregon and Idaho’s Department of Environmental Quality and Washington’s Department of Ecology (Ida-ho, 2012, Oregon, 2012,Washington, 2012). Wind farm locations were obtained from the Renewable Northwest Project website (Renewable Energy Projects, 2012). The locations of the hazardous waste facilities were collected from the EPA’s Toxic Release Inventory Pro-gram website (EPA, 2012). I used a data visualization program called Tableau to map each location and for analysis of the block group income per capita data from the U.S. Census Bureau (U.S. Census Bureau, 2009).
Figure 1. K-function graph for wind turbines in Arlington, Oregon using ARCGIS. Distance is in meters.
Friang
UW BOTHELL POLICY JOURNAL, 2012 35
Inequitable Distribution
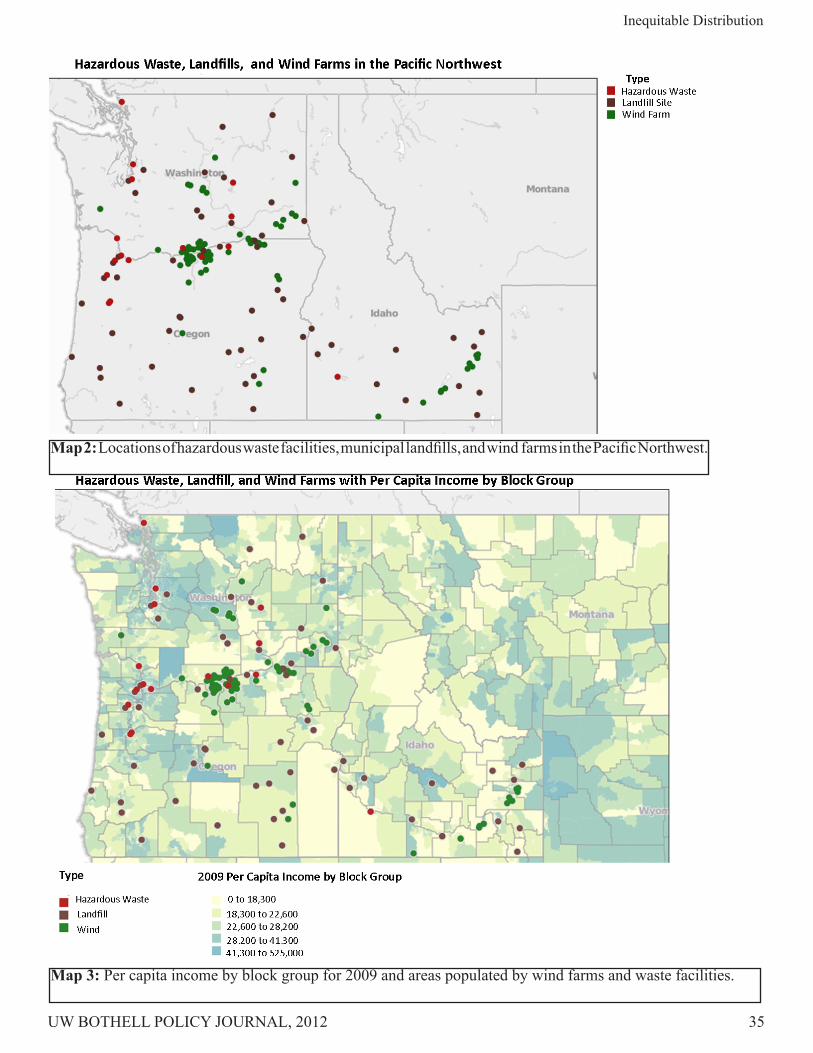
Map 3: Per capita income by block group for 2009 and areas populated by wind farms and waste facilities.
Map 2: Locations of hazardous waste facilities, municipal landfills, and wind farms in the Pacific Northwest.
36 UW BOTHELL POLICY JOURNAL, 2012
Results
Based on the mapping of the wind turbines, (x) the distribution of the wind turbines suggest that they are clustered and there are areas of Arlington that experi-ence impacts of both the wind turbines and the waste facilities (See Map 1). Waste facilities, both hazardous and municipal, are represented by the red squares. Waste facility impact areas are illustrated by the dark red buf-fer lines. When I mapped the land use zoning in Gil-liam County, I found no “Residential” areas in Arling-ton (See Map 1). It was zoned as “Urban” and “Rural Industrial” so I used the option (c) setback requirements for noise, which are 1,320 feet, for the wind turbines constructed in agricultural zone areas. Light gray lines indicate these wind turbine setback for noise as required by Oregon State law. The green line illustrates the two-mile noise setback used in Umatilla County. All of the city-proper of Arlington is clear of the impacts of the wind and waste facilities at these setback standards, but there are still areas of the rural community that fall un-der the impact of both types of facilities.
One interesting finding when I mapped the waste facilities was that the Roosevelt Regional Landfill in Washington State, represented by the red buffer circle at the top of Map 1, also impacted the Arlington area.
The results of the statistical tests for distribution of the wind farms illustrates that the wind farms are clus-tered and significantly so. The results of the nearest neighbor index calculations are: the average distance between wind turbines was 246.55 meters and with a ratio of .1847 the distribution is clustered. A Z- score of -32.68 indicates that the clustering of turbines is sta-tistically significant at the county level. The K-function test shows that the wind turbines are clustered since the observed values (red) are above the expected values (blue) (See Figure 1). The distance of the clustering is out to more than 8500 meters or four miles. This means that the distributions of the wind turbines in Gilliam County are indeed clustered.
Mapping of the hazardous waste, municipal landfills, and wind farms in the Pacific Northwest illustrates that the clustering of wind farms in rural communities (See Map 2). The red circles show locations of hazardous
Friang
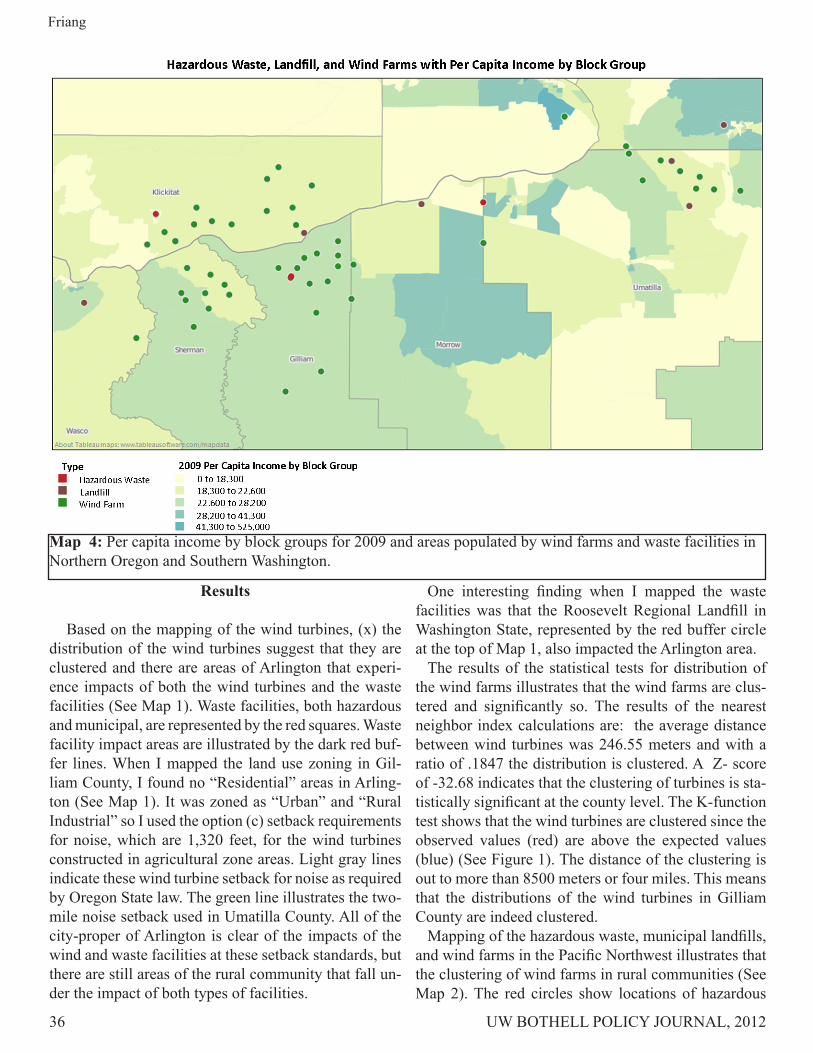
Map 4: Per capita income by block groups for 2009 and areas populated by wind farms and waste facilities in Northern Oregon and Southern Washington.
UW BOTHELL POLICY JOURNAL, 2012 37
waste facilities dealing with 3000 or more times of haz-ardous waste per year. The brown circles are municipal landfills and the green circles are wind farms. Some of the communities with clustered wind farms also con-tained either a hazardous waste facility or municipal landfill.
The map (See Map 2) of Washington, Oregon, and Idaho illustrating the locations of the hazardous waste facilities, landfills, and wind farms shows clustering of wind farms in specific areas such as North-Central Or-egon, Southern Washington and Southeastern Idaho.
Maps 3 and 4 depict the per capita income by block group for each county in the Pacific Northwest. These maps are overlaid with the facilities map and shows nu-merous windfarms and landfills in communities with incomes below $41,000. Closer investigation in Map 4 reveals many locations in Northern Oregon and South-ern Washington with multiple facilities and average in-comes below $28,000.
Conclusion
Wind farms surround Arlington. If you take into con-sideration the two mile setback, used in the neighbor-ing Umatilla County, the entire city of Arlington could be impacted by the noise of wind turbines (See Map 1). This means that most of the residents could be at risk from noise issues, vibrations and flicker effects as-sociated with the wind turbines. This also expands the parts of the community that could be potentially under impacts of both the wind turbines and also the waste facilities if the two mile buffer setback was used. The combination of these two different types of facilities in one place, tip the scales of equity against the citizens of Arlington.
Since Arlington, Oregon is considered an agricul-tural community, the larger setback requirements for wind farm construction do not apply. Wind turbines can be constructed within 1,320 feet of a residence. This smaller setback requirement leads to wind turbines be-ing located closer to residents in the agricultural com-munity than in a regular residential zone and puts these rural residents, who are already at risk from nearby hazardous waste facilities, at a greater risk of health impacts from these turbines. Expanding the setback re-quirements for all areas creates a safe zone in which to operate these facilities and decreases the health impacts to the population.
The analysis of the Pacific Northwest data depicted many low-income communities, besides Arlington, Or-
egon, dealing with the combined impacts of energy and hazardous waste facilities. This shows that Arlington’s experience is not isolated but has been repeated in loca-tions across the region. The clustering of the wind farms in places that are already home to hazardous waste fa-cilities concentrates the impacts to a smaller popula-tion in number, but compounds the health risks to these individuals. This is the inequitable distribution that re-searchers and activist groups have worked to change (Abel, 2008; Atlas, 2001; Bullard, et al., 2008; Krieg and Faber, 2004). Renewable energy facilities also pose health risks to the public and should be treated the same as any other large scale facility in the siting policies for the permitting process. By holding all large scale industries, “green” or not, to the same siting standards and creating policies that will limit the number of facili-ties that can operate in one area, the health risks to the public are diminished and communities like Arlington will be safer places to live.
Acknowledgements
I would like to thank the following people who helped in this research project. Professor Gwen Ottinger for mentoring me through this research process and encour-aging me to take on the challenge. Eric Hopson for his research skills and enthusiasm. Professor Jin-Kyu Jung and Professor Santiago Lopez for their guidance in the creation of the maps and the statistical analysis. The helpful, patient writing consultants from the University of Washington Bothell Writing Center. This research was funded by an Undergraduate Research Award from the University of Bothell, Department of Undergradu-ate Research.
References
Abel, T. D. (2008). Skewed riskscapes & environmental injustice: A case study of metropolitab St Louis. Environmental Man-agement, 42(2), 232-248.
Environmental Protection Agency. (2012, February 12). Tox-ics release inventory program. Retrieved from TRI Data and Tools: http://www.epa.gov/tri/tridata/index.html
Atlas, M. K. (2001). Safe and sorry: Risk, environmental equity, and hazardous waste management facilities. Risk Analysis, 21(5), 939-954.
Brainard, J. S., Jones, A. P., Bateman, I. J., & Lovett, A. A. (2004). Exposure to environmental urban noise pollution in Birmingham UK. Urban Studies, 41(13), 2581-2600.
Inequitable Distribution
38 UW BOTHELL POLICY JOURNAL, 2012
Bull, C. N., Krout, J. A., Rathbone-McCuan, E. P., & Shreffler, M. J. (2001). Access and issues of equity in remote/rural areas. Journal of Rural Health, 17(4), 356-359.
Bullard, R. D., Mohai, P., Saha, R., & Wright, B. (2008). Toxic wastes and race at twenty: Why race still matters after all these years. Environmental Law, 38(2), 371-412.
Idaho, S. o. (2012). Landfills in Idaho. Retrieved 2012, from Idaho Department of Environmental Quality: http://www.deq.idaho.gov/waste-mgmt-remediation/solid-waste/landfills.aspx
Kreig, E. J., & Faber, D. R. (2004). Not so black and white: Environmental justice and cumulative impact assessments. Environmental Impact Assessment Review, 24(7-8), 667-694.
Mitchell, A. (2009). The ESRI Guide to GIS Analysis. Redlands, California: ESRI Press.
Oregon Department of Energy (2011, December). Energy facility siting. Retrieved from http://www.oregon.gov/ENERGY/SIT-ING/standards.shtml
Oregon Department of Environmental Quality. (2012). Oregon’s Solid waste active permitted facilities. Retrieved from http://www.deq.state.or.us/lq/sw/disposal/permittedfacilities.htm
Renewable Northwest Project. (2012). Renewable energy proj-ects. Retrieved from http://rnp.org/project_map
Tipler, S. (2011, July 1). The future of wind development. Retrieved from East Oregonian: http://www.eastoregonian.com/news/the-future-of-wind-development/article_43ab3232-a41c-11e0-ae78-001cc4c03286.html
U.S. Census Bureau . (2011, August 17). American factfinder. Retrieved from http://2010.census.gov/2010census/
Washington, S. o. (2012). Washington state department of ecol-ogy. Retrieved from Solid Waste and Recycling Data: http://www.ecy.wa.gov/programs/swfa/solidwastedata/
Waste Management Northwest. (2011). Waste Management Northwest – Oregon 2011. Retrieved from http://www.wm-northwest.com/oregon.html
Friang