Embed Size (px)
Citation preview
Inequality in sub-Saharan Africa: a synthesis of recent research on the levels, trends, effects and determinants of inequality in its different dimensions
Christiana Okojie and Abebe Shimeles
February 2006
The Inter-Regional Inequality Facility
Secretariat: Overseas Development Institute 111 Westminster Bridge Road
London SE1 7JD UK
ii
This study was sponsored by the Inter-Regional Inequality Facility. The Facility exists to promote inter-regional dialogue and knowledge sharing on the issue of inequality – how it affects development, and how it can be addressed by policy – between Africa, Asia and Latin America. The Facility funds research, exchanges and advocacy activities which strengthen South-South dialogue on this issue, and help build a coalition in favour of a more equal and inclusive development process. It is a collaboration between the African Development Bank, the African Union Commission, the Asian Development Bank, the Inter-American Development Bank, the New Partnership for African Development and the United Nations Economic Commission for Africa. It was established in September 2004, with initial funding from the UK Department for International Development. The Overseas Development Institute (ODI) in London is providing secretariat services to the Facility. More details about the Facility and its activities can be found at: www.odi.org.uk/inter-regional_inequality. Christiana Okojie is Professor of Development Economics at the Department of Economics and Statistics, University of Benin, Benin City, Nigeria; email: [email protected]. Abebe Shimeles is a member of the Department of Economics, University of Gothenburg, Sweden; e-mail: [email protected]. Acknowledgements The authors are grateful for the comments of participants at the meeting of the Inter-Regional Inequality Facility held at the UK Department for International Development, April 2005. ISBN: 0 85003 783 2
© Overseas Development Institute 2005
All rights reserved. No part of this publication may be reproduced, stored in a retrieval system, or transmitted in any form or by any means, electronic, mechanical, photocopying, recording or otherwise, without the prior written permission of the publishers.
iii
Contents
Executive Summary v
1. Introduction 1 1.1 Aims and objectives 1 1.2 Methodology 1 1.3 Overview 1 1.4 Structure of the paper 2
2. Levels of Inequality 3 2.1 Income/expenditure inequality 3 2.2 Asset inequality 4 2.3 Education inequalities 5 2.4 Inequalities in health and nutrition 7 2.5 Inequalities in use of public services 7 2.6 Labour market inequalities 8 2.7 Multi-dimensional inequality 9
3. Trends in Inequality in Africa 10 3.1 Income/expenditure inequality 10 3.2 Asset inequality 11 3.3 Education inequalities 11 3.4 Inequalities in health and nutrition 12 3.5 Inequalities in use of public services 12 3.6 Labour market inequalities 13
4. The Effects of Inequality 14 4.1 Effects on economic growth 14 4.2 Effects on rates of poverty reduction 14 4.3 The ‘growth-equity’ trade-off 15
5. The Determinants of Inequality 17
5.1 Income/expenditure inequality 17 5.2 Non-income inequalities 21
6. Summary and Conclusions 23
Bibliography 25
Annex 1: Institutional Sources 29

iv
v
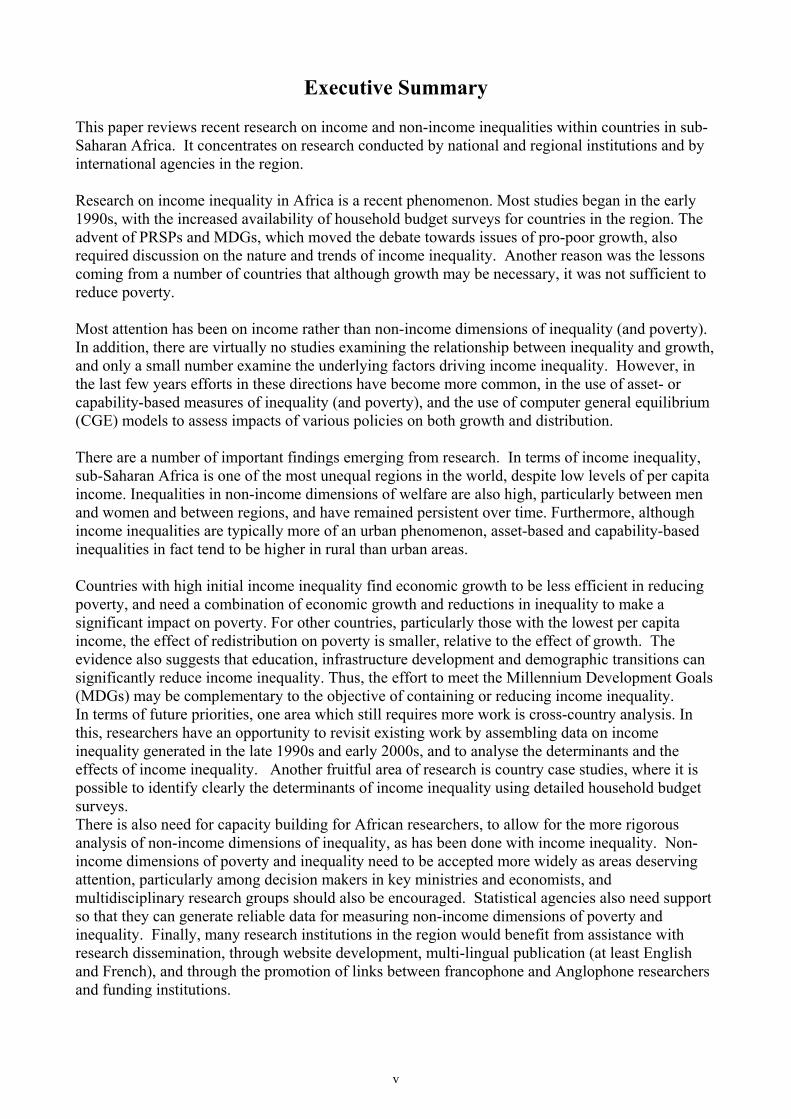
Executive Summary This paper reviews recent research on income and non-income inequalities within countries in sub-Saharan Africa. It concentrates on research conducted by national and regional institutions and by international agencies in the region. Research on income inequality in Africa is a recent phenomenon. Most studies began in the early 1990s, with the increased availability of household budget surveys for countries in the region. The advent of PRSPs and MDGs, which moved the debate towards issues of pro-poor growth, also required discussion on the nature and trends of income inequality. Another reason was the lessons coming from a number of countries that although growth may be necessary, it was not sufficient to reduce poverty. Most attention has been on income rather than non-income dimensions of inequality (and poverty). In addition, there are virtually no studies examining the relationship between inequality and growth, and only a small number examine the underlying factors driving income inequality. However, in the last few years efforts in these directions have become more common, in the use of asset- or capability-based measures of inequality (and poverty), and the use of computer general equilibrium (CGE) models to assess impacts of various policies on both growth and distribution. There are a number of important findings emerging from research. In terms of income inequality, sub-Saharan Africa is one of the most unequal regions in the world, despite low levels of per capita income. Inequalities in non-income dimensions of welfare are also high, particularly between men and women and between regions, and have remained persistent over time. Furthermore, although income inequalities are typically more of an urban phenomenon, asset-based and capability-based inequalities in fact tend to be higher in rural than urban areas. Countries with high initial income inequality find economic growth to be less efficient in reducing poverty, and need a combination of economic growth and reductions in inequality to make a significant impact on poverty. For other countries, particularly those with the lowest per capita income, the effect of redistribution on poverty is smaller, relative to the effect of growth. The evidence also suggests that education, infrastructure development and demographic transitions can significantly reduce income inequality. Thus, the effort to meet the Millennium Development Goals (MDGs) may be complementary to the objective of containing or reducing income inequality. In terms of future priorities, one area which still requires more work is cross-country analysis. In this, researchers have an opportunity to revisit existing work by assembling data on income inequality generated in the late 1990s and early 2000s, and to analyse the determinants and the effects of income inequality. Another fruitful area of research is country case studies, where it is possible to identify clearly the determinants of income inequality using detailed household budget surveys. There is also need for capacity building for African researchers, to allow for the more rigorous analysis of non-income dimensions of inequality, as has been done with income inequality. Non-income dimensions of poverty and inequality need to be accepted more widely as areas deserving attention, particularly among decision makers in key ministries and economists, and multidisciplinary research groups should also be encouraged. Statistical agencies also need support so that they can generate reliable data for measuring non-income dimensions of poverty and inequality. Finally, many research institutions in the region would benefit from assistance with research dissemination, through website development, multi-lingual publication (at least English and French), and through the promotion of links between francophone and Anglophone researchers and funding institutions.

vi
1
1. Introduction 1.1 Aims and objectives The purpose of this synthesis is to provide a review of recent research on income and non-income inequality within countries in sub-Saharan Africa by African research institutions. This includes research conducted by both national and regional institutions and by international agencies in the African region. The review is to be used as a basis for an inter-regional synthesis of work on inequality by Southern institutions, which will in turn identify the gaps in the existing body of work to be addressed in future work. It will also be used to identify Southern institutions working on inequality that can contribute to policy development. The measurement and analysis of poverty and inequality are crucial for cognitive purposes (to know what the situation is); for analytical purposes (to understand the factors determining this situation); for policymaking purposes (to design interventions best adapted to the issues); and for monitoring and evaluation purposes (to assess the effectiveness of current policies; and to determine whether the situation is changing) (Coudel, Hentschel and Wodon, 2002). Inequality, like poverty, is usually measured in monetary terms (income). However, inequality can also be measured in non-monetary dimensions such as health, nutrition, education and access to basic services. Changes in non-income aspects over time can also be assessed. Furthermore, an alternative to using a single dimension of inequality is to combine information on different dimensions, creating a measure that takes into account indicators such as health, education and assets. This synthesis focuses on inequality in both income and non-income dimensions of wellbeing in sub-Saharan Africa, and on research carried out under each of the following headings: The extent of inequality in income and non-income measures of wellbeing Trends in inequality in income and non-income measures of wellbeing The effects of inequality on rates of economic growth and progress toward the MDGs The determinants of inequality, both in terms of differences between countries and changes within countries over time 1.2 Methodology Much of the review in this study is based on research undertaken by such regional institutions as African Economic Research Consortium (AERC), United Nations Economic Commission for Africa (UNECA), World Bank (Africa Region), and African Development Bank (AfDB), and by national institutions and African nationals. A list of research institutions whose websites were accessed to identify completed or ongoing research is annexed. Where necessary, studies on income inequality sponsored by non-African institutions (e.g. WIDER, International Food Policy Research Institute (IFPRI), Cornell University, The Centre for the Study of African Economies in Oxford) and research by non-African scholars are cited for the sake of completeness. 1.3 Overview Research on income inequality in Africa is a recent phenomenon. Most of the works began in the early 1990s with the availability of household budget surveys for a number of African countries. In the mid-1990s, the AERC launched its collaborative project on 'Poverty, Income Distribution and Labour Market Issues in Africa', which in some way provided momentum for intellectual interest on income inequality issues in the discussion of poverty alleviation in the continent. The advent of
2
PRSPs and MDGs also changed the debate towards issues of pro-poor growth and pro-growth strategies. This by necessity required some amount of discussion on the nature and trend of income inequality (although in practice few PRSPs in Africa reported the extent of income inequality, let alone discussed its determinants and trends over time: see ECA, 2003a). Another related reason could be the lessons coming from a number of African countries (e.g. Ethiopia, Mozambique, Uganda, Rwanda and Lesotho) which cautioned that growth may be necessary, but not sufficient to reduce poverty (ECA, 2004). The main focus of the research on inequality by sub-Saharan African research institutions has been on income inequality as part of poverty analysis. Very few studies have addressed non-income dimensions of inequality. Several of the more recent research reports on non-income inequality are yet to be published. In addition, several of the studies of both income and non-income inequality are not by African institutions, although a few collaborative studies are available (between African and foreign institutions), mainly of income inequality. Most of the studies on non-income inequalities reviewed were descriptive and of tabular analysis; very few have carried out rigorous analysis of non-income inequality. 1.4 Structure of the paper The rest of the paper is organised as follows. Section 2 reviews empirical studies of inequalities within countries in sub-Saharan Africa in levels of income/expenditure, assets, education, health and nutrition, use of public service, wages and employment. Section 3 reviews similar evidence on recent trends in these inequalities. Section 4 then reviews evidence on the effects of inequality, and on economic growth and poverty reduction, including a discussion of the ‘growth-equity’ trade-off. Section 5 reviews evidence on the determinants of inequality in Africa, both in terms of reasons for differences in levels of inequality between countries in the region, and reasons for recent changes in inequality within countries in the region. Section 6 summarises and concludes the paper.
3
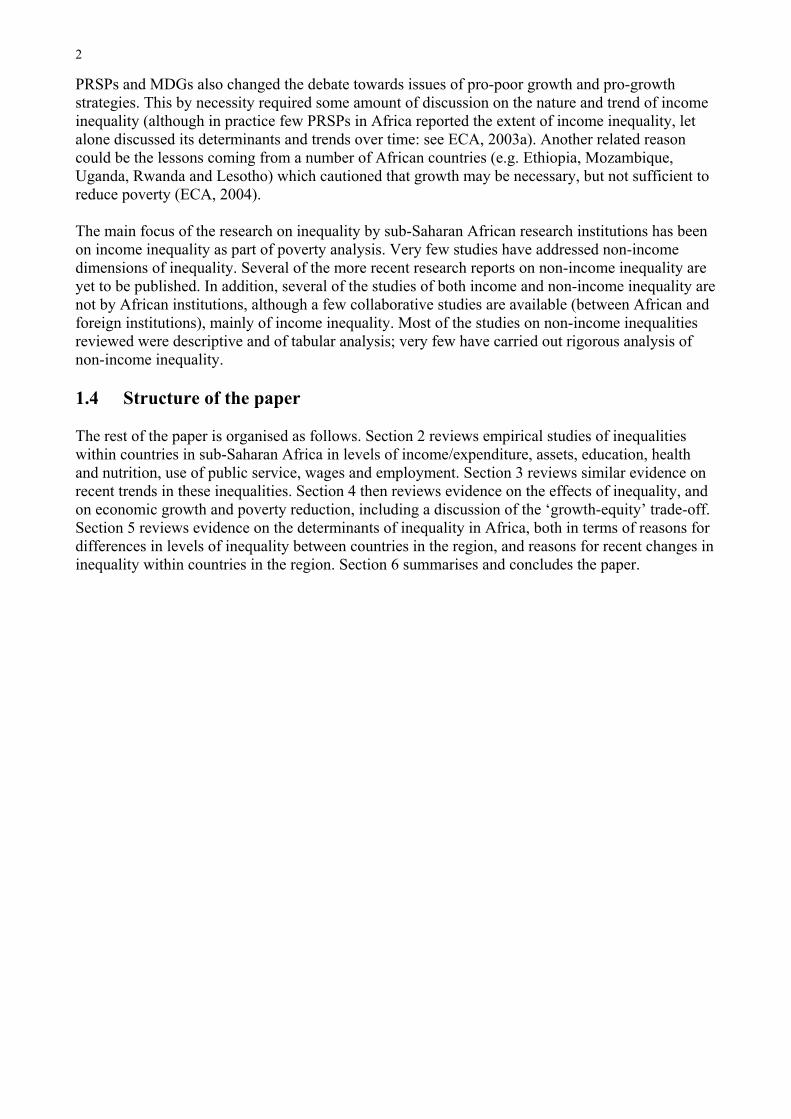
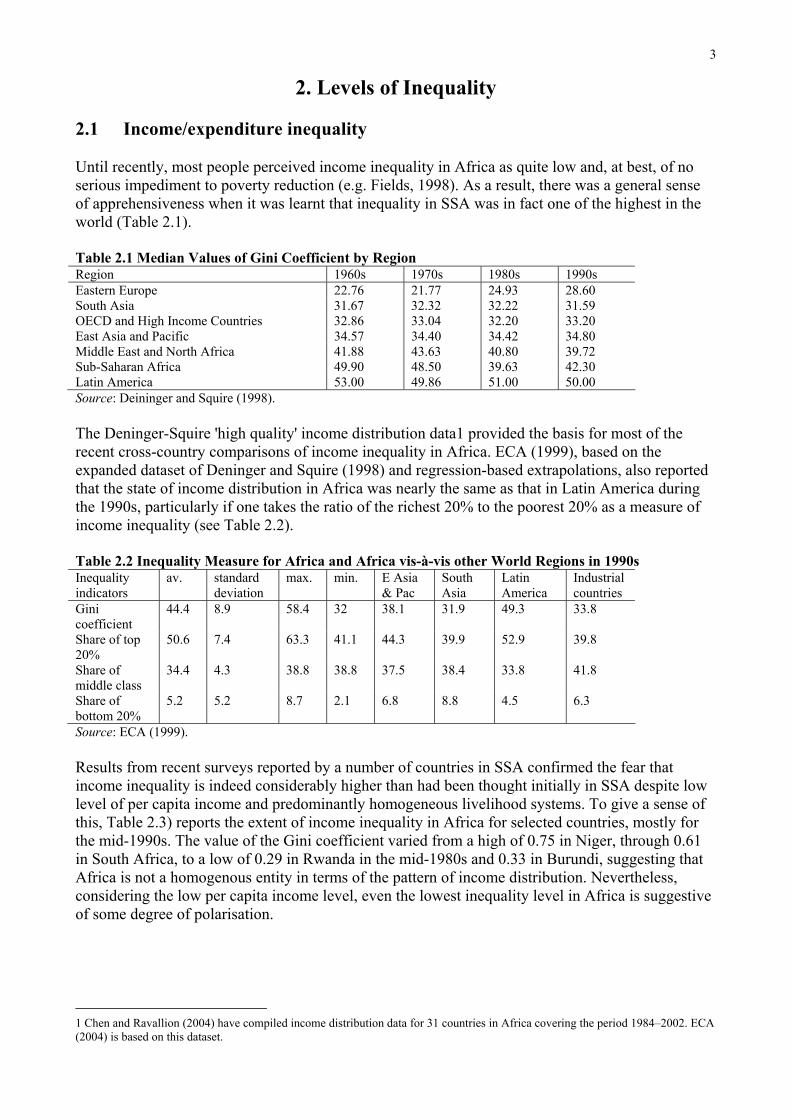
2. Levels of Inequality 2.1 Income/expenditure inequality Until recently, most people perceived income inequality in Africa as quite low and, at best, of no serious impediment to poverty reduction (e.g. Fields, 1998). As a result, there was a general sense of apprehensiveness when it was learnt that inequality in SSA was in fact one of the highest in the world (Table 2.1). Table 2.1 Median Values of Gini Coefficient by Region Region 1960s 1970s 1980s 1990s Eastern Europe 22.76 21.77 24.93 28.60 South Asia 31.67 32.32 32.22 31.59 OECD and High Income Countries 32.86 33.04 32.20 33.20 East Asia and Pacific 34.57 34.40 34.42 34.80 Middle East and North Africa 41.88 43.63 40.80 39.72 Sub-Saharan Africa 49.90 48.50 39.63 42.30 Latin America 53.00 49.86 51.00 50.00 Source: Deininger and Squire (1998). The Deninger-Squire 'high quality' income distribution data1 provided the basis for most of the recent cross-country comparisons of income inequality in Africa. ECA (1999), based on the expanded dataset of Deninger and Squire (1998) and regression-based extrapolations, also reported that the state of income distribution in Africa was nearly the same as that in Latin America during the 1990s, particularly if one takes the ratio of the richest 20% to the poorest 20% as a measure of income inequality (see Table 2.2). Table 2.2 Inequality Measure for Africa and Africa vis-à-vis other World Regions in 1990s Inequality indicators
av. standard deviation
max. min. E Asia & Pac
South Asia
Latin America
Industrial countries
Gini coefficient
44.4 8.9 58.4 32 38.1 31.9 49.3 33.8
Share of top 20%
50.6 7.4 63.3 41.1 44.3 39.9 52.9 39.8
Share of middle class
34.4 4.3 38.8 38.8 37.5 38.4 33.8 41.8
Share of bottom 20%
5.2 5.2 8.7 2.1 6.8 8.8 4.5 6.3
Source: ECA (1999). Results from recent surveys reported by a number of countries in SSA confirmed the fear that income inequality is indeed considerably higher than had been thought initially in SSA despite low level of per capita income and predominantly homogeneous livelihood systems. To give a sense of this, Table 2.3) reports the extent of income inequality in Africa for selected countries, mostly for the mid-1990s. The value of the Gini coefficient varied from a high of 0.75 in Niger, through 0.61 in South Africa, to a low of 0.29 in Rwanda in the mid-1980s and 0.33 in Burundi, suggesting that Africa is not a homogenous entity in terms of the pattern of income distribution. Nevertheless, considering the low per capita income level, even the lowest inequality level in Africa is suggestive of some degree of polarisation.
1 Chen and Ravallion (2004) have compiled income distribution data for 31 countries in Africa covering the period 1984–2002. ECA (2004) is based on this dataset.
4
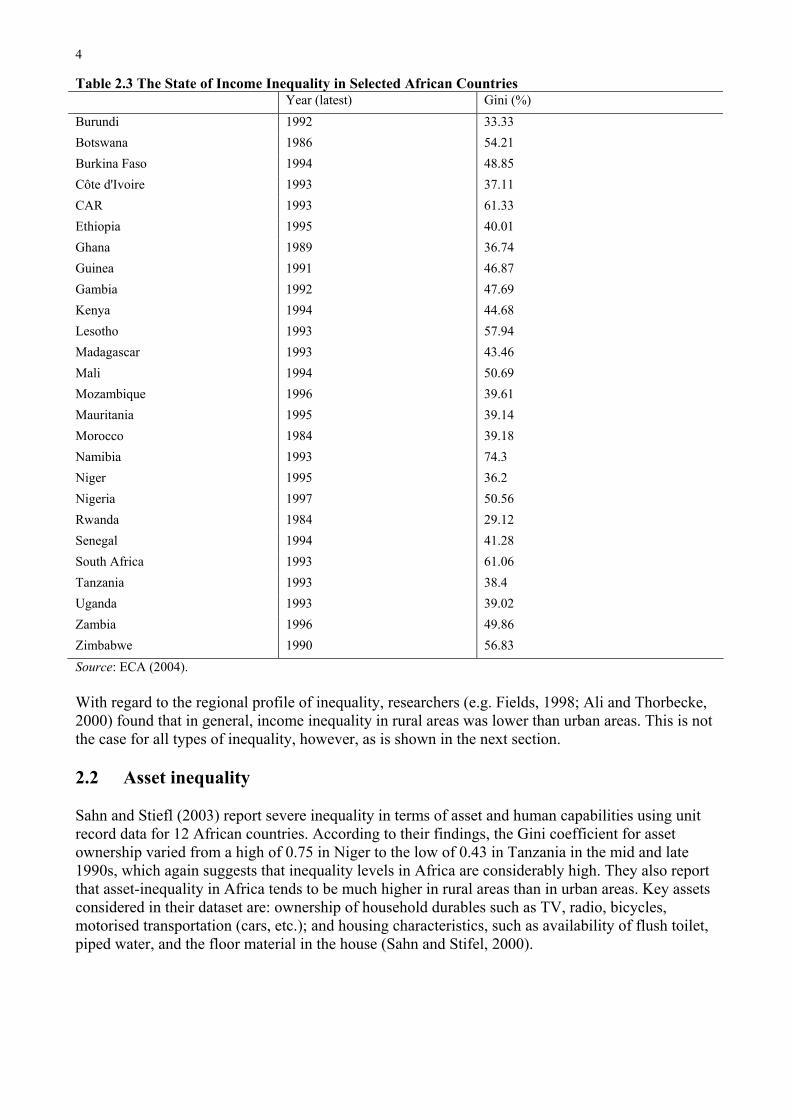
Table 2.3 The State of Income Inequality in Selected African Countries Year (latest) Gini (%) Burundi 1992 33.33 Botswana 1986 54.21 Burkina Faso 1994 48.85 Côte d'Ivoire 1993 37.11 CAR 1993 61.33 Ethiopia 1995 40.01 Ghana 1989 36.74 Guinea 1991 46.87 Gambia 1992 47.69 Kenya 1994 44.68 Lesotho 1993 57.94 Madagascar 1993 43.46 Mali 1994 50.69 Mozambique 1996 39.61 Mauritania 1995 39.14 Morocco 1984 39.18 Namibia 1993 74.3 Niger 1995 36.2 Nigeria 1997 50.56 Rwanda 1984 29.12 Senegal 1994 41.28 South Africa 1993 61.06 Tanzania 1993 38.4 Uganda 1993 39.02 Zambia 1996 49.86 Zimbabwe 1990 56.83 Source: ECA (2004). With regard to the regional profile of inequality, researchers (e.g. Fields, 1998; Ali and Thorbecke, 2000) found that in general, income inequality in rural areas was lower than urban areas. This is not the case for all types of inequality, however, as is shown in the next section. 2.2 Asset inequality Sahn and Stiefl (2003) report severe inequality in terms of asset and human capabilities using unit record data for 12 African countries. According to their findings, the Gini coefficient for asset ownership varied from a high of 0.75 in Niger to the low of 0.43 in Tanzania in the mid and late 1990s, which again suggests that inequality levels in Africa are considerably high. They also report that asset-inequality in Africa tends to be much higher in rural areas than in urban areas. Key assets considered in their dataset are: ownership of household durables such as TV, radio, bicycles, motorised transportation (cars, etc.); and housing characteristics, such as availability of flush toilet, piped water, and the floor material in the house (Sahn and Stifel, 2000).
5
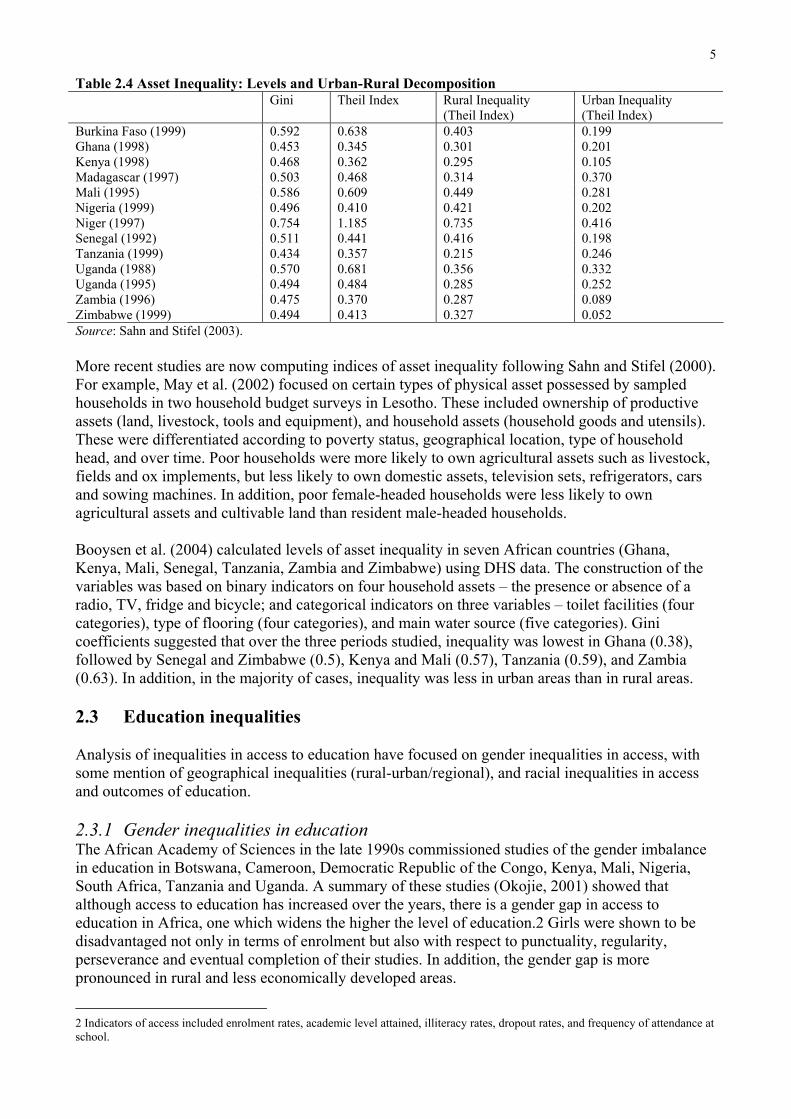
Table 2.4 Asset Inequality: Levels and Urban-Rural Decomposition Gini Theil Index Rural Inequality
(Theil Index) Urban Inequality (Theil Index)
Burkina Faso (1999) 0.592 0.638 0.403 0.199 Ghana (1998) 0.453 0.345 0.301 0.201 Kenya (1998) 0.468 0.362 0.295 0.105 Madagascar (1997) 0.503 0.468 0.314 0.370 Mali (1995) 0.586 0.609 0.449 0.281 Nigeria (1999) 0.496 0.410 0.421 0.202 Niger (1997) 0.754 1.185 0.735 0.416 Senegal (1992) 0.511 0.441 0.416 0.198 Tanzania (1999) 0.434 0.357 0.215 0.246 Uganda (1988) 0.570 0.681 0.356 0.332 Uganda (1995) 0.494 0.484 0.285 0.252 Zambia (1996) 0.475 0.370 0.287 0.089 Zimbabwe (1999) 0.494 0.413 0.327 0.052 Source: Sahn and Stifel (2003). More recent studies are now computing indices of asset inequality following Sahn and Stifel (2000). For example, May et al. (2002) focused on certain types of physical asset possessed by sampled households in two household budget surveys in Lesotho. These included ownership of productive assets (land, livestock, tools and equipment), and household assets (household goods and utensils). These were differentiated according to poverty status, geographical location, type of household head, and over time. Poor households were more likely to own agricultural assets such as livestock, fields and ox implements, but less likely to own domestic assets, television sets, refrigerators, cars and sowing machines. In addition, poor female-headed households were less likely to own agricultural assets and cultivable land than resident male-headed households. Booysen et al. (2004) calculated levels of asset inequality in seven African countries (Ghana, Kenya, Mali, Senegal, Tanzania, Zambia and Zimbabwe) using DHS data. The construction of the variables was based on binary indicators on four household assets – the presence or absence of a radio, TV, fridge and bicycle; and categorical indicators on three variables – toilet facilities (four categories), type of flooring (four categories), and main water source (five categories). Gini coefficients suggested that over the three periods studied, inequality was lowest in Ghana (0.38), followed by Senegal and Zimbabwe (0.5), Kenya and Mali (0.57), Tanzania (0.59), and Zambia (0.63). In addition, in the majority of cases, inequality was less in urban areas than in rural areas. 2.3 Education inequalities Analysis of inequalities in access to education have focused on gender inequalities in access, with some mention of geographical inequalities (rural-urban/regional), and racial inequalities in access and outcomes of education. 2.3.1 Gender inequalities in education The African Academy of Sciences in the late 1990s commissioned studies of the gender imbalance in education in Botswana, Cameroon, Democratic Republic of the Congo, Kenya, Mali, Nigeria, South Africa, Tanzania and Uganda. A summary of these studies (Okojie, 2001) showed that although access to education has increased over the years, there is a gender gap in access to education in Africa, one which widens the higher the level of education.2 Girls were shown to be disadvantaged not only in terms of enrolment but also with respect to punctuality, regularity, perseverance and eventual completion of their studies. In addition, the gender gap is more pronounced in rural and less economically developed areas.
2 Indicators of access included enrolment rates, academic level attained, illiteracy rates, dropout rates, and frequency of attendance at school.
6
Several other studies exist. In Kenya, Kimalu et al. (2001) showed that gross enrolment rates in primary education were lower for females than for males. While the gender gap is considerably reduced in access to primary education, the gap persists in access to secondary, and especially university education. When literacy rates are analysed, the male-female gap is much wider, the gap widens the higher the age group.3 Similar results were reported by Njeru and Orodho (2003), who showed that major gender and regional inequalities in access to secondary education persist although the gender gap has been considerably narrowed in Kenya. Similarly, an analysis of UPE enrolments in Uganda for 2001 showed that gender differentials persist, and the difference becomes more pronounced the higher the class level, suggesting that girls are more likely to drop out of school than boys (EPRC, 2002). In contrast, Kimalu et al. (2001) pointed out that in Botswana and Lesotho, females had higher gross enrolment rates in primary education than males, whereas Ethiopia has lower gross enrolment rates in primary education for females. Another study (Bedi et al., 2002) showed that females had higher completion rates in Kenya in 1998 and 1999 than males, unlike in the past. A study of poverty in Lesotho showed that, contrary to the situation in most other African countries, girls in Lesotho have higher school attendance rates than boys (May et al., 2002). In 1994–5, among 6–17 year olds, 77% of girls attended school compared with 66% of boys. This situation is attributed primarily to the traditional involvement of boys in the herding of livestock, and perception of parents that education is irrelevant for work in South African mines, viewed as the most promising job for Basotho men (ibid.). 2.3.2 Rural-urban/regional inequalities in education In Kenya, analysis of indicators of education confirms the existence of rural-urban and regional inequalities in access to education in African countries (Kimalu et al., 2001). Participation in primary education in Kenya is characterised by regional and gender disparities, a rising number of urban slum children not attending formal schools, and the enrolment rate not keeping pace with the increase of the relevant age group. There are wide variations in access to education between provinces, with the North Eastern Province reporting the lowest access rates to primary education. An analysis of dropout rates from primary education in Kenya showed that in 1993, North Eastern Province had the highest dropout rate for both boys and girls in the country, which may be partly explained by the nomadic way of life that the school-going-age population leads (ibid.). Similarly, an analysis of poverty in Ghana showed that urban dwellers and males had achieved higher levels of education and spent more years in school (Boateng et al., 2001). Again, several other studies exist. Okojie et al. (2000) show the existence of wide variations in literacy rates by state and rural-urban residence in Nigeria; in general, literacy rates are higher in the southern states of Nigeria than in states in the northern parts of the country. These trends were noticed at all levels of education; gross enrolment rates showed the same trends as for literacy rates. An analysis of educational attainment in Mozambique showed that Mozambique had substantial inequality in adult literacy rates between urban and rural areas (Dava et al., 2000). Literacy rates among those that have ever attended school is also lower in rural areas than in urban, reflecting differences in school dropout rates, school quality, or both. Furthermore, primary school enrolment was clearly higher in urban areas, for boy and for the non-poor, following the same patterns as adult education.
3 The study also examined primary school completion rates and dropout rates, as well as proportions of the total population and the working population who had attained various levels of education.
7
2.3.3 Racial inequalities in education In South Africa, Gelb (2003) showed that inequality in access to education has racial dimensions. Church-based schools were open to African children until the 1950s, when the apartheid government introduced ‘bantu education’ which focused on limited technical and vocational skills and instructions in the vernacular. The number of African children in schools increased, but they were concentrated in lower grades. Educational outcomes of African children remained poor even after government spending on education increased from the mid-1970s. In 1989, the African pupil-teacher ratio was 38:1 compared with 17:1 for whites; 52% of teachers in the African school system were under-qualified. African children’s pass rate in the school-leaving examination was only 41% compared with 96% for white children. Blacks were excluded from established English language universities from the 1950s and admitted only to segregated ‘bush colleges’ set up in the 1960s. In Namibia, Akinboade (2003) showed that for the Afrikaans, German and English-speaking population, who comprised only 13% of the population of 15 years old and above, share in the student population was 30% for secondary and 64% for tertiary population (ibid.). The indigenous population, with a share of nearly 90% of the student age population, represented only 32% of students at the tertiary level of education in Namibia. 2.4 Inequalities in health and nutrition Bhorat et al. (2004) examined variations in IMR in South Africa, and showed that variations in IMR exist, standing at 46 for Guateng, 68 for Kwazulu-Natal, and 53 for Limpopo Provinces respectively. The differences reflect differential access to basic health services in South Africa. Kwazulu-Natal also had the lowest life expectancy. The same study also showed that in South Africa, Limpopo Province had the lowest HIV prevalence rates: 14.5%, compared with 29.8% in Guateng and 33.5% in Kwazulu-Natal respectively. Limpopo Province, which is the poorest province in South Africa, performed best in terms of all health indicators, using poverty measures, suggesting that its rural nature and relative isolation is protecting it from the spread of HIV/AIDS. Gelb (2003) showed racial variations in HIV/AIDS prevalence; the figure was 12.9% among Africans, 6.2% among whites, 6.1% among coloureds and only 1.6% among Indians. In Kenya, analysis of HIV prevalence rates (IPAR, 2004) shows that women are more susceptible to HIV infection than men. The 2003 Demographic Health Survey showed that prevalence among women aged 15–49 was 9%, whereas it was 5% for men. Increasing violence against women and women’s economic vulnerability were major factors in women’s vulnerability to HIV/AIDS infection (IPAR, 2004). Similarly, Botswana data also showed that women are more vulnerable to HIV/AIDS; the male prevalence rate was about 83% of female prevalence rates. Poor households are also more vulnerable than non-poor households. The non-poor may be able to afford expensive private treatment using results of latest medical research, whereas poor households will be forced to rely on state medical provision (BIDPA, 2000). In Kenya, there are variations across regions in the nutritional status of young children, with Coast Province having the highest prevalence of chronic malnutrition stunting at 39.1%, followed by Eastern and Western provinces with 36.8% and 35%, respectively. Nairobi Province has the lowest prevalence rate, at 25.7% (Kimalu et al., 2004). In Mozambique, stunting is much higher in rural than in urban areas (Dava et al., 2000). 2.5 Inequalities in use of public services Several studies of access to healthcare services also show rural-urban and regional differences. In South Africa, access to healthcare in terms of distance to health clinics was better in Guateng Province (46% of households were within 15 minutes of a clinic) than in Limpopo (with 23% of
8
households being within 15 minutes reach) and Kwazulu-Natal (21% of households within 15 minutes reach) (Bhorat et al., 2004). In Mozambique, about 42% of rural and 80% of urban children complete a full set of vaccinations; as in the case of education, the large rural-urban difference dominates the gap between poor and non-poor (Dava et al., 2000). In Lesotho, most people, poor (70%) and non-poor (50%), have to travel more than five kilometres to get to main hospitals. There were also variations by district: access was much lower in the mountainous districts, such as Mokhotlong, Thaba Tseka and Quthing (May et al., 2002). In Senegal, Ki et al. (2004) showed that although 80.2% of urban households live within 30 minutes of a health centre, the corresponding figure for rural households is only 41.6%. In addition, although 71.8% of female-headed households live within a distance of 30 minutes, only 56.2% of male-headed households do so. Regional differentials also exist, with Dakar the capital being the most favoured. Kimalu et al. (2004) showed that there were rural-urban inequalities in access to potable water in Kenya. Over 50% of the urban population had access to piped water in 1993 and 1998 whereas less than 13% of the rural population had access. More than 40% of the rural population uses river and stream water sources. There are variations across regions, with 0.4% of the Nairobi population using river/stream water and Nyanza and Western provinces at 52.7% and 50.1%, respectively (ibid.). In Nigeria, wide variations exist between states in access to basic services such as potable water, sanitation and electricity (Okojie et al., 2000); in some states, less than 20% of the population has access to piped water. In Lesotho, urban dwellers had greater access (91%) to safe water than rural households (50%) (May et al., 2002). In Senegal, Ki et al. (2004) showed that 81.3% of urban households had access to potable water in contrast with only 32.2% of rural households. Access was highest (90.8%) in Dakar, the national capital, whereas Ziguinchor region had the lowest access, at only 19.3% of households. Each of these studies also shows the existence of urban-rural differentials in sanitation facilities. 2.6 Labour market inequalities Studies that focus on labour markets come mainly from South Africa, focusing on the link between the labour market and household inequality (Leibbrandt et al., 1999; Leibbrandt and Woolard, 1999). Their sensitivity analysis shows that labour income is the key determinant of income inequality in society, and that wages have a dominant influence on South Africa’s inequality. Studies have also shown that whites dominate professional and management positions whereas Africans are mainly artisans and operators, found in services, craft and related occupations and the Armed Forces (Van der Berg and Bhorat, 1999; Orr, 2000). Unemployment rates are higher among African women and men than among their white counterparts. Gender disparities in the South African labour market are also significant. 43% of African males of working age are formal sector employees, whereas only 17% of African females are in the same position. More African females are in self-employment and domestic service, and more of them are also unemployed, in school or engaged in household activities. Racial differences also exist within females in the labour force: 17% of Africans, 36% of coloureds and 45% of whites are in formal jobs (Van der Berg and Bhorat, 1999). African and coloured women are more likely to be found in elementary occupations (Orr, 2000). As a result of occupational segmentation, women suffer wage discrimination in the labour market. Women earn substantially less than men: in 2001, the ratio of male to female earnings was 0.654 (Casale, 2004). Similar evidence is presented in Gelb (2003) and Hinks (2004). In Kenya, gender and regional disparities also exist in the labour market. The national unemployment rate in Kenya for the population aged 10 years and above was 7.9% in 1989, with females having a higher rate of 8.2% relative to 7.6% for males. North Eastern Province had the highest unemployment rate (16.5%), followed by Nairobi Province with 15.6%. Eastern Province
9
had the lowest rate, at 4.4%. The overall urban unemployment rate was 14.8%, with North Eastern Province leading with 30.1%. Rural areas had a lower unemployment rate of 6.3% (Kimalu et al., 2001). In a review of employment and trade union movement in Côte d’Ivoire by the Centre Ivorian de Recherches Economiques et Socials (CIRES), Binam (n.d.) showed that unemployment was more a phenomenon of urban areas, where more than 90% of the unemployed converge, and that more women (65.4%) than men (60.6%) experienced prolonged unemployment. 2.7 Multi-dimensional inequality Ki et al. (2004) adopted a non-monetary approach to the analysis of poverty and inequality in Senegal with the aid of multidimensional indicators. The final variables included education, access to primary school (within 30 minutes), access to secondary school, access to potable water, access to health services, nutrition variables, type of habitation, energy, communication (TV, radio, public transport). A composite measure of poverty calculated from these variables showed that poverty was much higher in the rural areas (91.3%) than in urban areas (19.8%). With reference to inequality, Gini coefficients and Entropy indices were calculated. Overall, inequality was higher using the monetary index than the non-monetary index, with the Lorenz curve for the non-monetary index lying above that for the monetary measure. For both indices, the study found that inequality was higher in the rural than in the urban areas. A similar analysis using non-income measures of poverty is in progress for Côte d’Ivoire (Sylla et al., 2004).
10
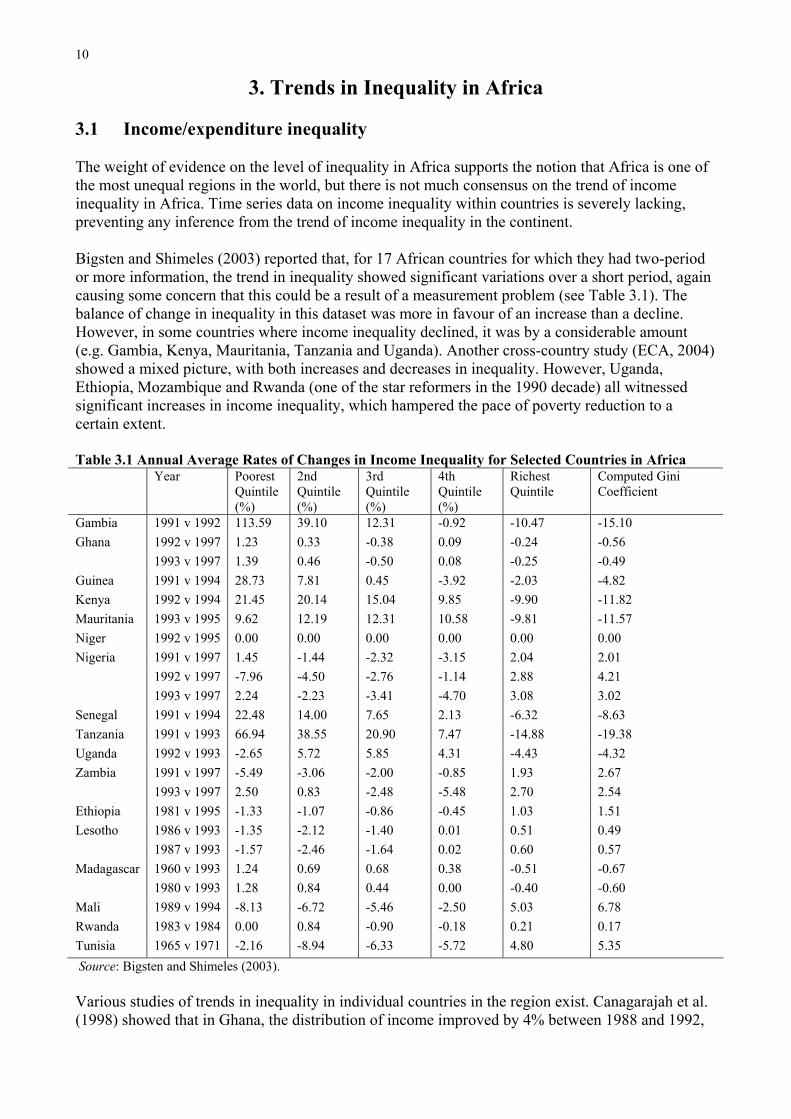
3. Trends in Inequality in Africa 3.1 Income/expenditure inequality The weight of evidence on the level of inequality in Africa supports the notion that Africa is one of the most unequal regions in the world, but there is not much consensus on the trend of income inequality in Africa. Time series data on income inequality within countries is severely lacking, preventing any inference from the trend of income inequality in the continent. Bigsten and Shimeles (2003) reported that, for 17 African countries for which they had two-period or more information, the trend in inequality showed significant variations over a short period, again causing some concern that this could be a result of a measurement problem (see Table 3.1). The balance of change in inequality in this dataset was more in favour of an increase than a decline. However, in some countries where income inequality declined, it was by a considerable amount (e.g. Gambia, Kenya, Mauritania, Tanzania and Uganda). Another cross-country study (ECA, 2004) showed a mixed picture, with both increases and decreases in inequality. However, Uganda, Ethiopia, Mozambique and Rwanda (one of the star reformers in the 1990 decade) all witnessed significant increases in income inequality, which hampered the pace of poverty reduction to a certain extent. Table 3.1 Annual Average Rates of Changes in Income Inequality for Selected Countries in Africa Year Poorest
Quintile (%)
2nd Quintile (%)
3rd Quintile (%)
4th Quintile (%)
Richest Quintile
Computed Gini Coefficient
Gambia 1991 v 1992 113.59 39.10 12.31 -0.92 -10.47 -15.10 Ghana 1992 v 1997 1.23 0.33 -0.38 0.09 -0.24 -0.56 1993 v 1997 1.39 0.46 -0.50 0.08 -0.25 -0.49 Guinea 1991 v 1994 28.73 7.81 0.45 -3.92 -2.03 -4.82 Kenya 1992 v 1994 21.45 20.14 15.04 9.85 -9.90 -11.82 Mauritania 1993 v 1995 9.62 12.19 12.31 10.58 -9.81 -11.57 Niger 1992 v 1995 0.00 0.00 0.00 0.00 0.00 0.00 Nigeria 1991 v 1997 1.45 -1.44 -2.32 -3.15 2.04 2.01 1992 v 1997 -7.96 -4.50 -2.76 -1.14 2.88 4.21 1993 v 1997 2.24 -2.23 -3.41 -4.70 3.08 3.02 Senegal 1991 v 1994 22.48 14.00 7.65 2.13 -6.32 -8.63 Tanzania 1991 v 1993 66.94 38.55 20.90 7.47 -14.88 -19.38 Uganda 1992 v 1993 -2.65 5.72 5.85 4.31 -4.43 -4.32 Zambia 1991 v 1997 -5.49 -3.06 -2.00 -0.85 1.93 2.67 1993 v 1997 2.50 0.83 -2.48 -5.48 2.70 2.54 Ethiopia 1981 v 1995 -1.33 -1.07 -0.86 -0.45 1.03 1.51 Lesotho 1986 v 1993 -1.35 -2.12 -1.40 0.01 0.51 0.49 1987 v 1993 -1.57 -2.46 -1.64 0.02 0.60 0.57 Madagascar 1960 v 1993 1.24 0.69 0.68 0.38 -0.51 -0.67 1980 v 1993 1.28 0.84 0.44 0.00 -0.40 -0.60 Mali 1989 v 1994 -8.13 -6.72 -5.46 -2.50 5.03 6.78 Rwanda 1983 v 1984 0.00 0.84 -0.90 -0.18 0.21 0.17 Tunisia 1965 v 1971 -2.16 -8.94 -6.33 -5.72 4.80 5.35 Source: Bigsten and Shimeles (2003). Various studies of trends in inequality in individual countries in the region exist. Canagarajah et al. (1998) showed that in Ghana, the distribution of income improved by 4% between 1988 and 1992,
11
mainly in rural areas and in cities other than Accra, the capital. They attributed this phenomenon to the reform programme that improved the terms of trade in favour of the rural poor in farm and non-farm activities. However, unlike Ghana, Tanzania experienced a rising trend in inequality after the economic reform; the Gini coefficient rose by 20 percentage points (from 52 to 72) between 1983 and 1991 (Ferreira, 1996).4 Demombynes and Hoogeveen (2004) reported a relatively mild increase – i.e. of one percentage point – in the levels of inequality in Tanzania during the period 1991–2000. Fofack et al. (2001) showed that in Burkina Faso, inequality rose during the period 1994–8, whereas in the case of Nigeria, Canagarajah and Thomas (2001) observed that the Gini coefficient rose by 16% from 0.387 in 1985 to 0.45 in 1992. In Uganda, Appleton et al. (1999) found out that inequality declined during the period 1992–7: the Gini coefficient dropped from 0.382 in 1992 to 0.358 in 1997–8 while headcount poverty also declined, from 55.5% to 44%. They also showed that consumption per adult equivalent increased by 29% for the bottom deciles, while the second and third deciles experienced an increase of 23% and 21%, respectively. However, Uganda experienced a reversal of trend between 1997 and 2003, when income inequality surged by eight percentage points, accompanied by a drop in the rate of economic growth (Ssewanyana et al., 2004). Inequality increased by 18% between 1992–3 and 2002–3; the increase, 23%, is much sharper between 1997 and 2002–3. In Zambia, between 1991 and 1996, inequality dropped by four percentage points, from 0.559 to 0.518; the Gini coefficient further dropped to 0.509 in 1998 (McCulloch et al., 2000). Disaggregating the national figure shows that during 1996–8, although the Gini coefficient increased in both rural and urban areas, inequality at the national level fell, owing to a faster growth of expenditure in the rural areas as compared with the urban areas (ibid.). 3.2 Asset inequality Booysen et al. (2004) examined trends in inequality using asset indices in seven African countries (Ghana, Kenya, Mali, Senegal, Tanzania, Zambia and Zimbabwe) using DHS data. The analysis showed that five countries out of the seven experienced improvements in overall inequality, and only Zambia showed a clear increase in inequality. However, four countries showed a clear increase in urban inequality, and only four countries showed a reduction in rural inequality. 3.3 Education inequalities Although figures from international agencies suggest that rural-urban and gender inequalities in education are on the decline, only a few institutes have focused on inequalities in education. The three available recent studies examining trends in education are for Kenya (Njeru and Orodho, 2003; Bedi et al., 2002; Kimalu et al., 2001). Njeru and Orodho (2003) showed that gross enrolment rates in secondary education had declined and that gender and regional inequalities in access to secondary education persist, with the hardest hit regions being the arid and semi-arid lands and the medium to low agricultural potential areas. Bedi et al. (2002), however, showed that despite variations in the overall GER, the gender gap in primary education has narrowed considerably, and since 1989 has ranged between three and four percentage points. Nevertheless, the analysis also showed that regional differences in enrolment rates are substantial: in 1990, the central and western regions of the country had the highest enrolment rates, at around 104%. North Eastern Province had the lowest rate, at around 24%, followed, somewhat surprisingly, by Nairobi, at around 66%. During the 1990s, enrolment rates fell in nearly all the provinces. The sharpest declines were in
4 Ferreira noted that the agricultural price policy reform during this period did not benefit all farmers equally. Specifically, the poor and less efficient farmers could not reap the benefit of the reform and hence the level of inequality has widened significantly.
12
Nairobi and Central Province. Similar results – declining trends in primary enrolment rates and persisting inequalities between regions – are reported by Kimalu et al. (2001). 3.4 Inequalities in health and nutrition Analysis of Kenya shows that infant and under-five mortality rates increased between 1992 and 1998, whereas life expectancy fell (Kimalu et al., 2004). Female and male average years of living declined from 58.4 and 55.3 years in 1992 to 51.9 and 50.2 years in 1998, respectively, implying that the gap between female and male life expectancy fell. The decline may be partly explained by increased poverty and HIV/AIDS. The same study showed that there was also a general decline in immunisation across the provinces. In 1998, 84.8% of children aged 12–23 months in Central Province had received all vaccinations, compared with 92.6% in 1993. Nyanza and Western provinces recorded vaccination coverage of 46.5% and 56.2% in 1998, respectively, compared with 69.7% and 69.5% in 1993, thus indicating a widening of regional differentials. In a similar manner, a study costing the MDGs for Uganda showed that between 1994–5 and 1998–9, there was a significant decline in immunisation coverage. Immunisation coverage from measles declined from 82% to 49%, DPT from 74% to 38%, BCG from 96% to 69%, and tetanus for pregnant women from 74% to 38% (EPRC, 2002). The decline owed to factors such as changing structure of service delivery mechanism and shifts in donor policies. In terms of nutrition, the 2003 Kenya Demographic and Health Survey showed that there were marginal improvements between 1998 and 2003. However, gender and rural-urban differences still persisted for all nutrition status indicators (Kimalu et al., 2004). A study by Nakabo-Ssewanyana (2003) based on the panel households of the Uganda National Household Survey (UNHS) for 1992–3 and 1999–2000, revealed that stunting decreased more among the richer population than the poor population. 3.5 Inequalities in use of public services A Lesotho study (May et al., 2002) showed that in 1986, 30% of the total population had access to safe drinking water: 27% of the poor and 35% of the non-poor. By 1994, 63% of the total population had access to safe water: 55% of the poor and 75% of the non-poor. The changes were more impressive for non-poor than for poor households and for urban dwellers. Leibbrandt et al. (2004), in an analysis of trends in inequality in South Africa between 1996 and 2001, showed that inequalities in access to safe water between African and other racial groups still remained: access increased from 73.6% to 78.3% for African households; over 90% of other racial groups had access. In Uganda, an Economic Policy Research Centre study (2002) also showed that, while access to water and sanitation had improved over the years, rural-urban inequalities still exist. In Cameroon, Emini et al. (2004) presented data showing that access to potable water increased from 73.6% of the urban population in 1996 to 86.2% by 2001; the corresponding increase for rural areas was from 25.5% to 31.3%. Thus, there was still a pronounced rural-urban gap in access to potable water. In Lesotho, access to sanitation also improved between the two years surveyed, but a sizeable disparity still existed between poor and non-poor households; in non-poor households, the percentage of households without sanitation halved between the two surveys. The figure improved slightly for poor and very poor households, increasing from 61.8% to 69.5% (May et al., 2002). Leibbrandt et al. (2004) showed that in South Africa during the period 1996 and 2001, there was an increase in the proportion of households using flush toilets, from 50.3% in 1996 to 53.4% by 2001, but inequalities between African and others persisted. As at 2001, only 41.6% of African households had flush toilets compared with over 90% of households for other races (97.9% for whites, 97.5% for Asians and 83.8% for coloureds).
13
3.6 Labour market inequalities Casale (2004) examined trends in employment and earnings of men and women in the South African labour market for the period 1995–2001. The aim was to provide a descriptive analysis of how the position of women differs from that of men, and how the relative positions changed as female employment increased in the period under review. The findings were that, among the employed as a whole and among the employed within each race group, women consistently earned less than men for both time periods. Earnings were also lower for Africans compared with whites. Thus, earnings differentials persisted over time along both gender and racial lines in South Africa. The analysis also showed that the fall in female earnings (real incomes) is driven by the decline in earnings of African women. Mean real earnings fell by 27.4% between 1995 and 2001, while median real earnings fell by 48.6% for the same period. In contrast, among white women, both average and median real earnings increased by 12.7% and 9.6% respectively. Among men, real earnings fell for both race groups, although the fall was much higher among African men than among white men. Regardless of race group, women were earning less than men on average in 2001 as in 1995. The ratio of female to male earnings hardly changed – from 0.654 in 1995 to 0.656 in 2001. There were differentials between males and females: the position of African women deteriorated compared with African men. There was a substantial decline in the ratio of female to male earnings among Africans, declining from 0.792 in 1995 to 0.718 in 2001. Among whites, the position of women improved relative to that of men. Female to male earnings among whites increased from 0.498 to 0.612.
14
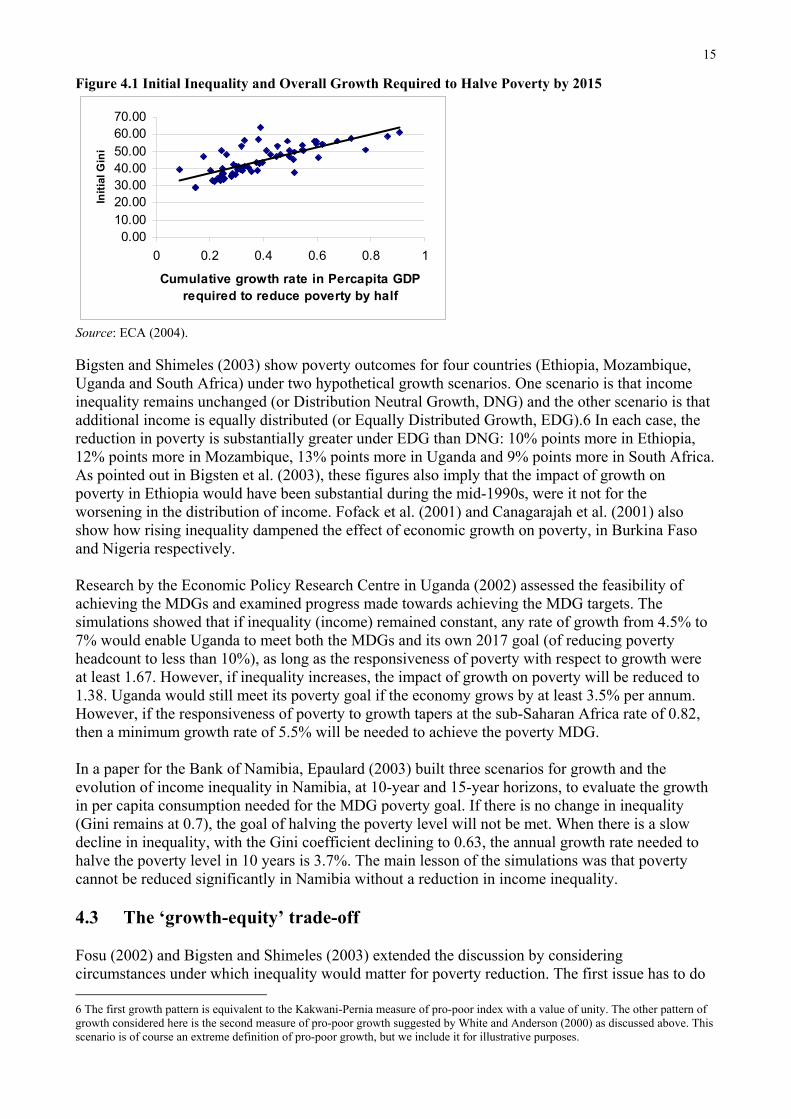
4. The Effects of Inequality 4.1 Effects on economic growth An issue of concern as far as Africa is concerned is the impact of inequality on subsequent growth. This issue has been debated extensively, mainly within the context of developed countries. Several arguments have been suggested as to why inequality could be harmful to growth in developing regions, such as Africa, including the possibility that high inequality could be a proxy for bad governance.5 However, there is little empirical work done in this area. Nel (2003) explored the effect of income inequality on subsequent growth using African data. Even if the statistical association is weak, the weight of evidence suggests that high inequality, possibly through its effect on political instability, might lead to a lower rate of economic growth. While this is plausible within the context of Africa’s recent experience (e.g. Bates, 2005), it is not in the case of some countries, which have had consistently high income inequality (Botswana, for example). Nor does it explain why other countries have witnessed rising inequality after political stability has been restored (e.g. Uganda, Ethiopia, Rwanda), or why the spurt of economic reform could be associated with more inequality (e.g. Tanzania, Lesotho and Zambia). Another study relating income inequality to growth in African countries was carried out for the World Institute for Development Economics Research (Odedokun and Round, 2001). However, there do not appear to be any studies by African research institutions assessing the effects of non-income indicators of inequality on economic growth. 4.2 Effects on rates of poverty reduction ECA (1999) investigated the rate of growth in real per capita GDP required to meet the target of reducing extreme poverty by half. According to the results, on average real GDP of sub-Saharan Africa would need to grow at a rate of 7% per annum to meet the target. Obviously, this growth rate was extremely high in comparison with what SSA had registered in the past four decades. Thus, ECA (1999) more or less concluded that Africa would need a substantial boost to its investment formation, as well as some degree of reduction in income inequality, if it were to achieve this global target. ECA (2004) extended this methodology to look at the role of initial inequality in affecting the overall growth required to meet the MDGs in a neutral growth scenario. The result reported in Figure 4.1 shows clearly that countries with high initial income inequality would need a higher acceleration in per capita GDP to meet the MDGs. In other words, the higher the initial level of income inequality, the lower the efficiency of economic growth in reducing poverty and vice versa. In this regard, ECA (2004) also attempted to compare actual rate of per capita growth with the pro-poor growth pattern to meet the MDGs. For most countries in SSA, containing inequality at its existing level reduces substantially the magnitude of growth required to meet the target of reducing poverty by half. The median annual rate of growth required to meet this target by 2015 is around 2.1%, a modest requirement for most countries in SSA.
5 Useful insight into the debate can be found in the works of Alesina and Rodrik (1994), Persson and Tabellini (1994), Bénabou (1994).
15
Figure 4.1 Initial Inequality and Overall Growth Required to Halve Poverty by 2015
0.0010.0020.0030.0040.0050.0060.0070.00
0 0.2 0.4 0.6 0.8 1
Cumulative growth rate in Percapita GDP required to reduce poverty by half
Initi
al G
ini
Source: ECA (2004). Bigsten and Shimeles (2003) show poverty outcomes for four countries (Ethiopia, Mozambique, Uganda and South Africa) under two hypothetical growth scenarios. One scenario is that income inequality remains unchanged (or Distribution Neutral Growth, DNG) and the other scenario is that additional income is equally distributed (or Equally Distributed Growth, EDG).6 In each case, the reduction in poverty is substantially greater under EDG than DNG: 10% points more in Ethiopia, 12% points more in Mozambique, 13% points more in Uganda and 9% points more in South Africa. As pointed out in Bigsten et al. (2003), these figures also imply that the impact of growth on poverty in Ethiopia would have been substantial during the mid-1990s, were it not for the worsening in the distribution of income. Fofack et al. (2001) and Canagarajah et al. (2001) also show how rising inequality dampened the effect of economic growth on poverty, in Burkina Faso and Nigeria respectively. Research by the Economic Policy Research Centre in Uganda (2002) assessed the feasibility of achieving the MDGs and examined progress made towards achieving the MDG targets. The simulations showed that if inequality (income) remained constant, any rate of growth from 4.5% to 7% would enable Uganda to meet both the MDGs and its own 2017 goal (of reducing poverty headcount to less than 10%), as long as the responsiveness of poverty with respect to growth were at least 1.67. However, if inequality increases, the impact of growth on poverty will be reduced to 1.38. Uganda would still meet its poverty goal if the economy grows by at least 3.5% per annum. However, if the responsiveness of poverty to growth tapers at the sub-Saharan Africa rate of 0.82, then a minimum growth rate of 5.5% will be needed to achieve the poverty MDG. In a paper for the Bank of Namibia, Epaulard (2003) built three scenarios for growth and the evolution of income inequality in Namibia, at 10-year and 15-year horizons, to evaluate the growth in per capita consumption needed for the MDG poverty goal. If there is no change in inequality (Gini remains at 0.7), the goal of halving the poverty level will not be met. When there is a slow decline in inequality, with the Gini coefficient declining to 0.63, the annual growth rate needed to halve the poverty level in 10 years is 3.7%. The main lesson of the simulations was that poverty cannot be reduced significantly in Namibia without a reduction in income inequality. 4.3 The ‘growth-equity’ trade-off Fosu (2002) and Bigsten and Shimeles (2003) extended the discussion by considering circumstances under which inequality would matter for poverty reduction. The first issue has to do 6 The first growth pattern is equivalent to the Kakwani-Pernia measure of pro-poor index with a value of unity. The other pattern of growth considered here is the second measure of pro-poor growth suggested by White and Anderson (2000) as discussed above. This scenario is of course an extreme definition of pro-poor growth, but we include it for illustrative purposes.
16
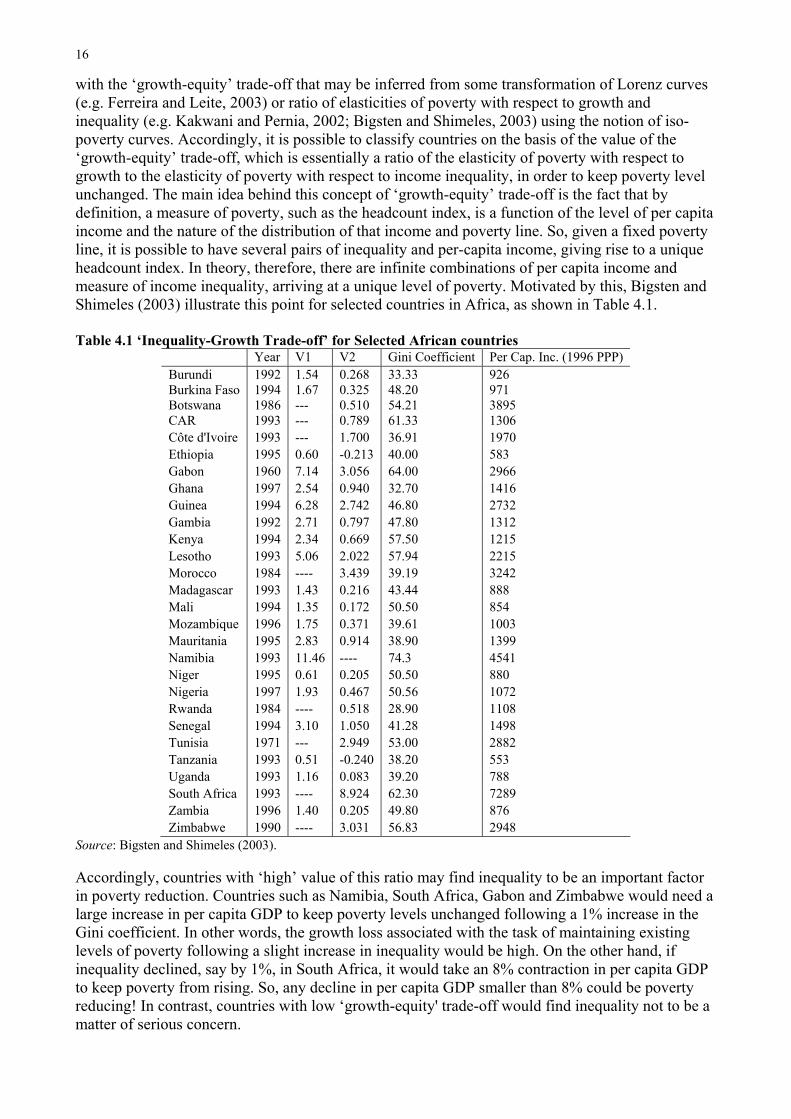
with the ‘growth-equity’ trade-off that may be inferred from some transformation of Lorenz curves (e.g. Ferreira and Leite, 2003) or ratio of elasticities of poverty with respect to growth and inequality (e.g. Kakwani and Pernia, 2002; Bigsten and Shimeles, 2003) using the notion of iso-poverty curves. Accordingly, it is possible to classify countries on the basis of the value of the ‘growth-equity’ trade-off, which is essentially a ratio of the elasticity of poverty with respect to growth to the elasticity of poverty with respect to income inequality, in order to keep poverty level unchanged. The main idea behind this concept of ‘growth-equity’ trade-off is the fact that by definition, a measure of poverty, such as the headcount index, is a function of the level of per capita income and the nature of the distribution of that income and poverty line. So, given a fixed poverty line, it is possible to have several pairs of inequality and per-capita income, giving rise to a unique headcount index. In theory, therefore, there are infinite combinations of per capita income and measure of income inequality, arriving at a unique level of poverty. Motivated by this, Bigsten and Shimeles (2003) illustrate this point for selected countries in Africa, as shown in Table 4.1. Table 4.1 ‘Inequality-Growth Trade-off’ for Selected African countries
Year V1 V2 Gini Coefficient Per Cap. Inc. (1996 PPP) Burundi 1992 1.54 0.268 33.33 926 Burkina Faso 1994 1.67 0.325 48.20 971 Botswana 1986 --- 0.510 54.21 3895 CAR 1993 --- 0.789 61.33 1306 Côte d'Ivoire 1993 --- 1.700 36.91 1970 Ethiopia 1995 0.60 -0.213 40.00 583 Gabon 1960 7.14 3.056 64.00 2966 Ghana 1997 2.54 0.940 32.70 1416 Guinea 1994 6.28 2.742 46.80 2732 Gambia 1992 2.71 0.797 47.80 1312 Kenya 1994 2.34 0.669 57.50 1215 Lesotho 1993 5.06 2.022 57.94 2215 Morocco 1984 ---- 3.439 39.19 3242 Madagascar 1993 1.43 0.216 43.44 888 Mali 1994 1.35 0.172 50.50 854 Mozambique 1996 1.75 0.371 39.61 1003 Mauritania 1995 2.83 0.914 38.90 1399 Namibia 1993 11.46 ---- 74.3 4541 Niger 1995 0.61 0.205 50.50 880 Nigeria 1997 1.93 0.467 50.56 1072 Rwanda 1984 ---- 0.518 28.90 1108 Senegal 1994 3.10 1.050 41.28 1498 Tunisia 1971 --- 2.949 53.00 2882 Tanzania 1993 0.51 -0.240 38.20 553 Uganda 1993 1.16 0.083 39.20 788 South Africa 1993 ---- 8.924 62.30 7289 Zambia 1996 1.40 0.205 49.80 876 Zimbabwe 1990 ---- 3.031 56.83 2948
Source: Bigsten and Shimeles (2003). Accordingly, countries with ‘high’ value of this ratio may find inequality to be an important factor in poverty reduction. Countries such as Namibia, South Africa, Gabon and Zimbabwe would need a large increase in per capita GDP to keep poverty levels unchanged following a 1% increase in the Gini coefficient. In other words, the growth loss associated with the task of maintaining existing levels of poverty following a slight increase in inequality would be high. On the other hand, if inequality declined, say by 1%, in South Africa, it would take an 8% contraction in per capita GDP to keep poverty from rising. So, any decline in per capita GDP smaller than 8% could be poverty reducing! In contrast, countries with low ‘growth-equity' trade-off would find inequality not to be a matter of serious concern.
17
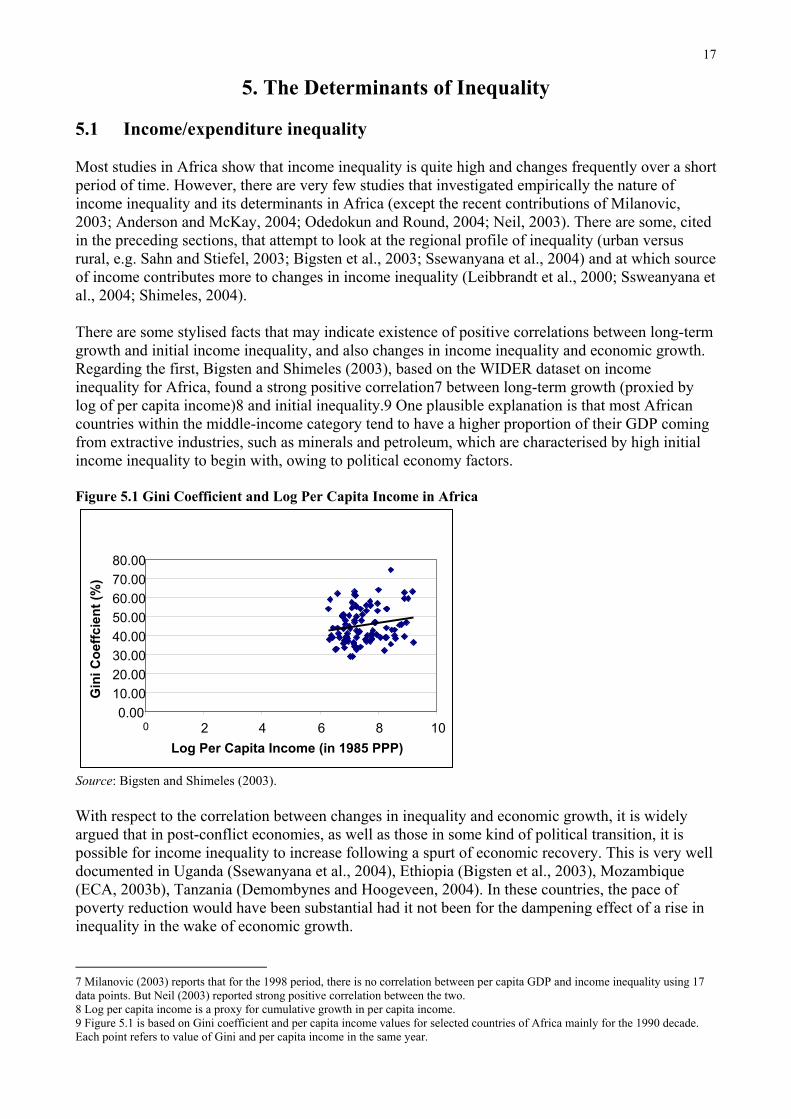
5. The Determinants of Inequality 5.1 Income/expenditure inequality Most studies in Africa show that income inequality is quite high and changes frequently over a short period of time. However, there are very few studies that investigated empirically the nature of income inequality and its determinants in Africa (except the recent contributions of Milanovic, 2003; Anderson and McKay, 2004; Odedokun and Round, 2004; Neil, 2003). There are some, cited in the preceding sections, that attempt to look at the regional profile of inequality (urban versus rural, e.g. Sahn and Stiefel, 2003; Bigsten et al., 2003; Ssewanyana et al., 2004) and at which source of income contributes more to changes in income inequality (Leibbrandt et al., 2000; Ssweanyana et al., 2004; Shimeles, 2004). There are some stylised facts that may indicate existence of positive correlations between long-term growth and initial income inequality, and also changes in income inequality and economic growth. Regarding the first, Bigsten and Shimeles (2003), based on the WIDER dataset on income inequality for Africa, found a strong positive correlation7 between long-term growth (proxied by log of per capita income)8 and initial inequality.9 One plausible explanation is that most African countries within the middle-income category tend to have a higher proportion of their GDP coming from extractive industries, such as minerals and petroleum, which are characterised by high initial income inequality to begin with, owing to political economy factors. Figure 5.1 Gini Coefficient and Log Per Capita Income in Africa
Source: Bigsten and Shimeles (2003). With respect to the correlation between changes in inequality and economic growth, it is widely argued that in post-conflict economies, as well as those in some kind of political transition, it is possible for income inequality to increase following a spurt of economic recovery. This is very well documented in Uganda (Ssewanyana et al., 2004), Ethiopia (Bigsten et al., 2003), Mozambique (ECA, 2003b), Tanzania (Demombynes and Hoogeveen, 2004). In these countries, the pace of poverty reduction would have been substantial had it not been for the dampening effect of a rise in inequality in the wake of economic growth. 7 Milanovic (2003) reports that for the 1998 period, there is no correlation between per capita GDP and income inequality using 17 data points. But Neil (2003) reported strong positive correlation between the two. 8 Log per capita income is a proxy for cumulative growth in per capita income. 9 Figure 5.1 is based on Gini coefficient and per capita income values for selected countries of Africa mainly for the 1990 decade. Each point refers to value of Gini and per capita income in the same year.
0.0010.0020.0030.0040.0050.0060.0070.0080.00
0 2 4 6 8 10Log Per Capita Income (in 1985 PPP)
Gin
i Coe
ffcie
nt (%
)
18
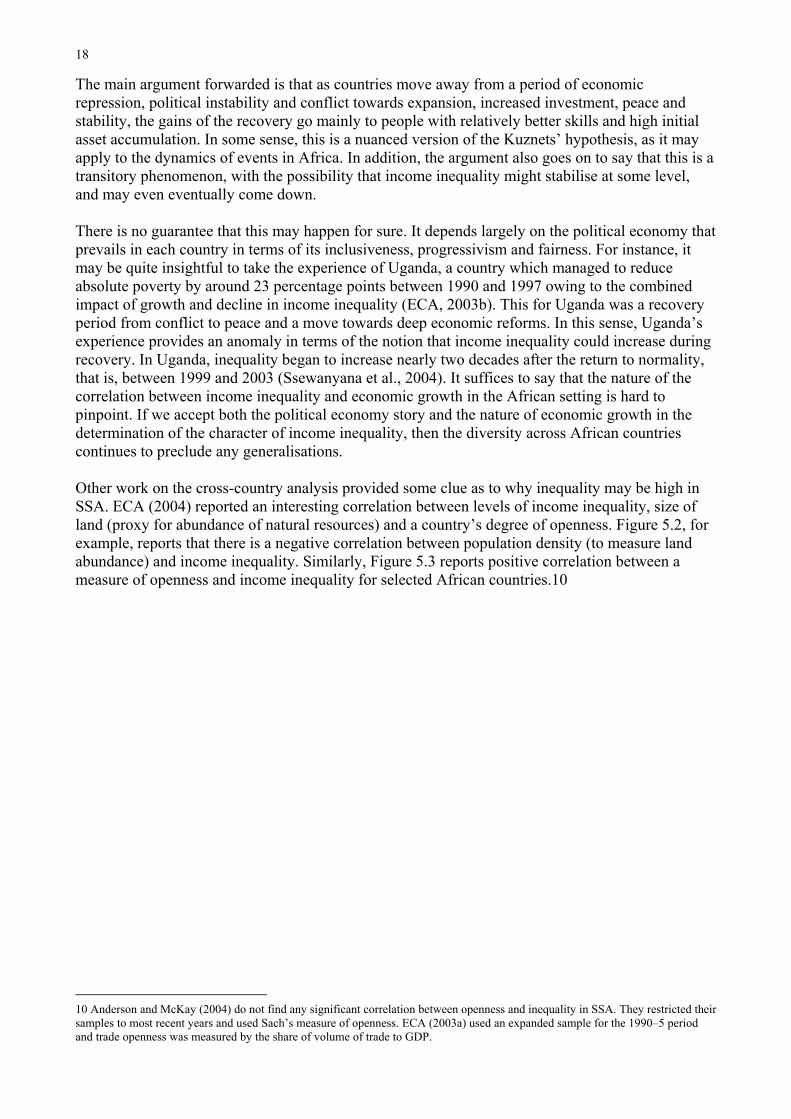
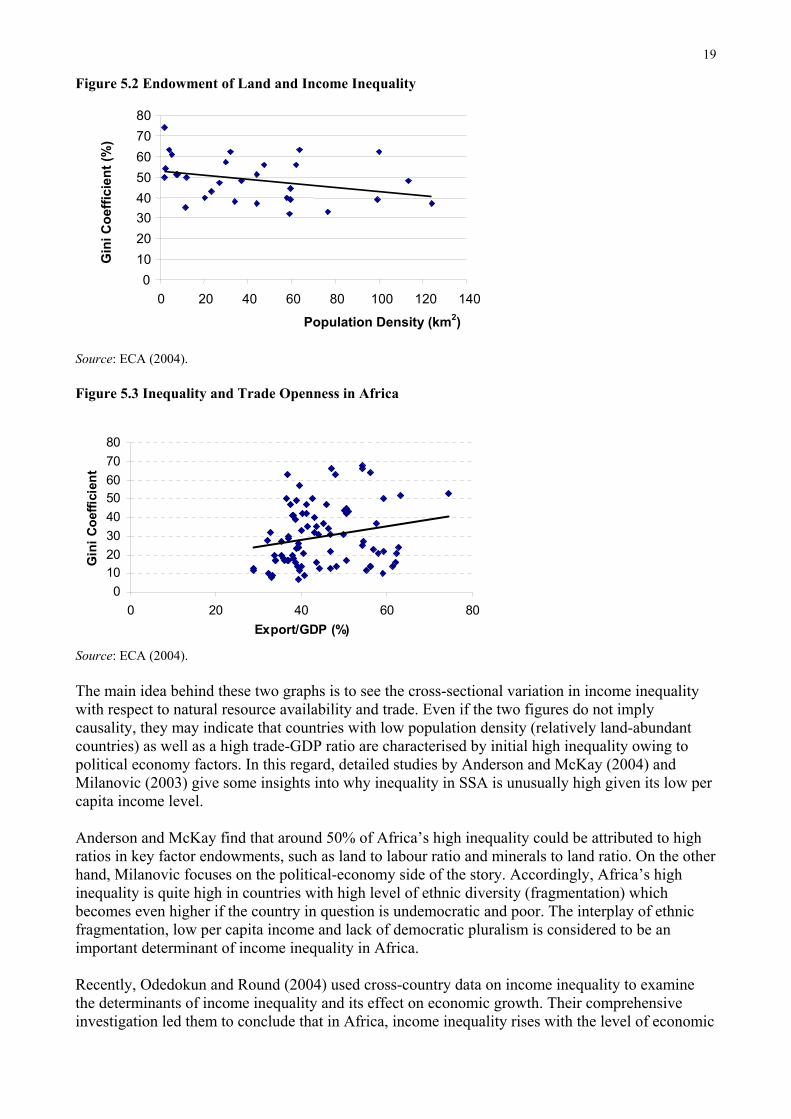
The main argument forwarded is that as countries move away from a period of economic repression, political instability and conflict towards expansion, increased investment, peace and stability, the gains of the recovery go mainly to people with relatively better skills and high initial asset accumulation. In some sense, this is a nuanced version of the Kuznets’ hypothesis, as it may apply to the dynamics of events in Africa. In addition, the argument also goes on to say that this is a transitory phenomenon, with the possibility that income inequality might stabilise at some level, and may even eventually come down. There is no guarantee that this may happen for sure. It depends largely on the political economy that prevails in each country in terms of its inclusiveness, progressivism and fairness. For instance, it may be quite insightful to take the experience of Uganda, a country which managed to reduce absolute poverty by around 23 percentage points between 1990 and 1997 owing to the combined impact of growth and decline in income inequality (ECA, 2003b). This for Uganda was a recovery period from conflict to peace and a move towards deep economic reforms. In this sense, Uganda’s experience provides an anomaly in terms of the notion that income inequality could increase during recovery. In Uganda, inequality began to increase nearly two decades after the return to normality, that is, between 1999 and 2003 (Ssewanyana et al., 2004). It suffices to say that the nature of the correlation between income inequality and economic growth in the African setting is hard to pinpoint. If we accept both the political economy story and the nature of economic growth in the determination of the character of income inequality, then the diversity across African countries continues to preclude any generalisations. Other work on the cross-country analysis provided some clue as to why inequality may be high in SSA. ECA (2004) reported an interesting correlation between levels of income inequality, size of land (proxy for abundance of natural resources) and a country’s degree of openness. Figure 5.2, for example, reports that there is a negative correlation between population density (to measure land abundance) and income inequality. Similarly, Figure 5.3 reports positive correlation between a measure of openness and income inequality for selected African countries.10
10 Anderson and McKay (2004) do not find any significant correlation between openness and inequality in SSA. They restricted their samples to most recent years and used Sach’s measure of openness. ECA (2003a) used an expanded sample for the 1990–5 period and trade openness was measured by the share of volume of trade to GDP.
19
Figure 5.2 Endowment of Land and Income Inequality
Source: ECA (2004). Figure 5.3 Inequality and Trade Openness in Africa
01020304050607080
0 20 40 60 80Export/GDP (%)
Gin
i Coe
ffici
ent
Source: ECA (2004). The main idea behind these two graphs is to see the cross-sectional variation in income inequality with respect to natural resource availability and trade. Even if the two figures do not imply causality, they may indicate that countries with low population density (relatively land-abundant countries) as well as a high trade-GDP ratio are characterised by initial high inequality owing to political economy factors. In this regard, detailed studies by Anderson and McKay (2004) and Milanovic (2003) give some insights into why inequality in SSA is unusually high given its low per capita income level. Anderson and McKay find that around 50% of Africa’s high inequality could be attributed to high ratios in key factor endowments, such as land to labour ratio and minerals to land ratio. On the other hand, Milanovic focuses on the political-economy side of the story. Accordingly, Africa’s high inequality is quite high in countries with high level of ethnic diversity (fragmentation) which becomes even higher if the country in question is undemocratic and poor. The interplay of ethnic fragmentation, low per capita income and lack of democratic pluralism is considered to be an important determinant of income inequality in Africa. Recently, Odedokun and Round (2004) used cross-country data on income inequality to examine the determinants of income inequality and its effect on economic growth. Their comprehensive investigation led them to conclude that in Africa, income inequality rises with the level of economic
Population Density (km2)
0 10 20 30 40 50 60 70 80
0 20 40 60 80 100 120 140
Gin
i Coe
ffici
ent (
%)
20
development (more or less consistent with Bigsten and Shimeles, 2003), regional factors (particularly the size of land), and size of government, proxied by ratio of government expenditure to GDP. It decreases with government subsidies and high level of enrolment, particularly in secondary and tertiary levels. These pieces of evidence suggest a need for closer investigation of the nature and determinants of income inequality in Africa. Some studies are investigating the impact of economic policies on income inequality in individual African countries. Kouadio et al. (2004) are carrying out an analysis of sectoral growth, income distribution and poverty reduction in Côte d’Ivoire, applying a micro-simulation computable general equilibrium model of the Ivorian economy. One of the objectives of the study is to identify the transmission mechanisms of macroeconomic choices on income inequality and poverty. The study is in progress. Emini et al. (2004) decomposed the effects of economic policies on the evolution of poverty and income distribution in Cameroon, using the computable general equilibrium (CGE) model. The objective was to evaluate the contribution of economic policies on the process of reduction of poverty and income inequality in Cameroon between 1996 and 2001. Some studies have looked in particular at the effects of trade liberalisation on inequality. Chatiga (2004) used a micro-simulation computable general equilibrium model to study the impact of trade liberalisation on poverty and inequality in Zimbabwe in the 1990s, especially since the implementation of the structural adjustment programme. Heterogeneity was introduced by dispensing with the assumption of the representative household. The analysis showed that, although poverty decreased overall, income inequality increased in the rural areas (using the Gini coefficient). In the urban areas, the skilled workers are disadvantaged whereas unskilled workers benefited, leading to a fall in inequality in the urban areas. Mabugu (2004) examines the dynamic effects of trade liberalisation in South Africa on rich and poor households, using a CGE model (the low-income households represent the poorest four income deciles); the study is in progress. Also in progress is a study which examines the impacts of trade liberalisation on poverty in Nigeria using a CGE model (Nwafor et al., 2004). The aim of the study is to quantify the impacts of trade liberalisation on poverty and household income distribution. Other studies have looked in particular at the effects of fiscal policy on inequality. Akinboade (2003) has shown that in Namibia, the progressive income taxation benefits the low-income group since they do not pay taxes at all, being below the threshold, or pay less tax than the rich, because of the lower marginal tax rate. With respect to public expenditure, government expenditure since independence has been characterised by high preference for the social sector in the provision of community and social services. The government has been investing heavily in education, training, health and community services (about 49% of its annual budget), to correct the imbalances from the colonial past and to alleviate poverty. Atemnkeng et al. (2004) are carrying out a study of the redistributive impacts of fiscal policy in Cameroon. The objective was to assess the extent to which public spending on education and health contributed to poverty reduction and redistribution of benefits among the population. Preliminary results showed that the tax system is mainly progressive. Health services were also distributed more equally than income and poor households received a disproportionate share of the benefits of primary healthcare, whereas the rich benefit more from spending on higher education. Gelb (2003) showed that in South Africa, government expenditure has been used effectively as an instrument of redistribution since 1994, continuing a pattern established in the mid-1970s. In 1975, African share of social spending was only 28% compared with 55% for the share of whites. African share increased to 51% in 1990, 67% in 1993, and 80% by 1997. In contrast, white share of social spending decreased from 55% in 1975 to 33% in 1990, 17% in 1993, and 9% in 1997. By 1997, racial spending allocations were roughly proportionate to population shares.
21
5.2 Non-income inequalities Sowa (2002a) reviewed the impact of financial sector reforms on poverty reduction in Ghana from the late 1980s. The conclusion was that the overall result of financial reforms has been to make access to banks and to credit more unequal, as the poor cannot afford to save with (because of high minimum deposits) or borrow from the formal banking sector (because of high interest rates). This has made it difficult for the poor to engage in meaningful investments that will lift them out of poverty. The rural sector has been virtually excluded from the formal financial sector. In another paper, Sowa (2002b) reviewed the effects of poverty-reducing policies and programmes in Ghana. The conclusion here was that the introduction of user fees in the health sector increased inequalities in access to health services; use of health services declined as the poor found it unaffordable. Similarly in the education sector, withdrawal of subsidies and cost recovery measures also led to greater inequalities in access to quality education, especially for the poor. In response, in addition to general economic policies, the government has implemented programmes aimed to increase access by the poor, who reside mainly in rural areas, to social services. In Kenya, Manda et al. (2000) argue that the reduction of subsidies in the health and education sectors has led to the persistence of inequalities in access to education and health services. Cost sharing in the education sector led to an increase in dropout rates at the primary level, whereas at the secondary level, the poor cannot enrol because of lack of fees. The children of the poor are therefore disadvantaged. The same is true at the tertiary level, where the poor cannot afford to pay fees and related expenses. Removal of subsidies in the health sector means that the poor cannot afford the good but expensive health services in the urban areas. In Namibia, Akinboade (2003) describes legislation to reduce discrimination and inequalities in the labour market. Since the majority of the poor in Namibia are women and indigenous people, the Affirmative Action law was passed in 1998 in order to redress gender inequalities in access to services and resources. The aim of the Act is to improve the representation of blacks, women and disabled persons in the formal workforce by requiring employers with more than 50 employees to prepare affirmative action plans. The Employment Equity Commission, made up of people from the designated groups, monitors the implementation of these plans. Anti–discrimination labour laws were also passed with generous fiscal provisions for working married women. These measures have helped to reduce poverty levels, although regional inequalities still exist between the richer and poorer regions. The poor regions have not benefited significantly from development expenditures, as relatively wealthy regions continue to receive most of the government spending per resident compared with the poorer regions. Cultural factors play an important role in determining girls’ and women’s access to education in Africa. The studies from the African Academy of Sciences research programme in the 1990s, as well as more recent studies from Kenya (described in Section 2), confirm that gender disparities in education persist because cultural attitudes towards women’s education are only slowly changing. Patriarchal attitudes lead to preference by parents for boys' education for the following reasons: Sons become future heads of households, inherit property and ensure continuity of the family. Education prepares them to perform these functions. Daughters are temporary residents in the parental household; they get married and move to their husbands' homes whereas boys remain in the family. Investment in girls' education is seen as benefiting the husbands' families. Boys are expected to care for their parents in their old age and to assist in caring for their siblings. Many parents, especially illiterate parents, have low academic expectations for their daughters. Some believe that higher education is for boys only, others think that boys like studying more than girls, that boys are more brilliant than girls and perform better than girls. Parents' and teachers'
22
perceptions of adult roles for girls – their marital and maternal obligations to their families – make them believe that girls do not require much formal education, as these roles do not require going to school. Culture prescribes domestic roles for women. Domestic chores such as cooking and cleaning the house, which take up a lot of time, are assigned to girls. Girls have little time for study or homework. In South Africa, non-income inequalities are rooted in military conquest and political exclusion, which took a colonial and racial form, buttressed by continued repression of political and social organisations (Gelb, 2003). Conquest and political exclusion thus shaped black people’s unequal access to resources, and their potential for asset accumulation and returns from their assets. The forced labour regime in mining established the migrant system, which provided a foundation for racial discrimination in the labour market and in the workplace. The Native Land Act of 1913 restricted land ownership for Africans to certain specified areas. The 1960 Group Areas Act restricted firm ownership by blacks to specified area in cities and towns. Later regulations prevented black entrepreneurs from owning more than one business, from establishing companies or partnerships, or owning business premises even in ‘black’ areas. Since 1994, efforts have been made to address this through the Black Economic Empowerment (BEE) strategy. One of its aims was to transfer some assets from white business to the small existing group of established black entrepreneurs. Part of the discussion focused on a 10-year timeframe within which corporations listed on the Johannesburg Stock Exchange should have 30% black directors, 40% black share ownership, 50% black suppliers for production inputs, and 60% black management. In 1999, black business associations, with government support, established a non-statutory Black Economic Empowerment Commission. In 2001, the Commission recommended a more interventionist government strategy, focusing on targets to be achieved within a 10-year period for ownership, management and high-level occupations, and government procurement. A broad-based Black Economic Empowerment Bill was introduced into Parliament in 2003. The South African government has also made efforts to increase access to various basic services (Gelb, 2003). In October 2000, the government announced the supply of free basic water of up to 6,000 litres per month for those who could not afford to pay for it, a reversal of the 1994 policy to charge for water. Increased spending on education has made it possible to equalise spending per pupil across race, leading to a substantial narrowing of pupil-teacher ratios across races. However, inequalities in access have become less important. Concern is now with educational outcomes, that is, with pass rates in school-leaving examinations. Thus the backlog from the apartheid era is yet to be overcome.
23
6. Summary and Conclusions This study reviewed the empirical literature on the level, profile, trend and determinants of income and non-income inequalities in sub-Saharan Africa based on cross-country and country case studies undertaken in recent years by institutions and individuals based in Africa (among others). In terms of the amount of research, the following observations were made. Relatively few studies by African research institutions were targeted at measuring inequality. Most of the studies focused on poverty, with inequality analysed in the process, by computing Gini coefficients, Theil indices, and Lorenz curves. However, analysis of inequality has increased, as a result of availability of household surveys in the 1990s. This has obtained a more realistic picture of income inequality in Africa, and the work of regional institutions as AERC and UNECA on the inequality-growth-poverty nexus. Much less attention has been paid to non-income dimensions of inequality (and poverty). Non-income dimensions of poverty and inequality are yet to be subjected to rigorous analysis as with income inequality. Lack of reliable household survey data over time has made it difficult to analyse trends in non-income dimensions of inequality. However, in the last few years, following Sahn and Stifel’s analysis using an asset index of poverty, the approach is now being used elsewhere, such as the Poverty and Economic Policy Networks in the MIMAP Programme, making use of Demographic and Health Survey data. There are virtually no studies examining the relationship between inequality and growth by African research institutions, and only a small number examine the underlying factors driving income inequality. However, efforts in this direction have begun as part of the MIMAP programme, where CGE models are being built to assess impacts of various policies on growth. Apart from poverty reduction, MDGs are yet to be integrated into the research programme of majority of African research institutions. In terms of the main findings emerging from research, a number of points stand out. In terms of income inequality, Africa, particularly, SSA is one of the most unequal regions in the world despite low levels of per capita income. Inequalities in non-income dimensions of welfare are also high, particularly between men and women and between regions, and have remained persistent over time. Income inequality is more of an urban phenomenon, though asset-based and capability-based inequality suggests quite the contrary. Countries with high initial income inequality find economic growth to be less efficient in reducing poverty, so they need a combination of equity and growth to make significant impact on poverty. For other countries, the effect of redistribution on poverty is smaller relative to the effect of growth. Particularly among the poor countries, the elasticity of poverty with respect to growth is larger than the elasticity of poverty with respect to redistribution. The evidence suggests that education, infrastructural development and demographic transition can significantly reduce income inequality. Thus, the effort to meet the MDGs may be complementary to the objective of containing or reducing income inequality. However, this has to be established through larger country case studies. In terms of the dissemination of research, it was noted that many research institutions are yet to develop their websites; several websites need to be updated with recent studies. Institutions in Eastern and Southern Africa are better developed than those in West and Central Africa in this respect. They therefore appear to be more active in research since it is easy to access what they have
24
done. Several research institutions need assistance in this direction. It will also be a good idea if research institutions publish executive summaries of their studies in both English and French, to make them accessible to all researchers. These are the two main languages written and spoken on the continent. In terms of future priorities, one area which still requires more work is cross-country analysis. In this, researchers can have an opportunity to revisit existing work by assembling data on income inequality generated in the late 1990s and early 2000s, and trying to go back to early periods by using approximations for missing inequality data in some years. For instance, Kernel density estimates and associated extrapolations allow one to extrapolate income distribution data from existing surveys and national account formations (e.g. Sala-i-Martin, 2002) and generate time series inequality measures. Ravallion and Chen (2004) have assembled inequality data for 31 African countries covering around 20 years in eight data points. No study so far has been done on the basis of this panel to analyse determinants of income inequality. It appears, therefore, that it is possible to push the frontiers of our empirical knowledge a bit further using cross-country analysis. Another fruitful area of research is country case studies, where it is possible to identify clearly the determinants of income inequality using detailed household budget surveys. Some of the works reviewed in this study indicated how promising this field is. For instance, the results from these studies indicate the importance of geographic diversity, education and demographic factors as key determinants of income inequality in Africa. This helps to put MDGs in context. Most of the social goals refer to equality of opportunities in terms of basic health and educational services and access to safe water and sanitation. This could lead to lower inequality as well as a faster rate of economic growth, as evidenced by results from most growth models. In addition, it is also possible to do multi-country studies, where detailed household data can be used to compare inequality between two countries. A good example could be to compare such a country as Ghana, which is more or less a low-inequality country, with Zambia which is historically a country with high income inequality. We can, for instance, impose the socio-economic conditions prevailing in Ghana on income distribution data in Zambia and account the differences to situations that are typical of Zambia, and so on. Finally, there is a need for capacity building for African researchers, to enable them to subject non-income dimensions of inequality to more rigorous analysis, as has been done with income inequality. This is important if economists, who have the training in statistical and econometric analysis, are to show more interest in this area. Economists need to produce these types of rigorous analyses to make their output acceptable for promotion purposes in their respective institutions. Many of the researchers are based in economics and statistics departments of universities and economic research institutions. Non-income dimensions of poverty and inequality are yet to be accepted as areas deserving the attention of economists. Similarly, many of the decision makers in key ministries are economists, who need to be sensitised about the importance of non-income dimensions of inequality. Furthermore, a bridge should be built between francophone and anglophone researchers and funding institutions. Multidisciplinary research groups should also be encouraged. Statistical agencies also need support so that they can generate reliable data for measuring non-income dimensions of poverty and inequality.
25
Bibliography Akinboade, O. A. (2003) 'Fiscal policy, income distribution and poverty alleviation in Namibia' in
Poverty, income inequality and economic development in Namibia, Windhoek: Bank of Namibia. Alesina, A. and D. Rodrik (1994) 'Distributive politics and economic growth', Quarterly Journal of
Economics 109(2): 465–90. Ali, A. A. and E. Thorbecke (1997) 'The state of rural poverty, income distribution and rural
development in SSA', Collaborative Research Project-Poverty, Income Distribution and Labour Market Issues in SSA, for AERC, Nairobi.
Ali, A. A. and E. Thorbecke (2000) 'The state and path of poverty in sub-Saharan Africa: some preliminary results', Journal of African Economies 9(1): 9–40.
Anderson, E and A. McKay (2004) 'Why is inequality so high, but also so variable in sub-Saharan Africa?', Poverty and Public Policy Group, Overseas Development Institute, London.
Appleton, S. with T. Emwanu, J. Kagugube, and J. Muwonge (1999) Changes in poverty in Uganda, 1992–7, CSAE Working Paper No. WPS/99.22, Oxford, CSAE.
Atemnkeng, T.J., U.E. Jumbo, and P. Etoh-Anzah (2004). “The Distributive Impact of Fiscal Policy in Cameroon: Tax and Benefit Incidence”. Interim Report Submitted to the Poverty and Economic Polciy (PEP) Research Network, May 2004.
Bates, R. (2005) Political insecurity and state failure in contemporary Africa, CID Working Paper No. 115, Cambridge, MA: CID.
Bedi, A. S., P. K. Kimalu, D. K. Mundi and N. N. Nafula (2002) The decline in primary school enrolment in Kenya, KIPPRA Discussion Paper No. 14, Nairobi: KIPPRA.
Bénabou, R. (1994) 'Human capital, inequality and growth: a local perspective', European Economic Review, 38(4): 817–26.
Bénabou, R. (1996) 'Inequality and growth', in NBER Macroeconomics Annual, Cambridge, MA: MIT Press.
Bhorat, H., L. Poswell, and P.Naidoo (2004) 'Dimensions of post-Apartheid South Africa, 1996–2001', Development Policy Research Unit (DPRU), July.
BIDPA (2000) Impacts of HIV/AIDS on poverty and income inequality in Botswana, Gabarone: BIDPA.
Bigsten, A, and A. Shimeles (2003) Prospect for pro-poor growth strategies in Africa, WIDER Research Paper 42/2004, Helsinki: WIDER.
Bigsten, A., P. Collier, S. Dercon, M. Fafchamps, B. Gauthier and J. W. Gunni (2003) 'Risk sharing in labor markets', World Bank Economic Review 17(3): 349–66.
Binam, J.N.(undated). ‘Emploi et Mouvement syndical en Cote d’Ivoire: Un Etat Des’. Centre Ivorien de Recherches Economiques et Sociales (CIRES), For Global Policy Network.
Boateng, K., L. Boakye-Yiadom, and A.D. Oduro (2001). Poverty in Ghana. Final Report submitted to the African Economic Research Consortium, Nairobi, Kenya.
Booysen, F. le R., S. Van der Berg, G. Du Rand, M. Von Maltiz, and R. Burger (2004) 'Poverty and inequality indices for seven African countries using asset indices constructed from DHS data', Interim Report for PEP-PMMA Meeting, Dakar, Senegal, 16–20 June.
Chen, S. and M. Ravallion (2004) How have the world’s poorest fared since the 1980s?, World Bank Policy Research Working Paper No 33341. Washington, DC: World Bank..
Canagarajah, S., D. Mazumdar and X. Ye (1998) 'The structure and determinants of inequality and poverty in Ghana', Report to World Bank Poverty Reduction and Social Development Division.
Canagarajah, S. and T. Saji (2001) 'Poverty in a wealthy economy: the case of Nigeria', Journal of African Economies 10(2): 143–73.
Casale, D. (2004) 'What has the feminisation of the labour market ‘bought’ women in South Africa? Trends in labour force participation, employment and earnings, 1995–2001, Development Policy Research Unit Working Paper 04/84, Cape Town: DPRU.
26
Chatiga, M. (2004) 'Trade policies and poverty in Zimbabwe: a computable general equilibrium micro-simulation analysis', Report submitted to the Poverty and Economic Policy (PEP) Research Network.
Coudel, A., J. S. Hentschel and Q. T. Wodon (2002) 'Poverty measurement and analysis', in J. Klugman (ed.) A sourcebook for poverty reduction strategies, Washington, DC: World Bank.
Dava, G., M. Ibrahim, V. Nhate, C. Matusse and J. Suleman (2000) 'Poverty, income distribution and labour market issues in sub-Saharan Africa: Mozambique country study', Final Report submitted to AERC.
Deninger, K. and L. Squire (1998) 'New ways of looking at old issues: inequality and growth', Journal of Development Economics 57(2): 259–87.
Demombynes, G. and J. Hoogeveen (2004) Growth, inequality and simulated poverty paths for Tanzania, 1992–2002, Policy Research Working Paper No. 3432, Washington, DC: World Bank.
ECA (1999) African economic report, Addis Ababa: ECA. ECA (2003a) 'Report on the third meeting of the Poverty Reduction Strategy Papers Learning
Group', mimeo, Addis Ababa: ECA. ECA (2003b) Poverty mapping for selected African countries, Addis Ababa: ECA. ECA (2004) 'The challenges and prospects of achieving MDGs in Africa', mimeo, ESPD. Economic Policy Research Centre (2002) Costing the Millennium Development Goals: Uganda
country study, Kampala: EPRC. Émini, C. A., V. O. Zogo, D. K., Feunou and M. H. Tadjuidje (2004) 'Décomposition des effects
des politiques economiques sur l’évolution de la pauvreté et de la distribution au Cameroun: une analyse en equilibre general micro-simule avec double calibration', Report, MIMAP.
Epaulard, A. (2003) 'Growth, income inequality and poverty reduction in Namibia', in Poverty, income inequality and economic development in Namibia, Windhoek: Bank of Namibia.
Ferreira, F. H. G. and P. G. Leite (2003) Policy options for meeting the Millennium Development Goals in Brazil: can micro-simulation help?, Policy Research Working Paper No. 2975, Washington, DC: World Bank
Ferreira, L. M. (1996) Poverty and inequality during structural adjustment in rural Tanzania, Policy Research Working Paper No. 1641, Washington, DC: World Bank.
Fields, G. (1998) 'Poverty, inequality and economic wellbeing: African economic growth in comparative perspective’, Paper prepared for presentation to the AERC.
Fofack, H., C. Monga and H. Tuluy (2001) Household welfare and poverty dynamics in Burkina Faso: empirical evidence from household surveys, Policy Research Working Paper No. 2590, Washington, DC: World Bank.
Fosu, A. (2002) 'Inequality and the growth-poverty nexus: evidence from sub-Saharan Africa', Paper presented at the CSAE Conference on Understanding Poverty and Growth in SSA, University of Oxford.
Gelb, S. (2003) 'Inequality in South Africa: nature, causes and responses', DFID Policy Initiative, The Edge Institute, Johannesburg, South Africa.
Hinks, T. (2004) What is happening to South African youth in the labour market?, Policy Brief Paper No. 1, Johannesburg: National Institute for Economic Policy.
IPAR (2004) Gender aspects in HIV/AIDS infection and prevention in Kenya, IPAR Policy Brief 10(12), Nairobi: IPAR.
Kakwani, N. and Pernia, E. M. (2000) 'What is pro-poor growth?', Asian Development Review 18(1): 1–16.
Ki, J. B., B. Faye and S. Faye (2004) 'Pauvrete multidimensionnelle au Senegal: approche non-monetaire fondee sur les besoins de Base', MIMAP Paper.
Kimalu, P.K, N. Nafula, D.K. Manda, A.S. Bedi, G. Mwabu, and M. Kimenyi (2001). Education Indicators in Kenya. WP No. 4, KIPPRA Working Paper Series, KIPPRA, Nairobi.
Kimalu, P.K. N.N. Nafula, D.K. Manda, A. Bedi, G. Mwabu, and M.S. Kimenyi (2004). A Review of the Health Sector in Kenya. WP No. 11, KIPPRA Working Paper Series, KIPPRA, Nairobi.
27
Kouadio, A. K., M. Gbongue, E. Koffi and I. Ouattara (2004) 'Croissance sectoreielle, distribution du revenu et reduction de la pauvrete', Research Proposal, PEP-MPIA.
Leibbrant M. and I. Woolard (1999) Household incomes, poverty and inequality in a multivariate framework, Working Paper No. 99/31, Cape Town: DPRU.
Leibbrandt M., H. Bhorat and I. Woolard (1999). “Understanding Contemporary Household Inequality in South Africa”. DPRU Working Papers N0. 99/25, May 1999. Development Policy Research Unit, University of Cape Town.
Leibbrandt, M, C. Wolward, and L. Woolward (2000). The Contribution of Income Components to Income Inequality in the Rural Former Homelands of South-Africa: a decomposable Gini analysis. Journal of African Economies. Volume 9, no 1, 79-99.
Leibbrandt, M., L.Poswell, P.Naidoo, M. Welch, and I. Woolard. (2004). Measuring Recent Trends in South African Inequality and Poverty Using 1996 and 2001 Census Data. Centre for Social Sciences Research (CSSR) Working Paper No. 84, Southern Africa Labour and Development Unit (SALDRU), University of Cape Town, November 2004.
Mabugu, R.E. (2004) 'South Africa: dynamic effects from trade liberalization – results from an intertemporal CGE model with perfect foresight', Progress Report submitted to the Poverty and Economic Policy Research Network.
Manda, D. K., M. S. Kimenyi and G Mwabu (2000) A review of anti-poverty initiatives in Kenya, Background Paper Prepared for Poverty, Education and Health (PEH) Project, Social Sector Division, KIPPRA, Nairobi: KIPPRA.
May, J., B. Roberts, G. Moqasa and I.Woolard (2002) Poverty and inequality in Lesotho, CSDS Working Paper No. 36, Durban: CSDS.
McCulloch, N., B. Baulch, B and M. Cherel-Robson (2000) 'Poverty, inequality and growth in Zambia during the 1990s', Paper presented at the 26th General Conference of The International Association for Research in Income and Wealth, Krakow, Poland, 27 August.
Milanovic, B. (2003). Is inequality in Africa really different? Washington, DC: World Bank. Nel, P. (2003). Income inequality, economic growth and political instability in sub-Saharan Africa.
Journal of Modern African Studies, 41 (4): 611-639. Nakabo-Ssewanyana, S. (2003) Food security and child nutrition status among urban poor
households in Uganda: implications for poverty alleviation., AERC Research Paper No. 130, Nairobi: AERC.
Njeru, E. H. N. and J. A. Orodho (2003) Access and participation in secondary school education in Kenya: emerging issues and policy implications', IPAR Discussion Paper Series No. 037/2003, Nairobi: IPAR.
Nwafor, M., O. Kanayo and A. Adenikinju (2004) 'The impacts of trade liberalization on poverty in Nigeria: micro-simulations in a CGE model', Proposal submitted to the Poverty and Economic Policy (PEP) Research Network.
Odedokun, M. O. and J. I. Round (2004) 'Determinants of income inequality and its effects on economic growth: evidence from African countries', African Development Review 16(2): 269–84.
Okojie, C. E. E. (2001) 'Female under-schooling in Africa as assessed by the African Academy of Sciences Research Programme', Paper presented at Colloque International, Genre, Population et Developpement en Afrique, 16-21 July.
Okojie, C. E. E., J. C. Anyanwu, F. O. Ogwumike and B. Alayande (2001) 'Poverty In Nigeria – an analysis of gender issues, access to social services and the labour market, Final Report submitted to AERC.
Orr, L. (2000) 'Globalising poverty: the gender dimension to job losses, casualisation and poverty' Discussion Document prepared for COSATU Gender Conference, National Labour and Economic Development Institute, June.
Persson, T. and G. Tabellini (1994) 'Is inequality harmful for growth?', American Economic Review 84(3): 600–21.
Sahn, D. and D. C. Stifel (2003) 'Urban-rural inequality in living standards in Africa', Journal of African Economies 12(4) 564–97.
28
Sahn, D. and D. C. Stifel (2000) ‘Poverty comparisons over time and across countries in. Africa’, World Development 28(1): 2123–55.
Sala-i-Martin, X. (2002) The world distribution of income (estimated from individual income distributions), Working Paper 8933, Cambridge, MA: NBER.
Shimeles, A. (2004) 'Consumption variability, risk and poverty in Ethiopia', mimeo. Department of Economics. University of Gothenburg, Sweden.
Sowa, N.K. (2002a). “Financial Sector Reform Policies and Poverty Reduction”. Paper presented at the Fifth AERC Senior Policy Seminar, Co-sponsored with the Bank of Tanzania, Dar Es Salaam, Tanzania, February 12-14, 2002.
Sowa, N. K. (2002b). 'An assessment of poverty reducing policies and programmes in Ghana', Paper prepared for Presentation at a MIMAP Workshop on Assessing Poverty Policies, Rabat, Morocco.
Sylla, K., M. Gbongue and E. Kouadio (2004) 'Une approche multidimensionnelle de la pauvrete applique a la Côte d’Ivoire', Proposal submitted to PEP.
Ssewanyana, N. S., A. J. Okidi, D. Angemi and V. Barungi (2004) Understanding the determinants of income inequality in Uganda, CSAE Working Paper No. WPS/2004-29, Oxford: CSAE.
Van der Berg, S. and H. Bhorat (1999) The present as a legacy of the past: the labour market, inequality and poverty in South Africa, DPRU Working Paper No. 01/29, Cape Town: DPRU.
White, H. and E. Anderson (2000) 'Growth versus redistribution: does the pattern of growth matter?', mimeo, Institute of Development Studies, University of Sussex.
29
Annex 1: Institutional Sources Regional research networks/institutions African Academy of Sciences (AAS)
P.O. Box 14798, Nairobi, Kenya Tel: 254-2-884401 Fax: 254-2-884406 Email: [email protected] Website: www.aascience.org Contact person: President – Professor Mohammed H.A. Hassan
African Economic Research Consortium (AERC) 3rd Floor Middle East Bank Towers Building Milimani Eoad P.O. Box 62882 00200 Nairobi, Kenya Tel: 254-20-2734150 Fax: 254-20-2734170 Email: [email protected]/[email protected].
Council for the Development of Social Science Research in Africa (CODESRIA) Avenue Cheikh Anta Diop X Canal IV, B.P.3304 Dakar, Senegal Tel: 221-825-98-22/23 Fax: 221-824-1289 Email: [email protected] or [email protected] Website: www.codesria.org Contact Person: Executive Secretary.
Secretariat for Institutional Support for Economic Research in Africa (SISERA) C/o CRDI/IDRC BP. 11007 PEYTAVIN Dakar, Senegal Tel; 221-8640000 ext. 2231 (Secretary) Fax: 221-8253256 Email: [email protected] (Secretary)
South African Regional Poverty Network (SARPN) Human Sciences Research Council Private Bag X41 Pretoria 0001, South Africa Tel: 27-12-302-2707 Fax: 27-12-302-2701 Email: [email protected] or [email protected] Website: [email protected]
Foreign research network to which research institutions are linked MIMAP (Micro Impacts of Macroeconomic and Adjustment Policies) Program has a Research Network: Poverty and Economic Policy (PEP) Network. PEP has three sub-networks. A number of African research institutions are involved with two of them: 'Modelling Poverty and Impact Assessment (MPIA)' and 'Poverty Monitoring, Measurement and analysis (PMMA)'.
Poverty and Economic Policy (PEP) Research Network Department of Economics Universite Laval Sainte Foy, Quebec, GIK 7P4
30
Canada Tel: 418-656-7744 Fax: 418-656-7798 Email: [email protected]/[email protected]
National research institutes African Institute for Applied Economics (AIAE)
128 Park Avenue, GRA P.O. Box 2147, Enugu Nigeria Tel: 234-42-256644 Fax: 234-42-256035 Email: [email protected] Contact Person: Director
Botswana Institute for Development Policy Analysis (BIDPA) Private Bag BR 29 – Gaborone, Botswana Executive Director: Happy Fidzani Tel: 267-371750 Fax: 267-371748 Email: [email protected]
Central Bank of Namibia Research Department P.O. Box 2882 10 Daniel Munamawa Street Windhoek 9000, Namibia Tel: 264-61-226401/229874 Fax: 264-61-227649
Centre for Policy Analysis (CEPA) No. 11 Dr. Amilcar Cabral Road Airport Residential Area P.O. Box 19010 Accra North, Ghana Tel: 233-21-779364/778035 Fax: 233-21-773670 Email: [email protected] Website: www.cepa.org.gh Contact Persons: Niki Sowa ([email protected]) Abena Oduro([email protected])
The Edge Institute P.O. Box 30896 Braamfontein 2017, South Africa Tel: 27-11-339-1757 Fax: 27-11-403-2794 Website: www.the-edge.org.za
Institut National de la Statistique (INSAT) BP 485 – Anosy Antananarivo 101 Madagascar. Tel: 261-20-22-274-18 Contact person: Director General [email protected] Website: www.instat.mg Contact researcher: Jean Razafindravonona
Institut National de la Statistique et de l’Analyse Economique (INSAE)
31
01 BP 323 Cotonou, Benin Tel: 229-308239 Fax: 229-308246 Contact Person: Cosme Vodounou ([email protected])
Institute of Policy Analysis and Research (IPAR) 15th Floor, Anbank House, University Way P.O. Box 46843, 00100 GPO Nairobi, Kenya Tel: 254-2-251179/252885/331767 Fax: 254-2-251162 Email: [email protected] Website: www.ipar.or.ke
Kenyan Institute for Public Policy Research and Analysis (KIPPRA) Bishops Garden towers, Bishops Road P.O. Box 56445, Nairobi, Kenya Tel: 254-202719933/4 Fax: 254-202719951 Website: www.kippra.org Contact Persons: Germano Mwabu/Mwangi Kimenyi Contact person: Naftali Wambugu/Enos Njeru
Namibian Economic Policy Research Unit (NEPRU) P.O. Box 40219 Ausspannplatz 59 Bahnof Street, Windhoek Namibia Tel: 264-61-22-82-84 Fax: 264-61-23-14-96 Website: www.nepru.org.na
National Institute for Economic Policy (NIEP) P.O. Box 32848 – Braamfontein Johannesburg, South Africa Tel: 011-403-3009 Fax: 011-339-6395 Email: [email protected] Contact Person: Tim Hinks
National Labour and Economic Development Institute (NALEDI) 6th Floor, COSATU House 1 Leyds Street, Johannesburg, South Africa Tel: 011-403-2122/3 Fax: 011-403-1948 Contact Person: Liesl Orr
Nigerian Institute of Social and Economic Research (NISER) Oyo Road Ojoo, Ibadan Tel: 234-02-8102904 Fax: 234-02-8101194 Email: [email protected] Contact Person: Stephen Gelb
University-based institutes/centres Bureau of Market Research
University of South Africa
32
Contact person: Prof. Carl van Aardt Website: www.unisa.ac.za
Centre d’Etudes de Documentation et de Recherches en Economique et Sociale (CEDRES) Universite de Ouagadougou 03 BP.7164, Ouagadougou Burkina Faso Director: Souleymane Soulama Tel: 226-311967 Fax: 226-312686
Centre for Environmental Economics and Policy in Africa (CEEPA) University of Pretoria, South Africa Tel: 27-12-4204997 Fax: 27-12-4204958 Contact Person: Ramos Mabugu
Centre Ivorien de Recherche Economique et Sociales (CIRES) Universite de Cocody, Abidjan, Boulevard Latrille, 08 BP 1295 Abidjan 08, Côte d’Ivoire Tel: 225-444363/448942 Fax: 225-440829 [email protected] Director: Mama Oualttara Contact Person: Dr. Kalilu Sylla ([email protected])
Centre de Recherche en Economie Applique (CREA) FASEG – UCAD Dakar, Senegal Director: Abdoulaye Diagne Tel: 221-8247861 Fax: 221-8251979 Email: [email protected]
Centre for Social and Development Studies (CSDS) School of Social and Development Studies University of Natal Kwazulu-Natal Durban 4041 Tel: 27-31-260-2363 Fax: 27-31-260-2359 Email: [email protected] Website: www.nu.ac.za/csds
Centre for Social Science Research (CSSR) Southern African Labour and Development Research Unit (SALDRU) University of Cape Town PMB Rondebosch, 7701 Tel: 021-650-4656 Fax: 021-650-4657 Email: [email protected] (Administrative officer) Contact: Professor Leibbrandt
Development Policy Research Unit (DPRU) School of Economics, University of Cape Town 4th floor, Robert Leslie Social Science Building Upper Campus, Rondebosch 7701, South Africa Tel: 27-216505705 Fax: 27-216505711
33
Email: [email protected] Website: www.commerce.uct.ac.za/dpru Contact Persons: Dr. Haroon Bhorat (Director), Murray Leibbrandt/Ingrid Woolard
Economic Policy Research Centre (EPRC) 51 Pool Road, Makerere University Campus P.O. Box 7841, Kampala, Uganda 256-41-541023 Fax: 256-41-541022 Email: [email protected]
Institute of Statistical, Social and Economic Research (ISSER) University of Ghana P.O. Box LG 74, Legon, Ghana Email: [email protected] Contact Person: Prof. J.K. Anarfi
University of Dschang BP 96, Dschang Cameroon Tel: 237-45-1381 Contact Person: T.J. Atemnkeng
Universite de Yaounde II BP 1365 Yaounde, Cameroun Tel: 237-222-03-88 Contact person: Christian Arnault Émini
Other research institutions websites visited These institutions below are listed as part of the SISERA network, but there was no evidence of current and recent work on non-income inequality. Centre for Basic Research
Plot 15, Baskerville Avenue, Kololo P.O. Box 9863, Kampala Uganda Tel: 256-41-342987 Email: [email protected] Website: www.cbr-ug.org
Centre d’Etudes Economiques (CEE) Facultes de droit D’economie de Gestion et de Sociologie Universite d’Antananarivo B.P. 905 – Anrananativo 101 Madagascar Tel: 261-20-22-277-92 Contact Person: Director
Centre d’Etudes et de Recherches en Economie et Gestion (CEREG) Douala, Cameroon Tel/Fax: 237-23.73.89/B Tel/Fax: 237-21.78.92D
Centre d’Etudes et de Recherches en Economie et Gestion (CEREG) University of Yaounde Yaounde, Cameroon Tel: 237-223-06-66 Email: [email protected]
34
Consultancy Training Centre (CTC) University of Swaziland Private Bag No. 4 Kwakvseni, M201, Swaziland Tel: 268-5184011 Fax: 268-5185276 Contact Person: Director
Economic and Social Research Foundation (ESRF) 51 Uporoto Street, Ursino Estate P.O. Box 31226, Dar-Es-Salam, Tanzania Tel: 255-22-2760260, 255-22-2760758, 255-22-2760752 Fax: 255-22-2760062/255-811-324508 Contact: Executive Director
Gambia Economic and Social Development Research Institute (GESDRI) No. 3 Mile 7 Quarters P.O. Box 4539, Bakau K.S.M.D. Banjul, Gambia Tel: 220-392781 Fax: 220-392781 Contact Person: Coordinator
Institute of Social and Economic Research (INESOR) University of Zambia P.O. Box 30900, Lusaka Zambia Tel: 260-1-29-46-73/29-41-31 Fax: 260-1-29-42-91/25-39-52 Website: [email protected] Contact Person: Director
Groupe de Recherché en Economic Appliqué et Théorique (GREAT) BP E1255 Bamako, Mali Tel: 223-20-38-52 Website: [email protected] Contact Person: Coordinator