Embed Size (px)
Citation preview
HAL Id: halshs-03165716https://halshs.archives-ouvertes.fr/halshs-03165716
Preprint submitted on 10 Mar 2021
HAL is a multi-disciplinary open accessarchive for the deposit and dissemination of sci-entific research documents, whether they are pub-lished or not. The documents may come fromteaching and research institutions in France orabroad, or from public or private research centers.
L’archive ouverte pluridisciplinaire HAL, estdestinée au dépôt et à la diffusion de documentsscientifiques de niveau recherche, publiés ou non,émanant des établissements d’enseignement et derecherche français ou étrangers, des laboratoirespublics ou privés.
Inequality, Identity, and the Structure of PoliticalCleavages in South Korea, Taiwan, and Hong Kong,
1996-2016Carmen Durrer de la Sota, Amory Gethin
To cite this version:Carmen Durrer de la Sota, Amory Gethin. Inequality, Identity, and the Structure of Political Cleavagesin South Korea, Taiwan, and Hong Kong, 1996-2016. 2021. �halshs-03165716�
World Inequality Lab – Working Paper N° 2021/06
Inequality, Identity, and the Structure of Political Cleavages in South Korea, Taiwan, and Hong Kong,
1996-2016
Carmen Durrer de la Sota Amory Gethin
February 2021
1
Inequality, Identity, and the Structure of Political Cleavages in
South Korea, Taiwan, and Hong Kong, 1996-2016
Carmen Durrer de la Sota
Amory Gethin†
Abstract
This paper documents how democratization in South Korea, Taiwan, and Hong Kong since the
1980s has led to the materialization of growing political cleavages. Political integration,
manifested by attitudes towards North Korea in South Korea, and towards mainland China in
Hong Kong and Taiwan, have been a key issue structuring party competition and electoral
behaviors in the three territories. In Hong Kong and South Korea, this issue has sharply divided
old and new generations, albeit in a somewhat different way. In Hong Kong, younger cohorts
are substantially more likely to vote for parties supporting lower political integration. In South
Korea, older generations show significantly higher support for unification, but they are also
much more likely to vote for conservatives, who firmly oppose any attempt to engage with the
North Korean regime, a phenomenon rooted in decades of tensions and fiercely anti-
communist regimes. In Taiwan, such a strong generational divide is absent, but the
independence/unification cleavage has interacted with ethnicity: immigrants from mainland
China and their descendants have been more supportive of the pro-unification Kuomintang than
natives. This is also the case in Hong Kong, where sustained immigration from the mainland
has come with the emergence of a strong anti-immigration cleavage. We argue that the strength
of these cleavages and the lack of political mobilization of the working class for historical
reasons have played a key role in explaining the near absence of class cleavages in all three
territories. While economic concerns do play a role in nurturing mass mobilizations, cultural
and political identities, rather than material concerns, seem to continue shaping party systems
in East Asia.
We are grateful to Joel Campbell, Eui-Young Jung, Karl Ho, Wai-Man Lam, Clara Martínez-Toledano, Sidney
Michelini, Thomas Piketty, and Sebastian Veg for their useful advices. We also thank the team of the Comparative
Study of Electoral Systems and of the Hong Kong Election Study for making the datasets used in this paper
available for research.
† Carmen Durrer de la Sota, Amory Gethin: Paris School of Economics – World Inequality Lab.
2
Introduction
South Korea, Hong Kong, and Taiwan have witnessed dramatic political transformations since
the 1980s, including institutional reforms and the conduct of elections on a regular basis. In
South Korea, the presidential elections of 1987 announced the advent of democracy after almost
three decades of military rule. In Taiwan, direct legislative elections in 1992 allowed opposition
forces to run against the ruling Kuomintang for the first time. In Hong Kong, democratization
has been more tortuous, with semi-direct elections being held in 1991 by the British and pursued
by the Chinese government since the handover of 1997.
In all three territories, the past three decades have been associated with a greater participation
of the population to the making of the polity. This growing mobilization has, at the intersection
of historical legacies and contingent factors, triggered the institutionalization of political parties
and the formation of clear partisan divides. In Taiwan and Hong Kong, parties organized into
two camps: those opposing greater integration with mainland China, and those in favor of it.
With the rise of the pro-independence Democratic Progressive Party, Taiwan transitioned to a
two-party system in the mid-2000s. The division between the pro-democracy camp and the pro-
Beijing camp in Hong Kong goes back further in time, and the pro-democracy camp has
received a stable 60 percent of popular votes since 1991. While democratic reform, economic
issues, and cultural concerns have interacted with this dimension of political conflict, relations
to the mainland have remained omnipresent in the political sphere. In South Korea, party system
institutionalization has been more complex. As minor conservative parties and independents
gradually lost in importance in the 1990s, the liberal Democratic Party grew as the main
opposition force to the conservative coalition inherited from the dictatorship. However, party
institutionalization remains incomplete. Political parties are still strongly dependent on their
leadership and their name and structure experience frequent changes. Foreign policy has also
remained at the heart of political conflicts in South Korea, as the institutionalization of the
conservative-liberal opposition materialized diverging attitudes towards North Korea, although
3
unlike in Taiwan or Hong Kong, the conflict does not concern whether or not to seek
unification, but how to interact with the northern regime in the meantime.
Alongside political transitions, South Korea, Taiwan, and Hong Kong also experienced deep
economic transformations. After several decades of sustained economic development, East
Asian economies were hit hard by the Asian Financial Crisis of 1997, and have been unable to
go back to the exceptional rates of growth they had achieved between the 1960s and the mid-
1990s.1 Income inequality has risen significantly, driven by a conjunction of changes on the
labor market, soaring housing prices in big cities, and the failure of governments to implement
policies protecting those most vulnerable to economic shocks.2
These transformations have arguably affected existing boundaries of political mobilization,
created new demands, and generated new divides. In this paper, we use existing political
attitudes surveys conducted in South Korea, Taiwan, and Hong Kong since the late 1990s to
document how structures of political cleavages in these three territories have responded to these
different political, economic, and cultural concerns. Our results bring us to two main findings.
First, we document that relations to the “other”, whether mainland China in Hong Kong and
Taiwan or North Korea in South Korea, have remained at the heart of politics, trumping other
dimensions of social conflict, and shaping political cleavages. “National” or “local” identity
feelings have risen in all three territories over the past decades, in particular among younger
cohorts. In South Korea, in addition to pre-existing regional divides, electoral behaviors have
been tightly linked to age and education, as older, lower-educated voters display a greater
1 Between 1970 and 1980, for instance, the average national incomes per adult of South Korea, Taiwan, and Hong
Kong grew at cumulated rates of 67 percent, 74 percent, and 54 percent respectively. Between the 2000 and 2010,
the corresponding figures were 51 percent, 58 percent, and 19 percent. Authors’ computations based on figures
from the World Inequality Database. See World Inequality Database, “Average National Income”, WID.world,
https://wid.world/world#anninc_p0p100_z/HK;TW;KR (accessed June 15, 2020).
2 On South Korea, see the longer discussion in the next section. On Taiwan, see for instance Chu (2015). On Hong
Kong, see the discussion below, as well as Hung (2018).
4
rejection towards engagement with the North Korean regime despite their stronger hopes for
unification. In Taiwan, identity has interacted with ethnicity, as mainlanders – immigrants
coming from the mainland at the end of the Chinese civil war and their descendants – continue
to display stronger attachment to China and to the hope of eventual unification. In Hong Kong,
it is again age and education which are the strongest predictors of vote choice, as mounting
polarization between pro-democrats and pro-Beijing forces have driven increasing student
mobilization.
Secondly, while economic concerns do matter significantly in fostering mass mobilizations, we
find only limited evidence of independent class cleavages in these three territories. In Hong
Kong, for instance, rising housing prices and decreasing perceived social mobility have been
important factors in the student protests against the Chinese regime. In Taiwan, fears that
greater trade integration would worsen regional inequalities may have also contributed to
reinforce preexisting North-South divides. In South Korea, promises of action against rising
economic polarization have become omnipresent in political campaigns, and income may be
starting to play a role in influencing vote choices. Yet, we find economic inequality to be poorly
represented in the East Asian party systems studied in this paper.
This underrepresentation, we argue, is partly the result of the fact that the integration/separation
cleavage is almost completely orthogonal to social class. In South Korea, a large share of the
poor are elderly citizens, who favor a hard stance against North Korea and are consequently
more supportive of conservative parties. In Taiwan, ethnicity is only weakly correlated to
income; unlike South Africa and Malaysia, where opposition to the former ethnic elite still has
a strong class dimension, the mainlander-native divide is one of historical identities rather than
conflicting economic interests. In Hong Kong, low-income voters are more supportive of the
pro-Beijing camp, but this is mainly because they tend to be older and are more likely to be
immigrants from Mainland China. All these factors suggest that the political representation of
economic inequalities in these three territories remains in large part framed, and sometimes
hindered, by divides over relations to the “other”. Given mainland China’s growing economic
power and renewed expansionist attitude, as well as the growing threat of North Korean
5
nuclearization, these divides are likely to persist and to play an increasing role in both domestic
and foreign politics.
South Korea
Contemporary South Korean politics have been inevitably shaped by the country´s unique
history and intricate position in the international scene. A product of the Cold War, South
Korea’s borders were set through the arbitrary partition of the Korean peninsula by the United
States and the Soviet Union at the end of World War II. The division of the Korean nation and
the hostility of the North Korean regime have been defining features of South Korea’s history
and political system ever since. In the words of Hieyeon Keum and Joel Campbell, “The North-
South Korean issue became the background concern of all other major political issues,
powerfully informed the formation of political parties, and stood behind the nature of political
cleavages and the types of corruption experienced” (Keum and Campbell 2018). The North
Korean security threat was used by the authoritarian regimes of the 1960s-1990s as a source of
legitimacy and a justification for political oppression (Freedman 2006; Kil and Moon 2001).
The military dictatorships also left behind a long-lasting regional cleavage, as both the state-
led economic development and the violent repression of anti-regime demonstrations had a
strong territorial component.
In this section, we show that South Korean political cleavages are changing quite significantly.
While regionalism persists, its importance has substantially decreased since democratization.
A rising generational cleavage, as in Hong Kong, has determined much of the vote in recent
elections, driven by diverging attitudes towards North Korea but also by the elderly poverty
crisis. In addition, the economic polarization suffered since the 1997 crisis has brought
redistributive issues to the center of the political discourse, and a modest class cleavage may be
emerging, with low-income voters showing less support for the conservatives than the middle
class, but only after accounting for age composition effects. University graduates have in
parallel decreased their support for the conservatives, producing a unique configuration of the
low-income and the higher educated simultaneously favoring progressive parties.
6
Democratization and the Transformation of South Korea’s Party System
Before the partition, the Korean peninsula had continuously been a single political entity since
936. After falling under Japanese domination in 1905, it officially became a Japanese colony in
1910. In the wake of the surrender of Japan in 1945, the US and the Soviet Union divided the
peninsula into two occupation zones along the 38th parallel. In 1950, the attempt by North
Korea to unify the peninsula under communist rule triggered the start of the Korean War, which
reached a stalemate in 1953, after immense human and material losses, consolidating the
division of the peninsula.
It was only two years earlier, in 1948, that the two Koreas had materialized into separate states.
In the south, nationalist leader Syngman Rhee instigated the founding of the Republic of Korea,
just shortly before the establishment of its Soviet backed northern counterpart. A series of
strongly anti-communist, US-backed, authoritarian regimes ensued until 1987.3 After 15 years
of repressive rule, President Rhee was ousted by a pro-democratic revolution in 1960. Only one
year later, a coup led by General Park Chung-hee placed the country under a military
dictatorship. Through the developmental state model and with the financial and political support
of the US, Park-Chung Hee led the country through a period of rapid economic growth. Income
per capita in South Korea went from $100 in 1960 to $13,000 in 1996, an unprecedented
phenomenon in the country’s history. The regime promoted industrialization and export-led
growth, leading to the emergence of a crucial nucleus of power in South Korean politics, the
Chaebol¸ or big business conglomerates. Park Chung-Hee, who had tightened his grip on power
in 1972 and was facing increasing social unrest, was assassinated in 1979 by one of his closest
confidents at the head of the South Korean secret service. Chun Doo-hwan, in charge of the
investigation of Park’s murder took over the regime. By the late 1980s, rising public protest
and international pressures facilitated the opening of the South Korean regime, which
3 With the exception of a short period of parliamentarism between the 1960 April revolution and the military coup
in May.
7
culminated in 1987 with the first free presidential election in 26 years, and the election of the
first opposition president, democratic activist Kim Dae-Jung, in 1997 (Freedman 2006;
Hellman 2011; Keum and Campbell 2018).
South Korea’s democracy has been shaped by the country’s experience of bureaucratic
authoritarianism and its Confucian heritage, leading to the development of a strongly
personalistic, so-called “imperial presidency” (Hellmann 2011; Kil and Moon 2001). As a
consequence, party institutionalization has been rather weak, with major parties often changing
their names under each new leader (Freedman 2006). However, despite the nominal changes,
two underlying coalitions can be distinguished across elections. The conservative coalition
descends directly from the authoritarian regimes. The progressive coalition, on the other hand,
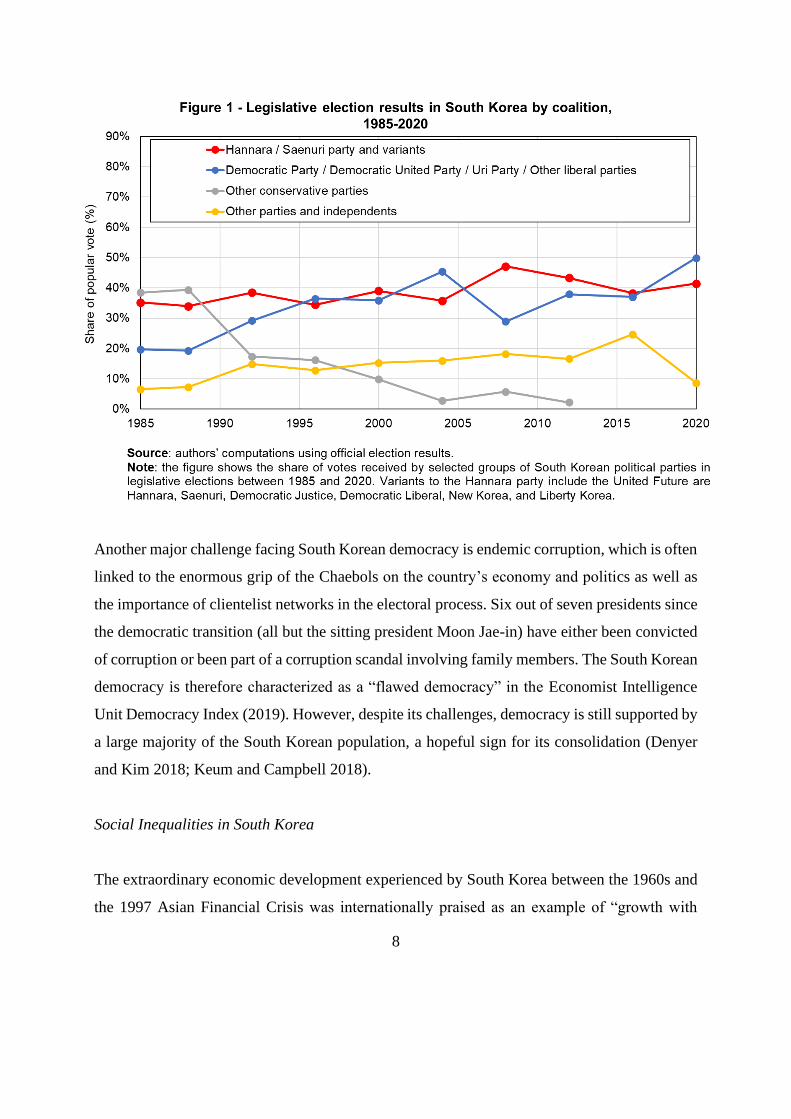
grew out of the democratic opposition.4 As shown in Figure 1, South Korea has progressively
evolved into a two-party system, even though smaller parties have remained significant,
receiving 10 to 20 percent of votes in most elections.5
4 A non-exhaustive list of names used by the conservative party is: Democratic Justice Party, Democratic Liberal
Party, Hannara Pary, Saenuri Party, Liberty Korea Party, and United Future. A non-exhaustive list of names used
by the progressive party is: Democratic Party, Millennium Democratic Party, Democratic United Party, and Uri
Party.
5 The results discussed in this section correspond to the vote by constituency, which allocates 253 of the 300 seats
in parliament. The results of the vote for the proportional party lists are less concentrated around the two main
parties but do not change the general findings.
8
Another major challenge facing South Korean democracy is endemic corruption, which is often
linked to the enormous grip of the Chaebols on the country’s economy and politics as well as
the importance of clientelist networks in the electoral process. Six out of seven presidents since
the democratic transition (all but the sitting president Moon Jae-in) have either been convicted
of corruption or been part of a corruption scandal involving family members. The South Korean
democracy is therefore characterized as a “flawed democracy” in the Economist Intelligence
Unit Democracy Index (2019). However, despite its challenges, democracy is still supported by
a large majority of the South Korean population, a hopeful sign for its consolidation (Denyer
and Kim 2018; Keum and Campbell 2018).
Social Inequalities in South Korea
The extraordinary economic development experienced by South Korea between the 1960s and
the 1997 Asian Financial Crisis was internationally praised as an example of “growth with
9
equity” (Stiglitz and Pleskovic 1998). However, in the aftermath of the 1997 Asian Financial
Crisis, South Korea’s balanced growth came to an end and inequality rose substantially, driven
by neoliberal economic reforms and the high concentration of the market under the Chaebols.
Between 1995 and 2016, the income share of the top 10 percent rose substantially, from 32
percent to 43 percent, and that of the top 1 percent from 7 percent to 12 percent.6 Studies have
emphasized the role played by the neoliberal economic reforms undertaken after the 1997 crisis
and during the 2000s, particularly labor market flexibilization, the high concentration of the
South Korean market under the Chaebols, and the increase in concentration of wealth as the
main culprits of the widening income gaps (Y. Kim 2018).
The rapid rise in inequality over the past two decades has disproportionately affected the older
generation. The share of the elderly among the bottom quintile has grown significantly, leaving
them more exposed to the already large, widening gap between income groups. South Korea’s
poverty rate among those over 65 has reached an alarming 44 percent in 2019, the highest
among OECD countries, compared to an average of 17 percent for the general population.7 This
dramatic deterioration in the living standards of the elderly has been linked to several cultural,
demographic and economic factors. Like other Asian countries, South Korea used to rely on
younger family members to provide care for the elderly. The gradual distancing of the youth
from traditional values coupled with the ageing of the population has left many elderly reliant
on an underdeveloped public pension system, where the basic benefits were only 6 percent of
the average wage in 2015 (OECD 2015).
6 Other inequality measures such as the 80:20 ratio and the Gini coefficient also increased sharply after the crisis.
See N. N. Kim (2018).
7 Poverty rates are measured by the OECD as the fraction of a given group of the population whose income is
below 50 percent of the median national household income. See OECD, “Poverty rates”, OECD.org,
https://data.oecd.org/inequality/poverty-rate.htm (accessed on June 15, 2020). In 2016, the elderly made over 40
percent of the poorest quintile, even though they only represented 20 percent of the population. See appendix
Figures A8, A17 and A18.
10
Over the same period, the average educational level has soared. The South Korean youth (aged
25 to 34) in particular, have almost doubled their share of tertiary graduates, from 37 percent in
2000 to 70 percent in 2018, the highest in the OECD.8 However, differences in average
educational level across age groups have actually narrowed slightly9, and the distribution of
educational attainment across income groups has barely changed in relative terms. This
suggests that broad changes in education cannot explain the rapid increase in inequality.
Regional inequalities have also somewhat increased over the past two decades, with the Seoul-
Gyeonggi region representing an increasing share of higher income groups and the historically
wealthy Gyeongsang region a larger fraction of the poor.10 However, these changes pale in the
light of the growing age gap.
Rising inequalities have been a major cause of recent changes in the political discourse in South
Korea, bringing more attention to redistributive issues and further popularizing the
development of the welfare state. The high level of economic disparities in the country have
been accused of weakening the young democracy, leading to the generalization of the motto
“democratize the economy” in recent political campaigns, highlighting the discontent with the
Chaebols’ concentration of economic and political power (Im 2018).11 Already in 2009, the
International Social Survey Programme found that 90 percent of Koreans perceived income
8 See OECD, “Population with tertiary education”, OECD.org, https://data.oecd.org/eduatt/population-with-
tertiary-education.htm (accessed on June 15, 2020).
9 Average educational attainment is measured here simply by codifying primary, secondary and tertiary education
as a categorical variable and looking at the changes in averages by age group between 2000 and 2016.
10 For example, Seoul’s inhabitants represented 57 percent of the 5th quintile in 2000, and 59% percent in 2016. In
the same period, their share among the bottom 20 percent has decreased dramatically from 35 percent to 23 percent.
The Gyeongsang region has experienced the reverse tendency, representing 25 percent of the bottom quintile in
2000 and over 41 percent in 2016. Given that the age structure of regions has not changed significantly over the
same period, the increase in regional inequalities cannot be explained through a generational composition effect.
For these numbers, see appendix Figures A11 to A20.
11 The expression has been widely used across the South Korean political spectrum, most notably by Park Geun-
hye (conservative) in her 2012 presidential campaign and by Moon Jae-in (Democrat) in his 2012 and 2017
presidential bids.
11
inequalities as too large, and some 75 percent believed it is the government’s responsibility to
tackle the issue (Kang 2017). Even former President Park Geun-hye, a conservative, centered
much of her 2012 campaign on social policies, showing that changes have taken place across
the political aisle. In 2017, Democratic candidate Moon Jae-in won the presidential election
after running a campaign full of promises to expand the state’s redistributive efforts and tackle
the excessive power of the Chaebols. While foreign policy and corruption still receive much of
the attention, economic inequalities are becoming an increasingly relevant topic in the political
arena (Yang 2017; Kim 2010).12
The North Korea Cleavage
The Korean peninsula had been unified for over a thousand years at the time of its division in
1945, albeit under foreign influence on numerous occasions. Koreans shared a common
language, culture, and history as well as a strong national identity. It is therefore not surprising
that diplomatic relations with North Korea and the question of unification have remained at the
forefront of Korean politics until the present day. In fact, Yoonkyung Lee and Jong-sung You
show that an individual’s self-reported position on a progressive-conservative scale is much
more strongly linked to their attitude towards North Korea than to their opinions on inequality,
redistribution, earned income, or self-perceived class belonging (Lee and You 2019). A similar
salience of the foreign policy debate is found in Taiwan and Hong-Kong with respect to China,
highlighting the centrality of international relations in a region where international trade is key
and strong tensions persist. In South Korea, however, negative attitudes towards North Korea
are closely related to conservative political positions (Lee and You 2019), contrary to the
ideological divide found in Taiwan and Hong-Kong (see below).13
12 Economic polarization is also attracting more attention in popular culture. The recent success of the film Parasite,
which portrays the gap between the urban poor and the wealthy in South Korea, hints at a change in social attitudes
towards equity issues.
13 Negative attitudes are measured by Lee and You (2019) as agreeing with the statement “We should be wary of
or hostile toward North Korea”.
12
The hard stance on North Korea of the pre-democratic authoritarian regimes was inherited by
the Grand National Party and its successors (now the United Future at the time of writing),
while the Democratic Party historically advocated for a more pragmatic policy of engagement.
President Kim Dae-Jung’s “Sunshine Policy” of the early 2000s was the concrete articulation
of the Democratic vision (Koh 2001). It promoted cultural and economic exchanges with North
Korea, with the final goal of reaching de-facto unification, in which people, goods and services
could freely move across the border. The policy marked a before and after in modern inter-
Korean relations, but also increased the polarization of South Korea’s domestic debate on the
North Korean issue, with conservatives accusing Kim Dae-Jung of giving in to the demands of
the North Korean regime without achieving any reciprocity, and even betraying the North
Korean people by providing aid to the totalitarian regime. The conservatives’ return to power
between 2007 and 2017, and in particular Lee Myung-bak’s presidency (2007-2012) entailed a
reversion to a more rigid approach to North Korean relations. In practice, most of the inter-
Korean negotiations over the past decade have revolved around North Korea’s nuclear program,
in an attempt to promote the denuclearization of the peninsula. Since 2017, President Moon
Jae-in’s North Korean policy has marked a return to the spirit of the Sunshine policy,
culminating in three inter-Korean summits during 2018 and 2019. However, progress on
denuclearization has been rather limited so far (Pacheco Pardo 2018; Choe 2018).
The North Korean cleavage is primarily structured along generational lines. Elder voters tend
to oppose the Democratic Party’s engagement policy, yet survey data from the Asian Institute
for Policy Studies show that they are also significantly more prone to support unification and
have a stronger sense of North Korea being part of the same nation than their young
counterparts. The South Korean youth, as in Hong Kong and Taiwan, seems to have begun to
develop a sense of South Korean national identity, drifting away from their cultural and
historical ties to the north. The increasingly frequent contact of the South Korean youth with
the rest of the world has prompted awareness among them of their country’s cultural and
economic proximity with the West and its distance to modern day North Korea (Campbell
2011). In 2017, almost 50 percent of South Koreans in their twenties declared perceiving North
13
Korea as a “Stranger/Enemy”, and only 32 percent felt they were “One of [them]”, compared
to 29 percent and 62 percent respectively for those aged 60 and above (Jiyoon, Kim, and
Chungku 2018). The youth’s support for unification is also significantly lower, and when
present it is much more likely to be due to security concerns rather than a feeling of national
unity. Yet, support for unification remains very high among the general population and has
increased between 2010 and 2017, with 82 percent of South Koreans favoring a unified Korea.
The Intensification of Generational Divides
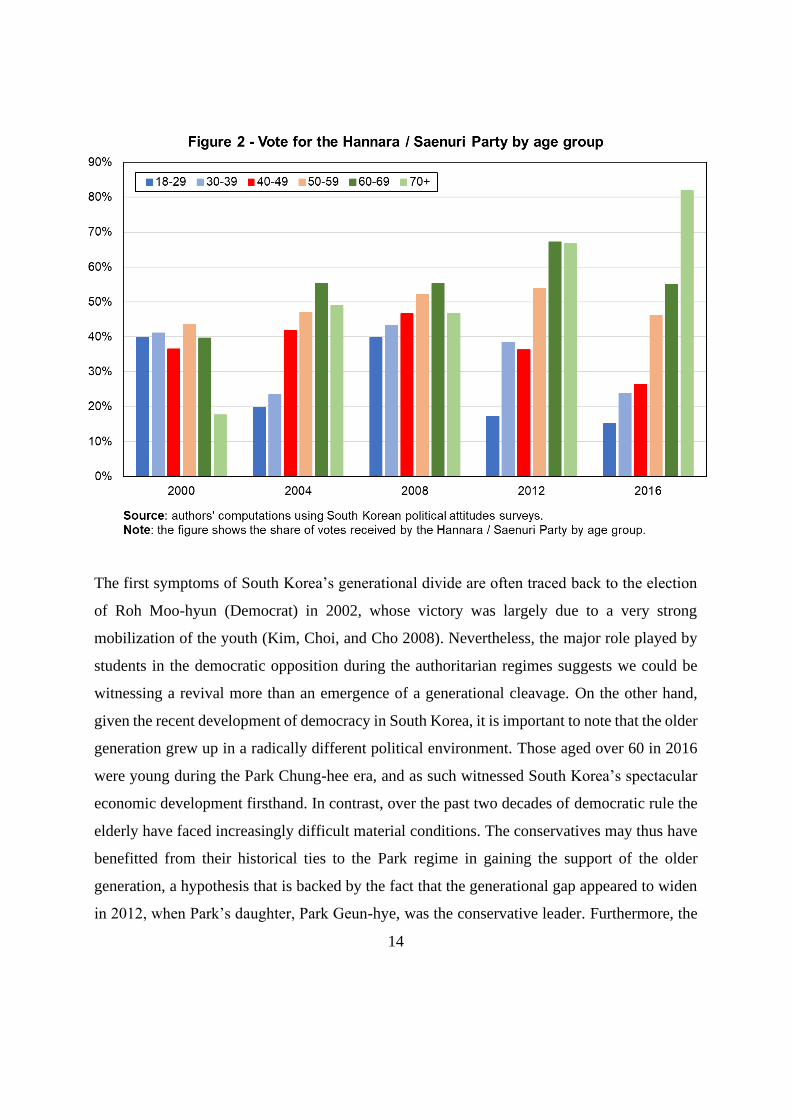
Age has become an increasingly better predictor of voting behavior in recent years, with older
people showing a much stronger support for the conservatives than younger generations
(Hellmann 2011; Kim and Park 2018). As shown in Figure 2, in 2016 the elderly (those aged
60 or above) were 25 percentage points more likely to vote for the conservatives than their
younger counterparts, versus 4 percentage points in 2000.14 We show in the appendix that after
controlling for other socioeconomic variables, in particular for education, the gap is reduced to
16 percentage points in 2016 and the trend becomes less clear, but the divide remains
significant. The large discrepancy between the pre- and post-controls numbers comes from a
rising interaction between education and age, as tertiary graduates are increasingly less likely
to vote for the conservative party, and the share of tertiary educated is much lower among the
elderly.15
14 The trend is stable except in 2008, where age does not seem to play as much of a role in voting behavior. There
are several potential reasons explaining the break, as the 2008 elections were rather exceptional, with a very low
participation rate (46.1 percent, the lowest since democratization) and a significant division of the conservatives
into three parties. Disappointment with the exiting Rho Moo-hyun’s progressive administration was quite strong,
and the Democratic Party obtained a particularly bad result amid high abstention of the youth. On the other hand,
the conservative vote was split across three parties, with Park Geun-hye’s coalition performing particularly well
among the elderly, leaving a more age-balanced electoral base to the GNP. The break in the trend may, however,
also be due to reduced accuracy of the data through the high abstention rate.
15 See appendix Figures A23 and A24.
14
The first symptoms of South Korea’s generational divide are often traced back to the election
of Roh Moo-hyun (Democrat) in 2002, whose victory was largely due to a very strong
mobilization of the youth (Kim, Choi, and Cho 2008). Nevertheless, the major role played by
students in the democratic opposition during the authoritarian regimes suggests we could be
witnessing a revival more than an emergence of a generational cleavage. On the other hand,
given the recent development of democracy in South Korea, it is important to note that the older
generation grew up in a radically different political environment. Those aged over 60 in 2016
were young during the Park Chung-hee era, and as such witnessed South Korea’s spectacular
economic development firsthand. In contrast, over the past two decades of democratic rule the
elderly have faced increasingly difficult material conditions. The conservatives may thus have
benefitted from their historical ties to the Park regime in gaining the support of the older
generation, a hypothesis that is backed by the fact that the generational gap appeared to widen
in 2012, when Park’s daughter, Park Geun-hye, was the conservative leader. Furthermore, the
15
omnipresence of references to the North Korean threat in the political discourse during the
decades authoritarian rule seems likely to have fed the rejection of the Democrats’ engagement
approach among older voters.
The Decline of the Regional Cleavage
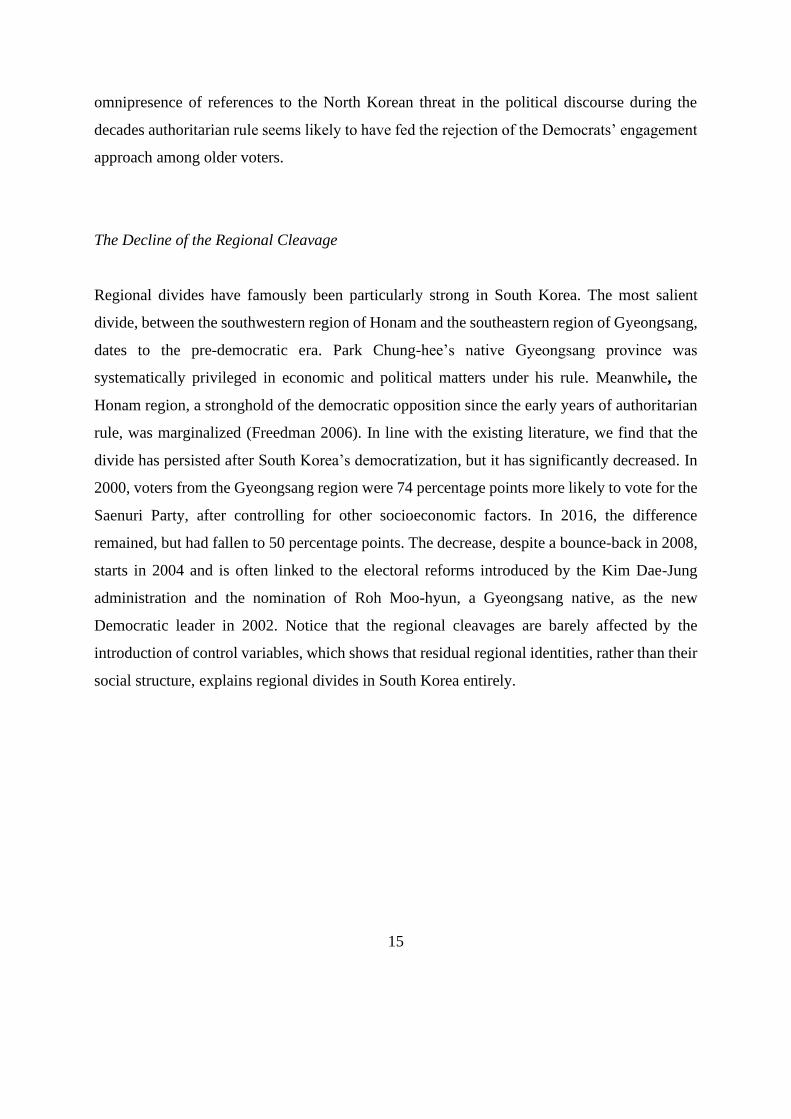
Regional divides have famously been particularly strong in South Korea. The most salient
divide, between the southwestern region of Honam and the southeastern region of Gyeongsang,
dates to the pre-democratic era. Park Chung-hee’s native Gyeongsang province was
systematically privileged in economic and political matters under his rule. Meanwhile, the
Honam region, a stronghold of the democratic opposition since the early years of authoritarian
rule, was marginalized (Freedman 2006). In line with the existing literature, we find that the
divide has persisted after South Korea’s democratization, but it has significantly decreased. In
2000, voters from the Gyeongsang region were 74 percentage points more likely to vote for the
Saenuri Party, after controlling for other socioeconomic factors. In 2016, the difference
remained, but had fallen to 50 percentage points. The decrease, despite a bounce-back in 2008,
starts in 2004 and is often linked to the electoral reforms introduced by the Kim Dae-Jung
administration and the nomination of Roh Moo-hyun, a Gyeongsang native, as the new
Democratic leader in 2002. Notice that the regional cleavages are barely affected by the
introduction of control variables, which shows that residual regional identities, rather than their
social structure, explains regional divides in South Korea entirely.
16
During the first years of democracy, regionalism expanded beyond the Honam and Gyeongsang
divide. The “era of the three Kims” in the 1990s was marked by strong regional voting, with
each candidate gathering large majorities in his home region.16 However, while regional voting
has persisted in Honam and Gyeongsang, our data suggest that regionalism has all but
disappeared in the rest of the country.17
16 The “Three Kims” were Kim Jong-pil, from the Chungcheong province, Kim Young-sam from Gyeongsang and
Kim Dae-jung from Honam. All three gathered between 60 percent and 90 percent of the vote in their native region
in the 1992 elections.
17 See region coefficients after controls in Table A3 in the appendix.
17
Towards Class Cleavages?
Class cleavages in South Korean politics have been rarely discussed, as the consensus used to
be that they were absent from the country’s political system. Regional voting and ideology
(often through the North Korean cleavage) were so strong that hardly any other voting factor
was observed. The absence of class voting was also rather unsurprising, as South Korea’s
relatively low level of inequality during the first decade of democracy and the repression of
labor movements during the authoritarian regimes meant the very drivers of class cleavages
were absent (Hellmann 2011). However, in recent years, economic polarization and the
increased salience of redistributive issues in the political debate have reopened the question of
class voting. One of the problems with analyzing class voting in South Korea, as noted by
Yoonkyung Lee and Jong-sung You, is the very strong overlap between age and income (Lee
and You 2019). The strong conservatism and the high rates of poverty among the elderly have
caused much of the literature to talk about “reverse-class voting” (Kang 2017).
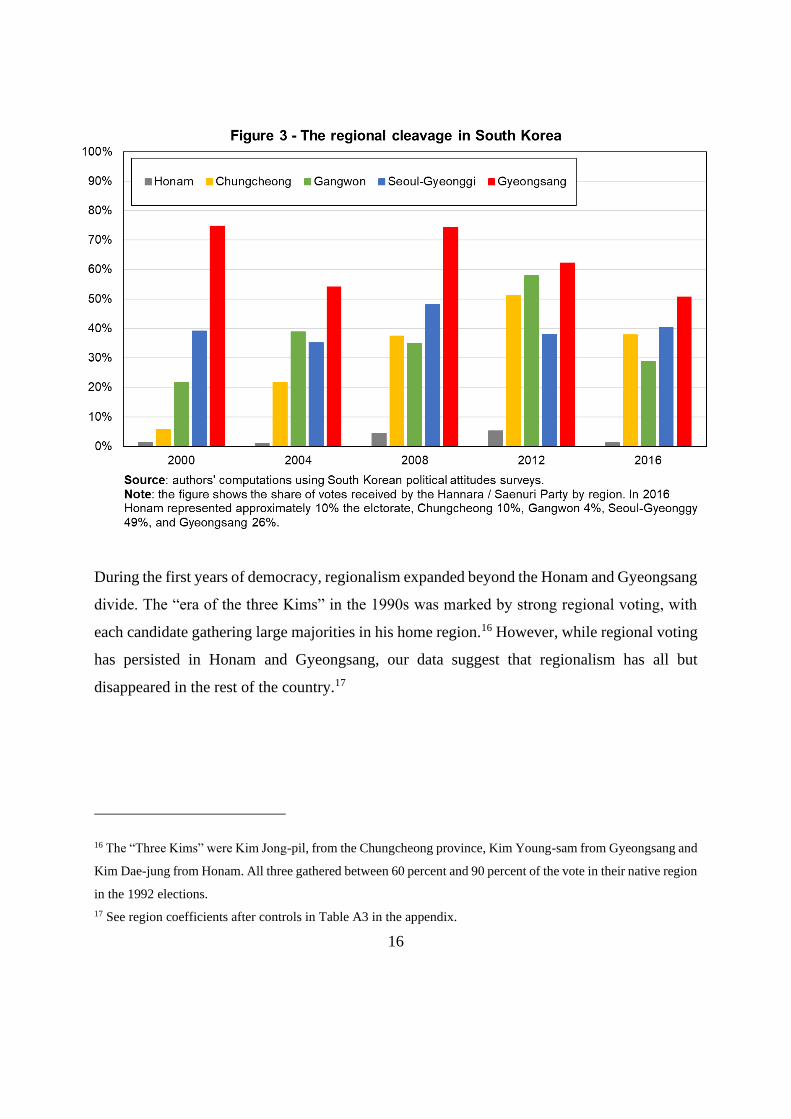
Indeed, if we look at voting results across income groups, the support of the poor for
conservatives is quite salient.18 However, we find that once age is controlled for, or once voters
older than 60 are removed from the sample, conservative vote is slightly higher among the
middle 40 percent (the fifth to ninth deciles of income) than among the bottom 50 percent
income earners (see Figure 4). Top income earners (top 10 percent) however, do not show a
clear voting pattern. conservative vote becomes very slightly lower among the bottom 50
percent income earners compared to the middle 40 percent (Figure 4). While it may be too early
to claim that class cleavages are emerging in South Korea given the short time-span and the
relatively low magnitude of the phenomenon (the gap is of some 5 percentage points), a change
18 See appendix Figure A28. The assimilation of class voting to income voting should not be problematic, as
multiple studies show that income is by far the most important factor determining subjective class belonging in
South Korea. See Lee and You (2019).
18
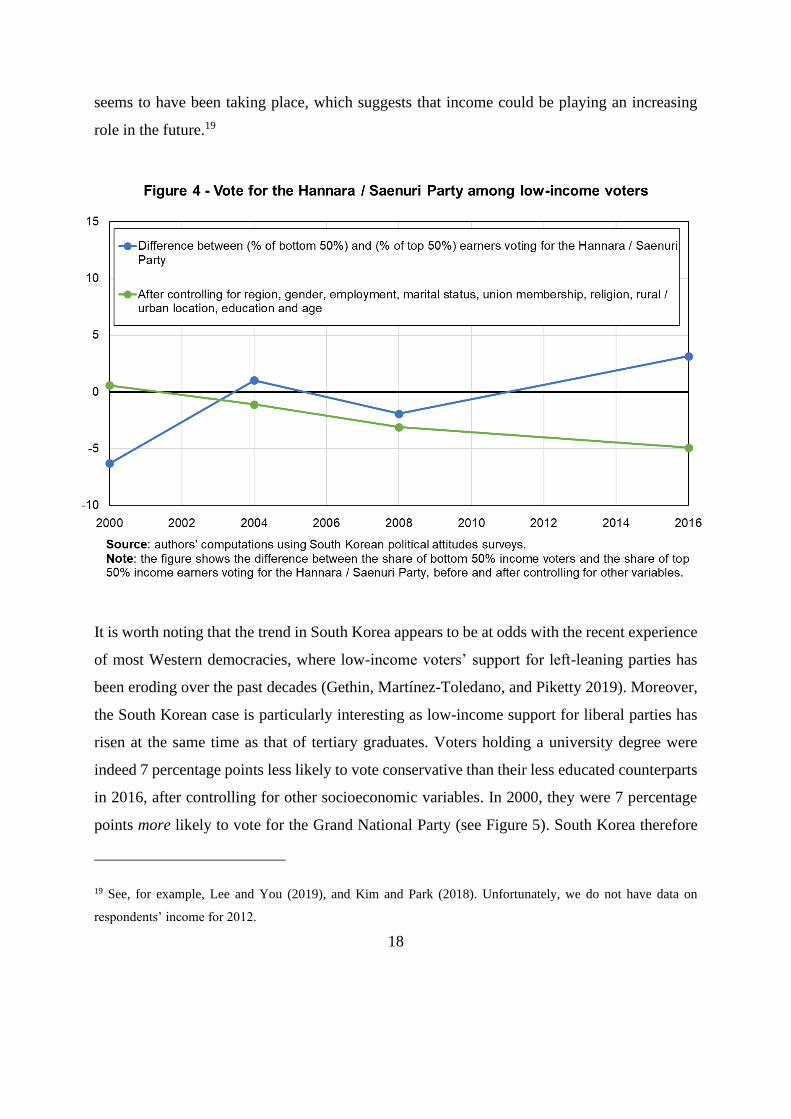
seems to have been taking place, which suggests that income could be playing an increasing
role in the future.19
It is worth noting that the trend in South Korea appears to be at odds with the recent experience
of most Western democracies, where low-income voters’ support for left-leaning parties has
been eroding over the past decades (Gethin, Martínez-Toledano, and Piketty 2019). Moreover,
the South Korean case is particularly interesting as low-income support for liberal parties has
risen at the same time as that of tertiary graduates. Voters holding a university degree were
indeed 7 percentage points less likely to vote conservative than their less educated counterparts
in 2016, after controlling for other socioeconomic variables. In 2000, they were 7 percentage
points more likely to vote for the Grand National Party (see Figure 5). South Korea therefore
19 See, for example, Lee and You (2019), and Kim and Park (2018). Unfortunately, we do not have data on
respondents’ income for 2012.
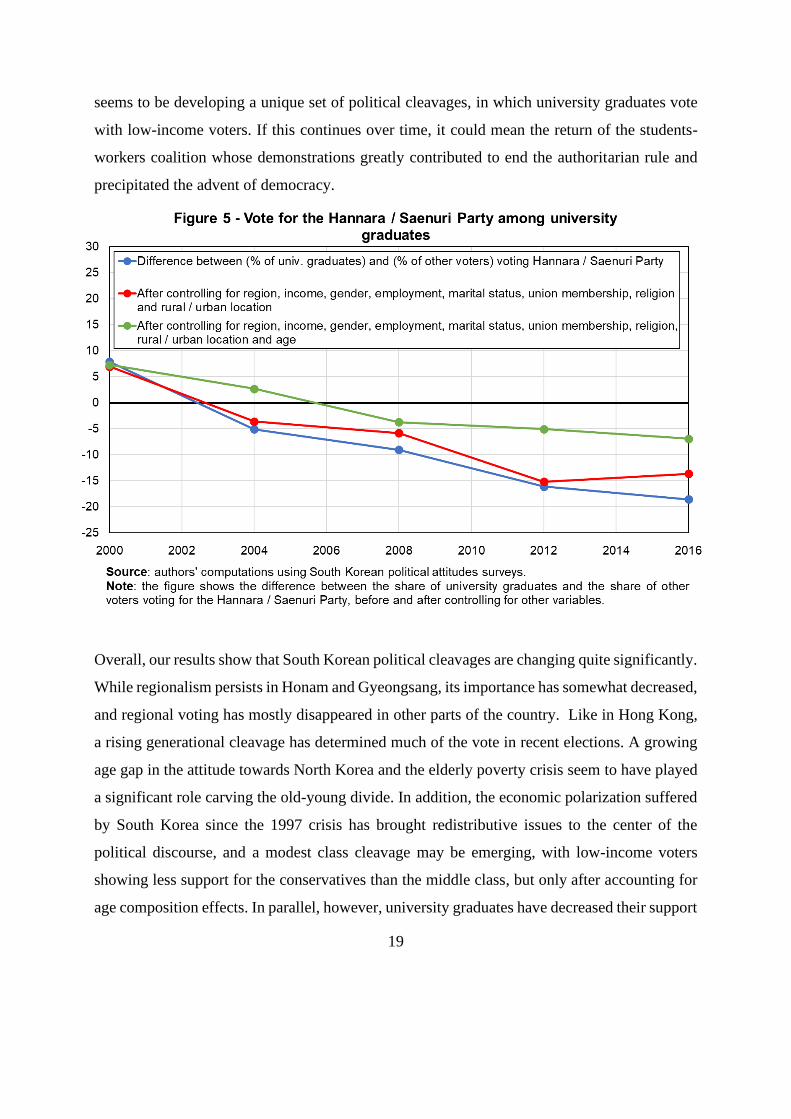
19
seems to be developing a unique set of political cleavages, in which university graduates vote
with low-income voters. If this continues over time, it could mean the return of the students-
workers coalition whose demonstrations greatly contributed to end the authoritarian rule and
precipitated the advent of democracy.
Overall, our results show that South Korean political cleavages are changing quite significantly.
While regionalism persists in Honam and Gyeongsang, its importance has somewhat decreased,
and regional voting has mostly disappeared in other parts of the country. Like in Hong Kong,
a rising generational cleavage has determined much of the vote in recent elections. A growing
age gap in the attitude towards North Korea and the elderly poverty crisis seem to have played
a significant role carving the old-young divide. In addition, the economic polarization suffered
by South Korea since the 1997 crisis has brought redistributive issues to the center of the
political discourse, and a modest class cleavage may be emerging, with low-income voters
showing less support for the conservatives than the middle class, but only after accounting for
age composition effects. In parallel, however, university graduates have decreased their support
20
for the conservatives, producing a unique configuration of the low-income and the highest-
educated simultaneously favoring progressive parties. We will have to wait a few more
elections to tell whether these long-run tendencies will persist or not.
Taiwan
As in South Korea and Hong Kong, contemporary Taiwanese politics have been structured by
foreign policy. The island’s political and cultural history is intrinsically linked to that of China.
As synthesized by Achen and Wang (2017), this relationship has taken the form of a culture
heritage, a security threat, and an economic opportunity. Immigration waves in the seventeenth
century, along with the establishment of a local Chinese government by the Qing dynasty
between 1684 and 1895, led Han Chinese to represent the majority of the island’s inhabitants.
Taiwan was ceded to Japan in 1895, only to be given back to China at the end of World War II.
The defeat of Chiang Kai-shek’s Republic of China (ROC) against the Communist Party of
China in the Chinese civil war came with the retreat of Chiang and two million of his followers
to Taiwan in 1949. Taiwan and the mainland’s common history, as well as the policies of
Sinicization implemented by the Kuomintang (KMT) government in the second half of the
twentieth century, contributed to foster a sense of Chinese identity, which has declined since
democratization but does persist until today.20
Taiwan’s relation to China has however been, both internally and externally, eminently
conflictual. Internally, the corruption and repression of the Kuomintang government came with
the formation of a social cleavage opposing mainlanders to the local residents speaking the
Minnan and Hakka dialects. This cleavage culminated in the “2–28 Incident” of 1947, in which
20 See in particular Wang (2017). Based on survey data, the author shows that in 1992, about 30 percent of
respondents declared feeling only Chinese, 20 percent only Taiwanese, and 50 percent a dual identity. In 2012,
these proportions had shifted to less than 5 percent, 55 percent, and 40 percent, so that single Taiwanese
identification has become dominant.
21
thousands of civilians were killed by the Republic of China’s (ROC) troops. In the second half
of the twentieth century, ethnic divisions in Taiwan lost much of their salience, but continued
to frame citizens’ opinions on the question of reunification with the mainland (Chu and Lin
2001). Externally, the communist People’s Republic of China (PRC) never accepted to
recognize the Taiwan-based government as the legitimate ruler of China, which led to repeated
military incidents and diplomatic threats. The persistence of these tensions, along with the
PRC’s growing success at isolating Taiwan on the diplomatic scene, contributed to erode
citizens’ Chinese identity and their support for eventual reunification. As the democratization
of the 1980s allowed the formation of the pro-independence Democratic Progressive Party
(DPP), the present and future of relationships with the mainland became the new democracy’s
core political cleavage (Hsieh 2005).
Yet, the extraordinary growth of the Chinese economy in the past two decades has led to a
remarkable intensification of economic exchanges between the two sides of the Taiwan Strait
(Chiang and Gerbier 2013; Tan and Ho 2017). Policies implemented by both governments
contributed to encourage this transformation, as revealed by the signature of the Economic
Cooperation Framework Agreement (ECFA) in 2008 aiming to reduce tariffs and trade barriers
in the two countries. While trade liberalization has often been embraced by both the KMT and
DPP, it has opened a potential for a new division between the “winners” and the “losers” of
globalization. This division could lead to a realignment of vulnerable workers towards the DPP,
which is generally less favorable to strengthening relations with China, and eventually
materialize in the form of a new class cleavage (Wu 2013).
The study of electoral behaviors in Taiwan has been a flourishing field. A number of studies
have documented the strength and persistence of the independence/reunification cleavage, and
the role played by ethnic identities, partisan identifications, and the North-South divide in
structuring its representation in electoral politics.21 While our findings are largely in line with
the existing literature, our contribution is threefold. First, we aim to compare the
21 An excellent review and synthesis of the field can be found in Achen and Wang (2017).
22
independence/reunification cleavage in Taiwan to that observed in South Korea and Hong
Kong: do we observe, for instance, generational and educational divides comparable to those
found in these two countries? Secondly, we seek to understand better how the structure of
political cleavages interacts with existing social inequalities: do ethnic and regional identities
correlate to economic positions, or are these dimensions orthogonal to each other when
compared to the other contemporary democracies? Third, we contribute to the existing debate
on the potential for class cleavages in Taiwan by decomposing vote choices by income and
education using indicators similar to those used for other countries studied in this paper, which
allows meaningful international comparisons.
Democratization and the Transformation of Taiwan’s Party System
When the Kuomintang government moved to Taiwan in 1949, it quickly established an
authoritarian regime, prohibiting political parties, repressing dissident opinions, and controlling
mass media. The KMT became the only legal political party, and the political representation of
Minnans and Hakkas was suppressed. Local elections were implemented under the one-party
regime, mainly as a way of recruiting political elites and distributing economic prerogatives,
but they did permit independent candidates to run, which allowed non-KMT forces to gradually
unify in the 1970s under the Tangwai movement (literally “outside the party”). At first a
convenient label for differentiating KMP members from non-members, the Tangwai grew in
the 1980s and became the strongest force pushing for the democratization of the political system
(Yu 2017). The majority of independents eventually joined the new Democratic Progressive
Party in 1986 and, after a gradual relaxation of existing legal constraints on the media and the
political parties, the KMT government organized the first direct legislative election in 1992,
and the first presidential election in 1996.
As shown in Figure 6, Taiwan has gradually stabilized into a two-party system as support for
the DPP grew in the 1990s and 2000s. The share of votes received by the DPP grew from 21
percent in 1996 to 57 percent in 2020, and the party won the elections of 2000, 2004, 2016 and
2020, while a Kuomintang president was elected in 1996, 2008, and 2012. Other presidential
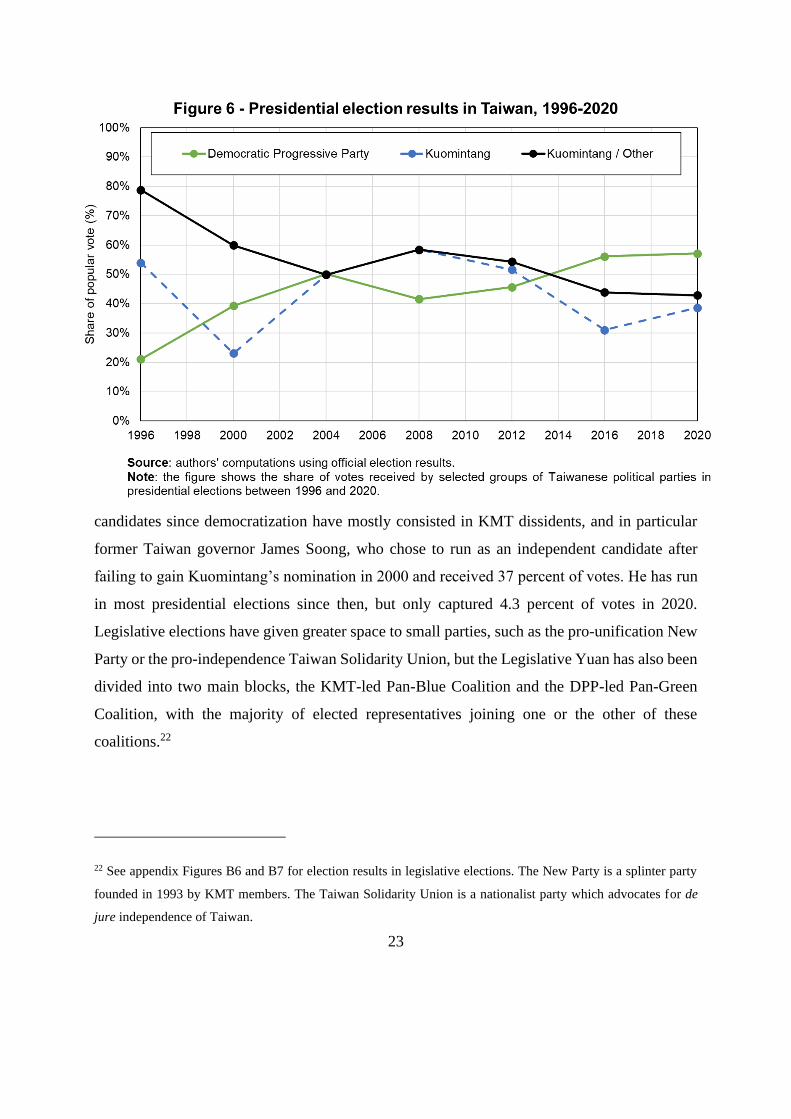
23
candidates since democratization have mostly consisted in KMT dissidents, and in particular
former Taiwan governor James Soong, who chose to run as an independent candidate after
failing to gain Kuomintang’s nomination in 2000 and received 37 percent of votes. He has run
in most presidential elections since then, but only captured 4.3 percent of votes in 2020.
Legislative elections have given greater space to small parties, such as the pro-unification New
Party or the pro-independence Taiwan Solidarity Union, but the Legislative Yuan has also been
divided into two main blocks, the KMT-led Pan-Blue Coalition and the DPP-led Pan-Green
Coalition, with the majority of elected representatives joining one or the other of these
coalitions.22
22 See appendix Figures B6 and B7 for election results in legislative elections. The New Party is a splinter party
founded in 1993 by KMT members. The Taiwan Solidarity Union is a nationalist party which advocates for de
jure independence of Taiwan.
24
While the question of independence/unification has been the main issue in Taiwanese politics,
there have been significant changes in the issues emphasized by political parties since
democratization. In fact, before democratization was achieved, this cleavage was only one of
several dimensions of political conflict with a potential to be represented in the emerging party
system. In the 1980s, as the elites of the Dang-wai united to form an opposition group to the
KMT, their main demand was not independence, but rather the reform of the political system
(Hsieh 1996).23 It was only once the process of democratization was achieved that the DPP
changed its focus to defending a strong position on independence of Taiwan from China (Sheng
and Liao 2017).
One of the reasons for this strategic shift was that this question was deeply connected to latent
divides between mainlanders and other ethnic groups, who had diverging beliefs and attitudes
towards mainland China. By contrast, while income inequality had risen significantly in the
1980s, and government benefits had mostly accrued to mainlanders under KMT rules,
democratization failed to trigger the emergence of a class cleavage, partly because the KMT
strategically responded to redistributive claims, because Taiwan’s economic structure,
characterized by the multiplication of small businesses, made the mobilization of the working
class particularly difficult and, as we will argue below, because ethnicity represented a very
poor mediating factor for representing economic inequality. By framing the
independence/unification issue, the DPP was able to attract the growing share of Minnan and
Hakka citizens who felt more “Taiwanese” and less “Chinese”. The DPP’s stance on the process
of independence itself has since then varied in being more or less radical, depending on the
context and the party’s electoral success, but it has remained the key feature distinguishing the
KMT from the DPP in voters’ minds (Sheng and Liao 2017).
23 Based on a survey conducted in 1993, the article identified six issues on which parties competed: the economy,
national identity, the environment, stability, local public works, and corruption. The author concluded that “the
stability issue is the survival kit of the KMT.”
25
Social Inequalities, Identity, and Political Cleavages in Taiwan
The existing literature has shown ethnicity to be a strong determinant of electoral behaviors and
an enduring marker of attitudes towards independence or unification. Ethnolinguistic groups in
Taiwan can be divided into four broad categories: Minnans, Hakkas, Mainlanders, and
Aborigines. The Minnans and Hakkas refer to island residents whose ancestors migrated from
China regions speaking the Minnan and Hakka dialects between the seventeenth and the first
half of the twentieth century. In 2016, they represented about 72 percent and 14 percent of the
Taiwanese electorate respectively. The Mainlanders amount to about 12 percent of the
electorate and are the descendants of the approximately two million people who emigrated from
China with Chiang Kai-shek at the end of the 1940s. The Aborigines, who represent less than
2 percent of the population today, are Austronesian indigenous people who lived on the island
before the Han immigration waves of the seventeenth century – given too low sample sizes, we
exclude them from our analysis.24
When the KMT imposed military rule and a one-party state on the island in the 1950s, it
disproportionately favored the mainlanders, who were overrepresented in party membership
and the civil service. Taiwan’s social structure was therefore very comparable to that found in
Malaysia (Gethin and Jenmana forthcoming) and South Africa (Gethin 2020), where an ethnic
minority – mainlanders in Taiwan, the Chinese in Malaysia, and White colonizers in South
Africa – controlled a large share of economic resources and of the state apparatus.
However, unlike in Malaysia and South Africa, where ethnic inequalities remained substantial
throughout the twentieth century, the KMT initiated a large process of indigenization of state
bureaucracy in the 1970s, after 20 years of Mainlander domination.25 This gradual incorporation
24 See appendix Table B2 and Figure B11 for the composition of the Taiwanese electorate by ethnicity and its
evolution over time.
25 For example, the share of native Taiwanese in the civil services increased from 56.5 percent in 1959 to 71
percent in 1991. See Chu and Lin, “Political Development in 20th Century Taiwan”, 119.
26
of Minnans and Hakkas into the state elite, as well as the economic boom of the 1970s and
1980s, the emergence of an export-led private sector, and growing intermarriage between
mainlanders and native Taiwanese, together contributed to reduce ethnic inequalities and ethnic
divides in Taiwan.26 Today, ethnicity and income are almost completely uncorrelated, and the
share of lower-educated adults is only marginally lower among mainlanders than among native
Taiwanese.27 In summary, while ethnic cleavages could be the precursor of class cleavages in
ethnically structured economies like South Africa or Malaysia, this was not the case in Taiwan,
where ethnolinguistic affiliations were almost entirely disconnected from social class.
The Persistence of Ethnic Divides
We now turn to the analysis of political cleavages in Taiwan by using post-electoral surveys
conducted between 1996 and 2016, which asked respondents about their voting behaviors in
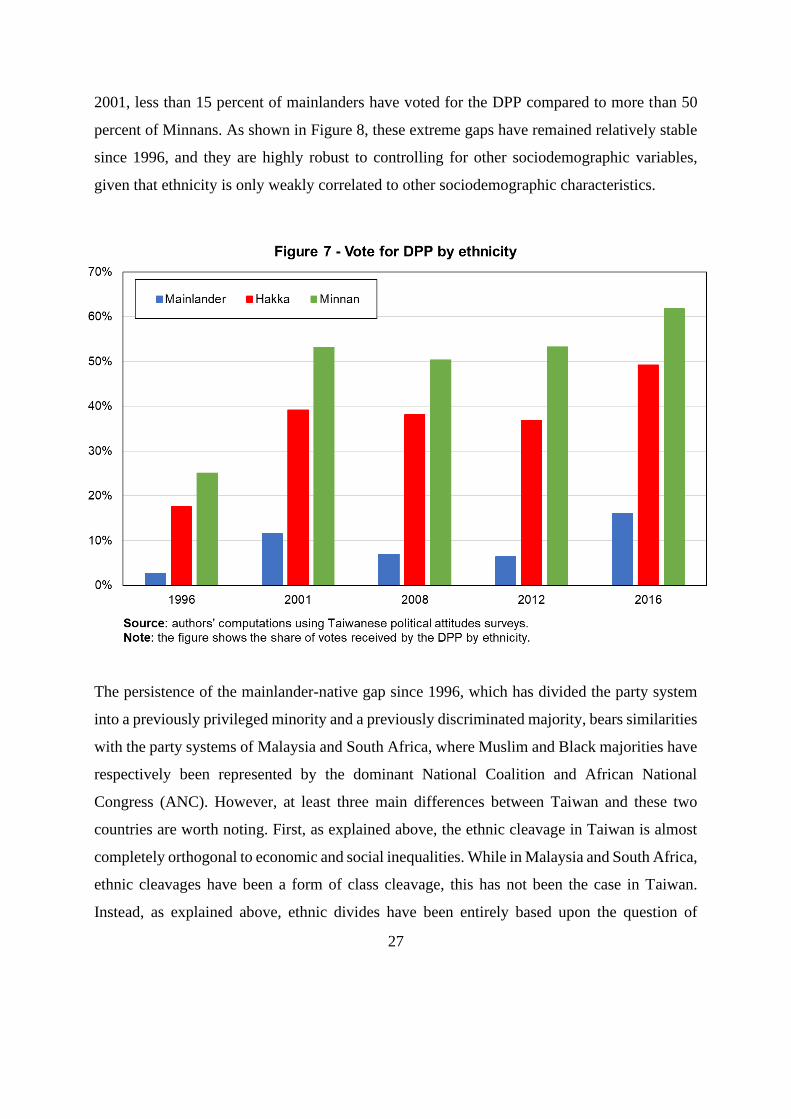
presidential elections.28 Figures 7 and 8 show that the rise of the DPP since 1996 has coincided
with the materialization of a strong ethnic cleavage. In 1996, the DPP was supported by only 2
percent of mainlanders compared to 18 percent of Hakkas and 25 percent of Minnans. Since
26 In 2006, 42 percent of Taiwanese declared having a close relative married to a mainlander, and 67 percent
declared getting along with Minnan, Hakka, and mainlanders about the same. See Wang (2017), 50.
27 See appendix Figures B17 and B18 for the composition of income quintiles by ethnolinguistic affiliation.
According to the surveys at our disposal, mainlanders were slightly overrepresented in the upper middle-class in
1996, amounting to 11 percent of the first quintile compared to 16 percent of the fourth quintile, but these
differences had almost completely vanished in 2016, even if mainlanders were slightly less represented among
low-income groups. Jui-Chang Jao and Matthew McKeever (2006) documented that while older mainlanders were
significantly more educated than Minnans and Hakkas in 1997, ethnic differences in educational attainments were
almost insignificant among younger cohorts, and were almost entirely explained by parents’ social background.
Recent evidence from surname data suggests that the mainlander-native gap decreased monotonically between the
1950s and the 2000s, which show that export-led growth and democratization cannot be held sole responsible for
these transitions: see Hao (2017).
28 See appendix Table B2 for the full list of surveys used, which are taken from the website of the Comparative
Study of Electoral Systems. The only exception is the 2001 survey, which only covers vote choice in the legislative
elections.
27
2001, less than 15 percent of mainlanders have voted for the DPP compared to more than 50
percent of Minnans. As shown in Figure 8, these extreme gaps have remained relatively stable
since 1996, and they are highly robust to controlling for other sociodemographic variables,
given that ethnicity is only weakly correlated to other sociodemographic characteristics.
The persistence of the mainlander-native gap since 1996, which has divided the party system
into a previously privileged minority and a previously discriminated majority, bears similarities
with the party systems of Malaysia and South Africa, where Muslim and Black majorities have
respectively been represented by the dominant National Coalition and African National
Congress (ANC). However, at least three main differences between Taiwan and these two
countries are worth noting. First, as explained above, the ethnic cleavage in Taiwan is almost
completely orthogonal to economic and social inequalities. While in Malaysia and South Africa,
ethnic cleavages have been a form of class cleavage, this has not been the case in Taiwan.
Instead, as explained above, ethnic divides have been entirely based upon the question of
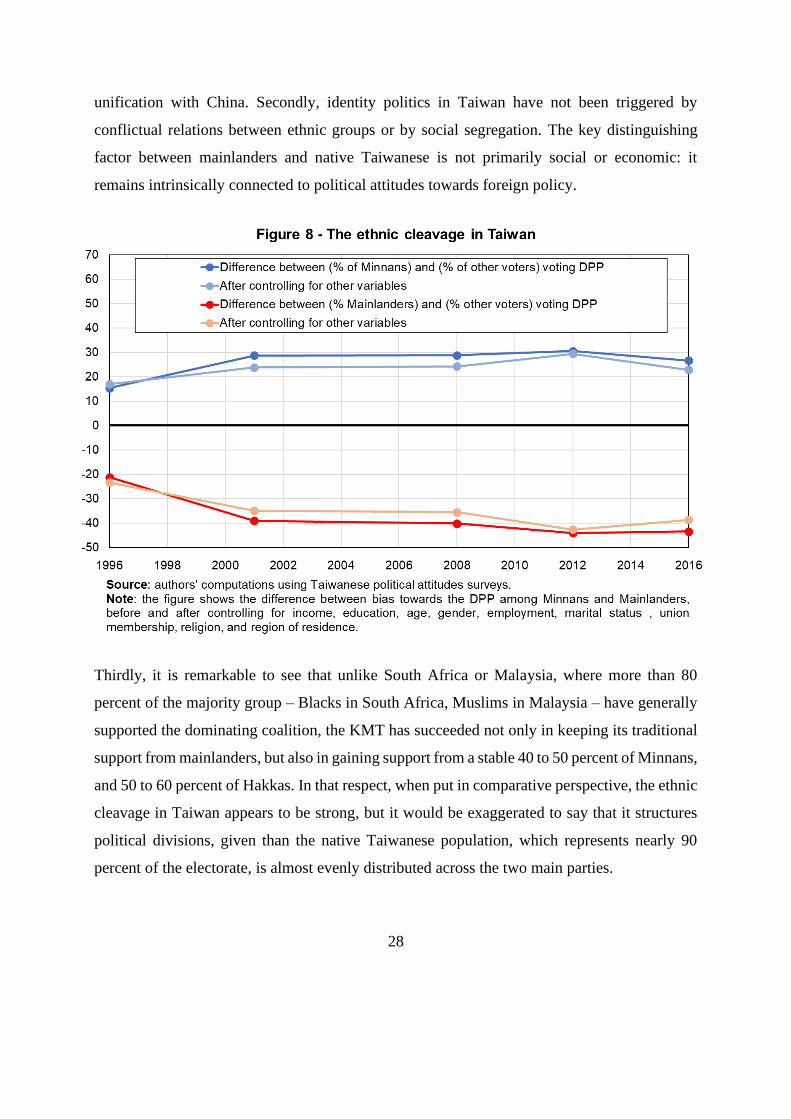
28
unification with China. Secondly, identity politics in Taiwan have not been triggered by
conflictual relations between ethnic groups or by social segregation. The key distinguishing
factor between mainlanders and native Taiwanese is not primarily social or economic: it
remains intrinsically connected to political attitudes towards foreign policy.
Thirdly, it is remarkable to see that unlike South Africa or Malaysia, where more than 80
percent of the majority group – Blacks in South Africa, Muslims in Malaysia – have generally
supported the dominating coalition, the KMT has succeeded not only in keeping its traditional
support from mainlanders, but also in gaining support from a stable 40 to 50 percent of Minnans,
and 50 to 60 percent of Hakkas. In that respect, when put in comparative perspective, the ethnic
cleavage in Taiwan appears to be strong, but it would be exaggerated to say that it structures
political divisions, given than the native Taiwanese population, which represents nearly 90
percent of the electorate, is almost evenly distributed across the two main parties.
29
Regional Cleavages and Spatial Inequalities
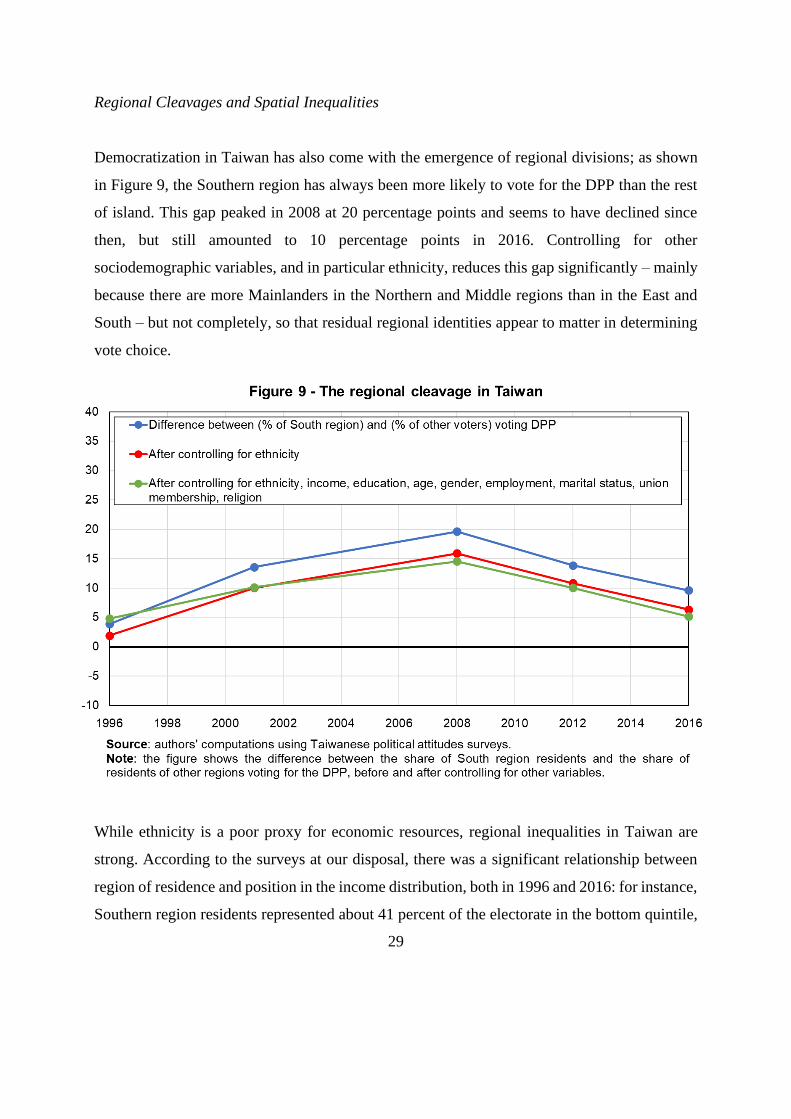
Democratization in Taiwan has also come with the emergence of regional divisions; as shown
in Figure 9, the Southern region has always been more likely to vote for the DPP than the rest
of island. This gap peaked in 2008 at 20 percentage points and seems to have declined since
then, but still amounted to 10 percentage points in 2016. Controlling for other
sociodemographic variables, and in particular ethnicity, reduces this gap significantly – mainly
because there are more Mainlanders in the Northern and Middle regions than in the East and
South – but not completely, so that residual regional identities appear to matter in determining
vote choice.
While ethnicity is a poor proxy for economic resources, regional inequalities in Taiwan are
strong. According to the surveys at our disposal, there was a significant relationship between
region of residence and position in the income distribution, both in 1996 and 2016: for instance,
Southern region residents represented about 41 percent of the electorate in the bottom quintile,
30
compared to only 18 percent of top 20 percent Taiwanese earners.29 These inequalities have
risen since the 1990s, with the Southern and Central regions lagging behind the North, a
divergence which has been attributed to the rise of the ICT sector and to increasing cross-Strait
economic integration (Anderson and Klinthäll 2012). Therefore, spatial differences in voting
behaviors do seem to have represented a parallel political cleavage, partially based upon
historical ethnic locations, but also potentially rooted in economic inequality.
Towards Class Cleavages?
Regional inequalities and the corresponding partisan divide that they seem to have generated
bears the question of class cleavages. Has the China question been so omnipresent as to entirely
obliterate political representations of economic inequality, or has Taiwan’s party system
represented divisions between rich and poor in recent elections? This has been a debated
question: some studies have argued that parties have increasingly focused on the economy
independently from the question of relations with China, while others have shown evidence that
voters’ opinions on economic questions have been mediated by their vision of the
independence/unification question.30
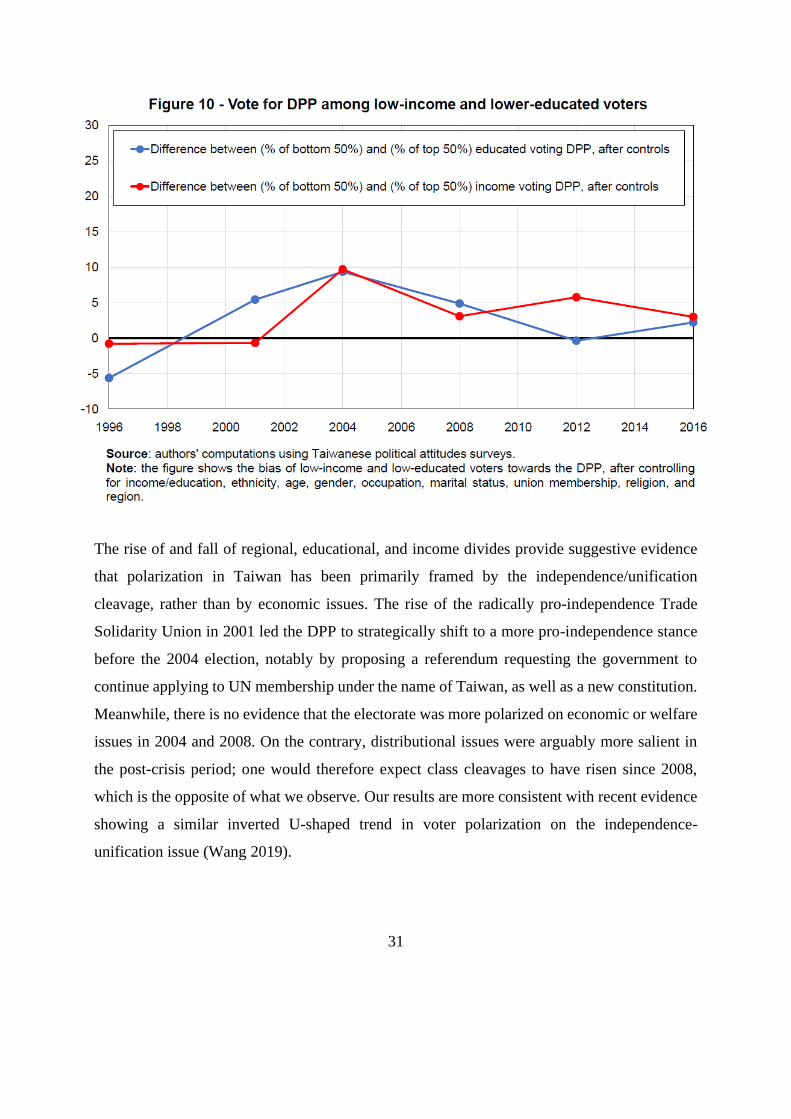
Figure 10 plots the relative bias of lower-educated and low-income voters towards the DPP.
With the exception of 1996, when the DPP was more supported by high-income and higher-
educated voters, poorer and less educated voters have been more likely to vote for the DPP by
5 to 15 percentage points. As in the case of regional divides, the gap reached its peak in 2004
and seems to have declined since then.
29 On the composition of income quintiles by region of residence, see appendix Figures B19 and B20.
30 See Wu (2013), who argues that slower growth and rising unemployment have led parties to put greater emphasis
on wealth gaps. However, quantitative evidence from survey data does not suggest that opinions on social welfare
affect attitudes towards trade with China once opinions towards the unification/independence are controlled for,
which suggests that attitudes about trade agreements are primarily about China rather than economics: see Achen
and Wang (2017).
31
The rise of and fall of regional, educational, and income divides provide suggestive evidence
that polarization in Taiwan has been primarily framed by the independence/unification
cleavage, rather than by economic issues. The rise of the radically pro-independence Trade
Solidarity Union in 2001 led the DPP to strategically shift to a more pro-independence stance
before the 2004 election, notably by proposing a referendum requesting the government to
continue applying to UN membership under the name of Taiwan, as well as a new constitution.
Meanwhile, there is no evidence that the electorate was more polarized on economic or welfare
issues in 2004 and 2008. On the contrary, distributional issues were arguably more salient in
the post-crisis period; one would therefore expect class cleavages to have risen since 2008,
which is the opposite of what we observe. Our results are more consistent with recent evidence
showing a similar inverted U-shaped trend in voter polarization on the independence-
unification issue (Wang 2019).
32
In summary, our results show that lower-educated, low-income, and Southern voters have been
significantly more likely to vote for the pro-independence camp since the early 2000s, and this
was even more the case in elections where partisan divides on the independence/unification
issue were stronger. These findings are completely the opposite of what we find in Hong Kong
where pro-democratic votes have been higher among higher-income and higher-educated voters
(see below). This difference arguably lies in the fact that the China question has interacted with
other dimensions of political conflicts in very different ways in the two territories: while in
Hong Kong, pro-Beijing forces have been more popular among older generations and
immigrants, two groups on average poorer than the rest of the population, the Kuomintang has
on the contrary historically been the party of the mainlander elite, a divide that the DPP seems
to have carried into the present day by representing not only formerly oppressed ethnic groups,
but also disadvantaged voters and poorer regions. Additionally, while economic patronage from
Beijing in Hong Kong may make integration more appealing to low-income voters, increasing
competition from mainland China’s industries may be negatively perceived by industrial
workers in Taiwan, in a perhaps comparable way to the rise of anti-globalization sentiments
among the working class in Western democracies.
Interestingly, age does not seem to have played a key role in Taiwan, and there is in fact
evidence that a sizable share of new generations has turned to abstention rather than to greater
political mobilization as in Hong Kong (Achen and Wang 2019).31 This may however be
gradually changing in recent years, as students were notably omnipresent in the 2014 Sunflower
Student Movement against the passing of the Cross-Strait Service Trade Agreement with
Beijing. The New Power Party which emerged from this movement captured five seats in the
31 We show in the online appendix that younger voters have been generally more supportive of the DPP, but this
bias is much lower than in the case of Hong Kong. Notice however that this view is static and considers younger
generations at each point in time. There is evidence that the rise of pro-independence views has been partially
driven by the replacement of older cohorts by new cohorts of voters, who tend to be more in favor of independence:
see Huang (2019).
33
legislative Yuan in 2016, but only 3 in 2020, which does not suggest that it is becoming a new
significant political force.32
Hong Kong
Hong Kong was handed over to the People’s Republic of China (PRC) by the United Kingdom
in 1997, in application of the Sino-British Joint Declaration of 1984. According to the
declaration, the Hong Kong Special Administrative Region (HKSAR) was to fall under the
principle of “one country, two systems”: the city’s capitalist system would remain unchanged
for a period of fifty years, and existing civil rights and freedoms would be guaranteed. The
government of the HKSAR would be composed of local inhabitants and elected democratically.
Several promises were made by Chinese officials detailing how and when such democratization
would take place, but none were fulfilled (Ma 2020).
China’s refusal to respond to democratic aspirations, together with the rise of a Hong Kong
identity increasingly viewed in exclusionary rather than complementary to Chinese identity,
initiated a gradual process of political polarization. Colonial Hong Kong had been widely
depicted by political scientists as a passive society, an “apathetic polity” where the culture of
“utilitarian familism” encouraged a materialistic, individual-oriented lifestyle with minimal
political participation (Cooper and Lam 2018).33 This view proved to be outdated in 2003, when
half a million of protestors joined in the streets to oppose the national security bill widely
perceived as a threat to civil liberties. The trend towards radicalization and political activism
continued thereafter, from the occupation of the government headquarters by students in 2007
to the Umbrella movement in 2014 (Ma 2020). The 2019-2020 protests triggered by the
Fugitive Offenders amendment bill, which would have allowed the extradition of criminal
32 On the New Power Party, see in particular Chen and Liao (2019).
33 The concept of “utilitarian familism” originates from the work of Siu-kai Lau in the 1970s and 1980s, in
particular Lau (1978).
34
suspects to mainland China, marked the culmination of mass mobilizations, with millions
taking to the streets in June 2019 (Kleefeld 2019).
Political cleavages in Hong Kong, as in Taiwan, have therefore been in large part structured by
citizens’ visions of, and interactions with, mainland China. The “China factor”, according to
Ma Ngok, has shaped Hong Kong politics in three dimensions: an ideological/identity
dimension, a power-structural dimension, and an organizational resource dimension.
Ideologically, attitudes towards the central government have been the main determinants of
electoral behaviors for the two main coalitions, the pro-democracy camp supporting democracy,
freedom, and autonomy, and the pro-Beijing camp supporting stability and loyalty to Beijing.
The power-structural dimension refers to the PRC’s ultimate control of the rules of the electoral
game, which have been exploited to show a façade of democracy while maintaining the
effective control of political resources and the legislature. The organizational resource factor
refers to Beijing’s ability to mobilize material and social resources to gain both support from
the local population and votes in popular elections, which allowed the pro-Beijing camp to get
a growing share of votes and seats (Ma 2016).
In structuring the opposition between the pro-democracy and the pro-Beijing camps, the main
divide has been generational. A distinct local subculture of “Hongkongers” (Heunggongyahn)
associated with consumerism and Cantonese pop culture had emerged as early as the 1970s, but
it was perceived as complementary, rather than conflictual, with the preexisting pan-Chinese
consciousness that prevailed (Veg 2017). By contrast, the generations that grew up in the 1980s
and 1990s started to envision Hong Kong identity as increasingly unique and partially
incompatible with the political and cultural specificities of the mainland. University students,
in particular, were at the heart of the protests that took place between 2003 and 2019 (Sing
2020).
Importantly, the generational divide in Hong Kong has not only been about identity: it has been
reinforced by other dimensions of political conflict. Key actors in the protest movements were
what the journalist Paul Mason called the “graduate with no future”, students disillusioned with
35
their economic and social perspectives in a city characterized by soaring housing prices and
widening income disparities (Mason 2012). Rapid immigration from the mainland also fostered
xenophobic sentiments against the newcomers, which strengthened the exclusivist vision of a
“Hong Konger identity” incompatible with integration with China (Ma 2015). Hong Kong
politics have therefore combined an integration/disintegration dimension similar to that
observed in Taiwan, an economic dimension, and an internationalist/nativist dimension.
In this section, we use existing political attitudes surveys to study how these different cleavages
have changed between 1998 and 2016. Three main findings emerge from our analysis. First, in
line with qualitative accounts, we document extreme and rising generational divides, almost
unparalleled in comparative perspective, which trump the effects of most other socio-structural
factors in determining party affiliations. Secondly, we show that China-born individuals are
significantly more likely to vote for pro-Beijing parties than for the pan-democracy camp, but
this effect is not as strong as one would expect. The age gradient holds among both groups,
which suggests that processes of socialization among young mainlander cohorts matter in
shaping their political attitudes. Finally, we find that younger voters are significantly more
likely to oppose closer integration with China, to feel exclusively Hong Konger, to oppose
immigration from the mainland, and to think that income inequality is an important societal
problem. Integration with China and Hong Konger identity appear to be much more divisive
across generations, however, which suggests that cleavages related to institutions and
sovereignty are more pronounced than distributional or immigration issues.
Unachieved Democratization and the Transformation of Hong Kong’s Party System
After more than 150 years of colonization by the British, with the exception of a brief period of
Japanese occupation in the 1940s, Hong Kong reintegrated China in 1997 under the principle
of “one country, two systems”. Democratization and the formation of political organizations
had nevertheless already started in the 1980s, as the Sino-British negotiations of 1982-1984
politicized the Hong Kong population. The Tiananmen Square protests in mainland China in
1989, among other factors, had consolidated the strength of pro-democracy political parties,
36
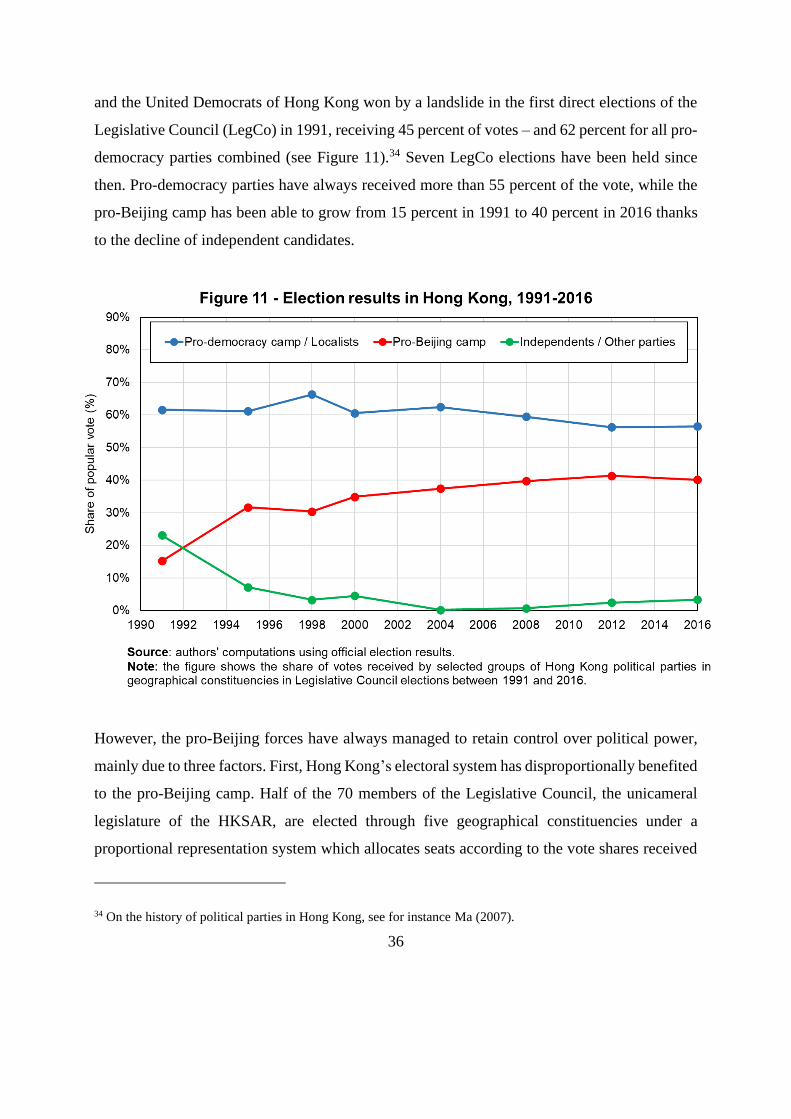
and the United Democrats of Hong Kong won by a landslide in the first direct elections of the
Legislative Council (LegCo) in 1991, receiving 45 percent of votes – and 62 percent for all pro-
democracy parties combined (see Figure 11).34 Seven LegCo elections have been held since
then. Pro-democracy parties have always received more than 55 percent of the vote, while the
pro-Beijing camp has been able to grow from 15 percent in 1991 to 40 percent in 2016 thanks
to the decline of independent candidates.
However, the pro-Beijing forces have always managed to retain control over political power,
mainly due to three factors. First, Hong Kong’s electoral system has disproportionally benefited
to the pro-Beijing camp. Half of the 70 members of the Legislative Council, the unicameral
legislature of the HKSAR, are elected through five geographical constituencies under a
proportional representation system which allocates seats according to the vote shares received
34 On the history of political parties in Hong Kong, see for instance Ma (2007).
37
by parties. The other half are elected through functional constituencies representing specific
interest groups such as big businesses, professional sectors, or labor unions, which have been
much more supportive of the pro-Beijing government.35 In 2016, functional constituencies were
elected by about 230,000 individuals or corporate entities, compared to 3.8 million registered
voters in the geographical constituencies. This allowed the pro-Beijing camp to get 40 of the
70 LegCo seats despite obtaining only 40 percent of votes in geographical constituencies.36
Secondly, the Chief Executive, the head of government, is elected from a restricted pool of
candidates supportive of the Central Government by a 1200-member electoral college of
individuals and interest groups. This has allowed the executive branch of government to be
completely controlled by Beijing. The joint declaration of 1984 stipulated that the Chief
Executive would be eventually selected on the basis of local consultations or elections, which
raised hope of democratization among younger generations. In fact, the election of the Chief
Executive by universal suffrage without pre-screening of candidates was one of the key
demands of protestors in the Umbrella movement of 2014 (Ma 2020).
Thirdly, Beijing has been able to mobilize electoral resources to secure a growing share of
popular votes. Pro-Beijing local networks have cultivated members’ support through material
benefits and social services, which they have been able to dispense thanks to subsidies received
from the mainland. They have also been highly effective at optimizing the organization of party
lists and the allocation of candidates to constituencies, which in 2016 allowed them to get more
35 The system used for geographical constituencies is a proportional system with Largest Remainder method and
Hare quota. Under the PR system, seats are first awarded to the parties or lists that get above the quota, and the
remaining seats are awarded to those who have the most remaining votes after the votes needed to reach the quota
are counted. The Hare quota corresponds to a quota of 1/N if a constituency has N candidates. See Ma (2007).
36 Notice that five of the LegCo members from the functional constituencies (the District Council (Second)
Function Constituencies) are returned by a closed list proportional representation system where Hong Kong as a
whole is considered as a one constituency. Candidates must be elected District Council members who are
nominated by no less than 15 other elected District Council members, and voters are registered GC electors who
are not registered in other FCs. See for instance Pang-kwong (2016).
38
seats than pan-democrats in geographical constituencies, despite receiving a lower vote share
(Ma 2017). Immigration from the mainland has also boosted support for the pro-Beijing camp:
immigrants tend to be more supportive of the status quo, and they have successfully been co-
opted by pro-establishment parties (Wong, Ma, and Lam 2018).
As in Taiwan, while the China factor has been the main axis of electoral competition between
parties at least since the early 1990s, there have been significant changes in the issues debated
by political actors. In the 1991 and 1995 LegCo elections, attitudes towards the Chinese
government, the Tiananmen crackdown, and democratization were the main distinguishing
factors between parties and voters (Leung 1993; Leung 1996). Democratization became an even
more important issue in the context of the 2003 protests against the security bill; and electing
the Chief Executive and the LegCo by universal suffrage was the main demand of the pro-
democracy movement in the 2004 elections (Ma 2020). After the Beijing Olympics of 2008,
the China factor changed again, as anti-China sentiments grew stronger and new currents of
“localism” emerged. Movements of “progressive localism” renewed demands for self-
determination and the implementation of genuine democracy. Movements of “anti-China
localism” born after the 2014 Umbrella protests went further, questioning for the first time the
“one country, two systems” principle and even proposing the sovereign independence of Hong
Kong as a new nation (Chen and Szeto 2015). A “localist” camp emerged in the LegCo in the
2016 legislative election, receiving 19 percent of votes and winning six seats in geographical
constituencies – as compared to 36 percent and 13 seats for the pro-democracy camp. Politics
in Hong Kong have therefore been characterized by growing polarization, as claims are
gradually shifting from autonomy and democracy to cultural exclusivism and even national
sovereignty (Kaeding 2017; Ortmann 2018).
The Rise of Generational Divides
We now turn to the analysis of electoral behaviors in Hong Kong by using political attitudes
surveys available from the Comparative Study of Electoral Systems, which cover the LegCo
elections of 1998, 2000, 2004, 2012, and 2016. Figures 12 and 13 reveal extreme generational
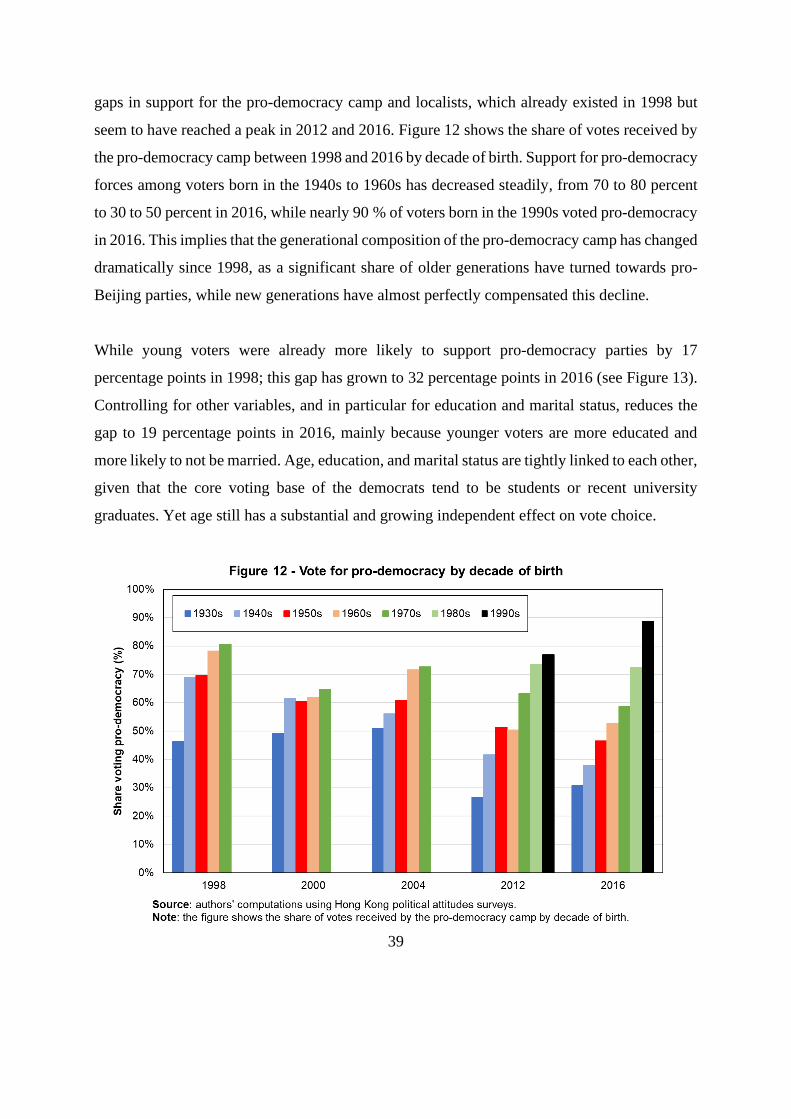
39
gaps in support for the pro-democracy camp and localists, which already existed in 1998 but
seem to have reached a peak in 2012 and 2016. Figure 12 shows the share of votes received by
the pro-democracy camp between 1998 and 2016 by decade of birth. Support for pro-democracy
forces among voters born in the 1940s to 1960s has decreased steadily, from 70 to 80 percent
to 30 to 50 percent in 2016, while nearly 90 % of voters born in the 1990s voted pro-democracy
in 2016. This implies that the generational composition of the pro-democracy camp has changed
dramatically since 1998, as a significant share of older generations have turned towards pro-
Beijing parties, while new generations have almost perfectly compensated this decline.
While young voters were already more likely to support pro-democracy parties by 17
percentage points in 1998; this gap has grown to 32 percentage points in 2016 (see Figure 13).
Controlling for other variables, and in particular for education and marital status, reduces the
gap to 19 percentage points in 2016, mainly because younger voters are more educated and
more likely to not be married. Age, education, and marital status are tightly linked to each other,
given that the core voting base of the democrats tend to be students or recent university
graduates. Yet age still has a substantial and growing independent effect on vote choice.
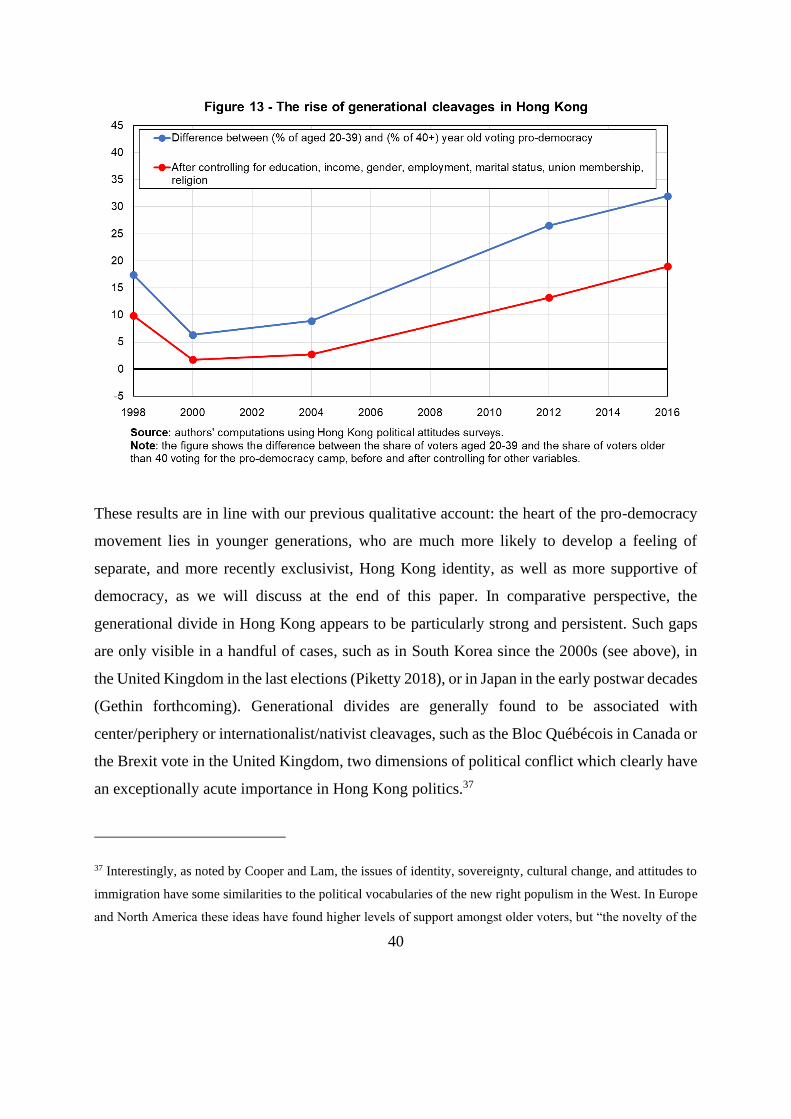
40
These results are in line with our previous qualitative account: the heart of the pro-democracy
movement lies in younger generations, who are much more likely to develop a feeling of
separate, and more recently exclusivist, Hong Kong identity, as well as more supportive of
democracy, as we will discuss at the end of this paper. In comparative perspective, the
generational divide in Hong Kong appears to be particularly strong and persistent. Such gaps
are only visible in a handful of cases, such as in South Korea since the 2000s (see above), in
the United Kingdom in the last elections (Piketty 2018), or in Japan in the early postwar decades
(Gethin forthcoming). Generational divides are generally found to be associated with
center/periphery or internationalist/nativist cleavages, such as the Bloc Québécois in Canada or
the Brexit vote in the United Kingdom, two dimensions of political conflict which clearly have
an exceptionally acute importance in Hong Kong politics.37
37 Interestingly, as noted by Cooper and Lam, the issues of identity, sovereignty, cultural change, and attitudes to
immigration have some similarities to the political vocabularies of the new right populism in the West. In Europe
and North America these ideas have found higher levels of support amongst older voters, but “the novelty of the
41
Simultaneously, the shift of older generations towards the pro-Beijing camp may have been
driven by two factors. First, it may be that youth radicalization, mounting protests, and the
ideological transformation of pro-democracy movements have led older generations, who may
be more risk averse and more moderate in their reformist aspirations, to shift to pro-Beijing
parties. The material and social resources deployed by pro-Beijing networks to gain votes may
also have been more effective at convincing older cohorts to support the status quo than younger
voters. Secondly, massive immigration from mainland China has changed the composition of
the electorate. As migrants tend to be older and more supportive of pro-Beijing parties,
immigration waves mechanically lead to lower support among older cohorts. Competition
between the pro-democracy camp and the pro-Beijing camp could in this dimension be
conceptualized as a “race” between immigration and generational renewal. Unfortunately, data
on location of birth is only available since 2012, so this cannot be formally tested. However, as
we show below, the cleavage between mainlanders and natives is not sufficiently strong to
account for this transformation alone, so that the first factor must necessarily explain part of the
change.
It is also important to stress that while concerns about rising housing prices and economic
insecurity have been strong determinants of pro-democracy support and protest participation
among young natives, this does not imply that the pro-democracy/pro-Beijing opposition has
represented class cleavages. In fact, according to the surveys at our disposal, support for the
pro-democracy camp is more pronounced among highest-educated and top-income voters: in
2016, tertiary-educated were more likely to vote for pro-democrats by 27 percentage points,
and top 10 percent income earners by 5 percentage points. The bias of university graduates
towards the pro-democracy camp is mainly driven by the fact that younger voters are more
educated, yet it does not disappear completely after controlling for age. Income is a poor
Hong Kong experience lies in how the relationship between social demography and the emergence of nativism
appears to be powerfully inverted” (Cooper and Lam 2018, 8-9). It is also important to note that the growth of
nativism in Hong Kong has often come in reaction to an aggressive nationalism coming from Beijing.
42
predictor of electoral behaviors overall, because age is only weakly correlated to social class,
and because poorer immigrants from the mainland tend to support the pro-Beijing camp.38
Immigration and the internationalist/nativist cleavage
Immigration from mainland China to Hong Kong since 1997 has been substantial has been the
subject of intense political debates (Wong, Lee, Ho, and Clarke). Under the “one-way permit”
policy, mainland Chinese who want to migrate to Hong Kong must apply through mainland
authorities. If the application is approved, they can legally migrate, and they usually obtain
permanent residence status after seven years, along with the right to vote. A maximum of 150
permits per day are issued by the relevant Chinese departments, corresponding to an annual
quota of 54,000, which has led to a large and sustained influx of mainland immigrants in the
last decades (Wong, Lee, and Ho 2019). The government has also implemented other
immigration schemes since the 2000s, such as the Quality Migration Admission Scheme, which
allows high-skilled migrants to gain residence in Hong Kong even without an employment
contract, and it has provided opportunities for mainland students to pursue higher education in
the city. Before 2015, the enforcement of the one-child policy in mainland China also led
families to emigrate to give birth, leading to heated controversies in Hong Kong (Ma 2015). In
2016, about one in seven of the city’s residents was an immigrant who arrived from China after
1997, and according to the surveys used in this paper, over a quarter of the electorate in total
was born in the mainland (arriving before or after 1997) (Downes 2018).39
Chinese immigrants face numerous difficulties when arriving in Hong Kong, from social
prejudice to discrimination. They are usually less educated, older, and poorer than natives, and
38 A number of figures on education and income are available in the appendix: see in particular Figures C10, C11,
C12, C20, C21, C22, C23, and C24. Notice however that the peak in housing prices has created a sharp divide
between homeowners and tenants, the latter being much more likely to support the pro-democracy camp: see Wong
and Wan (2018).
39 See appendix Table C2 for the share of individuals born in Hong Kong, China, and other countries.
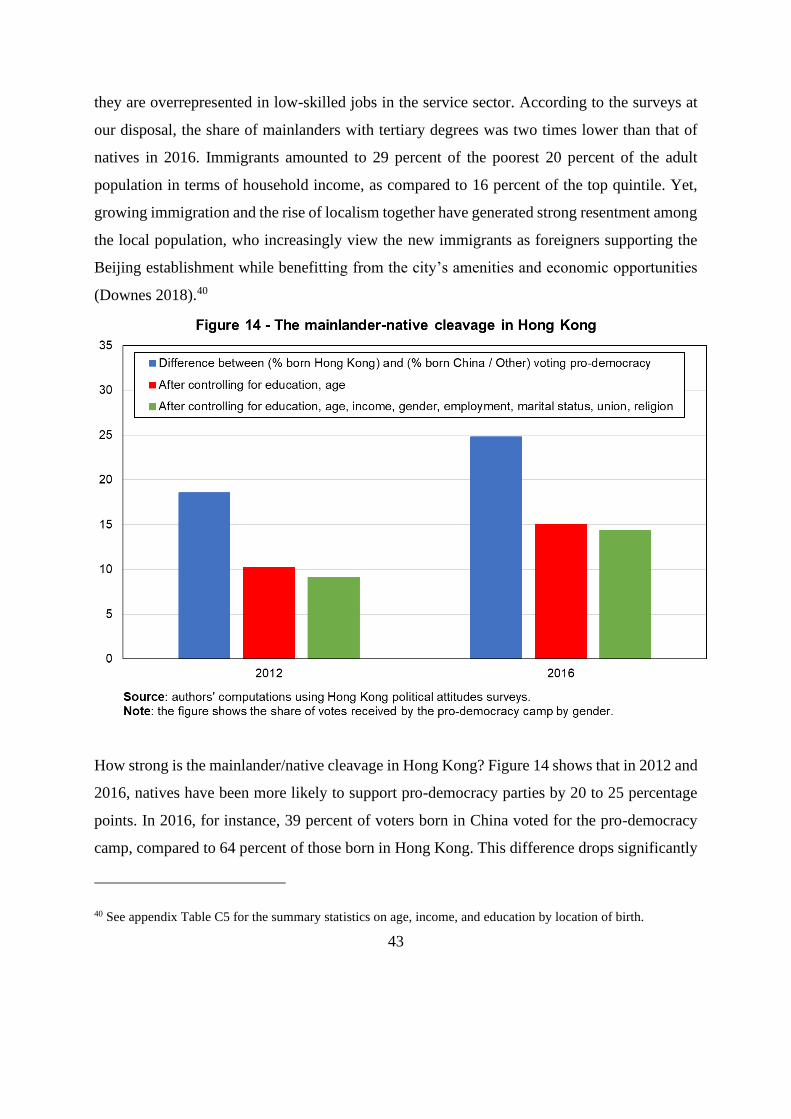
43
they are overrepresented in low-skilled jobs in the service sector. According to the surveys at
our disposal, the share of mainlanders with tertiary degrees was two times lower than that of
natives in 2016. Immigrants amounted to 29 percent of the poorest 20 percent of the adult
population in terms of household income, as compared to 16 percent of the top quintile. Yet,
growing immigration and the rise of localism together have generated strong resentment among
the local population, who increasingly view the new immigrants as foreigners supporting the
Beijing establishment while benefitting from the city’s amenities and economic opportunities
(Downes 2018).40
How strong is the mainlander/native cleavage in Hong Kong? Figure 14 shows that in 2012 and
2016, natives have been more likely to support pro-democracy parties by 20 to 25 percentage
points. In 2016, for instance, 39 percent of voters born in China voted for the pro-democracy
camp, compared to 64 percent of those born in Hong Kong. This difference drops significantly
40 See appendix Table C5 for the summary statistics on age, income, and education by location of birth.
44
once controlling for age and education, because immigrants are on average older than natives,
and age is strongly associated with vote choice. After controlling for all available variables, the
mainlander-native gap drops to about 14 percentage points in 2016.41
Two findings emerge from this figure. First, the immigration cleavage in Hong Kong appears
to be surprisingly small when put in comparative perspective. In Taiwan, for instance, we saw
that the mainlander-native cleavage was much larger, with less than 15 percent of mainlanders
voting for the DPP as compared to 60 percent of Minnan voters. This is again much smaller
than the massive differences in voting behaviors between religious minorities and the rest of
the population visible in Western democracies (Gethin, Martínez-Toledano, and Piketty 2019).
In France, for instance, over 90 percent of Muslims voted for left-wing parties in 2012,
compared to about 40 percent of Catholics (Piketty 2018). Therefore, while the divide between
natives and immigrants does exist, its importance should not be over-emphasized.
Secondly, one might hypothesize that this small gap hides heterogeneity within generations, as
older generations of immigrants could be more supportive of the pro-democracy camp than new
generations, who have been the first victims of the rise of anti-immigration sentiments.
However, we show in the appendix that the exact opposite holds: as much as 80 percent of
immigrants from the mainland aged below 29 voted for the pro-democracy camp in 2016,
compared to 28 percent of those aged 70 or above. Therefore, generational divides seem to
matter much more than the mainlander-native cleavage. It also points to the role of processes
of socialization, as young voters born in China may correspond to individuals who emigrated
from the mainland when they were children and received their entire education in Hong Kong.
Other mainlanders younger than 40 may correspond to former students who benefited from
student schemes and were exposed to pro-democracy student activism. This result shows that
mainlander-native cleavages cannot be explained by economic competition or opposition
between immigrants and natives belonging to the same cohorts, as young natives and
immigrants show comparable levels of support for the pro-democracy camp.
41 See appendix Figure C13 for support for the pro-democracy camp by location of birth.
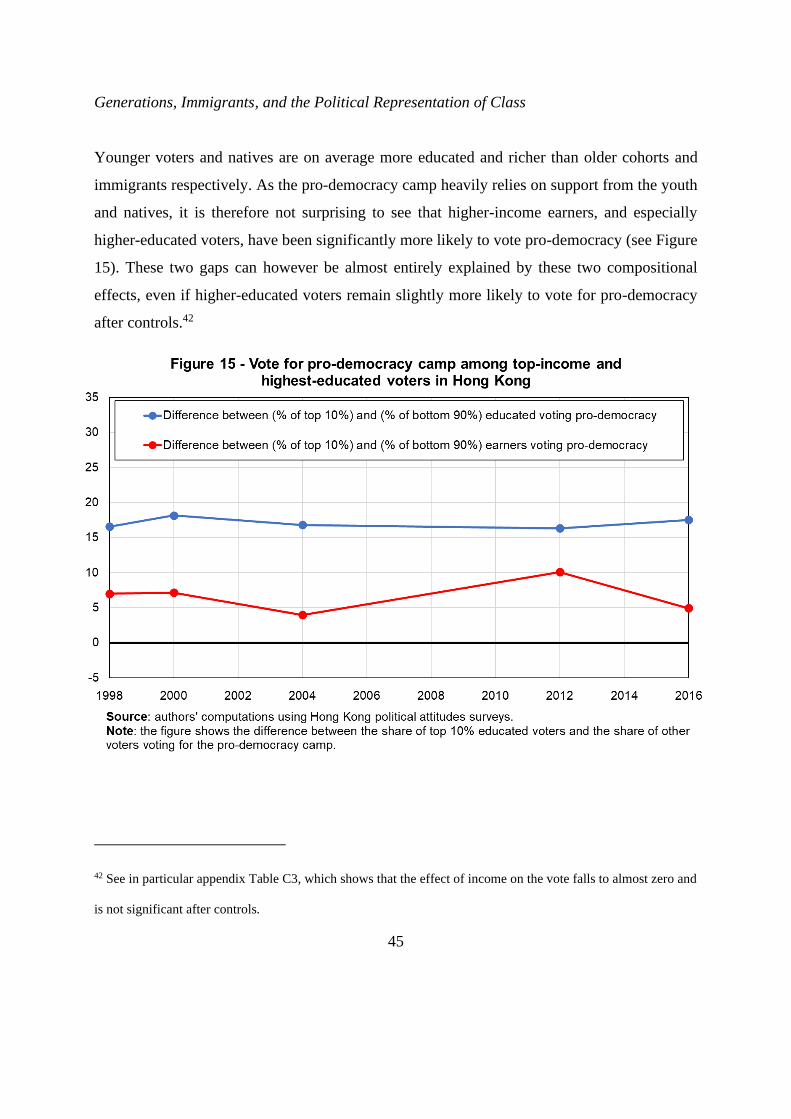
45
Generations, Immigrants, and the Political Representation of Class
Younger voters and natives are on average more educated and richer than older cohorts and
immigrants respectively. As the pro-democracy camp heavily relies on support from the youth
and natives, it is therefore not surprising to see that higher-income earners, and especially
higher-educated voters, have been significantly more likely to vote pro-democracy (see Figure
15). These two gaps can however be almost entirely explained by these two compositional
effects, even if higher-educated voters remain slightly more likely to vote for pro-democracy
after controls.42
42 See in particular appendix Table C3, which shows that the effect of income on the vote falls to almost zero and
is not significant after controls.
46
Therefore, while economic concerns about rising housing prices and economic insecurity did
play an important role in explaining pro-democracy support and protest participation among
young natives, there is only limited evidence that economic status influences electoral behaviors
beyond its interaction with age and origin, and there is even less evidence that poorer or less-
educated voters have been shifting towards the pro-democracy camp.43 This is a striking result,
given that the youth are on average more concerned about income inequality (see below) and
that the pro-Beijing camp is generally pictured as representing the elites (which are, it is true,
numerically small and may not be adequately captured in our data). This points again to the
dominance of the generational cleavage and the immigration cleavage in structuring political
conflicts in Hong Kong.
The Sociological Foundations of Generational Divides
We conclude with a simple analysis of the relationship between generational divides and
political attitudes. As we explained at the beginning of this section, existing studies suggest that
youth radicalization in Hong Kong lies at the intersection of social, economic, and cultural
concerns. Based on the Hong Kong Election Study conducted in 2015, we document in Figure
16 how opinions on Chinese integration, Chinese identity, democracy, immigration, and
economic inequality vary with age.
43 Notice however that the peak in housing prices may have created a divide between homeowners and tenants:
see S. H. Wong and K. M. Wan, “The Housing Boom and the Rise of Localism in Hong Kong: Evidence from the
Legislative Council Election in 2016,” China Perspectives 3 (2018): 31–40.
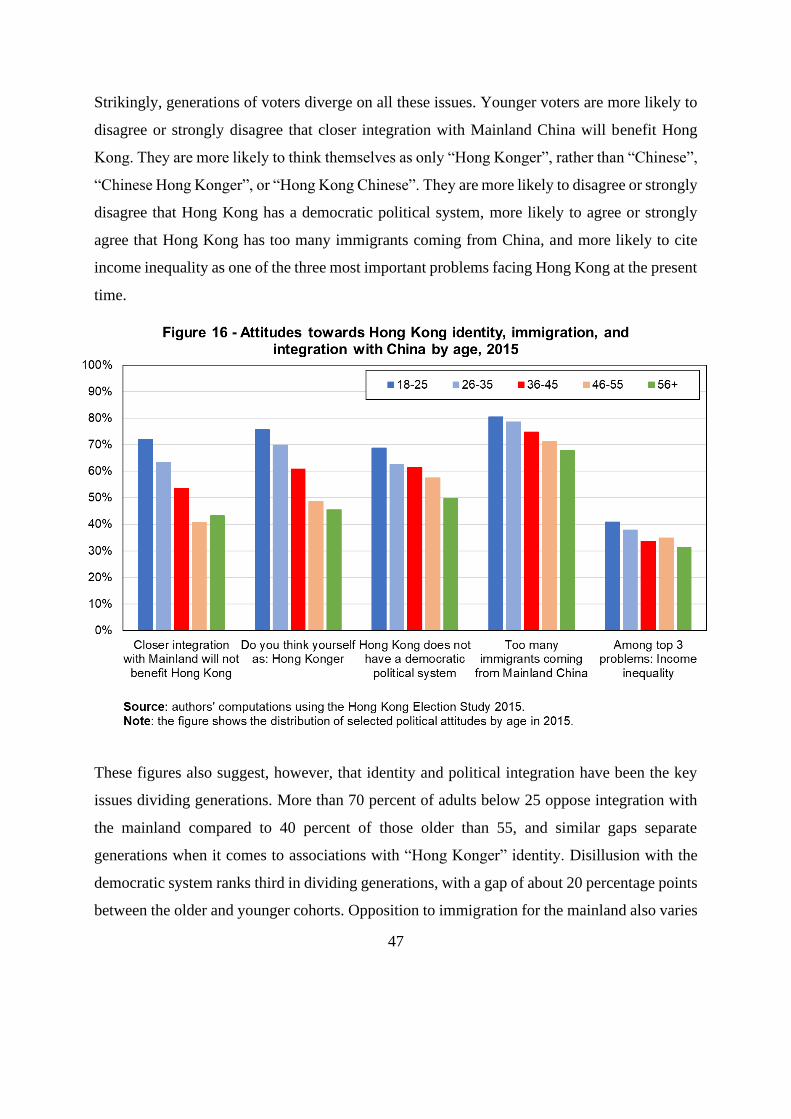
47
Strikingly, generations of voters diverge on all these issues. Younger voters are more likely to
disagree or strongly disagree that closer integration with Mainland China will benefit Hong
Kong. They are more likely to think themselves as only “Hong Konger”, rather than “Chinese”,
“Chinese Hong Konger”, or “Hong Kong Chinese”. They are more likely to disagree or strongly
disagree that Hong Kong has a democratic political system, more likely to agree or strongly
agree that Hong Kong has too many immigrants coming from China, and more likely to cite
income inequality as one of the three most important problems facing Hong Kong at the present
time.
These figures also suggest, however, that identity and political integration have been the key
issues dividing generations. More than 70 percent of adults below 25 oppose integration with
the mainland compared to 40 percent of those older than 55, and similar gaps separate
generations when it comes to associations with “Hong Konger” identity. Disillusion with the
democratic system ranks third in dividing generations, with a gap of about 20 percentage points
between the older and younger cohorts. Opposition to immigration for the mainland also varies
48
with age, but only some 10 percentage points separate the younger and older cohorts. Anti-
immigration feelings appear in fact to be widespread, with more than 65 percent of respondents
within each generation agreeing that immigration should be limited. Concerns about income
disparities are also high, with about a third of respondents ranking inequality as one of the three
most important problems in the city, but generational differences are moderate.
Political integration, cultural differentiation, and democratization seem to be the most important
issues structuring political cleavages in Hong Kong. Attitudes towards these issues clearly
differentiate generations, and they eventually translate into differences in electoral behaviors.
It is important to stress, however, that this survey was conducted in 2015. Since then, and in
particular since the 2019-2020 protests, support for the pro-democracy camp seems to have
grown tremendously, which was visible in the results of the local elections of 2019, in which
the pro-democrats achieved their biggest success in Hong Kong’s history with 57 percent of
votes and over 81 percent of seats. Such a landslide victory was possible in large part thanks to
a surge in turnout among younger voters, which suggests that the generational cleavage is
further deepening (Chung 2020). How recent events will transform the structure of political
cleavages in Hong Kong yet remains to be determined.
References
C. H. Achen and T. Y. Wang, eds., The Taiwan Voter (University of Michigan Press, 2017).
C. H. Achen and T. Y. Wang, “Declining voter turnout in Taiwan: A generational effect?”
Electoral Studies 58 (2019): 113–124.
M. Anderson and M. Klinthäll, “The Opening of the North–South Divide: Cumulative
Causation, Household Income Disparity and the Regional Bonus in Taiwan 1976–2005,”
Structural Change and Economic Dynamics 23, no. 2 (2012): 170–179.
49
E. L. G. Campbell, Uri nara, our nation: Unification, identity and the emergence of a new
nationalism amongst South Korean young people (Australian National University, 2011).
I. T. Chen and D. Liao, “The Rise of the New Power Party in Taiwan’s 2016 Legislative
Election: Reality and Challenges,” in Taiwan’s Political Re-Alignment and Diplomatic
Challenges, ed. W. Lee (Palgrave Macmillan, 2019).
Y. Chen and M. M. Szeto, “The Forgotten Road of Progressive Localism: New Preservation
Movement in Hong Kong,” Inter-Asia Cultural Studies 16, no. 3 (2015): 436–453.
M. Chiang and B. Gerbier, “Cross-Strait Economic Relations: Recent Development and
Implications for Taiwan,” Revue de la Régulation 13 (2013): 1–18.
S. H. Choe “His Predecessors Failed. Can Moon Jae-in Make Peace With North Korea”, The
New York Times, May 3, 2018, https://www.nytimes.com/2018/05/03/world/asia/north-korea-
moon-trump-kim.html (accessed June 15, 2020).
C. Y. C. Chu, “Top Incomes in Taiwan, 1977-2013” (WID.world Working Paper 2015).
Y. Chu and J. Lin, “Political Development in 20th-Century Taiwan: State-Building, Regime
Transformation and the Construction of National Identity,” The China Quarterly 165 (2001):
102–129.
K. Chung, “Hong Kong District Council Election Data Reveals Turnout Now Highest Among
Young People, Driven to The Ballot Box by Anti-Government Protests,” South China Morning
Post, April 4 2020, accessed May 31 2020, https://www.scmp.com/news/hong-kong/politics/
article/3078401/hong-kong-district-council-election-data-reveals-turnout.
L. Cooper and W. Lam, “Introduction,” in Citizenship, Identity and Social Movements in the
New Hong Kong, ed. W. Lam and L. Cooper (Routledge Contemporary China Series, 2018),
1–12.
50
S. Denyer and M. J. Kim, “Another former South Korea president jailed for corruption,” The
Washington Post, October 5, 2018, https://www.washingtonpost.com/world/asia_pacific/
another-former-south-korea-president-jailed-for-corruption/2018/10/05/7e216cc6-c866-11e8-
9158-09630a6d8725_story.html.
J. F. Downes, “Mainland Chinese Immigration in Hong Kong: Analysing Anti-Immigrant
Sentiment,” in Citizenship, Identity and Social Movements in the New Hong Kong, ed. W. Lam
and L. Cooper (Routledge Contemporary China Series, 2018), 51–71.
The Economist Intelligence Unit, Democracy Index 2019 A Year of Democratic Setbacks and
Popular Protest (The Economist, 2019).
A. L. Freedman, Political Change and Consolidation: Democracy’s Rocky Road in Thailand,
Indonesia, South Korea, and Malaysia (Palgrave Macmillan, 2006).
A. Gethin, “Extreme Inequality and the Structure of Political Cleavages in South Africa, 1994-
2019,” (WID.world Working Paper 2020/13, 2020).
A. Gethin and T. Jenmana, “Democratization and the Construction of Class Cleavages in
Indonesia, Malaysia, Thailand, and the Philippines, 1992-2019” (forthcoming).
A. Gethin, C. Martínez-Toledano, and T. Piketty, “Political Cleavages and Inequality: Evidence
from Electoral Democracies, 1950-2018” (Preliminary results, 2019:
http://piketty.pse.ens.fr/files/GethinMartinezPiketty2019Slides.pdf).
Y. Hao, “Converging Mainlander and Native Taiwanese, 1949–2012,” Australian Economic
History Review 57, no. 1 (2017): 84–107.
O. Hellmann, Political Parties and Electoral Strategy (Palgrave Macmillan UK, 2011).
J. F. Hsieh, “Salient Issues in Taiwan’s Electoral Politics,” Electoral Studies 15, no. 2 (1996):
219–235.
51
J. F. Hsieh, “Ethnicity, National Identity, and Domestic Politics in Taiwan,” Journal of Asian
and African Studies 40, no. 1–2 (2005): 13–28.
C. Huang, “Generation effects? Evolution of Independence–Unification Views in Taiwan,
1996–2016,” Electoral Studies 58 (2019): 103–112.
C. T. Hung, “Income Inequality in Hong Kong and Singapore” (Paris School of Economics,
2018).
H. B. Im, “Globalization, Democracy and Social Polarization in South Korea” in Korea’s Quest
for Economic Democratization, ed. Y. Kim (Palgrave Macmillan, 2018).
J. Jao and M. McKeever, “Ethnic Inequalities and Educational Attainment in Taiwan,”
Sociology of Education 79, no. 2 (2006): 131–152.
K. Jiyoon, K. Kim, and K. Chungku, “South Korean Youths’ Perceptions of North Korea and
Unification” (Asan institute issue brief 2018-03, 2018).
M. P. Kaeding, “The Rise of ‘Localism’ in Hong Kong,” Journal of Democracy 28, no. 1
(2017): 157–171.
W. J. Kang, “Income and Voting Behavior in Korean Politics: Why Do the Poor Support
Conservative Political Parties?,” Journal of International and Area Studies 24, n. 20 (2017):
15-33.
H. Keum and J. R. Campbell, “Perils of Transition: Korea and Taiwan Democratization
Compared,” The Korean Journal of International Studies 16, no. 1 (2018): 29–55.
S. H. Kil and C. Moon, “Introduction: Understanding Korean Politics,” in Understanding
Korean Politics: An Introduction, S. H. Kil and C. Moon, eds. (State University of New York
Press, 2001).
52
H. M. Kim, J. Y. Choi, and J. Cho, “Changing Cleavage Structures in New Democracies: An
Empirical Analysis of Regionalism in Korea,” Electoral Studies 27, no. 1 (2008): 136–150.
N. N. Kim, “Top Incomes in Korea: Update, 1933-2016” (WID.world Working Paper 2018/13,
2018).
W. Kim, “Does Class Matter? Social Cleavages in South Korea’s Electoral Politics in the Era
of Neoliberalism.” Review of Political Economy 22, no. 4 (2010): 589–616.
Y. Kim and S. Park. “Emerging Cleavages in Korean Society: Region, Generation, Ideology,
and Class.” in Korea’s Quest for Economic Democratization, ed. Y. Kim (Palgrave Macmillan,
2018).
Y. Kim, “Hell Joseon: Polarization and Social Contention in a Neo-liberal Age” in Korea’s
Quest for Economic Democratization, ed. Y. Kim (Palgrave Macmillan, 2018).
E. Kleefeld, “Hundreds of Thousands Attend Protest in Hong Kong over Extradition Bill,” Vox,
June 9 2019, accessed May 31 2020, https://www.vox.com/world/2019/6/9/18658650/hong-
kong-protest-march-china-extradition-bill-2019.
B. C. Koh, “The Foreign and Unification Policies of the Republic of Korea,” in Understanding
Korean Politics: An Introduction, S. H. Kil and C. Moon, eds. (State University of New York
Press, 2001).
S. Lau, From Traditional Familism to Utilitarianistic Familism: The Metamorphosis of
Familial Ethos Among the Hong Kong Chinese (Chinese University of Hong Kong, 1978).
Y. Lee and J. S. You, “Is Class Voting Emergent in Korea?,” Journal of East Asian Studies 19,
no. 2 (2019): 197–213.
S. Leung, “The ‘China Factor’ in the 1991 Legislative Council Election: The June 4th Incident
and Anti-Communist China Syndrome,” in Hong Kong Tried Democracy: The 1991 Elections
53
in Hong Kong. Hong Kong: Hong Kong Institute of Asia-Pacific Studies, ed. L. Siu-kai and L.
Kin-shuen, (Chinese University of Hong Kong, 1993), 187–235.
S. Leung, “The ‘China Factor’ and Voters’ Choice in the 1995 Legislative Council Election,”
in The 1995 Legislative Council Elections in Hong Kong, ed. K. Hsin-chi (Chinese University
of Hong Kong, 1996), 201–244.
N. Ma, “Political Parties and Elections,” in Contemporary Hong Kong Politics, ed. L. Wai-
man, P. Luen-tim Lui, W. Wong, and I. Holliday (Hong Kong University Press, 2007).
N. Ma, “The Rise of ‘Anti-China’ Sentiments in Hong Kong and the 2012 Legislative Council
Elections,” China Review 15, no. 1 (2015): 39–66.
N. Ma, “The China Factor in Hong Kong Elections: 1991 to 2016,” China Perspective 3 (2017):
17–26.
N. Ma, “From Political Acquiescence to Civil Disobedience: Hong Kong’s Road to Civil
Disobedience,” in The Umbrella Movement: Civil Resistance and Contentious Space in Hong
Kong, ed. N. Ma and E. W. Cheng (Amsterdam University Press, 2020), 27–50.
P. Mason, Why It’s Kicking Off Everywhere: The New Global Revolutions (Verso, 2012).
OECD, Pensions at a Glance 2015: OECD and G20 indicators (OECD Publishing, 2015).
OECD, “Poverty rates”, OECD.org, https://data.oecd.org/inequality/poverty-rate.htm
(accessed on June 15, 2020).
OECD, “Population with tertiary education”, OECD.org, https://data.oecd.org/eduatt/
population-with-tertiary-education.htm (accessed on June 15, 2020).
54
S. Ortmann, “The Development of Hong Kong Identity: From Local to National Identity,” in
Citizenship, Identity and Social Movements in the New Hong Kong, ed. W. Lam and L. Cooper
(Routledge Contemporary China Series, 2018), 114–131.
R. Pacheco Pardo, “Moon on a Mission: South Korea’s New Approach to the North,” The
Diplomat, March 14, 2018, https://thediplomat.com/2018/03/moon-on-a-mission-south-
koreas-new-approach-to-the-north/ (accessed June 15, 2020).
L. Pang-kwong, “Comparative Study of Electoral Systems Module 5: Macro Report”
(Comparative Study of Electoral Systems Module 5, 2016), https://cses.org/datacenter/
module5/macro/HKG_2016_Macro.pdf.
T. Piketty, “Brahmin Left vs Merchant Right: Rising Inequality & the Changing Structure of
Political Conflict (Evidence from France, Britain and the US, 1948-2017)” (WID.world
Working Paper Series 2018/7, 2018).
S. Sheng and H. Liao, “Issues, Political Cleavages, and Party Competition in Taiwan,” in The
Taiwan Voter, ed. C. H. Achen and T. Y. Wang (University of Michigan Press, 2017).
M. Sing, “Mass Support for the Umbrella Movement,” in The Umbrella Movement: Civil
Resistance and Contentious Space in Hong Kong, ed. N. Ma and E. W. Cheng (Amsterdam
University Press, 2020), 233–250.
J. Stiglitz and B. Pleskovic, “Annual World Bank Conference on Development Economics
1997” (The World Bank, 1998).
A. C. Tan and K. Ho, “Cross-Strait Relations and the Taiwan Voter,” in The Taiwan Voter, ed.
C. H. Achen and T. Y. Wang (University of Michigan Press, 2017).
S. Veg, “The Rise of ‘Localism’ and Civic Identity in Post-handover Hong Kong: Questioning
the Chinese Nation-state,” The China Quarterly 230 (2017): 323–347.
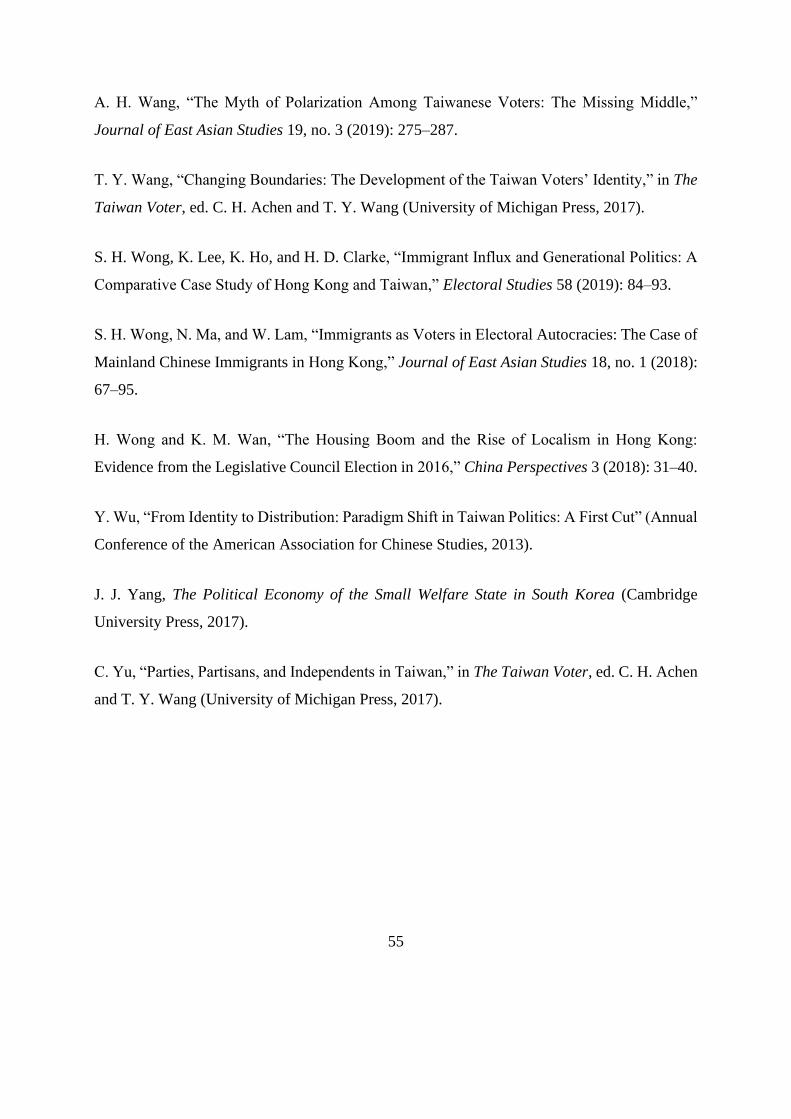
55
A. H. Wang, “The Myth of Polarization Among Taiwanese Voters: The Missing Middle,”
Journal of East Asian Studies 19, no. 3 (2019): 275–287.
T. Y. Wang, “Changing Boundaries: The Development of the Taiwan Voters’ Identity,” in The
Taiwan Voter, ed. C. H. Achen and T. Y. Wang (University of Michigan Press, 2017).
S. H. Wong, K. Lee, K. Ho, and H. D. Clarke, “Immigrant Influx and Generational Politics: A
Comparative Case Study of Hong Kong and Taiwan,” Electoral Studies 58 (2019): 84–93.
S. H. Wong, N. Ma, and W. Lam, “Immigrants as Voters in Electoral Autocracies: The Case of
Mainland Chinese Immigrants in Hong Kong,” Journal of East Asian Studies 18, no. 1 (2018):
67–95.
H. Wong and K. M. Wan, “The Housing Boom and the Rise of Localism in Hong Kong:
Evidence from the Legislative Council Election in 2016,” China Perspectives 3 (2018): 31–40.
Y. Wu, “From Identity to Distribution: Paradigm Shift in Taiwan Politics: A First Cut” (Annual
Conference of the American Association for Chinese Studies, 2013).
J. J. Yang, The Political Economy of the Small Welfare State in South Korea (Cambridge
University Press, 2017).
C. Yu, “Parties, Partisans, and Independents in Taiwan,” in The Taiwan Voter, ed. C. H. Achen
and T. Y. Wang (University of Michigan Press, 2017).
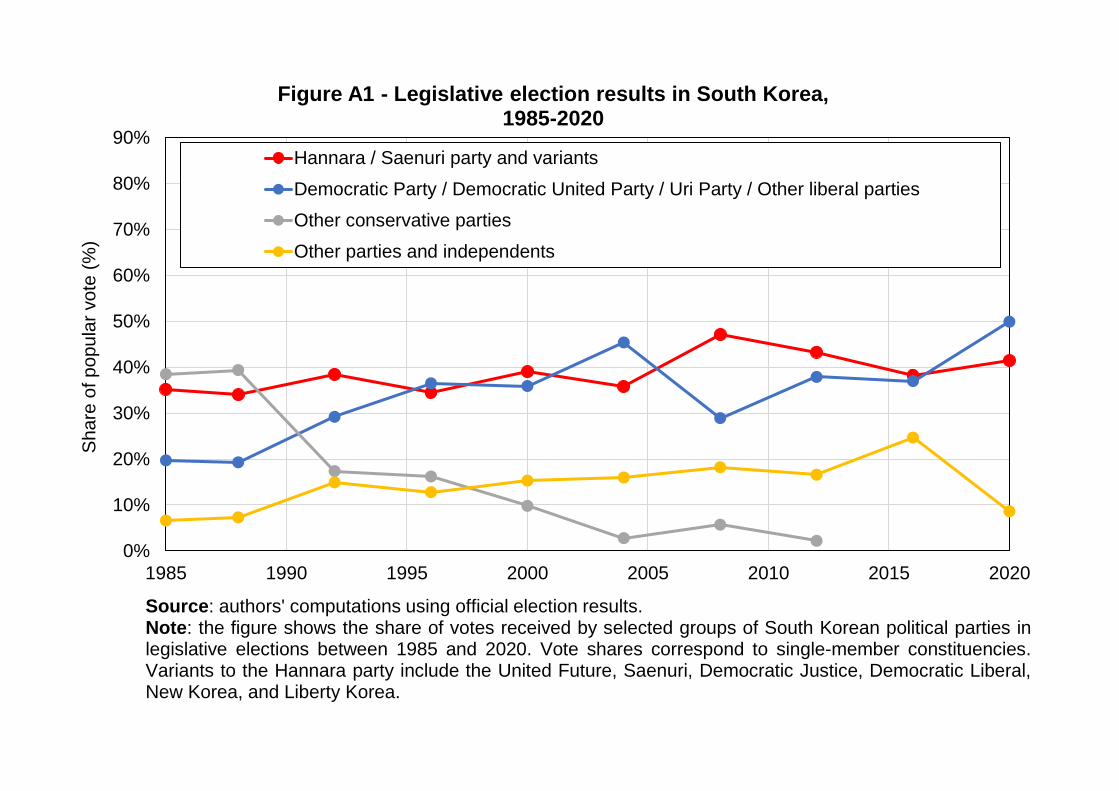
0%
10%
20%
30%
40%
50%
60%
70%
80%
90%
1985 1990 1995 2000 2005 2010 2015 2020
Share
of popula
r vote
(%
)Figure A1 - Legislative election results in South Korea,
1985-2020
Hannara / Saenuri party and variants
Democratic Party / Democratic United Party / Uri Party / Other liberal parties
Other conservative parties
Other parties and independents
Source: authors' computations using official election results.Note: the figure shows the share of votes received by selected groups of South Korean political parties inlegislative elections between 1985 and 2020. Vote shares correspond to single-member constituencies.Variants to the Hannara party include the United Future, Saenuri, Democratic Justice, Democratic Liberal,New Korea, and Liberty Korea.
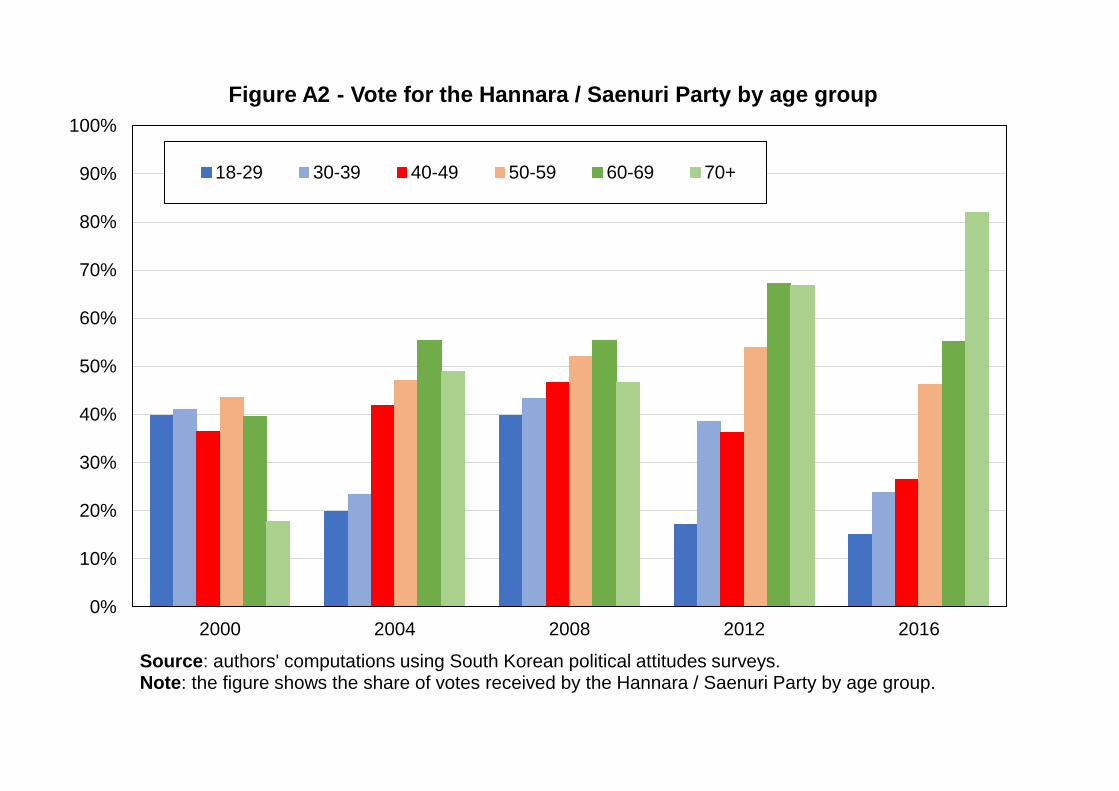
0%
10%
20%
30%
40%
50%
60%
70%
80%
90%
100%
2000 2004 2008 2012 2016
Figure A2 - Vote for the Hannara / Saenuri Party by age group
18-29 30-39 40-49 50-59 60-69 70+
Source: authors' computations using South Korean political attitudes surveys.Note: the figure shows the share of votes received by the Hannara / Saenuri Party by age group.
0%
10%
20%
30%
40%
50%
60%
70%
80%
90%
100%
2000 2004 2008 2012 2016
Figure A3 - The regional cleavage in South Korea
Honam Chungcheong Gangwon Seoul-Gyeonggi Gyeongsang
Source: authors' computations using South Korean political attitudes surveys.Note: the figure shows the share of votes received by the Hannara / Saenuri Party by region. In 2016 Honam represented approximately 10% the electorate, Chungcheong 10%, Gangwon 4%, Seoul-Gyeonggy 49%, and Gyeongsang 26%.
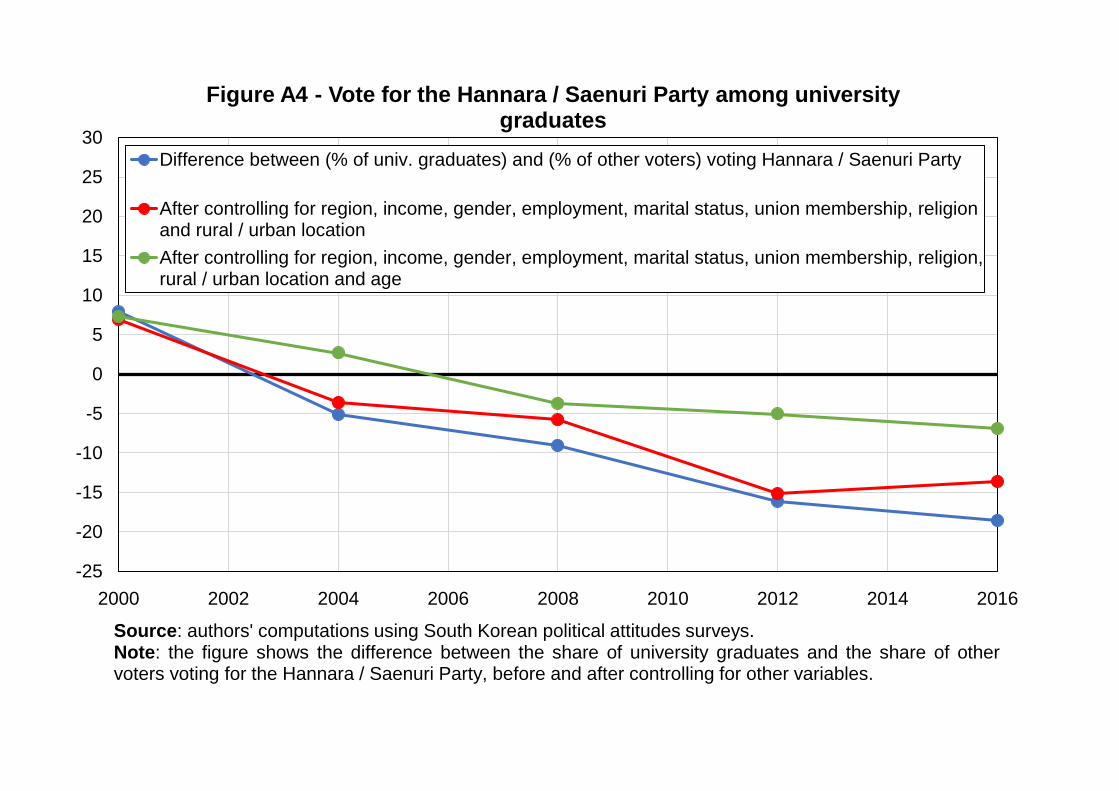
-25
-20
-15
-10
-5
0
5
10
15
20
25
30
2000 2002 2004 2006 2008 2010 2012 2014 2016
Figure A4 - Vote for the Hannara / Saenuri Party among university graduates
Difference between (% of univ. graduates) and (% of other voters) voting Hannara / Saenuri Party
After controlling for region, income, gender, employment, marital status, union membership, religionand rural / urban location
After controlling for region, income, gender, employment, marital status, union membership, religion,rural / urban location and age
Source: authors' computations using South Korean political attitudes surveys.Note: the figure shows the difference between the share of university graduates and the share of othervoters voting for the Hannara / Saenuri Party, before and after controlling for other variables.
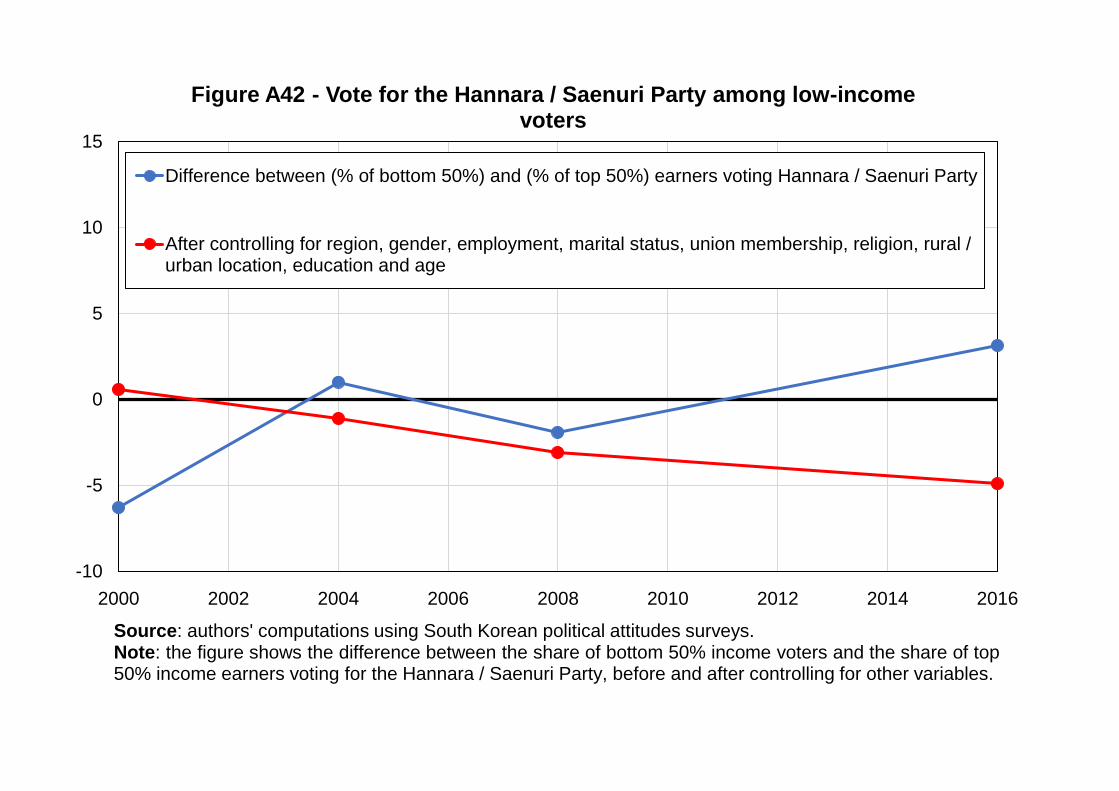
-10
-5
0
5
10
15
2000 2002 2004 2006 2008 2010 2012 2014 2016
Figure A42 - Vote for the Hannara / Saenuri Party among low-income voters
Difference between (% of bottom 50%) and (% of top 50%) earners voting Hannara / Saenuri Party
After controlling for region, gender, employment, marital status, union membership, religion, rural /urban location, education and age
Source: authors' computations using South Korean political attitudes surveys.Note: the figure shows the difference between the share of bottom 50% income voters and the share of top50% income earners voting for the Hannara / Saenuri Party, before and after controlling for other variables.
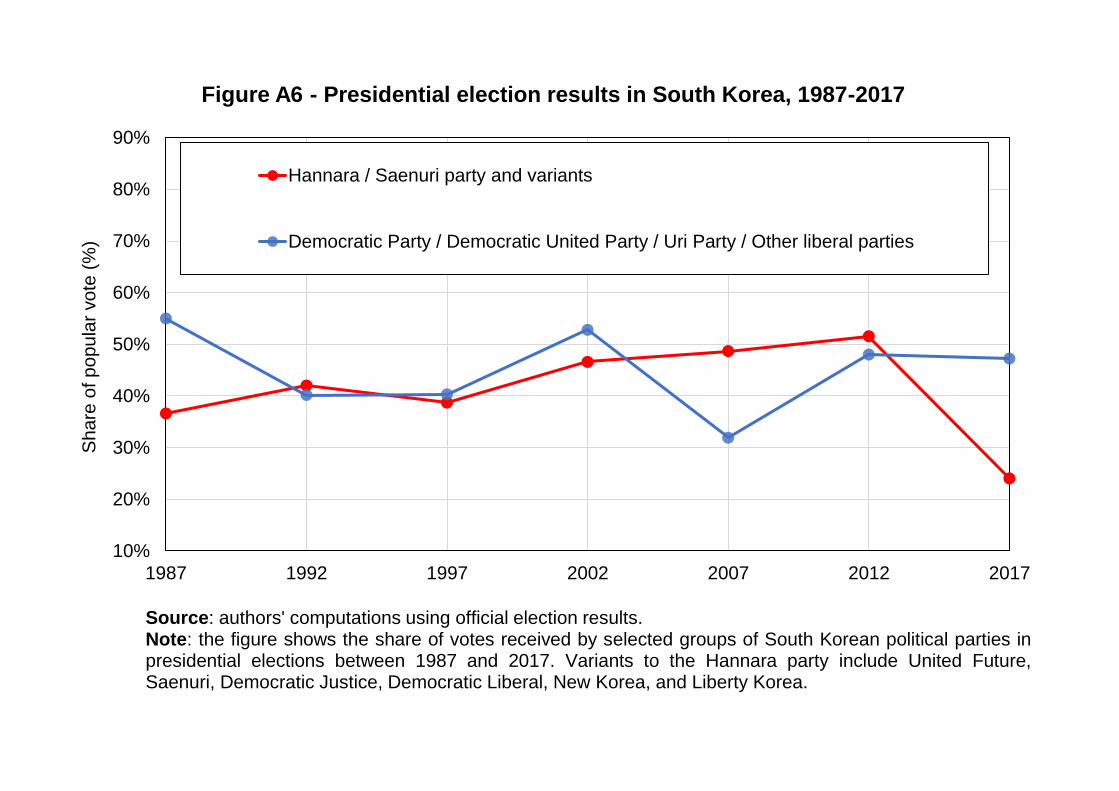
10%
20%
30%
40%
50%
60%
70%
80%
90%
1987 1992 1997 2002 2007 2012 2017
Share
of popula
r vote
(%
)Figure A6 - Presidential election results in South Korea, 1987-2017
Hannara / Saenuri party and variants
Democratic Party / Democratic United Party / Uri Party / Other liberal parties
Source: authors' computations using official election results.Note: the figure shows the share of votes received by selected groups of South Korean political parties inpresidential elections between 1987 and 2017. Variants to the Hannara party include United Future,Saenuri, Democratic Justice, Democratic Liberal, New Korea, and Liberty Korea.
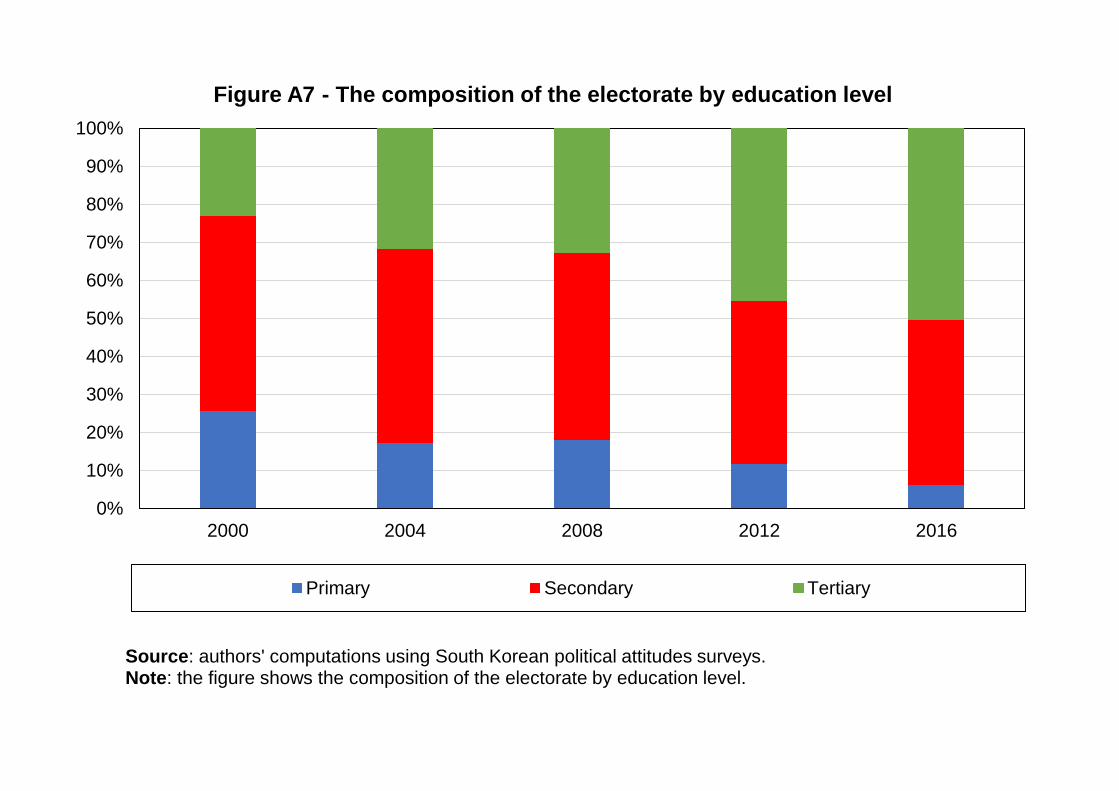
0%
10%
20%
30%
40%
50%
60%
70%
80%
90%
100%
2000 2004 2008 2012 2016
Figure A7 - The composition of the electorate by education level
Primary Secondary Tertiary
Source: authors' computations using South Korean political attitudes surveys.Note: the figure shows the composition of the electorate by education level.
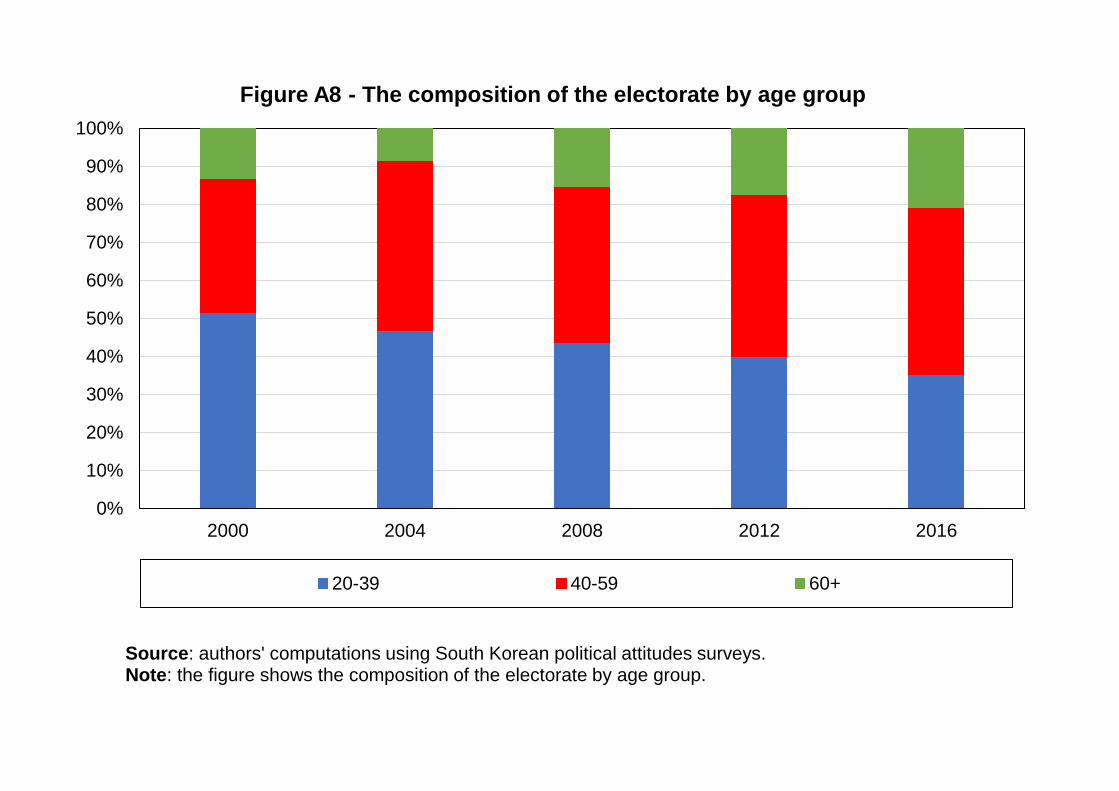
0%
10%
20%
30%
40%
50%
60%
70%
80%
90%
100%
2000 2004 2008 2012 2016
Figure A8 - The composition of the electorate by age group
20-39 40-59 60+
Source: authors' computations using South Korean political attitudes surveys.Note: the figure shows the composition of the electorate by age group.
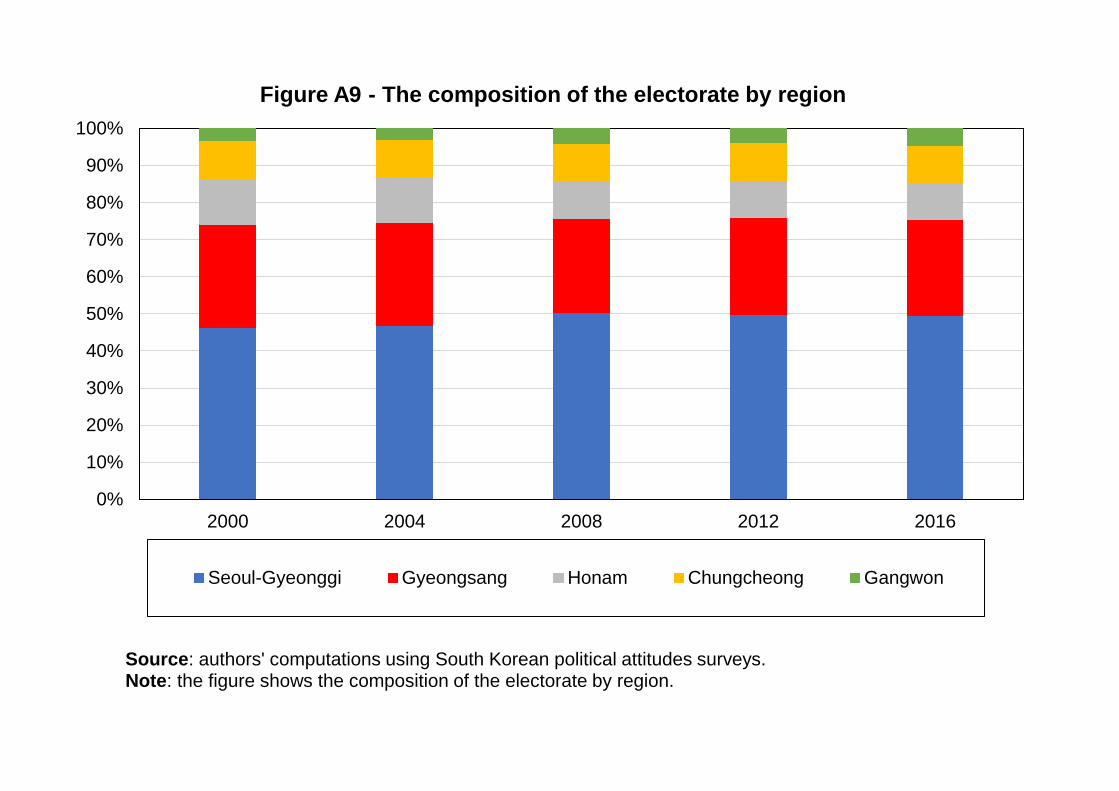
0%
10%
20%
30%
40%
50%
60%
70%
80%
90%
100%
2000 2004 2008 2012 2016
Figure A9 - The composition of the electorate by region
Seoul-Gyeonggi Gyeongsang Honam Chungcheong Gangwon
Source: authors' computations using South Korean political attitudes surveys.Note: the figure shows the composition of the electorate by region.
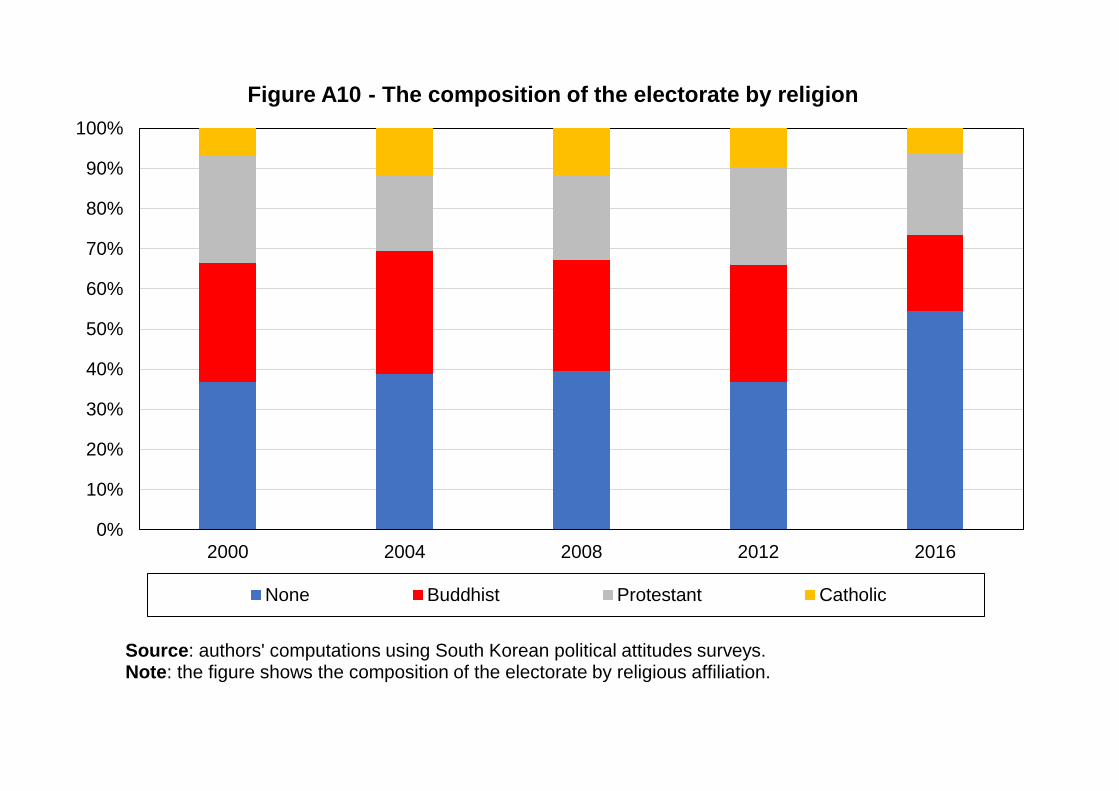
0%
10%
20%
30%
40%
50%
60%
70%
80%
90%
100%
2000 2004 2008 2012 2016
Figure A10 - The composition of the electorate by religion
None Buddhist Protestant Catholic
Source: authors' computations using South Korean political attitudes surveys.Note: the figure shows the composition of the electorate by religious affiliation.
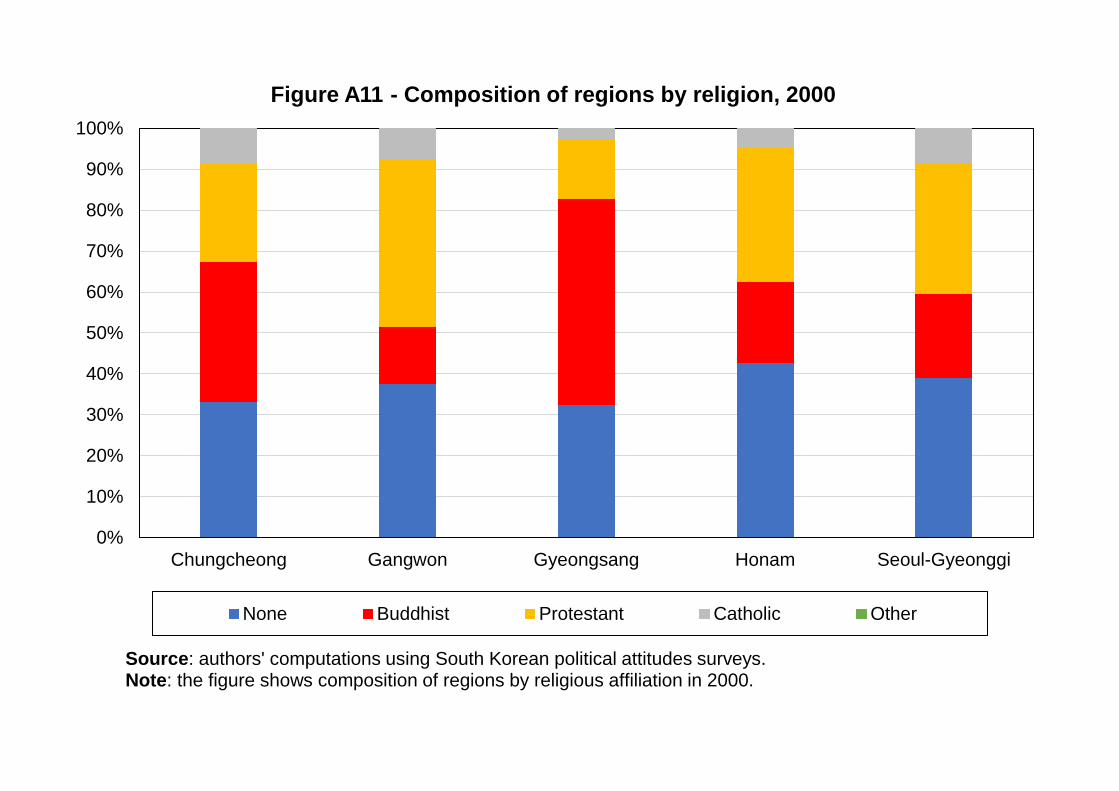
0%
10%
20%
30%
40%
50%
60%
70%
80%
90%
100%
Chungcheong Gangwon Gyeongsang Honam Seoul-Gyeonggi
Figure A11 - Composition of regions by religion, 2000
None Buddhist Protestant Catholic Other
Source: authors' computations using South Korean political attitudes surveys.Note: the figure shows composition of regions by religious affiliation in 2000.
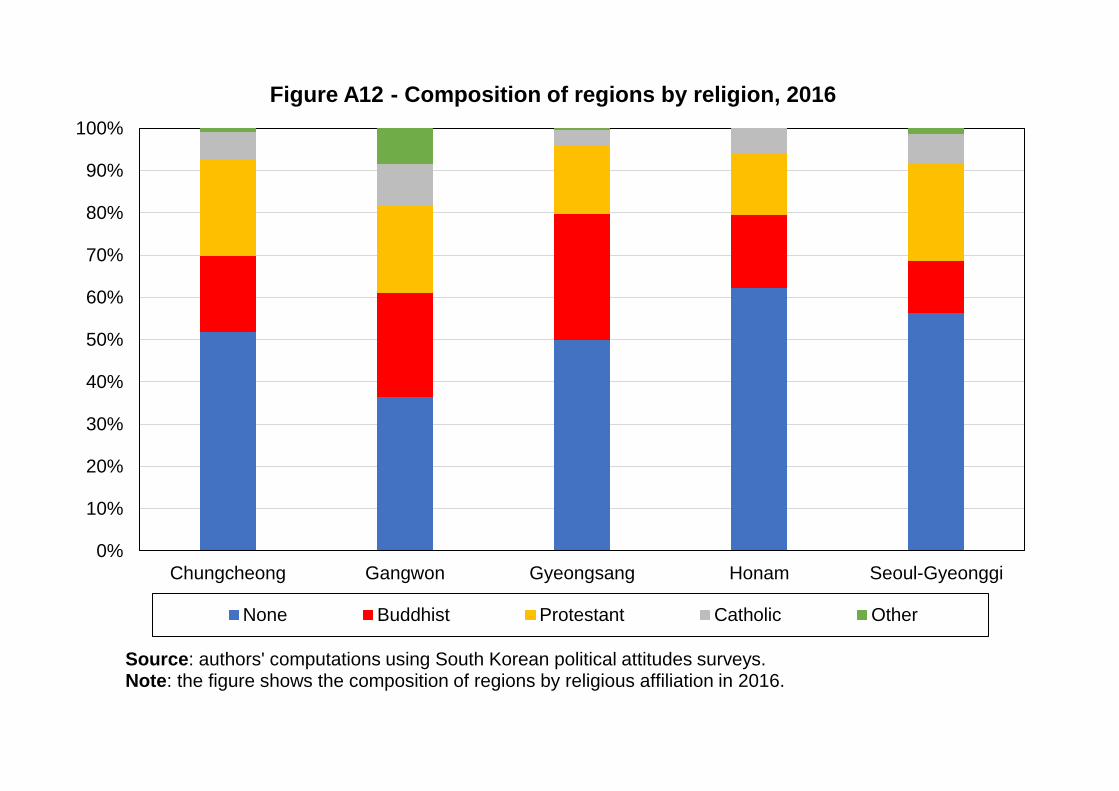
0%
10%
20%
30%
40%
50%
60%
70%
80%
90%
100%
Chungcheong Gangwon Gyeongsang Honam Seoul-Gyeonggi
Figure A12 - Composition of regions by religion, 2016
None Buddhist Protestant Catholic Other
Source: authors' computations using South Korean political attitudes surveys.Note: the figure shows the composition of regions by religious affiliation in 2016.
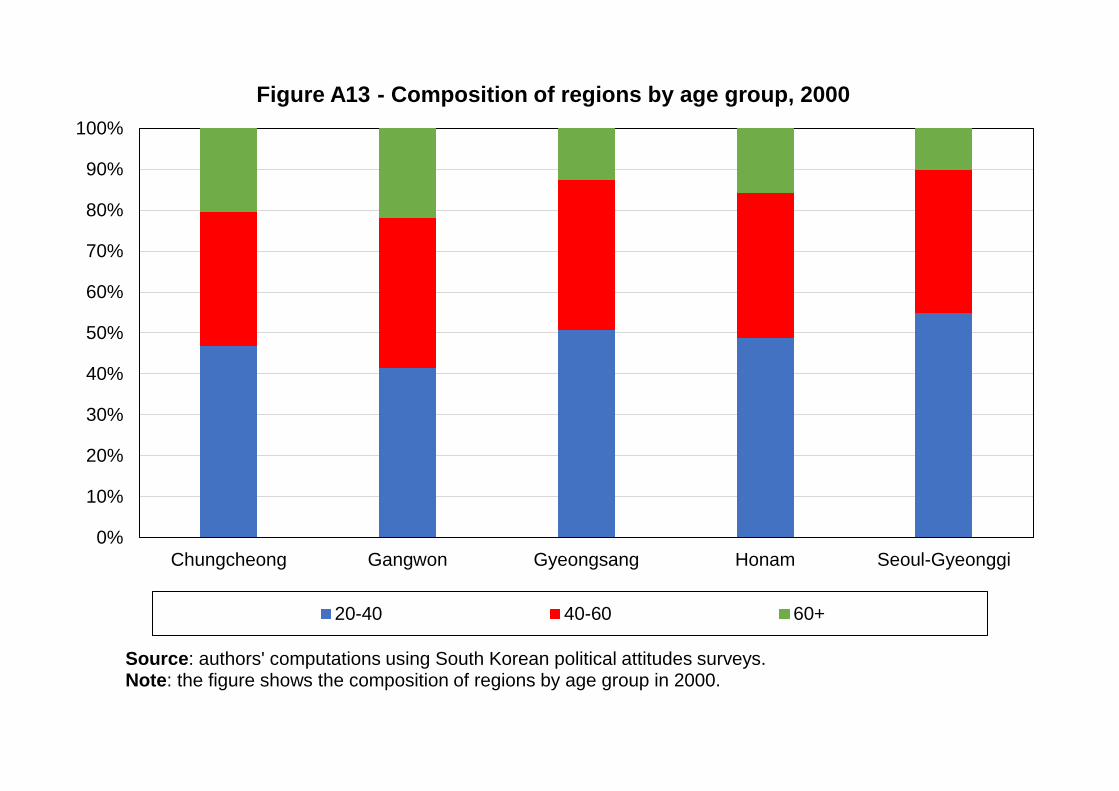
0%
10%
20%
30%
40%
50%
60%
70%
80%
90%
100%
Chungcheong Gangwon Gyeongsang Honam Seoul-Gyeonggi
Figure A13 - Composition of regions by age group, 2000
20-40 40-60 60+
Source: authors' computations using South Korean political attitudes surveys.Note: the figure shows the composition of regions by age group in 2000.
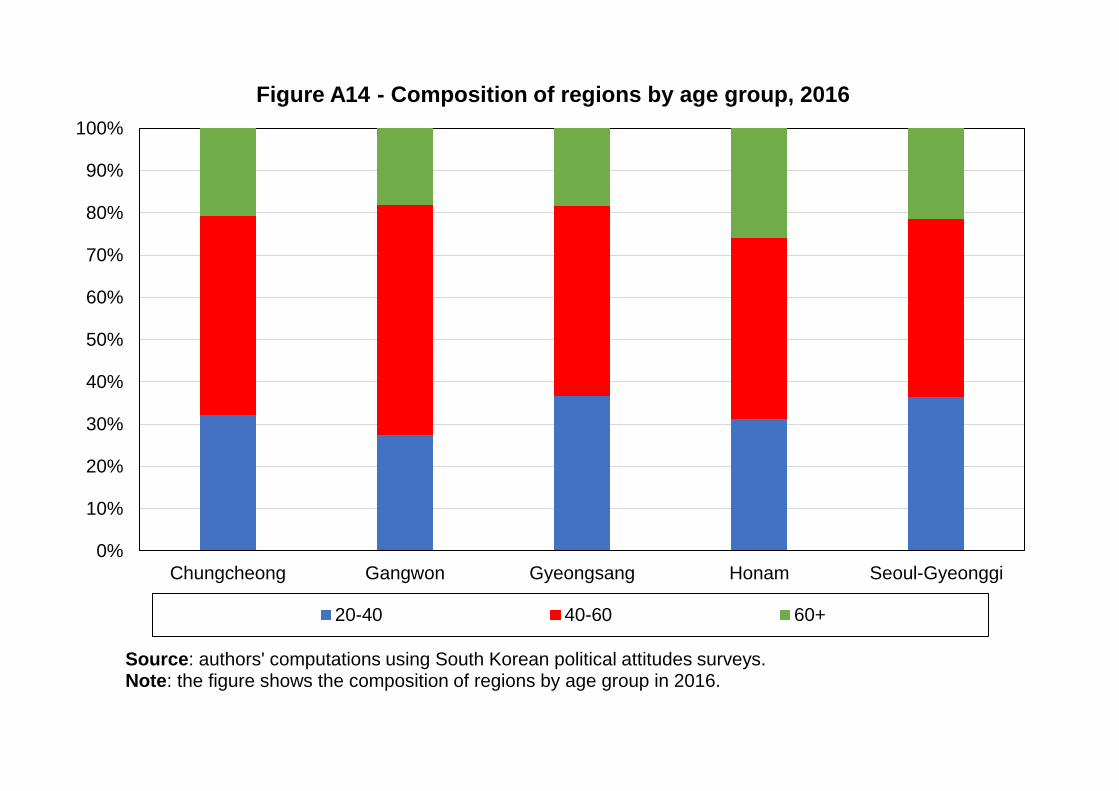
0%
10%
20%
30%
40%
50%
60%
70%
80%
90%
100%
Chungcheong Gangwon Gyeongsang Honam Seoul-Gyeonggi
Figure A14 - Composition of regions by age group, 2016
20-40 40-60 60+
Source: authors' computations using South Korean political attitudes surveys.Note: the figure shows the composition of regions by age group in 2016.
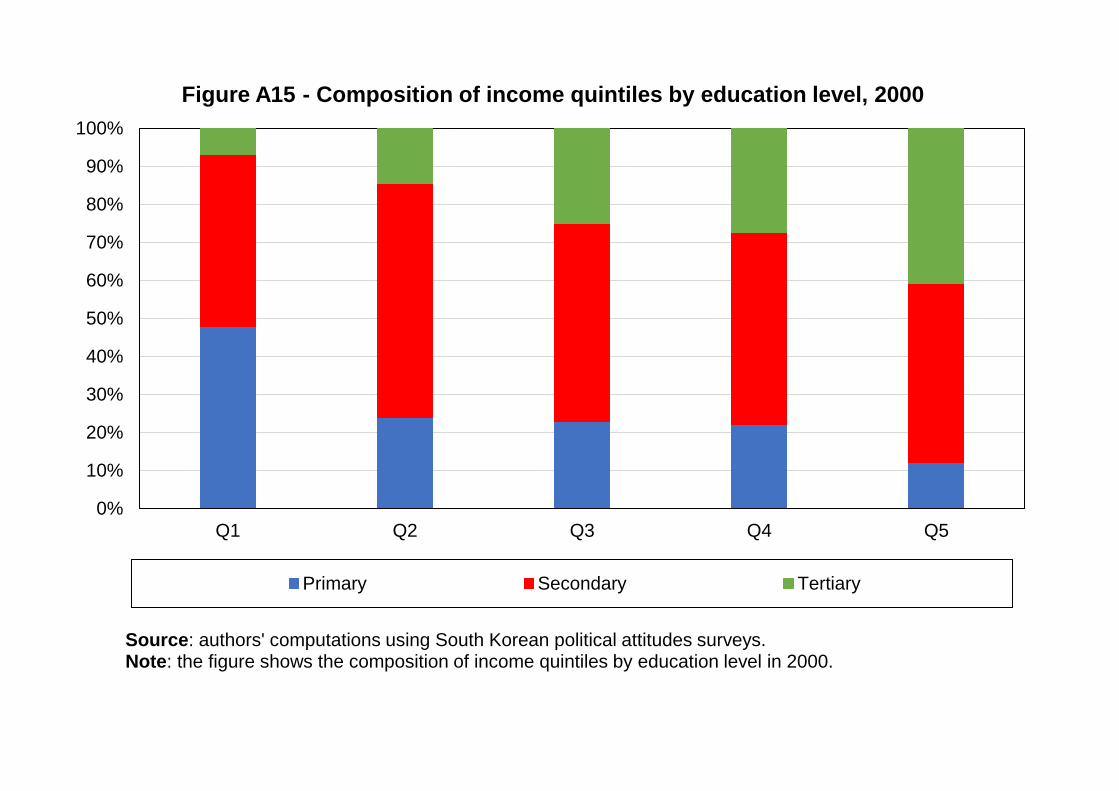
0%
10%
20%
30%
40%
50%
60%
70%
80%
90%
100%
Q1 Q2 Q3 Q4 Q5
Figure A15 - Composition of income quintiles by education level, 2000
Primary Secondary Tertiary
Source: authors' computations using South Korean political attitudes surveys.Note: the figure shows the composition of income quintiles by education level in 2000.
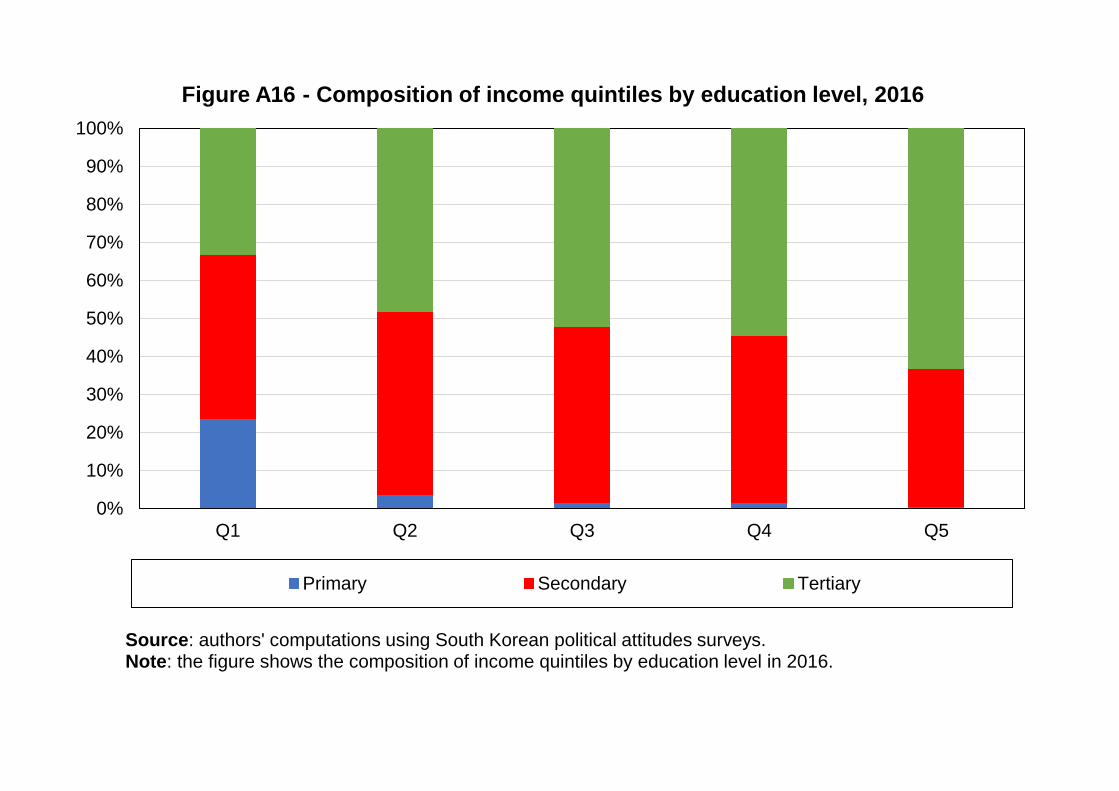
0%
10%
20%
30%
40%
50%
60%
70%
80%
90%
100%
Q1 Q2 Q3 Q4 Q5
Figure A16 - Composition of income quintiles by education level, 2016
Primary Secondary Tertiary
Source: authors' computations using South Korean political attitudes surveys.Note: the figure shows the composition of income quintiles by education level in 2016.
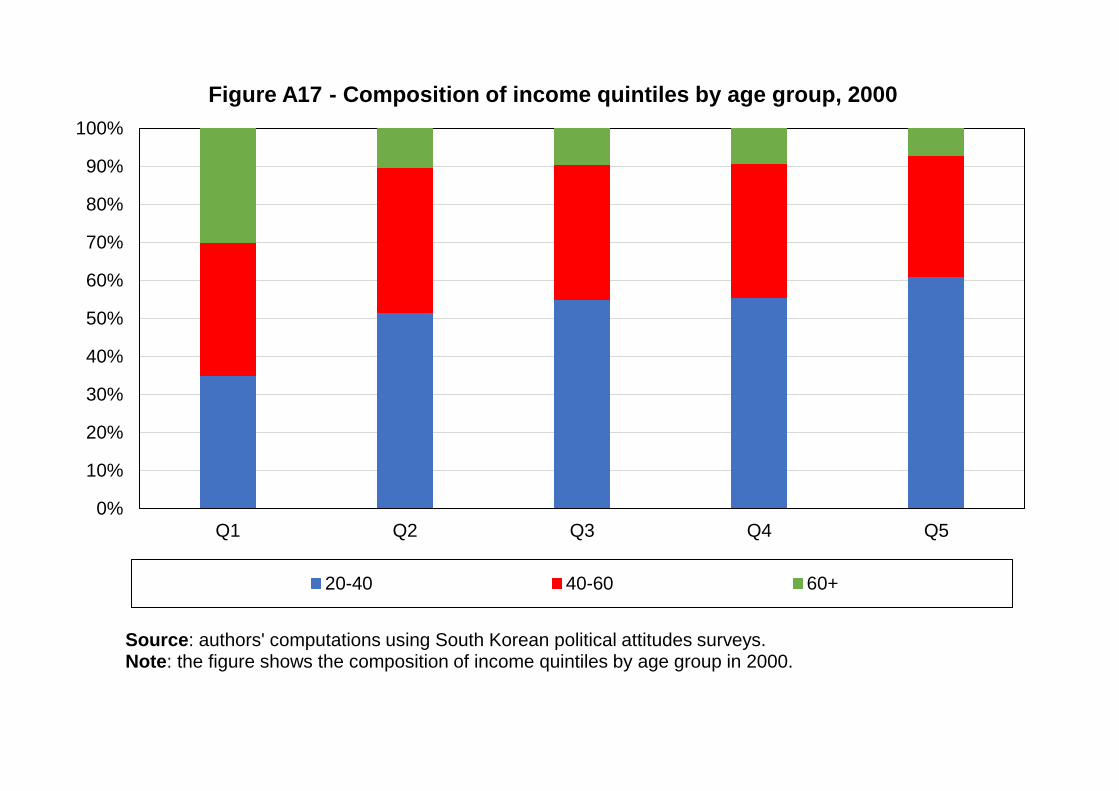
0%
10%
20%
30%
40%
50%
60%
70%
80%
90%
100%
Q1 Q2 Q3 Q4 Q5
Figure A17 - Composition of income quintiles by age group, 2000
20-40 40-60 60+
Source: authors' computations using South Korean political attitudes surveys.Note: the figure shows the composition of income quintiles by age group in 2000.
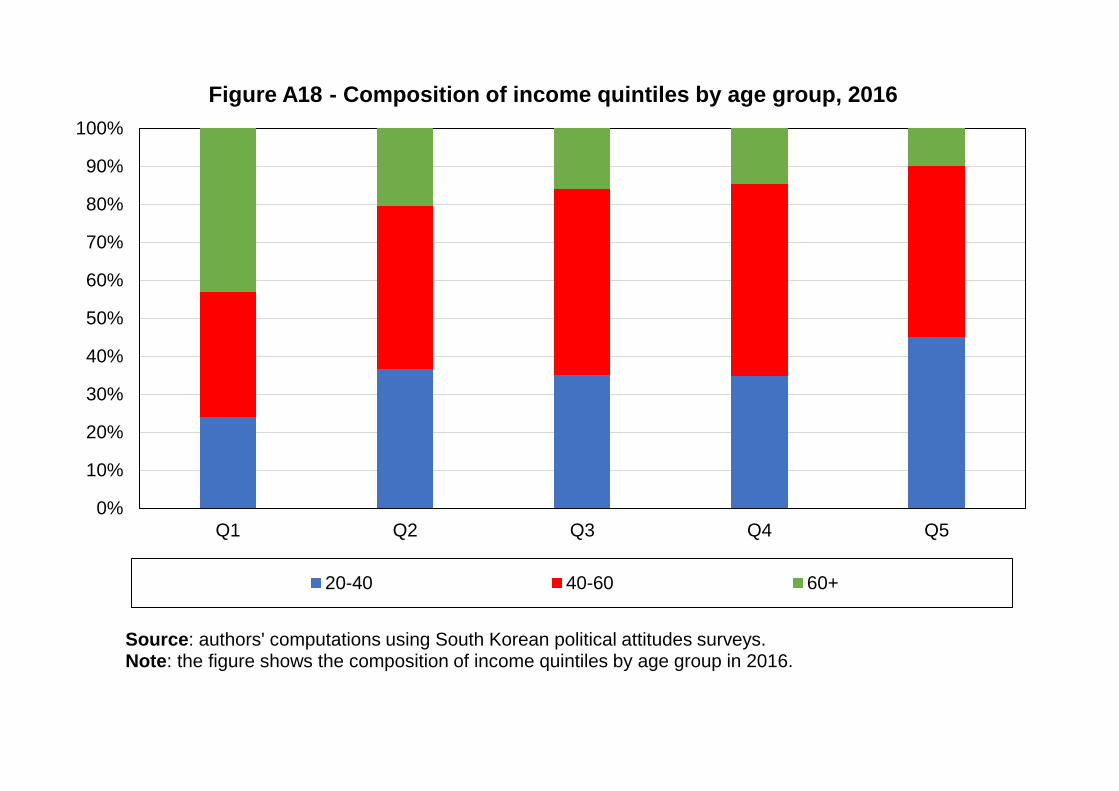
0%
10%
20%
30%
40%
50%
60%
70%
80%
90%
100%
Q1 Q2 Q3 Q4 Q5
Figure A18 - Composition of income quintiles by age group, 2016
20-40 40-60 60+
Source: authors' computations using South Korean political attitudes surveys.Note: the figure shows the composition of income quintiles by age group in 2016.
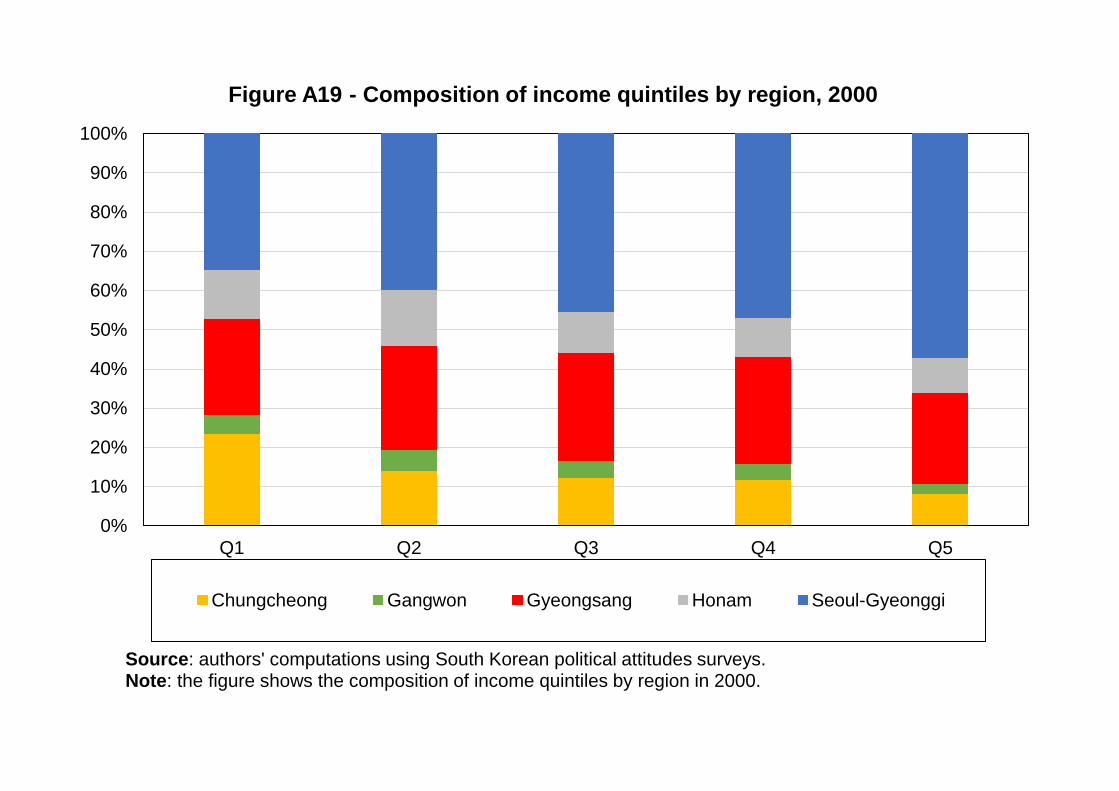
0%
10%
20%
30%
40%
50%
60%
70%
80%
90%
100%
Q1 Q2 Q3 Q4 Q5
Figure A19 - Composition of income quintiles by region, 2000
Chungcheong Gangwon Gyeongsang Honam Seoul-Gyeonggi
Source: authors' computations using South Korean political attitudes surveys.Note: the figure shows the composition of income quintiles by region in 2000.
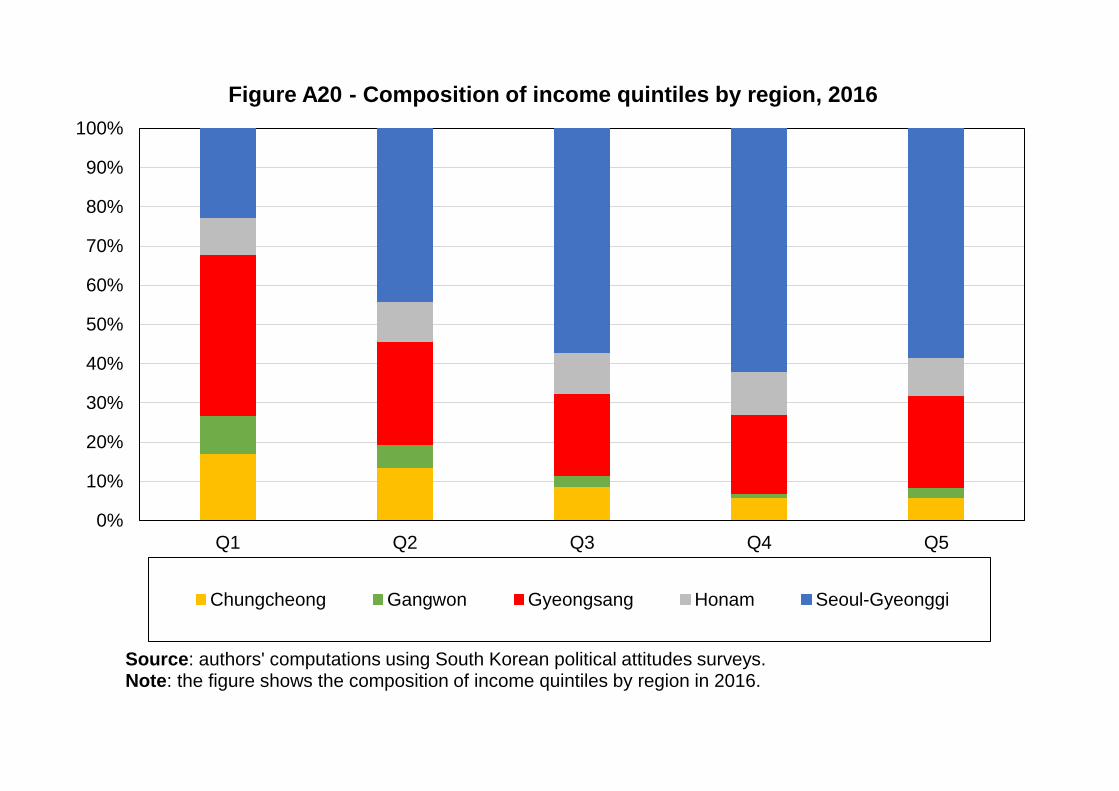
0%
10%
20%
30%
40%
50%
60%
70%
80%
90%
100%
Q1 Q2 Q3 Q4 Q5
Figure A20 - Composition of income quintiles by region, 2016
Chungcheong Gangwon Gyeongsang Honam Seoul-Gyeonggi
Source: authors' computations using South Korean political attitudes surveys.Note: the figure shows the composition of income quintiles by region in 2016.
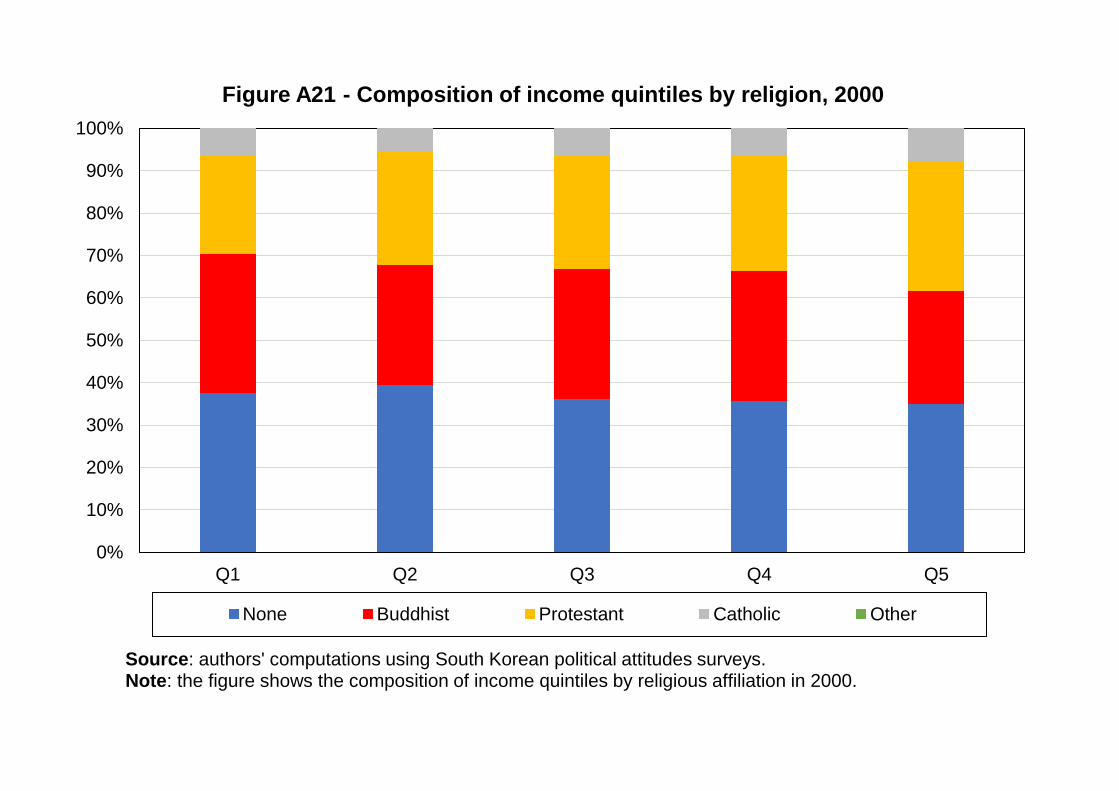
0%
10%
20%
30%
40%
50%
60%
70%
80%
90%
100%
Q1 Q2 Q3 Q4 Q5
Figure A21 - Composition of income quintiles by religion, 2000
None Buddhist Protestant Catholic Other
Source: authors' computations using South Korean political attitudes surveys.Note: the figure shows the composition of income quintiles by religious affiliation in 2000.
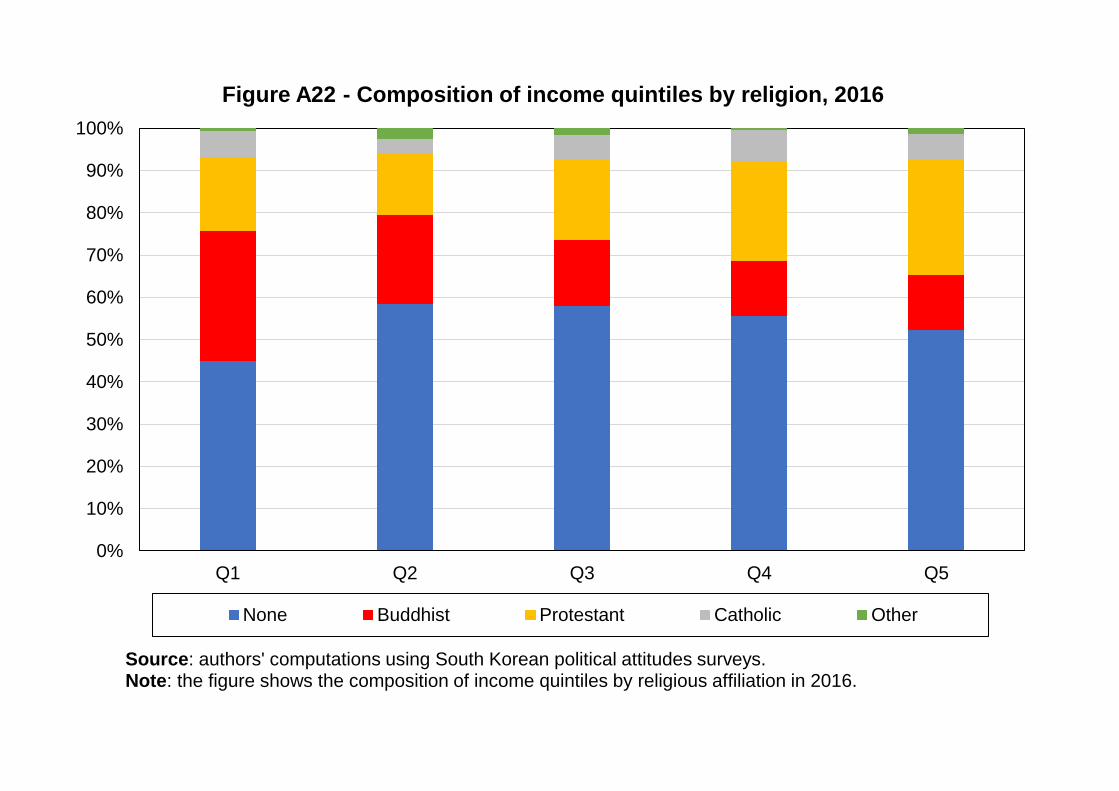
0%
10%
20%
30%
40%
50%
60%
70%
80%
90%
100%
Q1 Q2 Q3 Q4 Q5
Figure A22 - Composition of income quintiles by religion, 2016
None Buddhist Protestant Catholic Other
Source: authors' computations using South Korean political attitudes surveys.Note: the figure shows the composition of income quintiles by religious affiliation in 2016.
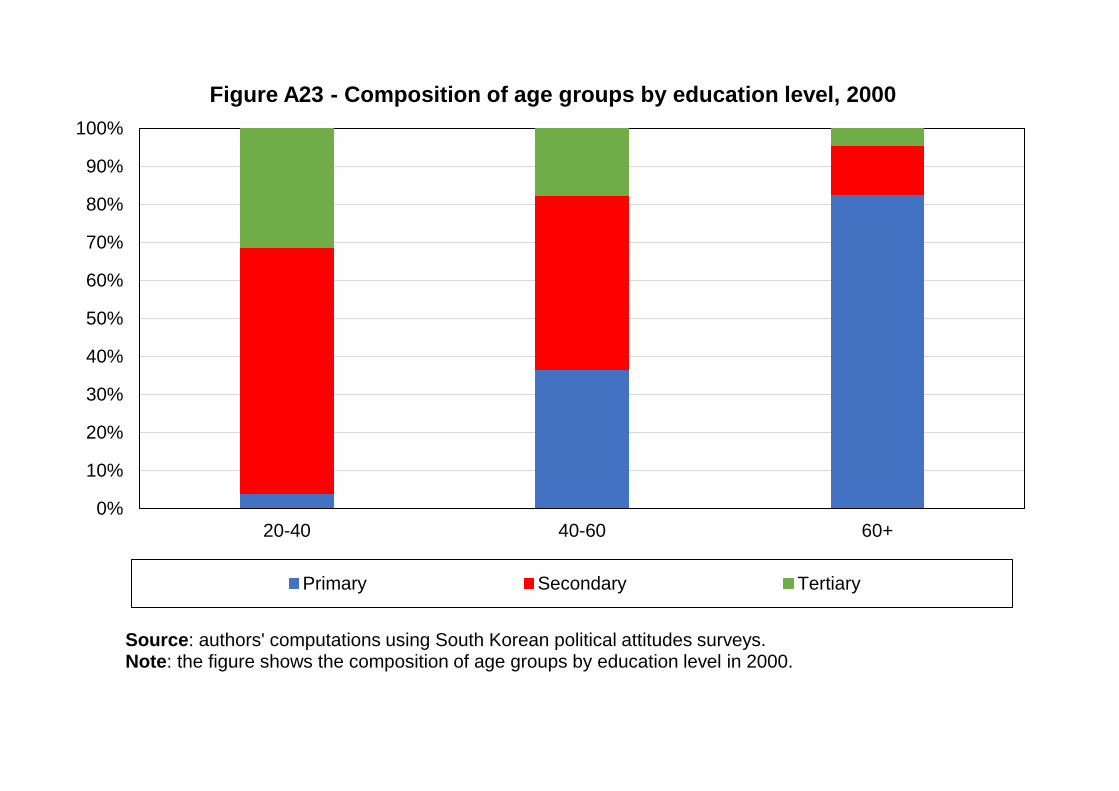
0%
10%
20%
30%
40%
50%
60%
70%
80%
90%
100%
20-40 40-60 60+
Figure A23 - Composition of age groups by education level, 2000
Primary Secondary Tertiary
Source: authors' computations using South Korean political attitudes surveys.Note: the figure shows the composition of age groups by education level in 2000.
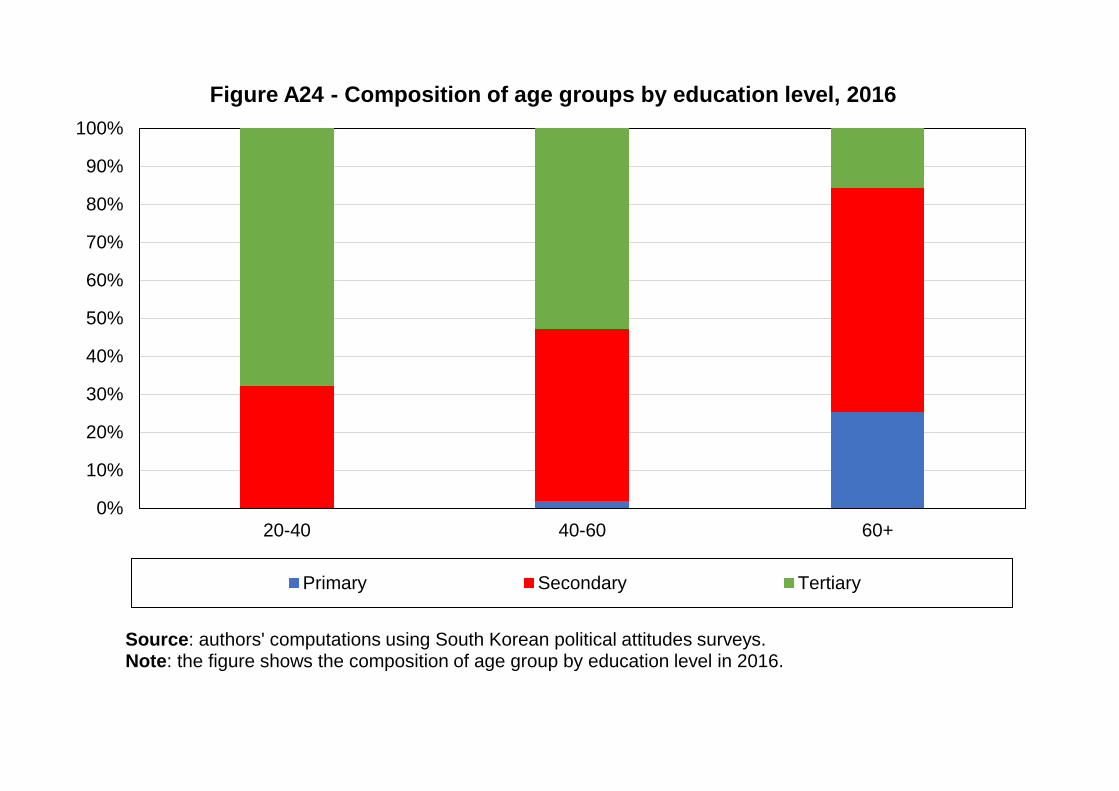
0%
10%
20%
30%
40%
50%
60%
70%
80%
90%
100%
20-40 40-60 60+
Figure A24 - Composition of age groups by education level, 2016
Primary Secondary Tertiary
Source: authors' computations using South Korean political attitudes surveys.Note: the figure shows the composition of age group by education level in 2016.
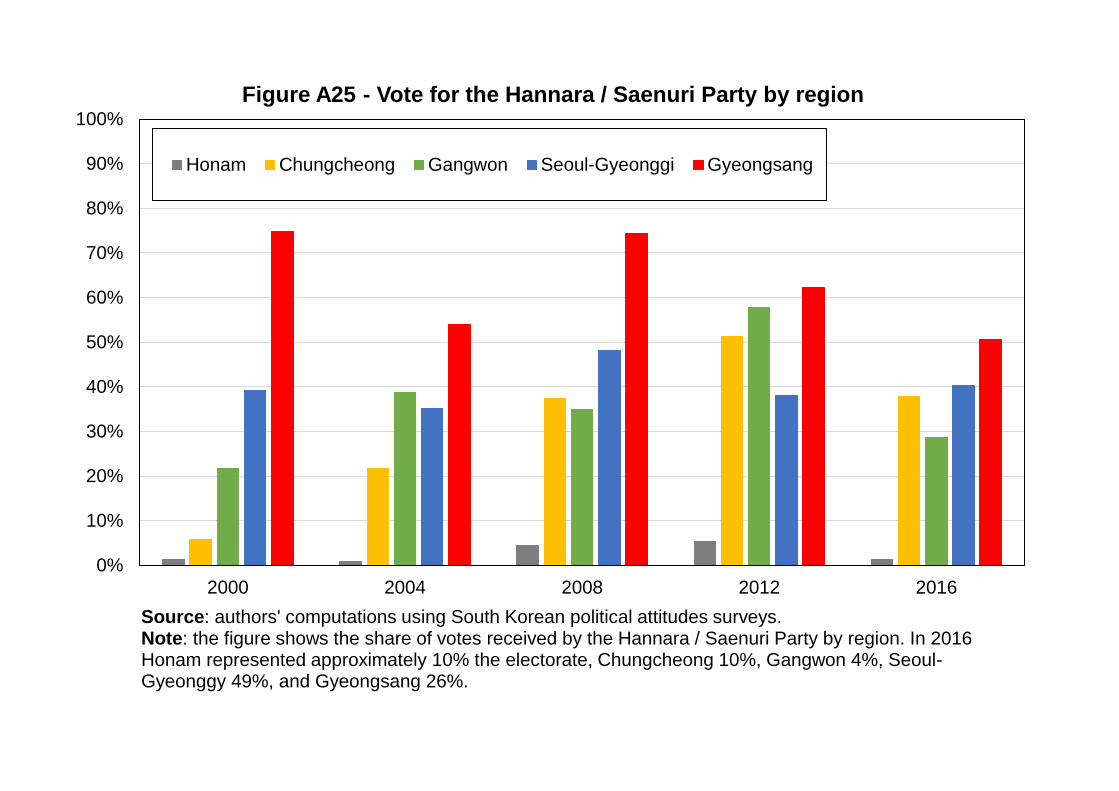
0%
10%
20%
30%
40%
50%
60%
70%
80%
90%
100%
2000 2004 2008 2012 2016
Figure A25 - Vote for the Hannara / Saenuri Party by region
Honam Chungcheong Gangwon Seoul-Gyeonggi Gyeongsang
Source: authors' computations using South Korean political attitudes surveys.Note: the figure shows the share of votes received by the Hannara / Saenuri Party by region. In 2016 Honam represented approximately 10% the electorate, Chungcheong 10%, Gangwon 4%, Seoul-Gyeonggy 49%, and Gyeongsang 26%.
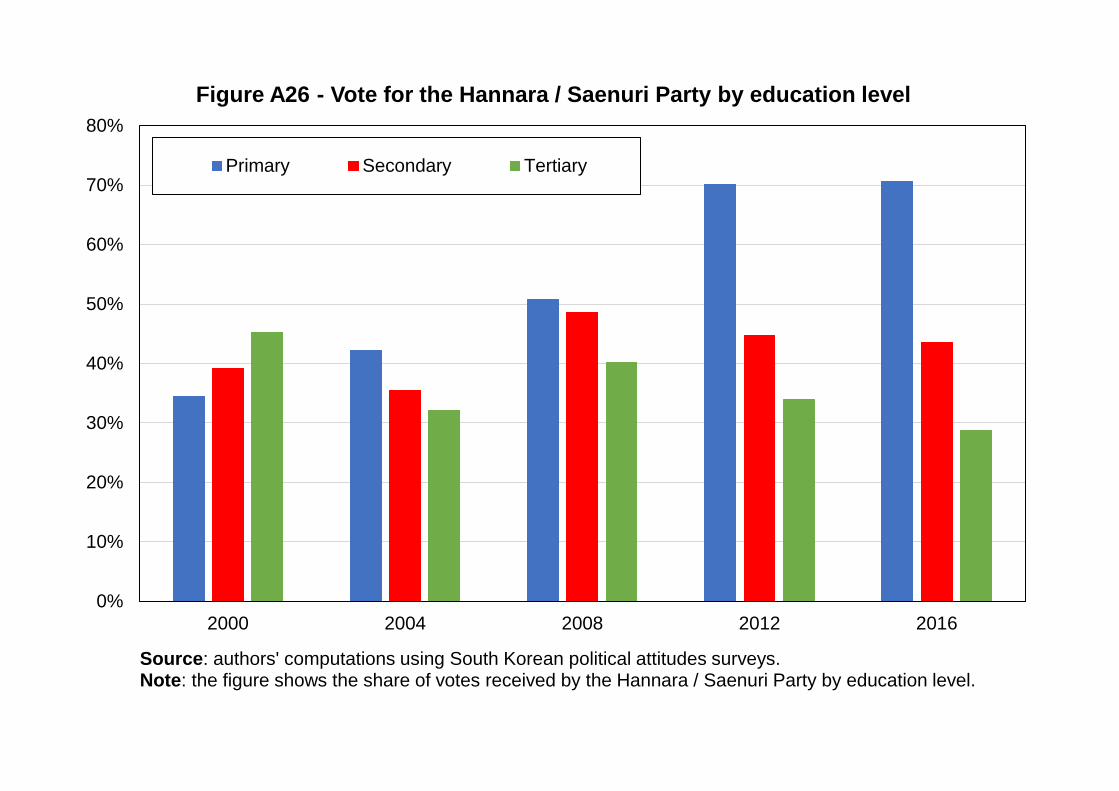
0%
10%
20%
30%
40%
50%
60%
70%
80%
2000 2004 2008 2012 2016
Figure A26 - Vote for the Hannara / Saenuri Party by education level
Primary Secondary Tertiary
Source: authors' computations using South Korean political attitudes surveys.Note: the figure shows the share of votes received by the Hannara / Saenuri Party by education level.
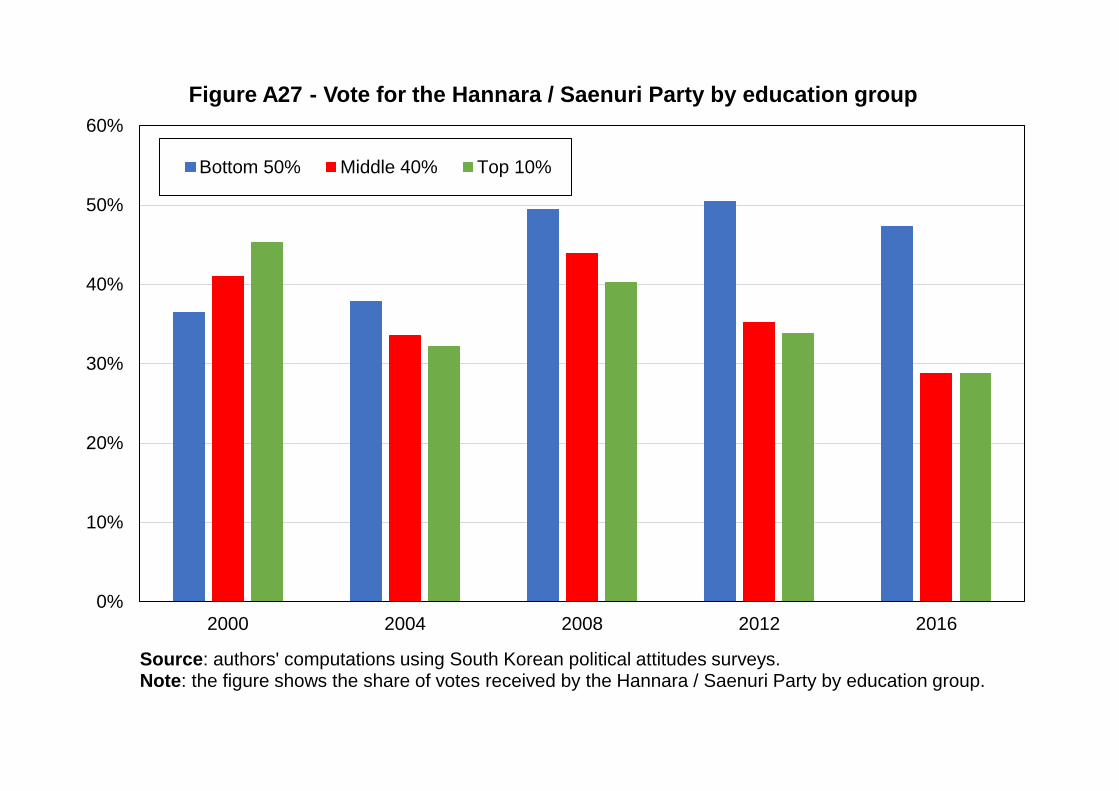
0%
10%
20%
30%
40%
50%
60%
2000 2004 2008 2012 2016
Figure A27 - Vote for the Hannara / Saenuri Party by education group
Bottom 50% Middle 40% Top 10%
Source: authors' computations using South Korean political attitudes surveys.Note: the figure shows the share of votes received by the Hannara / Saenuri Party by education group.
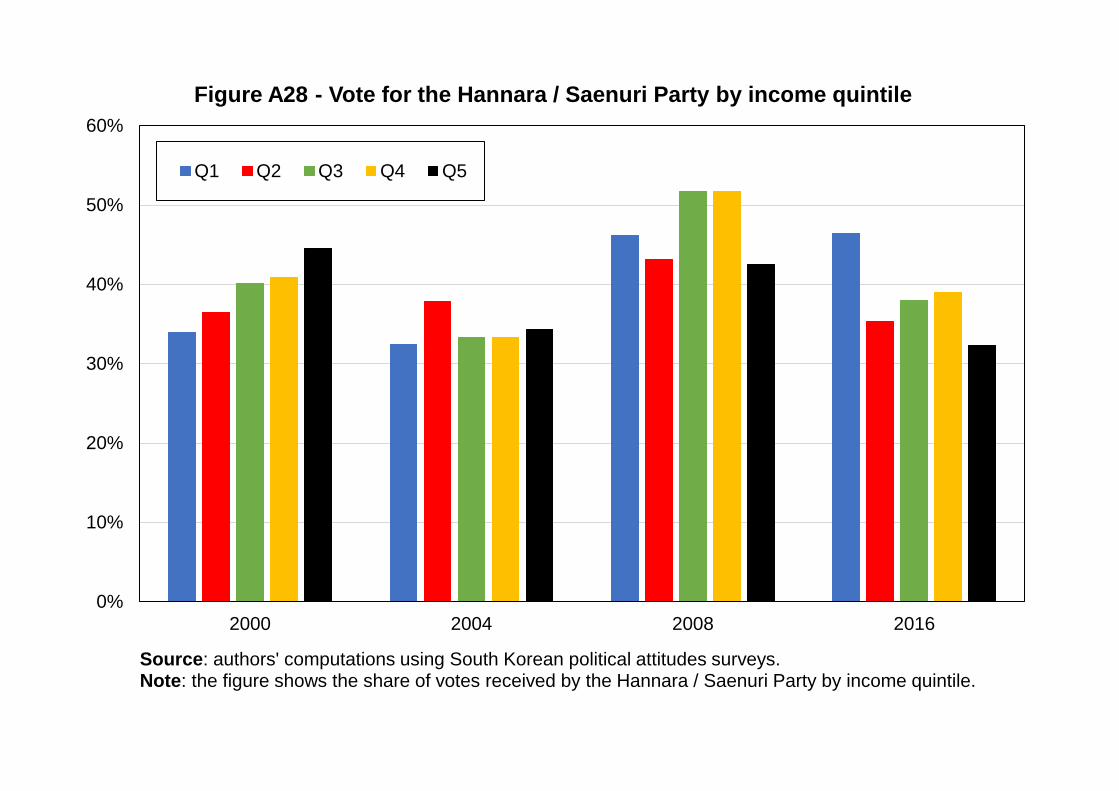
0%
10%
20%
30%
40%
50%
60%
2000 2004 2008 2016
Figure A28 - Vote for the Hannara / Saenuri Party by income quintile
Q1 Q2 Q3 Q4 Q5
Source: authors' computations using South Korean political attitudes surveys.Note: the figure shows the share of votes received by the Hannara / Saenuri Party by income quintile.
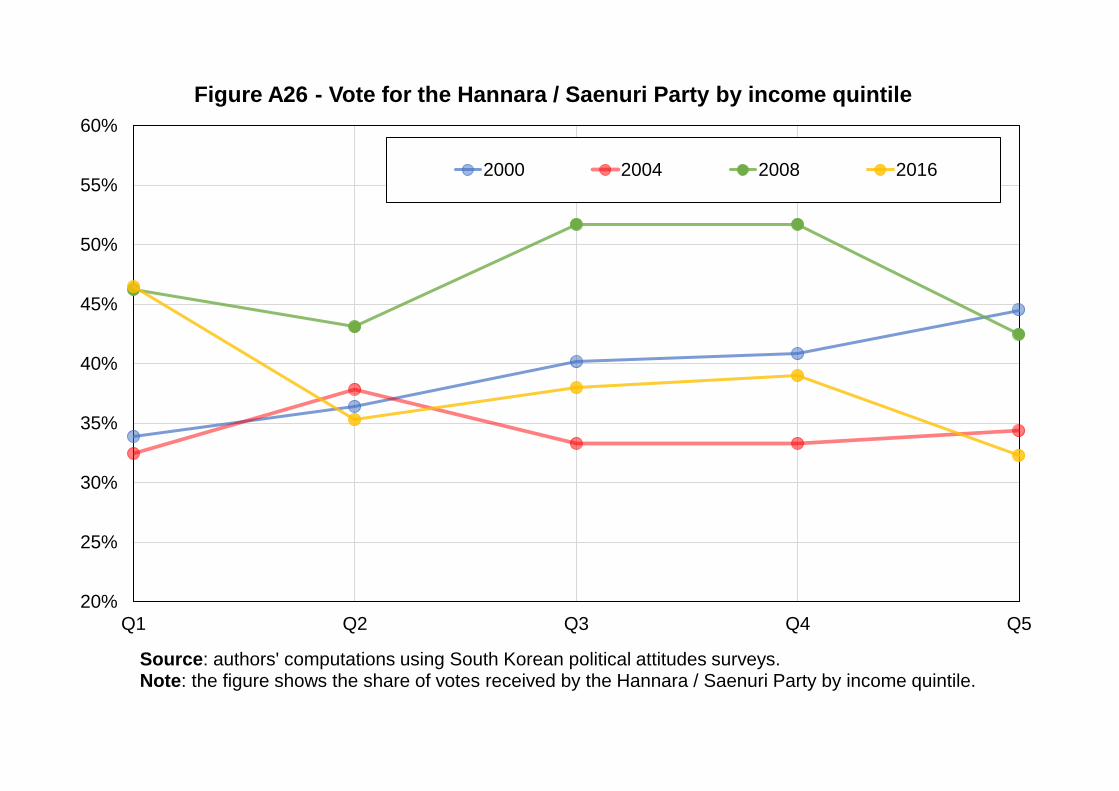
20%
25%
30%
35%
40%
45%
50%
55%
60%
Q1 Q2 Q3 Q4 Q5
Figure A26 - Vote for the Hannara / Saenuri Party by income quintile
2000 2004 2008 2016
Source: authors' computations using South Korean political attitudes surveys.Note: the figure shows the share of votes received by the Hannara / Saenuri Party by income quintile.
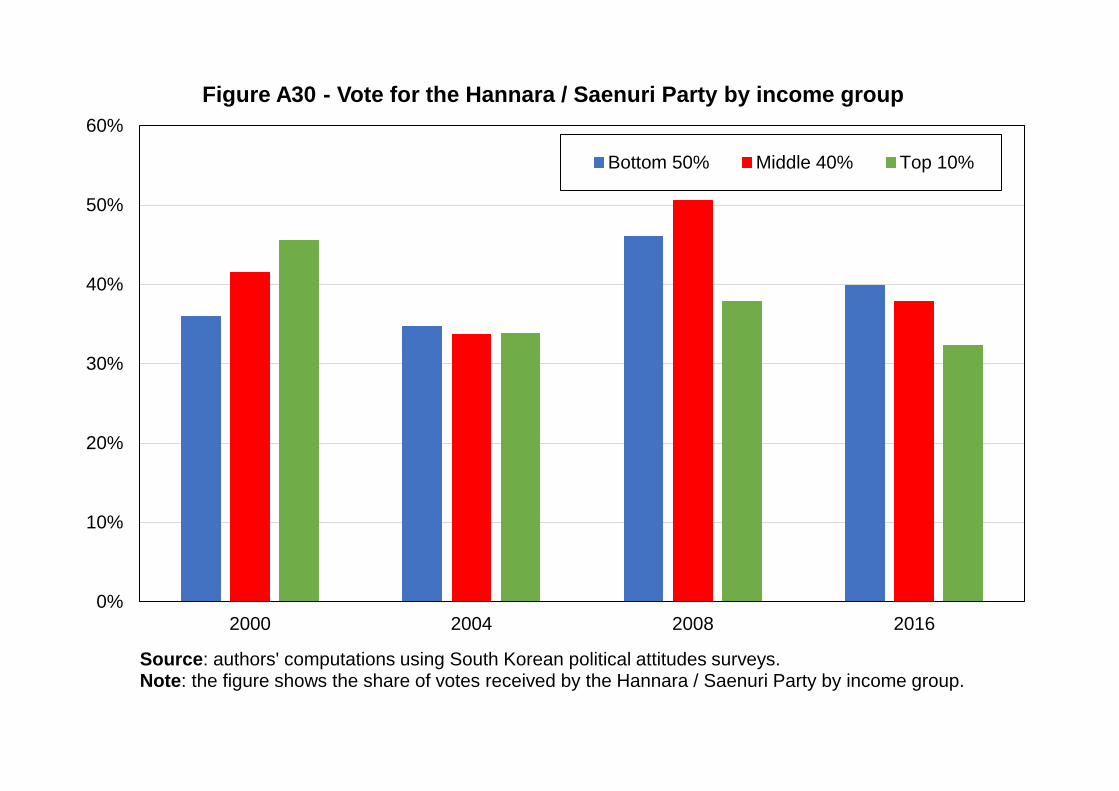
0%
10%
20%
30%
40%
50%
60%
2000 2004 2008 2016
Figure A30 - Vote for the Hannara / Saenuri Party by income group
Bottom 50% Middle 40% Top 10%
Source: authors' computations using South Korean political attitudes surveys.Note: the figure shows the share of votes received by the Hannara / Saenuri Party by income group.
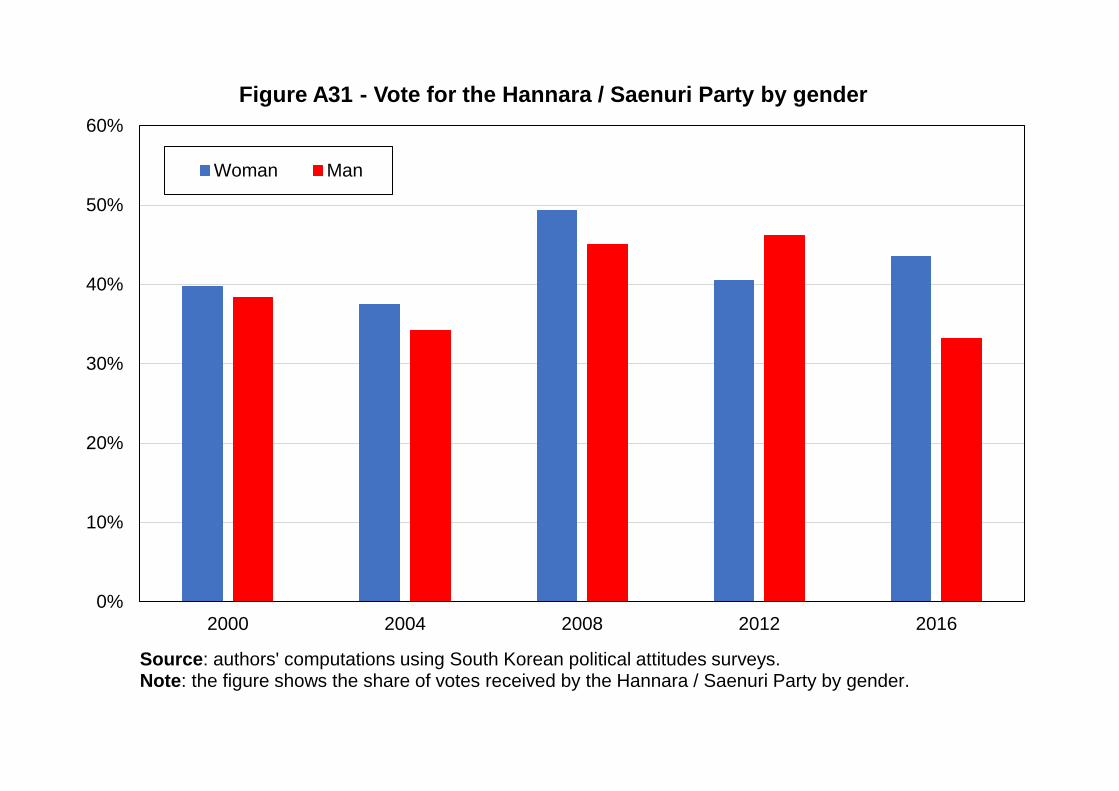
0%
10%
20%
30%
40%
50%
60%
2000 2004 2008 2012 2016
Figure A31 - Vote for the Hannara / Saenuri Party by gender
Woman Man
Source: authors' computations using South Korean political attitudes surveys.Note: the figure shows the share of votes received by the Hannara / Saenuri Party by gender.
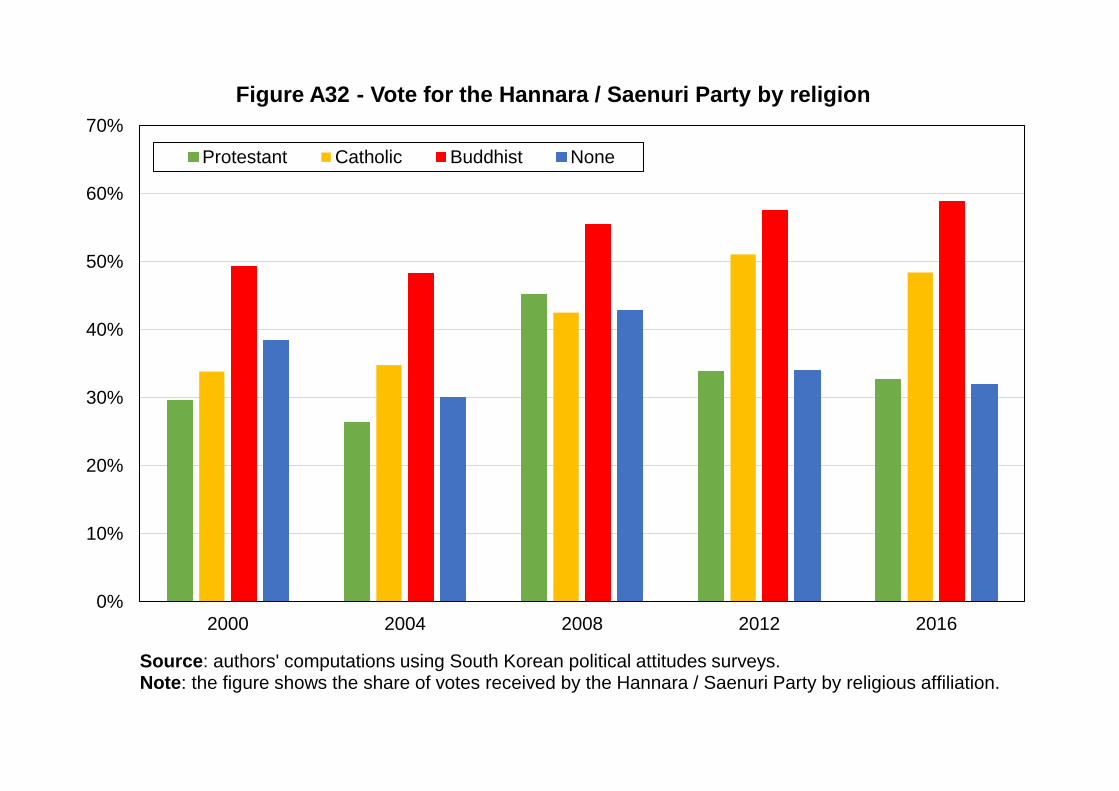
0%
10%
20%
30%
40%
50%
60%
70%
2000 2004 2008 2012 2016
Figure A32 - Vote for the Hannara / Saenuri Party by religion
Protestant Catholic Buddhist None
Source: authors' computations using South Korean political attitudes surveys.Note: the figure shows the share of votes received by the Hannara / Saenuri Party by religious affiliation.
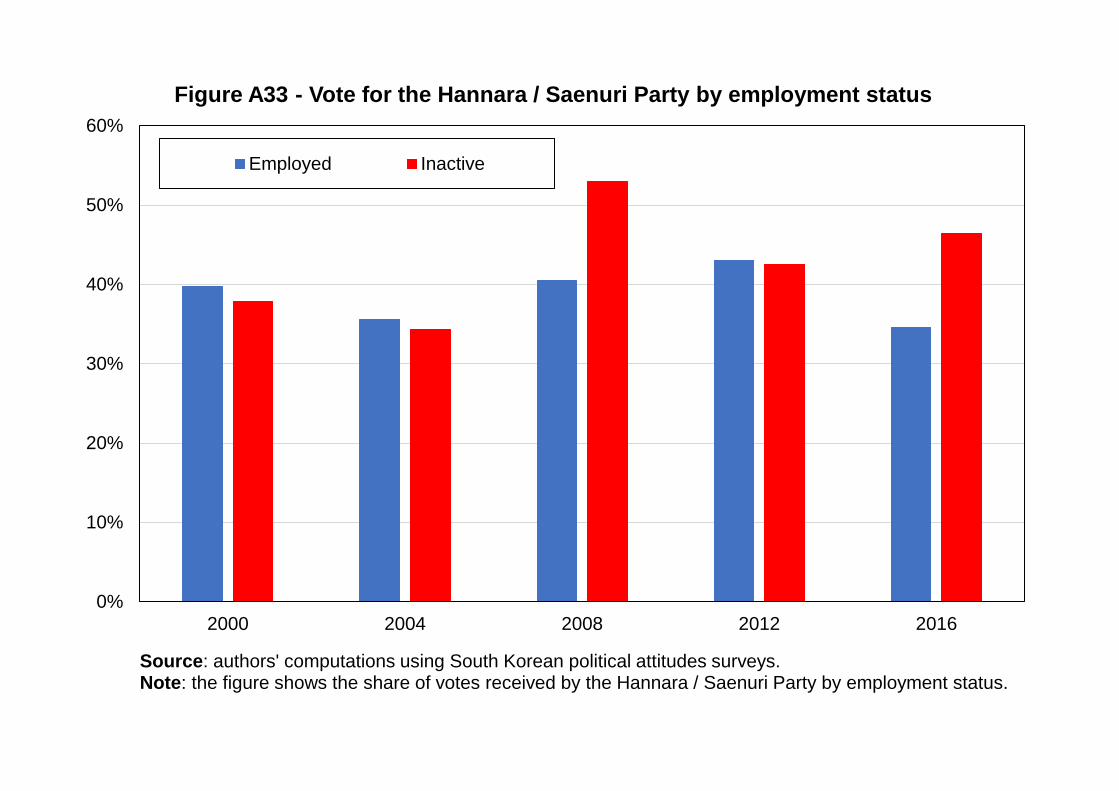
0%
10%
20%
30%
40%
50%
60%
2000 2004 2008 2012 2016
Figure A33 - Vote for the Hannara / Saenuri Party by employment status
Employed Inactive
Source: authors' computations using South Korean political attitudes surveys.Note: the figure shows the share of votes received by the Hannara / Saenuri Party by employment status.
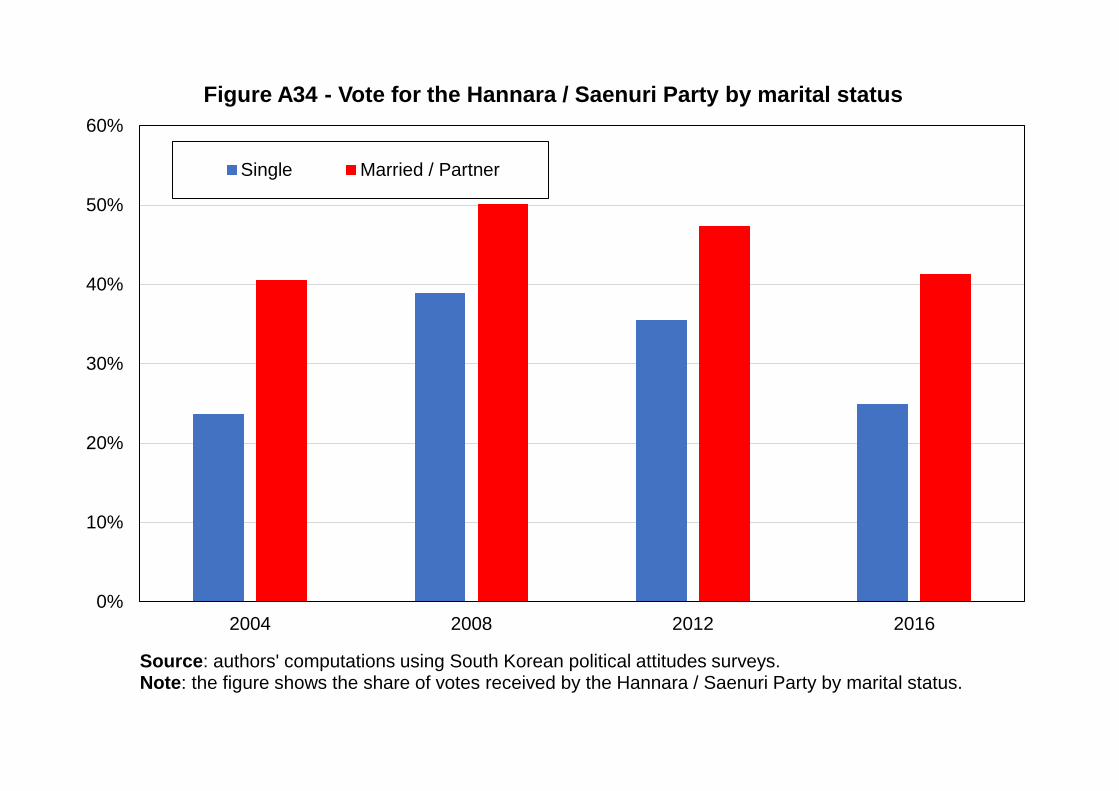
0%
10%
20%
30%
40%
50%
60%
2004 2008 2012 2016
Figure A34 - Vote for the Hannara / Saenuri Party by marital status
Single Married / Partner
Source: authors' computations using South Korean political attitudes surveys.Note: the figure shows the share of votes received by the Hannara / Saenuri Party by marital status.
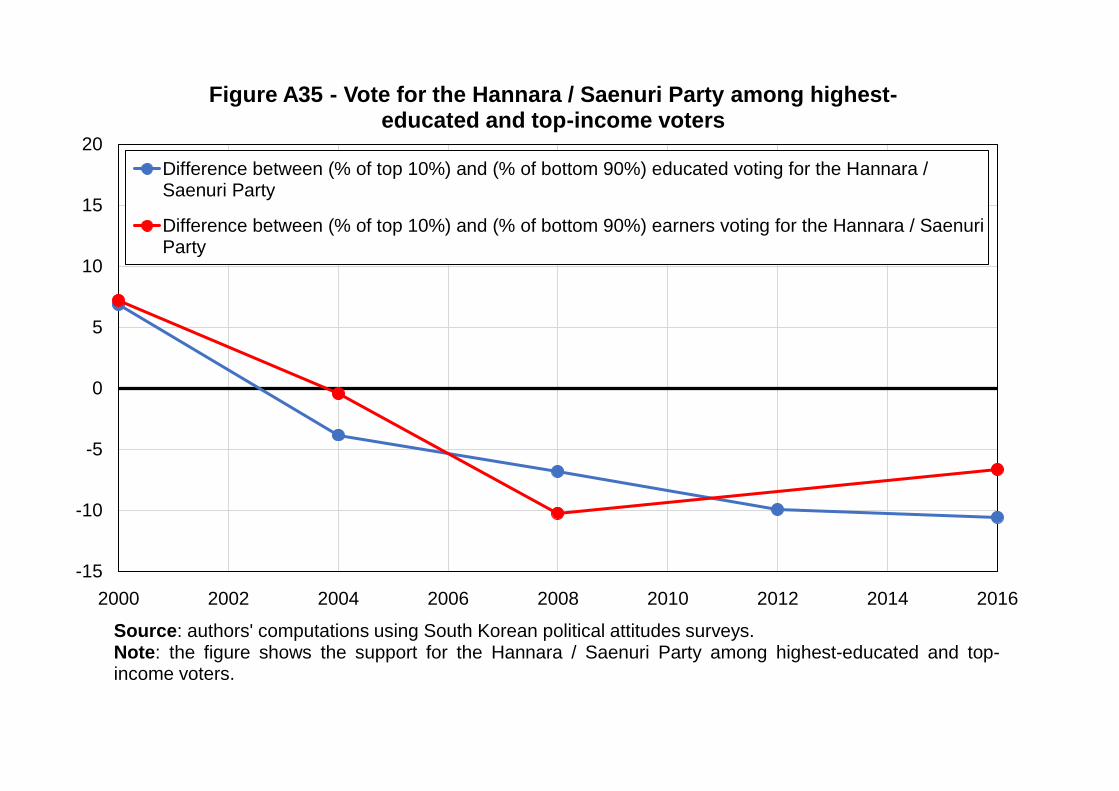
-15
-10
-5
0
5
10
15
20
2000 2002 2004 2006 2008 2010 2012 2014 2016
Figure A35 - Vote for the Hannara / Saenuri Party among highest-educated and top-income voters
Difference between (% of top 10%) and (% of bottom 90%) educated voting for the Hannara /Saenuri Party
Difference between (% of top 10%) and (% of bottom 90%) earners voting for the Hannara / SaenuriParty
Source: authors' computations using South Korean political attitudes surveys.Note: the figure shows the support for the Hannara / Saenuri Party among highest-educated and top-income voters.
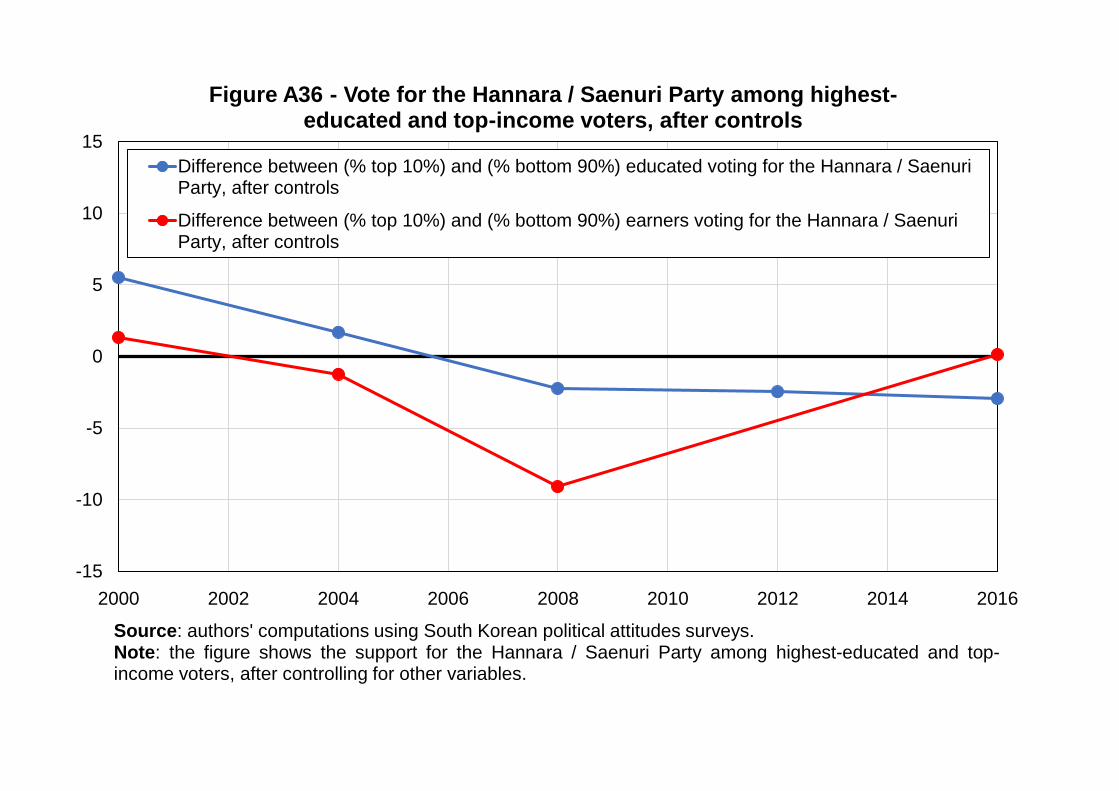
-15
-10
-5
0
5
10
15
2000 2002 2004 2006 2008 2010 2012 2014 2016
Figure A36 - Vote for the Hannara / Saenuri Party among highest-educated and top-income voters, after controls
Difference between (% top 10%) and (% bottom 90%) educated voting for the Hannara / SaenuriParty, after controls
Difference between (% top 10%) and (% bottom 90%) earners voting for the Hannara / SaenuriParty, after controls
Source: authors' computations using South Korean political attitudes surveys.Note: the figure shows the support for the Hannara / Saenuri Party among highest-educated and top-income voters, after controlling for other variables.
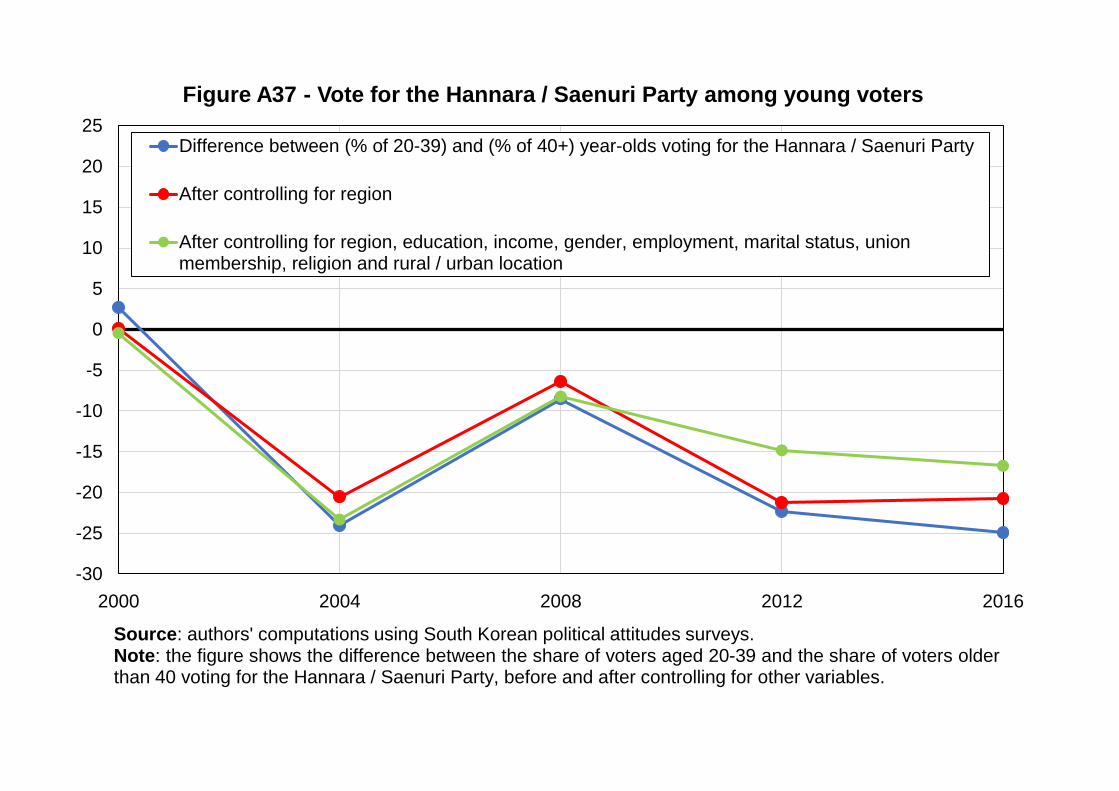
-30
-25
-20
-15
-10
-5
0
5
10
15
20
25
2000 2004 2008 2012 2016
Figure A37 - Vote for the Hannara / Saenuri Party among young voters
Difference between (% of 20-39) and (% of 40+) year-olds voting for the Hannara / Saenuri Party
After controlling for region
After controlling for region, education, income, gender, employment, marital status, unionmembership, religion and rural / urban location
Source: authors' computations using South Korean political attitudes surveys.Note: the figure shows the difference between the share of voters aged 20-39 and the share of voters olderthan 40 voting for the Hannara / Saenuri Party, before and after controlling for other variables.
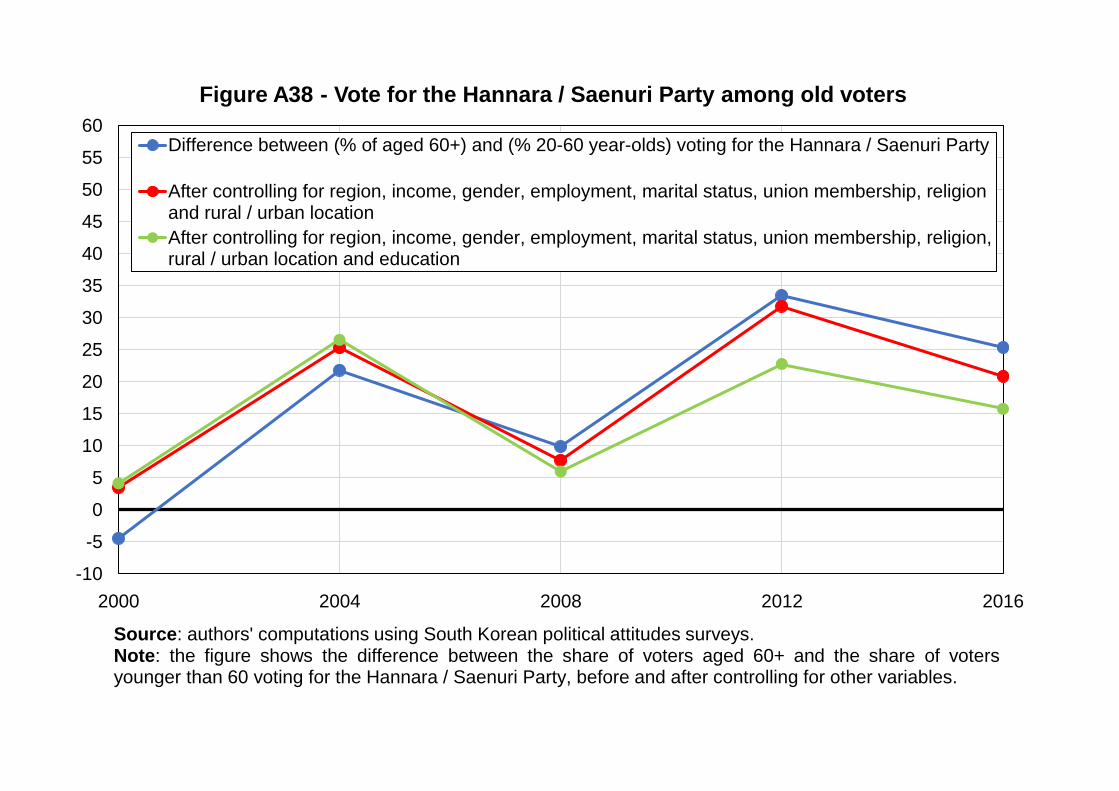
-10
-5
0
5
10
15
20
25
30
35
40
45
50
55
60
2000 2004 2008 2012 2016
Figure A38 - Vote for the Hannara / Saenuri Party among old voters
Difference between (% of aged 60+) and (% 20-60 year-olds) voting for the Hannara / Saenuri Party
After controlling for region, income, gender, employment, marital status, union membership, religionand rural / urban location
After controlling for region, income, gender, employment, marital status, union membership, religion,rural / urban location and education
Source: authors' computations using South Korean political attitudes surveys.Note: the figure shows the difference between the share of voters aged 60+ and the share of votersyounger than 60 voting for the Hannara / Saenuri Party, before and after controlling for other variables.
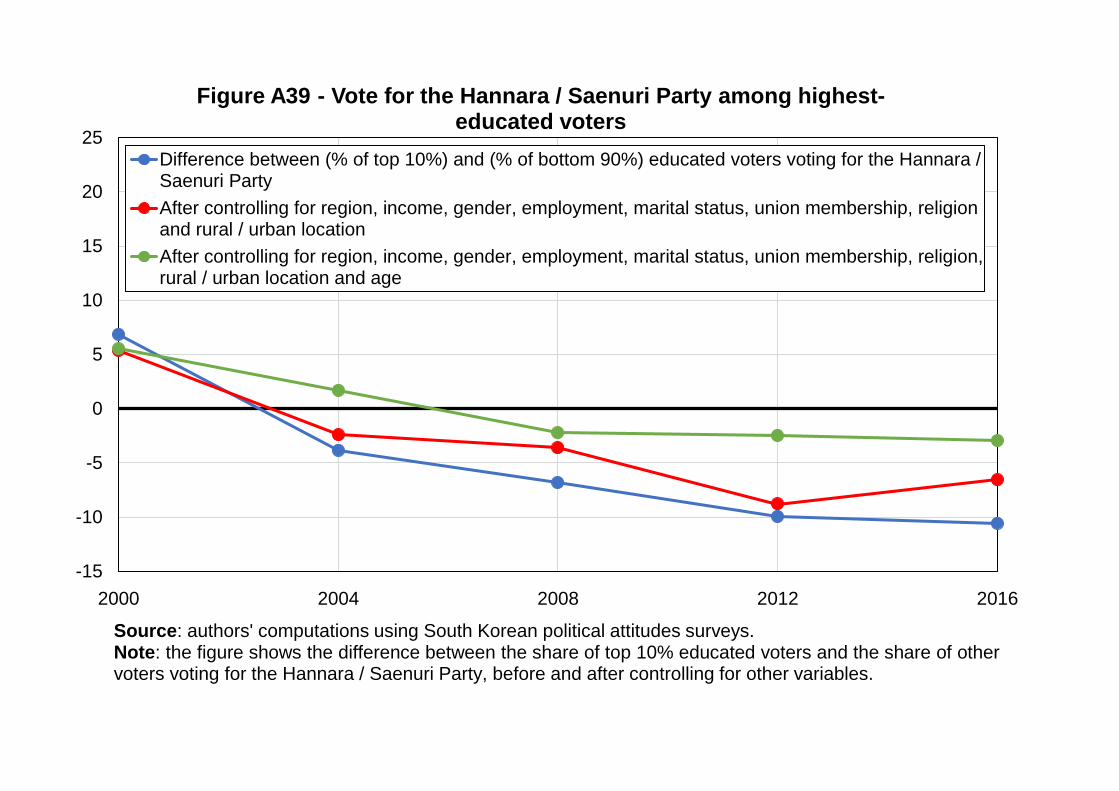
-15
-10
-5
0
5
10
15
20
25
2000 2004 2008 2012 2016
Figure A39 - Vote for the Hannara / Saenuri Party among highest-educated voters
Difference between (% of top 10%) and (% of bottom 90%) educated voters voting for the Hannara /Saenuri Party
After controlling for region, income, gender, employment, marital status, union membership, religionand rural / urban location
After controlling for region, income, gender, employment, marital status, union membership, religion,rural / urban location and age
Source: authors' computations using South Korean political attitudes surveys.Note: the figure shows the difference between the share of top 10% educated voters and the share of othervoters voting for the Hannara / Saenuri Party, before and after controlling for other variables.
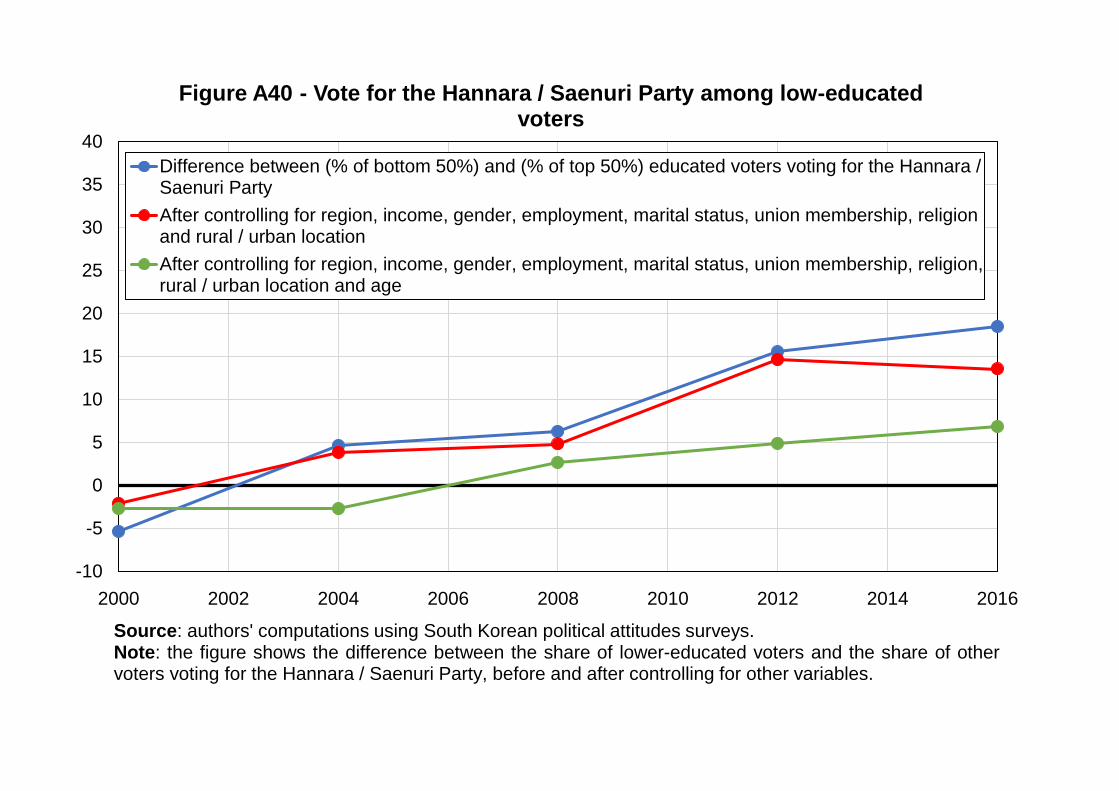
-10
-5
0
5
10
15
20
25
30
35
40
2000 2002 2004 2006 2008 2010 2012 2014 2016
Figure A40 - Vote for the Hannara / Saenuri Party among low-educated voters
Difference between (% of bottom 50%) and (% of top 50%) educated voters voting for the Hannara /Saenuri Party
After controlling for region, income, gender, employment, marital status, union membership, religionand rural / urban location
After controlling for region, income, gender, employment, marital status, union membership, religion,rural / urban location and age
Source: authors' computations using South Korean political attitudes surveys.Note: the figure shows the difference between the share of lower-educated voters and the share of othervoters voting for the Hannara / Saenuri Party, before and after controlling for other variables.
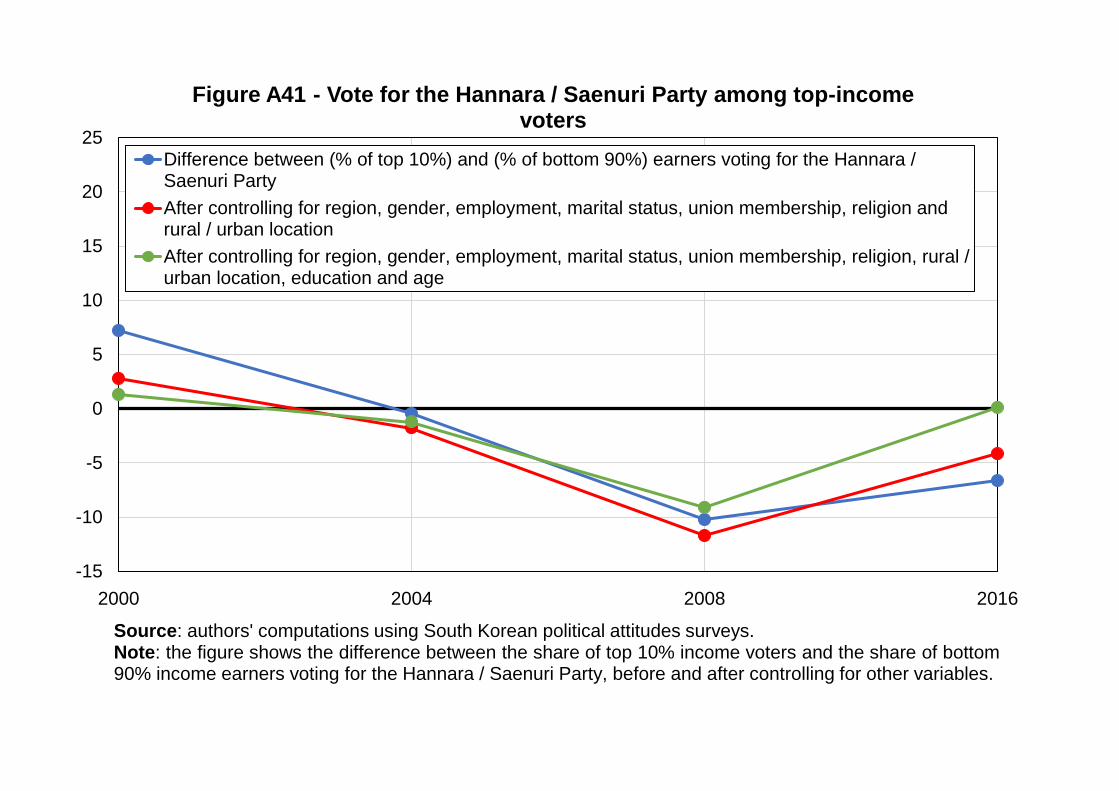
-15
-10
-5
0
5
10
15
20
25
2000 2004 2008 2016
Figure A41 - Vote for the Hannara / Saenuri Party among top-income voters
Difference between (% of top 10%) and (% of bottom 90%) earners voting for the Hannara /Saenuri Party
After controlling for region, gender, employment, marital status, union membership, religion andrural / urban location
After controlling for region, gender, employment, marital status, union membership, religion, rural /urban location, education and age
Source: authors' computations using South Korean political attitudes surveys.Note: the figure shows the difference between the share of top 10% income voters and the share of bottom90% income earners voting for the Hannara / Saenuri Party, before and after controlling for other variables.
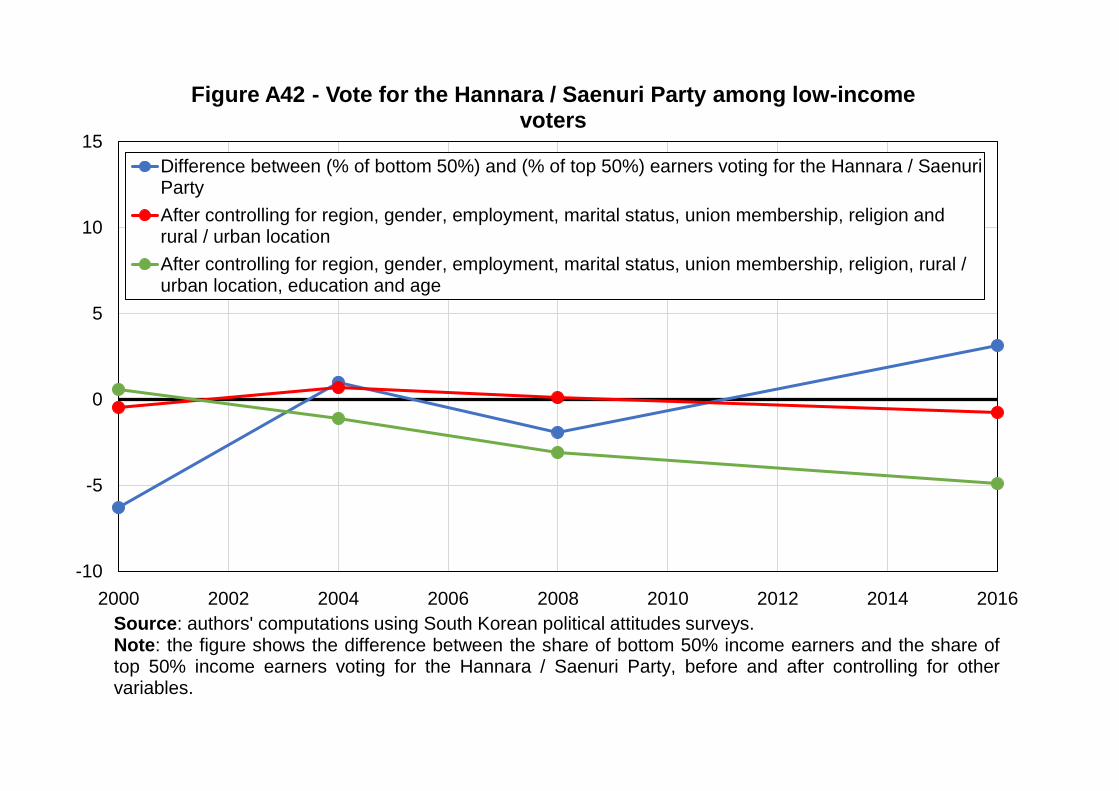
-10
-5
0
5
10
15
2000 2002 2004 2006 2008 2010 2012 2014 2016
Figure A42 - Vote for the Hannara / Saenuri Party among low-income voters
Difference between (% of bottom 50%) and (% of top 50%) earners voting for the Hannara / SaenuriParty
After controlling for region, gender, employment, marital status, union membership, religion andrural / urban location
After controlling for region, gender, employment, marital status, union membership, religion, rural /urban location, education and age
Source: authors' computations using South Korean political attitudes surveys.Note: the figure shows the difference between the share of bottom 50% income earners and the share oftop 50% income earners voting for the Hannara / Saenuri Party, before and after controlling for othervariables.
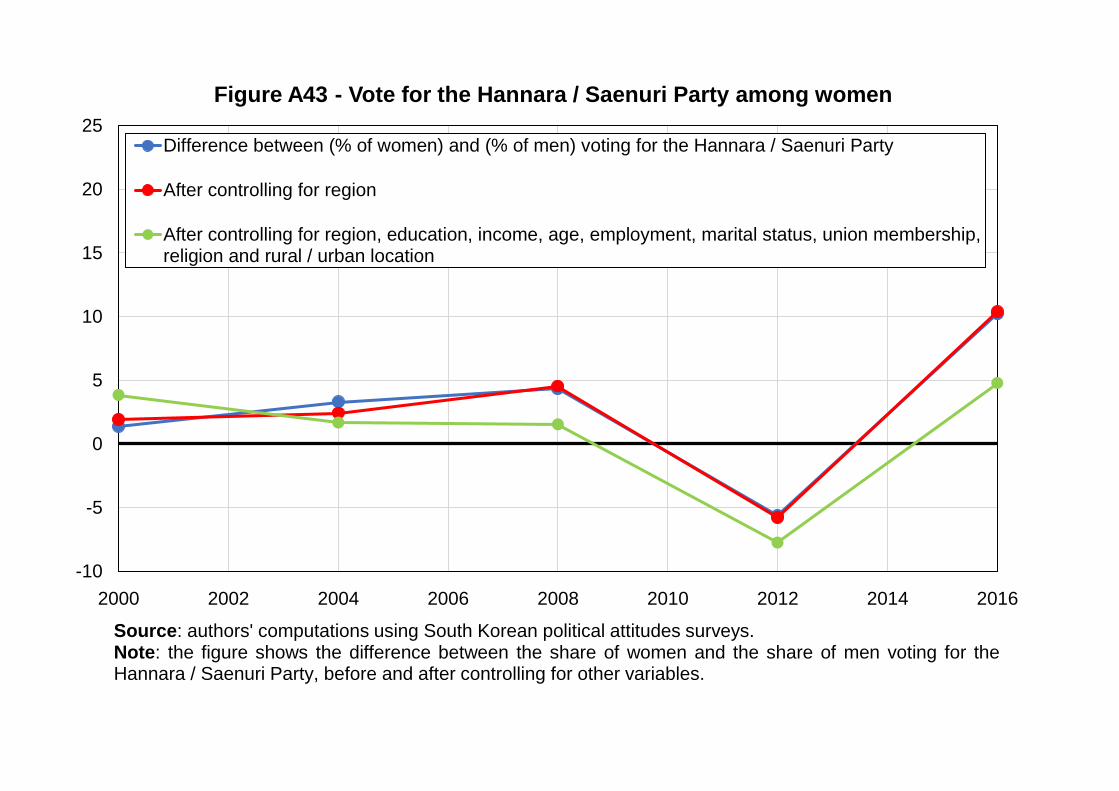
-10
-5
0
5
10
15
20
25
2000 2002 2004 2006 2008 2010 2012 2014 2016
Figure A43 - Vote for the Hannara / Saenuri Party among women
Difference between (% of women) and (% of men) voting for the Hannara / Saenuri Party
After controlling for region
After controlling for region, education, income, age, employment, marital status, union membership,religion and rural / urban location
Source: authors' computations using South Korean political attitudes surveys.Note: the figure shows the difference between the share of women and the share of men voting for theHannara / Saenuri Party, before and after controlling for other variables.
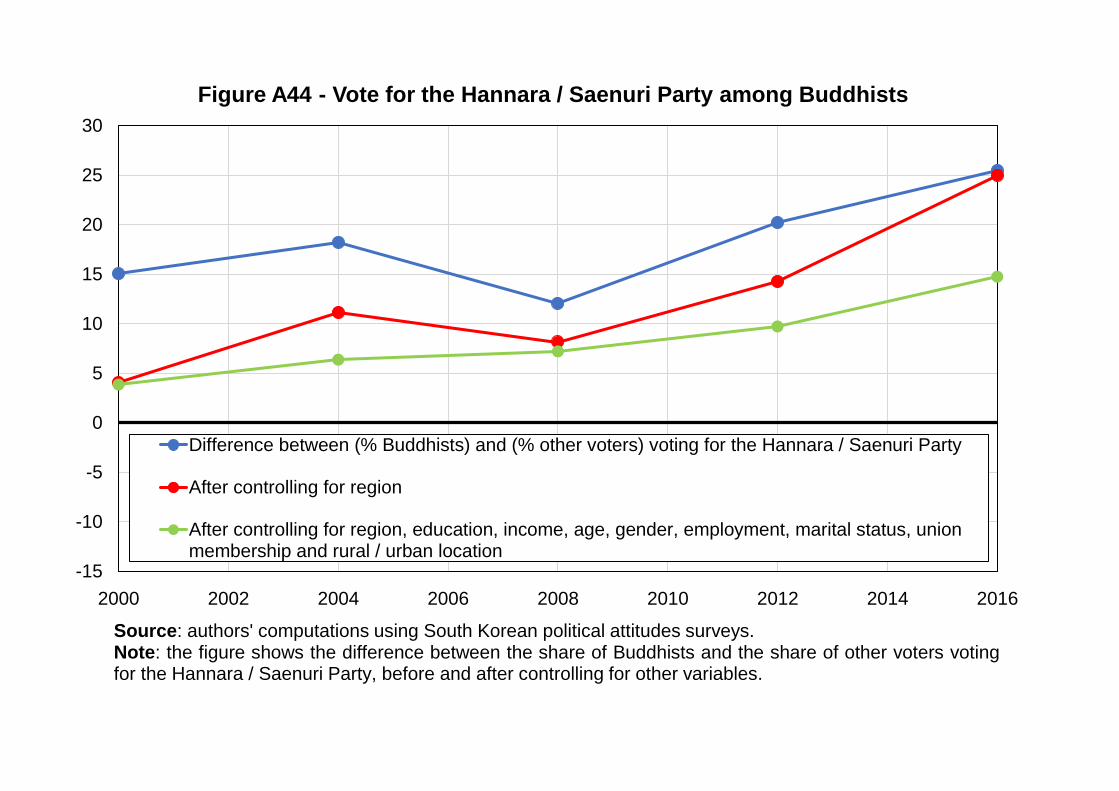
-15
-10
-5
0
5
10
15
20
25
30
2000 2002 2004 2006 2008 2010 2012 2014 2016
Figure A44 - Vote for the Hannara / Saenuri Party among Buddhists
Difference between (% Buddhists) and (% other voters) voting for the Hannara / Saenuri Party
After controlling for region
After controlling for region, education, income, age, gender, employment, marital status, unionmembership and rural / urban location
Source: authors' computations using South Korean political attitudes surveys.Note: the figure shows the difference between the share of Buddhists and the share of other voters votingfor the Hannara / Saenuri Party, before and after controlling for other variables.
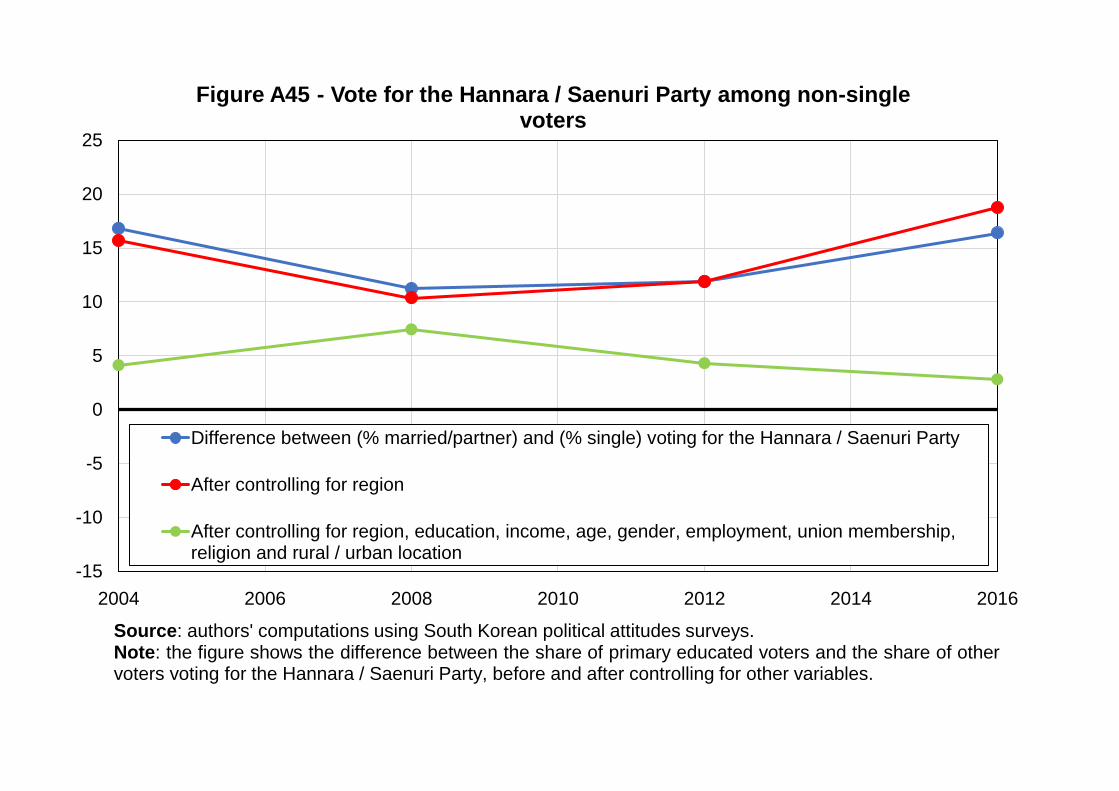
-15
-10
-5
0
5
10
15
20
25
2004 2006 2008 2010 2012 2014 2016
Figure A45 - Vote for the Hannara / Saenuri Party among non-single voters
Difference between (% married/partner) and (% single) voting for the Hannara / Saenuri Party
After controlling for region
After controlling for region, education, income, age, gender, employment, union membership,religion and rural / urban location
Source: authors' computations using South Korean political attitudes surveys.Note: the figure shows the difference between the share of primary educated voters and the share of othervoters voting for the Hannara / Saenuri Party, before and after controlling for other variables.
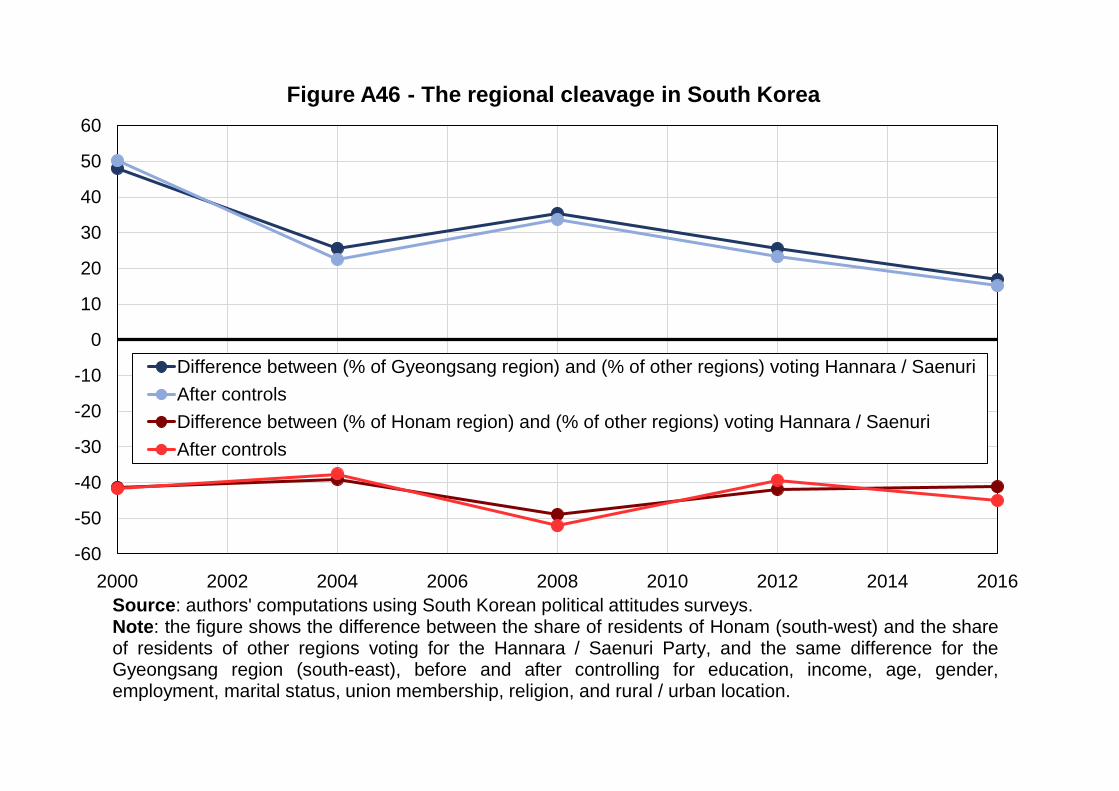
-60
-50
-40
-30
-20
-10
0
10
20
30
40
50
60
2000 2002 2004 2006 2008 2010 2012 2014 2016
Figure A46 - The regional cleavage in South Korea
Difference between (% of Gyeongsang region) and (% of other regions) voting Hannara / Saenuri
After controls
Difference between (% of Honam region) and (% of other regions) voting Hannara / Saenuri
After controls
Source: authors' computations using South Korean political attitudes surveys.Note: the figure shows the difference between the share of residents of Honam (south-west) and the shareof residents of other regions voting for the Hannara / Saenuri Party, and the same difference for theGyeongsang region (south-east), before and after controlling for education, income, age, gender,employment, marital status, union membership, religion, and rural / urban location.
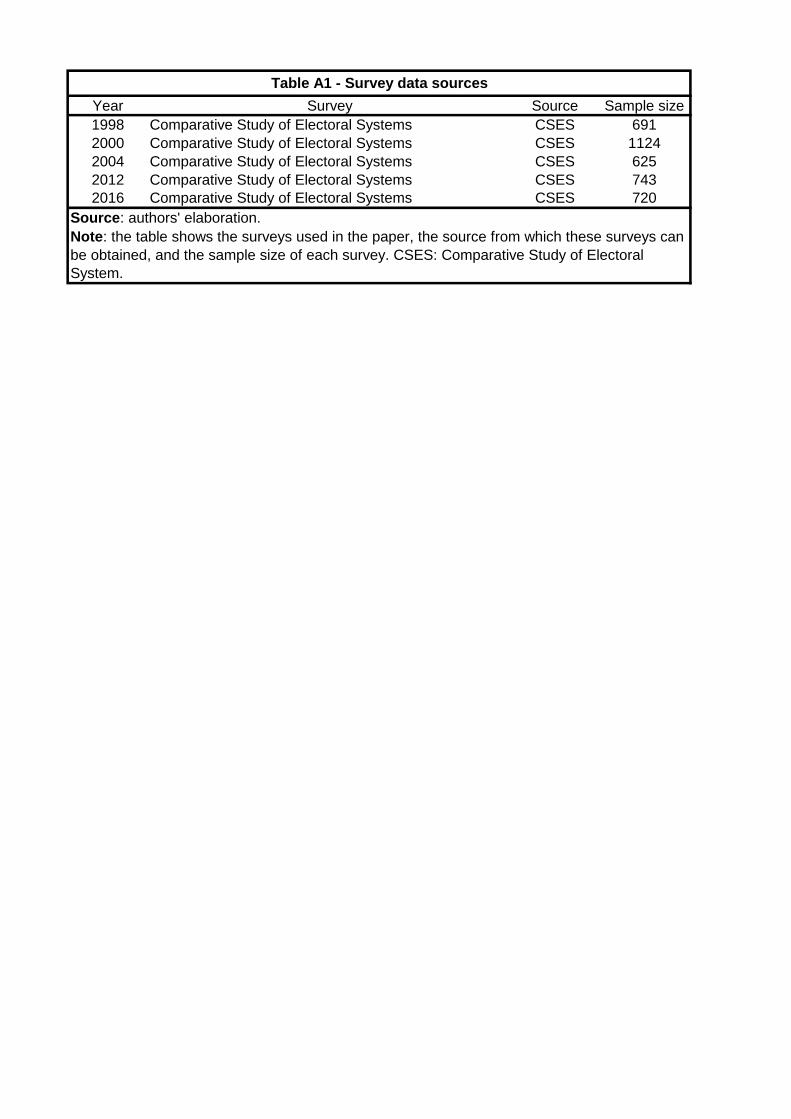
Year Survey Source Sample size
1998 Comparative Study of Electoral Systems CSES 691
2000 Comparative Study of Electoral Systems CSES 1124
2004 Comparative Study of Electoral Systems CSES 625
2012 Comparative Study of Electoral Systems CSES 743
2016 Comparative Study of Electoral Systems CSES 720
Table A1 - Survey data sources
Source: authors' elaboration.
Note: the table shows the surveys used in the paper, the source from which these surveys can
be obtained, and the sample size of each survey. CSES: Comparative Study of Electoral
System.
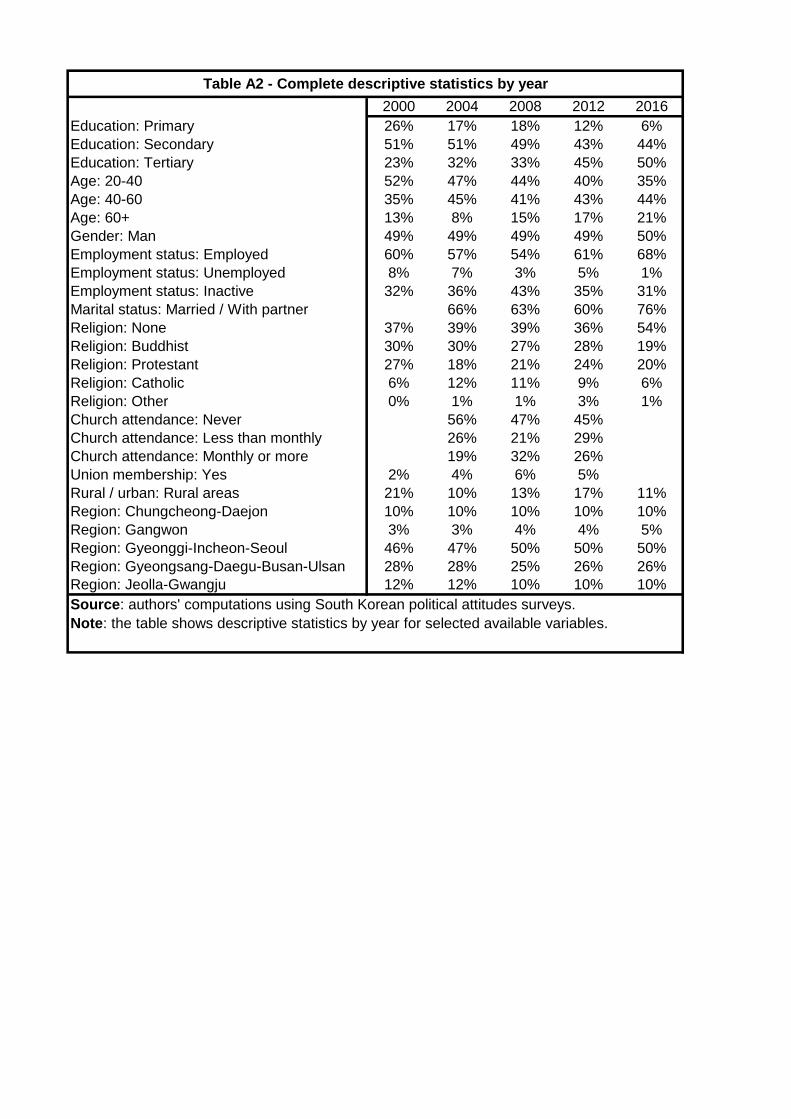
2000 2004 2008 2012 2016
Education: Primary 26% 17% 18% 12% 6%
Education: Secondary 51% 51% 49% 43% 44%
Education: Tertiary 23% 32% 33% 45% 50%
Age: 20-40 52% 47% 44% 40% 35%
Age: 40-60 35% 45% 41% 43% 44%
Age: 60+ 13% 8% 15% 17% 21%
Gender: Man 49% 49% 49% 49% 50%
Employment status: Employed 60% 57% 54% 61% 68%
Employment status: Unemployed 8% 7% 3% 5% 1%
Employment status: Inactive 32% 36% 43% 35% 31%
Marital status: Married / With partner 66% 63% 60% 76%
Religion: None 37% 39% 39% 36% 54%
Religion: Buddhist 30% 30% 27% 28% 19%
Religion: Protestant 27% 18% 21% 24% 20%
Religion: Catholic 6% 12% 11% 9% 6%
Religion: Other 0% 1% 1% 3% 1%
Church attendance: Never 56% 47% 45%
Church attendance: Less than monthly 26% 21% 29%
Church attendance: Monthly or more 19% 32% 26%
Union membership: Yes 2% 4% 6% 5%
Rural / urban: Rural areas 21% 10% 13% 17% 11%
Region: Chungcheong-Daejon 10% 10% 10% 10% 10%
Region: Gangwon 3% 3% 4% 4% 5%
Region: Gyeonggi-Incheon-Seoul 46% 47% 50% 50% 50%
Region: Gyeongsang-Daegu-Busan-Ulsan 28% 28% 25% 26% 26%
Region: Jeolla-Gwangju 12% 12% 10% 10% 10%
Source: authors' computations using South Korean political attitudes surveys.
Note: the table shows descriptive statistics by year for selected available variables.
Table A2 - Complete descriptive statistics by year
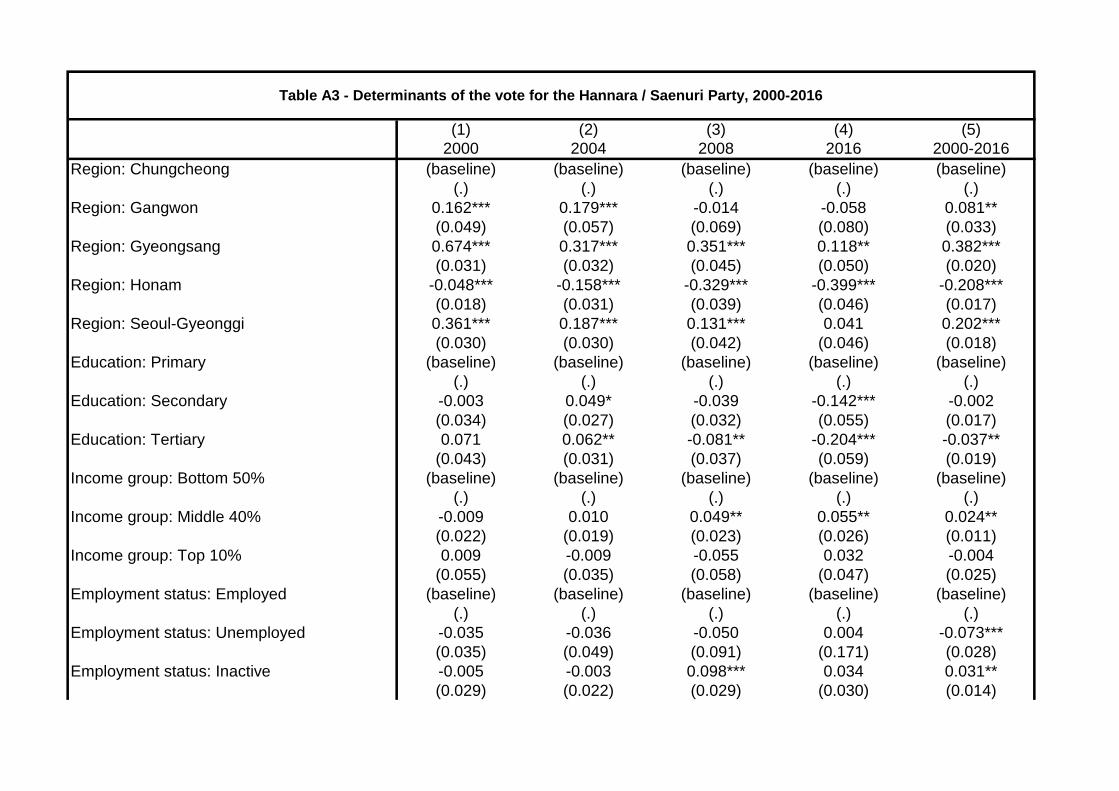
(1) (2) (3) (4) (5)
2000 2004 2008 2016 2000-2016
Region: Chungcheong (baseline) (baseline) (baseline) (baseline) (baseline)
(.) (.) (.) (.) (.)
Region: Gangwon 0.162*** 0.179*** -0.014 -0.058 0.081**
(0.049) (0.057) (0.069) (0.080) (0.033)
Region: Gyeongsang 0.674*** 0.317*** 0.351*** 0.118** 0.382***
(0.031) (0.032) (0.045) (0.050) (0.020)
Region: Honam -0.048*** -0.158*** -0.329*** -0.399*** -0.208***
(0.018) (0.031) (0.039) (0.046) (0.017)
Region: Seoul-Gyeonggi 0.361*** 0.187*** 0.131*** 0.041 0.202***
(0.030) (0.030) (0.042) (0.046) (0.018)
Education: Primary (baseline) (baseline) (baseline) (baseline) (baseline)
(.) (.) (.) (.) (.)
Education: Secondary -0.003 0.049* -0.039 -0.142*** -0.002
(0.034) (0.027) (0.032) (0.055) (0.017)
Education: Tertiary 0.071 0.062** -0.081** -0.204*** -0.037**
(0.043) (0.031) (0.037) (0.059) (0.019)
Income group: Bottom 50% (baseline) (baseline) (baseline) (baseline) (baseline)
(.) (.) (.) (.) (.)
Income group: Middle 40% -0.009 0.010 0.049** 0.055** 0.024**
(0.022) (0.019) (0.023) (0.026) (0.011)
Income group: Top 10% 0.009 -0.009 -0.055 0.032 -0.004
(0.055) (0.035) (0.058) (0.047) (0.025)
Employment status: Employed (baseline) (baseline) (baseline) (baseline) (baseline)
(.) (.) (.) (.) (.)
Employment status: Unemployed -0.035 -0.036 -0.050 0.004 -0.073***
(0.035) (0.049) (0.091) (0.171) (0.028)
Employment status: Inactive -0.005 -0.003 0.098*** 0.034 0.031**
(0.029) (0.022) (0.029) (0.030) (0.014)
Table A3 - Determinants of the vote for the Hannara / Saenuri Party, 2000-2016

Religion: None (baseline) (baseline) (baseline) (baseline) (baseline)
(.) (.) (.) (.) (.)
Religion: Buddhist 0.009 0.096*** 0.091*** 0.142*** 0.102***
(0.027) (0.024) (0.029) (0.034) (0.014)
Religion: Protestant -0.072** 0.040 0.033 -0.034 0.007
(0.029) (0.025) (0.033) (0.031) (0.015)
Religion: Catholic -0.015 0.043 -0.010 0.097* 0.031
(0.045) (0.030) (0.039) (0.052) (0.020)
Religion: Other 0.064 -0.057 -0.208*** -0.068
(0.092) (0.123) (0.072) (0.058)
Location: Rural -0.059* -0.073** -0.005 0.032 -0.018
(0.035) (0.032) (0.030) (0.040) (0.015)
Age: 20-40 (baseline) (baseline) (baseline) (baseline) (baseline)
(.) (.) (.) (.) (.)
Age: 40-60 -0.002 0.186*** 0.017 0.140*** 0.081***
(0.027) (0.025) (0.035) (0.035) (0.015)
Age: 60+ 0.040 0.384*** 0.002 0.273*** 0.184***
(0.039) (0.039) (0.046) (0.044) (0.020)
Gender: Man -0.039 -0.011 -0.005 -0.053** -0.016
(0.025) (0.019) (0.025) (0.027) (0.012)
Marital status: Married / Partner 0.046** 0.081** 0.035 0.036***
(0.023) (0.032) (0.037) (0.013)
Union membership: Yes 0.128** -0.042 -0.153*** -0.038
(0.051) (0.042) (0.041) (0.026)
Constant 0.084* -0.079* 0.244*** 0.335*** 0.096***
(0.044) (0.045) (0.056) (0.071) (0.025)
R-squared 0.28 0.20 0.22 0.21 0.18
* p<0.10, ** p<0.05, *** p<0.01
Source: authors' computations using South Korean political attitudes surveys.
Note: the table shows the results of a multivariate regression assessing the determinants of support for the Hannara / Saenuri Party by
year, and over the entire period studied. 2012 is excluded since the income variable was not available.
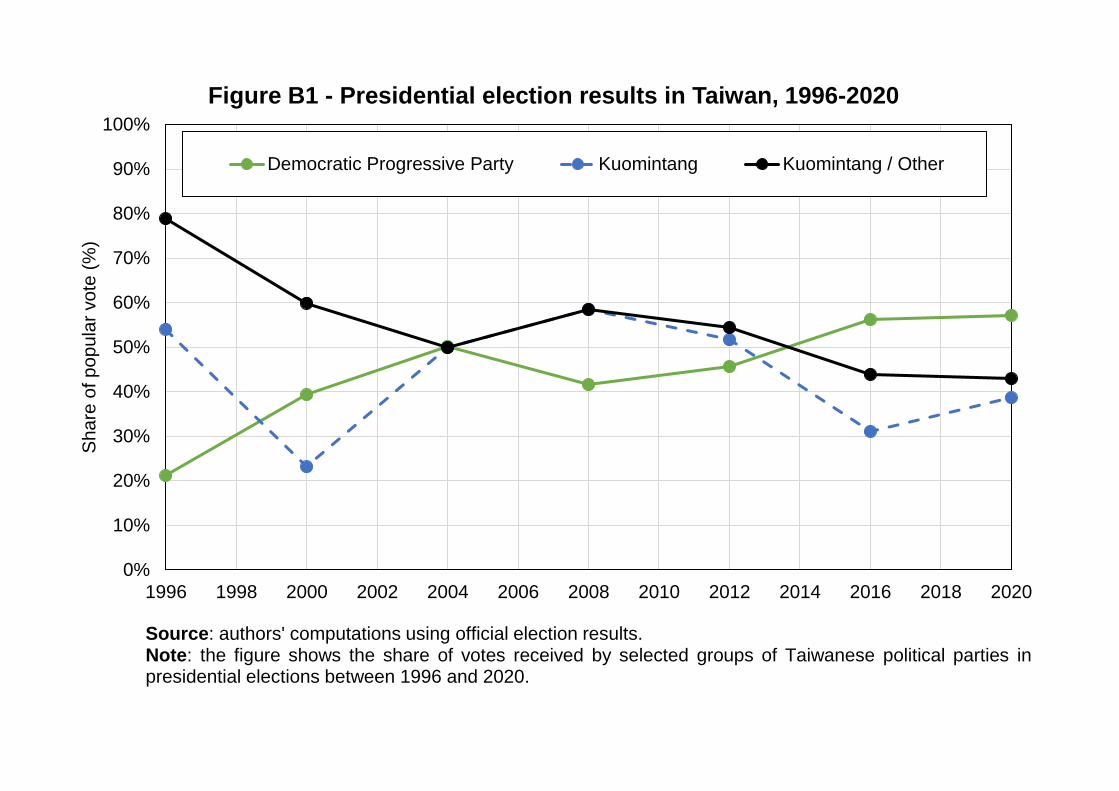
0%
10%
20%
30%
40%
50%
60%
70%
80%
90%
100%
1996 1998 2000 2002 2004 2006 2008 2010 2012 2014 2016 2018 2020
Sh
are
of p
op
ula
r vo
te (
%)
Figure B1 - Presidential election results in Taiwan, 1996-2020
Democratic Progressive Party Kuomintang Kuomintang / Other
Source: authors' computations using official election results.Note: the figure shows the share of votes received by selected groups of Taiwanese political parties inpresidential elections between 1996 and 2020.
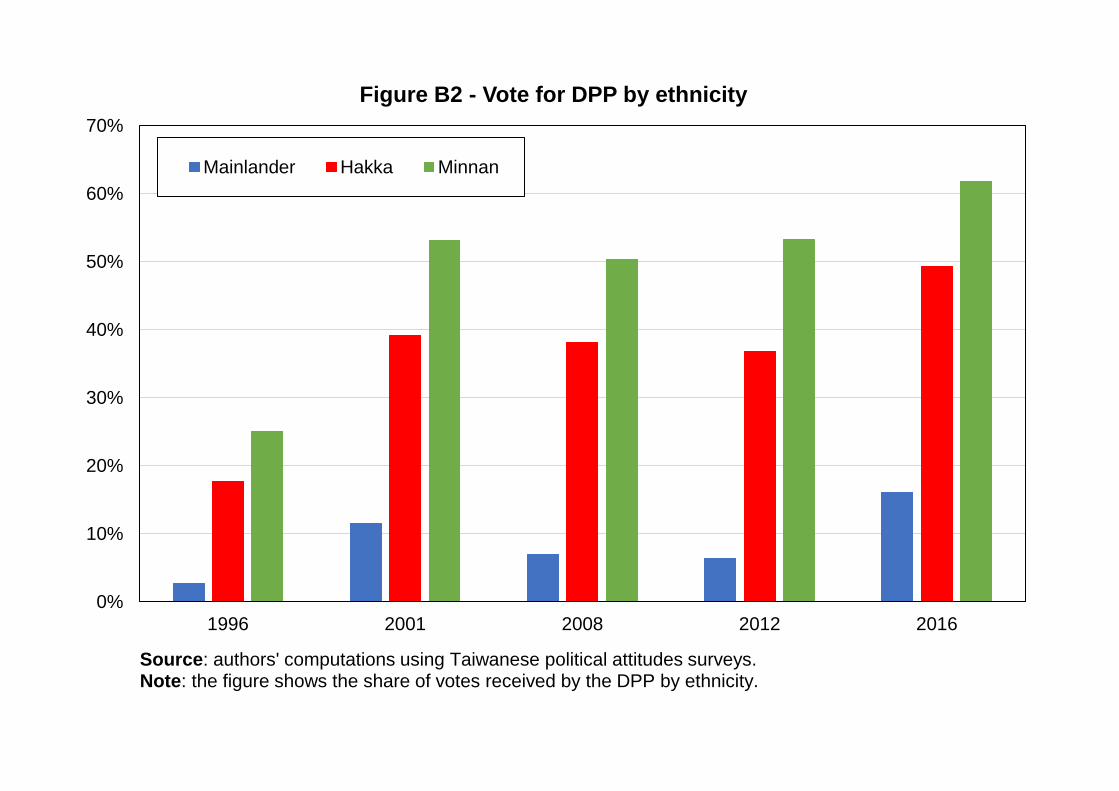
0%
10%
20%
30%
40%
50%
60%
70%
1996 2001 2008 2012 2016
Figure B2 - Vote for DPP by ethnicity
Mainlander Hakka Minnan
Source: authors' computations using Taiwanese political attitudes surveys.Note: the figure shows the share of votes received by the DPP by ethnicity.
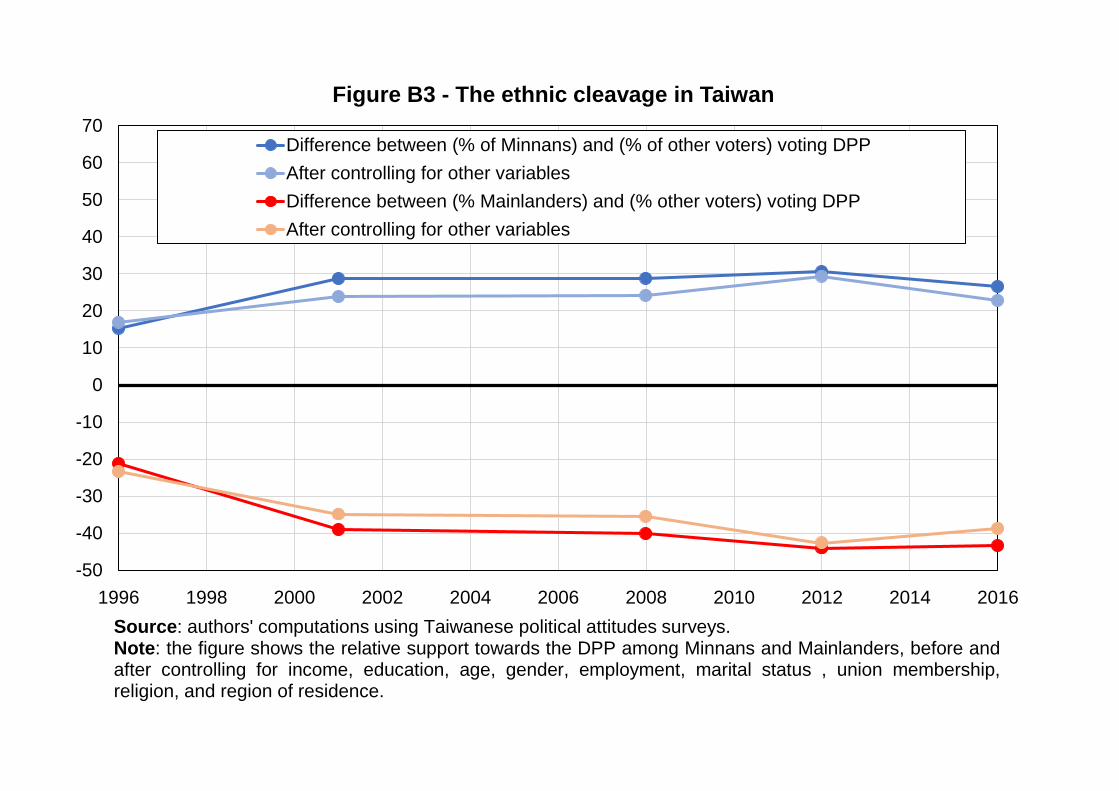
-50
-40
-30
-20
-10
0
10
20
30
40
50
60
70
1996 1998 2000 2002 2004 2006 2008 2010 2012 2014 2016
Figure B3 - The ethnic cleavage in Taiwan
Difference between (% of Minnans) and (% of other voters) voting DPP
After controlling for other variables
Difference between (% Mainlanders) and (% other voters) voting DPP
After controlling for other variables
Source: authors' computations using Taiwanese political attitudes surveys.Note: the figure shows the relative support towards the DPP among Minnans and Mainlanders, before andafter controlling for income, education, age, gender, employment, marital status , union membership,religion, and region of residence.
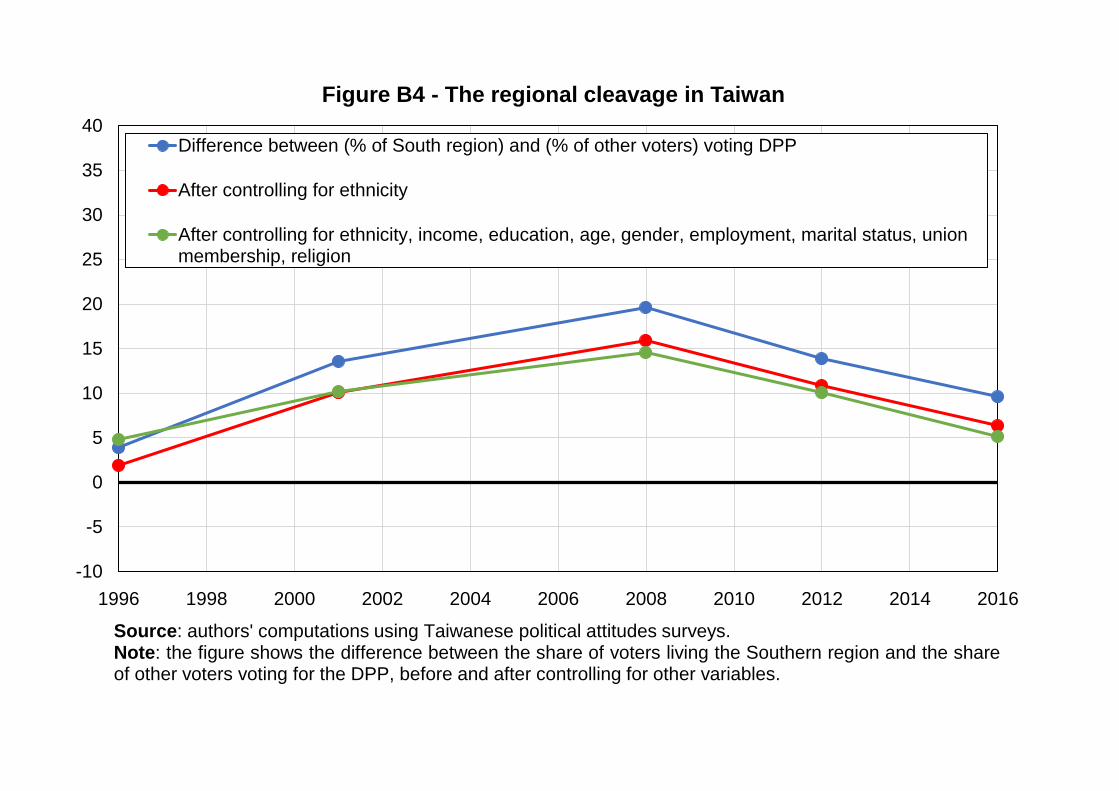
-10
-5
0
5
10
15
20
25
30
35
40
1996 1998 2000 2002 2004 2006 2008 2010 2012 2014 2016
Figure B4 - The regional cleavage in Taiwan
Difference between (% of South region) and (% of other voters) voting DPP
After controlling for ethnicity
After controlling for ethnicity, income, education, age, gender, employment, marital status, unionmembership, religion
Source: authors' computations using Taiwanese political attitudes surveys.Note: the figure shows the difference between the share of voters living the Southern region and the shareof other voters voting for the DPP, before and after controlling for other variables.
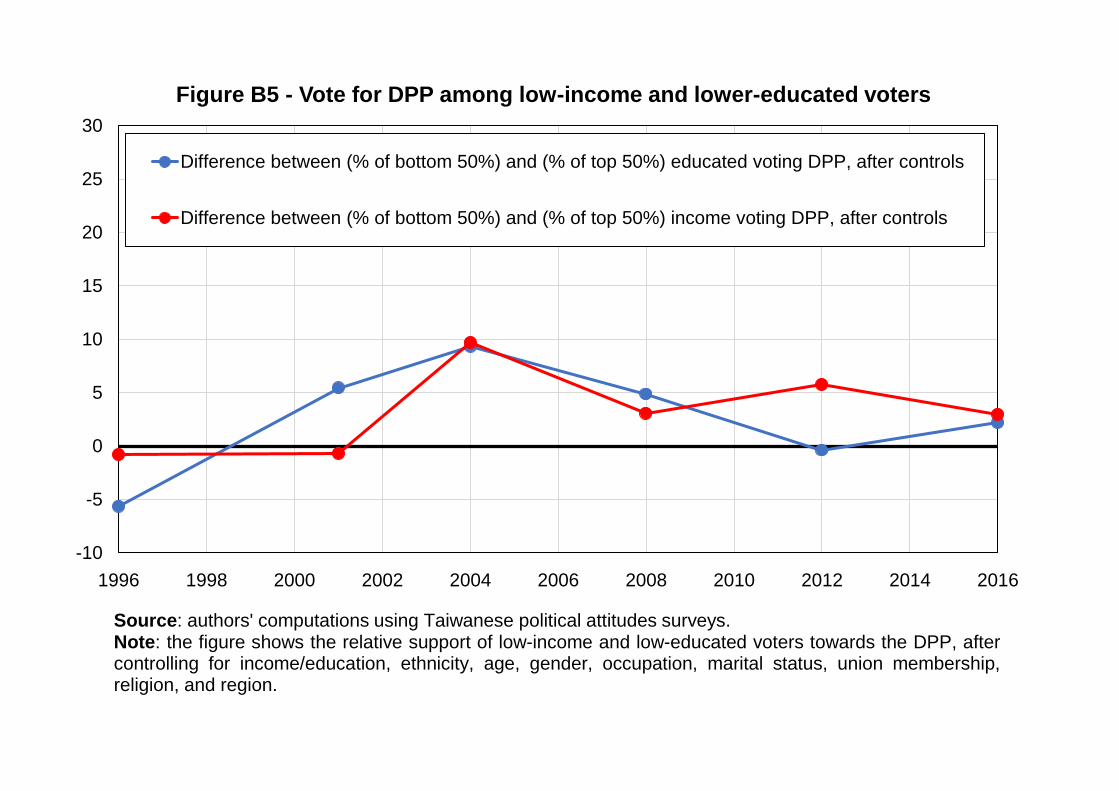
-10
-5
0
5
10
15
20
25
30
1996 1998 2000 2002 2004 2006 2008 2010 2012 2014 2016
Figure B5 - Vote for DPP among low-income and lower-educated voters
Difference between (% of bottom 50%) and (% of top 50%) educated voting DPP, after controls
Difference between (% of bottom 50%) and (% of top 50%) income voting DPP, after controls
Source: authors' computations using Taiwanese political attitudes surveys.Note: the figure shows the relative support of low-income and low-educated voters towards the DPP, aftercontrolling for income/education, ethnicity, age, gender, occupation, marital status, union membership,religion, and region.
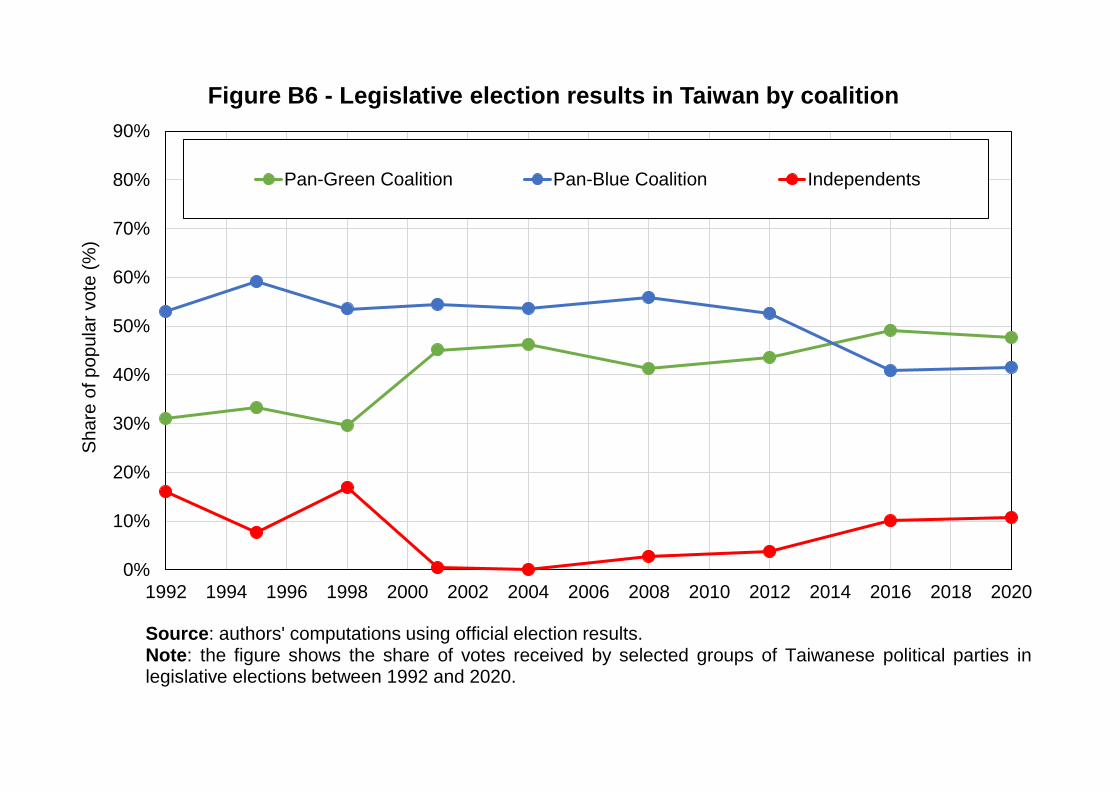
0%
10%
20%
30%
40%
50%
60%
70%
80%
90%
1992 1994 1996 1998 2000 2002 2004 2006 2008 2010 2012 2014 2016 2018 2020
Sh
are
of p
op
ula
r vo
te (
%)
Figure B6 - Legislative election results in Taiwan by coalition
Pan-Green Coalition Pan-Blue Coalition Independents
Source: authors' computations using official election results.Note: the figure shows the share of votes received by selected groups of Taiwanese political parties inlegislative elections between 1992 and 2020.
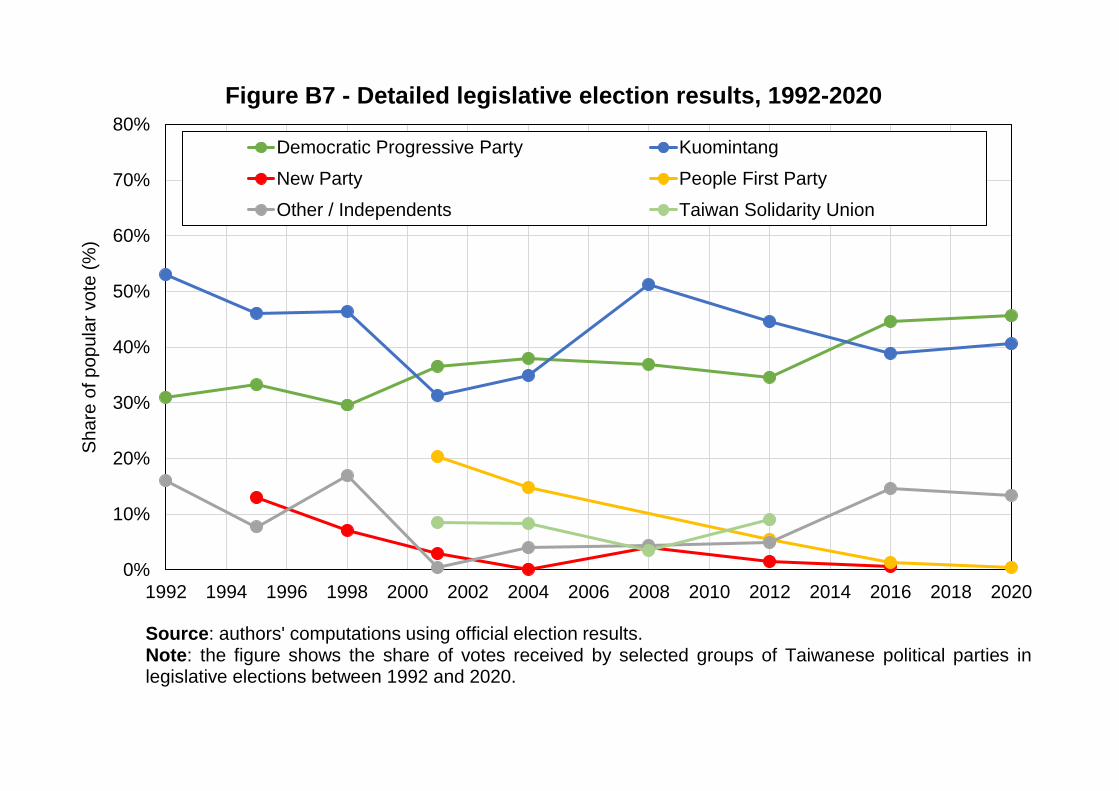
0%
10%
20%
30%
40%
50%
60%
70%
80%
1992 1994 1996 1998 2000 2002 2004 2006 2008 2010 2012 2014 2016 2018 2020
Sh
are
of p
op
ula
r vo
te (
%)
Figure B7 - Detailed legislative election results, 1992-2020
Democratic Progressive Party Kuomintang
New Party People First Party
Other / Independents Taiwan Solidarity Union
Source: authors' computations using official election results.Note: the figure shows the share of votes received by selected groups of Taiwanese political parties inlegislative elections between 1992 and 2020.
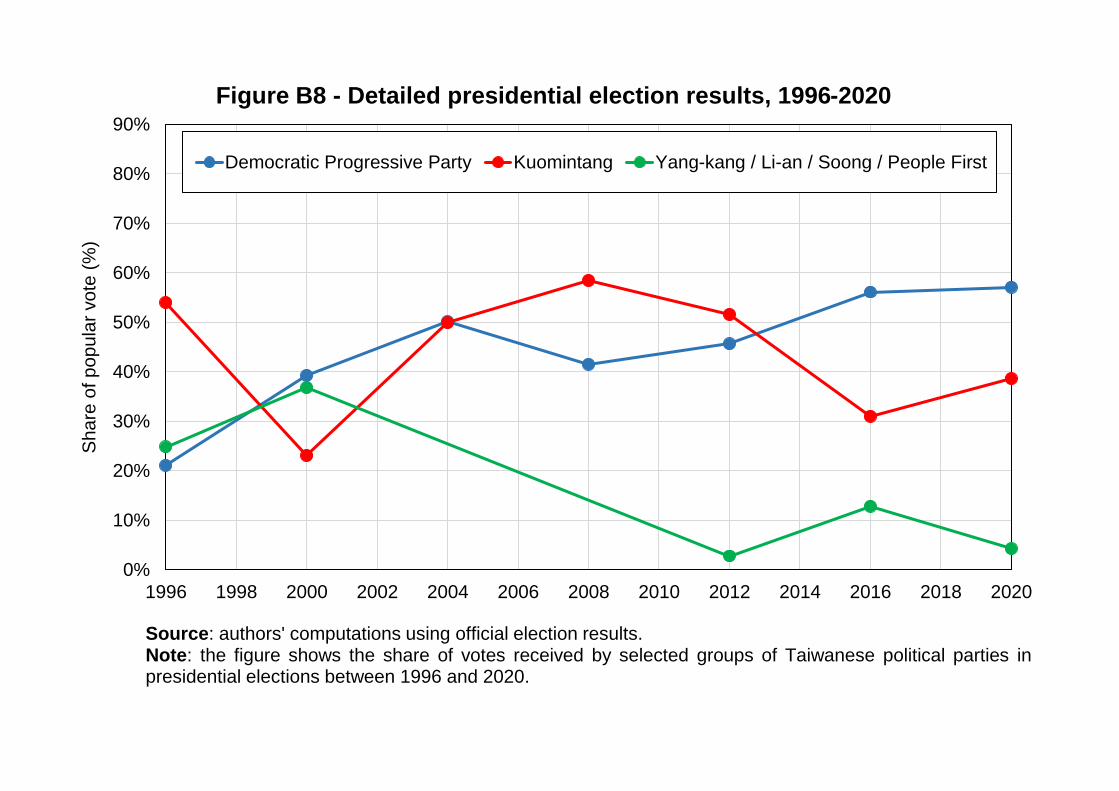
0%
10%
20%
30%
40%
50%
60%
70%
80%
90%
1996 1998 2000 2002 2004 2006 2008 2010 2012 2014 2016 2018 2020
Sh
are
of p
op
ula
r vo
te (
%)
Figure B8 - Detailed presidential election results, 1996-2020
Democratic Progressive Party Kuomintang Yang-kang / Li-an / Soong / People First
Source: authors' computations using official election results.Note: the figure shows the share of votes received by selected groups of Taiwanese political parties inpresidential elections between 1996 and 2020.
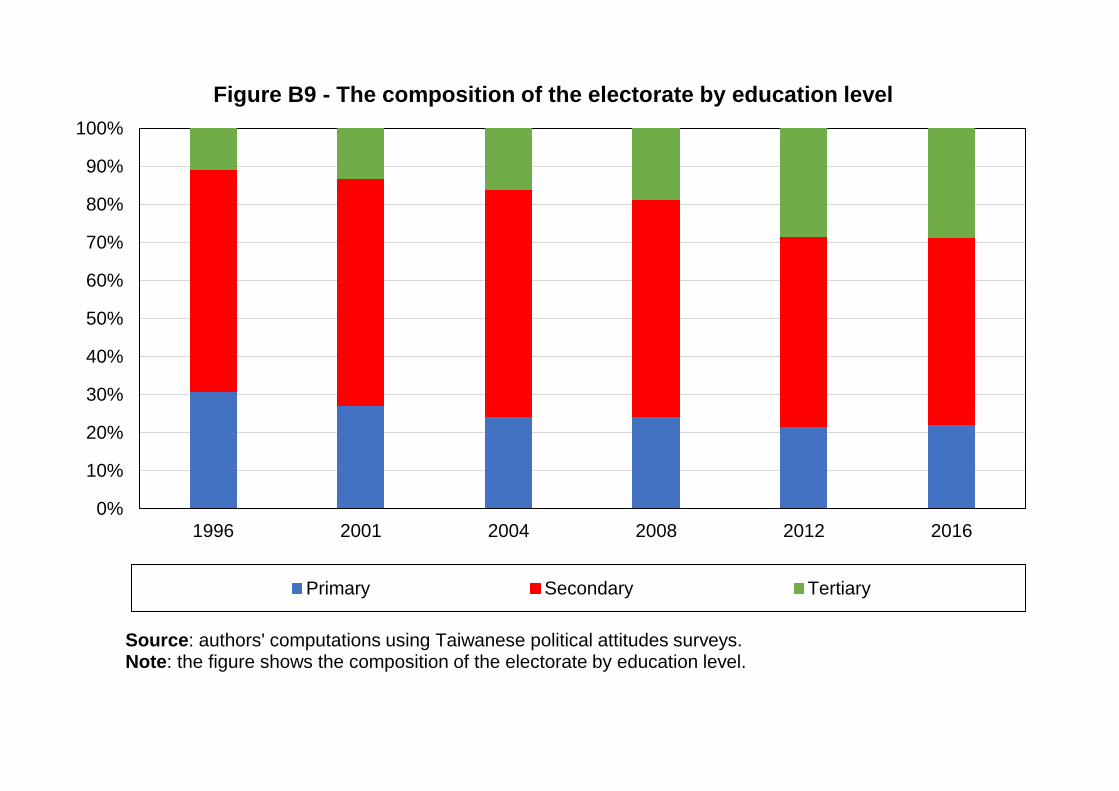
0%
10%
20%
30%
40%
50%
60%
70%
80%
90%
100%
1996 2001 2004 2008 2012 2016
Figure B9 - The composition of the electorate by education level
Primary Secondary Tertiary
Source: authors' computations using Taiwanese political attitudes surveys.Note: the figure shows the composition of the electorate by education level.
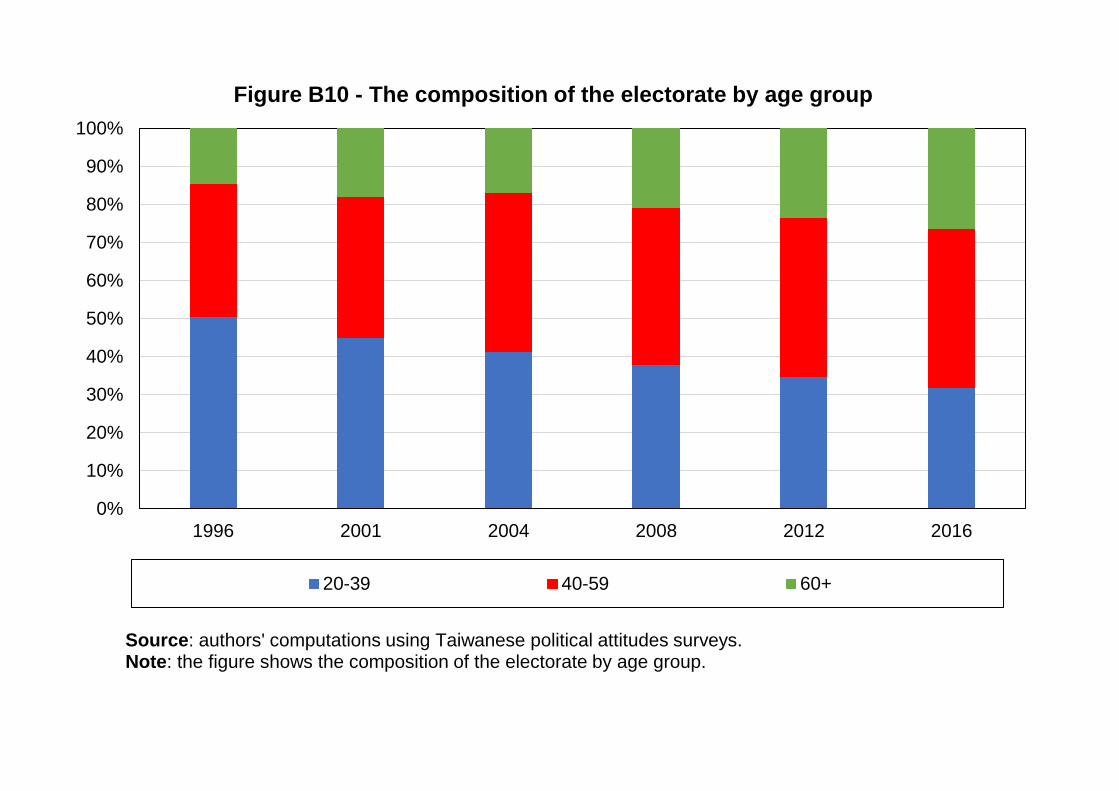
0%
10%
20%
30%
40%
50%
60%
70%
80%
90%
100%
1996 2001 2004 2008 2012 2016
Figure B10 - The composition of the electorate by age group
20-39 40-59 60+
Source: authors' computations using Taiwanese political attitudes surveys.Note: the figure shows the composition of the electorate by age group.
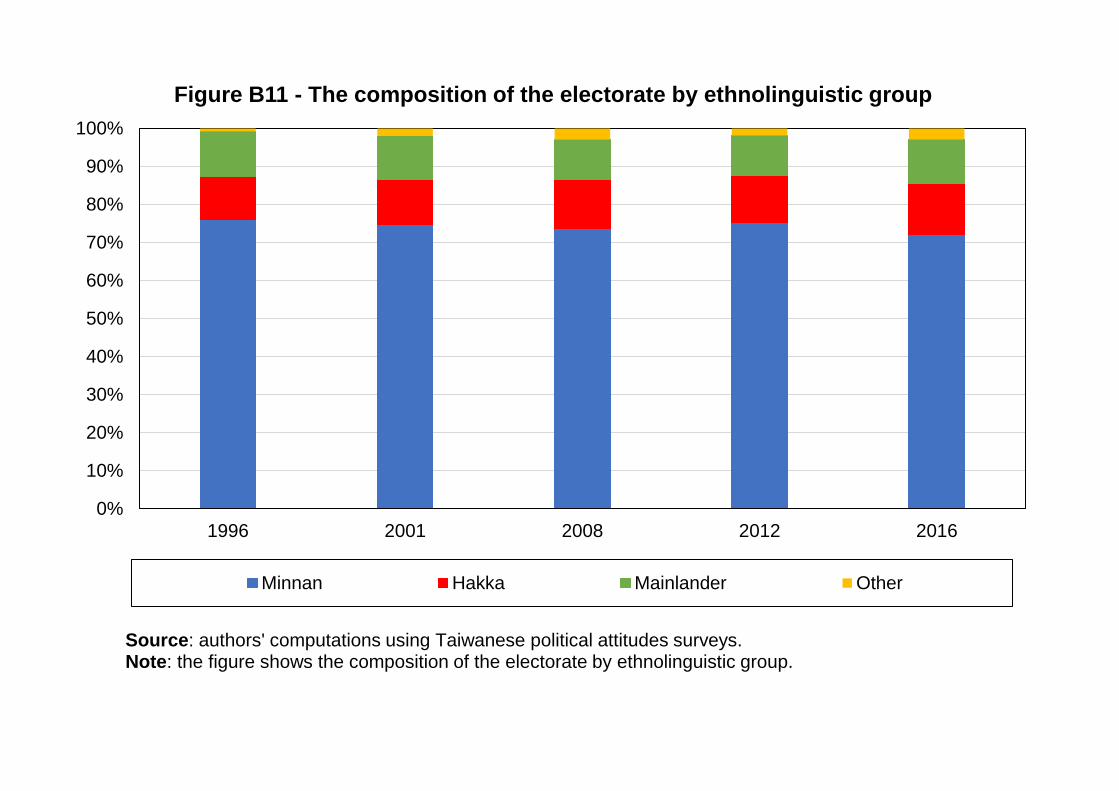
0%
10%
20%
30%
40%
50%
60%
70%
80%
90%
100%
1996 2001 2008 2012 2016
Figure B11 - The composition of the electorate by ethnolinguistic group
Minnan Hakka Mainlander Other
Source: authors' computations using Taiwanese political attitudes surveys.Note: the figure shows the composition of the electorate by ethnolinguistic group.
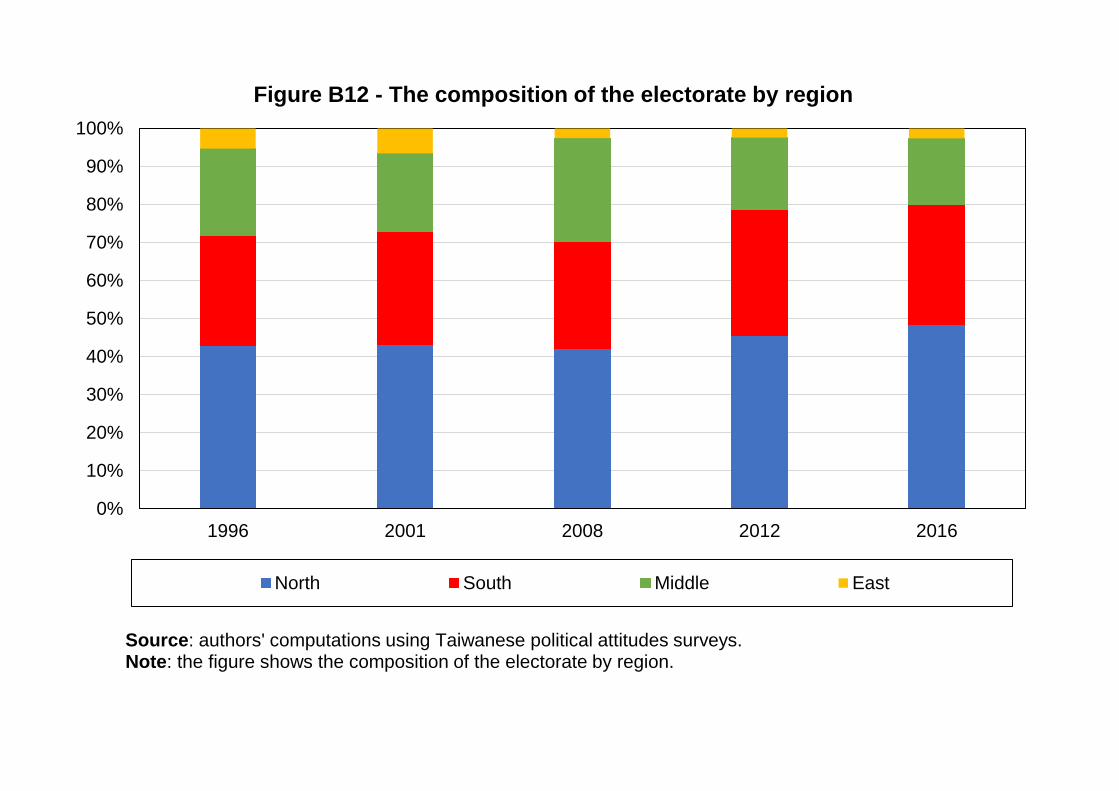
0%
10%
20%
30%
40%
50%
60%
70%
80%
90%
100%
1996 2001 2008 2012 2016
Figure B12 - The composition of the electorate by region
North South Middle East
Source: authors' computations using Taiwanese political attitudes surveys.Note: the figure shows the composition of the electorate by region.
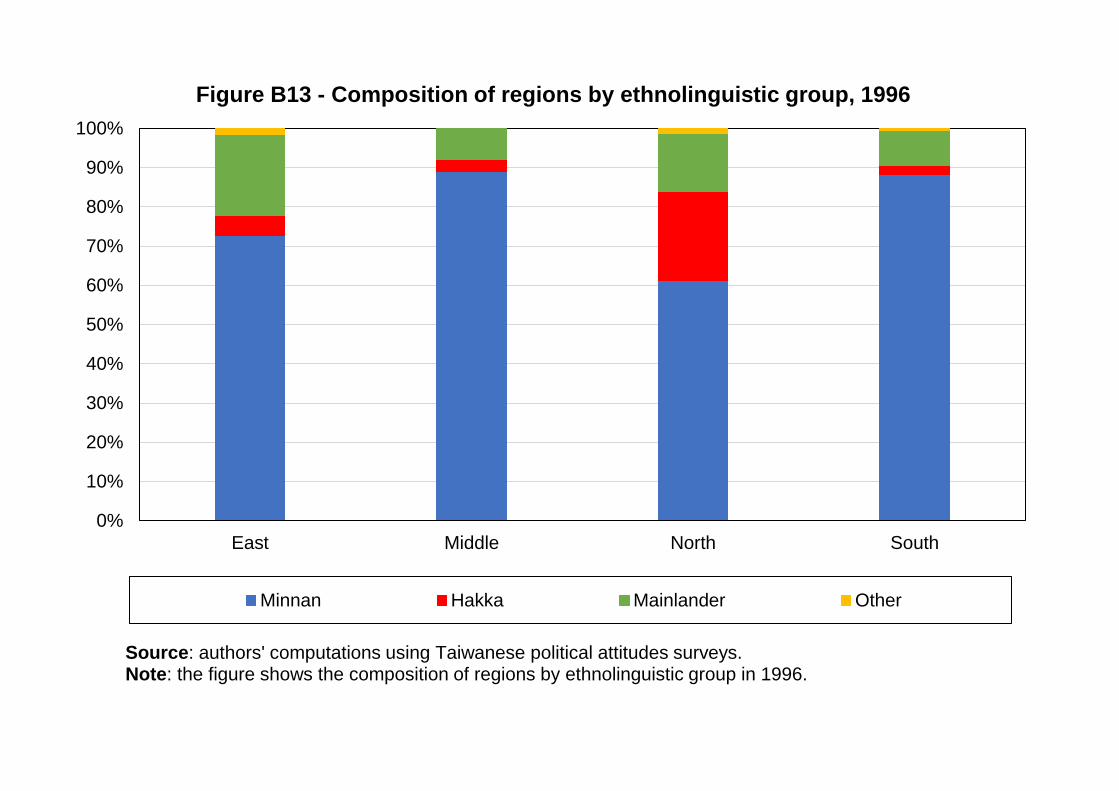
0%
10%
20%
30%
40%
50%
60%
70%
80%
90%
100%
East Middle North South
Figure B13 - Composition of regions by ethnolinguistic group, 1996
Minnan Hakka Mainlander Other
Source: authors' computations using Taiwanese political attitudes surveys.Note: the figure shows the composition of regions by ethnolinguistic group in 1996.
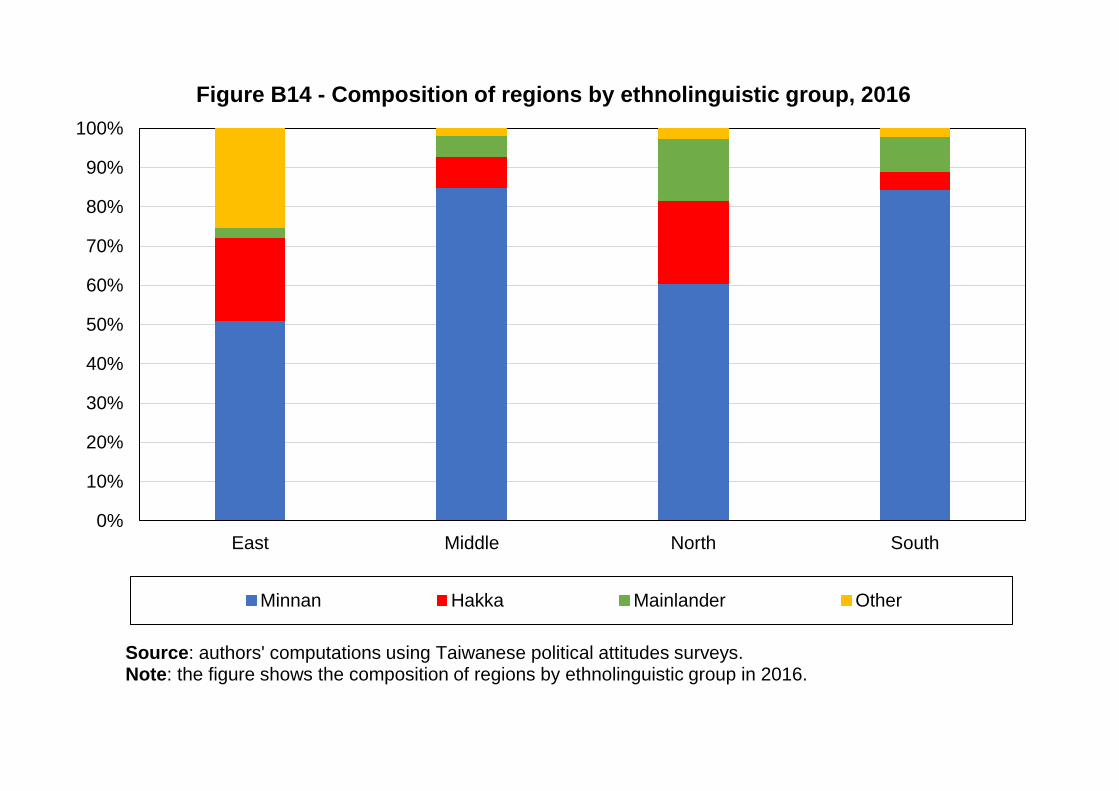
0%
10%
20%
30%
40%
50%
60%
70%
80%
90%
100%
East Middle North South
Figure B14 - Composition of regions by ethnolinguistic group, 2016
Minnan Hakka Mainlander Other
Source: authors' computations using Taiwanese political attitudes surveys.Note: the figure shows the composition of regions by ethnolinguistic group in 2016.
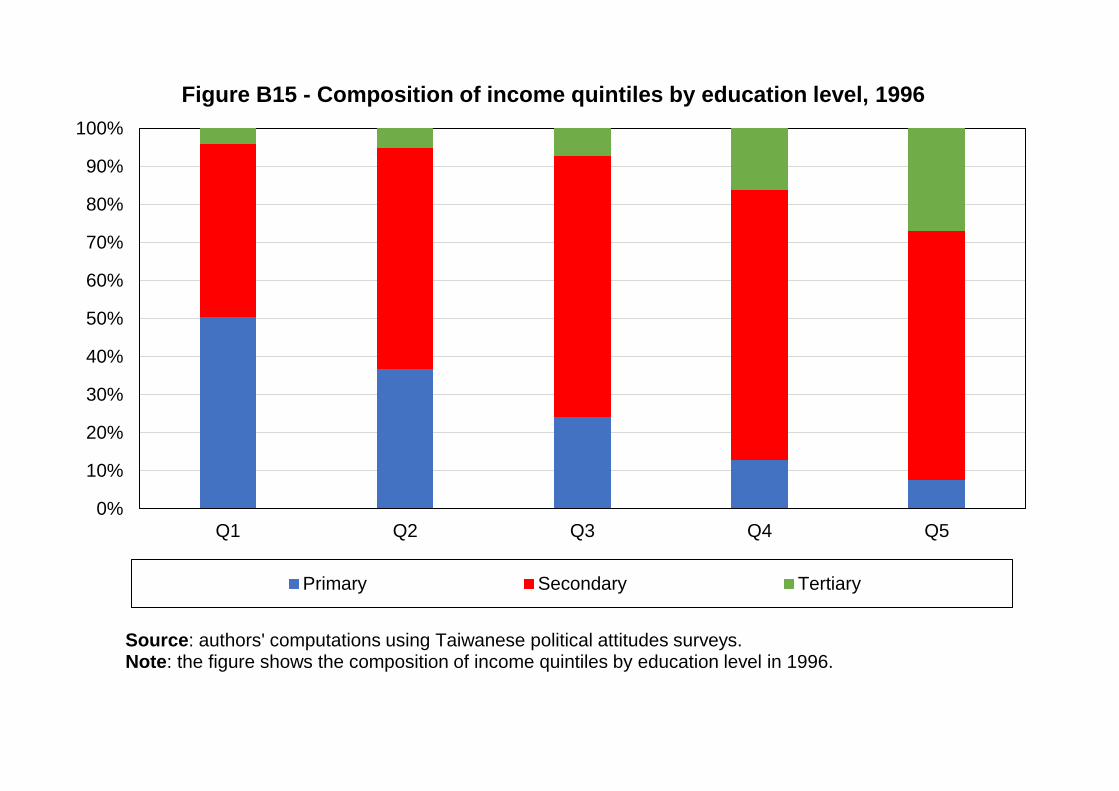
0%
10%
20%
30%
40%
50%
60%
70%
80%
90%
100%
Q1 Q2 Q3 Q4 Q5
Figure B15 - Composition of income quintiles by education level, 1996
Primary Secondary Tertiary
Source: authors' computations using Taiwanese political attitudes surveys.Note: the figure shows the composition of income quintiles by education level in 1996.
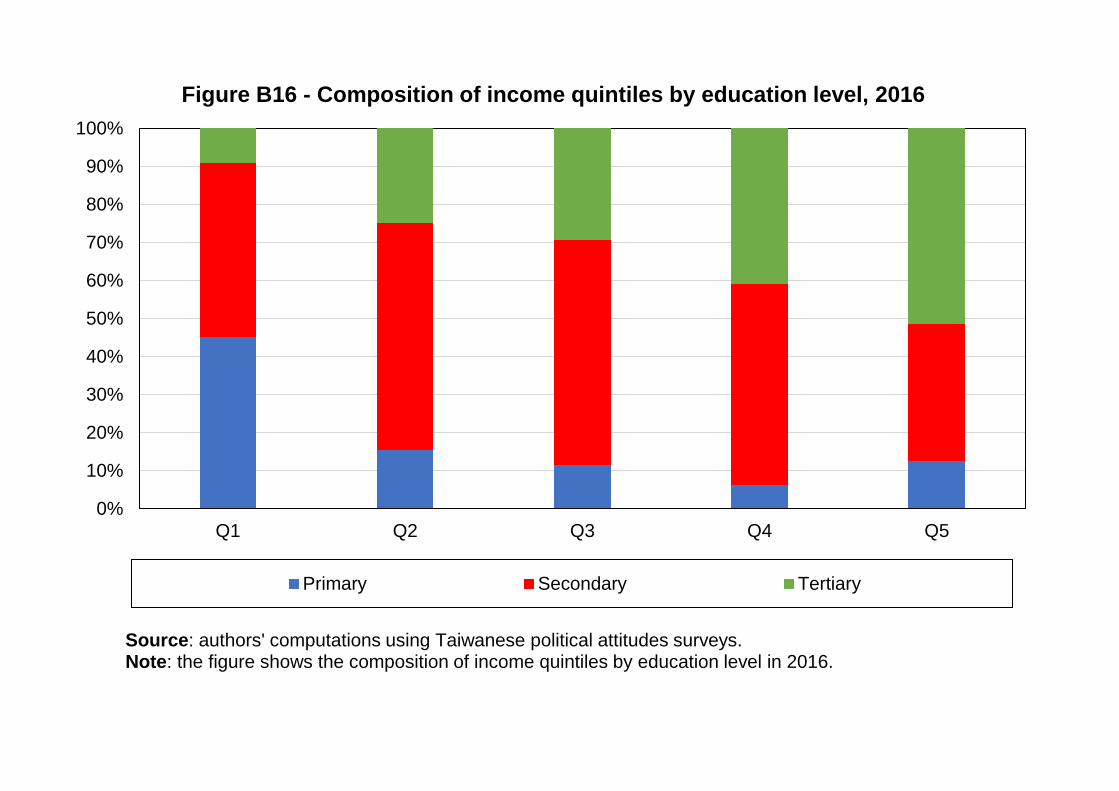
0%
10%
20%
30%
40%
50%
60%
70%
80%
90%
100%
Q1 Q2 Q3 Q4 Q5
Figure B16 - Composition of income quintiles by education level, 2016
Primary Secondary Tertiary
Source: authors' computations using Taiwanese political attitudes surveys.Note: the figure shows the composition of income quintiles by education level in 2016.
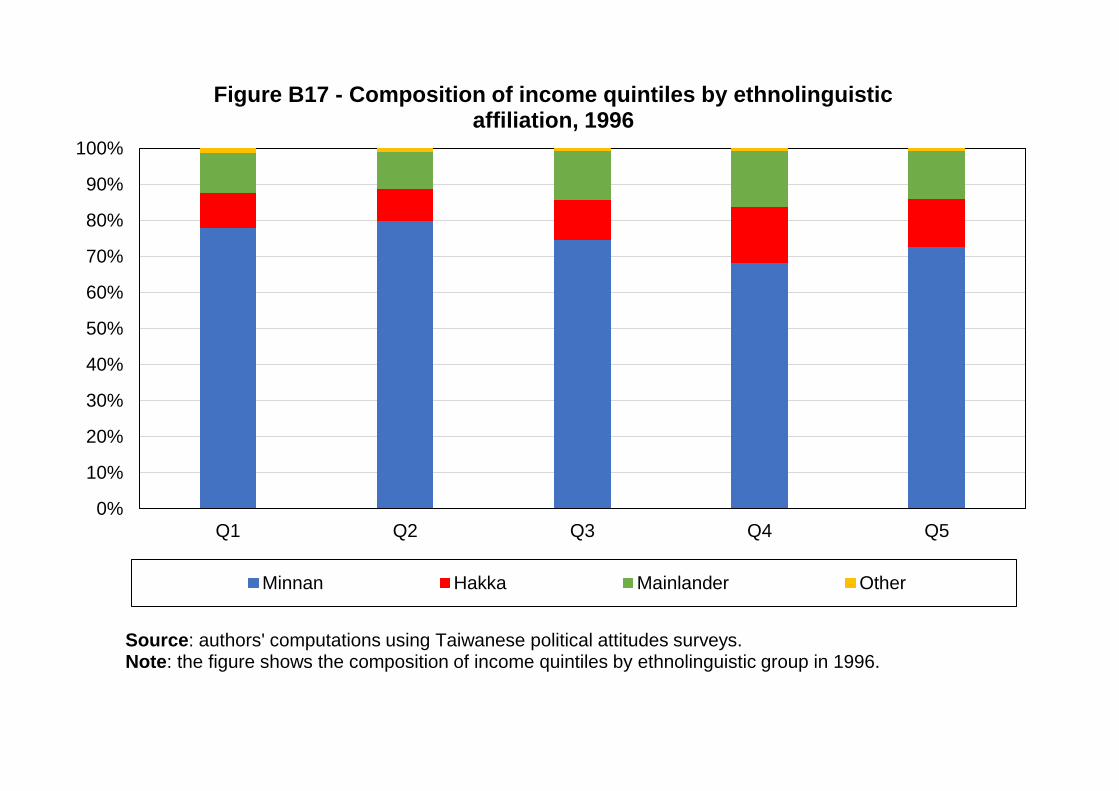
0%
10%
20%
30%
40%
50%
60%
70%
80%
90%
100%
Q1 Q2 Q3 Q4 Q5
Figure B17 - Composition of income quintiles by ethnolinguistic affiliation, 1996
Minnan Hakka Mainlander Other
Source: authors' computations using Taiwanese political attitudes surveys.Note: the figure shows the composition of income quintiles by ethnolinguistic group in 1996.
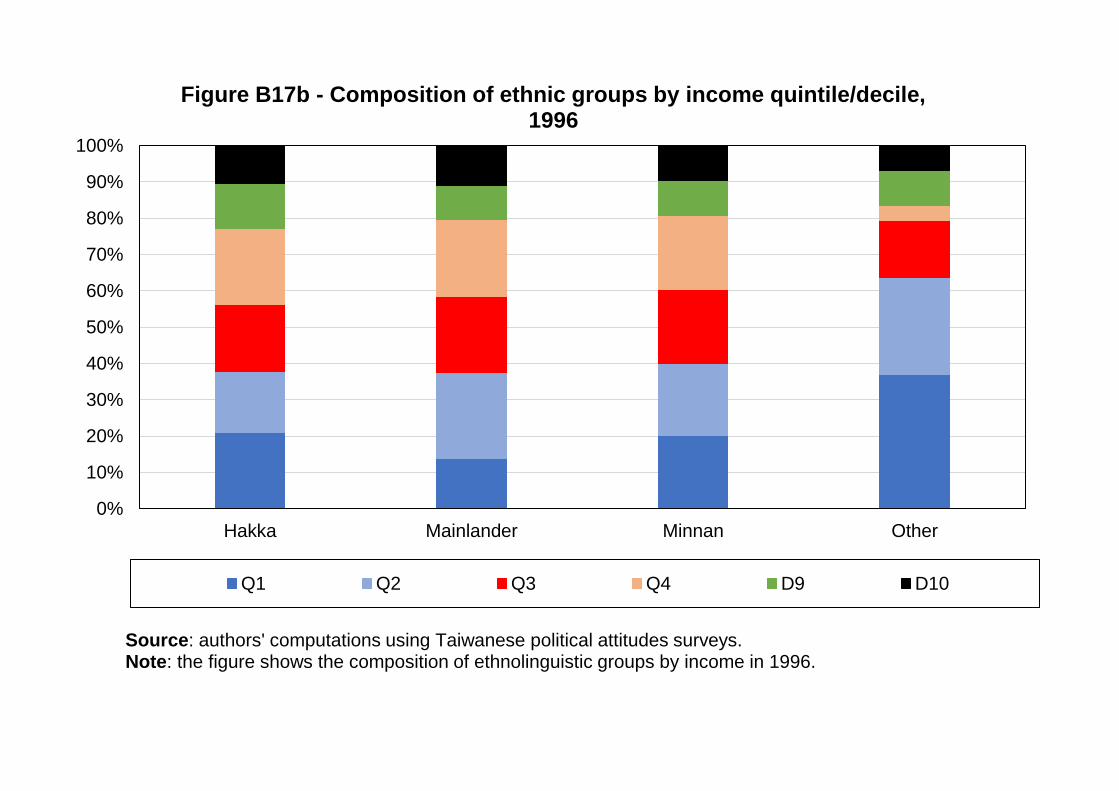
0%
10%
20%
30%
40%
50%
60%
70%
80%
90%
100%
Hakka Mainlander Minnan Other
Figure B17b - Composition of ethnic groups by income quintile/decile, 1996
Q1 Q2 Q3 Q4 D9 D10
Source: authors' computations using Taiwanese political attitudes surveys.Note: the figure shows the composition of ethnolinguistic groups by income in 1996.
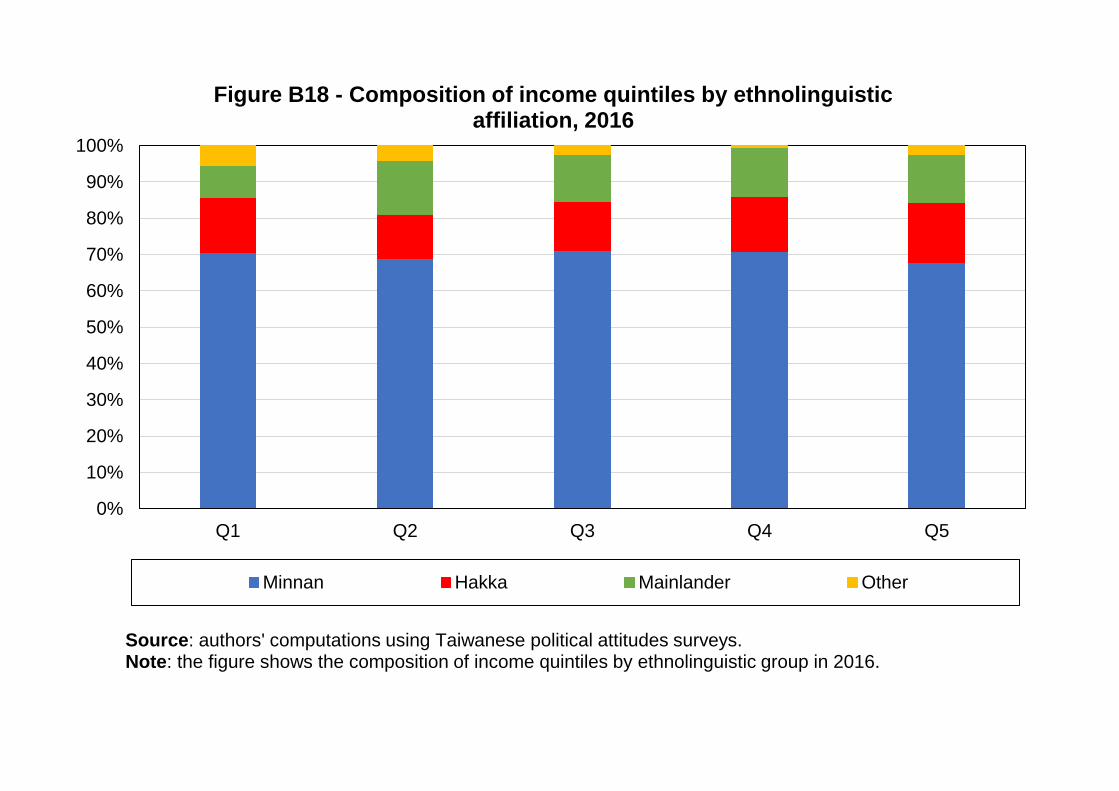
0%
10%
20%
30%
40%
50%
60%
70%
80%
90%
100%
Q1 Q2 Q3 Q4 Q5
Figure B18 - Composition of income quintiles by ethnolinguistic affiliation, 2016
Minnan Hakka Mainlander Other
Source: authors' computations using Taiwanese political attitudes surveys.Note: the figure shows the composition of income quintiles by ethnolinguistic group in 2016.
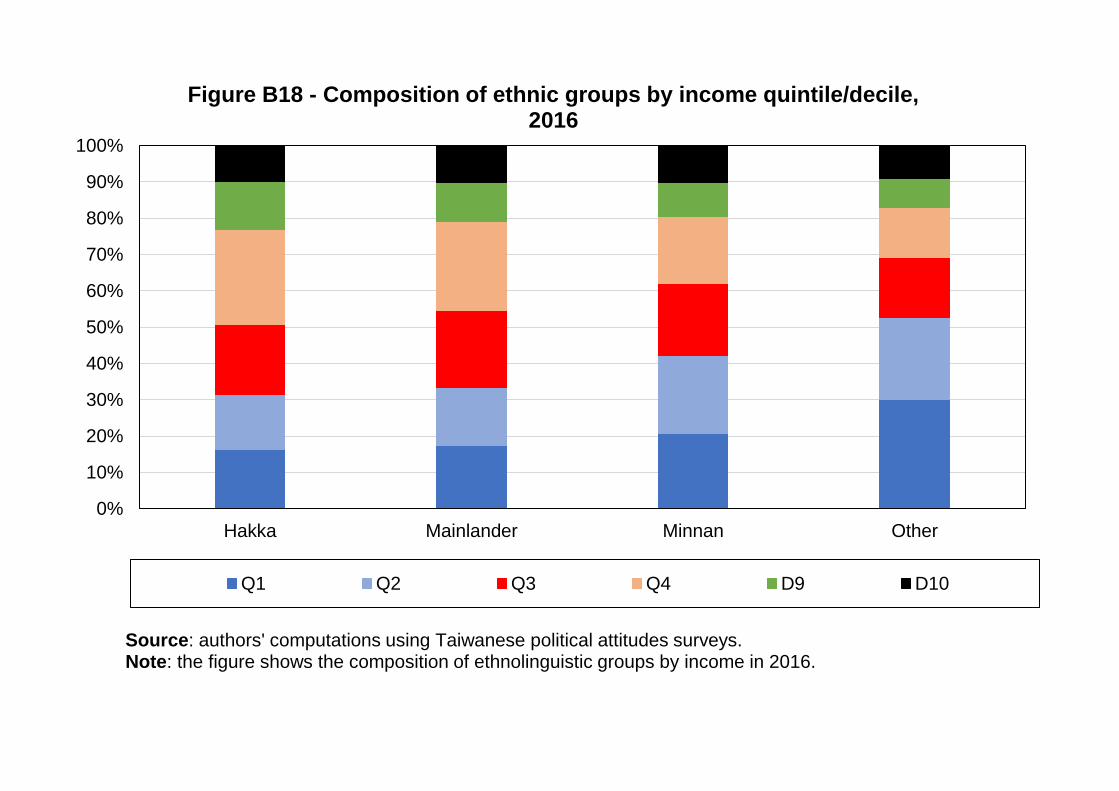
0%
10%
20%
30%
40%
50%
60%
70%
80%
90%
100%
Hakka Mainlander Minnan Other
Figure B18 - Composition of ethnic groups by income quintile/decile, 2016
Q1 Q2 Q3 Q4 D9 D10
Source: authors' computations using Taiwanese political attitudes surveys.Note: the figure shows the composition of ethnolinguistic groups by income in 2016.
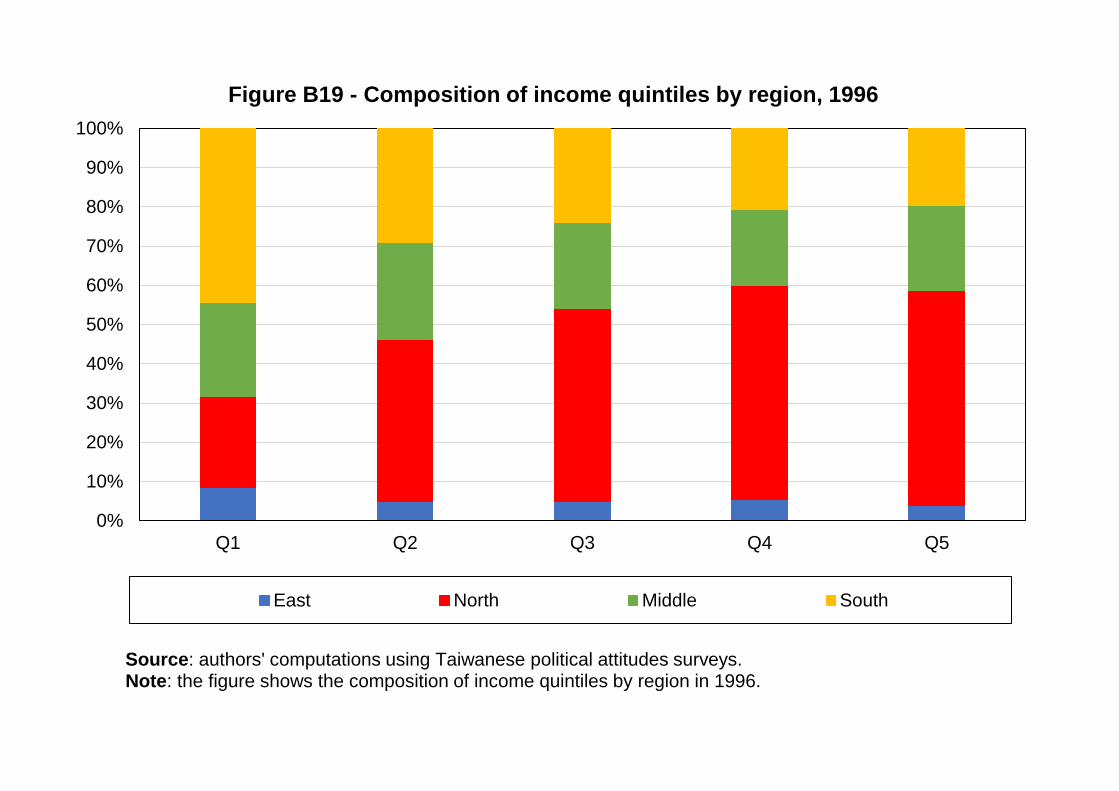
0%
10%
20%
30%
40%
50%
60%
70%
80%
90%
100%
Q1 Q2 Q3 Q4 Q5
Figure B19 - Composition of income quintiles by region, 1996
East North Middle South
Source: authors' computations using Taiwanese political attitudes surveys.Note: the figure shows the composition of income quintiles by region in 1996.
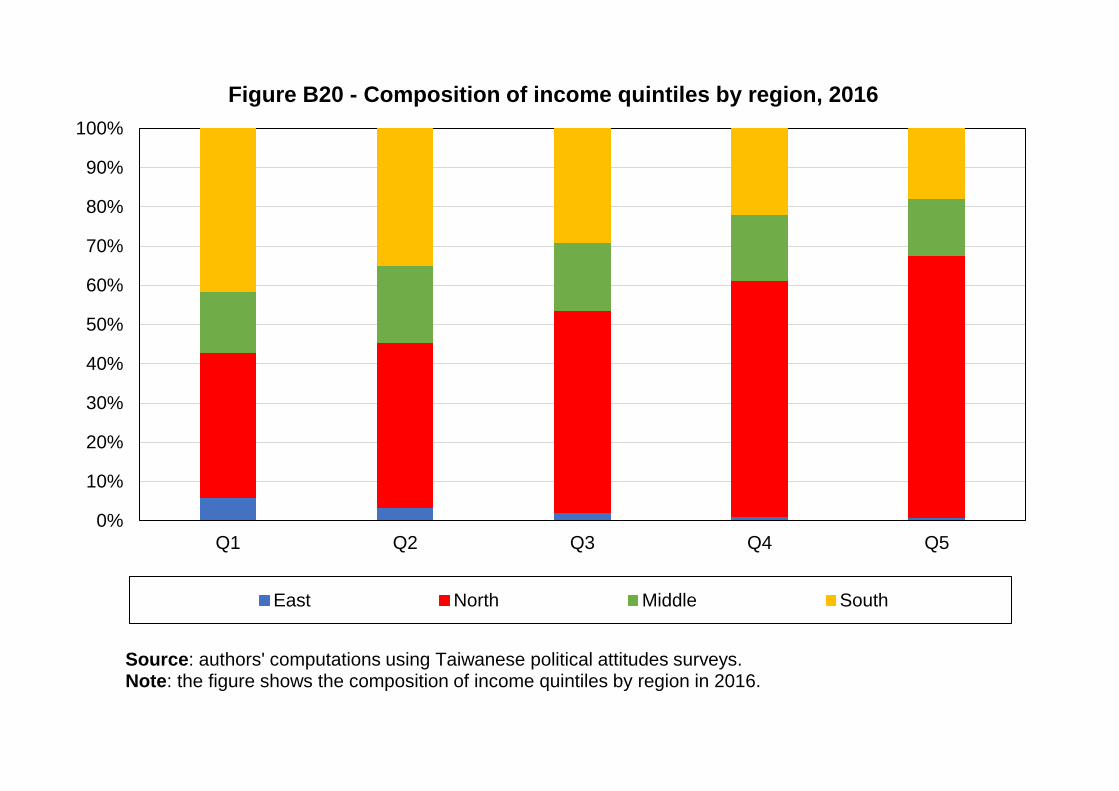
0%
10%
20%
30%
40%
50%
60%
70%
80%
90%
100%
Q1 Q2 Q3 Q4 Q5
Figure B20 - Composition of income quintiles by region, 2016
East North Middle South
Source: authors' computations using Taiwanese political attitudes surveys.Note: the figure shows the composition of income quintiles by region in 2016.
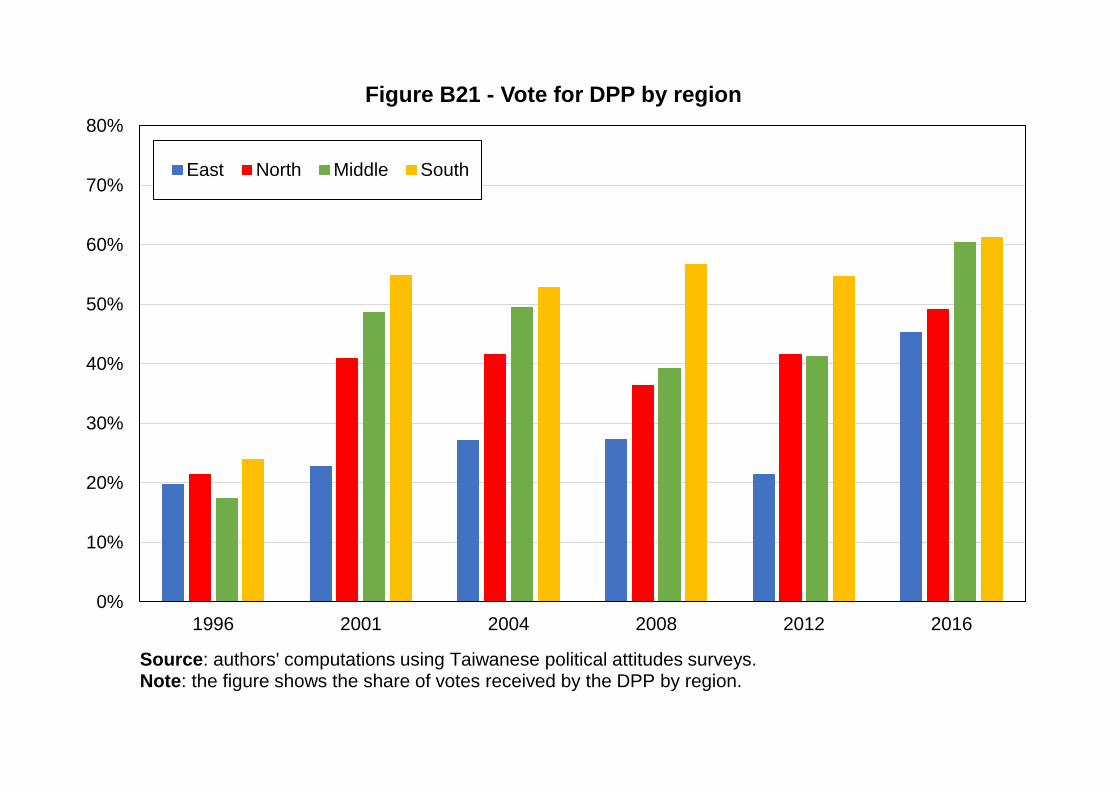
0%
10%
20%
30%
40%
50%
60%
70%
80%
1996 2001 2004 2008 2012 2016
Figure B21 - Vote for DPP by region
East North Middle South
Source: authors' computations using Taiwanese political attitudes surveys.Note: the figure shows the share of votes received by the DPP by region.
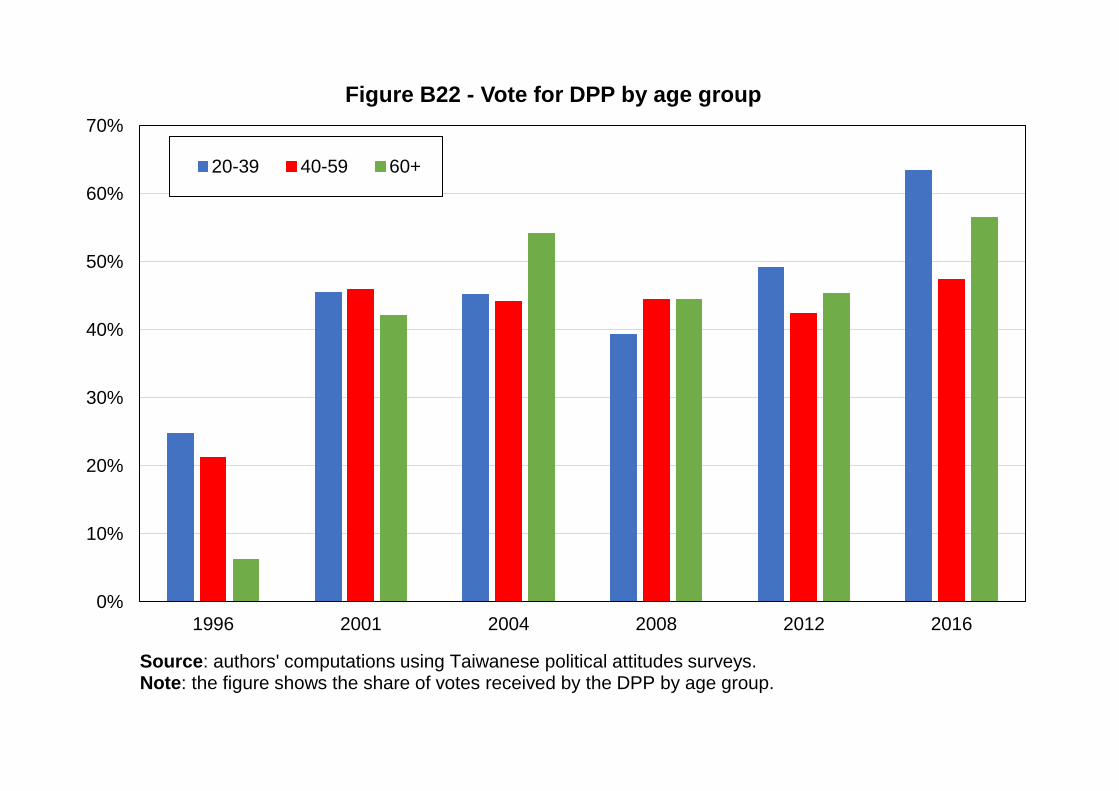
0%
10%
20%
30%
40%
50%
60%
70%
1996 2001 2004 2008 2012 2016
Figure B22 - Vote for DPP by age group
20-39 40-59 60+
Source: authors' computations using Taiwanese political attitudes surveys.Note: the figure shows the share of votes received by the DPP by age group.
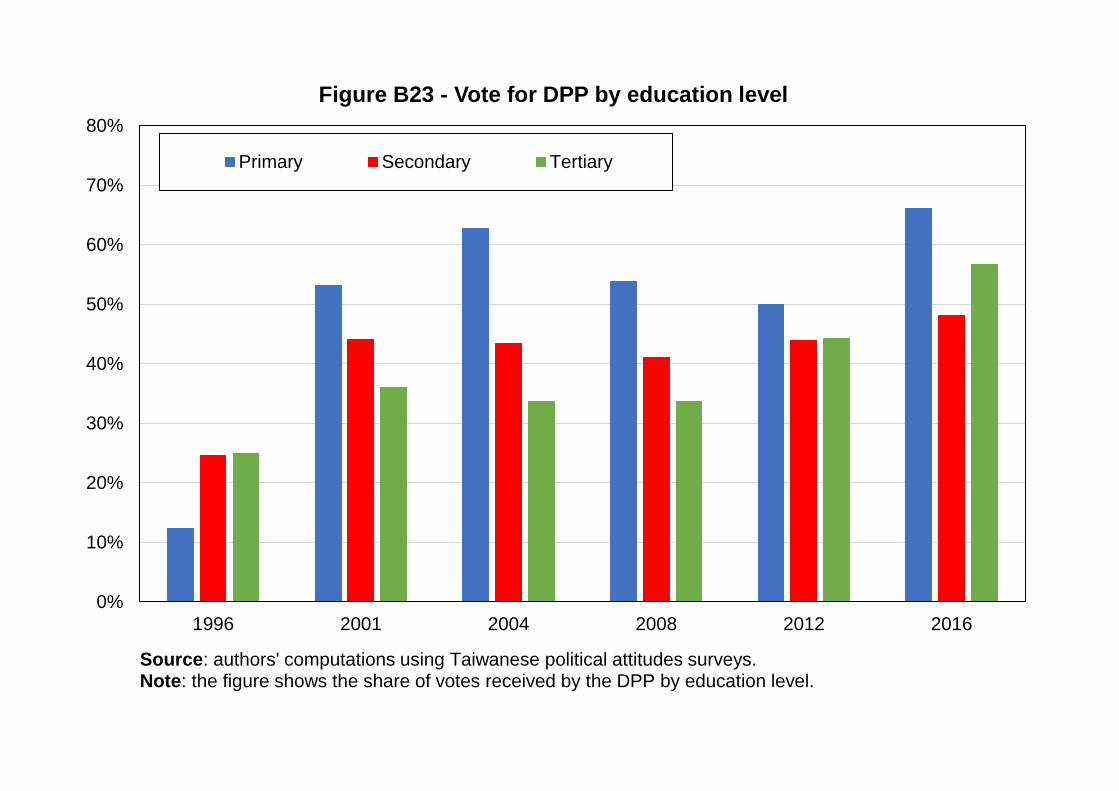
0%
10%
20%
30%
40%
50%
60%
70%
80%
1996 2001 2004 2008 2012 2016
Figure B23 - Vote for DPP by education level
Primary Secondary Tertiary
Source: authors' computations using Taiwanese political attitudes surveys.Note: the figure shows the share of votes received by the DPP by education level.
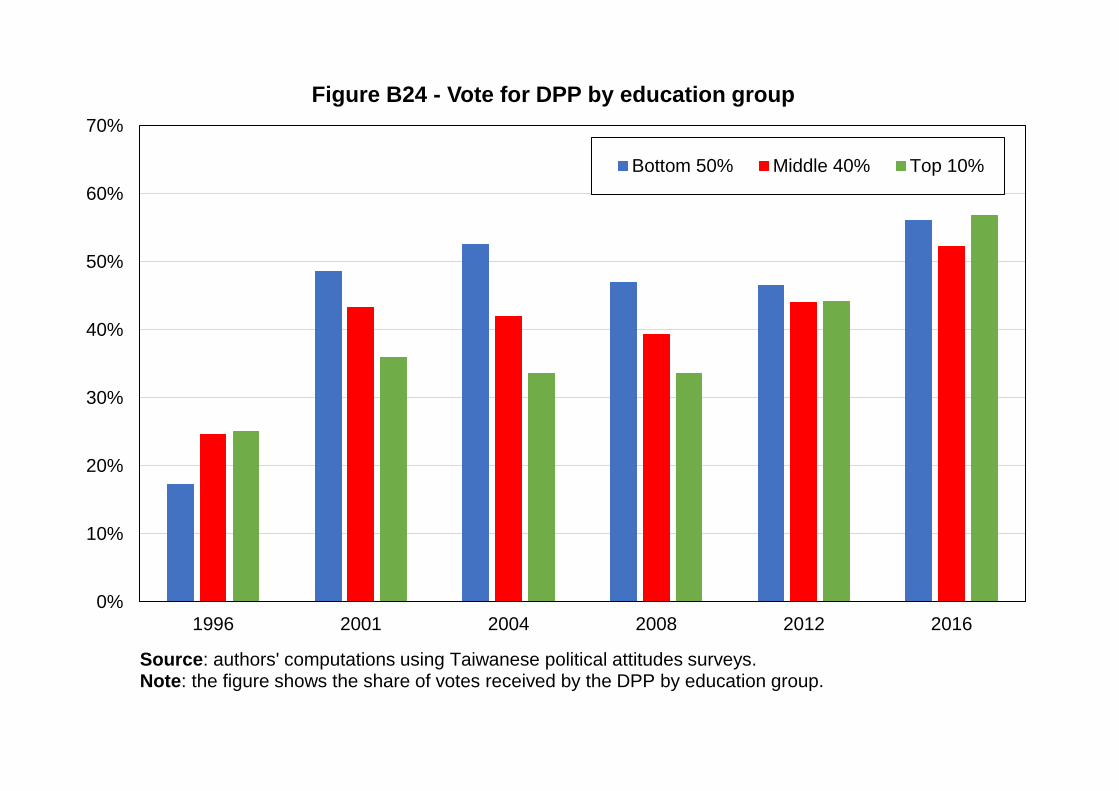
0%
10%
20%
30%
40%
50%
60%
70%
1996 2001 2004 2008 2012 2016
Figure B24 - Vote for DPP by education group
Bottom 50% Middle 40% Top 10%
Source: authors' computations using Taiwanese political attitudes surveys.Note: the figure shows the share of votes received by the DPP by education group.
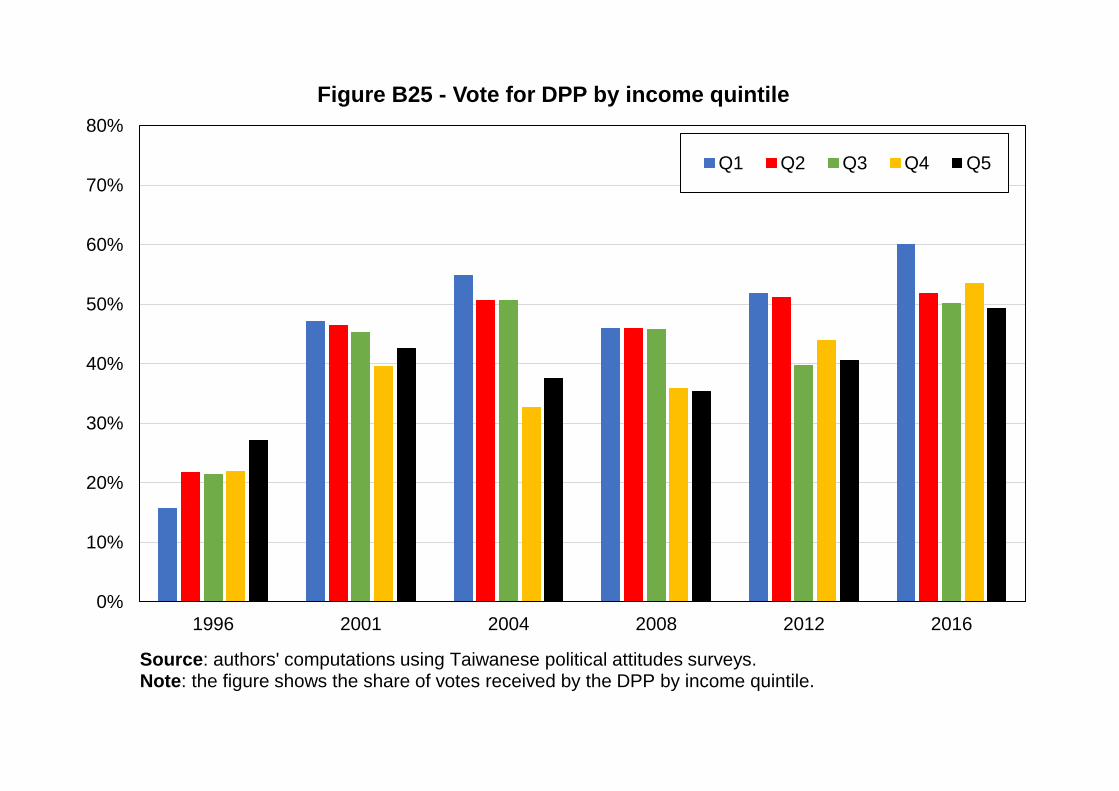
0%
10%
20%
30%
40%
50%
60%
70%
80%
1996 2001 2004 2008 2012 2016
Figure B25 - Vote for DPP by income quintile
Q1 Q2 Q3 Q4 Q5
Source: authors' computations using Taiwanese political attitudes surveys.Note: the figure shows the share of votes received by the DPP by income quintile.
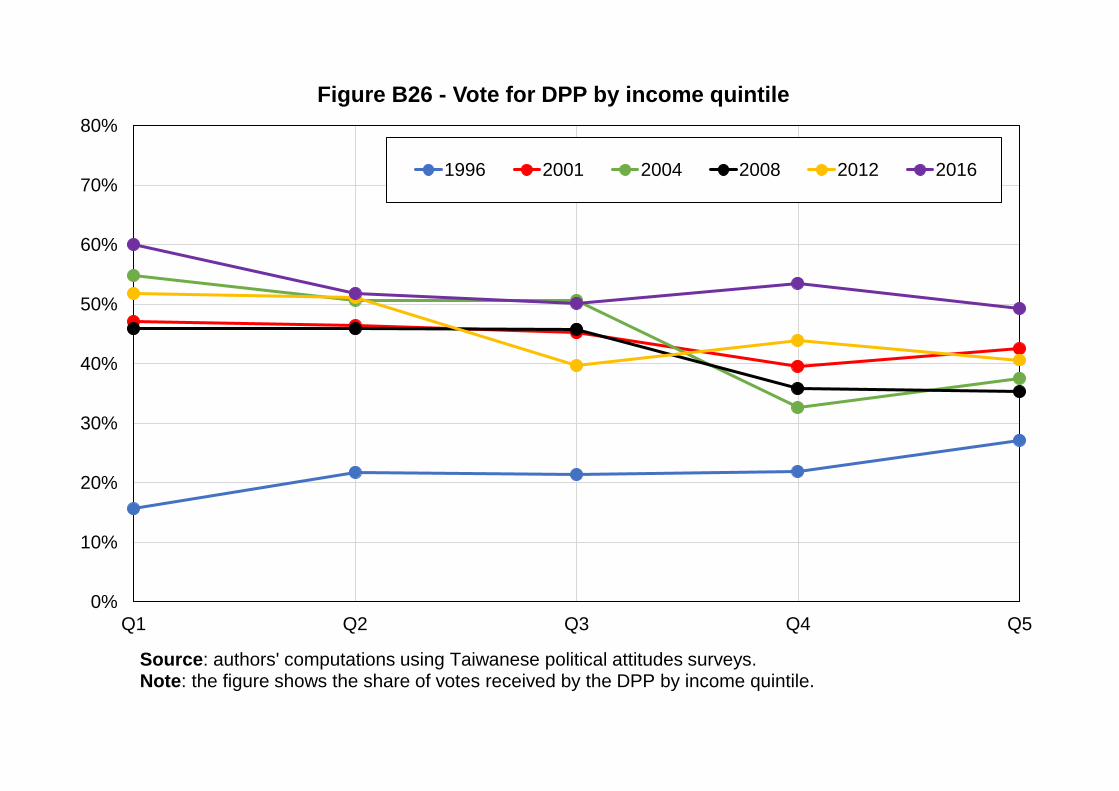
0%
10%
20%
30%
40%
50%
60%
70%
80%
Q1 Q2 Q3 Q4 Q5
Figure B26 - Vote for DPP by income quintile
1996 2001 2004 2008 2012 2016
Source: authors' computations using Taiwanese political attitudes surveys.Note: the figure shows the share of votes received by the DPP by income quintile.
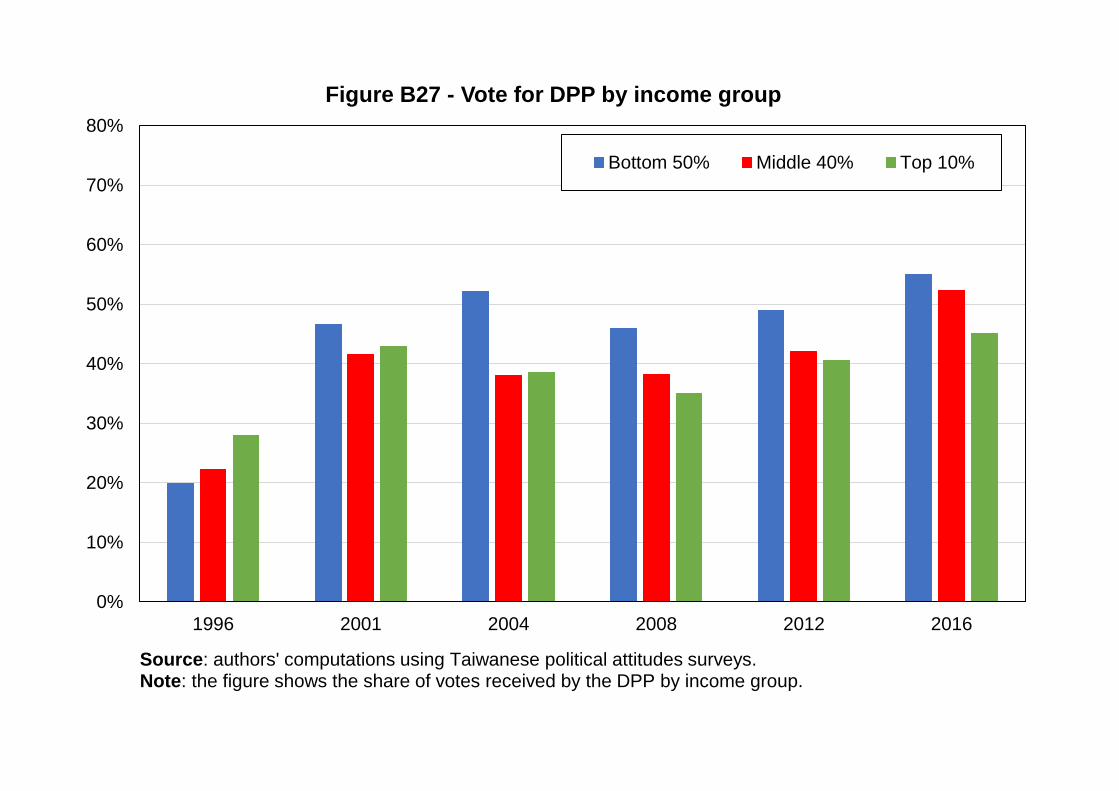
0%
10%
20%
30%
40%
50%
60%
70%
80%
1996 2001 2004 2008 2012 2016
Figure B27 - Vote for DPP by income group
Bottom 50% Middle 40% Top 10%
Source: authors' computations using Taiwanese political attitudes surveys.Note: the figure shows the share of votes received by the DPP by income group.
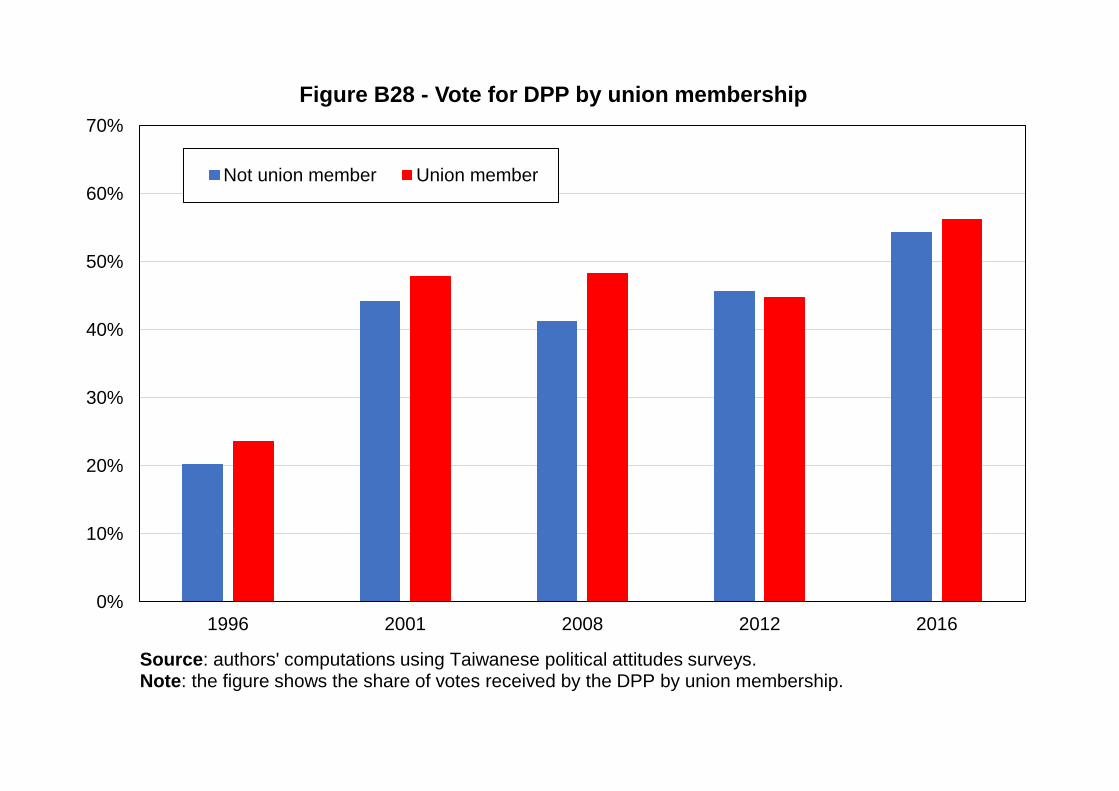
0%
10%
20%
30%
40%
50%
60%
70%
1996 2001 2008 2012 2016
Figure B28 - Vote for DPP by union membership
Not union member Union member
Source: authors' computations using Taiwanese political attitudes surveys.Note: the figure shows the share of votes received by the DPP by union membership.
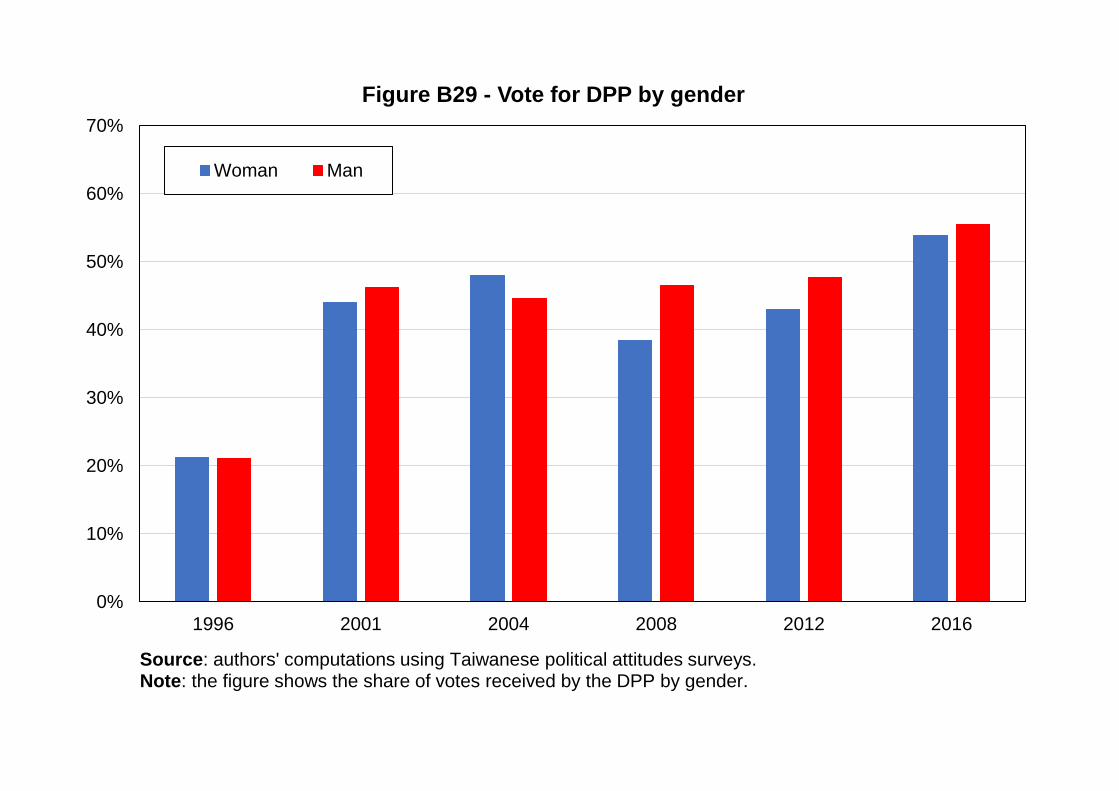
0%
10%
20%
30%
40%
50%
60%
70%
1996 2001 2004 2008 2012 2016
Figure B29 - Vote for DPP by gender
Woman Man
Source: authors' computations using Taiwanese political attitudes surveys.Note: the figure shows the share of votes received by the DPP by gender.
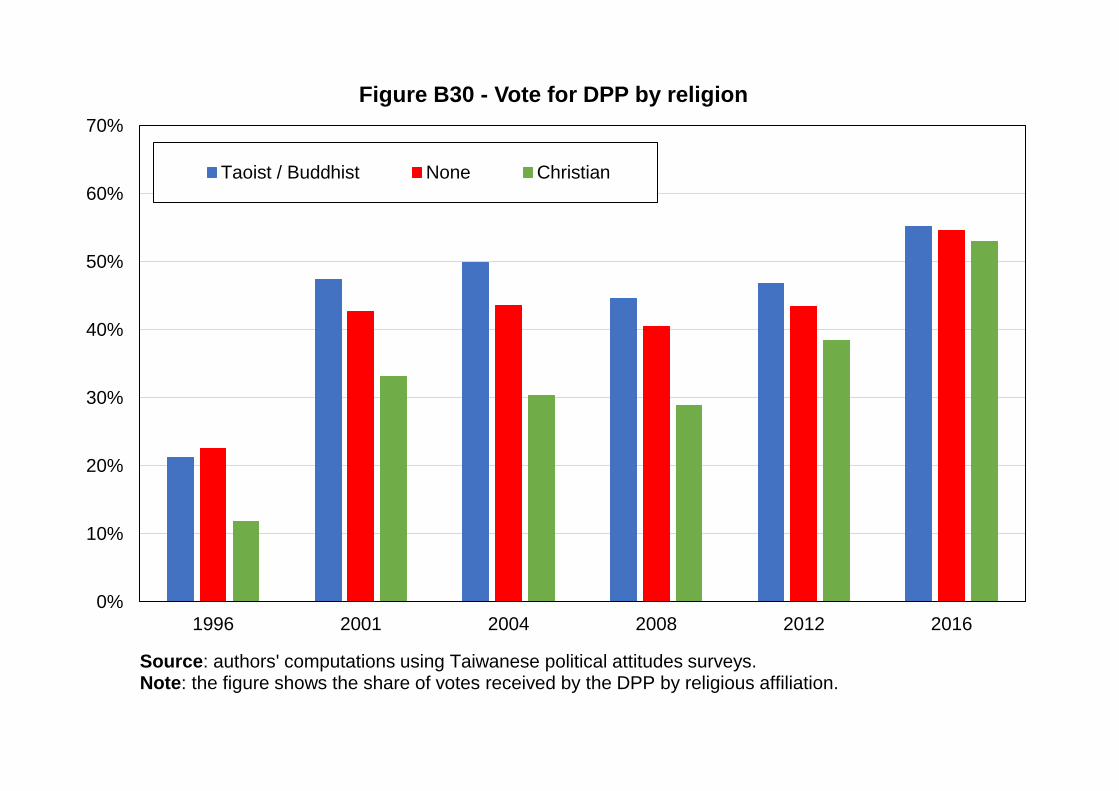
0%
10%
20%
30%
40%
50%
60%
70%
1996 2001 2004 2008 2012 2016
Figure B30 - Vote for DPP by religion
Taoist / Buddhist None Christian
Source: authors' computations using Taiwanese political attitudes surveys.Note: the figure shows the share of votes received by the DPP by religious affiliation.
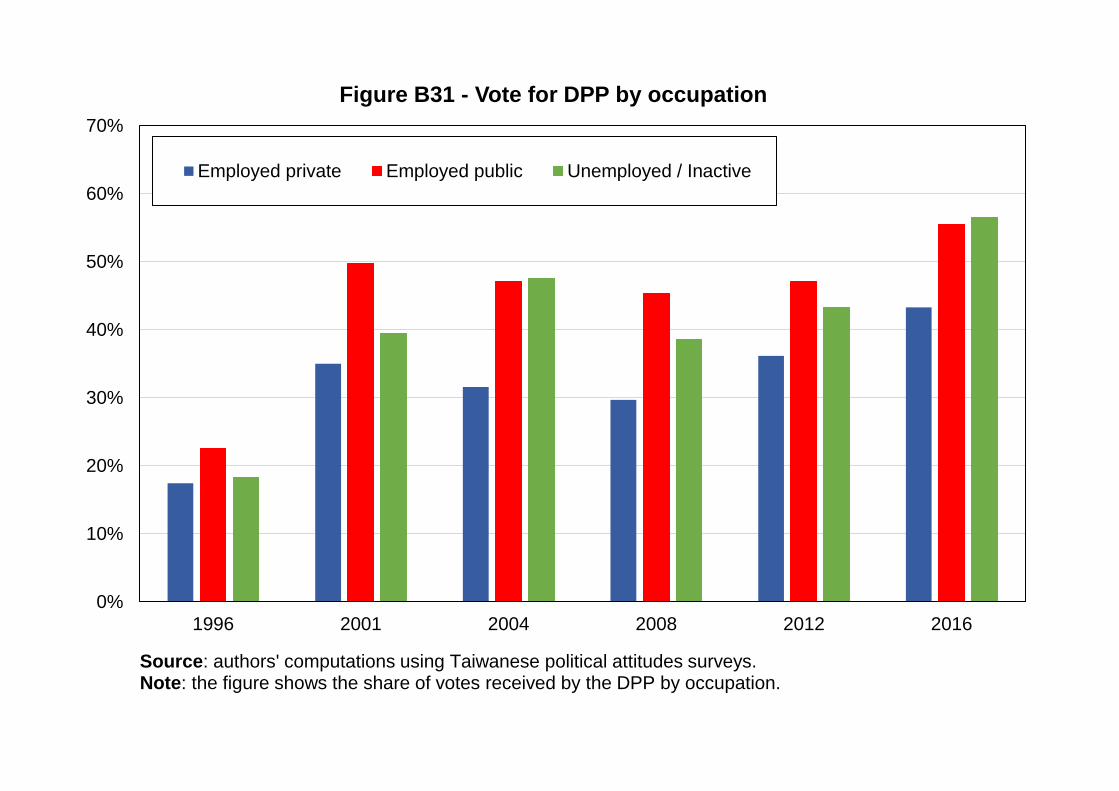
0%
10%
20%
30%
40%
50%
60%
70%
1996 2001 2004 2008 2012 2016
Figure B31 - Vote for DPP by occupation
Employed private Employed public Unemployed / Inactive
Source: authors' computations using Taiwanese political attitudes surveys.Note: the figure shows the share of votes received by the DPP by occupation.
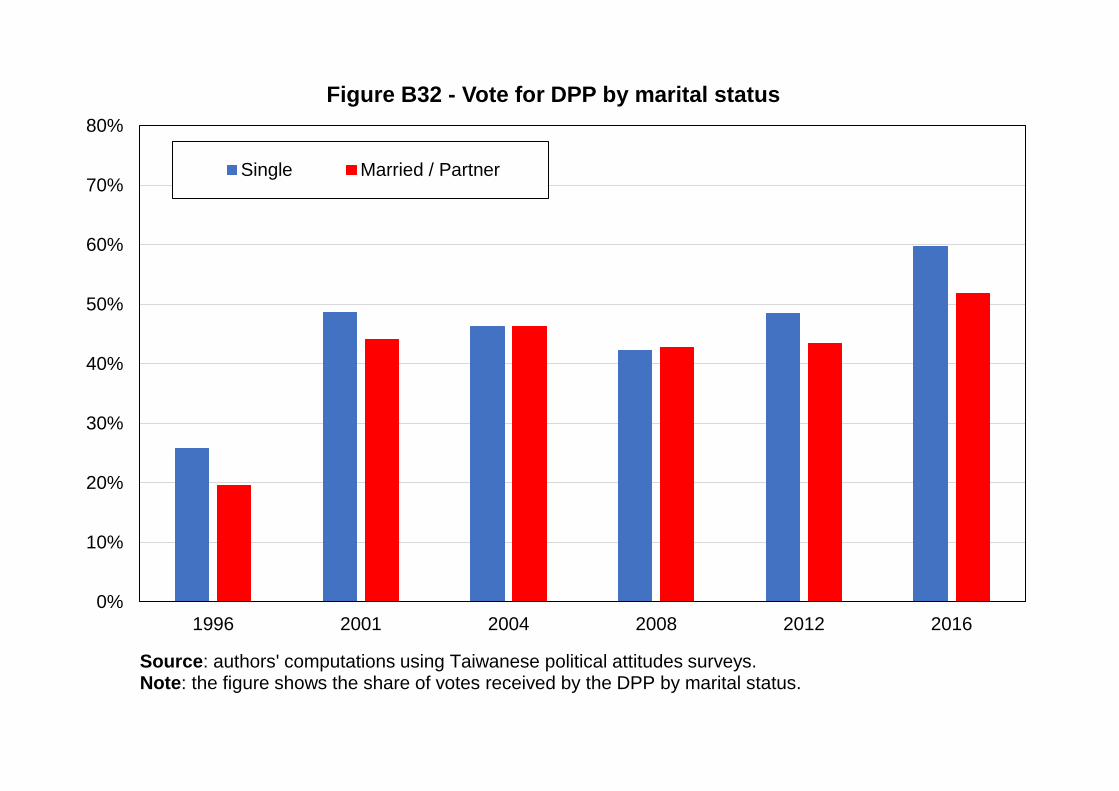
0%
10%
20%
30%
40%
50%
60%
70%
80%
1996 2001 2004 2008 2012 2016
Figure B32 - Vote for DPP by marital status
Single Married / Partner
Source: authors' computations using Taiwanese political attitudes surveys.Note: the figure shows the share of votes received by the DPP by marital status.
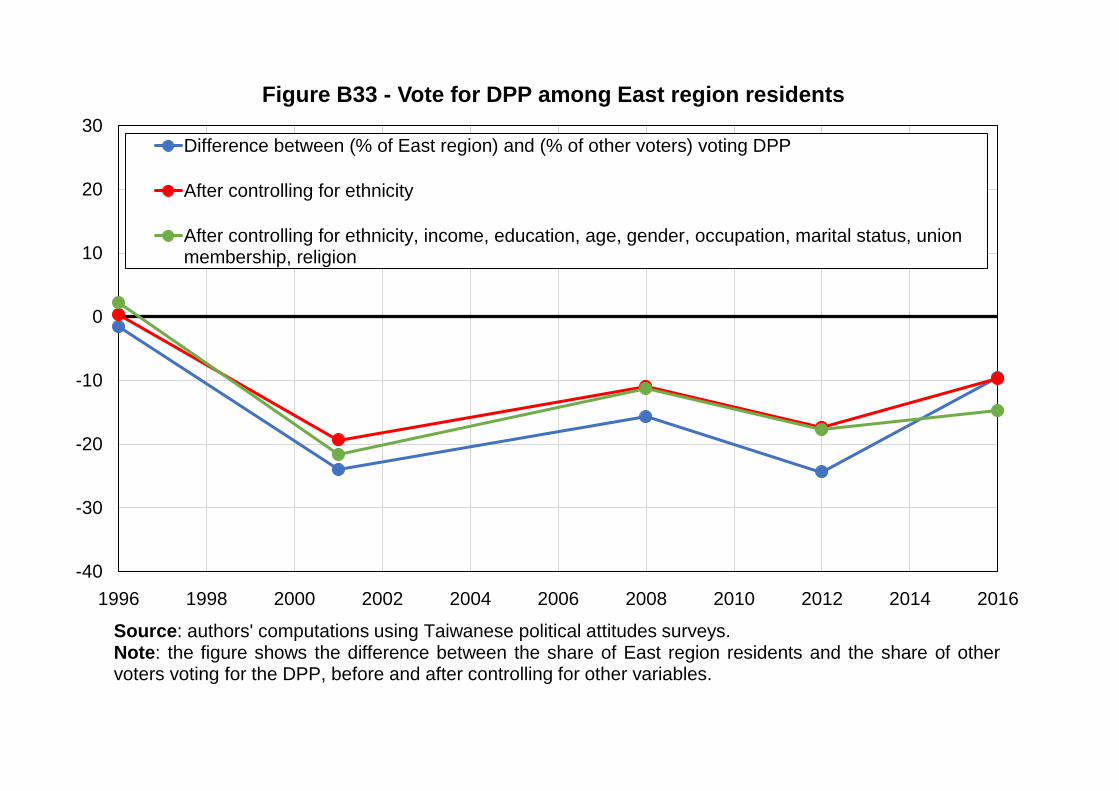
-40
-30
-20
-10
0
10
20
30
1996 1998 2000 2002 2004 2006 2008 2010 2012 2014 2016
Figure B33 - Vote for DPP among East region residents
Difference between (% of East region) and (% of other voters) voting DPP
After controlling for ethnicity
After controlling for ethnicity, income, education, age, gender, occupation, marital status, unionmembership, religion
Source: authors' computations using Taiwanese political attitudes surveys.Note: the figure shows the difference between the share of East region residents and the share of othervoters voting for the DPP, before and after controlling for other variables.
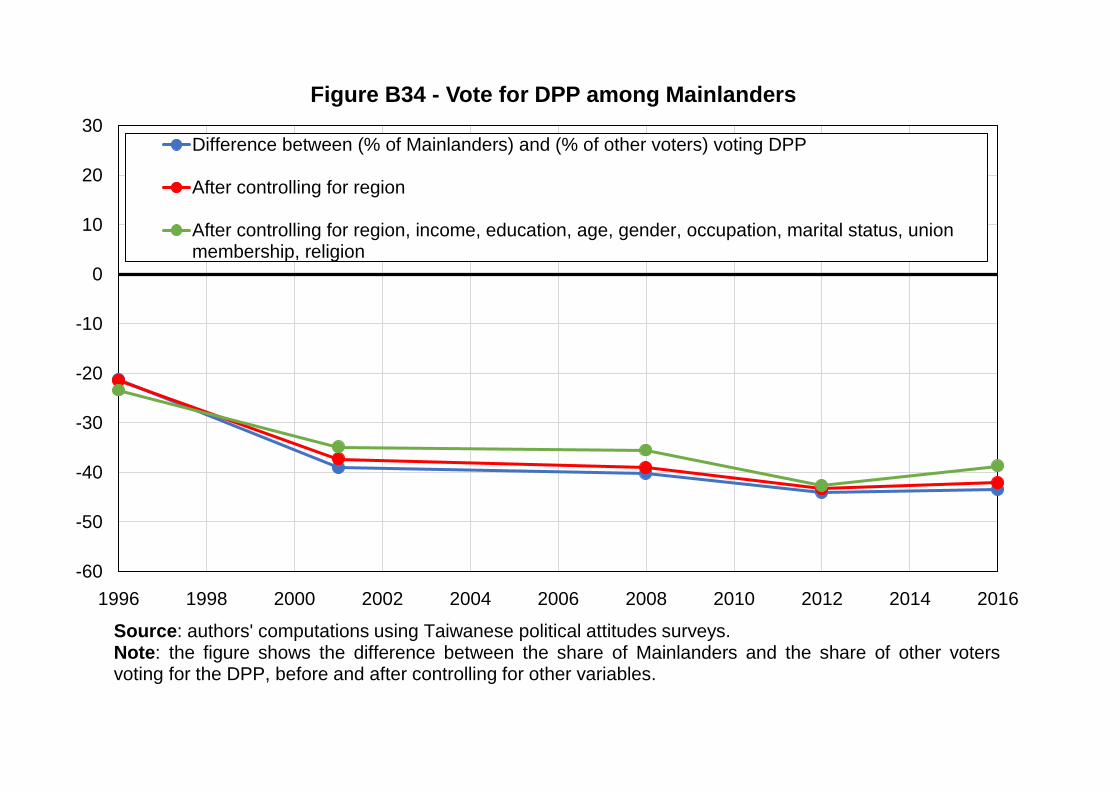
-60
-50
-40
-30
-20
-10
0
10
20
30
1996 1998 2000 2002 2004 2006 2008 2010 2012 2014 2016
Figure B34 - Vote for DPP among Mainlanders
Difference between (% of Mainlanders) and (% of other voters) voting DPP
After controlling for region
After controlling for region, income, education, age, gender, occupation, marital status, unionmembership, religion
Source: authors' computations using Taiwanese political attitudes surveys.Note: the figure shows the difference between the share of Mainlanders and the share of other votersvoting for the DPP, before and after controlling for other variables.
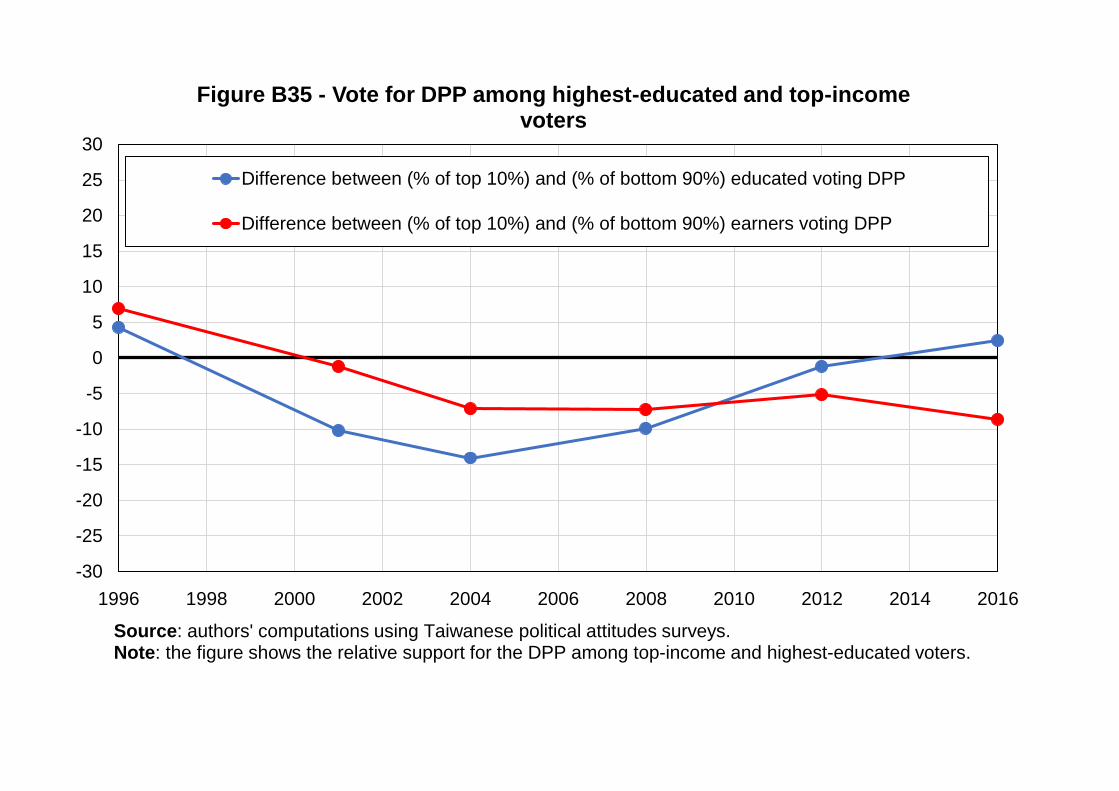
-30
-25
-20
-15
-10
-5
0
5
10
15
20
25
30
1996 1998 2000 2002 2004 2006 2008 2010 2012 2014 2016
Figure B35 - Vote for DPP among highest-educated and top-income voters
Difference between (% of top 10%) and (% of bottom 90%) educated voting DPP
Difference between (% of top 10%) and (% of bottom 90%) earners voting DPP
Source: authors' computations using Taiwanese political attitudes surveys.Note: the figure shows the relative support for the DPP among top-income and highest-educated voters.
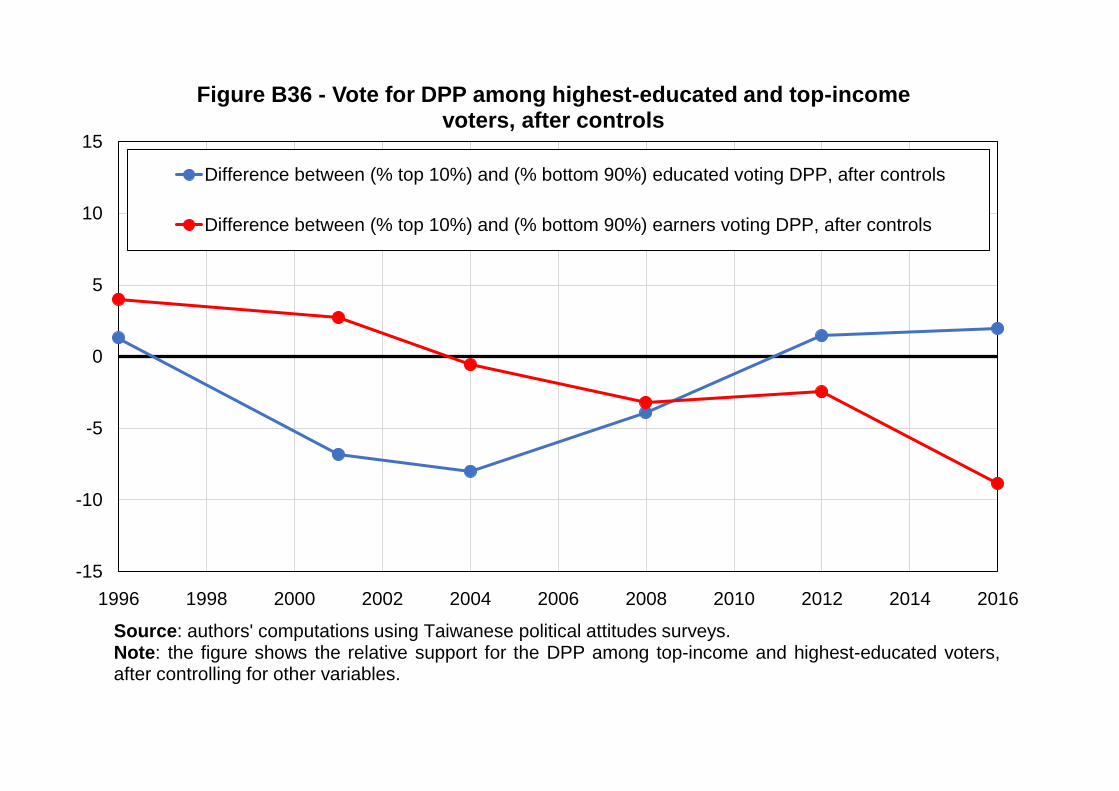
-15
-10
-5
0
5
10
15
1996 1998 2000 2002 2004 2006 2008 2010 2012 2014 2016
Figure B36 - Vote for DPP among highest-educated and top-income voters, after controls
Difference between (% top 10%) and (% bottom 90%) educated voting DPP, after controls
Difference between (% top 10%) and (% bottom 90%) earners voting DPP, after controls
Source: authors' computations using Taiwanese political attitudes surveys.Note: the figure shows the relative support for the DPP among top-income and highest-educated voters,after controlling for other variables.
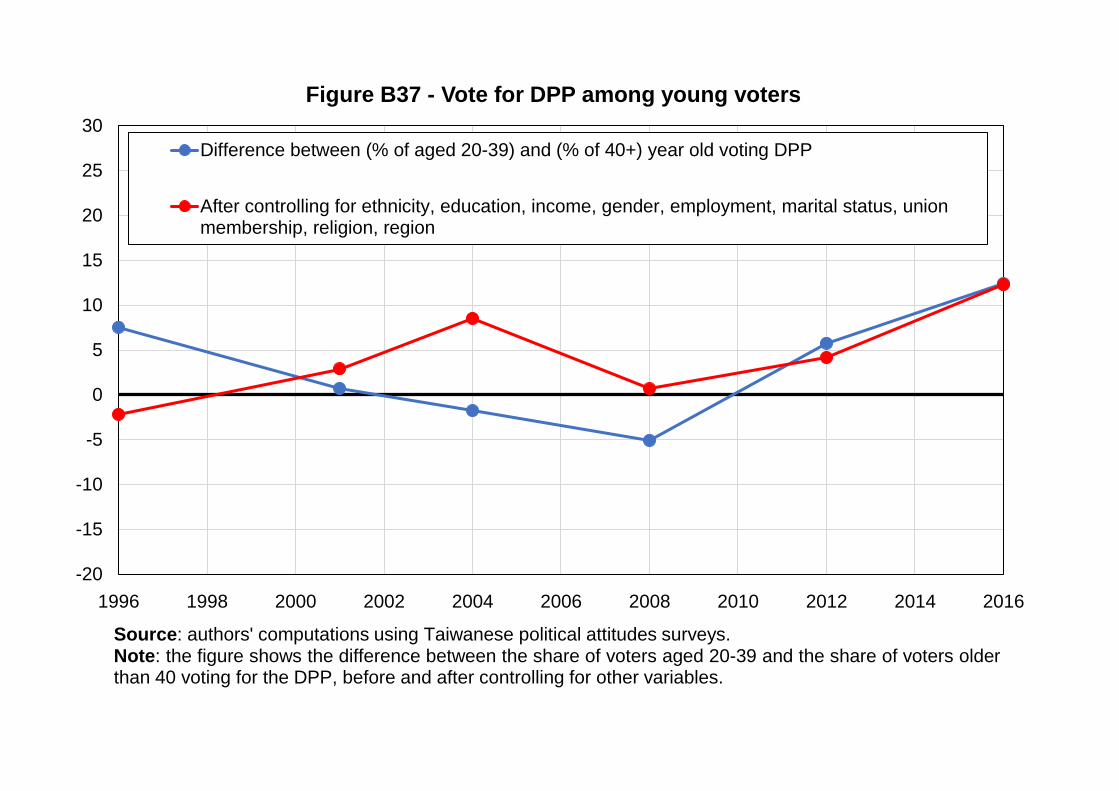
-20
-15
-10
-5
0
5
10
15
20
25
30
1996 1998 2000 2002 2004 2006 2008 2010 2012 2014 2016
Figure B37 - Vote for DPP among young voters
Difference between (% of aged 20-39) and (% of 40+) year old voting DPP
After controlling for ethnicity, education, income, gender, employment, marital status, unionmembership, religion, region
Source: authors' computations using Taiwanese political attitudes surveys.Note: the figure shows the difference between the share of voters aged 20-39 and the share of voters olderthan 40 voting for the DPP, before and after controlling for other variables.
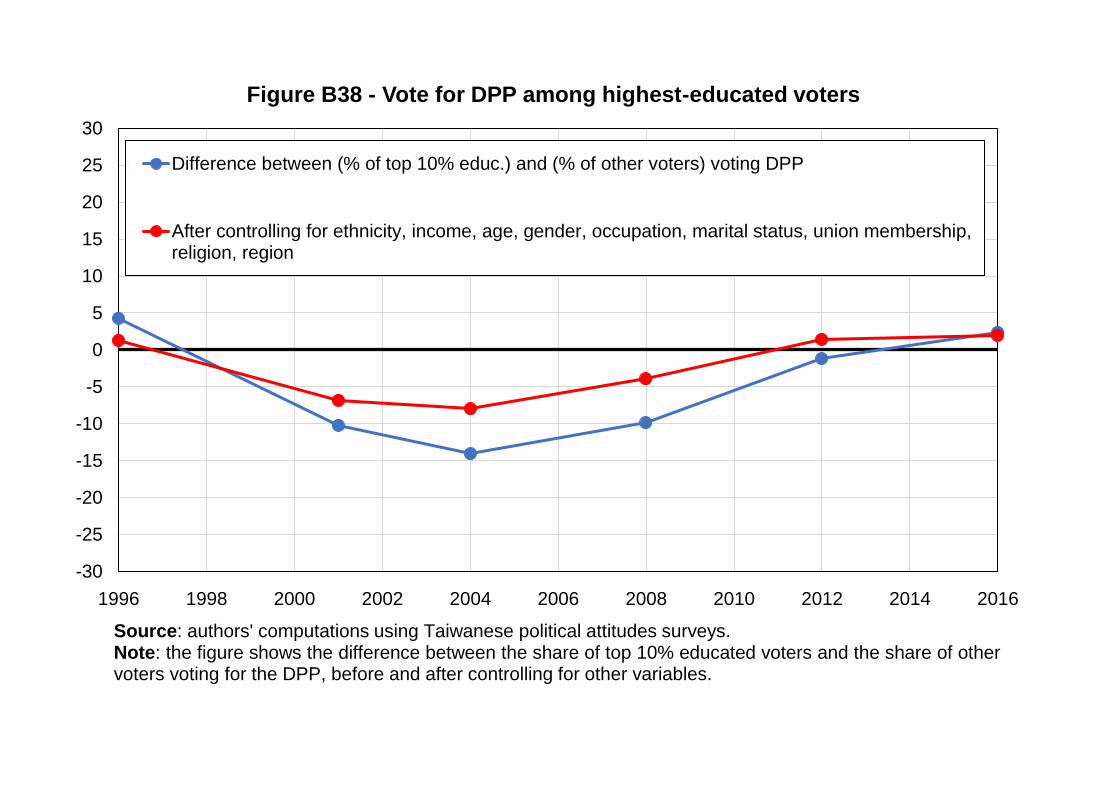
-30
-25
-20
-15
-10
-5
0
5
10
15
20
25
30
1996 1998 2000 2002 2004 2006 2008 2010 2012 2014 2016
Figure B38 - Vote for DPP among highest-educated voters
Difference between (% of top 10% educ.) and (% of other voters) voting DPP
After controlling for ethnicity, income, age, gender, occupation, marital status, union membership,religion, region
Source: authors' computations using Taiwanese political attitudes surveys.Note: the figure shows the difference between the share of top 10% educated voters and the share of othervoters voting for the DPP, before and after controlling for other variables.
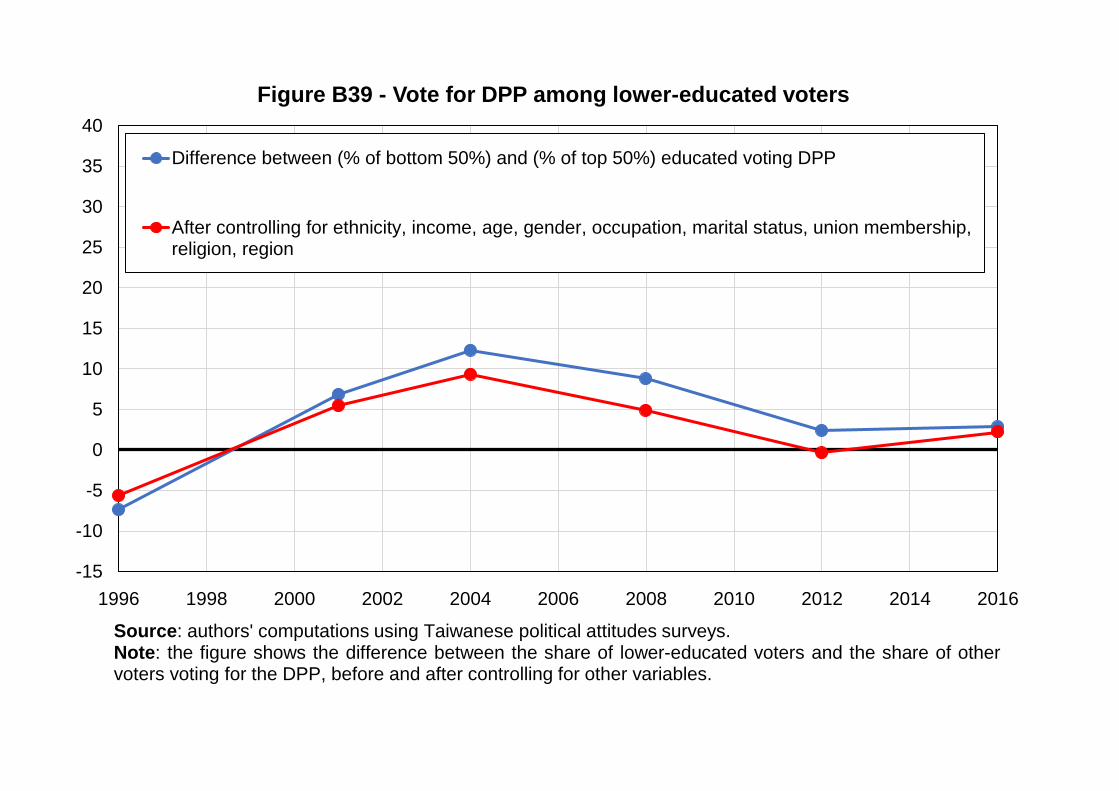
-15
-10
-5
0
5
10
15
20
25
30
35
40
1996 1998 2000 2002 2004 2006 2008 2010 2012 2014 2016
Figure B39 - Vote for DPP among lower-educated voters
Difference between (% of bottom 50%) and (% of top 50%) educated voting DPP
After controlling for ethnicity, income, age, gender, occupation, marital status, union membership,religion, region
Source: authors' computations using Taiwanese political attitudes surveys.Note: the figure shows the difference between the share of lower-educated voters and the share of othervoters voting for the DPP, before and after controlling for other variables.
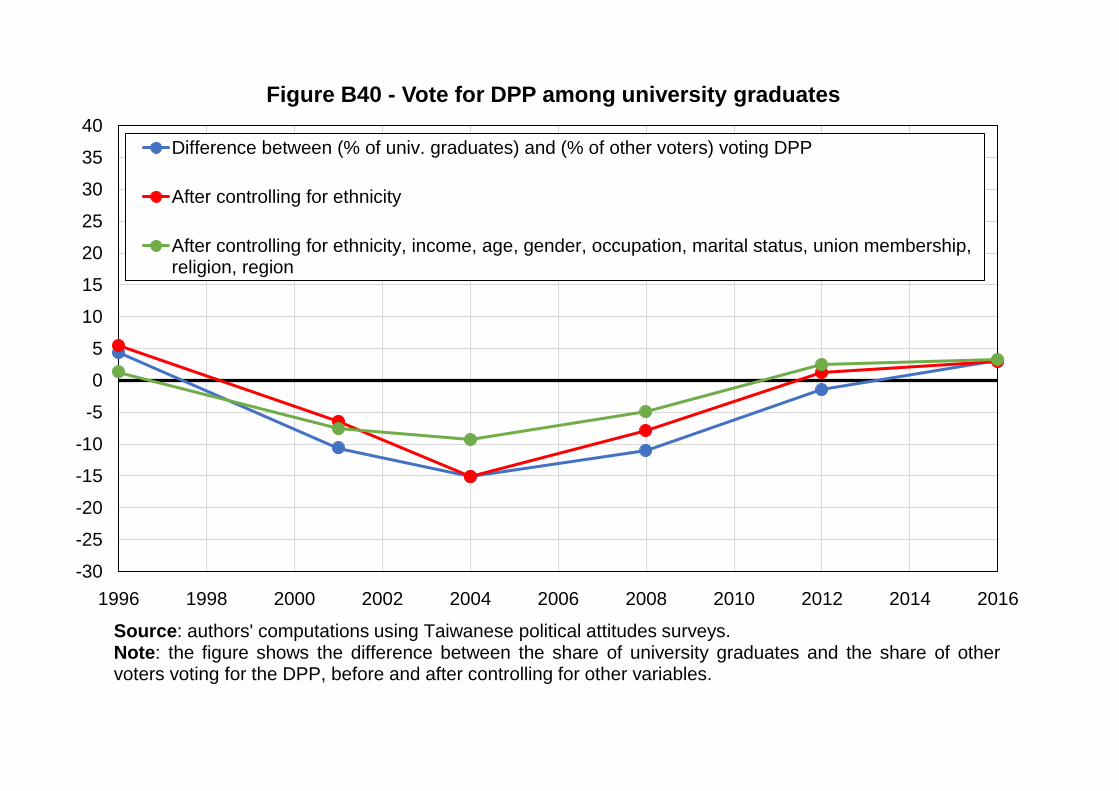
-30
-25
-20
-15
-10
-5
0
5
10
15
20
25
30
35
40
1996 1998 2000 2002 2004 2006 2008 2010 2012 2014 2016
Figure B40 - Vote for DPP among university graduates
Difference between (% of univ. graduates) and (% of other voters) voting DPP
After controlling for ethnicity
After controlling for ethnicity, income, age, gender, occupation, marital status, union membership,religion, region
Source: authors' computations using Taiwanese political attitudes surveys.Note: the figure shows the difference between the share of university graduates and the share of othervoters voting for the DPP, before and after controlling for other variables.
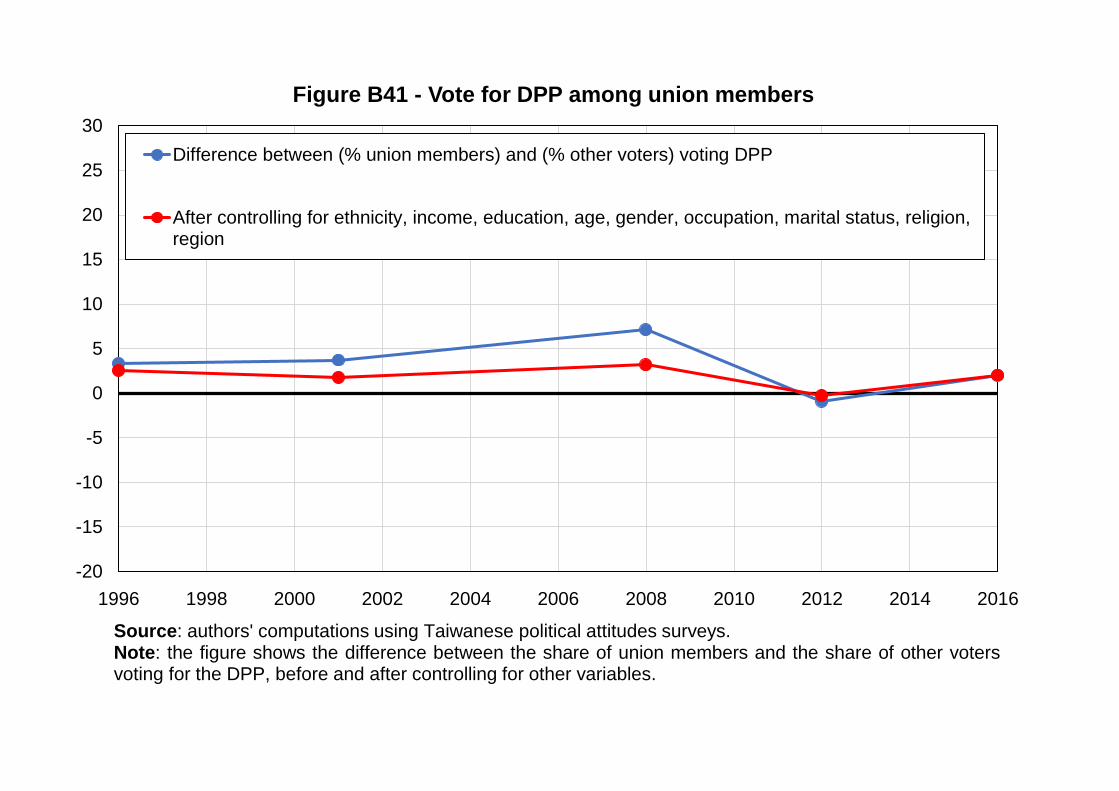
-20
-15
-10
-5
0
5
10
15
20
25
30
1996 1998 2000 2002 2004 2006 2008 2010 2012 2014 2016
Figure B41 - Vote for DPP among union members
Difference between (% union members) and (% other voters) voting DPP
After controlling for ethnicity, income, education, age, gender, occupation, marital status, religion,region
Source: authors' computations using Taiwanese political attitudes surveys.Note: the figure shows the difference between the share of union members and the share of other votersvoting for the DPP, before and after controlling for other variables.
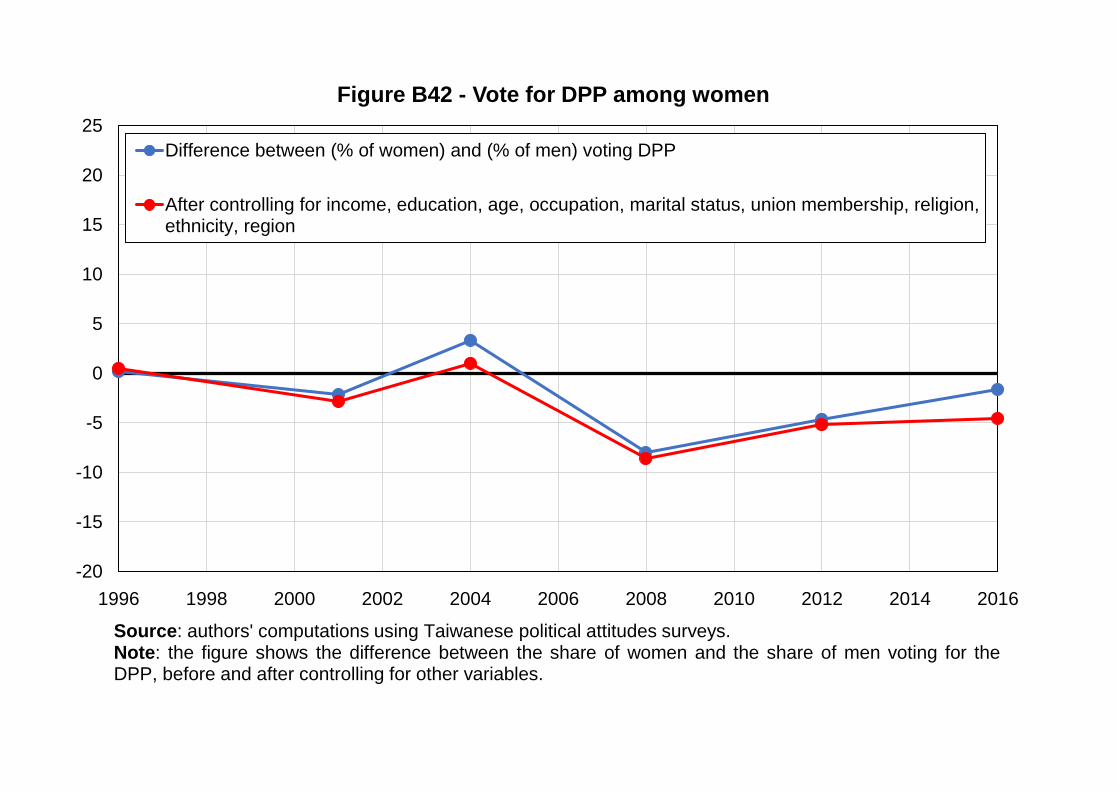
-20
-15
-10
-5
0
5
10
15
20
25
1996 1998 2000 2002 2004 2006 2008 2010 2012 2014 2016
Figure B42 - Vote for DPP among women
Difference between (% of women) and (% of men) voting DPP
After controlling for income, education, age, occupation, marital status, union membership, religion,ethnicity, region
Source: authors' computations using Taiwanese political attitudes surveys.Note: the figure shows the difference between the share of women and the share of men voting for theDPP, before and after controlling for other variables.
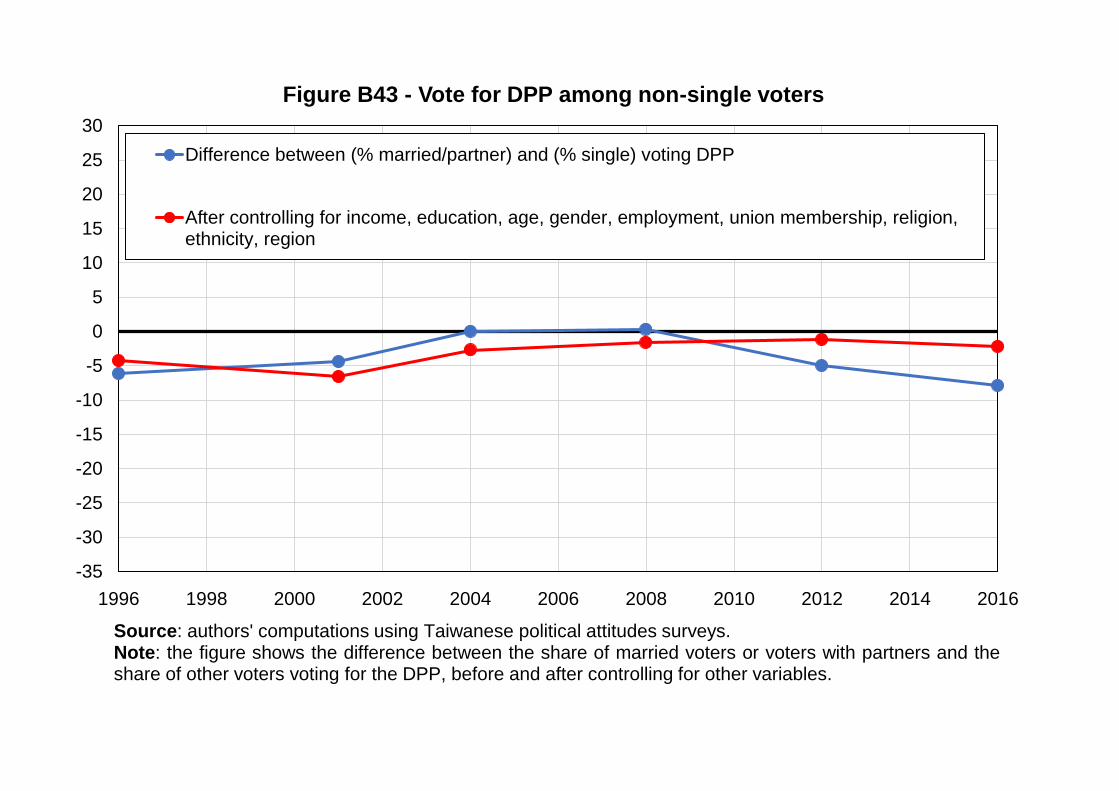
-35
-30
-25
-20
-15
-10
-5
0
5
10
15
20
25
30
1996 1998 2000 2002 2004 2006 2008 2010 2012 2014 2016
Figure B43 - Vote for DPP among non-single voters
Difference between (% married/partner) and (% single) voting DPP
After controlling for income, education, age, gender, employment, union membership, religion,ethnicity, region
Source: authors' computations using Taiwanese political attitudes surveys.Note: the figure shows the difference between the share of married voters or voters with partners and theshare of other voters voting for the DPP, before and after controlling for other variables.
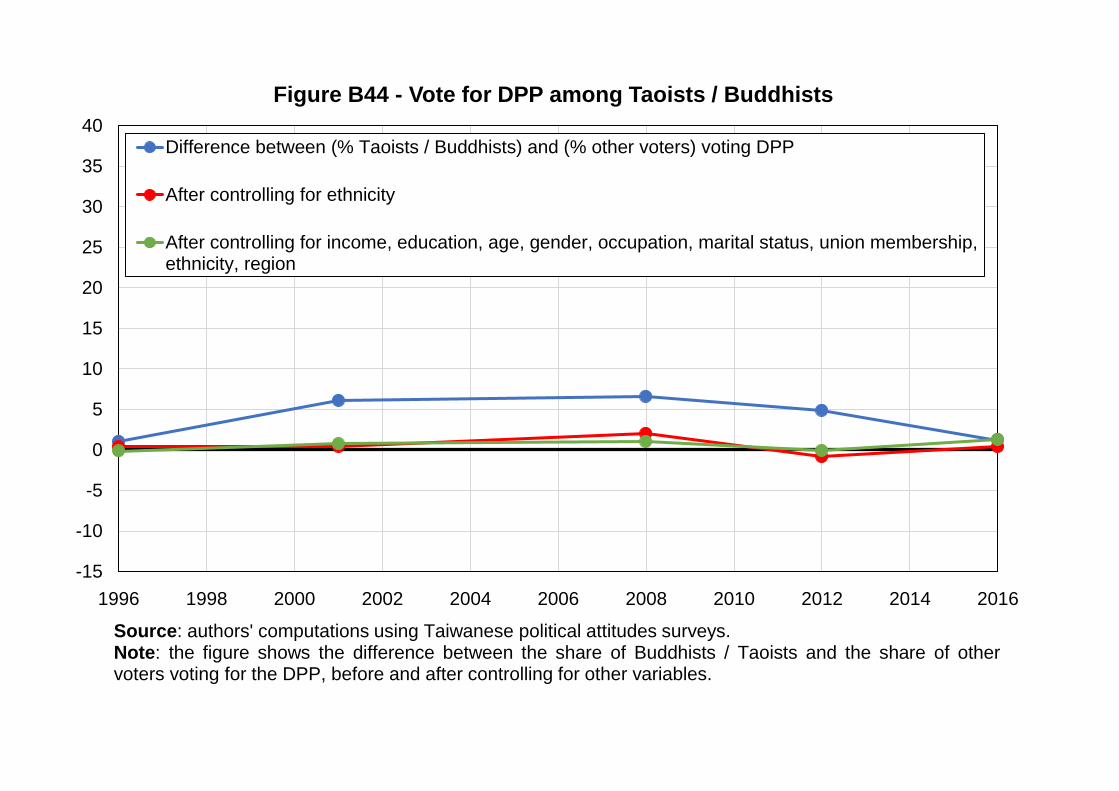
-15
-10
-5
0
5
10
15
20
25
30
35
40
1996 1998 2000 2002 2004 2006 2008 2010 2012 2014 2016
Figure B44 - Vote for DPP among Taoists / Buddhists
Difference between (% Taoists / Buddhists) and (% other voters) voting DPP
After controlling for ethnicity
After controlling for income, education, age, gender, occupation, marital status, union membership,ethnicity, region
Source: authors' computations using Taiwanese political attitudes surveys.Note: the figure shows the difference between the share of Buddhists / Taoists and the share of othervoters voting for the DPP, before and after controlling for other variables.
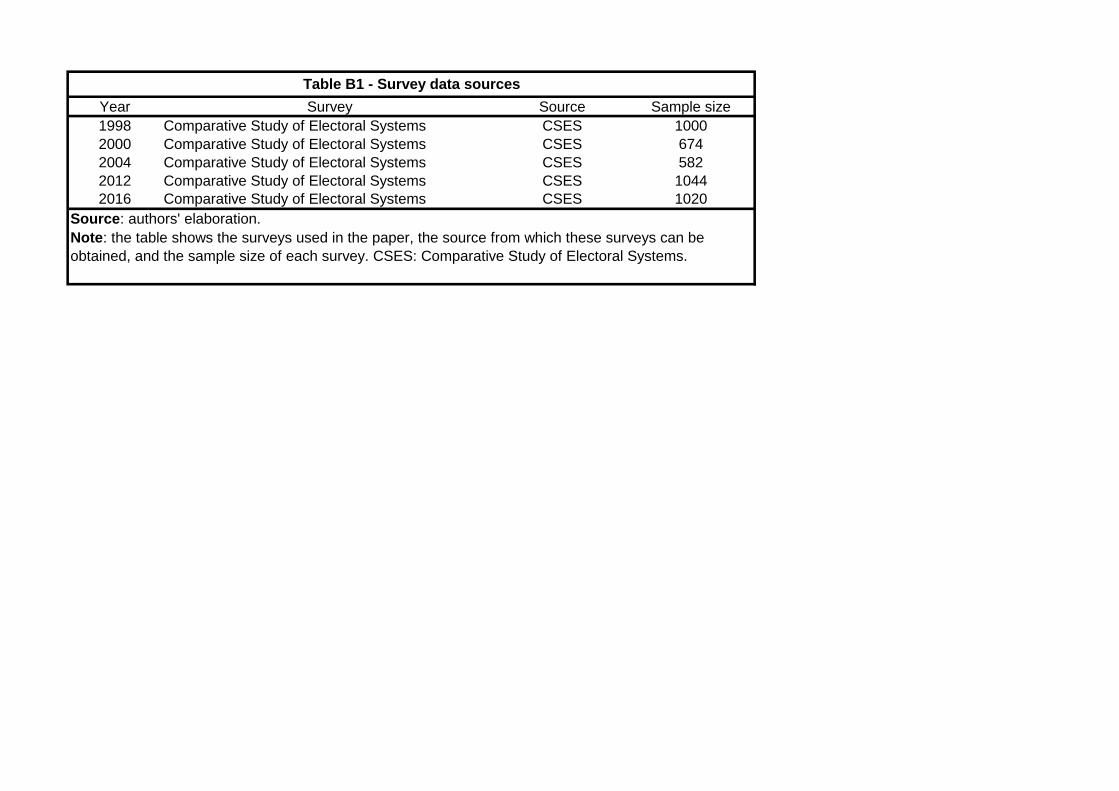
Year Survey Source Sample size
1998 Comparative Study of Electoral Systems CSES 1000
2000 Comparative Study of Electoral Systems CSES 674
2004 Comparative Study of Electoral Systems CSES 582
2012 Comparative Study of Electoral Systems CSES 1044
2016 Comparative Study of Electoral Systems CSES 1020
Table B1 - Survey data sources
Source: authors' elaboration.
Note: the table shows the surveys used in the paper, the source from which these surveys can be
obtained, and the sample size of each survey. CSES: Comparative Study of Electoral Systems.
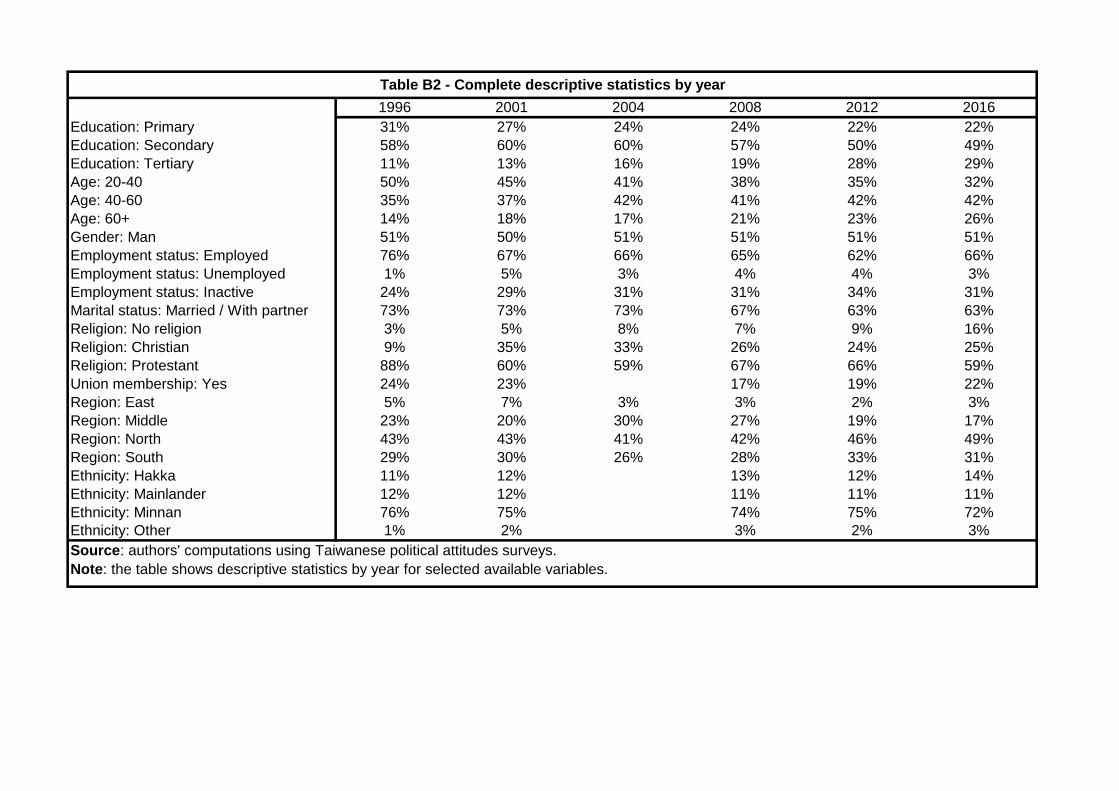
1996 2001 2004 2008 2012 2016
Education: Primary 31% 27% 24% 24% 22% 22%
Education: Secondary 58% 60% 60% 57% 50% 49%
Education: Tertiary 11% 13% 16% 19% 28% 29%
Age: 20-40 50% 45% 41% 38% 35% 32%
Age: 40-60 35% 37% 42% 41% 42% 42%
Age: 60+ 14% 18% 17% 21% 23% 26%
Gender: Man 51% 50% 51% 51% 51% 51%
Employment status: Employed 76% 67% 66% 65% 62% 66%
Employment status: Unemployed 1% 5% 3% 4% 4% 3%
Employment status: Inactive 24% 29% 31% 31% 34% 31%
Marital status: Married / With partner 73% 73% 73% 67% 63% 63%
Religion: No religion 3% 5% 8% 7% 9% 16%
Religion: Christian 9% 35% 33% 26% 24% 25%
Religion: Protestant 88% 60% 59% 67% 66% 59%
Union membership: Yes 24% 23% 17% 19% 22%
Region: East 5% 7% 3% 3% 2% 3%
Region: Middle 23% 20% 30% 27% 19% 17%
Region: North 43% 43% 41% 42% 46% 49%
Region: South 29% 30% 26% 28% 33% 31%
Ethnicity: Hakka 11% 12% 13% 12% 14%
Ethnicity: Mainlander 12% 12% 11% 11% 11%
Ethnicity: Minnan 76% 75% 74% 75% 72%
Ethnicity: Other 1% 2% 3% 2% 3%
Source: authors' computations using Taiwanese political attitudes surveys.
Note: the table shows descriptive statistics by year for selected available variables.
Table B2 - Complete descriptive statistics by year
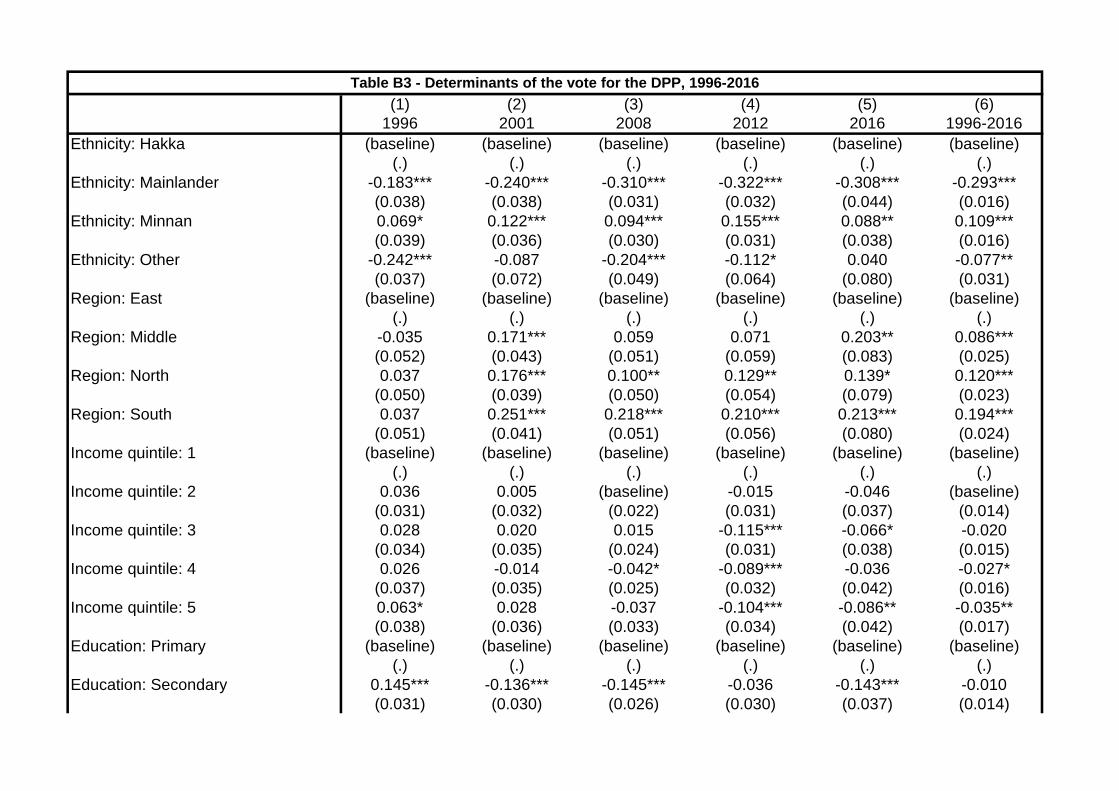
(1) (2) (3) (4) (5) (6)
1996 2001 2008 2012 2016 1996-2016
Ethnicity: Hakka (baseline) (baseline) (baseline) (baseline) (baseline) (baseline)
(.) (.) (.) (.) (.) (.)
Ethnicity: Mainlander -0.183*** -0.240*** -0.310*** -0.322*** -0.308*** -0.293***
(0.038) (0.038) (0.031) (0.032) (0.044) (0.016)
Ethnicity: Minnan 0.069* 0.122*** 0.094*** 0.155*** 0.088** 0.109***
(0.039) (0.036) (0.030) (0.031) (0.038) (0.016)
Ethnicity: Other -0.242*** -0.087 -0.204*** -0.112* 0.040 -0.077**
(0.037) (0.072) (0.049) (0.064) (0.080) (0.031)
Region: East (baseline) (baseline) (baseline) (baseline) (baseline) (baseline)
(.) (.) (.) (.) (.) (.)
Region: Middle -0.035 0.171*** 0.059 0.071 0.203** 0.086***
(0.052) (0.043) (0.051) (0.059) (0.083) (0.025)
Region: North 0.037 0.176*** 0.100** 0.129** 0.139* 0.120***
(0.050) (0.039) (0.050) (0.054) (0.079) (0.023)
Region: South 0.037 0.251*** 0.218*** 0.210*** 0.213*** 0.194***
(0.051) (0.041) (0.051) (0.056) (0.080) (0.024)
Income quintile: 1 (baseline) (baseline) (baseline) (baseline) (baseline) (baseline)
(.) (.) (.) (.) (.) (.)
Income quintile: 2 0.036 0.005 (baseline) -0.015 -0.046 (baseline)
(0.031) (0.032) (0.022) (0.031) (0.037) (0.014)
Income quintile: 3 0.028 0.020 0.015 -0.115*** -0.066* -0.020
(0.034) (0.035) (0.024) (0.031) (0.038) (0.015)
Income quintile: 4 0.026 -0.014 -0.042* -0.089*** -0.036 -0.027*
(0.037) (0.035) (0.025) (0.032) (0.042) (0.016)
Income quintile: 5 0.063* 0.028 -0.037 -0.104*** -0.086** -0.035**
(0.038) (0.036) (0.033) (0.034) (0.042) (0.017)
Education: Primary (baseline) (baseline) (baseline) (baseline) (baseline) (baseline)
(.) (.) (.) (.) (.) (.)
Education: Secondary 0.145*** -0.136*** -0.145*** -0.036 -0.143*** -0.010
(0.031) (0.030) (0.026) (0.030) (0.037) (0.014)
Table B3 - Determinants of the vote for the DPP, 1996-2016
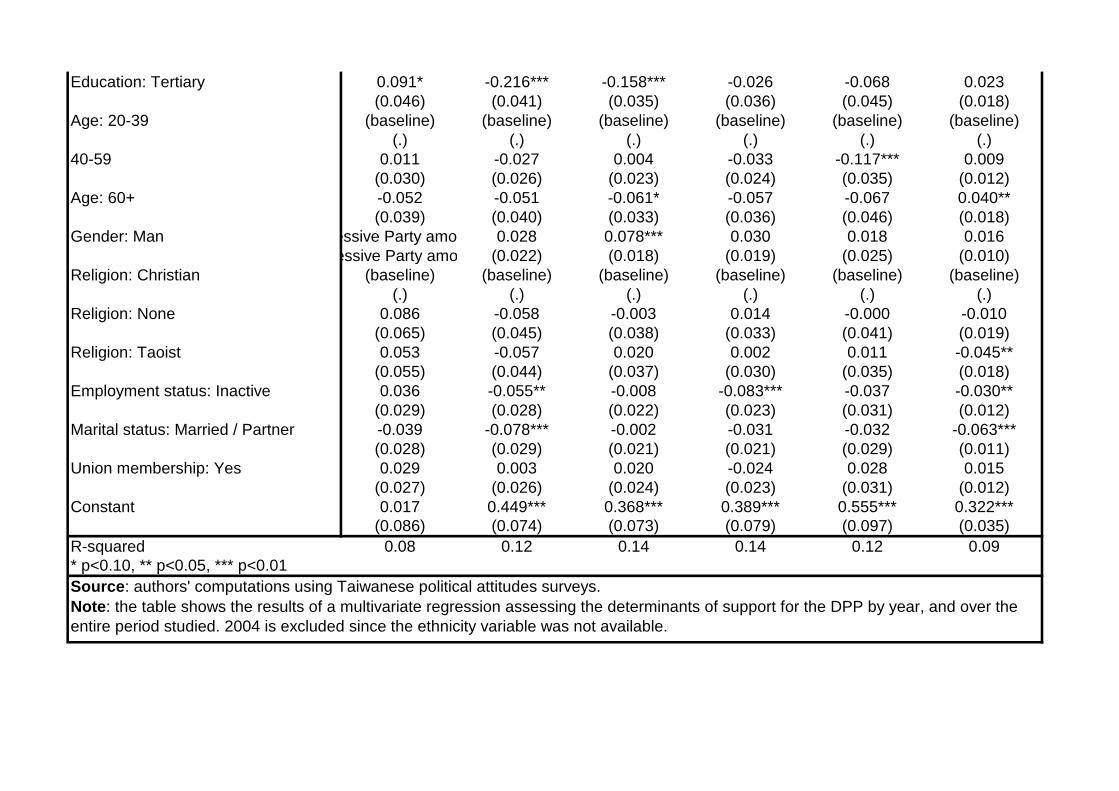
Education: Tertiary 0.091* -0.216*** -0.158*** -0.026 -0.068 0.023
(0.046) (0.041) (0.035) (0.036) (0.045) (0.018)
Age: 20-39 (baseline) (baseline) (baseline) (baseline) (baseline) (baseline)
(.) (.) (.) (.) (.) (.)
40-59 0.011 -0.027 0.004 -0.033 -0.117*** 0.009
(0.030) (0.026) (0.023) (0.024) (0.035) (0.012)
Age: 60+ -0.052 -0.051 -0.061* -0.057 -0.067 0.040**
(0.039) (0.040) (0.033) (0.036) (0.046) (0.018)
Gender: ManVote for Democratic Progressive Party among highest-educated voters0.028 0.078*** 0.030 0.018 0.016
Vote for Democratic Progressive Party among lowest- educated voters(0.022) (0.018) (0.019) (0.025) (0.010)
Religion: Christian (baseline) (baseline) (baseline) (baseline) (baseline) (baseline)
(.) (.) (.) (.) (.) (.)
Religion: None 0.086 -0.058 -0.003 0.014 -0.000 -0.010
(0.065) (0.045) (0.038) (0.033) (0.041) (0.019)
Religion: Taoist 0.053 -0.057 0.020 0.002 0.011 -0.045**
(0.055) (0.044) (0.037) (0.030) (0.035) (0.018)
Employment status: Inactive 0.036 -0.055** -0.008 -0.083*** -0.037 -0.030**
(0.029) (0.028) (0.022) (0.023) (0.031) (0.012)
Marital status: Married / Partner -0.039 -0.078*** -0.002 -0.031 -0.032 -0.063***
(0.028) (0.029) (0.021) (0.021) (0.029) (0.011)
Union membership: Yes 0.029 0.003 0.020 -0.024 0.028 0.015
(0.027) (0.026) (0.024) (0.023) (0.031) (0.012)
Constant 0.017 0.449*** 0.368*** 0.389*** 0.555*** 0.322***
(0.086) (0.074) (0.073) (0.079) (0.097) (0.035)
R-squared 0.08 0.12 0.14 0.14 0.12 0.09
Source: authors' computations using Taiwanese political attitudes surveys.
Note: the table shows the results of a multivariate regression assessing the determinants of support for the DPP by year, and over the
entire period studied. 2004 is excluded since the ethnicity variable was not available.
* p<0.10, ** p<0.05, *** p<0.01
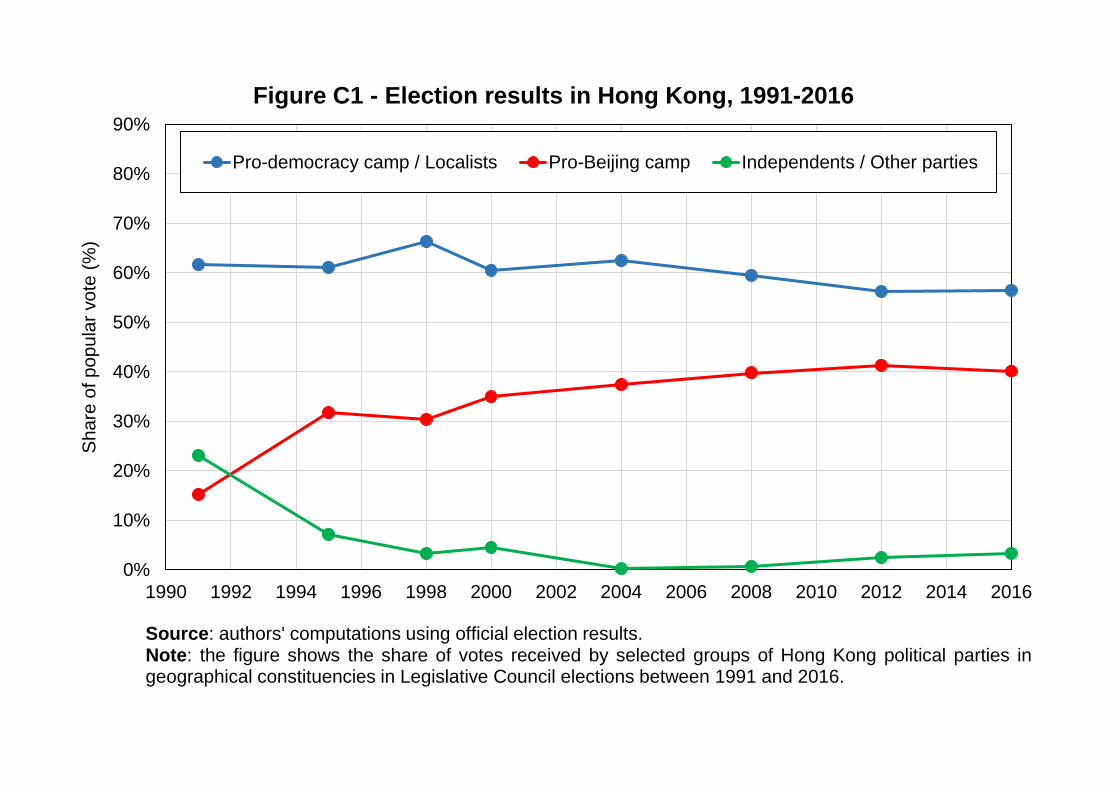
0%
10%
20%
30%
40%
50%
60%
70%
80%
90%
1990 1992 1994 1996 1998 2000 2002 2004 2006 2008 2010 2012 2014 2016
Sh
are
of p
op
ula
r vo
te (
%)
Figure C1 - Election results in Hong Kong, 1991-2016
Pro-democracy camp / Localists Pro-Beijing camp Independents / Other parties
Source: authors' computations using official election results.Note: the figure shows the share of votes received by selected groups of Hong Kong political parties ingeographical constituencies in Legislative Council elections between 1991 and 2016.
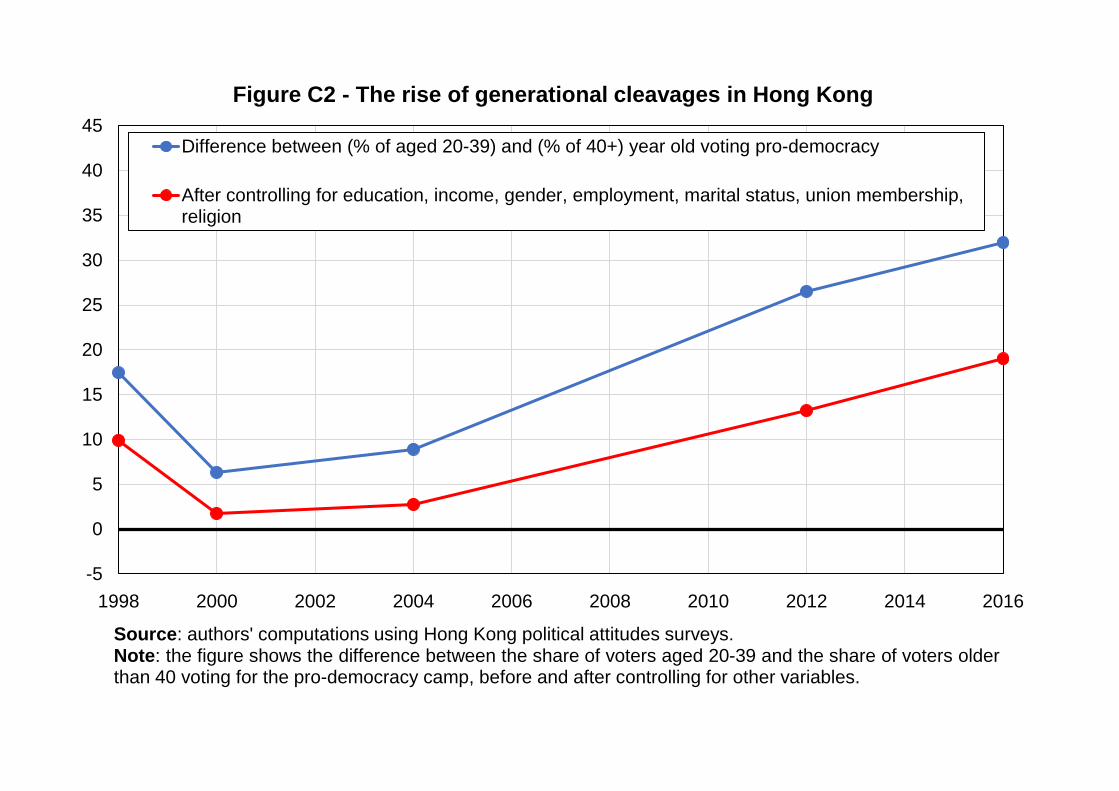
-5
0
5
10
15
20
25
30
35
40
45
1998 2000 2002 2004 2006 2008 2010 2012 2014 2016
Figure C2 - The rise of generational cleavages in Hong Kong
Difference between (% of aged 20-39) and (% of 40+) year old voting pro-democracy
After controlling for education, income, gender, employment, marital status, union membership,religion
Source: authors' computations using Hong Kong political attitudes surveys.Note: the figure shows the difference between the share of voters aged 20-39 and the share of voters olderthan 40 voting for the pro-democracy camp, before and after controlling for other variables.
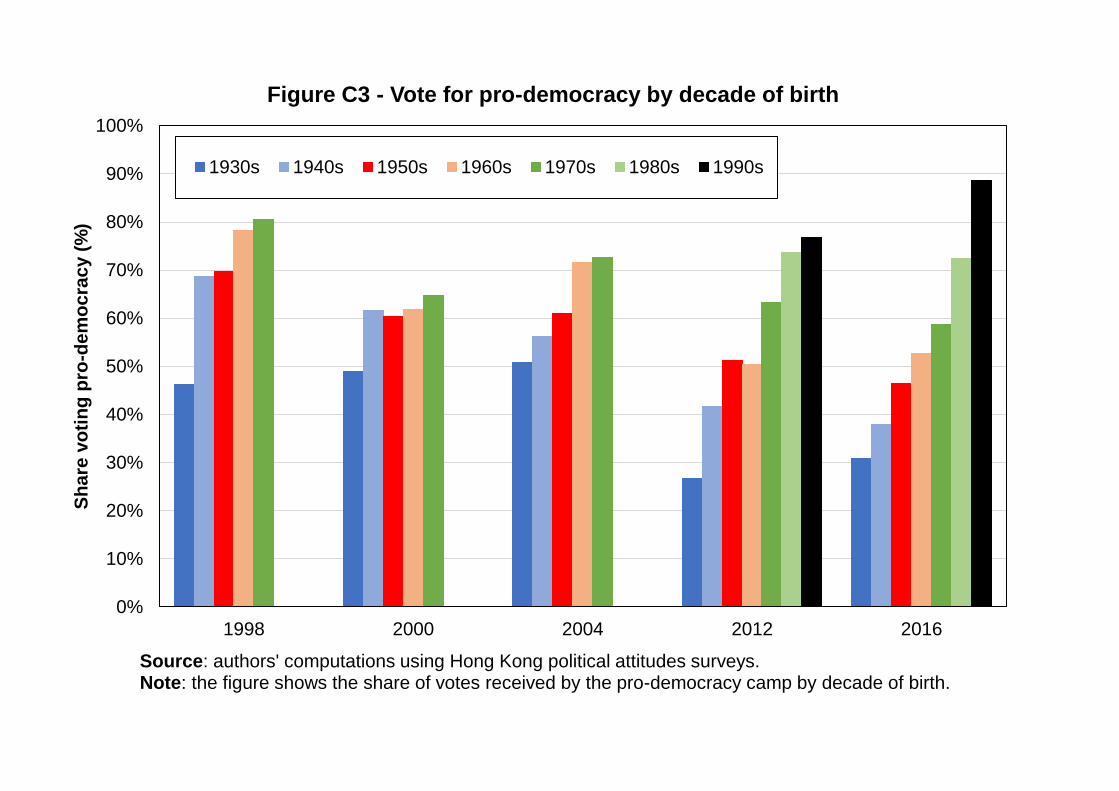
0%
10%
20%
30%
40%
50%
60%
70%
80%
90%
100%
1998 2000 2004 2012 2016
Sh
are
vo
tin
g p
ro-d
em
ocra
cy (
%)
Figure C3 - Vote for pro-democracy by decade of birth
1930s 1940s 1950s 1960s 1970s 1980s 1990s
Source: authors' computations using Hong Kong political attitudes surveys.Note: the figure shows the share of votes received by the pro-democracy camp by decade of birth.
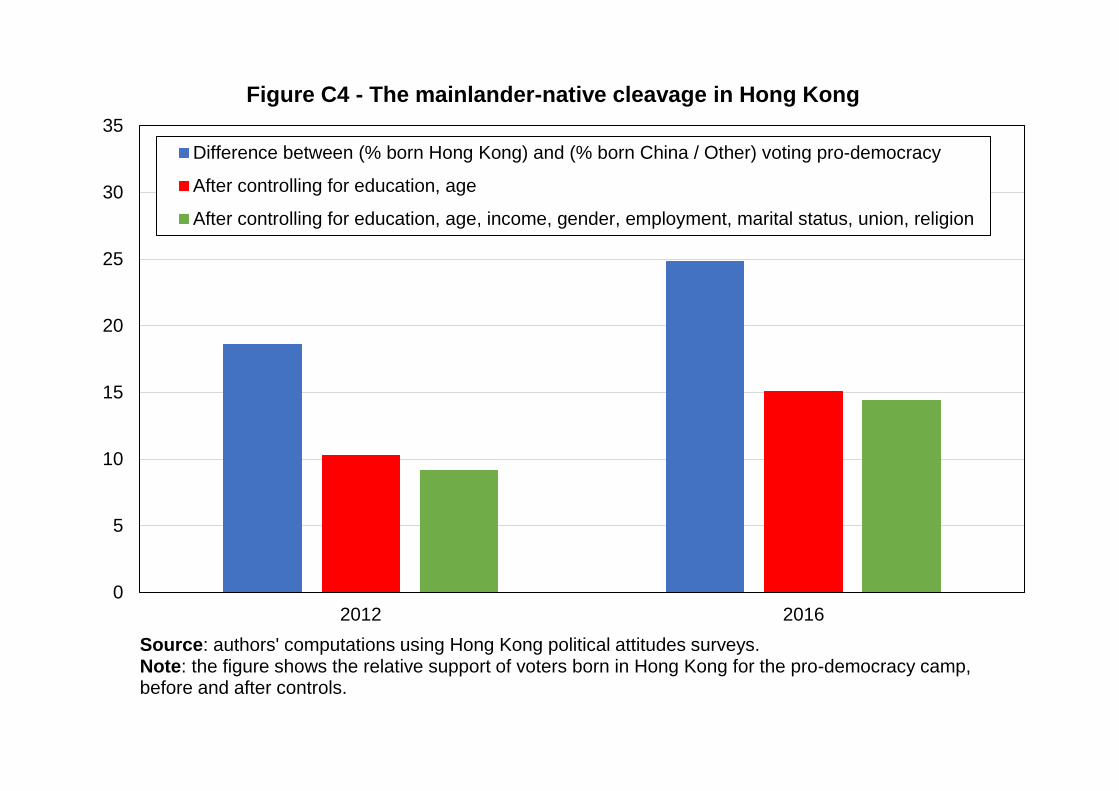
0
5
10
15
20
25
30
35
2012 2016
Figure C4 - The mainlander-native cleavage in Hong Kong
Difference between (% born Hong Kong) and (% born China / Other) voting pro-democracy
After controlling for education, age
After controlling for education, age, income, gender, employment, marital status, union, religion
Source: authors' computations using Hong Kong political attitudes surveys.Note: the figure shows the relative support of voters born in Hong Kong for the pro-democracy camp, before and after controls.
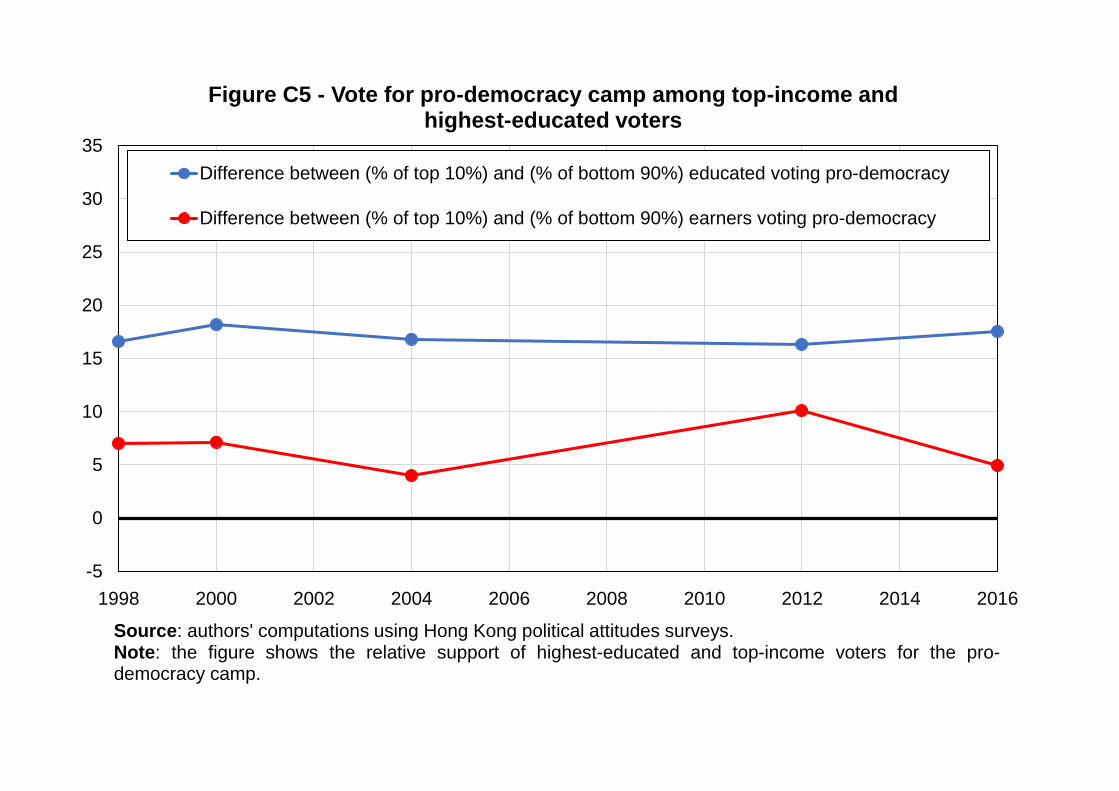
-5
0
5
10
15
20
25
30
35
1998 2000 2002 2004 2006 2008 2010 2012 2014 2016
Figure C5 - Vote for pro-democracy camp among top-income and highest-educated voters
Difference between (% of top 10%) and (% of bottom 90%) educated voting pro-democracy
Difference between (% of top 10%) and (% of bottom 90%) earners voting pro-democracy
Source: authors' computations using Hong Kong political attitudes surveys.Note: the figure shows the relative support of highest-educated and top-income voters for the pro-democracy camp.
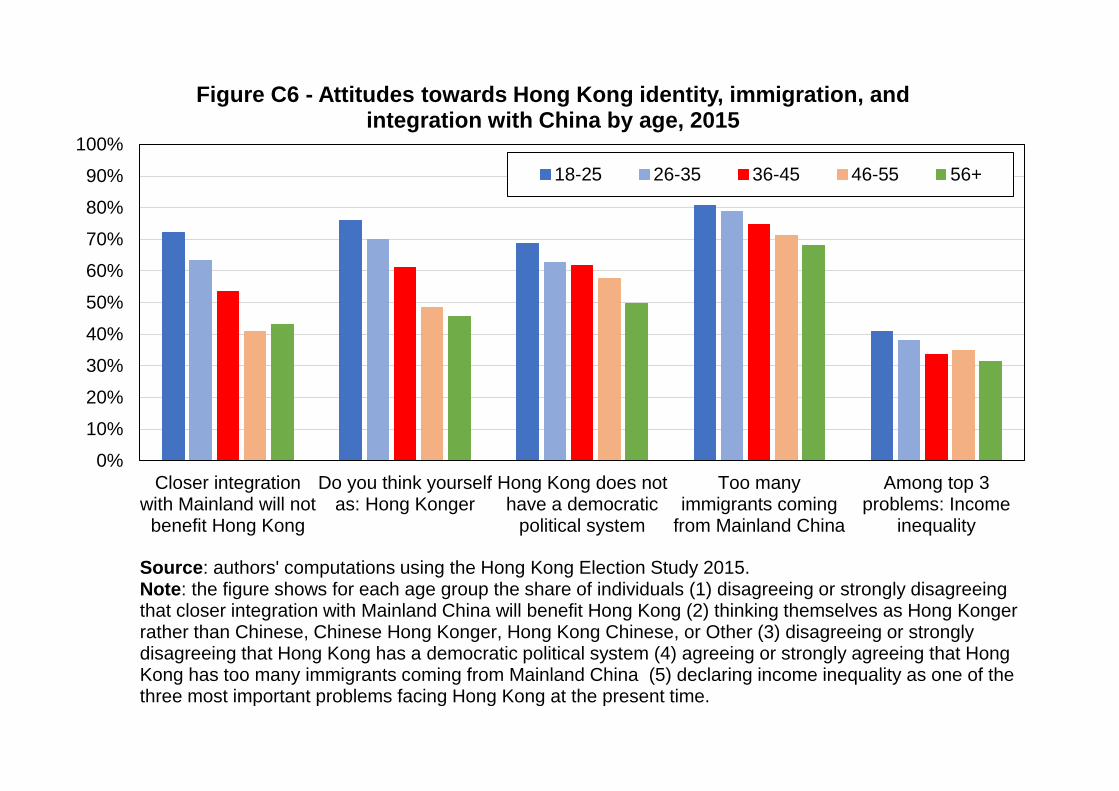
0%
10%
20%
30%
40%
50%
60%
70%
80%
90%
100%
Closer integrationwith Mainland will not
benefit Hong Kong
Do you think yourselfas: Hong Konger
Hong Kong does nothave a democratic
political system
Too manyimmigrants coming
from Mainland China
Among top 3problems: Income
inequality
Figure C6 - Attitudes towards Hong Kong identity, immigration, and integration with China by age, 2015
18-25 26-35 36-45 46-55 56+
Source: authors' computations using the Hong Kong Election Study 2015.Note: the figure shows for each age group the share of individuals (1) disagreeing or strongly disagreeing that closer integration with Mainland China will benefit Hong Kong (2) thinking themselves as Hong Konger rather than Chinese, Chinese Hong Konger, Hong Kong Chinese, or Other (3) disagreeing or strongly disagreeing that Hong Kong has a democratic political system (4) agreeing or strongly agreeing that Hong Kong has too many immigrants coming from Mainland China (5) declaring income inequality as one of the three most important problems facing Hong Kong at the present time.
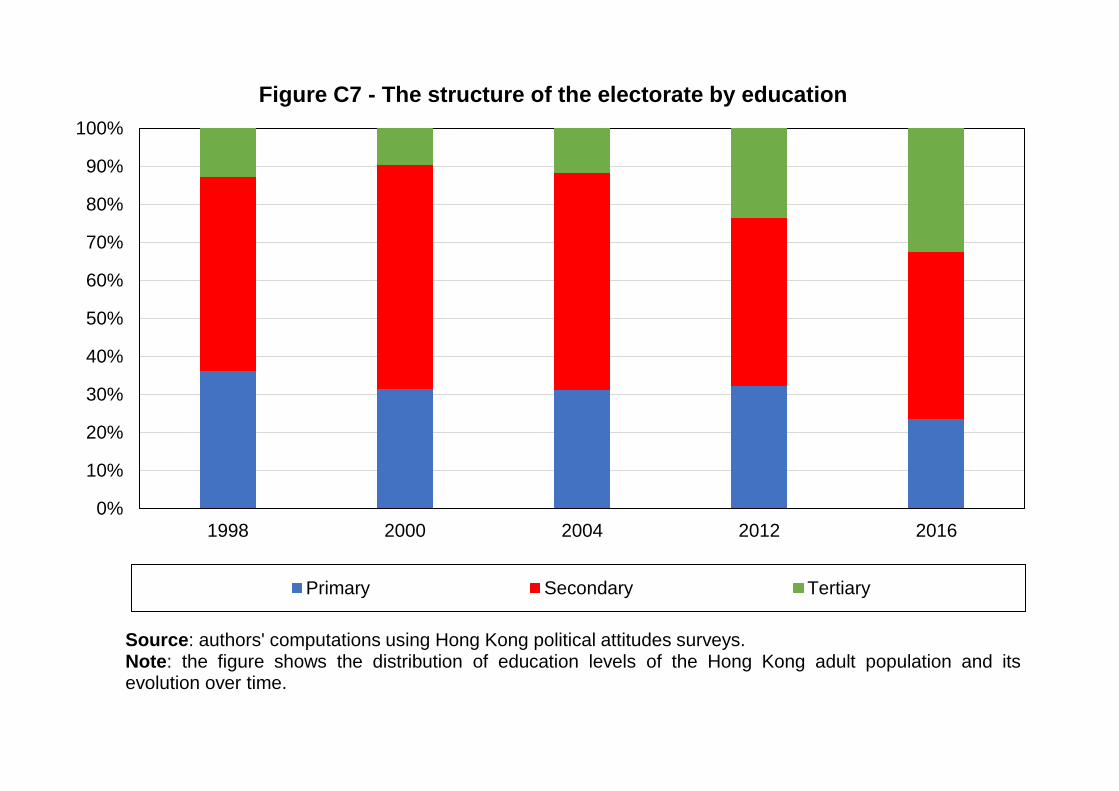
0%
10%
20%
30%
40%
50%
60%
70%
80%
90%
100%
1998 2000 2004 2012 2016
Figure C7 - The structure of the electorate by education
Primary Secondary Tertiary
Source: authors' computations using Hong Kong political attitudes surveys.Note: the figure shows the distribution of education levels of the Hong Kong adult population and itsevolution over time.
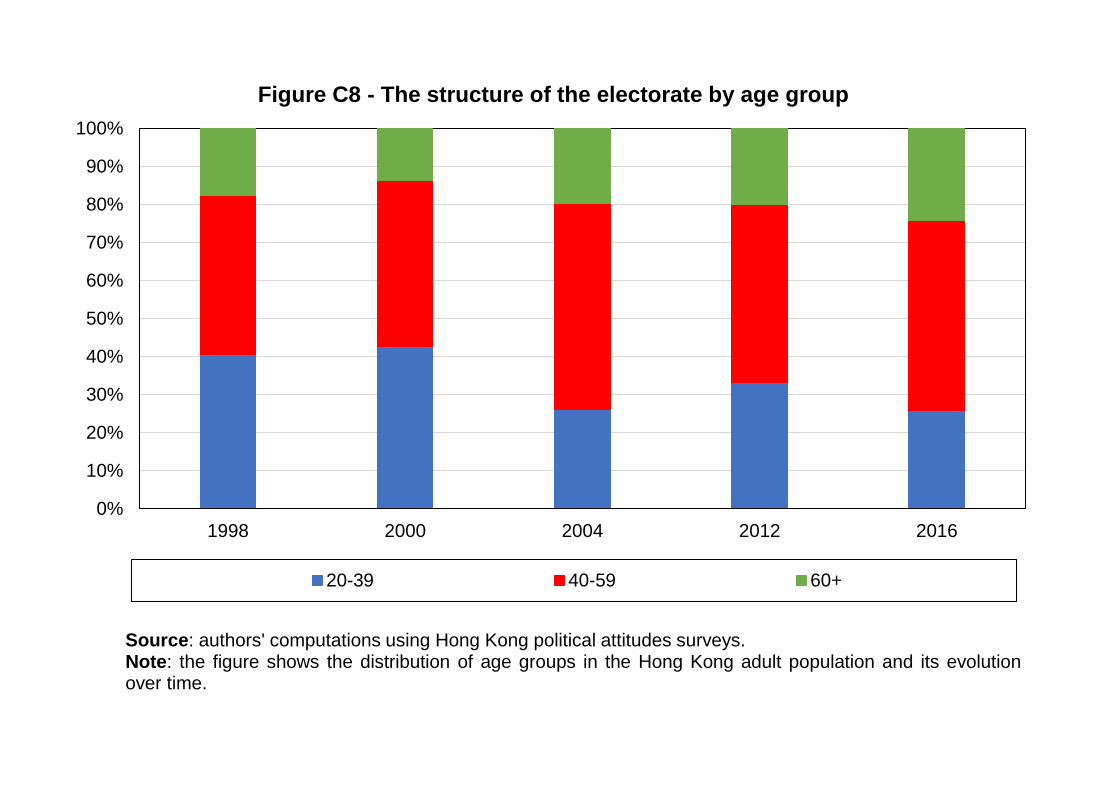
0%
10%
20%
30%
40%
50%
60%
70%
80%
90%
100%
1998 2000 2004 2012 2016
Figure C8 - The structure of the electorate by age group
20-39 40-59 60+
Source: authors' computations using Hong Kong political attitudes surveys.Note: the figure shows the distribution of age groups in the Hong Kong adult population and its evolutionover time.
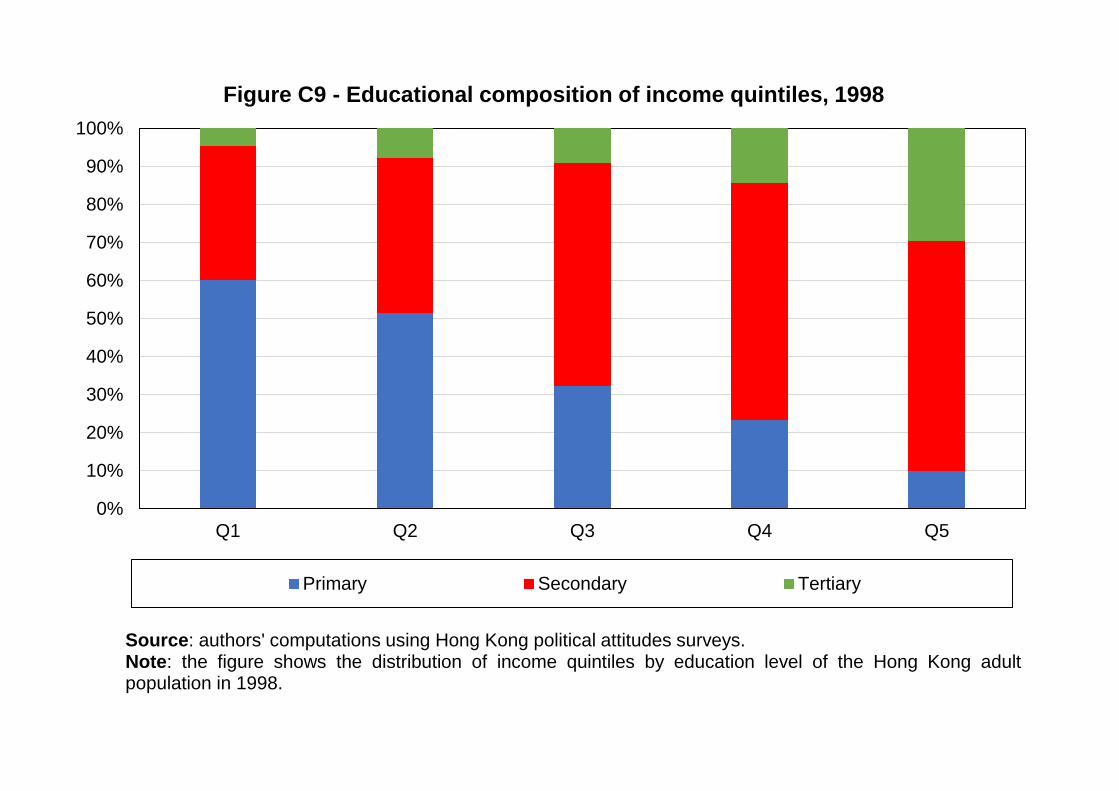
0%
10%
20%
30%
40%
50%
60%
70%
80%
90%
100%
Q1 Q2 Q3 Q4 Q5
Figure C9 - Educational composition of income quintiles, 1998
Primary Secondary Tertiary
Source: authors' computations using Hong Kong political attitudes surveys.Note: the figure shows the distribution of income quintiles by education level of the Hong Kong adultpopulation in 1998.
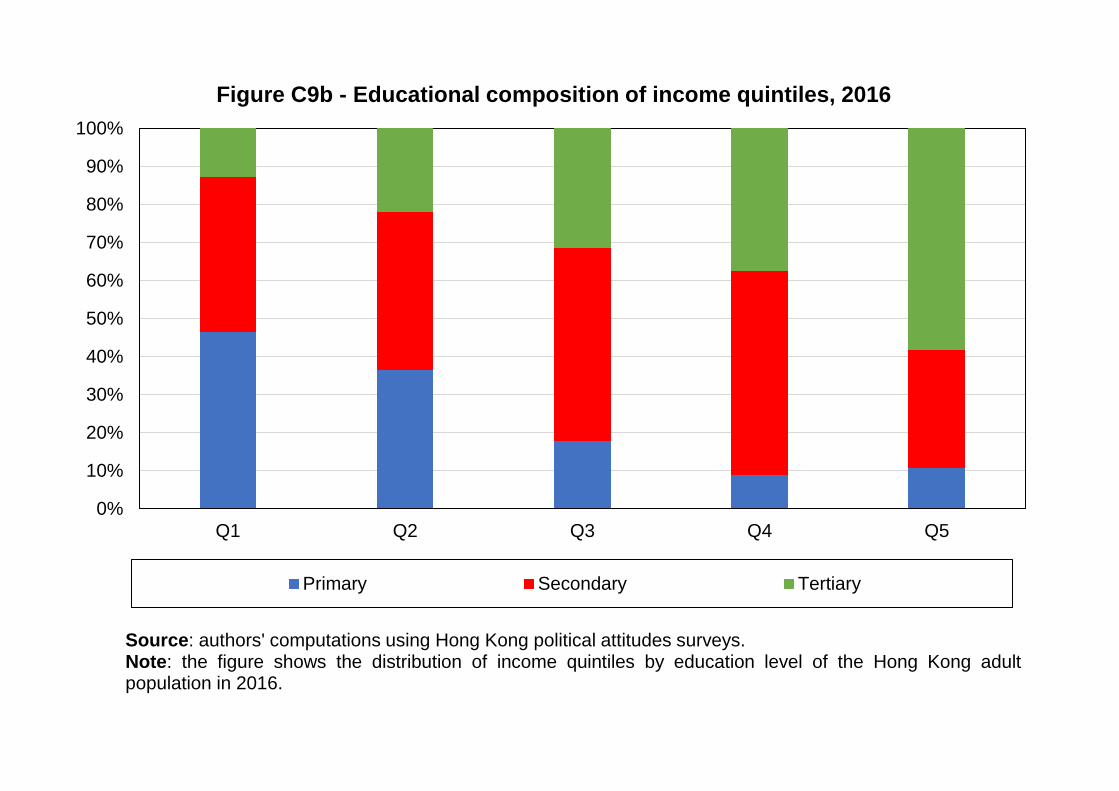
0%
10%
20%
30%
40%
50%
60%
70%
80%
90%
100%
Q1 Q2 Q3 Q4 Q5
Figure C9b - Educational composition of income quintiles, 2016
Primary Secondary Tertiary
Source: authors' computations using Hong Kong political attitudes surveys.Note: the figure shows the distribution of income quintiles by education level of the Hong Kong adultpopulation in 2016.
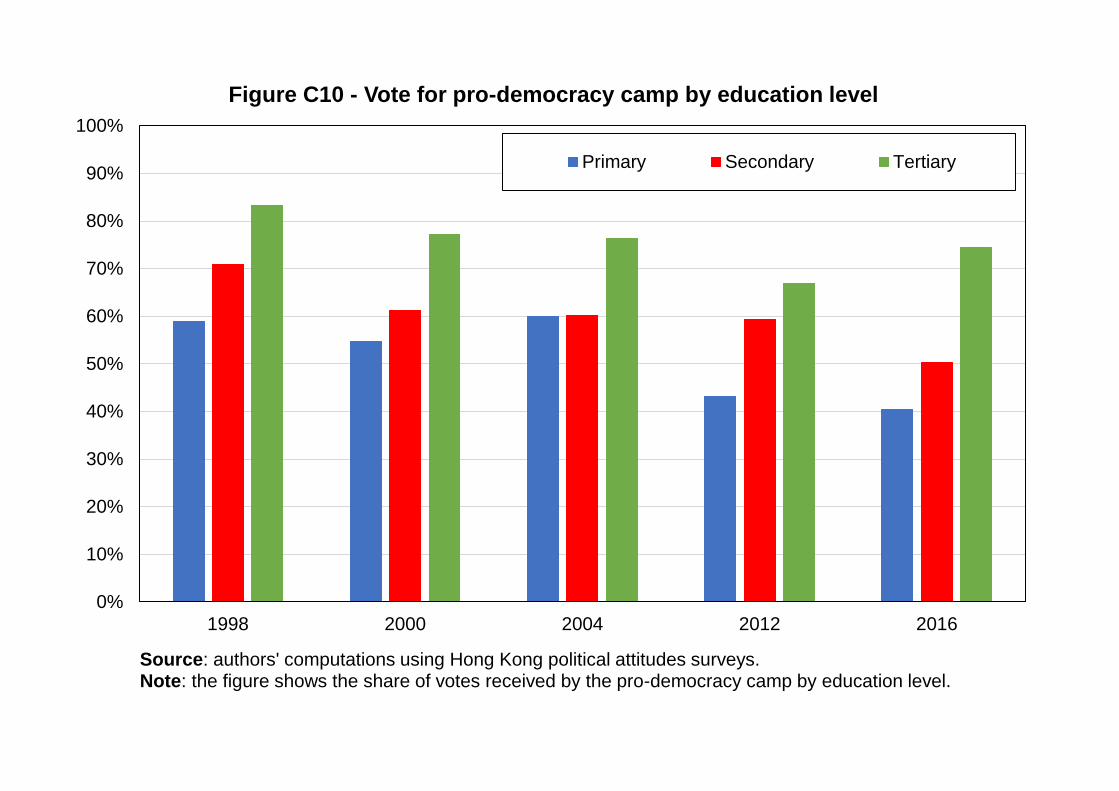
0%
10%
20%
30%
40%
50%
60%
70%
80%
90%
100%
1998 2000 2004 2012 2016
Figure C10 - Vote for pro-democracy camp by education level
Primary Secondary Tertiary
Source: authors' computations using Hong Kong political attitudes surveys.Note: the figure shows the share of votes received by the pro-democracy camp by education level.
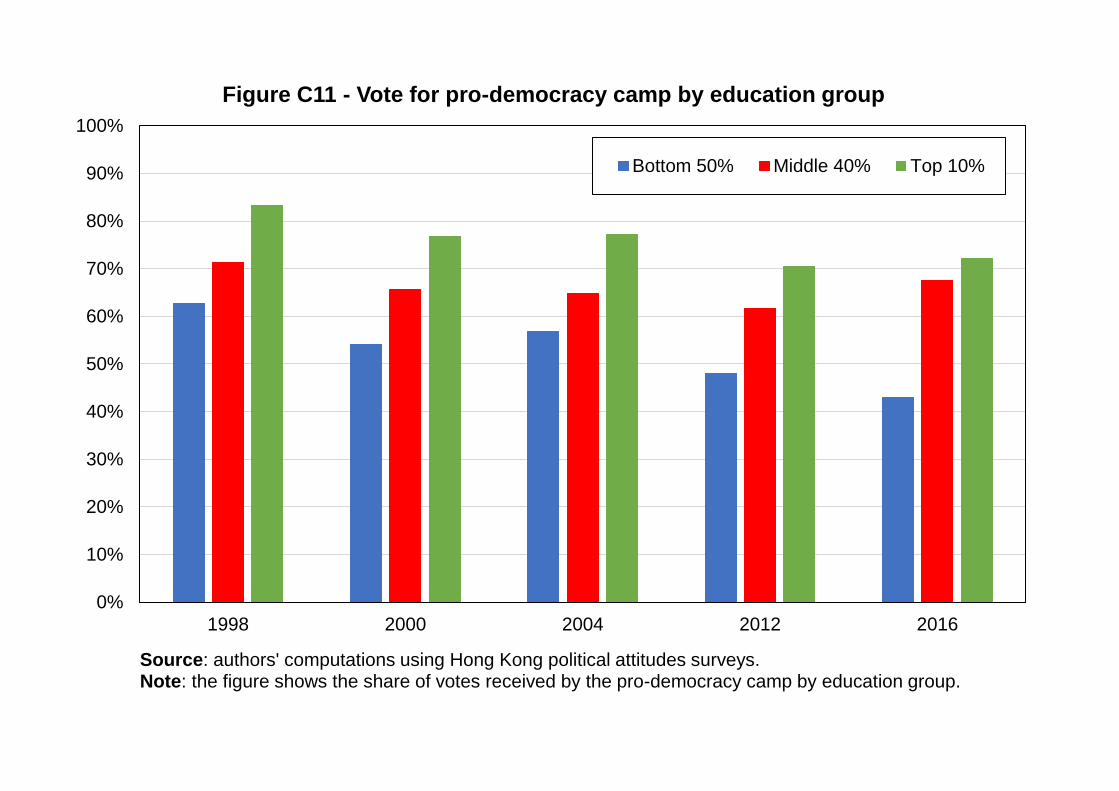
0%
10%
20%
30%
40%
50%
60%
70%
80%
90%
100%
1998 2000 2004 2012 2016
Figure C11 - Vote for pro-democracy camp by education group
Bottom 50% Middle 40% Top 10%
Source: authors' computations using Hong Kong political attitudes surveys.Note: the figure shows the share of votes received by the pro-democracy camp by education group.
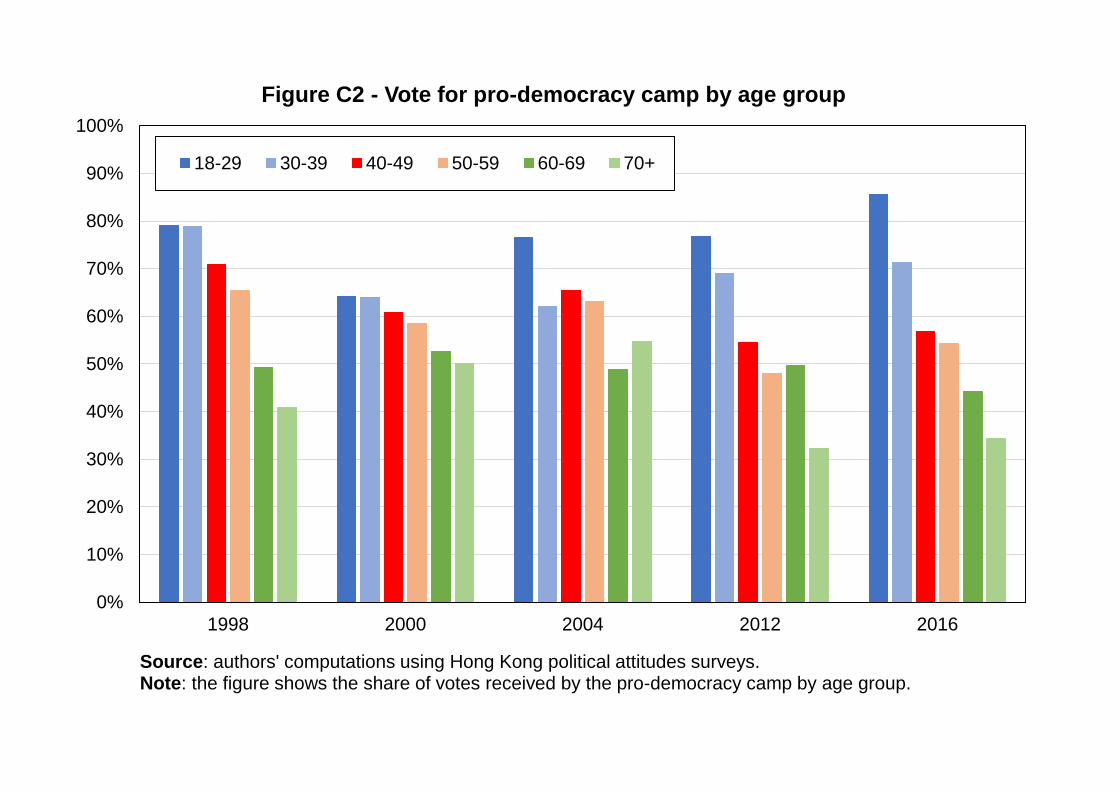
0%
10%
20%
30%
40%
50%
60%
70%
80%
90%
100%
1998 2000 2004 2012 2016
Figure C2 - Vote for pro-democracy camp by age group
18-29 30-39 40-49 50-59 60-69 70+
Source: authors' computations using Hong Kong political attitudes surveys.Note: the figure shows the share of votes received by the pro-democracy camp by age group.
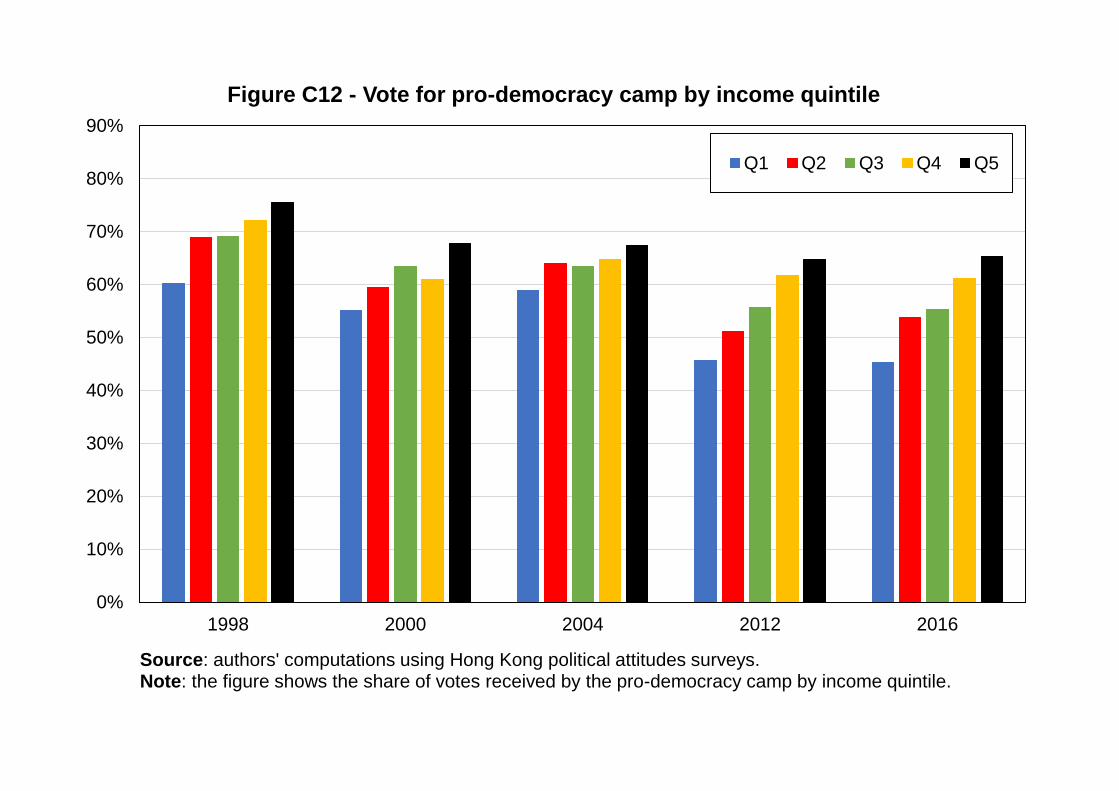
0%
10%
20%
30%
40%
50%
60%
70%
80%
90%
1998 2000 2004 2012 2016
Figure C12 - Vote for pro-democracy camp by income quintile
Q1 Q2 Q3 Q4 Q5
Source: authors' computations using Hong Kong political attitudes surveys.Note: the figure shows the share of votes received by the pro-democracy camp by income quintile.
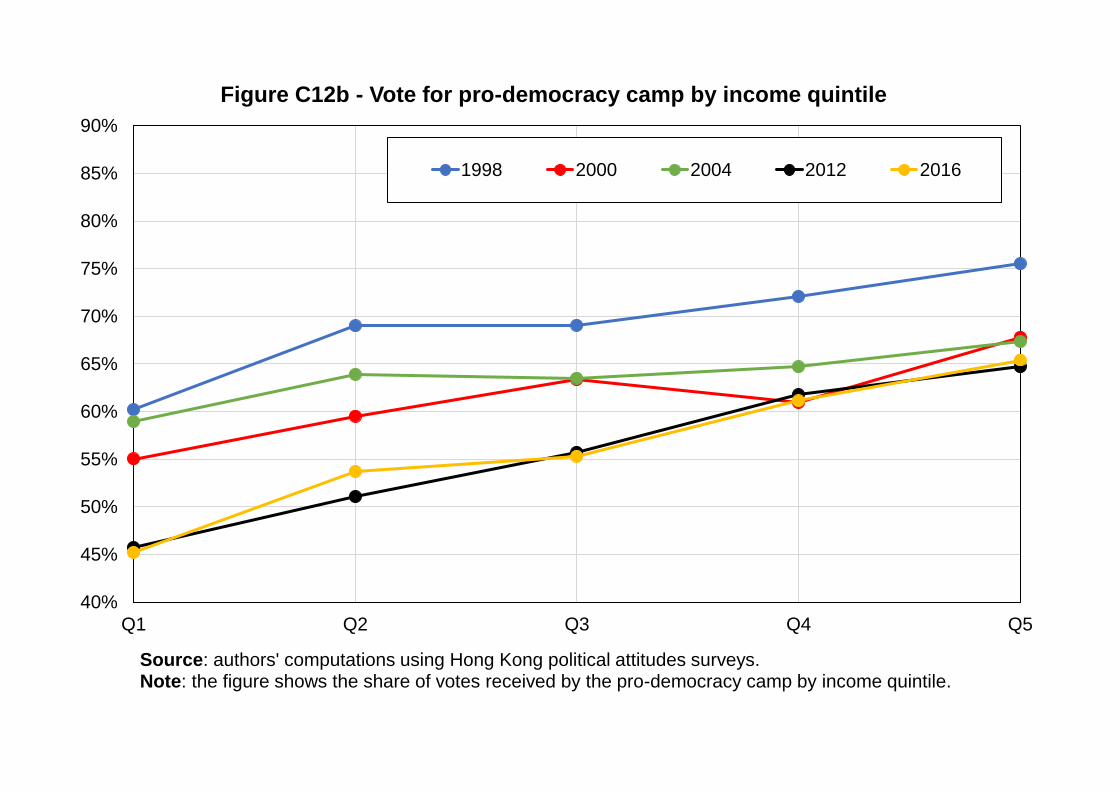
40%
45%
50%
55%
60%
65%
70%
75%
80%
85%
90%
Q1 Q2 Q3 Q4 Q5
Figure C12b - Vote for pro-democracy camp by income quintile
1998 2000 2004 2012 2016
Source: authors' computations using Hong Kong political attitudes surveys.Note: the figure shows the share of votes received by the pro-democracy camp by income quintile.
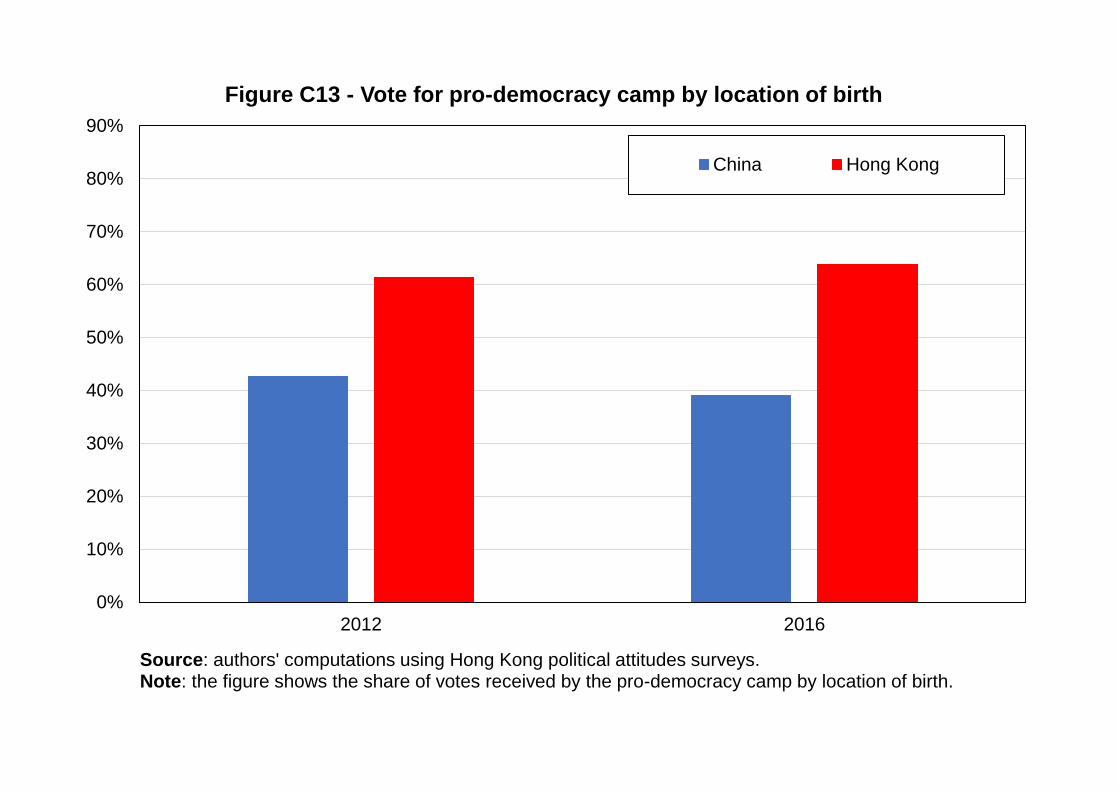
0%
10%
20%
30%
40%
50%
60%
70%
80%
90%
2012 2016
Figure C13 - Vote for pro-democracy camp by location of birth
China Hong Kong
Source: authors' computations using Hong Kong political attitudes surveys.Note: the figure shows the share of votes received by the pro-democracy camp by location of birth.
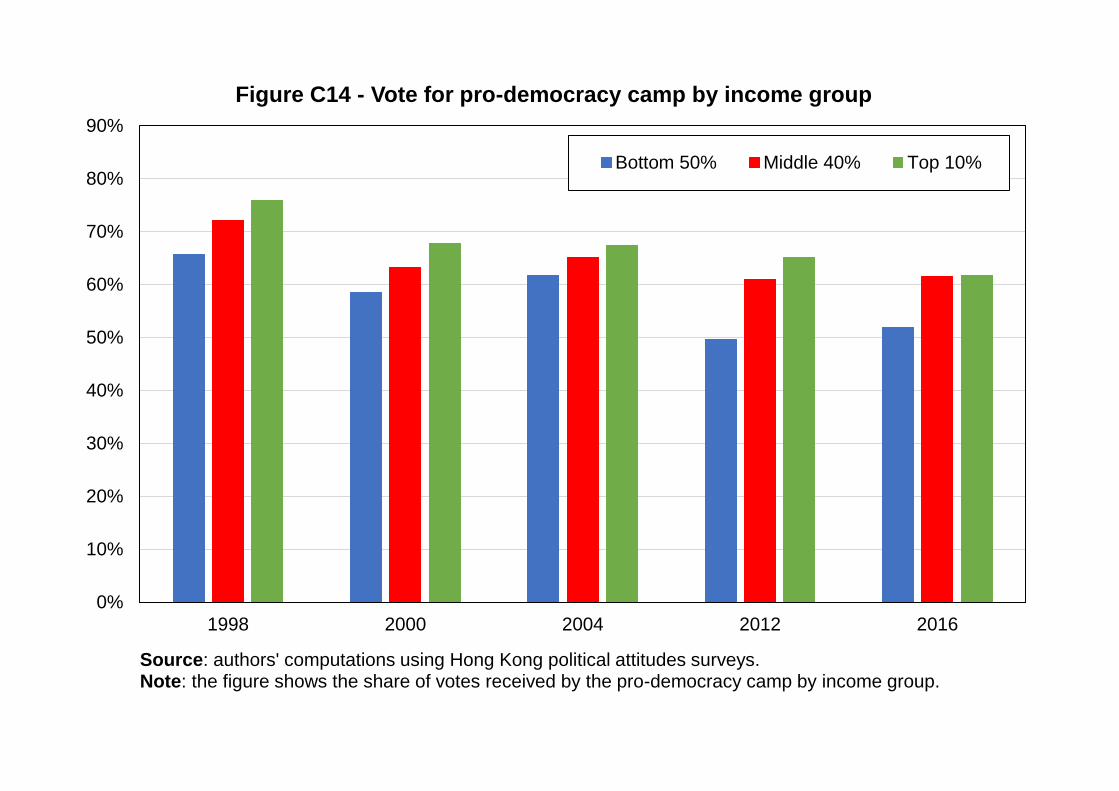
0%
10%
20%
30%
40%
50%
60%
70%
80%
90%
1998 2000 2004 2012 2016
Figure C14 - Vote for pro-democracy camp by income group
Bottom 50% Middle 40% Top 10%
Source: authors' computations using Hong Kong political attitudes surveys.Note: the figure shows the share of votes received by the pro-democracy camp by income group.
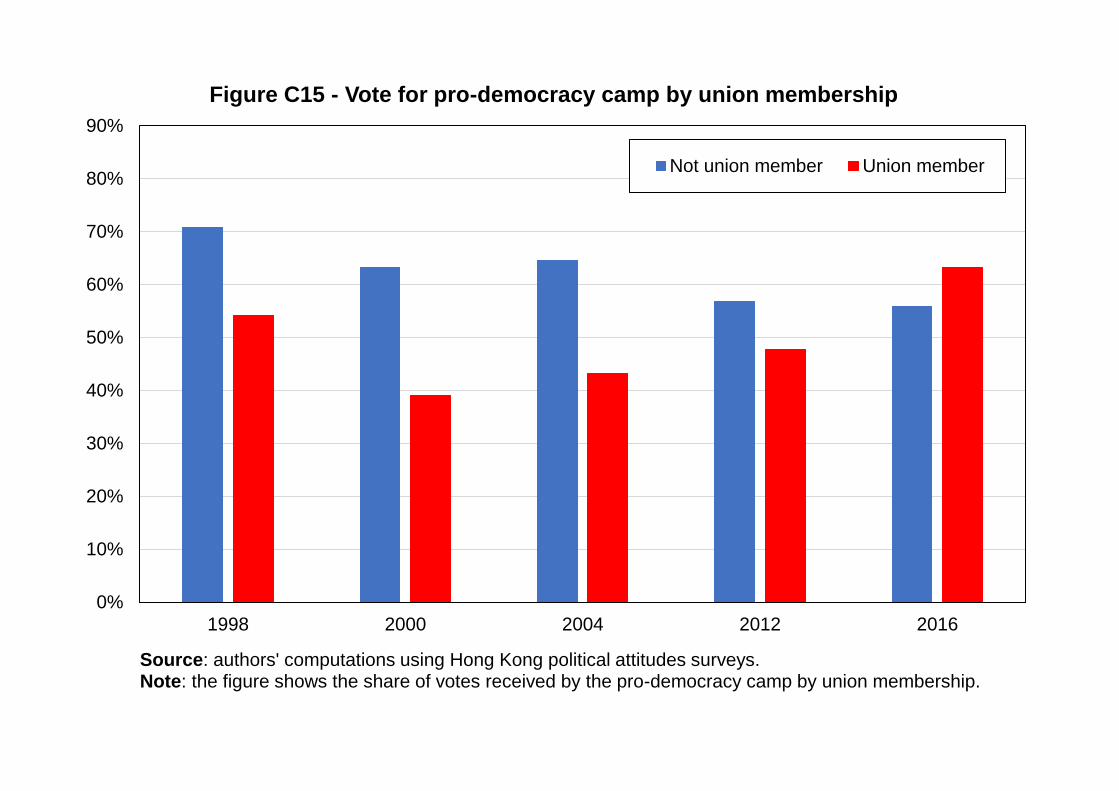
0%
10%
20%
30%
40%
50%
60%
70%
80%
90%
1998 2000 2004 2012 2016
Figure C15 - Vote for pro-democracy camp by union membership
Not union member Union member
Source: authors' computations using Hong Kong political attitudes surveys.Note: the figure shows the share of votes received by the pro-democracy camp by union membership.
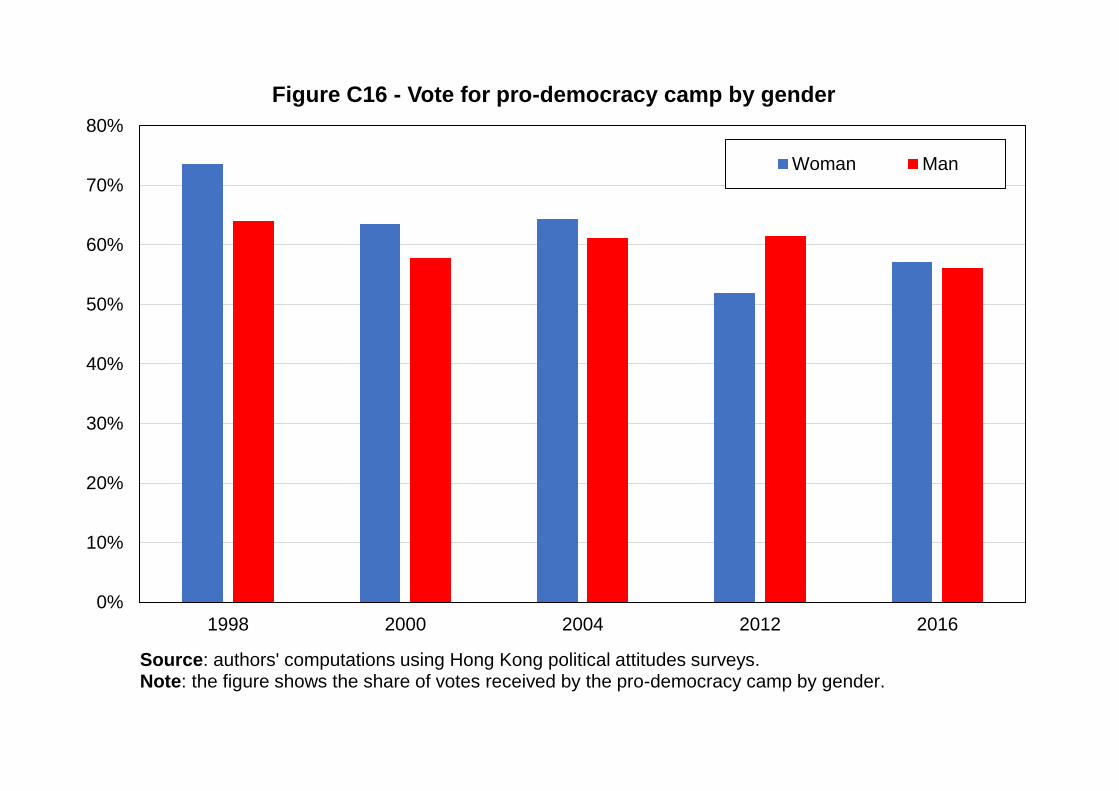
0%
10%
20%
30%
40%
50%
60%
70%
80%
1998 2000 2004 2012 2016
Figure C16 - Vote for pro-democracy camp by gender
Woman Man
Source: authors' computations using Hong Kong political attitudes surveys.Note: the figure shows the share of votes received by the pro-democracy camp by gender.
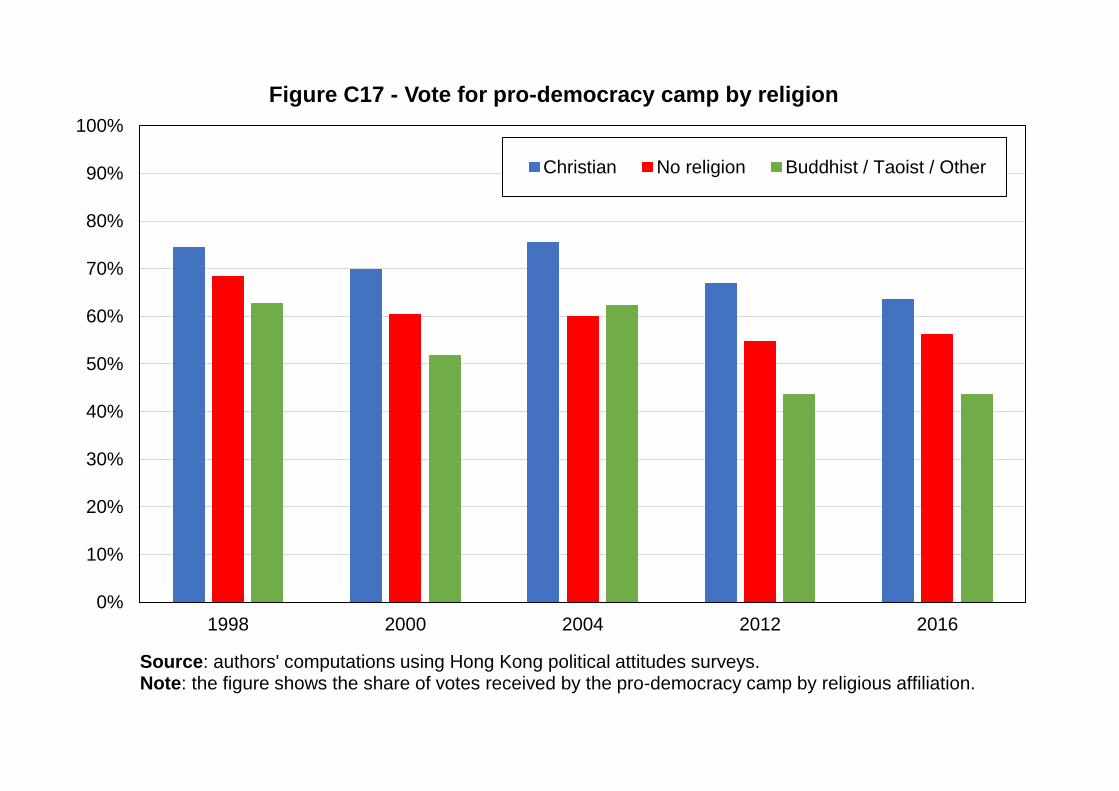
0%
10%
20%
30%
40%
50%
60%
70%
80%
90%
100%
1998 2000 2004 2012 2016
Figure C17 - Vote for pro-democracy camp by religion
Christian No religion Buddhist / Taoist / Other
Source: authors' computations using Hong Kong political attitudes surveys.Note: the figure shows the share of votes received by the pro-democracy camp by religious affiliation.
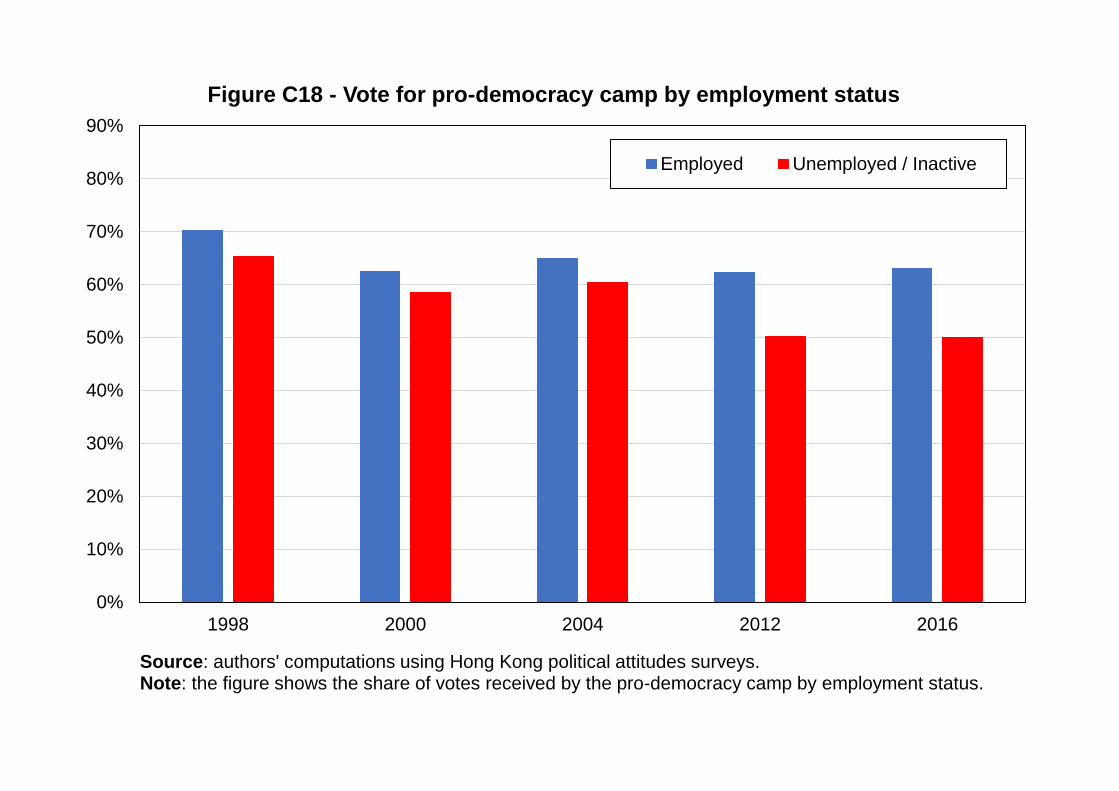
0%
10%
20%
30%
40%
50%
60%
70%
80%
90%
1998 2000 2004 2012 2016
Figure C18 - Vote for pro-democracy camp by employment status
Employed Unemployed / Inactive
Source: authors' computations using Hong Kong political attitudes surveys.Note: the figure shows the share of votes received by the pro-democracy camp by employment status.
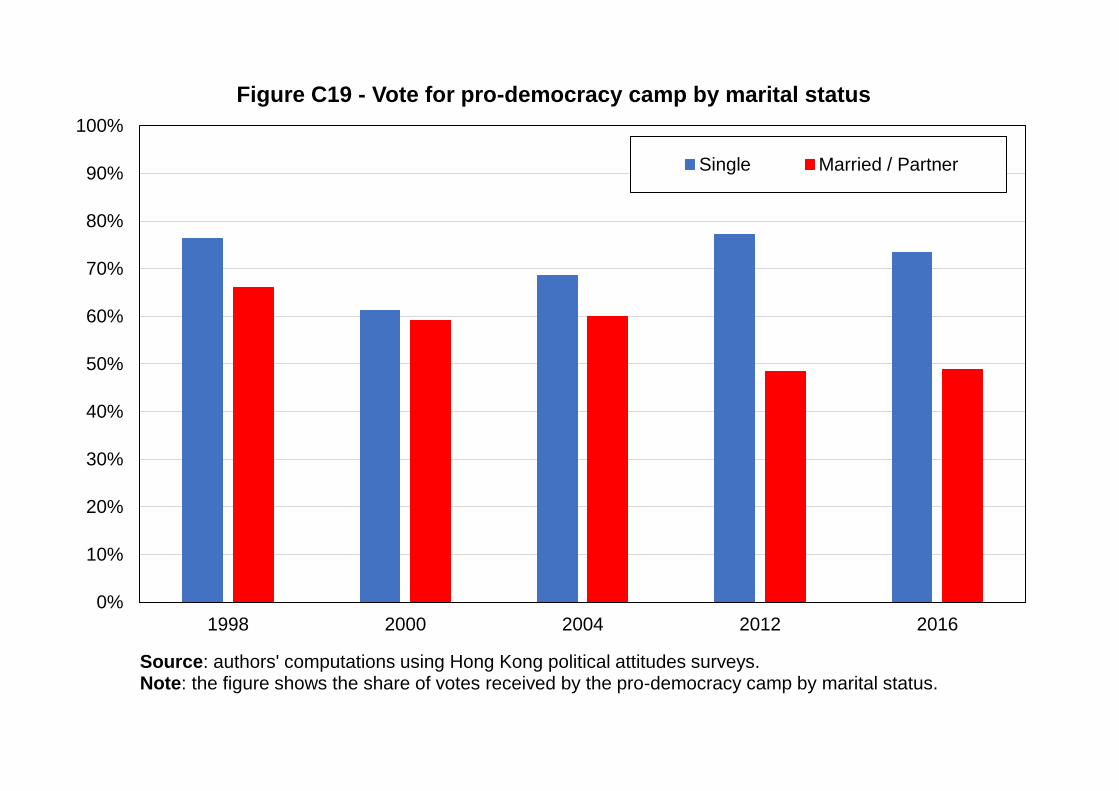
0%
10%
20%
30%
40%
50%
60%
70%
80%
90%
100%
1998 2000 2004 2012 2016
Figure C19 - Vote for pro-democracy camp by marital status
Single Married / Partner
Source: authors' computations using Hong Kong political attitudes surveys.Note: the figure shows the share of votes received by the pro-democracy camp by marital status.
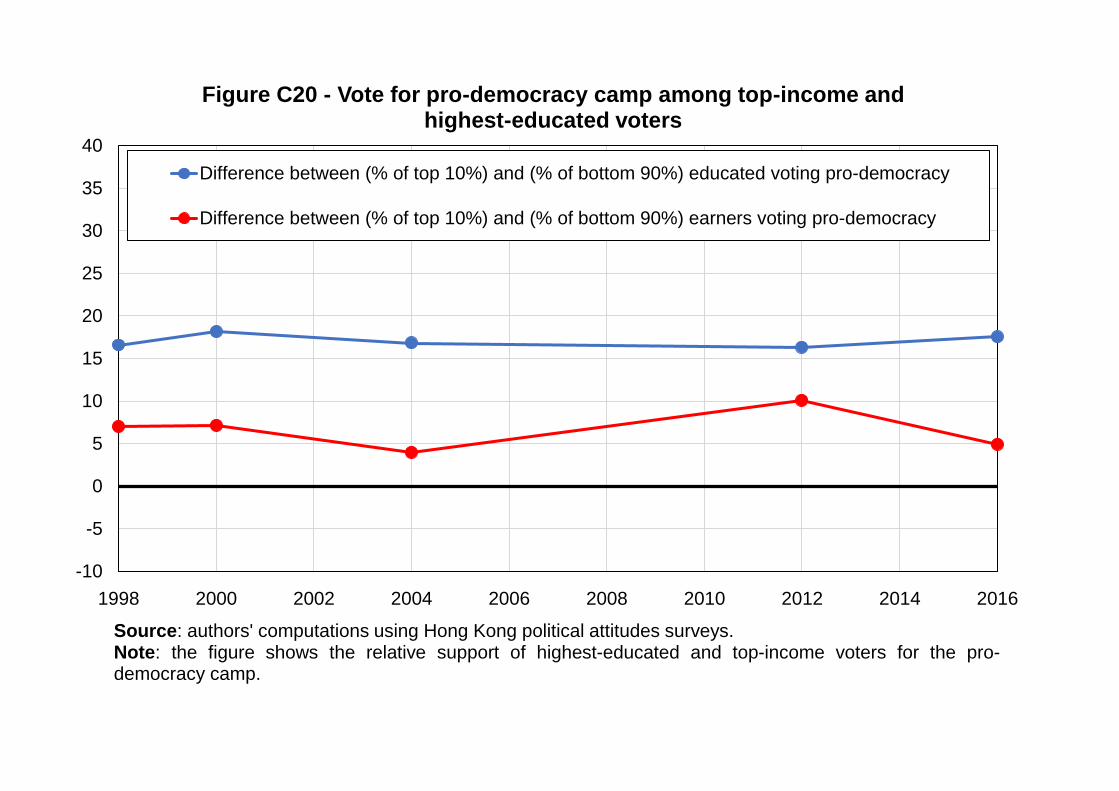
-10
-5
0
5
10
15
20
25
30
35
40
1998 2000 2002 2004 2006 2008 2010 2012 2014 2016
Figure C20 - Vote for pro-democracy camp among top-income and highest-educated voters
Difference between (% of top 10%) and (% of bottom 90%) educated voting pro-democracy
Difference between (% of top 10%) and (% of bottom 90%) earners voting pro-democracy
Source: authors' computations using Hong Kong political attitudes surveys.Note: the figure shows the relative support of highest-educated and top-income voters for the pro-democracy camp.
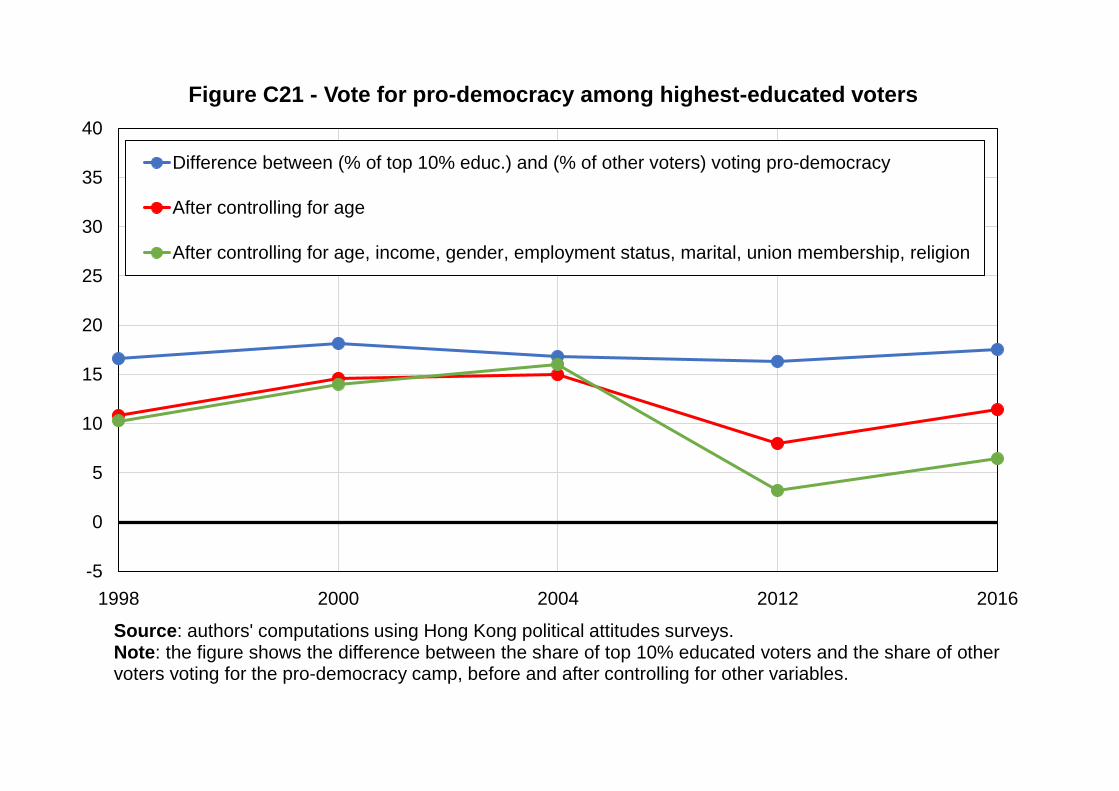
-5
0
5
10
15
20
25
30
35
40
1998 2000 2004 2012 2016
Figure C21 - Vote for pro-democracy among highest-educated voters
Difference between (% of top 10% educ.) and (% of other voters) voting pro-democracy
After controlling for age
After controlling for age, income, gender, employment status, marital, union membership, religion
Source: authors' computations using Hong Kong political attitudes surveys.Note: the figure shows the difference between the share of top 10% educated voters and the share of othervoters voting for the pro-democracy camp, before and after controlling for other variables.
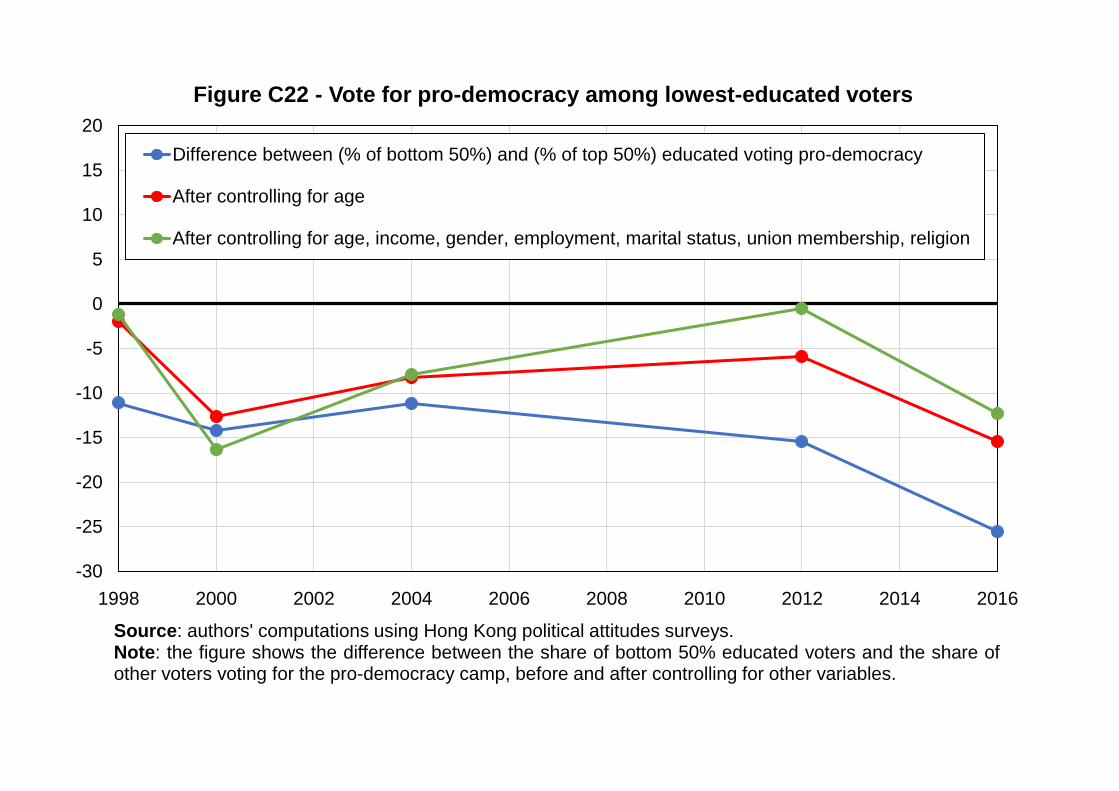
-30
-25
-20
-15
-10
-5
0
5
10
15
20
1998 2000 2002 2004 2006 2008 2010 2012 2014 2016
Figure C22 - Vote for pro-democracy among lowest-educated voters
Difference between (% of bottom 50%) and (% of top 50%) educated voting pro-democracy
After controlling for age
After controlling for age, income, gender, employment, marital status, union membership, religion
Source: authors' computations using Hong Kong political attitudes surveys.Note: the figure shows the difference between the share of bottom 50% educated voters and the share ofother voters voting for the pro-democracy camp, before and after controlling for other variables.
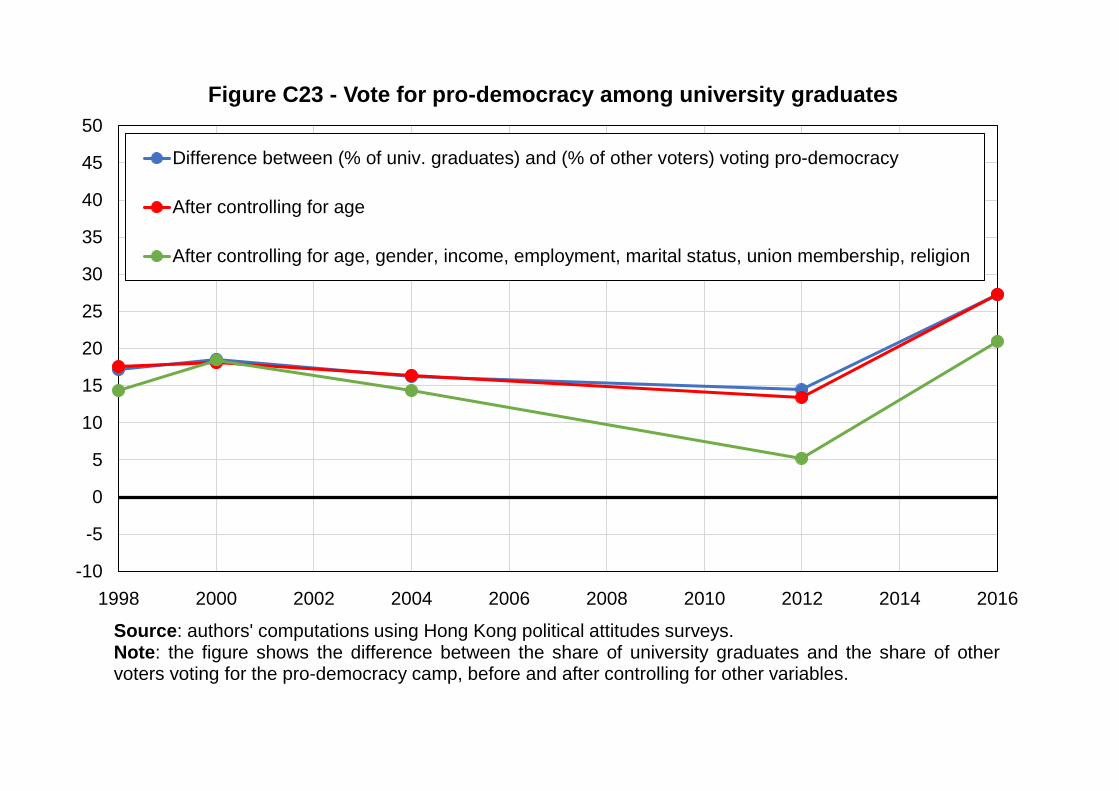
-10
-5
0
5
10
15
20
25
30
35
40
45
50
1998 2000 2002 2004 2006 2008 2010 2012 2014 2016
Figure C23 - Vote for pro-democracy among university graduates
Difference between (% of univ. graduates) and (% of other voters) voting pro-democracy
After controlling for age
After controlling for age, gender, income, employment, marital status, union membership, religion
Source: authors' computations using Hong Kong political attitudes surveys.Note: the figure shows the difference between the share of university graduates and the share of othervoters voting for the pro-democracy camp, before and after controlling for other variables.
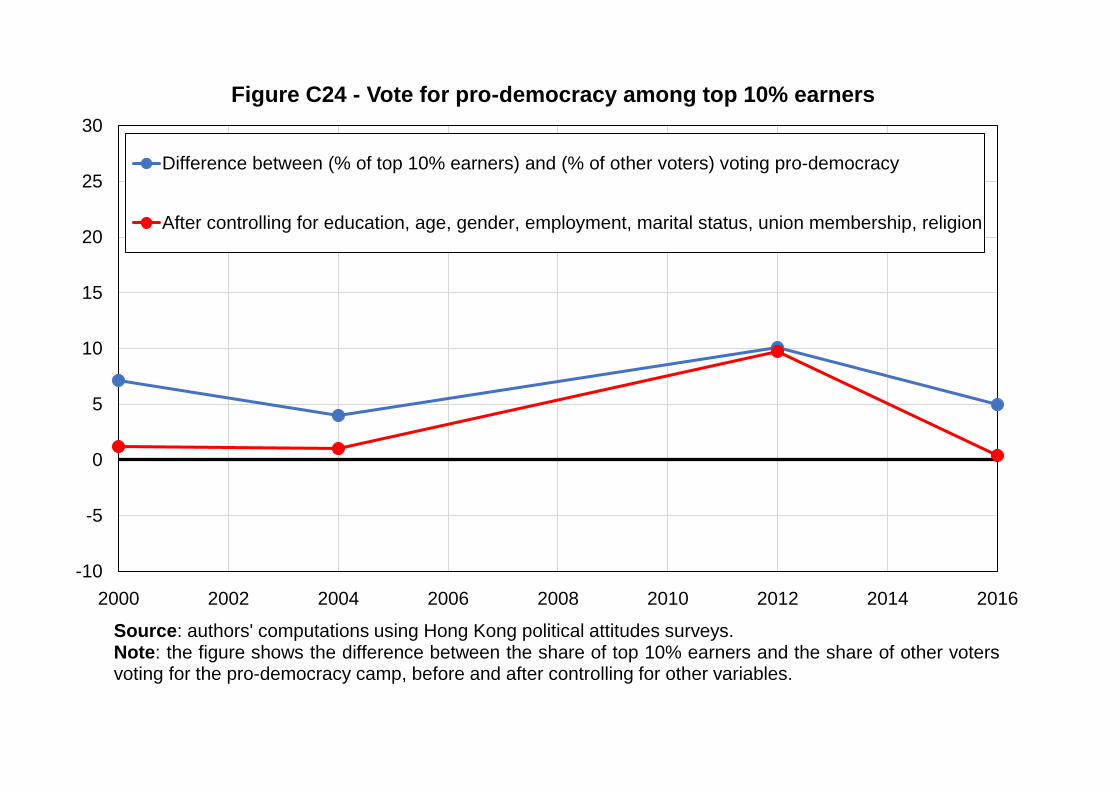
-10
-5
0
5
10
15
20
25
30
2000 2002 2004 2006 2008 2010 2012 2014 2016
Figure C24 - Vote for pro-democracy among top 10% earners
Difference between (% of top 10% earners) and (% of other voters) voting pro-democracy
After controlling for education, age, gender, employment, marital status, union membership, religion
Source: authors' computations using Hong Kong political attitudes surveys.Note: the figure shows the difference between the share of top 10% earners and the share of other votersvoting for the pro-democracy camp, before and after controlling for other variables.
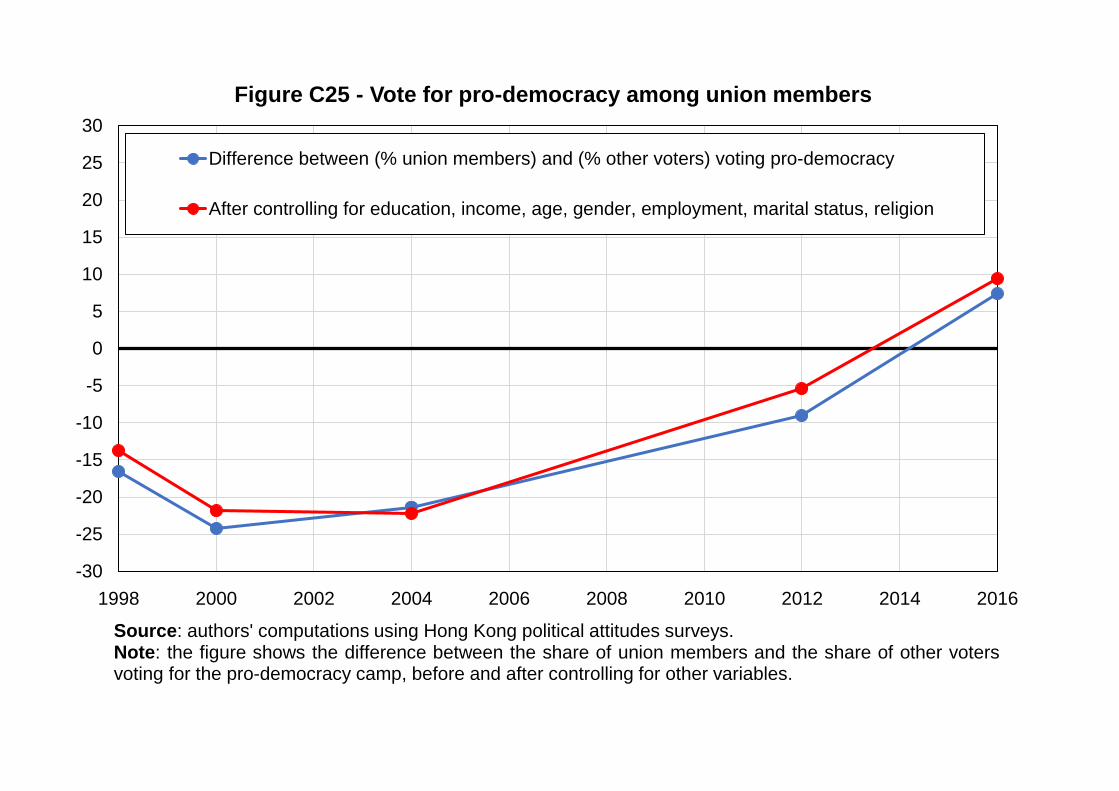
-30
-25
-20
-15
-10
-5
0
5
10
15
20
25
30
1998 2000 2002 2004 2006 2008 2010 2012 2014 2016
Figure C25 - Vote for pro-democracy among union members
Difference between (% union members) and (% other voters) voting pro-democracy
After controlling for education, income, age, gender, employment, marital status, religion
Source: authors' computations using Hong Kong political attitudes surveys.Note: the figure shows the difference between the share of union members and the share of other votersvoting for the pro-democracy camp, before and after controlling for other variables.
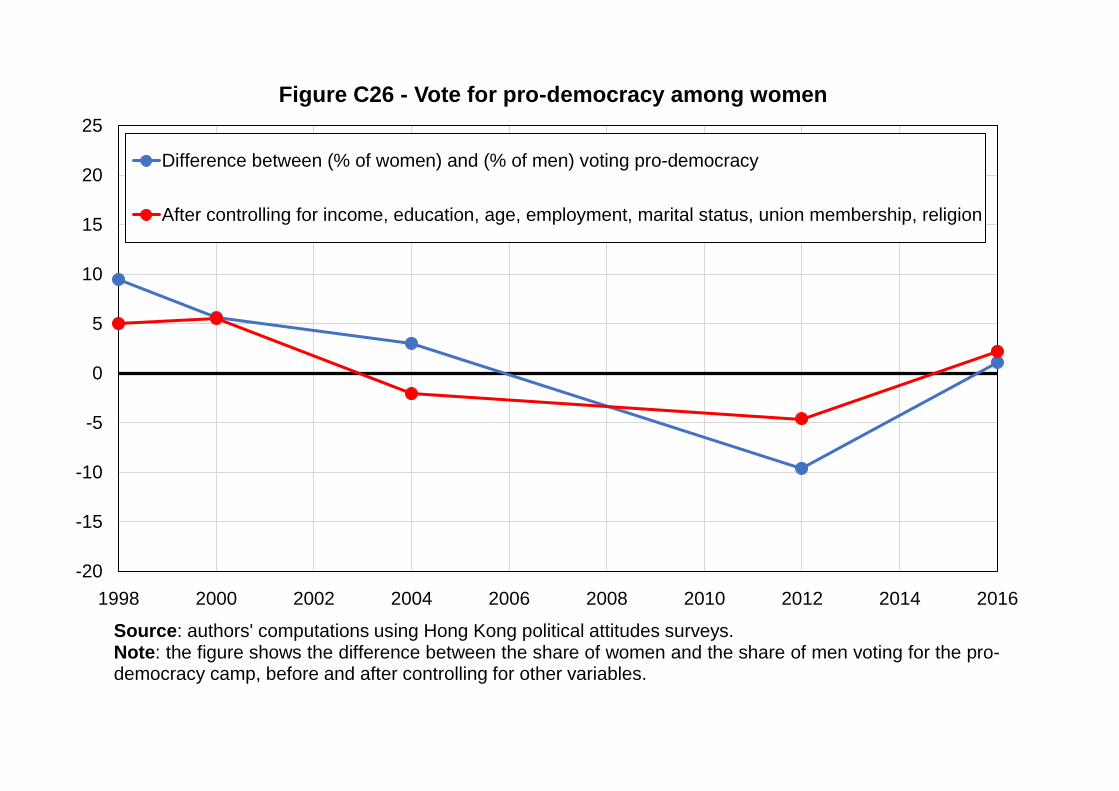
-20
-15
-10
-5
0
5
10
15
20
25
1998 2000 2002 2004 2006 2008 2010 2012 2014 2016
Figure C26 - Vote for pro-democracy among women
Difference between (% of women) and (% of men) voting pro-democracy
After controlling for income, education, age, employment, marital status, union membership, religion
Source: authors' computations using Hong Kong political attitudes surveys.Note: the figure shows the difference between the share of women and the share of men voting for the pro-democracy camp, before and after controlling for other variables.
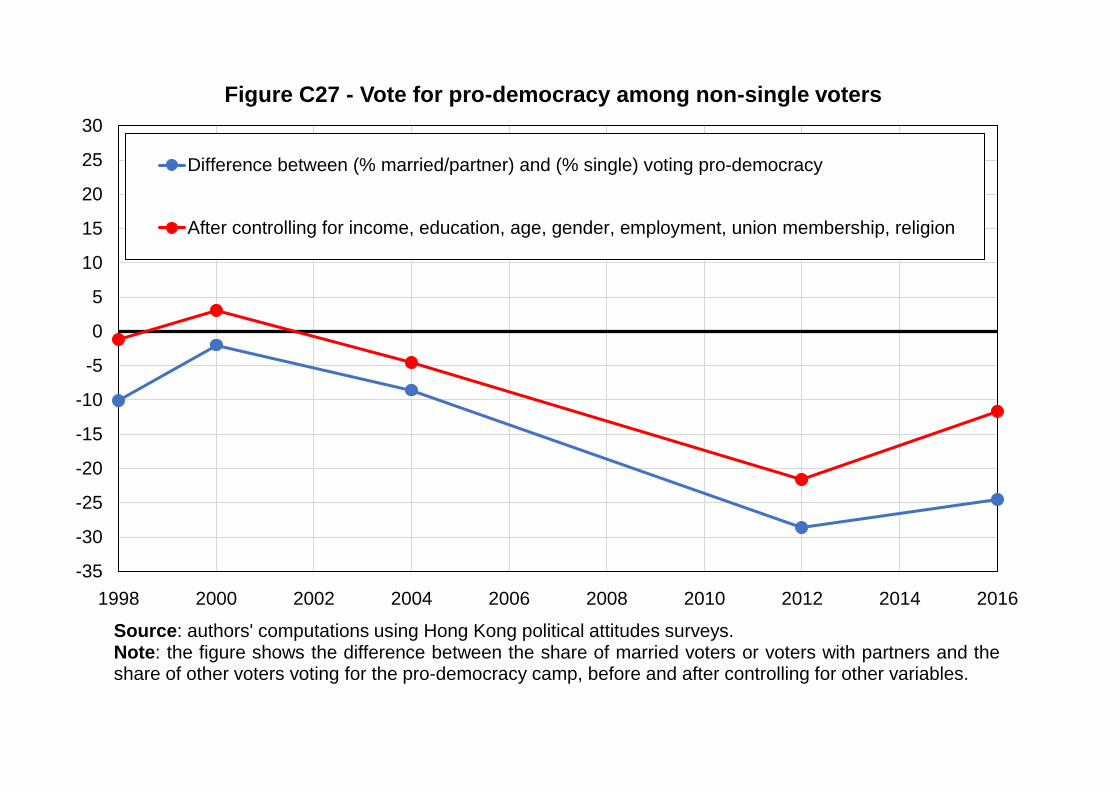
-35
-30
-25
-20
-15
-10
-5
0
5
10
15
20
25
30
1998 2000 2002 2004 2006 2008 2010 2012 2014 2016
Figure C27 - Vote for pro-democracy among non-single voters
Difference between (% married/partner) and (% single) voting pro-democracy
After controlling for income, education, age, gender, employment, union membership, religion
Source: authors' computations using Hong Kong political attitudes surveys.Note: the figure shows the difference between the share of married voters or voters with partners and theshare of other voters voting for the pro-democracy camp, before and after controlling for other variables.
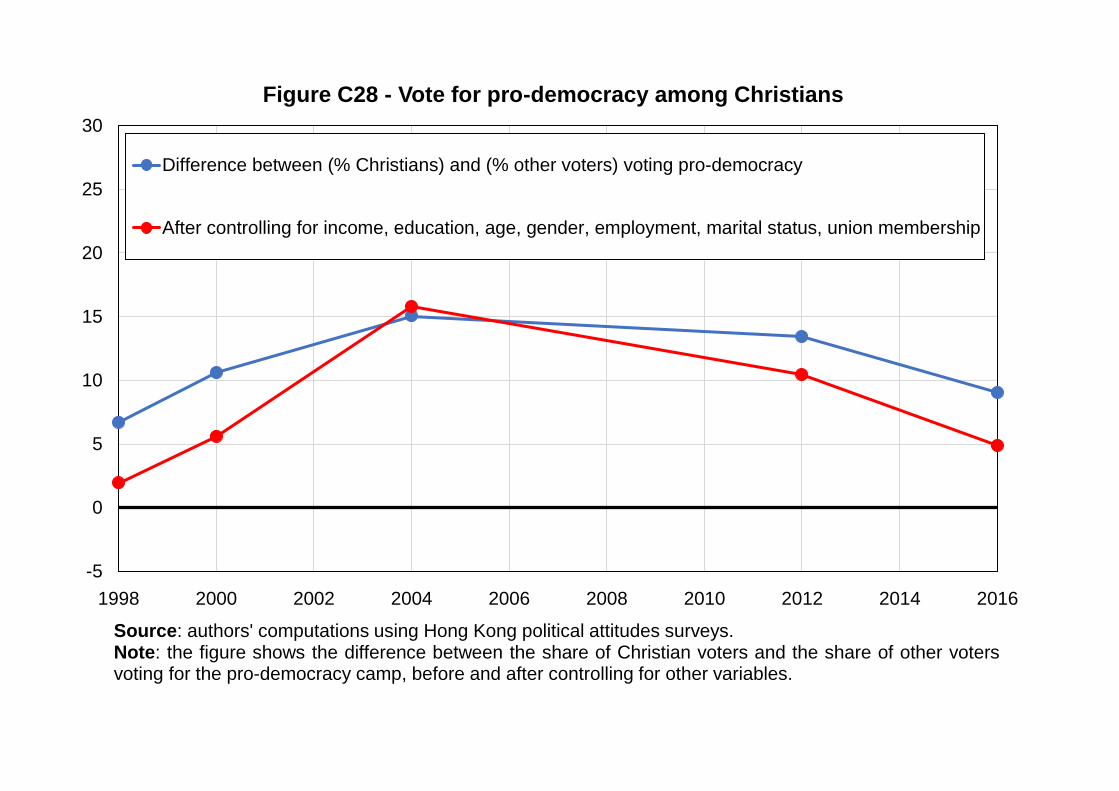
-5
0
5
10
15
20
25
30
1998 2000 2002 2004 2006 2008 2010 2012 2014 2016
Figure C28 - Vote for pro-democracy among Christians
Difference between (% Christians) and (% other voters) voting pro-democracy
After controlling for income, education, age, gender, employment, marital status, union membership
Source: authors' computations using Hong Kong political attitudes surveys.Note: the figure shows the difference between the share of Christian voters and the share of other votersvoting for the pro-democracy camp, before and after controlling for other variables.
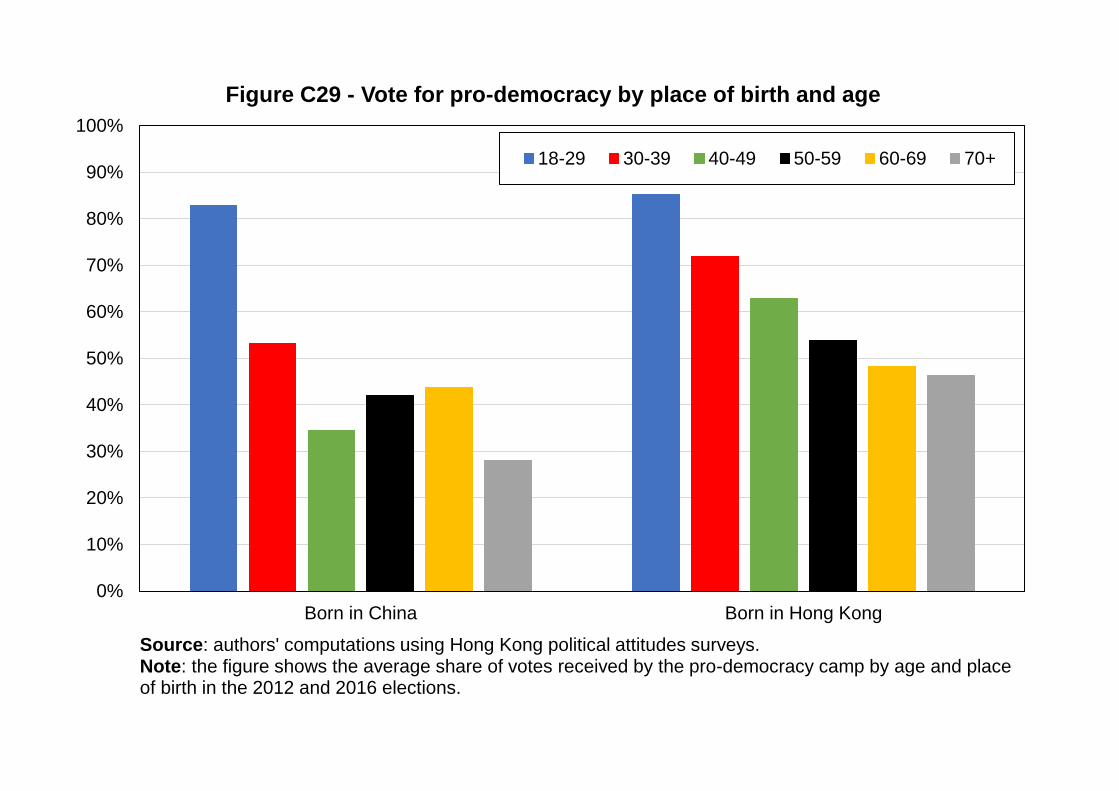
0%
10%
20%
30%
40%
50%
60%
70%
80%
90%
100%
Born in China Born in Hong Kong
Figure C29 - Vote for pro-democracy by place of birth and age
18-29 30-39 40-49 50-59 60-69 70+
Source: authors' computations using Hong Kong political attitudes surveys.Note: the figure shows the average share of votes received by the pro-democracy camp by age and place of birth in the 2012 and 2016 elections.
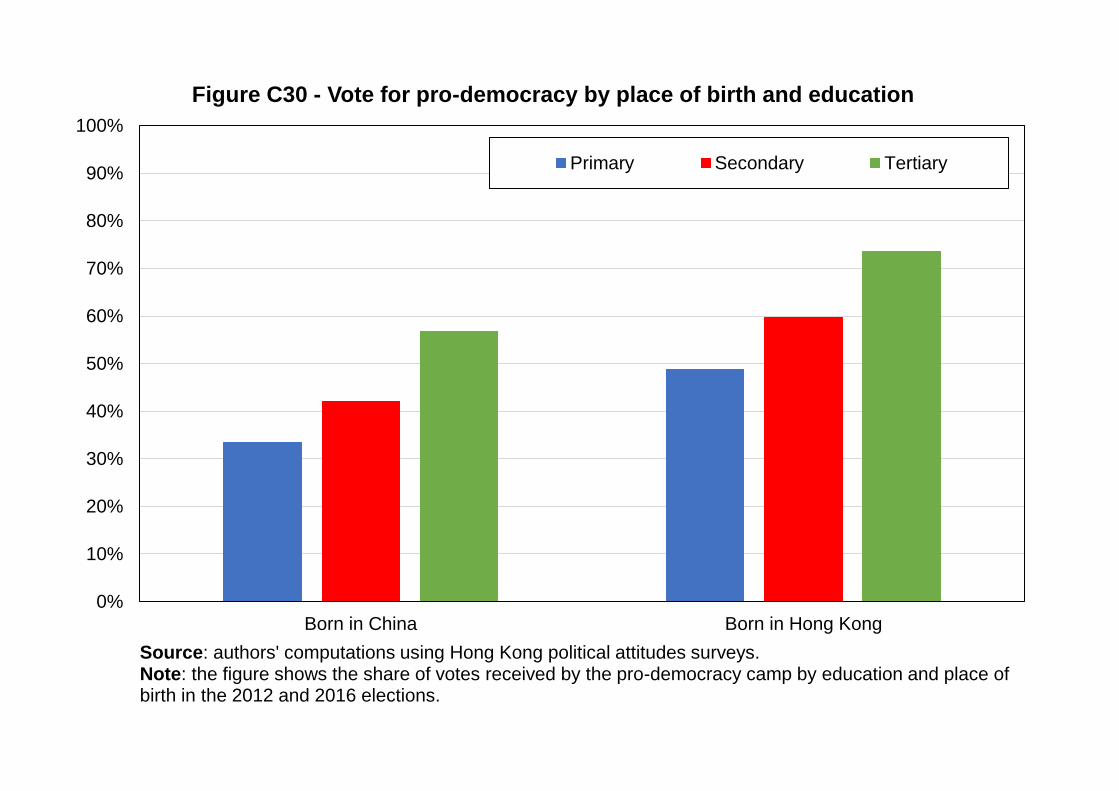
0%
10%
20%
30%
40%
50%
60%
70%
80%
90%
100%
Born in China Born in Hong Kong
Figure C30 - Vote for pro-democracy by place of birth and education
Primary Secondary Tertiary
Source: authors' computations using Hong Kong political attitudes surveys.Note: the figure shows the share of votes received by the pro-democracy camp by education and place of birth in the 2012 and 2016 elections.
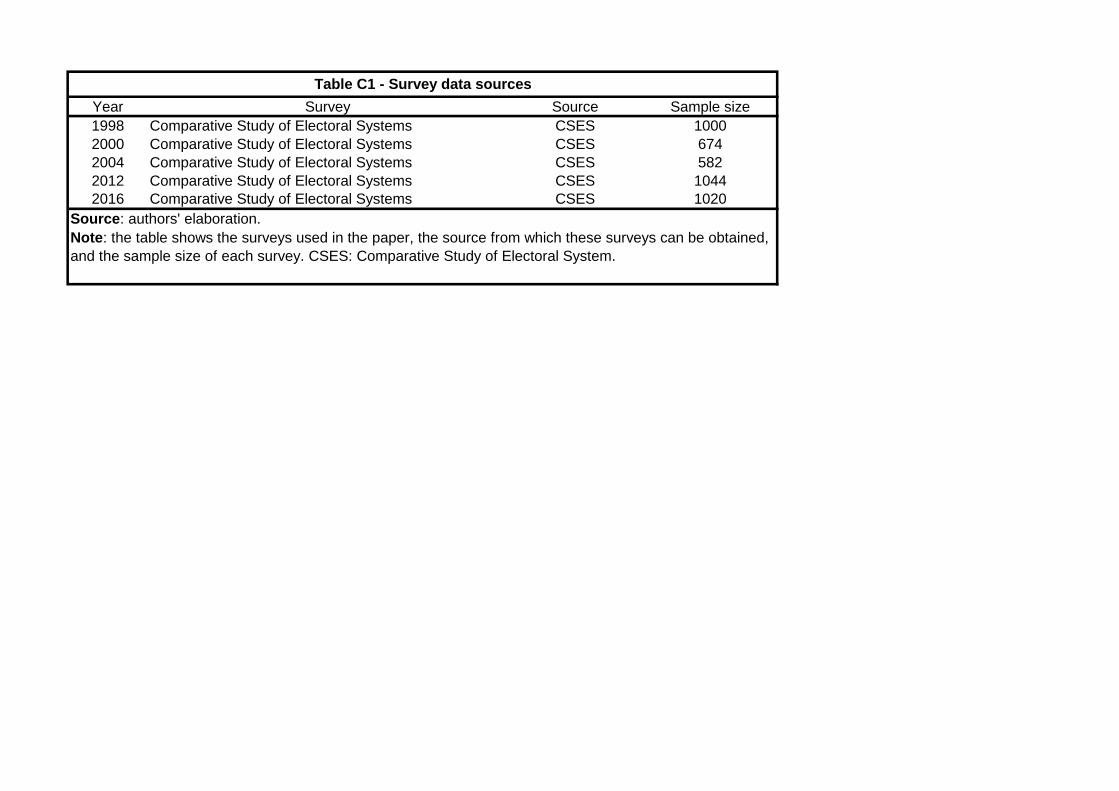
Year Survey Source Sample size
1998 Comparative Study of Electoral Systems CSES 1000
2000 Comparative Study of Electoral Systems CSES 674
2004 Comparative Study of Electoral Systems CSES 582
2012 Comparative Study of Electoral Systems CSES 1044
2016 Comparative Study of Electoral Systems CSES 1020
Table C1 - Survey data sources
Source: authors' elaboration.
Note: the table shows the surveys used in the paper, the source from which these surveys can be obtained,
and the sample size of each survey. CSES: Comparative Study of Electoral System.
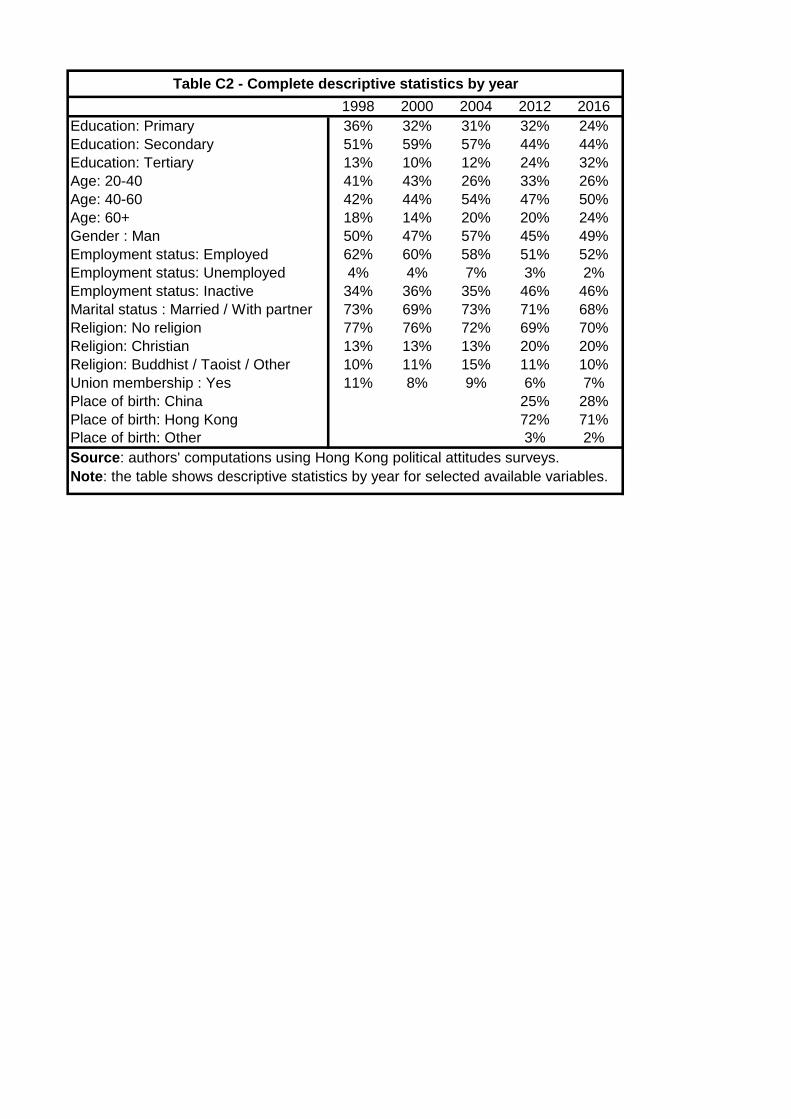
1998 2000 2004 2012 2016
Education: Primary 36% 32% 31% 32% 24%
Education: Secondary 51% 59% 57% 44% 44%
Education: Tertiary 13% 10% 12% 24% 32%
Age: 20-40 41% 43% 26% 33% 26%
Age: 40-60 42% 44% 54% 47% 50%
Age: 60+ 18% 14% 20% 20% 24%
Gender : Man 50% 47% 57% 45% 49%
Employment status: Employed 62% 60% 58% 51% 52%
Employment status: Unemployed 4% 4% 7% 3% 2%
Employment status: Inactive 34% 36% 35% 46% 46%
Marital status : Married / With partner 73% 69% 73% 71% 68%
Religion: No religion 77% 76% 72% 69% 70%
Religion: Christian 13% 13% 13% 20% 20%
Religion: Buddhist / Taoist / Other 10% 11% 15% 11% 10%
Union membership : Yes 11% 8% 9% 6% 7%
Place of birth: China 25% 28%
Place of birth: Hong Kong 72% 71%
Place of birth: Other 3% 2%
Table C2 - Complete descriptive statistics by year
Source: authors' computations using Hong Kong political attitudes surveys.
Note: the table shows descriptive statistics by year for selected available variables.
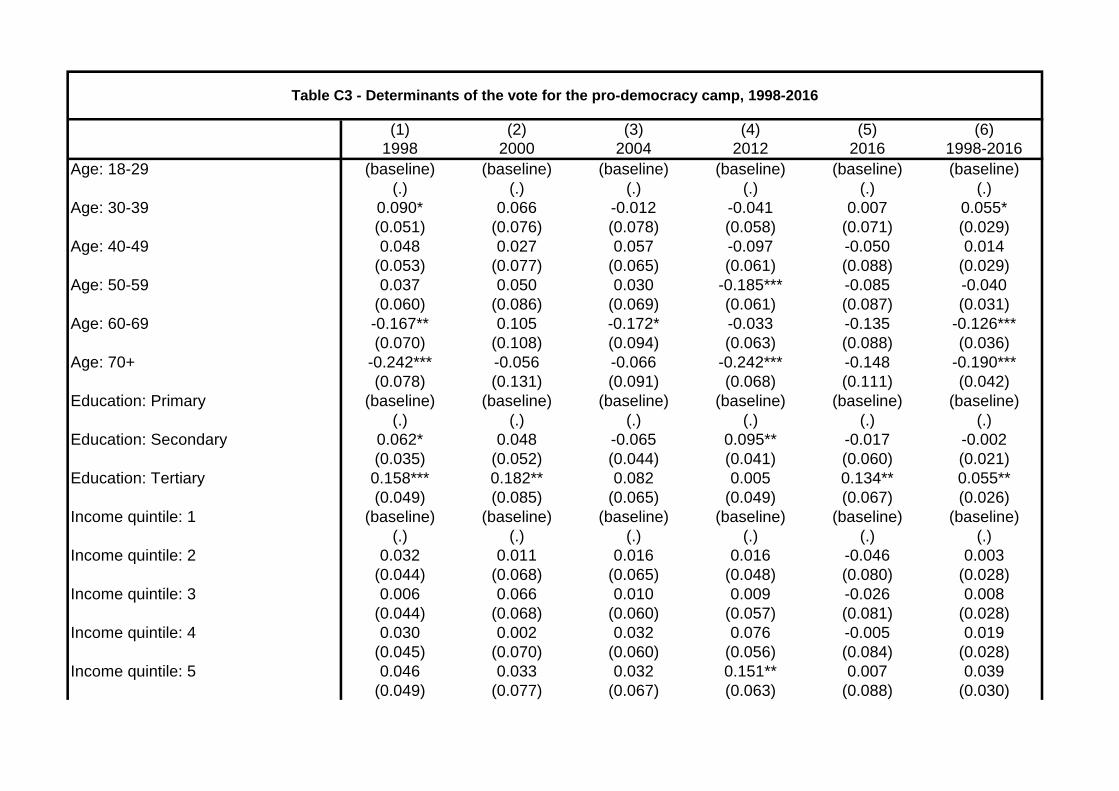
(1) (2) (3) (4) (5) (6)
1998 2000 2004 2012 2016 1998-2016
Age: 18-29 (baseline) (baseline) (baseline) (baseline) (baseline) (baseline)
(.) (.) (.) (.) (.) (.)
Age: 30-39 0.090* 0.066 -0.012 -0.041 0.007 0.055*
(0.051) (0.076) (0.078) (0.058) (0.071) (0.029)
Age: 40-49 0.048 0.027 0.057 -0.097 -0.050 0.014
(0.053) (0.077) (0.065) (0.061) (0.088) (0.029)
Age: 50-59 0.037 0.050 0.030 -0.185*** -0.085 -0.040
(0.060) (0.086) (0.069) (0.061) (0.087) (0.031)
Age: 60-69 -0.167** 0.105 -0.172* -0.033 -0.135 -0.126***
(0.070) (0.108) (0.094) (0.063) (0.088) (0.036)
Age: 70+ -0.242*** -0.056 -0.066 -0.242*** -0.148 -0.190***
(0.078) (0.131) (0.091) (0.068) (0.111) (0.042)
Education: Primary (baseline) (baseline) (baseline) (baseline) (baseline) (baseline)
(.) (.) (.) (.) (.) (.)
Education: Secondary 0.062* 0.048 -0.065 0.095** -0.017 -0.002
(0.035) (0.052) (0.044) (0.041) (0.060) (0.021)
Education: Tertiary 0.158*** 0.182** 0.082 0.005 0.134** 0.055**
(0.049) (0.085) (0.065) (0.049) (0.067) (0.026)
Income quintile: 1 (baseline) (baseline) (baseline) (baseline) (baseline) (baseline)
(.) (.) (.) (.) (.) (.)
Income quintile: 2 0.032 0.011 0.016 0.016 -0.046 0.003
(0.044) (0.068) (0.065) (0.048) (0.080) (0.028)
Income quintile: 3 0.006 0.066 0.010 0.009 -0.026 0.008
(0.044) (0.068) (0.060) (0.057) (0.081) (0.028)
Income quintile: 4 0.030 0.002 0.032 0.076 -0.005 0.019
(0.045) (0.070) (0.060) (0.056) (0.084) (0.028)
Income quintile: 5 0.046 0.033 0.032 0.151** 0.007 0.039
(0.049) (0.077) (0.067) (0.063) (0.088) (0.030)
Table C3 - Determinants of the vote for the pro-democracy camp, 1998-2016
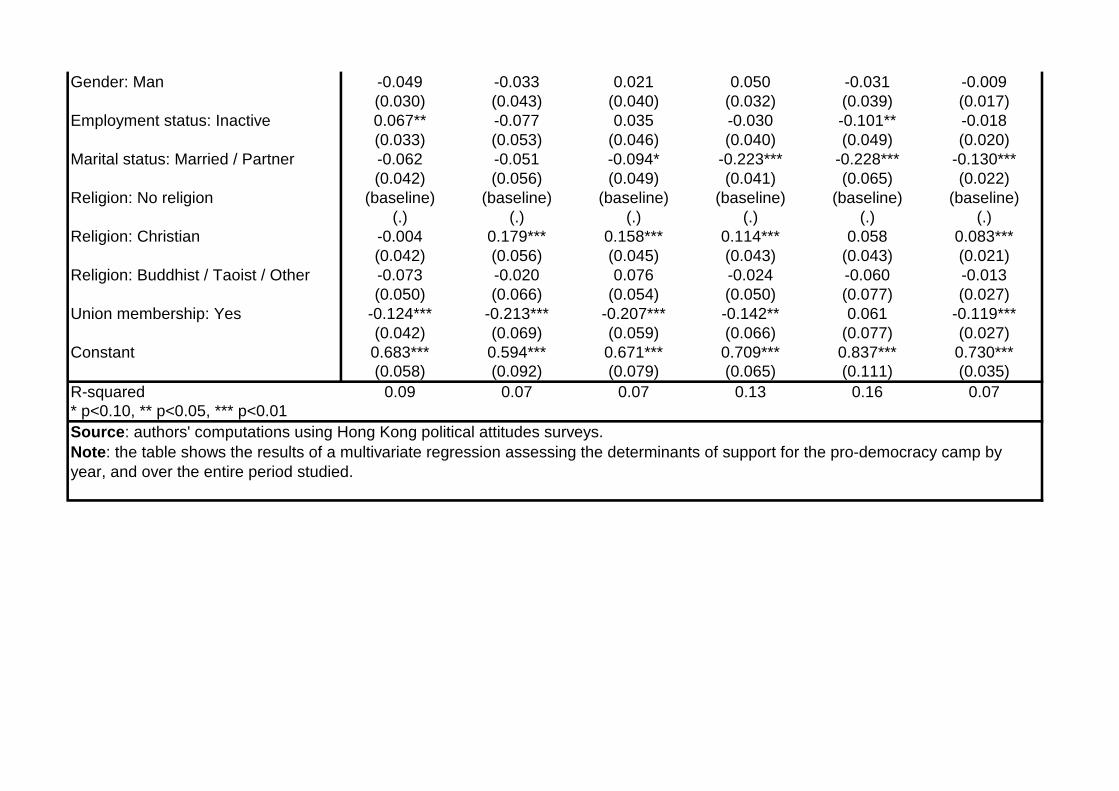
Gender: Man -0.049 -0.033 0.021 0.050 -0.031 -0.009
(0.030) (0.043) (0.040) (0.032) (0.039) (0.017)
Employment status: Inactive 0.067** -0.077 0.035 -0.030 -0.101** -0.018
(0.033) (0.053) (0.046) (0.040) (0.049) (0.020)
Marital status: Married / Partner -0.062 -0.051 -0.094* -0.223*** -0.228*** -0.130***
(0.042) (0.056) (0.049) (0.041) (0.065) (0.022)
Religion: No religion (baseline) (baseline) (baseline) (baseline) (baseline) (baseline)
(.) (.) (.) (.) (.) (.)
Religion: Christian -0.004 0.179*** 0.158*** 0.114*** 0.058 0.083***
(0.042) (0.056) (0.045) (0.043) (0.043) (0.021)
Religion: Buddhist / Taoist / Other -0.073 -0.020 0.076 -0.024 -0.060 -0.013
(0.050) (0.066) (0.054) (0.050) (0.077) (0.027)
Union membership: Yes -0.124*** -0.213*** -0.207*** -0.142** 0.061 -0.119***
(0.042) (0.069) (0.059) (0.066) (0.077) (0.027)
Constant 0.683*** 0.594*** 0.671*** 0.709*** 0.837*** 0.730***
(0.058) (0.092) (0.079) (0.065) (0.111) (0.035)
R-squared 0.09 0.07 0.07 0.13 0.16 0.07
* p<0.10, ** p<0.05, *** p<0.01
Source: authors' computations using Hong Kong political attitudes surveys.
Note: the table shows the results of a multivariate regression assessing the determinants of support for the pro-democracy camp by
year, and over the entire period studied.
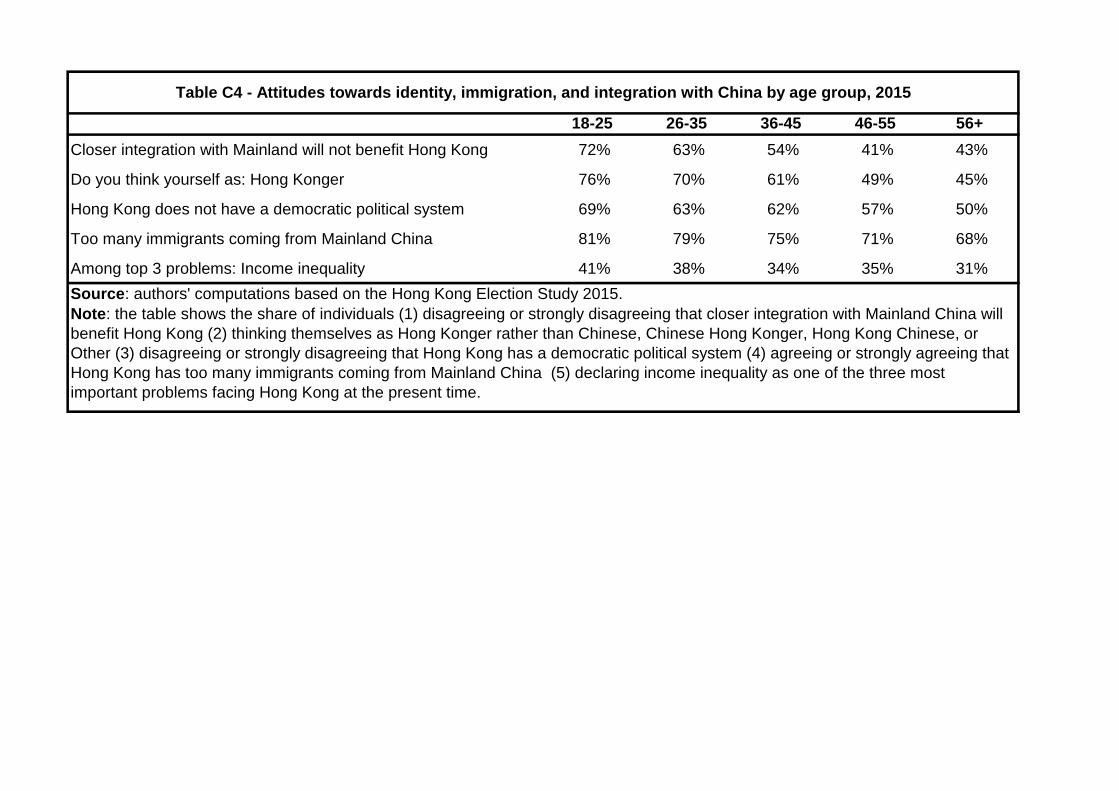
18-25 26-35 36-45 46-55 56+
Closer integration with Mainland will not benefit Hong Kong 72% 63% 54% 41% 43%
Do you think yourself as: Hong Konger 76% 70% 61% 49% 45%
Hong Kong does not have a democratic political system 69% 63% 62% 57% 50%
Too many immigrants coming from Mainland China 81% 79% 75% 71% 68%
Among top 3 problems: Income inequality 41% 38% 34% 35% 31%
Table C4 - Attitudes towards identity, immigration, and integration with China by age group, 2015
Source: authors' computations based on the Hong Kong Election Study 2015.
Note: the table shows the share of individuals (1) disagreeing or strongly disagreeing that closer integration with Mainland China will
benefit Hong Kong (2) thinking themselves as Hong Konger rather than Chinese, Chinese Hong Konger, Hong Kong Chinese, or
Other (3) disagreeing or strongly disagreeing that Hong Kong has a democratic political system (4) agreeing or strongly agreeing that
Hong Kong has too many immigrants coming from Mainland China (5) declaring income inequality as one of the three most
important problems facing Hong Kong at the present time.
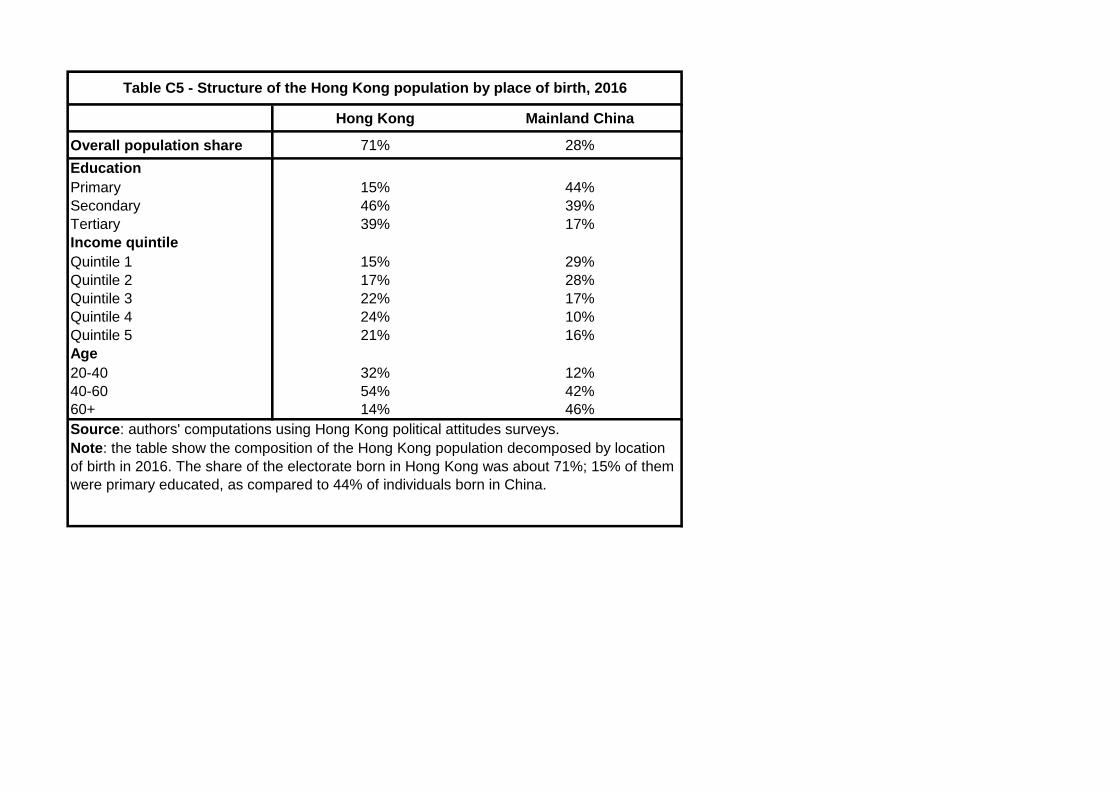
Hong Kong Mainland China
Overall population share 71% 28%
Education
Primary 15% 44%
Secondary 46% 39%
Tertiary 39% 17%
Income quintile
Quintile 1 15% 29%
Quintile 2 17% 28%
Quintile 3 22% 17%
Quintile 4 24% 10%
Quintile 5 21% 16%
Age
20-40 32% 12%
40-60 54% 42%
60+ 14% 46%
Table C5 - Structure of the Hong Kong population by place of birth, 2016
Source: authors' computations using Hong Kong political attitudes surveys.
Note: the table show the composition of the Hong Kong population decomposed by location
of birth in 2016. The share of the electorate born in Hong Kong was about 71%; 15% of them
were primary educated, as compared to 44% of individuals born in China.
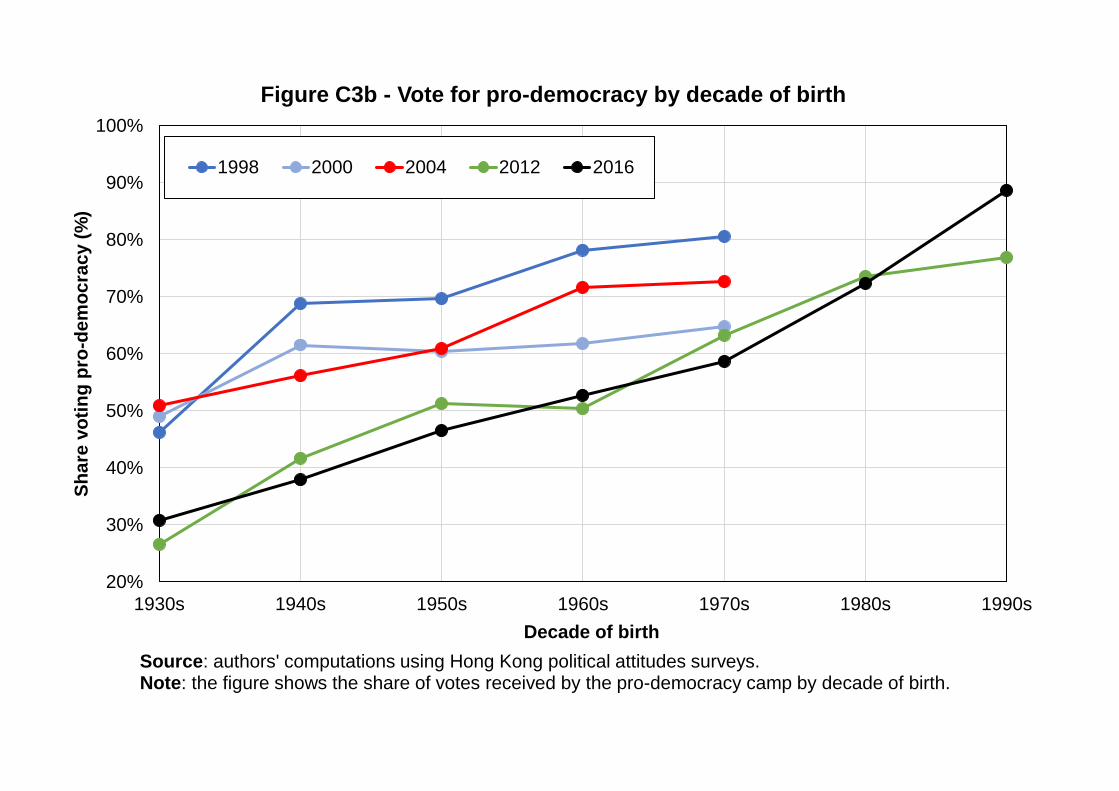
20%
30%
40%
50%
60%
70%
80%
90%
100%
1930s 1940s 1950s 1960s 1970s 1980s 1990s
Sh
are
vo
tin
g p
ro-d
em
oc
rac
y (
%)
Decade of birth
Figure C3b - Vote for pro-democracy by decade of birth
1998 2000 2004 2012 2016
Source: authors' computations using Hong Kong political attitudes surveys.Note: the figure shows the share of votes received by the pro-democracy camp by decade of birth.