Embed Size (px)
Citation preview

Institute for International Political Economy Berlin
Inequality and growth: Marxian and post-Keynesian/Kaleckian perspectives on distribution and growth regimes before and after the Great Recession
Author: Eckhard Hein
Working Paper, No. 96/2018
Editors: Sigrid Betzelt Eckhard Hein Martina Metzger Jennifer Pedussel Wu Martina Sproll Christina Teipen Achim Truger Markus Wissen Reingard Zimmer


1
Inequality and growth: Marxian and post-Keynesian/Kaleckian perspectives on distribution and growth regimes before and after the Great Recession* Eckhard Hein Institute for International Political Economy (IPE) at the Berlin School of Economics and Law Abstract The re-distribution of income from labour to capital, from workers to top-managers, and from low income households to the rich has been an important feature of finance-dominated capitalism since the early 1980s. After the Great Financial Crisis and the Great Recession in 2007-9, the recovery has been sluggish so far, and this has given rise to a renewed discussion about stagnation tendencies in capitalist economies. In orthodox approaches income distribution only has a restricted role to play, if at all, but the interaction between distribution and growth is at the centre of Marxian and post-Keynesian/Kaleckian approaches when it comes to explaining medium- to long-run trends of economic growth – and stagnation. In this contribution we will thus provide Marxian and Kaleckian assessments of the distribution and growth regimes under finance-dominated capitalism, both before and after the recent crisis. Finally, we also sketch an interpretation of stagnation tendencies in a demand-led endogenous growth model with Kaleckian, Kaldorian and Marxian features. JEL-code: E11, E21, E22, E25, E60, F43, F62, O40 Keywords: Distribution, growth, financialisation, stagnation, macroeconomic demand and growth regimes, productivity growth, Kaleckian models, Marxian models Prof. Dr. Eckhard Hein Berlin School of Economics and Law Badensche Str. 52 10825 Berlin Germany e-mail: [email protected]
* For helpful comments I would like to thank Daniel Detzer and Franz J. Prante. I am also indebted to Ryan Woodgate for excellent research assistance and to Sophie Rotermund for editing assistance. Remaining errors are mine, of course.
2
1. Introduction The re-distribution of income from labour to capital, from workers to top-managers, and from low income households to the rich has been a main feature of finance-dominated capitalism since the early 1980s, which has led to the Great Financial Crisis and the Great Recession in 2007-9. The recovery from this crisis has been sluggish so far, and this has given rise to a renewed discussion about stagnation tendencies in capitalist economies (Summers 2014, 2015). Whereas in orthodox approaches income distribution only has a restricted role to play, if at all, the interaction between distribution and growth is at the centre of Marxian and post-Keynesian/Kaleckian approaches when it comes to explaining medium- to long-run trends of economic growth – and stagnation. In this contribution we will first provide Marxian and Kaleckian assessments of the distribution and growth regimes under finance-dominated capitalism, both before and after the recent crisis. Second, we will present an interpretation of stagnation tendencies in a demand-led endogenous growth model with Kaleckian, Kaldorian and Marxian features.
For this purpose, we will build on the recent empirical literature on different demand and growth regimes under financialisation (Hein 2012), and the research on the distributional effects of financialisation (Hein et al. 2017a, 2017b) in particular, and provide some stylised facts on distribution and growth regimes under financialisation before the crisis in Section 2. In order to allow for a comparative assessment of the relationship between distribution and growth in these regimes from a Marxian and a Kaleckian perspective in Section 3, we then apply the method of model closure, invented by Sen (1963) and then used by Marglin (1984a, 1984b), Dutt (1990) and Hein (2017a), among others. We will first generate the two extreme growth regimes under financialisation before the crisis, the ‘debt-led private demand boom’ and the ‘export-led mercantilist’ regimes, in stylised Marxian and neo-Kaleckian models. Then we will study the effects of a rising profit share, holding behavioural equations constant. Finally, will add the changes in behavioural parameters for the two regimes in each approach and generate the distribution and growth patterns observed before the crisis. In Section 4, we will then turn towards the crisis and post-crisis period. Empirically, we will assess the changes in distribution and growth regimes in this period and we will interpret these changes in the context of the stylised neo-Kaleckian model from Section 3. Thereafter, we will extend this model by Kaldorian and Marxian views on the determinants of technological progress and productivity growth, generate a demand-led endogenous growth model and show how current stagnation tendencies can be explained by this model. The final Section 5 will briefly summarise and conclude. 2. Stylised facts: distribution and growth regimes under financialisation before the crisis From a macroeconomic perspective, finance-dominated capitalism or financialisation can be described by four characteristics, as elaborated in Hein (2012, 2014, Chapter 10), for example.1
1. With regard to distribution, financialisation has been conducive to a rising gross profit share, including retained profits, dividends and interest payments, and thus a falling 1 See also the summaries in Dodig et al. (2016), Hein and Dodig (2015) and Hein et al. (2015).

3
labour income share, on the one hand, and to increasing inequality of wages and top management salaries and thus of personal or household incomes, on the other hand. Hein (2015) has recently reviewed the evidence for a set of developed capitalist economies since the early 1980s and finds ample empirical support for falling labour income shares and increasing inequality in the personal/household distribution of market incomes with only a few exceptions, increasing inequality in the personal/household distribution of disposable income in most of the countries, an increase in the income share of the very top incomes particularly in the USA and the UK, but also in several other countries for which data is available, with rising top management salaries as one of the major driving forces. Reviewing the empirical literature on the determinants of functional income distribution against the background of the Kaleckian theory of income distribution, it is argued that features of finance-dominated capitalism have contributed to the falling labour income share since the early 1980s through three main channels: the falling bargaining power of trade unions, rising profit claims imposed in particular by increasingly powerful rentiers, and a change in the sectoral composition of the economy in favour of the financial corporate sector at the expense of the non-financial corporate sector or the public sector with higher labour income shares. In Hein et al. (2017a, 2017b), the relative importance of these factors has been analysed for the six countries which are included in the current study.
2. Regarding investment in the capital stock, financialisation has meant increasing shareholder power vis-à-vis firms and workers, the demand for an increasing rate of return on equity held by rentiers, and an alignment of management with shareholder interests through short-run performance related pay schemes, such as bonuses, stock option programmes, and so on. On the one hand, this has imposed short-termism on management and has caused a decrease in management’s animal spirits with respect to real investment in the capital stock and long-run growth of the firm, and increasing preference for financial investment, generating high profits in the short run. On the other hand, it has drained internal means of finance available for real investment purposes from non-financial corporations, through increasing dividend payments and share buybacks in order to boost stock prices and thus shareholder value. These ‘preference’ and ‘internal means of finance’ channels should each have negative partial effects on firms’ real investment in capital stock. Econometric evidence for these two channels has been supplied by Stockhammer (2004), van Treeck (2008), Orhangazi (2008), Onaran et al. (2011), Davis (2018) and Tori and Onaran (2016, 2017) confirming a depressing effect of increasing shareholder value orientation on investment in capital stock, in particular for the USA but also for other economies, like the UK, France and other Western European countries.
3. Regarding consumption, financialisation has generated an increasing potential for wealth-based and debt-financed consumption in some countries, thus creating the potential to compensate for the depressing demand effects of financialisation, which have been imposed on the economy via re-distribution and the depressing impact of shareholder value orientation on real investment. Stock market and housing price booms have each increased notional wealth against which households were willing to borrow. Financial deregulation, changing financial norms, new financial instruments (credit card debt, home equity lending),

4
deterioration of creditworthiness standards, triggered by securitisation of mortgage debt and ‘originate and distribute’ strategies of commercial banks, made credit increasingly available to low income, low wealth households, in particular. This potentially allowed for consumption to rise faster than median income and thus to stabilise aggregate demand. But it also generated increasing debt-income ratios of private households. Several studies have shown that financial and housing wealth was a significant determinant of consumption, particularly in the USA, but also in countries like the UK, France, Italy, Japan and Canada (Boone and Girouard 2002; Ludvigson and Steindl 1999; Mehra 2001; Onaran et al. 2011). Furthermore, Barba and Pivetti (2009), Cynamon and Fazzari (2008, 2013), Guttmann and Plihon (2010), van Treeck and Sturn (2012), and van Treeck (2014) have presented extensive case studies on wealth-based and debt-financed consumption, with a focus on the USA. However, Kim (2013, 2016) in two recent studies on the USA has found that although new credit to households will boost aggregate demand and output in the short run, the effects of household debt variables on output and growth turn negative in the long run. This indicates contradictory effects of the flow of new credit and the stock of debt on consumption.
4. The liberalisation of international capital markets and capital accounts has allowed for rising and persistent current account imbalances at the global, but also at the regional levels, in particular within the Eurozone, as has been analysed by several authors, including Hein (2012, Chapter 6, 2014, Chapter 10), Hein and Dodig (2015), Hein and Mundt (2012), Horn et al. (2009), Stockhammer (2010, 2012, 2015), UNCTAD (2009) and van Treeck and Sturn (2012).
Under the conditions of the dominance of finance, income re-distribution at the expense of labour and low-income households, and weak investment in the capital stock, different demand and growth regimes may emerge, as has been analysed by the authors mentioned in the previous paragraph, using different terminologies. Considering the growth contributions of the main demand aggregates (private consumption, public consumption, investment, net exports) and the sectoral financial balances of the main macroeconomic sectors (private household sector, financial and non-financial corporate sectors, government sector, external sector), in the current contribution three broad types of regimes will be distinguished: a) a ‘debt-led private demand boom’ regime, b) an ‘export-led mercantilist’ regime and c) a ‘domestic demand-led’ regime.
The debt-led private demand boom regime is characterised by negative or close to zero financial balances of the private household sectors, which means that major parts of the private household sector have negative saving rates out of current income, are hence running current deficits, financed by increasing their stock of debt and/or reducing their stock of assets. These private household deficits are increased by corporate deficits and thus we have deficits of the private domestic sectors as a whole. The external sector has positive financial balances, which means that ‘debt-led private demand boom’ countries are usually running current account deficits. We have high growth contributions of private domestic demand, in particular private consumption, financed by credit to a considerable extent, and negative growth contributions of the balance of goods and services, driving the current account into deficit in the medium to long run.
5
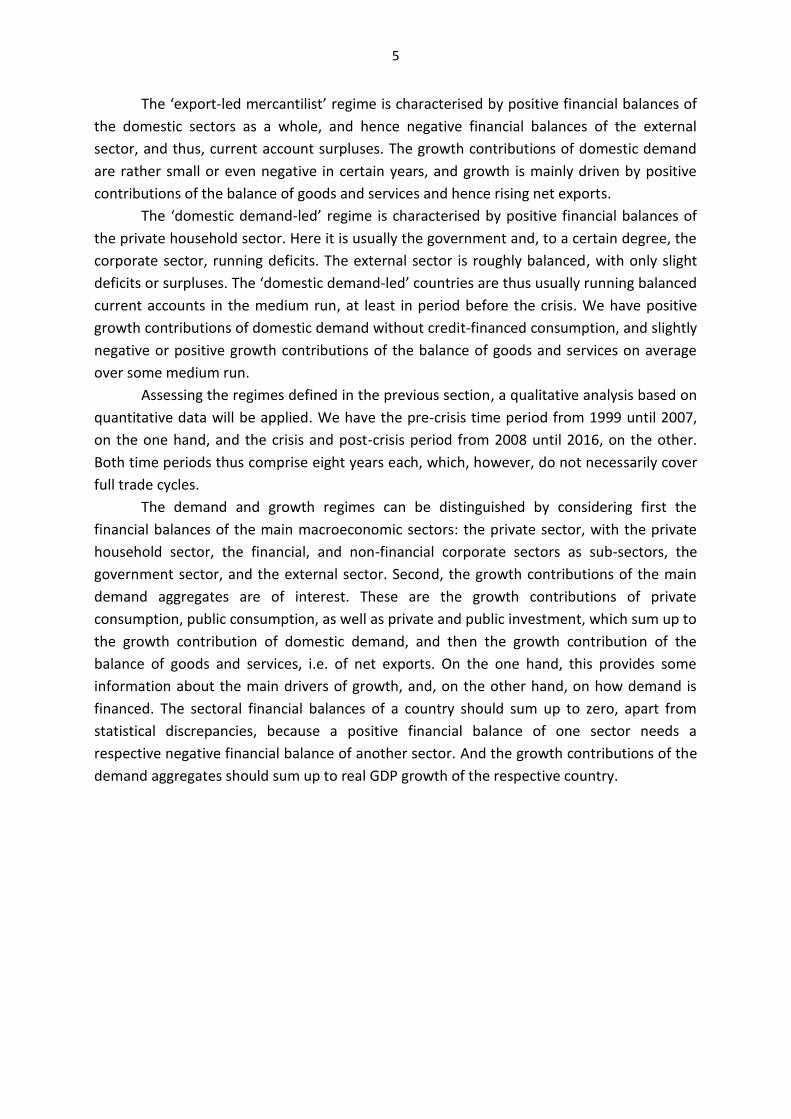
The ‘export-led mercantilist’ regime is characterised by positive financial balances of the domestic sectors as a whole, and hence negative financial balances of the external sector, and thus, current account surpluses. The growth contributions of domestic demand are rather small or even negative in certain years, and growth is mainly driven by positive contributions of the balance of goods and services and hence rising net exports.
The ‘domestic demand-led’ regime is characterised by positive financial balances of the private household sector. Here it is usually the government and, to a certain degree, the corporate sector, running deficits. The external sector is roughly balanced, with only slight deficits or surpluses. The ‘domestic demand-led’ countries are thus usually running balanced current accounts in the medium run, at least in period before the crisis. We have positive growth contributions of domestic demand without credit-financed consumption, and slightly negative or positive growth contributions of the balance of goods and services on average over some medium run.
Assessing the regimes defined in the previous section, a qualitative analysis based on quantitative data will be applied. We have the pre-crisis time period from 1999 until 2007, on the one hand, and the crisis and post-crisis period from 2008 until 2016, on the other. Both time periods thus comprise eight years each, which, however, do not necessarily cover full trade cycles.
The demand and growth regimes can be distinguished by considering first the financial balances of the main macroeconomic sectors: the private sector, with the private household sector, the financial, and non-financial corporate sectors as sub-sectors, the government sector, and the external sector. Second, the growth contributions of the main demand aggregates are of interest. These are the growth contributions of private consumption, public consumption, as well as private and public investment, which sum up to the growth contribution of domestic demand, and then the growth contribution of the balance of goods and services, i.e. of net exports. On the one hand, this provides some information about the main drivers of growth, and, on the other hand, on how demand is financed. The sectoral financial balances of a country should sum up to zero, apart from statistical discrepancies, because a positive financial balance of one sector needs a respective negative financial balance of another sector. And the growth contributions of the demand aggregates should sum up to real GDP growth of the respective country.

6
Table 1: Distribution trends for selected OECD countries before and after the financial
and economic crisis 2007-9
USA UK Spain Ger-many
Swe-den France
Distribution trends
Adjusted wage share
Before – 0 – – – – After – – – 0 0 +
Top income share
Before + + + + + + After + – – ? 0 0
Gini coefficients
Before + + 0 + + 0 After + 0 + + 0 –
Notes: + tendency to increase, – tendency to decrease, 0 no tendency, ? no data Before: early 1990s until the crisis 2007-9, After: after the crisis 2007-9 Source: Hein et al. (2017a, 2017b)
In the pre-crisis period from 1999 until 2007, the USA, the UK and Spain were dominated by the ‘debt-led private demand boom’ regime. In this period, these countries faced rising inequality, i.e. falling wage shares in the USA and Spain, but a constant wage share in the UK, rising top income shares in all three countries and rising Gini coefficients for market and disposable household income in the USA and the UK, but constant household or personal income inequality measured by these indices in Spain (Table 1). In the pre-crisis period these countries were characterised by negative financial balances of their domestic private sectors and negative or, in the UK, close to zero financial balances of the private household sectors, in particular (Table 2). The corporate sectors were in deficit, too. The external sectors were the surplus sectors, and the countries following the ‘debt-led private demand boom’ regime were thus characterised by current account deficits and negative net exports. As typical for this regime, we see high growth contributions of private domestic demand, and of private consumption demand in particular, financed by household deficits and thus rising credit to a considerable degree. Private consumption contributed more than 55 per cent to GDP growth in the case of Spain, and up to close to 80 per cent, in the cases of the USA and the UK. The growth contributions of the balance of goods and services were negative and thus reduced GDP growth, most pronouncedly in Spain. The ‘debt-led private demand boom’ countries were thus the world demand engines before the crisis, mainly relying on increasing private debt, and household debt in particular.2
The ‘export-led mercantilist’ regime in the pre-crisis period dominated in Germany and Sweden. Here, we also see rising inequality, i.e. falling labour income shares, rising top income shares and increasing Gini coefficients for market and disposable incomes of households (Table 1). For the ‘export-led mercantilist’ countries, we observe positive financial balances of the domestic sectors as a whole, with significantly positive financial balances of the private sector, and a deficit of the public sector in Germany and a surplus in Sweden (Table 2). The private sector balance in Germany was composed of a significant surplus of private households and a small deficit in the corporate sector, whereas in Sweden
2 For more country specific information on these three debt-led private demand boom economies, see for example Evans (2016) on the US, Lepper et al. (2016) on the UK and Ferreiro et al. (2016) on Spain.

7
both sub-sectors contributed to the private sector surplus. The external sector was in deficit in both countries, and considerably so in Sweden. These countries were thus running current account surpluses and positive balances of goods and services. In both countries, the growth contributions of domestic demand were rather small, and in Germany even negative in certain years. Private consumption only accounted for a bit more than 30 percent of GDP growth in the case of Germany and for 40 percent in the case of Sweden, each on average over the period. Growth was mainly driven by positive contributions of the balance of goods and services and hence rising net exports, which contributed about 50 percent in the case of Germany and 20 percent in the case of Sweden to GDP growth. These countries were thus free-riding on dynamic world demand generated by the ‘debt-led private demand’ boom countries in particular.3
Finally, we have in between the two extremes the ‘domestic demand-led’ regime, which in the pre-crisis period can be found in France. Here, we also see rising inequality, as reflected in the falling labour income share and in rising top income shares, despite constant Gini coefficients for market and disposable income (Table 1). The French economy was characterised by positive financial balances of the private household sector and of the private sector as a whole (Table 2). Furthermore, we have slightly negative financial balances of the external sectors and hence, small current account and net export surpluses. Growth was exclusively driven by domestic demand, with relevant contributions by private consumption, however, without drawing on rising household credit, since private household financial balances remained considerably positive. Growth contributions of the balance of goods and services were slightly negative.4
3 For more country specific information on these two export-led mercantilist economies, see for example Detzer and Hein (2016) on Germany and Stenfors (2016) on Sweden. 4 For more country specific information on the domestic demand-led economy of France, see for example Cournilleau and Creel (2016).

8
Table 2: Key macroeconomic variables for selected OECD countries,
average annual values for the period 1999-2007 USA UK Spain Ger-
many Swede
n France
Financial balances of external sector as a share of nominal GDP, per cent
4.0 2.0 5.6 -2.4 -6.4 -0.7
Financial balances of public sector as share of nominal GDP, per cent
-3.0 -1.7 0.2 -2.3 1.1 -2.5
Financial balance of private sector as a share of nominal GDP, per cent
-0.9 -0.3 -5.8 4.7 5.3 3.2
- Financial balance of private household sector as a share of nominal GDP, per cent
-0.8 0.6 -1.0 5.0 2.4 3.4
- Financial balance of the corporate sector as a share of nominal GDP, per cent
-0.1 -0.8 -4.0 -0.3 2.8 -0.2
Real GDP growth, per cent 2.9 2.9 3.9 1.6 3.4 2.3 Growth contribution of domestic demand including stocks, percentage points
3.3 3.3 4.8 0.8 2.7 2.6
- Growth contribution of private consumption, percentage points
2.3 2.3 2.2 0.5 1.4 1.4
- Growth contribution of public consumption, percentage points
0.3 0.6 0.8 0.1 0.2 0.4
- Growth contribution of gross fixed capital formation, percentage points
0.7 0.5 1.7 0.2 1.1 0.8
Growth contribution of the balance of goods and services, percentage points
-0.4 -0.3 -0.9 0.8 0.7 -0.3
Net exports of goods and services as a share of nominal GDP, per cent
-4.3 -2.4 -3.6 3.6 6.7 0.6
Note: Growth contributions of private consumption, public consumption and growth fixed capital formation may not sum up to growth contribution of domestic demand, because the latter also includes the change in inventories/stocks. Source: European Commission (2017), own calculations

9
The countries following the two extreme regimes before the crisis, the ‘debt-led private demand boom’ regime and the ‘export-led mercantilist’ regime, generated rising current account imbalances in the global economy (Figure 1), but also within the Eurozone (Hein 2013/14, 2017b). Apart from Germany and Sweden, mainly China and Japan, but also Argentina, Canada and Russia were among the surplus countries, and, apart from the USA, the UK and Spain, we had Italy, Turkey, South Africa and Australia among the deficit countries. These global imbalances then led to the severity of the financial crisis and the Great Recession, as we will see below.
Figure 1: Current account balance, major countries, 1999-2016, in billions of US dollars
Source: IMF (2017), own presentation
3. Distribution and growth before the crisis: Stylised facts and regimes in stylised Marxian and Kaleckian models Let us now present and compare the two extreme growth regimes before the crisis, the ‘debt-led private demand boom’ and the ‘export-led mercantilist’ regime, in a stylised Marxian and also in a stylised Kaleckian model of distribution and growth. For this purpose, we apply the method of model closure, as has already been done in Hein (2017a) for a comparison of basic old neoclassical, new neoclassical, classical/Marxian and different versions of post-Keynesian growth theories.5 In what follows, we will focus on Marxian and Kaleckian models. In essence, we will start with two equations for the basic model, and will then add further equations for each of the approaches in order to close the model. Each approach can then be described graphically in a two-quadrant system by the relationship between the rate of growth and the rate of profit, on the one hand, and by the relationship
5 As acknowledged by Marglin (1984a, p. 530), Sen (1963) introduced the concept of model closures, and Marglin (1984a, 1984b), Amadeo (1986), and Dutt (1990), among others, have used it in order to compare different theoretical approaches.

10
between the rate of profit and the rate of capacity utilisation, on the other. This presentation can then be used, first, to show the properties of the ‘debt-led private demand boom’ and the ‘export-led mercantilist’ regime from the two perspectives, and second, to discuss the effects of distributional and behavioural changes in the period leading to the Great Financial Crisis and the Great Recession. 3.1 The basic model We assume an open economy with a primitive government sector, which only appears as a deficit spending sector drawing on credit generated in the financial sector so that we can ignore taxation issues. The private sector is composed of two classes, workers and capitalists, the latter including the financial capitalists or the rentiers. Capitalists own the means of production and receive profits, which are partly consumed and partly saved – buying assets issued by the corporate sector, and thus the capitalists themselves, or by the government, or depositing parts of the profits with the financial sector, which is also owned by the capitalists and not explicitly modelled here. Capitalists control the capital stock, hire labour, organise the production process, and decide about investment and thus the expansion of the capital stock. For the latter, they draw on their own means of finance, issue stocks or corporate bonds or draw on credit endogenously generated and granted by the financial sector. By assumption, these transactions take place within the capitalist class and they are not modelled here. Workers offer labour power to capitalists and receive wages, which they partly use in order to purchase consumption goods and partly save. However, the propensity to save out of wages is much lower than the propensity to save out of profits.
In our model economy, a homogenous output (Y) is produced combining direct labour (L) and a non-depreciating capital stock (K) in the production process using a fixed coefficients production technology with a constant labour-output ratio (a = L/Y) and a constant capital-potential output ratio (v = K/Yp). The homogeneous output can be used for consumption and investment purposes. For the sake of simplicity, we refrain from the consideration of overhead labour, depreciation of the capital stock, as well as raw materials and intermediate products. The rate of profit (r) relating the flow of profits (3) to the nominal capital stock (pK) can be decomposed into the profit share (h), relating profits to nominal income (pY), the rate of capacity utilisation (u), relating actual output to potential output given by the capital stock (Yp), and the inverse of the capital-potential output ratio (1/v), relating the capital stock to potential output:
(1) p
p
Y Y 1r hupK pY Y K v3 3
.
Our assumption regarding saving translates into the following domestic saving rate (V), which relates the flow of total domestic saving (S) to the value of the capital stock:

11
(2) � �
� �
W G WW
W W W
S S S s s W D u us h s 1 h dpK pK v v
us s h s d, 0 s s 1, d 0.v
3 33
3 3
� � 3 � �V � � �
� � � d � d tª º¬ ¼
Total saving is composed of saving out of profits (SΠ), saving out of wages (SW) and government saving (SG), which is zero or negative in our model, because we do not include taxation and only allow for government deficits ( GD S 0 � t ). The saving rate is thus
determined by the propensities to save out of profits (s3) and out of wages (sW), by the components of the profit rate from equation (1), as well as by the government deficit rate (d), which we treat as a long-run exogenous policy variable. A rise in the profit share will raise the saving rate, as will an increase in capacity utilisation, the functional propensities to save, and a reduction in the government deficit rate.
In the next steps we will now first look at the Marxian and Kaleckian closures of the model generating long-run distribution and growth equilibria for the ‘debt-led private demand boom’ and the ‘export-led mercantilist’ regimes, then at the cet. par. effects of changes in income shares for both regimes, and finally at the replication of the stylised facts in the pre-crisis period introducing further some behavioural changes. We will start with the Marxian approach and we will then move to the Kaleckian approach. 3.2 Marxian closure, regime generation and effects of distributional and behavioural changes before the crisis Karl Marx (1867, 1885, 1894) in most of Capital Vol. I – III assumes that, in the long run, functional income distribution is determined by socio-institutional factors and power relationships determining a subsistence or conventional real wage rate. For a given production technology the rate of profit then becomes a residual variable. With functional income distribution determined in this way, the rate of profit, together with capitalists’ propensity to save and to accumulate would thus determines the long-run equilibrium rates of capital accumulation and growth.6 In this approach, in essence the validity of Say’s law in Ricardo’s version is assumed to hold in the long run:7 Profits saved are completely used for investment and accumulation, so that no problems of effective demand for the economy as a whole arise in long-run growth. With positive saving out of wages, as well as the inflow of net foreign saving, we also have to assume that these are also channelled towards investment in the long run. For Marxians ignoring effective demand constraints in the long run does not mean that the growth path is characterised by full employment. On the contrary, unemployment is considered to be a persistent feature of capitalism constraining distribution claims of workers and thus providing the conditions for positive profits, capital accumulation and growth. Furthermore from this perspective, capital accumulation feeds
6 For a basic overview over Marxian theories of capital accumulation see Shaikh (1978). 7 Marx’s theory also allows for another interpretation, in which aggregate demand, finance, credit and interest rates matter for the determination of long-run accumulation and growth, as for example Argitis (2001) and Hein (2006) have discussed.

12
back on the rate of profit in the long run, and causes a tendency of the rate of profit to fall. The reason is a specific nature of technical progress causing a rising capital-potential output ratio, i.e. Marx’s notion of a rising ‘organic composition of capital’, which he already explained in Capital Vol. I.
Adding an orthodox Marxian closure to our model, we have that productive capacities given by the capital stock are used at their normal or target rate (un) in the long-run growth equilibrium: (3M) nuu . Functional income distribution is determined by socio-institutional factors and distribution conflict. A subsistence or conventional real wage rate (wr
s), for a given production technology and thus a given labour-output ratio, determines the profit share:
(4M) aw1pY
wLpYh rs�
� ,
with w representing the nominal wage rate. In the long run, the capital-potential output ratio may be rising with capital accumulation and growth, due to the Marxian type of technical change:
(5M) � � vv v g , 0gw
tw
.
The net export rate (b) relates net exports (NX), as the difference between nominal exports (pX) and imports (pfeM), to the nominal capital stock, with pf representing the foreign price level and e the nominal exchange rate, each taken to be exogenous here. In this orthodox Marxian approach, net exports can be considered to be given by net capital flows which are guided by the domestic (r) and the foreign rate of profit (rf), as well as by a set of further institutional factors (zi), as the openness and the degree of liberalisation of the capital account and the capital market of the respective country:
(6M) � � � �f
f f if i
pX p eM NX b bb b r r , z , 0, 0pK pK r r z� w w
�V � ! !ª º¬ ¼ w � w.
We treat institutional factors as exogenous parameters which will remain constant whenever domestic profit rates change. Taken the foreign profit rate as given, net exports will thus be negatively related to the domestic profit rate, because an increase in the domestic profit rate will reduce capital exports and increase capital imports.
Investment is given by domestic saving plus foreign saving (σf) flowing into the domestic economy associated with negative net exports (σf = -b). Each variable is normalised

13
by the domestic capital stock, so that we have for the domestic rate of capital accumulation and growth (g): (7M) fg b{ V�V { V� .
Figure 2a) presents the Marxian distribution and growth model for a ‘debt-led private demand boom’ economy and Figure 2b) for an ‘export-led mercantilist’ economy. On the left hand side of both figures we have the relationship between the rate of profit and the rate of capacity utilisation, as in equation (1). Since modern Marxians assume that, in the long run, productive capacities given by the capital stock are used at the normal rate, the long-run normal rate of profit (r*) is then determined by the profit share and by the capital-potential output ratio. A rise in the profit share will mean a clockwise rotation of the profit rate function, a rise in the capital-potential output ratio will make the function rotate counter-clockwise. On the right hand side of Figures 2a) and 2b), we have the relationship between the rate of profit, the domestic saving rate, the accumulation rate and the net export rate from equations (2), (6M) and (7M). Figure 2a) shows a ‘debt-led private demand boom’ economy with a current account deficit; the domestic saving rate is falling short of the domestic rate of capital accumulation and the difference is made up of negative net exports and hence the respective capital inflows, which are rising when the domestic profit rate is increasing, holding the foreign profit rate constant. Figure 2b) shows an ‘export-led mercantilist economy’ with a current account surplus; the domestic saving rate exceeds the rate of capital accumulation and the difference is made up by positive net exports and hence the respective capital outflows which are falling with an increase in the domestic profit rate in isolation.
The causality in the Marxian approach runs from the left hand side of Figures 2a) and 2b) to the right hand side. Distribution conflict determines the profit share and together with the technical conditions of production, indicated by the capital-potential output ratio, the profit rate. The latter, together with the propensities to save out of profits and wages and the government deficit rate, as well as the net export rate, determines equilibrium capital accumulation and growth. Under these conditions, any rise in the profit share or an increase in inequality in the personal or household distribution of income, raising the functional propensities to consume out of wages and out of profits and the differential between them, should cause a higher saving rate and a higher rate of capital accumulation in both the ‘debt-led private demand boom’ economies and the ‘export-led mercantilist’ economies. The same holds true for any fall in the government deficit rate.

14
Figure 2: A basic Marxian distribution and growth approach
a) The ‘debt-led private demand boom’ regime
b) The ‘export-led mercantilist’ regime
r
u
g = V-b
g, V, b
r=hun/v
un
r*
g*
V
V*
r
u
g = V-b
g, V, b
r=hun/v
un
r*
g*
V
V*

15
The effect of a rise in the profit share without any behavioural change in a simple Marxian model is shown for both regimes in Figure 3a) and 3b). A higher profit share causes a clockwise rotation in the profit rate function in the left hand side of these figures, which will then lead to higher equilibrium domestic saving and accumulation rates. Net export rates will fall, if the rise in profit shares and rates takes place in isolation and capital imports will thus rise, as assumed here. However, if profit shares and rates rise globally such that relative profit rates will not change in international comparison, net export rates should not be affected by redistribution.8
However, the effects shown in Figures 3a) and 3b) for an increase in the profit share are not consistent with the stylised facts we have summarised in Section 2 for the two regimes, and they also contradict the stories several eminent Marxian authors have been telling for the long-run period from the early 1980s until the Great Financial Crisis and the Great Recession. One of the leading proponents of the theory of ‘the falling rate of profit due a rising organic composition of capital’ (FRoP) and the resultant crisis of over-accumulation of capital, Shaikh (2011, 2016, Chapter 16), has put forward the following explanation. He argues that the long-run tendency of the normal or the maximum rate of profit to fall in the US non-financial business sector, due to Marxian technological progress causing a rising capital-potential output ratio in our model, was neutralised with respect to the rate of profit by redistribution at the expense of labour and thus by a rising profit share. This led to a constant trend for the total rate of profit, including interest and dividends, starting in the early 1980s, with remarkable cyclical fluctuations. A reduction in the interest rate (i) even allowed for an increase in the rate of profit of enterprise (rn = r-i). Most importantly, low interest rates together with the liberalisation and deregulation of credit and financial markets provided the conditions for increasing debt-financed expenditures, and debt-financed household consumption in the face of stagnating real wages and a falling wage share in particular. The associated rise in household debt-income ratios then provided the grounds for the Great Financial Crisis and the Great Recession.9
8 Rising inequality in personal and household incomes, leading to higher average propensities to save out of wages and out of profits and to a higher differential between these two rates, should shift the saving rate curves in Figures 3a) and 3b) rightwards and rotate them clockwise. Long-run equilibrium saving and accumulation rates will thus rise. The effect on net exports will depend on the development of domestic profit rates relative to foreign rates and on other institutional factors determining international capital movements. 9 “In the neoliberal era (1983 – 2007, EH), cheap finance became a way to expand employment through finance-related activities like real estate booms, export-led growth, foreign remittance growth, and so on. The crisis put an end to most of that.” (Shaikh 2016, p. 739)

16
Figure 3: A rising profit share in isolation in a basic Marxian approach
a) The ‘debt-led private demand boom’ regime
b) The ‘export-led mercantilist’ regime
r
u
g1=g2
g, V, b
r2 = h2un/v
un
r*1
g*2
V1=V2
V*2 V*1
r1 = h1un/v
r*2
g*1
r
u
g1=g2
g, V, b un
r*1
g*2
V1 = V2
V*1
r2 = h2un/v
V*2
r1 = h1un/v
r*2
g*1

17
A similar explanation of the developments leading to the 2007-9 crisis in the USA is presented by Kotz (2009, 2013), a proponent of the US Social-Structure-of-Accumulation (SSA) approach. According to this approach, previous deep crises in the developed capitalist economies, as the crisis of the mid 1970s in the USA in particular, indicating the end of the Golden Age and the ‘regulated capitalist SSA’, were caused by fall in the rate of profit due to a profit squeeze, i.e. a rise in the wage share, and thus problems in the ‘production of profits’. The 2007-9 crisis of the ‘neoliberal SSA’ in the USA, established in the early 1980s, however, is seen to be caused by problems in the ‘realization of profits’. Real wage growth falling short of productivity growth since the early 1980s, and thus a fall in the wage share, together with rising inequality in household incomes caused potential demand problems triggering falling rates of utilisation in manufacturing. The deregulation of the financial sector facilitating stock market and housing price booms in the 1990s and early 2000s and rising debt-financed household consumption provided temporary solutions to these demand problems. However, because of rising household debt-income ratios these solutions turned out to be unsustainable when stock market and housing prices stopped rising, which then triggered the Great Financial Crisis and the Great Recession.10
Finally, also prominent proponents of the Marxian monopoly capitalism school relating capitalist crises or stagnation to rising concentration of capital, rising profit shares and falling wage shares and thus to a lack of consumption demand, like Foster and Magdoff (2009) and Foster and McChesney (2012) have come up with a similar explanation for the 2007-9 US crisis as the proponents of the two other Marxian schools. In their view, credit-financed consumption demand has countered the tendency towards under-consumption and stagnation inherent in monopoly capitalism. The conditions were provided by the liberalization of the financial sector and the increasingly speculative booms in the stock and housing markets.11 The crisis was then triggered by financial instability associated with speculation and by over-indebtedness of private households in particular.
The three main strands of Marxian distribution, growth and crises theories have thus come up with similar explanations of the main trends leading to the crisis in the US: Demand problems related to the redistribution of income at the expense of labour and low income households have temporarily been compensated by the rise in credit-financed expenditures, and in credit-financed private consumption in particular. The liberalization and deregulation of the financial sector, which facilitated the stock market and housing price booms, on the one hand, creating the conditions for wealth effects on consumption, and the deterioration of creditworthiness standards, on the other hand, has been a pre-condition for this. However, the associated over-indebtedness of private households and financial instabilities
10 “The structural crisis of the neoliberal SSA finally arrived, not due to a falling rate of profit, but due to the collapse of unsustainable trends that were essential features of the neoliberal SSA and of its ability to promote capital accumulation.” (Kotz 2013, p. 345) 11 “It was this underlying stagnation tendency (…) which was the reason the economy became so dependent on financialisation – or decades-long series of ever-larger speculative financial bubbles. In fact, a dangerous feedback loop between stagnation and financial bubbles has now emerged, reflecting the fact that stagnation and financialisation are increasingly interdependent phenomena: a problem which we refer to (…) as the stagnation-financialisation trap.” (Foster and McChesney 2012, p. 4)

18
then triggered the financial and economic crisis. This explanation is fully consistent with the basics of the monopoly capitalism school. The principle mechanisms in the FRoP and SSA/profit-squeeze approaches, however, do not seem to be of any (SSA) or only little (FRoP) relevance for the explanation of the recent crises.
Let us now try to integrate this Marxian consensus view on distribution and growth before the crisis into our stylised Marxian model. The focus of the outlines presented here has been on the USA as a ‘debt-led private demand boom’ economy before the crisis, but we will also provide a Marxian view on the pre-crisis processes in an ‘export-led mercantilist’ economy as a kind of mirror image. Let us start with Figure 4a), which shows the pre-crisis processes in a ‘debt-led private demand boom’ regime from a stylised Marxian perspective. According to the Marxian view, the economy is operating at a target or normal rate of capacity utilisation in the long run, and the rise in the profit share – overcompensating the rise in the capital-potential output ration in the FRoP approach – thus leads to a rise in the long-run normal rate of profit from r*1 to r*2. However, this does not lead to rising capital accumulation, because the average propensities to save out of profits and out of wages have fallen due to rising debt-financed consumption. This is indicated by a leftwards shift and a counter-clockwise rotation of the domestic saving function. This overcompensates the effect of a rising profit share and normal profit rate on the equilibrium domestic saving rate, which therefore falls from σ*1 to σ*2. The fall in the equilibrium domestic saving rate is only partly compensated by an increase in the inflow of foreign saving triggered by a higher profit rate and an improvement of structural factors attracting foreign capital (financial market deregulation in particular) and associated with a rising current account deficits. Therefore, the equilibrium accumulation rate is falling as well, from g*1 to g*2. The reason why this should happen, however, remains somewhat vague in this Marxian approach.
The pre-crisis processes associated with an increasing profit share and rising inequality in an ‘export-led mercantilist’ regime are shown in Figure 4b). Since no compensating debt-financed consumption or rise in government deficits is at work in this regime, a rising profit share and a higher normal rate of profit is causing a higher equilibrium domestic saving rate, which thus increases from σ*1 to σ*2. However, since capital is increasingly attracted by deregulated foreign capital markets promising higher rates of return (including speculative capital gains), capital outflows and current account surpluses are increasing, leading to a lower long-run equilibrium rate of domestic capital accumulation, which is falling from g*1 to g*2. Again, it remains somewhat unclear in this Marxian approach why exactly domestic capital accumulation should shrink.

19
Figure 4: Distributional and behavioural changes before the crises: a stylized Marxian approach
a) The ‘debt-led private demand boom’ regime: rising profit share, rising rate of profit, falling average propensity to save due credit-financed consumption, and rising current
account deficits/net capital imports
b) The ‘export-led mercantilist’ regime: Rising profit share, rising rate of profit, rising average propensity to save, and rising current account surpluses/net capital exports
r
u
g1
g, V, b
r2 = h2un/v2
un
r*1
g*1
V1
V*1
V2
V*2
r1 = h1un/v1
r*2
g2
g*2
r
u
g1
g, V, b un
r*1
g*2
V1 = V2
V*1
r2 = h2un/v2
V*2
r1 = h1un/v1
g2
r*2
g*1

20
In the face of rising inequality and falling wage shares under the conditions of financialisation, the Marxian approach is thus able to generate ‘profits without investment’ constellations, i.e. rising normal rates of profits but falling rates of capital accumulation, for both the ‘debt-led private demand boom’ and the ‘export-led mercantilist’ economies, and thus to reproduce a stylised fact which has been observed by several authors (Hein 2012, van Treeck 2009) for these two types of economies before the crises. The crucial condition is that the long-run increase in credit-financed expenditures, especially private consumption, in the ‘debt-led private demand boom’ economies, and thus a fall in the domestic saving rate here, more than absorbs the increase in long-run equilibrium domestic saving in the ‘export-led mercantilist’ economies triggered by rising inequality and a higher profit share, such that international capital re-allocation leads to a fall in capital accumulation in the ‘export-led mercantilist’ economies, too. Since domestic and foreign saving (and hence the current/capital account balance), and thus profitability in the long run drives investment in this Marxian approach, there is no independent role for the consideration of effective demand, and of investment independently of saving in particular. Therefore, this Marxian approach is unable to explicitly incorporate the effects of financialisation on business investment in the capital stock, which have been analysed in several studies referred to in Section 2 above, and to include these effects into the analysis of distributional effects in the different growth regimes under the conditions of rising financialisation before the crisis. Interestingly, neither Shaikh (2011, 2016, Chapter 16) nor Kotz (2009, 2013) provide any in-depth study of the changes in business investment behaviour in the neo-liberal or financialisation period. However, Foster and McChesney (2012, Chapter 2) from the Marxian monopoly capitalism school, which is closer to Kaleckian distribution and growth theory in principle, touch upon such an analysis and come up with observations and conclusions which are similar to those integrated into Kaleckian models of distribution and growth applied to the period of financialisation. Therefore, we will turn towards the Kaleckian approach in the following section. 3.3 Kaleckian closure, regime generation and effects of distributional and behavioural changes before the crisis The stylised Marxian approach presented above suffers from the explicit consideration of the role of effective demand and investment determination in long-run growth theory. Alternatively, we can now turn to the second generation of post-Keynesian distribution and growth models based on Michal Kalecki’s (1954, 1971) and Josef Steindl’s (1952) works. Here, the determination of income distribution by relative economic powers of capital and labour, mainly through firms’ mark-up pricing on constant unit labour costs up to full capacity output in imperfectly competitive goods markets, is combined with the long-run independence of capital accumulation of firms from saving at the macroeconomic level, as a distinguishing feature of post-Keynesian distribution and growth models in general.12
12 “The Keynesian models (including our own) are designed to project into the long period the central thesis of the General Theory, that firms are free, within wide limits, to accumulate as they please, and that the rate of

21
Functional income distribution and hence the profit share are thus explained by relative economic powers of capital and labour, as in the Marxian approach. But then firms’ investment decisions, together with net exports and government deficits, drive the system and saving adjusts through income and growth effects, with the rate of capacity utilisation as an accommodating variable beyond the short run.13
The effects of distributional changes on equilibrium capacity utilisation and growth in Kaleckian models depend on a variety of factors, as has been reviewed in Blecker (2002), Hein (2014, Chapter 6) and Lavoie (2014, Chapter 6.2). First, for a closed private economy the choice of the investment function, i.e. the relative importance of demand/utilisation and profitability indicators for investment decisions, has given rise to two variants of the model. The ‘neo-Kaleckian’ model, based on the works of Rowthorn (1981) and Dutt (1984, 1987), contains a strong accelerator effect of demand and no direct effect of profitability in the investment function. Without saving out of wages it generates uniquely expansionary effects of re-distribution in favour of the wage share on the rates of capacity utilisation, capital accumulation, growth and profit. Demand and growth are thus uniquely wage led and the ‘paradox of costs’ is valid, i.e. a fall in the profit share will trigger an increase in the profit rate. The ‘post-Kaleckian’ model, based on the works of Bhaduri and Marglin (1990) and Kurz (1990), however, also contains a direct profitability effect in the investment function. Therefore, its closed economy version without saving out of wages is able to generate wage- or profit-led regimes of demand and growth, depending on the relative weights of accelerator and profitability terms in the investment function and on the propensity to save from profits. Second, including international trade, the otherwise wage-led neo-Kaleckian model may also turn profit-led through a strong positive effect of the profit share on net exports, as has already been shown by Blecker (1989). Third, including personal income distribution, wage inequality, relative income concerns and access to debt into the consumption function of the model, several recent contributions have shown that this might turn an otherwise wage-led demand and growth economy seemingly profit led, as recently reviewed by Hein and Prante (2018).
Adding a Kaleckian closure to our basic model, we treat the rate of capacity utilisation as a medium- to long-run endogenous variable. The profit share, and thus functional income distribution, is mainly determined by the mark-up (m) in firms’ pricing in imperfectly competitive markets:14
(3K) � � 0mh,mhh !
ww
.
saving of the economy as a whole accommodates itself to the rate of investment that they decree.” (Robinson 1962, pp. 82-83) 13 The treatment of the rate of capacity utilisation as a long-run endogenous variable has been criticized and debated for a while. For recent reviews, see Hein et al. (2011, 2012), Hein (2014, Chapter 11) and Lavoie (2014, Chapter 6.5). 14 Here, we ignore the effects of costs of imported raw materials and intermediate products on the domestic profit share. See Hein (2014, Chapter 7.3) for a Kaleckian model including these effects.

22
The mark-up itself is affected by several factors, such as the degree of competition in the goods market, the bargaining power of workers and also unit overhead costs, which we all treat as exogenously given. The capital-potential output ratio is also considered as an exogenous variable determined by technology which does not systematically respond to distribution and activity variables in the model, different from the Marxian view: (4K) vv . With the profit share and the capital-potential output ratio as exogenously given variables, the rate of capacity utilisation becomes the variable adjusting the profit rate (equation 1) to its equilibrium value. As principle determinants in the investment function in Kaleckian models, we have firms’ or managements’ animal spirits (D), sometimes taken to represent the firms’ assessment of the long-run growth trend of the economy. Furthermore, the (expected) rate of profit is of relevance, because it indicates internal means of finance required for attracting external investment finance, according to Kalecki’s (1937) ‘principle of increasing risk’. Also the dynamics of demand as a determinant of investment are reflected in the rate of profit through changes in capacity utilisation. Apart from animal spirits, we can thus include the three principle determinants of the profit rate from equation (1) into the Kaleckian accumulation function:
(5K) � � 0,0,0,0,,,, ww
!ww
tww
!Dww
D vg
ug
hggvuhgg .
Investment decisions will thus positively depend on the profit share and the rate of capacity utilisation, because each will increase the (expected) rate of profit, cet. par.. Neo-Kaleckians, however, would insist that the partial effect of a change in the profit share is irrelevant for firms’ decisions to invest, and hence that wg/wh = 0. In order to simplify the further exposition, but also for empirical reasons, we will follow this view here.15 Regarding exogenous changes in the capital-potential output ratio through technical change, the partial effects on investment decisions are not clear. On the one hand, a higher capital-potential output ratio means a lower rate of profit which should dampen investment. On the other hand, however, a higher capital-potential output ratio means that a certain increase in demand requires a higher increase in the capital stock which should boost investment. The sign of the sum of these two opposing effects is not clear ex ante, so that we will disregard any direct effect of changes in the capital-potential output ratio on investment in what follows, and treat the capital potential-output ratio as a constant, even in the face of technical change.16 15 Most of the empirical estimations of the post-Kaleckian model focussing on medium- to long-run results find only little or no significant effects of profitability variables on investment, such that domestic demand turns out to be wage led in developed capitalist economies. See Hein (2014, Chapter 7), Blecker (2016) and Stockhammer (2017) for recent reviews. 16 Technical change is thus assumed to be ‘Harrod-neutral’, as in many post-Keynesian/Kaleckian distribution and growth models (Hein 2014, Chapter 8).

23
The net export rate (b) is negatively affected by domestic capital accumulation and growth triggering rising imports, and positively affected by foreign accumulation and growth (gf) generating rising exports. Also the real exchange rate (er = epf/p), given by the nominal exchange rate (e), the foreign price index (pf) and the domestic price index (p), may have a positive effect on net exports, if exports and imports are price sensitive and the Marshall-Lerner conditions holds. We assume that the real exchange rate is positively related to the profit share:17
(6K) � �r
rff r
f
pX p eM NX b b b eb b g,g ,e h , 0, 0, 0, 0pK pK g g e h� w w w wª º � ! t !¬ ¼ w w w w
.
Finally, equation (7K) provides the goods market equilibrium condition: (7K) g* b* *� V . We can now present our two extreme regimes, the ‘debt-led private demand boom’ regime and the ‘export-led mercantilist’ regime in this stylised neo-Kaleckian distribution and growth model making use of Figures 5a) and 5b).18 In the right hand quadrants we have the determination of the long-run goods market equilibrium from equation (7K), with the domestic saving rate from equation (2) and the accumulation rate from equation (5K) as positive functions of the rate of profit (or its components), and the net export rate from equation (6K) as a negative function of the domestic growth and accumulation rate, for a given profit share, real exchange rate and foreign growth rate. Note that the net export rate is negative for the ‘debt-led private demand boom’ regime in Figure 5a) and positive for the ‘export-led mercantilist’ regime in Figure 5b). The goods market equilibrium then determines the equilibrium rate of capital accumulation, domestic saving rate (with the government deficit rate as an exogenous component), net export rate, as well as the equilibrium rate of capacity utilisation and, for a given profit share and capital-potential output ratio, also the equilibrium rate of profit in the left hand quadrant. A higher equilibrium accumulation and/or net export rate will thus be associated with higher equilibrium rates of capacity utilisation and profit, as will a lower domestic saving rate and thus a higher government deficit rate. In Figures 5a) and 5b) this can be brought about by a rightward shifts (higher animal spirits) or a clockwise rotation (higher utilisation rates triggering a higher responsiveness of the accumulation rate to a given rate of profit) of the accumulation function, by a rightward shift of the net export function (due to higher foreign growth or improved domestic price competitiveness), or by a leftward shift (rise in the government deficit rate, fall in the average propensity to save out of wages) or a counter-clockwise rotation (fall in the differential between the propensities to save out of profits and out of wages) of the saving function. 17 See Hein (2014, Chapter 7.3) for a more detailed open economy Kaleckian distribution and growth model. 18 More extensive and detailed generations of these regimes in Kaleckian stock-flow consistent models can be found in Hein (2014, Chapter 10) and in Detzer (2018), for example.

24
Figure 5: A basic Kaleckian distribution and growth approach
a) The ‘debt-led private demand boom’ regime
b) The ‘export-led mercantilist’ regime
r
u
V
g,V,b
g
r=uh/v
u*
r*
V*
g+b
g*
r
u
V
g,V,b
g r=uh/v
u*
r*
V*
g+b
g*

25
Any rise in the profit share will affect both the profit rate-curve in the left quadrant and potentially also the accumulation-curve in the right quadrant of the graphical presentation of the neo-Kaleckian model in Figures 6a) and 6b). On the one hand, a higher profit share will cause a clockwise rotation of the r-curve, and, on the other hand, a higher profit share will also affect the accumulation function and thus the g-curve. With a strong responsiveness of investment towards utilisation (wg/wu) and a very weak or even zero reaction towards the profit share (wg/wh), as assumed in the neo-Kaleckian model, a higher profit share and thus a lower rate of utilisation for every rate of profit, will trigger a counter-clockwise rotation of the accumulation function in the right hand side quadrants of Figures 6a) and 6b). Every rate of profit will now be associated with a lower rate of utilisation, and firms’ investment will respond accordingly. Finally, if we again assume that the rise in the profit share takes place in a single country in isolation, net exports will slightly improve, so that the rotation of the (g+b)-curve will slightly deviate from the rotation of the g-curve. Taking these effects together, we can see that both the ‘debt-led private demand boom’ regime in Figure 6a) and the ‘export-led mercantilist’ regime in Figure 6b) are wage led: a rise in the profit share, cet. par., will lead to a fall in the equilibrium rates of capacity utilisation from u*1 to u*2, profit from r*1 to r*2, capital accumulation from g*1 to g*2 and domestic saving from σ*1 to σ*2. However the equilibrium net export rates (b* = σ*-g*) will rise in both regimes, assuming that the increase in the profit share and the concomitant improvement of price competitiveness raising exports and the fall in domestic capacity utilisation dampening imports will take place in isolation. Obviously, if the rise in the profit share takes place globally, thus in both regimes, neither will relative price competitiveness be improved nor will the respective export markets remain constant, so that an improvement of net exports cannot be taken for granted any more for individual countries and, of course, is impossible for all the countries taken together.19
19 See Onaran and Galanis (2014) for supportive estimation results showing that globally simultaneous hikes in the profit share drastically reduce potentially positive effects on net exports and thus make overall wage-led results even more likely.

26
Figure 6: A rising profit share in isolation in a basic neo-Kaleckian approach
a) The ‘debt-led private demand boom’ regime
b) The ‘export-led mercantilist’ regime
r
u
V1=V2
g,V,b
g1 r1 = uh1/v
u*1
r*1
V*1
(g+b)1
g*1
r2 = uh2/v
u*2
(g+b)2 g2
g*2 V*2
r*2
r
u
V1 = V2
g,V,b
g1
r1 = uh1/v
u*1
r*1
V*1
(g+b)1
g*1
r2 = uh2/v g2
(g+b)2
u*2 g*2 V*2
r*2
27
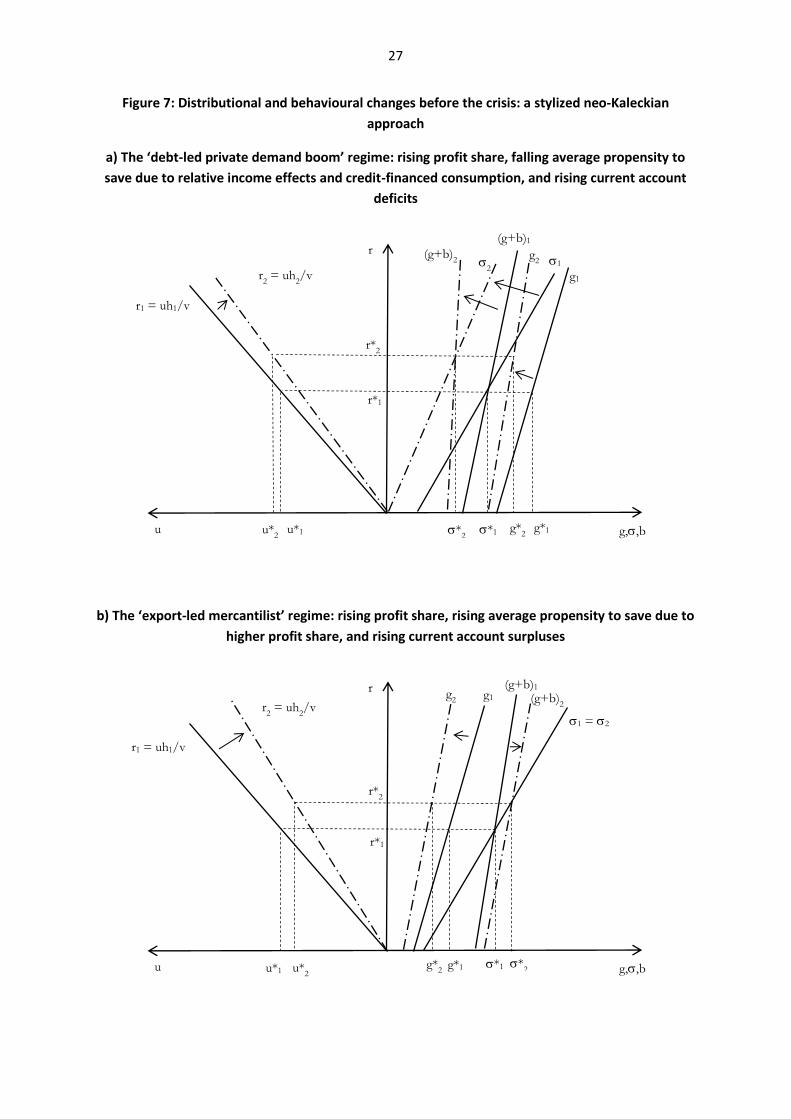
Figure 7: Distributional and behavioural changes before the crisis: a stylized neo-Kaleckian approach
a) The ‘debt-led private demand boom’ regime: rising profit share, falling average propensity to save due to relative income effects and credit-financed consumption, and rising current account
deficits
b) The ‘export-led mercantilist’ regime: rising profit share, rising average propensity to save due to higher profit share, and rising current account surpluses
r
u
V1
g,V,b
g1
r1 = uh1/v
u*1
r*1
V*1
(g+b)1
g*1
r2 = uh2/v
u*2
V2 (g+b)2 g2
g*2 V*2
r*2
r
u
V1 = V2
g,V,b
g1
r1 = uh1/v
u*1
r*1
V*1
(g+b)1
g*1
r2 = uh2/v g2 (g+b)2
u*2 g*2 V*2
r*2

28
In order to present the developments in the two regimes before the crisis in Figure 7, we now have to take into account further effects of financialisation and neoliberalism, as already outlined in Section 2 above.
Regarding investment in the capital stock, financialisation has meant increasing shareholder power vis-à-vis firms and workers. This has imposed short-termism on management and has caused a decrease in management’s animal spirits with respect to real investment in the capital stock and long-run growth of the firm, and increasing preference for financial investment, generating high profits in the short run. On the other hand, paying out dividends and buying back shares in order to satisfy shareholders, has drained internal means of finance available for real investment purposes from non-financial corporations and thus required a higher total rate of profit to execute a certain rate of capital accumulation. The ‘preference’ and the ‘internal means of finance’ channel thus cause a leftwards shift and a counter-clockwise rotation of the accumulation function in both regimes, from g1 to g2, as can be seen in Figures 7a) and 7b).
Regarding the effects on consumption we have to distinguish the two regimes. In the ‘debt-led private demand boom’ regime we have increasing credit-financed consumption in particular. This has been due to relative income concerns (‘keeping up with the Joneses’), the requirements to sustain necessary consumption in the face of falling wages, to considerable wealth effects on consumption associated with stock price and housing price booms, as well as to improved access to consumption credit due to financial innovations and liberalization. A rising profit share and higher income inequality are thus associated with lower propensities to save out of wages and out of profits, as well as with a lower differential between the two propensities. We observe thus a leftwards shift and a counter-clockwise rotation in the domestic saving function of Figure 7a), assuming little change in the government deficit rate. In the ‘export-led mercantilist’ regime any expansionary effects on consumption have been absent for several, partly different reasons in different countries: a more developed welfare state providing basic consumption and public goods, absence of housing price booms, a less deregulated credit market etc.. For the sake of simplicity, we have not changed the domestic saving function in Figure 7b), ignoring potentially contractionary effects of rising inequality in personal and household incomes, leading to higher average propensities to save out of wages and out of profits and to a higher differential between these two rates, which would shift the saving rate curve rightwards and rotate it clockwise.
Regarding net exports and the current account balance, we can ignore the effects of re-distribution on relative price competitiveness, because profit shares and rates have improved globally in both types of regimes. Therefore, the net export function will be mainly affected by relative demand dynamics and non-price competitiveness. In the ‘debt-led private demand boom’ economy, high domestic demand dynamics decrease net exports and increase current account deficits; the (g+b)-function in Figure 7a) thus shows a more pronounced leftward shift than the accumulation function. In the ‘export-led mercantilist’ economies, low domestic demand dynamics due to regressive redistribution dampens imports and high foreign demand dynamics, particularly from the ‘debt-led private demand

29
boom’ economies, raises exports, so that we have rising net exports and current account surpluses. In Figure 7b), therefore, although the accumulation function is shifted leftwards, the (g+b)-function gets slightly shifted to the right. As can be seen in Figure 7, redistribution and changes in economic behaviour under the conditions of financialisation lead to the following changes in medium- to long-run equilibrium positions in the two regimes. We obtain that a higher profit share raises the equilibrium profit rates in both regimes from r*1 to r*2. This is accompanied by a fall in equilibrium capital stock growth from g*1 to g*2, which means that we have ‘profits without investment’ regimes in both cases. However, in the ‘debt-led private demand boom’ case in Figure 7a) this is accompanied by a rise in the equilibrium rate of capacity utilisation from u*1 to u*2. Demand thus turns ‘seemingly profit-led’ here. Vigorous domestic demand dynamics in this regime also cause lower net exports and thus rising current account deficits. The ‘export-led mercantilist’ regime in Figure 7b) displays a fall in equilibrium capacity utilisation from u*1 to u*2, but shows higher net exports and current account surpluses. This overall constellation has then given rise to unsustainable private debt dynamics in the ‘debt-led private demand boom’ economies, which in countries not being able to issue debt in their own currencies was coupled with unsustainable foreign debt dynamics. These unsustainable debt dynamics then triggered the crisis and led to the collapse of both pre-crisis regimes in course of the Great Financial Crisis and the Great Recession, as has been analysed in more detail in Hein (2012, Chapter 6), for example.
Summing up, the stylised neo-Kaleckian model presented in this section is easily able to reproduce the stylised facts, which have been observed by several authors (Hein 2012, van Treeck 2009) for the two extreme demand and growth regimes before the crises. Compared to the stylised Marxian approach it provides a somewhat fuller picture due to the explicit consideration of demand dynamics and changes in investment determinants under the conditions of financialisation, in particular. 4. Distribution and growth after the crisis: Regime changes and stagnation tendencies As is well known, the Great Financial Crisis and the Great Recession started in the main ‘debt-led private demand boom’ economy, the USA, and were transmitted to the world economy through the international trade channel and the financial contagion channel. Initially, the ‘export-led mercantilist’ countries were hit particularly hard through these channels but then recovered at a relatively quick rate until 2011, whereas the other countries had some more problems (Figure 8). The quick initial recovery of the ‘export-led mercantilist’ economies was driven by the ongoing dynamic development in countries such as China, India and other emerging market economies which were hardly hit by the crisis (Dodig et al. 2016). Overall, the recovery until recently, however, has been slow in historical comparison, which has led Summers (2014, 2015) and others to rediscover the ‘secular stagnation’ hypothesis.20 As can be seen comparing the values in Tables 2 and 3, on average,
20 See the contributions in Teulings and Baldwin (2014a) and the survey by Teulings and Baldwin (2014b). For the presentation of post-Keynesian/Kaleckian critique of the current debate on ‘secular stagntion’ and for

30
in the crisis and post-crisis period GDP growth, and growth contributions of fixed investment in particular, have remained extremely weak compared to the pre-crisis period.
Figure 8
Source: European Commission (2017), own calculations and presentation
With the deep financial and economic crises some major changes in the demand and growth regimes took place, as can be seen looking at the average values for financial balances and GDP growth contributions in the period 2008-16 (Table 3).21 In the pre-crisis ‘debt-led private demand boom’ countries, the USA, the UK and Spain, the private sectors, i.e. the private households and partly the corporations, had to deleverage considerably. The financial balances of these sectors thus became positive, and the growth contributions of private consumption and investment shrank remarkably – in Spain they even became negative on average over the considered period. High public deficits stabilised the economy and allowed for low but positive growth in the USA and the UK, with the balances of goods and services slightly contributing to GDP growth in the USA. However, the current accounts remained considerably negative and thus the financial balance of the external sectors stayed positive. The USA and the UK hence moved from a ‘debt-led private demand boom’ regime towards a ‘domestic demand-led’ regime mainly stabilised by public sector deficits. The willingness to continue to accept high current account deficits in these two countries has contributed to the stabilisation of global demand in the world economy. alternative interpretations of current stagnation tendencies, see Cynamon and Fazzari (2015, 2016), Hein (2016), Palley (2016) and van Treeck (2015). 21 For more country-specific information on the causes of and the responses towards the crisis, see Evans (2016) on the US, Lepper et al. (2016) on the UK, Febrero and Bermejo (2013), Ferreiro et al. (2016) and Ferreiro and Gomez (2015) on Spain, Detzer and Hein (2016) and Hein and Detzer (2015) on Germany, Stenfors (2016) on Sweden, and Cournilleau and Creel (2016) on France, for example.

31
Table 3: Key macroeconomic variables for selected OECD countries,
average annual values for the period 2008-2016 USA UK Spain Ger-
many Swe-den
France
Financial balances of external sector as a share of nominal GDP, per cent
2.7 3.7 1.7 -6.9 -5.8 2.3
Financial balances of public sector as share of nominal GDP, per cent
-7.8 -6.6 -7.5 -0.8 -0.2 -4.7
Financial balance of private sector as a share of nominal GDP, per cent
5.2 3.0 5.8 7.7 6.0 2.4
- Financial balance of private household sector as a share of nominal GDP, per cent
3.4 1.2 1.8 5.1 6.6 3.6
- Financial balance of the corporate sector as a share of nominal GDP, per cent
1.8 1.8 4.2 2.5 -0.7 -1.2
Real GDP growth, per cent 1.3 1.0 0.0 1.0 1.5 0.6 Growth contribution of domestic demand including stocks, percentage points
1.1 0.8 -1.2 1.0 1.7 0.8
- Growth contribution of private consumption, percentage points
1.1 0.5 -0.3 0.6 0.8 0.5
- Growth contribution of public consumption, percentage points
0.0 0.2 0.1 0.4 0.4 0.3
- Growth contribution of gross fixed capital formation, percentage points
0.1 0.0 -1.0 0.2 0.4 0.0
Growth contribution of the balance of goods and services, percentage points
0.1 0.0 1.2 0.1 -0.2 -0.2
Net exports of goods and services as a share of nominal GDP, per cent
-3.3 -2.2 0.5 6.1 5.1 -1.9
Note: Growth contributions of private consumption, public consumption and growth fixed capital formation may not sum up to growth contribution of domestic demand, because the latter also includes the change in inventories/stocks. Source: European Commission (2017), own calculations

32
Spain has been a different case. Initially in the crisis, high public-sector deficits allowed the private sector to generate financial surpluses and to deleverage. However, with the euro crisis since 2010 and the austerity policies implemented, public deficits have been reduced, public and private domestic demand have collapsed and real GDP growth has turned negative for a couple of years. Positive growth contributions only came from the balance of goods and services, the current account improved and has, on an annual basis, remained positive since 2013. Spain has thus moved from a ‘debt-led private demand boom’ economy towards an ‘export-led mercantilist’ economy. Both in the USA and the UK, as well as in Spain, the regime shifts have been associated with a further deterioration of income distribution (Table 1): Labour income shares in all three countries have been falling further, Gini coefficients for the household distribution of income before and after taxes have been rising in the USA and Spain, and remained constant at very high levels in the UK, and only top income shares have been falling in the UK and Spain, but continued to rise in the USA. These developments have prevented a mass income- or wage-driven recovery in these countries, so that the options have been either drawing on government deficits (USA, UK) or on foreign sector deficits (Spain) as stabilisers of demand and growth. In terms of the stylised models discussed in Section 3, the constellation in the USA and the UK can still be described by the second equilibrium in Figure 7a) for the ‘debt-led private demand boom’ regime. The only difference is now that the low domestic saving rate is sustained by government deficits instead of private household deficits. The constellation for Spain, however, is moving towards the second equilibrium shown in Figure 7b) for the ‘export-led mercantilist’ regime.
In the ‘export-led mercantilist’ countries before the crisis, Germany and Sweden, the public sector initially accepted high financial deficits (Germany) or a strong reduction of surpluses leading to small deficits (Sweden) in the crisis and the years following in order to stabilise the private sector and the macro-economy. However, these deficits could be passively consolidated, because of the economic recovery, initially driven by net exports. The financial balances of the private sectors have remained positive, in particular for private households, and in Germany the corporations have remained in surplus, too, whereas in Sweden they have incurred a small deficit (Table 3). On average over the period 2008-16, the small economic growth has been driven by domestic demand, with significant contributions of private consumption. But the balances of goods and services have still contributed to growth in Germany. However, in Sweden the growth contributions have even turned slightly negative. This shift towards domestic private demand as a main driver of growth has been made possible by halting the trend towards rising inequality (Table 1): Labour income shares stopped falling, top income shares have not been rising any more, and in Sweden Gini coefficients for pre- and post-tax household incomes have remained constant, whereas in Germany, however, they have continued to rise slightly. But these countries still show considerable current account and net export surpluses, and thus negative financial balances of the respective external sectors. In Germany, these surpluses have exceeded those before the crisis and have shown a rising tendency, whereas in Sweden they have only slightly been lower than before the crisis. Germany has thus continued to follow the ‘export-led

33
mercantilist’ regime after the crisis, and Sweden has only moderately deviated and become ‘weakly export-led’. In terms of the stylised models discussed in Section 3, the regimes in both Germany and Sweden can thus still be described by the second equilibrium in Figure 7b) for the ‘export-led mercantilist’ regime.
The ‘domestic demand-led’ regime in France has not changed significantly in the crisis and the following years. Financial surpluses of private households have been mopped up by corporations, but even more so by the public sector (Table 3). Due to the stabilisation requirements in the crisis, public sector deficits have increased relative to the cycle before the crisis. The balance of the external sector, which had become positive already before the crisis has been rising, so that France on average over the second period has been running a current account and a net exports deficit. Public deficits in France have thus been stabilising global demand for goods and services, too. Growth in France has been driven by domestic demand, and mainly by private and public consumption. The former has been facilitated by a decline in inequality in the period after the crisis (Table 1). France is the only country in our data set, in which the labour income share has been slightly rising, the Gini coefficients for pre- and post-tax incomes of households have been falling and top income shares have at least remained constant in the period after the crisis.
From a global perspective, current account imbalances have been slightly reduced in and after the crisis, if compared to the years before the crises. However, they are still much more pronounced than in the early 2000s (Figure 1). The high current account surpluses by the ‘export-led mercantilist’ countries, Germany, Spain and Sweden in our study, but also the Eurozone as a whole, China, Japan, Italy and Russia, have been matched by current account deficits of ‘domestic demand-led’ economies with high public sector deficits, in particular the USA, the UK and France in our study, and furthermore by emerging market and commodity producing countries like Argentina, Australia, Brazil, Canada, India, South Africa and Turkey.
The risks of such a global constellation are obvious. If ever more economies move towards an ‘export-led mercantilist’ strategy, the world economy will face an aggregation problem. It will become increasingly difficult to generate the related current account deficits in other regions of the world. Dominating tendencies towards demand stagnation are then the inescapable consequences. And to the degree that global demand stabilisation has to rely on public sector financial deficits in the mature ‘domestic demand-led’ economies, as well as on public and private sector deficits in emerging market economies, there are severe risks and dangers built up. First, high government deficits and debt in mature ‘domestic demand-led’ economies as stabilisers of national and global demand may be reversed for political reasons (debt ceilings, debt brakes), although there may be no risks of over-indebtedness of governments, if debt can be issued in the countries’ own currency and is backed by the respective central bank. Second, capital inflows into emerging market economies may be unstable and face ‘sudden stops’ because of changes in expectations and/or over-indebtedness in foreign currency of these countries. And third, there are the risks of politically induced protection measures in order to reduce current account and net export deficits, which are considered to be too high.

34
Apart from these short- to medium-run problems of stability of such a global constellation, there arises a long-run stagnation problem associated with the still persisting ‘profits without investment’ patterns in the post-crisis regimes. Theoretically, these are shown in Figure 7, which still explains the patterns in the major current ‘domestic demand-led by government deficits’ and the ‘export-led mercantilist’ regimes, as we have argued above. And empirically, the problem can be observed in Table 3 showing particular weak growth contributions of private investment accompanying high and in several countries even rising inequality. High and rising inequality – indicated by a high and rising profit share for the sake of simplicity – and depressed capital accumulation will have re-enforcing depressing effects on productivity growth, thus contributing to long-run stagnation, as can be briefly shown, building on the neo-Kaleckian model presented in Section 3.
Starting with Rowthorn (1981), Dutt (1990, Chapter 5), Taylor (1991, Chapter 10) and Lavoie (1992, Chapter 6), several authors have introduced endogenous technological change and labour productivity growth into Kaleckian distribution and growth models, as reviewed and elaborated on in Hein (2014, Chapter 8). Relying on Kaldor’s (1957, 1961) technical progress function and/or on Kaldor’s (1966) ‘Verdoorn’s Law’, labour productivity growth is assumed to be positively affected by capital stock growth due to capital-embodied technological change, and/or demand growth due to dynamic returns to scale. And we can add a Marxian component to the story, following Marx (1867) and integrating a wage-push variable into the productivity growth function of the model, arguing that a higher real wage rate or a higher wage share induces capitalists to speed up the implementation of labour augmenting technological progress in order to protect the profit share. We thus get equation (8) for long-run productivity growth ( y ), with zi representing a set of further institutional factors determining productivity growth, like government technology policies, the education system, etc.:
(8) � �ii
ˆ ˆ ˆy y yˆ ˆy y g*,h,z , 0, 0, 0g* h zw w w
! � !w w w
.
Furthermore, we can assume that the goods market equilibrium rate of capital accumulation is positively affected by productivity growth, because of capital embodied technological change, in particular. Firms have to invest in new capital stock in order to benefit from technological inventions. Taking into account the exogenous parameters determining the goods market equilibrium rate of accumulation derived in Section 3, we arrive at the following equation for equilibrium capital accumulation:
(9) � �WW
g* g* g* g* g* g*ˆg* g* y, ,h,s ,s ,d,b , 0, 0, 0, 0, 0, 0y h s s d b3
3
w w w w w w D ! � � � ! !
w w w w w w.
Equations (8) and (9) describe a demand-determined endogenous growth model and Figure 9 presents the long-run equilibrium values for capital accumulation ( **g ) and productivity

35
growth ( **y ), and thus the endogenous potential or ‘natural’ growth grate.22 Any fall in the goods market equilibrium rate of capital accumulation – as the ones we have seen for both the ‘debt-led private demand boom’ and the ‘export-led mercantilist’ regimes before the crisis, which then have persisted in the post-crisis regimes – will thus cause a leftwards shift in the g*-curve and thus lower long-run equilibrium rates of capital accumulation and productivity growth, and hence potential growth. Finally, Figure 10 shows the effect of a rise in the profit share on long-run potential growth. In this case, both curves get shifted and the long-run growth equilibrium falls from ** **
1 1ˆg , y to ** **2 2ˆg , y . Redistribution at the expense of
wages is thus detrimental to long-run capital accumulation, productivity growth and thus to potential growth, although there may be short- to medium-run compensatory factors which dampen or even overcompensate the effects on aggregate demand and the profit rate, i.e. rising deficit spending of private households, of the government or of the foreign sector. These, however, are difficult to sustain, as we have seen.
Figure 9: A Kalecki-Kaldor-Marx endogenous growth model
-
22 For analytical treatments see Hein (2014, Chapter 8, 2017a).

36
Figure 10: Redistribution in favour of profits and stagnation with endogenous productivity growth
- Summing up, post-crisis stagnation tendencies can be explained by those factors generating low capital stock growth, on the one hand, i.e. depressed animal spirits of management of non-financial corporations, too high propensities to save out of the different types of income, too low government deficit rates in particular in the ‘export-led mercantilist’ countries, and too high profit shares. On the other hand, too high profit shares have a depressing effect on innovation activities of firms and on productivity growth; the latter being depressed by low capital accumulation, too.23 5. Summary and conclusions In this contribution, we have provided Marxian and Kaleckian assessments of the distribution and growth regimes under finance-dominated capitalism before the recent financial and economic crises. Based on this, we have presented an interpretation of regime shifts and stagnation tendencies after the crises in a demand-led endogenous productivity growth model with Kaleckian, Kaldorian and Marxian features.
First, we have recalled the main macroeconomic features of financialisation and have derived empirically the main extreme growth regimes in the face of redistribution at the expense of the wage share and low income households, the ‘debt-led private demand boom’ and the ‘export-led mercantilist’ regimes. Then we have assessed these regimes in stylised Marxian and neo-Kaleckian distribution and growth models. Both models are able to generate these regimes, which contain and explain the ‘profits without investment’ phenomenon observed in empirical studies. However, we have argued that the stylised neo-Kaleckian model is superior over the stylised Marxian model, because it explicitly takes into account the demand determinants of long-run growth and thus in particular the effects of
23 For a more detailed discussion see Hein (2016, 2017a).

37
financialisation and re-distribution on investment, irrespective of prior saving. Finally, we have assessed the changes in distribution and growth regimes in the crisis and post-crisis period and interpreted these changes in the context of the stylised neo-Kaleckian model. We have seen that pre-crisis ‘debt-led private demand boom’ countries have either turned ‘domestic demand-led’ stabilised by government deficits or ‘export-led mercantilist’, with the pre-crisis ‘export-led mercantilist’ countries sticking to their regimes. This has meant that global current account imbalances and the related fragilities have been more or less maintained, with government deficits in the current ‘domestic demand-led’ regimes assuming the role of the private household financial deficits in the pre-crisis ‘debt-led private demand boom’ regimes. Furthermore, since the ‘profits without investment’ phenomenon has been maintained in the post-crisis regimes, we have extended the neo-Kaleckian model by a productivity growth equation with Kaldorian and Marxian features, generating a demand-led endogenous growth model, and we have shown how current stagnation tendencies can be explained by this model.
References Amadeo, E.J. (1986). Notes on capacity utilisation, distribution and accumulation.
Contributions to Political Economy, 5, 83-94. Argitis, G. (2001). Intra-capitalists conflict, monetary policy and income distribution. Review
of Political Economy, 13, 453-470. Barba, A., & Pivetti, M. (2009). Rising household debt: its causes and macroeconomic
implications – a long-period analysis. Cambridge Journal of Economics, 33, 113-137. Bhaduri, A., & Marglin, S. (1990). Unemployment and the real wage: the economic basis for
contesting political ideologies. Cambridge Journal of Economics, 14, 375–93. Blecker, R.A. (1989). International competition, income distribution and economic growth.
Cambridge Journal of Economics, 13, 395–412. Blecker, R.A. (2002). Distribution, demand and growth in neo-Kaleckian macro-models. In M.
Setterfield (Ed.), The Economics of Demand-Led Growth. Cheltenham: Edward Elgar Blecker, R.A. (2016). Wage-led versus profit-led demand regimes: the long and the short of
it. Review of Keynesian Economics, 4, 373-390. Boone, L., & Girouard, N. (2002). The stock market, the housing market and consumer
behaviour. OECD Economic Studies, 35, 175-200. Cournilleau, G., & Creel, J. (2016). France, a domestic demand-led economy under the
influence of external shocks. In: E. Hein, D. Detzer, & N. Dodig (Eds.), Financialisation and the Financial and Economic Crises: Country Studies. Cheltenham: Edward Elgar.
Cynamon, B., & Fazzari S.M. (2008). Household debt in the consumer age: source of growth – risk of collapse. Capitalism and Society, 3(2), 1-30.
Cynamon, B., & Fazzari, S.M. (2013). Inequality and household finance during the consumer age (Working Paper No. 752). Annandale-on-Hudson, NY: Levy Economics Institute of Bard College.
38
Cynamon, B.Z., & Fazzari, S.M. (2015). Rising inequality and stagnation in the US economy. European Journal of Economics and Economic Policies: Intervention, 12(2), 170-172.
Cynamon, B.Z., & Fazzari, S.M. (2016). Inequality, the Great Recession and slow recovery. Cambridge Journal of Economics, 40, 373–399.
Davis, L. (2018). Financialisation and the nonfinancial corporation: an investigation of firm level investment behavior in the United States. Metroeconomica, 69(1), 270-3017
Detzer, D. (2018). Inequality, emulation and debt: the occurrence of different growth regimes in the age of financialisation in a stockflow consistent model. Journal of Post Keynesian Economics. forthcoming.
Detzer, D., & Hein, E. (2016). Financialisation and the crises in the export-led mercantilist German economy. In: E. Hein, D. Detzer, & N. Dodig (Eds.), Financialisation and the Financial and Economic Crises: Country Studies. Cheltenham: Edward Elgar.
Dodig, N., Hein, E., & Detzer, D. (2016). Financialisation and the financial and economic crises: Theoretical framework and empirical analysis for 15 countries. In: E. Hein, D. Detzer, & N. Dodig (Eds.), Financialisation and the Financial and Economic Crises: Country Studies. Cheltenham: Edward Elgar.
Dutt, A.K. (1984). Stagnation, income distribution and monopoly power. Cambridge Journal of Economics, 8, 25–40.
Dutt, A.K. (1987). Alternative closures again: a comment on ‘Growth, distribution and inflation’. Cambridge Journal of Economics, 11, 75–82.
Dutt, A.K. (1990). Growth, Distribution and Uneven Development. Cambridge, UK: Cambridge University Press.
European Commission. (2017). Annual Macroeconomic Database (AMECO). [April 7, 2017]. https://ec.europa.eu/info/business-economy-euro/indicators-statistics/economic-databases/macro-economic-database-ameco_en.
Evans, T. (2016). The crisis of finance-led capitalism in the United States. In: E. Hein, D. Detzer, & N. Dodig (Eds.), Financialisation and the Financial and Economic Crises: Country Studies. Cheltenham: Edward Elgar.
Febrero, E., & Bermejo, F. (2013). Spain during the Great Recession: teetering on the brink of collapse. In: O. Dejuan, E. Febrero, & J. Uxo (Eds.), Post-Keynesian Views of the Crisis and its Remedies. Abingdon: Routledge.
Ferreiro, J., Galvez, C., & Gonzales, A. (2016). Financialisation and the economic crisis in Spain. In: E. Hein, D. Detzer, & N. Dodig (Eds.), Financialisation and the Financial and Economic Crises: Country Studies. Cheltenham: Edward Elgar.
Ferreiro, J., & Gomez, C. (2015). The economic crisis in Spain: mistakes made in the management of labour markets and fiscal policy. In: A. Bitzenis, N. Karagiannis, & J. Marangos (Eds.). Europe in Crisis: Problems, Challenges and Alternative Perspectives. New York: Palgrave Macmillan.
Foster, J.B., & Magdoff, F. (2009). The Great Financial Crisis: Causes and Consequences. New York: Monthly Review Press.

39
Foster, J.B., & McChesney, R.W. (2012). The Endless Crisis: How Monopoly-Finance Capital Produces Stagnation and Upheaval from the USA to China. New York: Monthly Review Press.
Guttmann, R., & Plihon, D. (2010). Consumer debt and financial fragility. International Review of Applied Economics, 24, 269-283.
Hein, E. (2006). Money, interest and capital accumulation in Karl Marx’s economics: a monetary interpretation and some similarities to post-Keynesian approaches. European Journal of the History of Economic Thought, 13, 113-140.
Hein, E. (2012). The Macroeconomics of Finance-dominated Capitalism – and its Crisis. Cheltenham: Edward Elgar.
Hein, E. (2013/14). The crisis of finance-dominated capitalism in the Euro area, deficiencies in the economic policy architecture and deflationary stagnation policies. Journal of Post Keynesian Economics, 36 (2), 325–354.
Hein, E. (2014). Distribution and Growth after Keynes: A Post-Keynesian Guide. Cheltenham: Edward Elgar.
Hein, E. (2015). Finance-dominated capitalism and re-distribution of income – a Kaleckian perspective. Cambridge Journal of Economics, 39, 907-934.
Hein, E. (2016). Secular stagnation or stagnation policy? Steindl after Summers. PSL Quarterly Review, 69(276), 3-47.
Hein, E. (2017a). The Bhaduri/Marglin post-Kaleckian model in the history of distribution and growth theories – an assessment by means of model closures. Review of Keynesian Economics, 5(2), 218-238.
Hein, E. (2017b). Stagnation policy in the Eurozone and economic policy alternatives: A Steindlian/neo-Kaleckian perspective (FMM Working Paper 5/2017). Forum Macroeconomics and Macroeconomic Policies.
Hein, E., & Detzer, D. (2015). Financialisation, re-distribution and ‘export-led mercantilism’: the case of Germany. In: A. Gallas, H. Herr, F. Hoffer, & C. Scherrer (Eds.), Combating Inequality: Opportunities for Economic and Political Change. London: Routledge.
Hein, E., & Dodig, N. (2015). Financialisation, distribution, growth and crises – long-run tendencies. In: E. Hein, D. Detzer, & N. Dodig (Eds.), The Demise of Finance-dominated Capitalism: Explaining the Financial and Economic Crises. Cheltenham: Edward Elgar.
Hein, E., Dodig, N., & Budyldina, N. (2015). The transition towards finance-dominated capitalism: French Regulation School, Social Structures of Accumulation and post-Keynesian approaches compared. In: E. Hein, D. Detzer, & N. Dodig (Eds.), The Demise of Finance-dominated Capitalism: Explaining the Financial and Economic Crises. Cheltenham: Edward Elgar.
Hein, E., Dünhaupt, P., Alfageme, A., & Kulesza, M. (2017a). Financialisation and distribution in the US, the UK, Spain, Germany, Sweden and France - before and after the crisis (Institute for International Political Economy (IPE) Working Paper, 85/2017). Berlin: Institute for International Political Economy.

40
Hein, E., Dünhaupt, P., Alfageme, A., & Kulesza, M. (2017b). Financialisation and distribution before and after the crisis: patterns for six OECD countries. In: P. Arestis, & M. Sawyer (Eds.), Economic Policies since the Global Financial Crisis. International Papers in Political Economy. Basingstoke: Palgrave Macmillan.
Hein, E., Lavoie, M., & van Treeck, T. (2011). Some instability puzzles in Kaleckian models of growth and distribution: a critical survey. Cambridge Journal of Economics, 35, 587-612.
Hein, E., Lavoie, M., & van Treeck, T. (2012). Harrodian instability and the “normal rate” of capacity utilisation in Kaleckian models of distribution and growth – a survey. Metroeconomica, 63, 139-169.
Hein, E., & Mundt, M. (2012). Financialisation and the requirements and potentials for wage-led recovery – a review focussing on the G20. (Conditions of Work and Employment Series No. 37) Geneva: ILO.
Hein, E., & Prante, F.J. (2018). Functional distribution and wage inequality in recent Kaleckian growth models. In: H. Bougrine, & L.-P. Rochon (Eds.), Economic Growth and Macroeconomic Stabilization Policies in Post-Keynesian Economics, Essays in Honour of Marc Lavoie and Mario Seccareccia, Book Two. Cheltenham: Edward Elgar, forthcoming.
Horn, G., Joebges, H., & Zwiener, R. (2009). From the financial crisis to the world economic crisis (II). Global imbalances: Cause of the crisis and solution strategies for Germany (IMK Policy Brief, December 2009). Duesseldorf: Macroeconomic Policy Institute (IMK) at Hans-Boeckler Foundation.
International Monetary Fund (IMF). (2017). World Economic Outlook Database. [May 26 2017]. https://www.imf.org/external/pubs/ft/weo/2017/01/weodata/index.aspx
Kaldor, N. (1957). A model of economic growth. The Economic Journal, 67, 591-624. Kaldor, N. (1961). Capital accumulation and economic growth. In: F.A. Lutz, & D.C. Hague
(Eds.), The Theory of Capital. London: Macmillan. Kaldor, N. (1966). Causes of the Slow Rate of Economic Growth in the United Kingdom.
Cambridge, UK: Cambridge University Press. Kalecki, M. (1937). The principle of increasing risk. Economica, 4, 440-447. Kalecki, M. (1954). Theory of Economic Dynamics. London: George Allen and Unwin. Kalecki, M. (1971). Selected Essays on the Dynamics of the Capitalist Economy, 1933-70.
Cambridge, UK: Cambridge University Press. Kim, Y.K. (2013). Household debt, financialisation, and macroeconomic performance in the
United States, 1951-2009. Journal of Post Keynesian Economics, 35, 675–694. Kim, Y.K. (2016). Macroeconomic effects of household debt: an empirical analysis. Review of
Keynesian Economics, 4, 127–150. Kotz, D.M. (2009). The financial and economic crisis of 2008: A systemic crisis of neoliberal
capitalism. Review of Radical Political Economics, 41, 305-317. Kotz, D.M. (2013). Social Structures of Accumulation, the rate of profit, and economic crises.
In: J. Wicks-Lim, & R. Pollin (Eds.), Capitalism on Trial: Explorations in the Tradition of Thomas E. Weisskopf, Cheltenham, UK: Edward Elgar.

41
Kurz, H.D. (1990). Technical change, growth and distribution: a steady state approach to unsteady growth. In: H.D. Kurz (Ed.), Capital, Distribution and Effective Demand: Studies in the Classical Approach to Economic Theory. Cambridge: Polity Press.
Lavoie, M. (1992). Foundations of Post Keynesian Economic Analysis. Aldershot, Brookfield: Edward Elgar.
Lavoie, M. (2014). Post-Keynesian Economics: New Foundations. Cheltenham: Edward Elgar. Lepper, J., Shabani, M., Toporowski, J., & Tyson, J. (2016). Monetary adjustment and
inflation of financial claims in the UK after 1980. In: E. Hein, D. Detzer, & N. Dodig (Eds.), Financialisation and the Financial and Economic Crises: Country Studies. Cheltenham: Edward Elgar.
Ludvigson, S., & Steindl, C. (1999). How important is the stock market effect on consumption?. Federal Reserve Bank of New York Economic Policy Review, July, 29-51.
Marglin, S.A. (1984a). Growth, Distribution and Prices. Cambridge, MA: Harvard University Press.
Marglin, S.A. (1984b). Growth, distribution and inflation: a centennial synthesis. Cambridge Journal of Economics, 8, 115-144.
Marx, K. (1867). Das Kapital. Kritik der politischen Ökonomie, Erster Band: Der Produktionsprozeß des Kapitals, 4th edition 1890, edited by F. Engels. English translation: Capital. A Critique of Political Economy, Volume 1: The Process of Capitalist Production. New York: International Publisher, 1967.
Marx, K. (1885). Das Kapital. Kritik der politischen Ökonomie, Zweiter Band: Der Zirkulationsprozeß des Kapitals, 2nd edition 1893, edited by F. Engels. English translation: Capital. A Critique of Political Economy, Volume 2: The Process of Circulation of Capital. New York: International Publisher, 1967
Marx, K. (1894). Das Kapital. Kritik der politischen Ökonomie, Dritter Band: Der Gesamtprozeß der kapitalistischen Produktion, edited by F. Engels. English translation: Capital. A Critique of Political Economy, Volume 3: The Process of Capitalist Production as A Whole. New York: International Publisher, 1967.
Mehra, Y.P. (2001). The wealth effect in empirical life-cycle aggregate consumption equations. Federal Reserve Bank of Richmond Economic Quarterly, 87(2), 45-68.
Onaran, Ö., & Galanis, G. (2014). Income distribution and growth: a global model. Environment and Planning A, 46, 2489–2513.
Onaran, Ö., Stockhammer, E., & Grafl, L. (2011). Financialisation, income distribution and aggregate demand in the USA. Cambridge Journal of Economics, 35, 637-661.
Orhangazi, Ö. (2008). Financialisation and capital accumulation in the non-financial corporate sector: a theoretical and empirical investigation on the US economy: 1973-2003. Cambridge Journal of Economics, 32, 863-886.
Palley, T.I. (2016). Inequality, the financial crisis and stagnation: competing stories and why they matter. Real World Economics Review, 74, 1-18.
Robinson, J. (1956). The Accumulation of Capital. London: Macmillan. Robinson, J. (1962). Essays in the Theory of Economic Growth. London: Macmillan.

42
Rowthorn, R.E. (1981). Demand, real wages and economic growth. Thames Papers in Political Economy, Autumn, 1-39.
Sen, A. (1963). Neo-classical and neo-Keynesian theories of distribution. Economic Record, 39, 53-64.
Shaikh, A. (1978). An introduction to the history of crisis theories. U.S. Capitalism in Crisis, New York: URPE.
Shaikh, A. (2011). The first great depression of the 21st century. Socialist Register, 47, 44-63. Shaikh, A. (2016). Capitalism: Competition, Conflict, Crises. Oxford: Oxford University Press. Steindl, J. (1952). Maturity and Stagnation in American Capitalism. Oxford: Blackwell, 2nd
edition: New York, London: Monthly Review Press, 1976. Stenfors, A., (2016). Swedish financialisation: ‘nordic noir’ or ‘safe haven’?. In: E. Hein, D.
Detzer, & N. Dodig (Eds.), Financialisation and the Financial and Economic Crises: Country Studies. Cheltenham: Edward Elgar.
Stockhammer, E. (2004). Financialisation and the slowdown of accumulation. Cambridge Journal of Economics, 28, 719-741.
Stockhammer, E. (2010). Income distribution, the finance-dominated accumulation regime, and the present crisis. In: S. Dullien, E. Hein, A. Truger, & T. van Treeck (Eds.), The World Economy in Crisis - the Return of Keynesianism?. Marburg: Metropolis.
Stockhammer, E. (2012). Financialisation, income distribution and the crisis. Investigación Económica, 71 (279), 39-70.
Stockhammer, E. (2015). Rising inequality as a root cause of the present crisis. Cambridge Journal of Economics, 39, 935–958.
Stockhammer, E. (2017). Wage-led versus profit-led demand: What have we learned? A Kaleckian-Minskyan view. Review of Keynesian Economics, 5, 25-42.
Summers, L.A. (2014). U.S. economic prospects: secular stagnation, hysteresis, and the zero lower bound. Business Economics, 49(2), 65-73.
Summers, L.A. (2015). Demand side secular stagnation. American Economic Review: Papers and Proceedings, 105(5), 60-65.
Taylor, L. (1991). Income Distribution, Inflation, and Growth. Lectures on Structuralist Macroeconomic Theory. Cambridge, MA, London: MIT Press.
Teulings, C., & Baldwin, R. (Eds.) (2014a). Secular Stagnation: Facts, Causes and Cures (VoxEU.org eBook). London: Centre for Economic Policy Research (CEPR).
Teulings, C., & Baldwin, R. (2014b). Introduction. In: C. Teulings, & R. Baldwin (Eds.), Secular Stagnation: Facts, Causes and Cures (VoxEU.org eBook). London: Centre for Economic Policy Research (CEPR).
Tori, D., & Onaran, Ö. (2016). The effects of financialisation on investment: Evidence from firm-level data for the UK (Post Keynesian Economics Study Group Working Paper 1601).
Tori, D., & Onaran, Ö. (2017). The effects of financialisation and financial development on investment: Evidence from firm-level data for Europe (Greenwich Papers in Political Economy 16089). Greenwich: University of Greenwich, Greenwich Political Economy Research Centre.

43
UNCTAD (2009). The Global Economic Crisis. Systemic Failures and Multilateral Remedies. New York, Geneva: UNCTAD.
Van Treeck, T. (2008). Reconsidering the investment-profit nexus in finance-led economies: an ARDL-based approach. Metroeconomica, 59, 371-404.
Van Treeck, T. (2009). The political economy debate on “financialisation” - a macroeconomic perspective. Review of International Political Economy, 16, 907-944.
Van Treeck, T. (2014). Did inequality cause the US financial crisis?. Journal of Economic Surveys, 28, 421-448.
Van Treeck, T. (2015). Inequality, the crisis, and stagnation. European Journal of Economics and Economic Policies: Intervention, 12(2), 158-169.
Van Treeck, T., & Sturn, S. (2012). Income inequality as a cause of the Great Recession? A survey of current debates (Conditions of Work and Employment Series No. 39). Geneva: ILO.

Imprint Editors: Sigrid Betzelt Eckhard Hein Martina Metzger Jennifer Pedussel Wu Martina Sproll Christina Teipen Achim Truger Markus Wissen Reingard Zimmer ISSN 1869-6406 Printed by HWR Berlin Berlin February 2018