Embed Size (px)
Citation preview
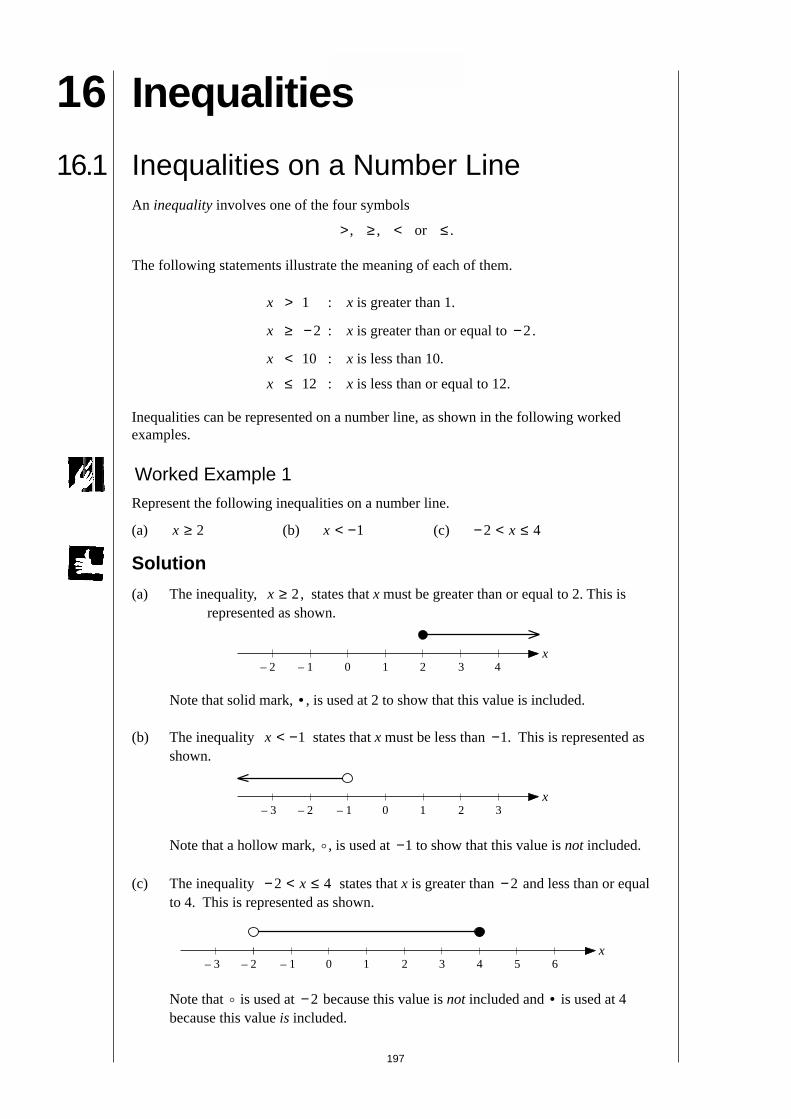
197
MEP Pupil Text 16
16 Inequalities
16.1 Inequalities on a Number LineAn inequality involves one of the four symbols
> , ≥ , < or ≤ .
The following statements illustrate the meaning of each of them.
x > 1 : x is greater than 1.
x ≥ −2 : x is greater than or equal to −2.
x < 10 : x is less than 10.
x ≤ 12 : x is less than or equal to 12.
Inequalities can be represented on a number line, as shown in the following workedexamples.
Worked Example 1
Represent the following inequalities on a number line.
(a) x ≥ 2 (b) x < −1 (c) − < ≤2 4x
Solution
(a) The inequality, x ≥ 2, states that x must be greater than or equal to 2. This isrepresented as shown.
– 2 – 1 0 1 2 3 4x
Note that solid mark, • , is used at 2 to show that this value is included.
(b) The inequality x < −1 states that x must be less than −1. This is represented asshown.
– 3 – 2 – 1 0 1 2 3x
Note that a hollow mark, o , is used at −1 to show that this value is not included.
(c) The inequality − < ≤2 4x states that x is greater than −2 and less than or equalto 4. This is represented as shown.
– 3 – 2 – 1 0 1 2 3x
4 5 6
Note that o is used at −2 because this value is not included and • is used at 4because this value is included.
198
MEP Pupil Text 16
Worked Example 2
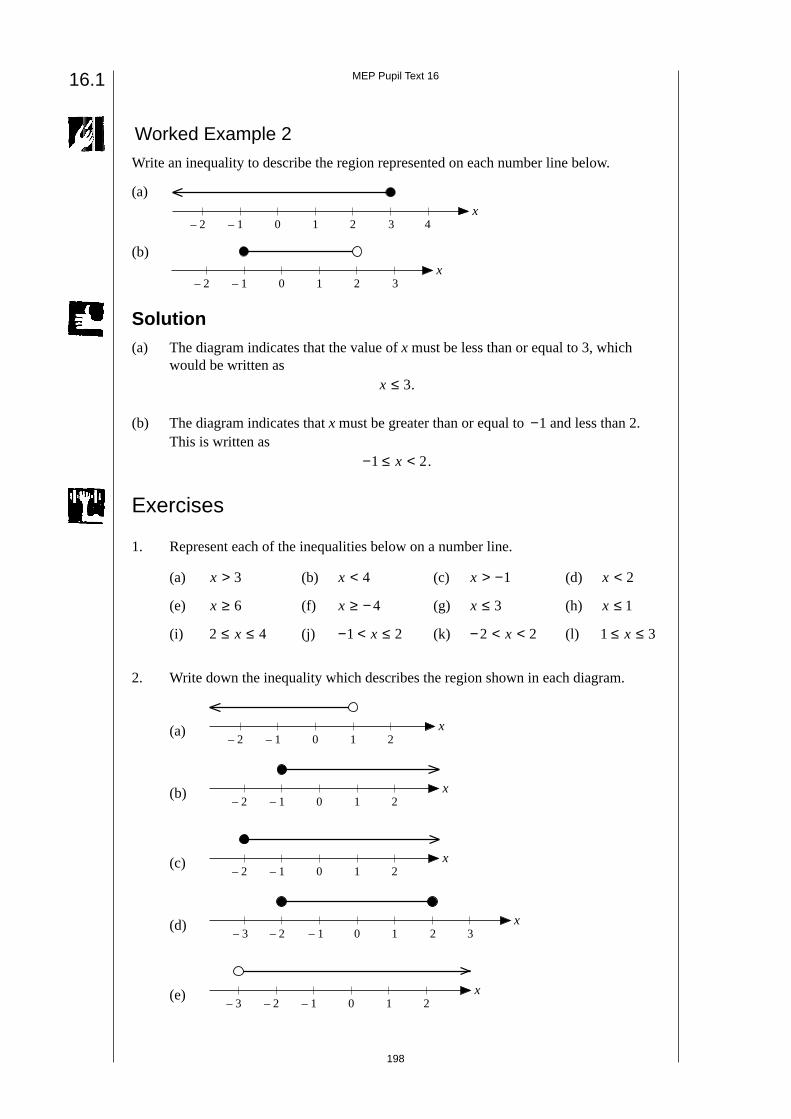
Write an inequality to describe the region represented on each number line below.
(a)
(b)
Solution(a) The diagram indicates that the value of x must be less than or equal to 3, which
would be written asx ≤ 3.
(b) The diagram indicates that x must be greater than or equal to −1 and less than 2.This is written as
− ≤ <1 2x .
Exercises
1. Represent each of the inequalities below on a number line.
(a) x > 3 (b) x < 4 (c) x > −1 (d) x < 2
(e) x ≥ 6 (f) x ≥ −4 (g) x ≤ 3 (h) x ≤ 1
(i) 2 4≤ ≤x (j) − < ≤1 2x (k) − < <2 2x (l) 1 3≤ ≤x
2. Write down the inequality which describes the region shown in each diagram.
(a)– 2 – 1 0 1 2
x
(b)– 2 – 1 0 1 2
x
(c)– 2 – 1 0 1 2
x
(d)– 3 – 2 – 1 0 1 2 3
x
(e)– 2 – 1 0 1 2
x– 3
– 2 – 1 0 1 2 3 4x
– 2 – 1 0 1 2 3x
16.1
199
MEP Pupil Text 16
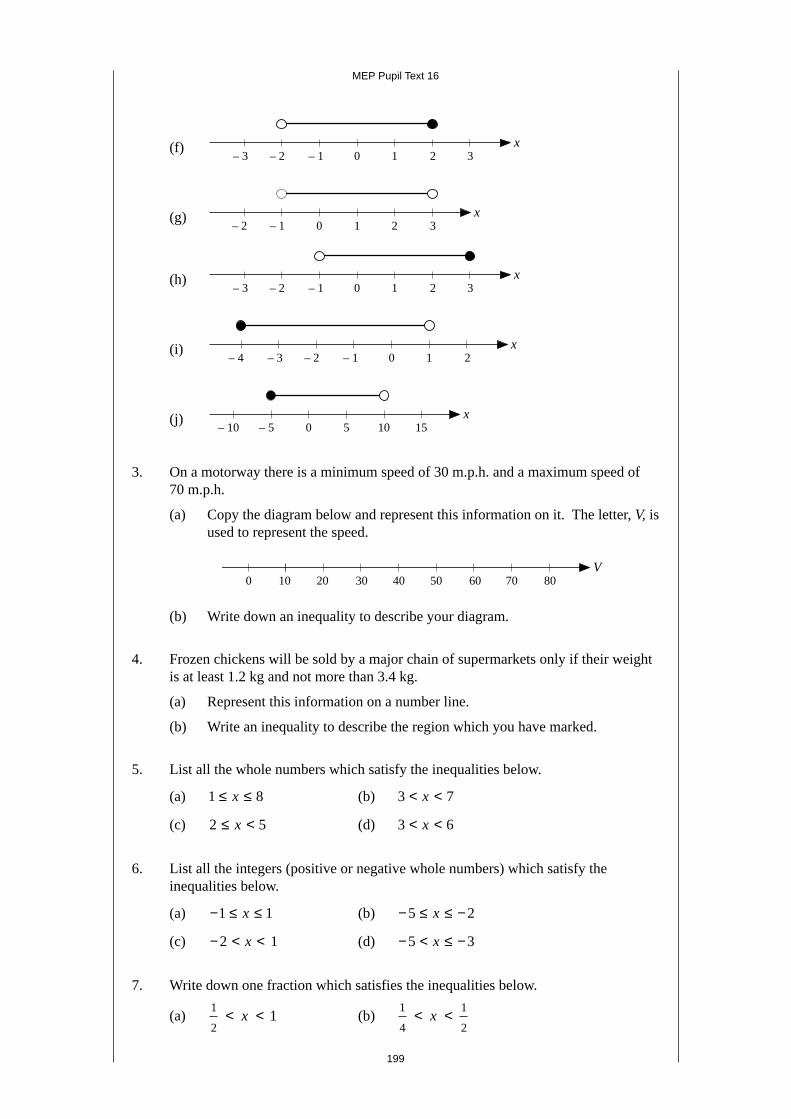
(f)– 3 – 2 – 1 0 1 2 3
x
(g)– 2 – 1 0 1 2 3
x
(h)– 3 – 2 – 1 0 1 2 3
x
(i)– 3 – 2 – 1 0 1 2
x– 4
(j)– 10 – 5 0 5 10 15
x
3. On a motorway there is a minimum speed of 30 m.p.h. and a maximum speed of70 m.p.h.
(a) Copy the diagram below and represent this information on it. The letter, V, isused to represent the speed.
0 10 20 30 40 50 60V
70 80
(b) Write down an inequality to describe your diagram.
4. Frozen chickens will be sold by a major chain of supermarkets only if their weightis at least 1.2 kg and not more than 3.4 kg.
(a) Represent this information on a number line.
(b) Write an inequality to describe the region which you have marked.
5. List all the whole numbers which satisfy the inequalities below.
(a) 1 8≤ ≤x (b) 3 7< <x
(c) 2 5≤ <x (d) 3 6< <x
6. List all the integers (positive or negative whole numbers) which satisfy theinequalities below.
(a) − ≤ ≤1 1x (b) − ≤ ≤ −5 2x
(c) − < <2 1x (d) − < ≤ −5 3x
7. Write down one fraction which satisfies the inequalities below.
(a)1
21< <x (b)
1
4
1
2< <x
200
MEP Pupil Text 16
(c)1
3
1
2< <x (d) 0
1
3< <x
8. List all the possible integer values of n such that
− ≤ <3 2n .(LON)
16.2 Solution of Linear InequalitiesInequalities such as 6 7 5x − ≤ can be simplified before solving them. The process issimilar to that used to solve equations, except that there should be no multiplication ordivision by negative numbers.
Worked Example 1
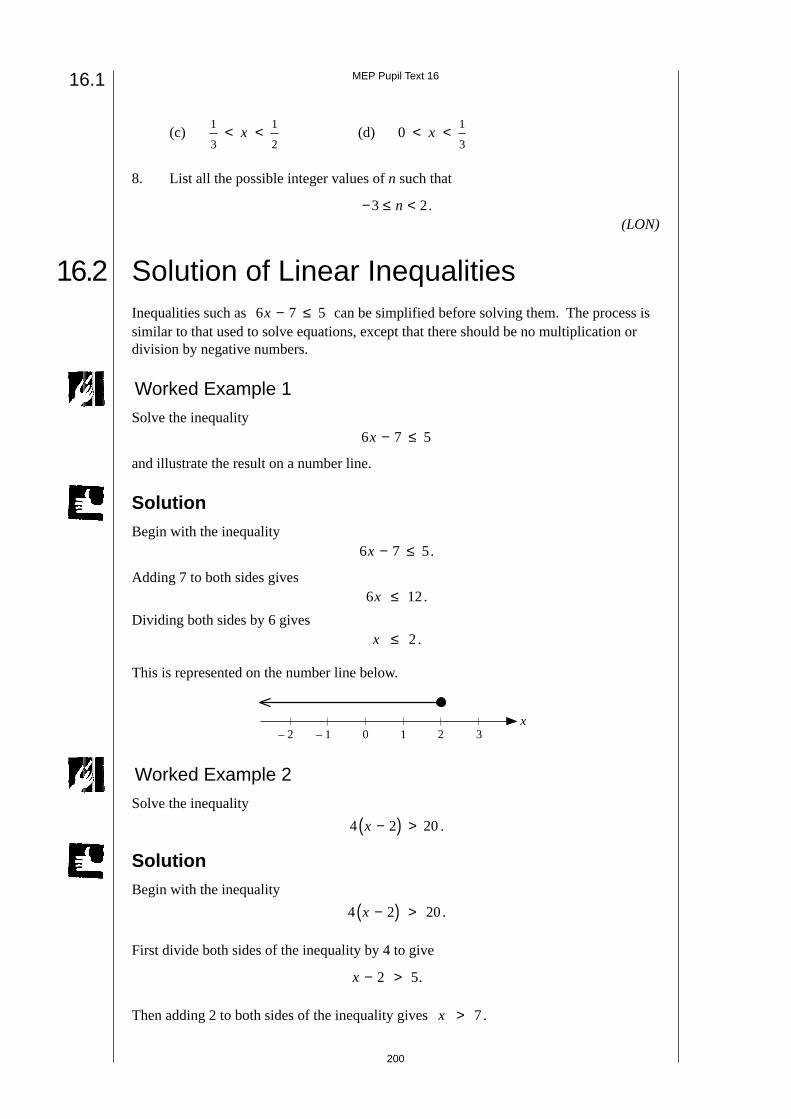
Solve the inequality6 7 5x − ≤
and illustrate the result on a number line.
SolutionBegin with the inequality
6 7 5x − ≤ .
Adding 7 to both sides gives6 12x ≤ .
Dividing both sides by 6 givesx ≤ 2 .
This is represented on the number line below.
– 2 – 1 0 1 2 3x
Worked Example 2
Solve the inequality
4 2 20x −( ) > .
SolutionBegin with the inequality
4 2 20x −( ) > .
First divide both sides of the inequality by 4 to give
x − >2 5.
Then adding 2 to both sides of the inequality gives x > 7.
16.1
201
MEP Pupil Text 16
Worked Example 3
Solve the inequality5 6 19− ≥ −x .
SolutionBegin with the inequality
5 6 19− ≥ −x .
In this case, note that the inequality contains a ' −6 x ' term. The first step here is to add 6xto both sides, giving
5 19 6≥ − + x .
Now 19 can be added to both sides to give
24 6≥ x .
Then dividing both sides by 6 gives4 ≥ x
or x ≤ 4.
Worked Example 4
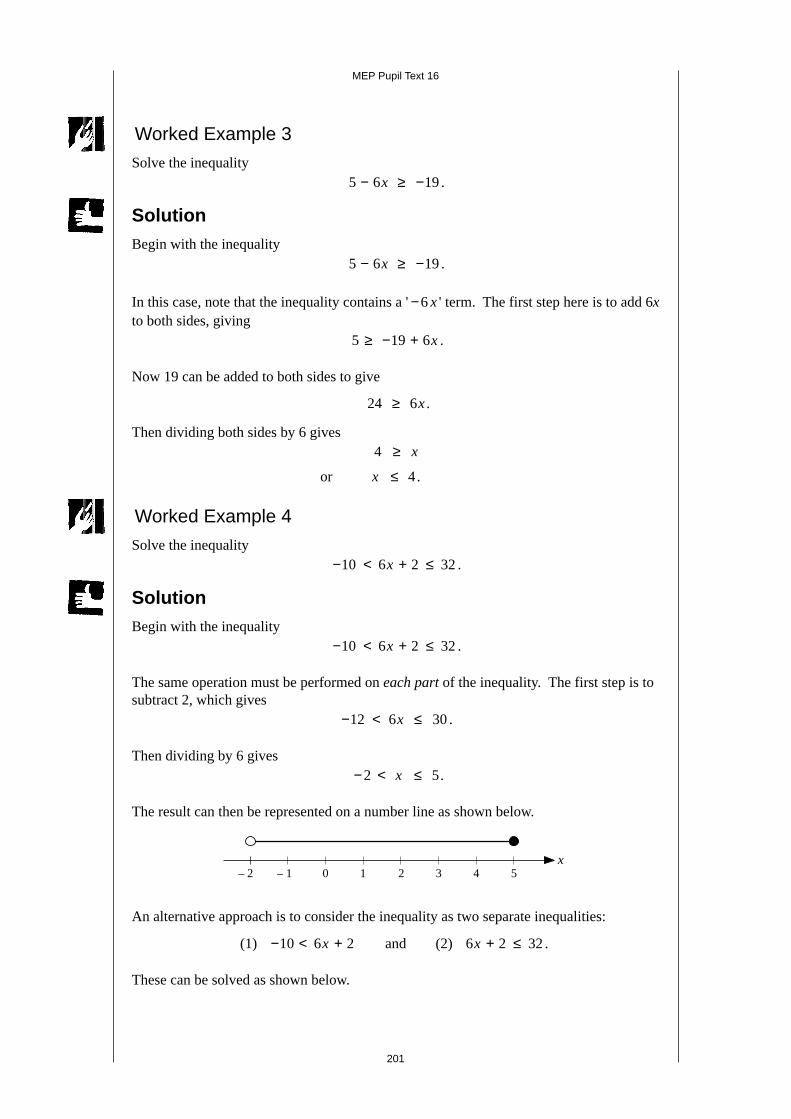
Solve the inequality− < + ≤10 6 2 32x .
SolutionBegin with the inequality
− < + ≤10 6 2 32x .
The same operation must be performed on each part of the inequality. The first step is tosubtract 2, which gives
− < ≤12 6 30x .
Then dividing by 6 gives − < ≤2 5x .
The result can then be represented on a number line as shown below.
– 2 – 1 0 1 2 3x
4 5
An alternative approach is to consider the inequality as two separate inequalities:
(1) − < +10 6 2x and (2) 6 2 32x + ≤ .
These can be solved as shown below.
202
MEP Pupil Text 16
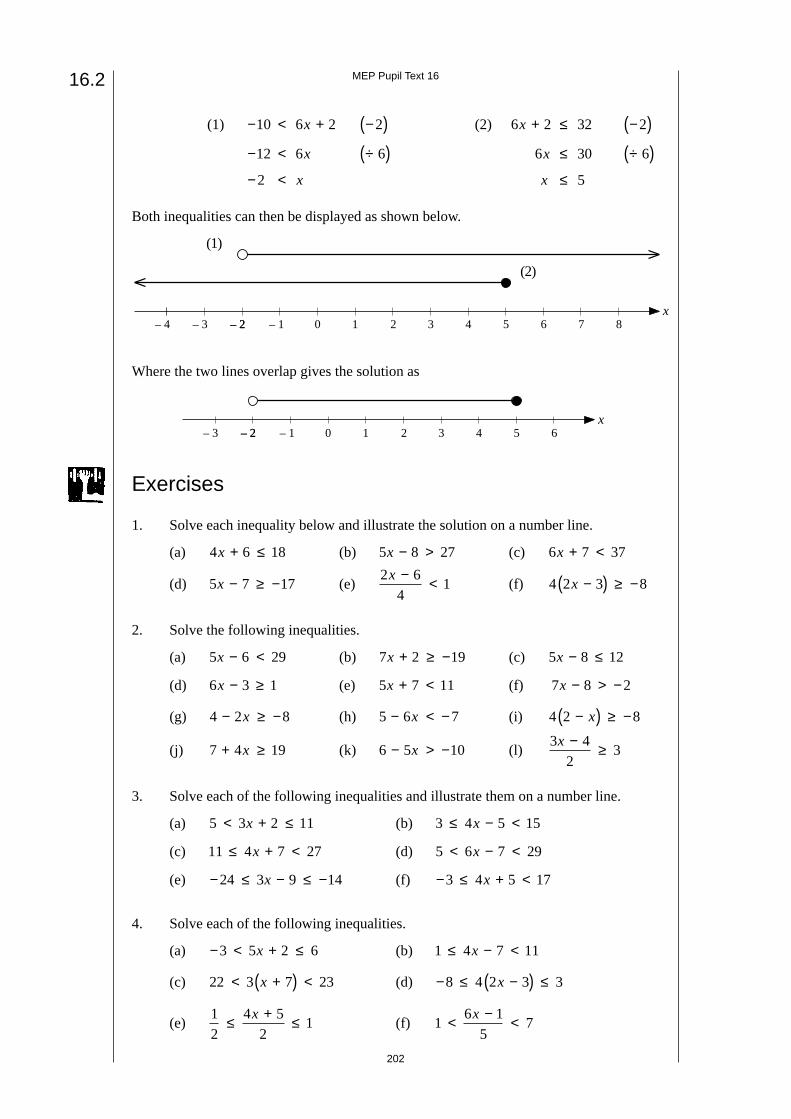
(1) − < +10 6 2x −( )2 (2) 6 2 32x + ≤ −( )2
− <12 6x ÷( )6 6 30x ≤ ÷( )6
− <2 x x ≤ 5
Both inequalities can then be displayed as shown below.
– 2 – 1 0 1 2 3x
4 5– 2– 3– 4 6 7 8
Where the two lines overlap gives the solution as
– 2 – 1 0 1 2 3x
4 5– 2– 3 6
Exercises
1. Solve each inequality below and illustrate the solution on a number line.
(a) 4 6 18x + ≤ (b) 5 8 27x − > (c) 6 7 37x + <
(d) 5 7 17x − ≥ − (e)2 6
41
x − < (f) 4 2 3 8x −( ) ≥ −
2. Solve the following inequalities.
(a) 5 6 29x − < (b) 7 2 19x + ≥ − (c) 5 8 12x − ≤
(d) 6 3 1x − ≥ (e) 5 7 11x + < (f) 7 8 2x − > −
(g) 4 2 8− ≥ −x (h) 5 6 7− < −x (i) 4 2 8−( ) ≥ −x
(j) 7 4 19+ ≥x (k) 6 5 10− > −x (l)3 4
23
x − ≥
3. Solve each of the following inequalities and illustrate them on a number line.
(a) 5 3 2 11< + ≤x (b) 3 4 5 15≤ − <x
(c) 11 4 7 27≤ + <x (d) 5 6 7 29< − <x
(e) − ≤ − ≤ −24 3 9 14x (f) − ≤ + <3 4 5 17x
4. Solve each of the following inequalities.
(a) − < + ≤3 5 2 6x (b) 1 4 7 11≤ − <x
(c) 22 3 7 23< +( ) <x (d) − ≤ −( ) ≤8 4 2 3 3x
(e)12
4 52
1≤ + ≤x(f) 1
6 15
7< − <x
(1)
(2)
16.2
203
MEP Pupil Text 16
5. Chris runs a barber's shop. It costs him £20 per day to cover his expenses and hecharges £4 for every hair cut.
(a) Explain why his profit for any day is £ ( 4 20x − ), where x is the number ofhaircuts in that day.
He hopes to make at least £50 profit per day, but does not intend to make more than£120 profit.
(b) Write down an inequality to describe this situation.
(c) Solve the inequality.
6. The distance that a car can travel on a full tank of petrol varies between 200 and320 miles.
(a) If m represents the distance (in miles) travelled on a full tank of petrol, writedown an inequality involving m.
(b) Distances in kilometres, k, are related to distances in miles by
mk= 5
8.
Write down an alternative inequality involving k instead of m.
(c) How many kilometres can the car travel on a full tank of petrol?
7. A man finds that his electricity bill varies between £50 and £90.
(a) If C represents the size of his bill, write down an inequality involving C.
The bill is made up of a standing charge of £10 and a cost of 10p per kilowatt hourof electricity.
(b) If n is the number of kilowatt hours used, write down a formula for C interms of n.
(c) Using your formula, write down an inequality involving n and solve thisinequality.
8. In an office, the temperature, F (in degrees Fahrenheit), must satisfy the inequality
60 70≤ ≤F .
The temperature, F, is related to the temperature, C (in degrees Centigrade), by
F C= +3295
.
Write down an inequality which involves C and solve this inequality.
9. (a) List all the integers which satisfy
− < ≤2 3n .
(b) Ajaz said, "I thought of an integer, multiplied it by 3 then subtracted 2.The answer was between 47 and 62."
List the integers that Ajaz could have used.
204
MEP Pupil Text 16
(MEG)10. (a) x is a whole number such that
− ≤ <4 2x .
(i) Make a list of all the possible values of x.
(ii) What is the largest possible value of x2 ?
(b) Every week Rucci has a test in Mathematics. It is marked out of 20.Rucci has always scored at least half the marks available. She has neverquite managed to score full marks.
Using x to represent Rucci's marks, write this information in the form of twoinequalities.
(NEAB)
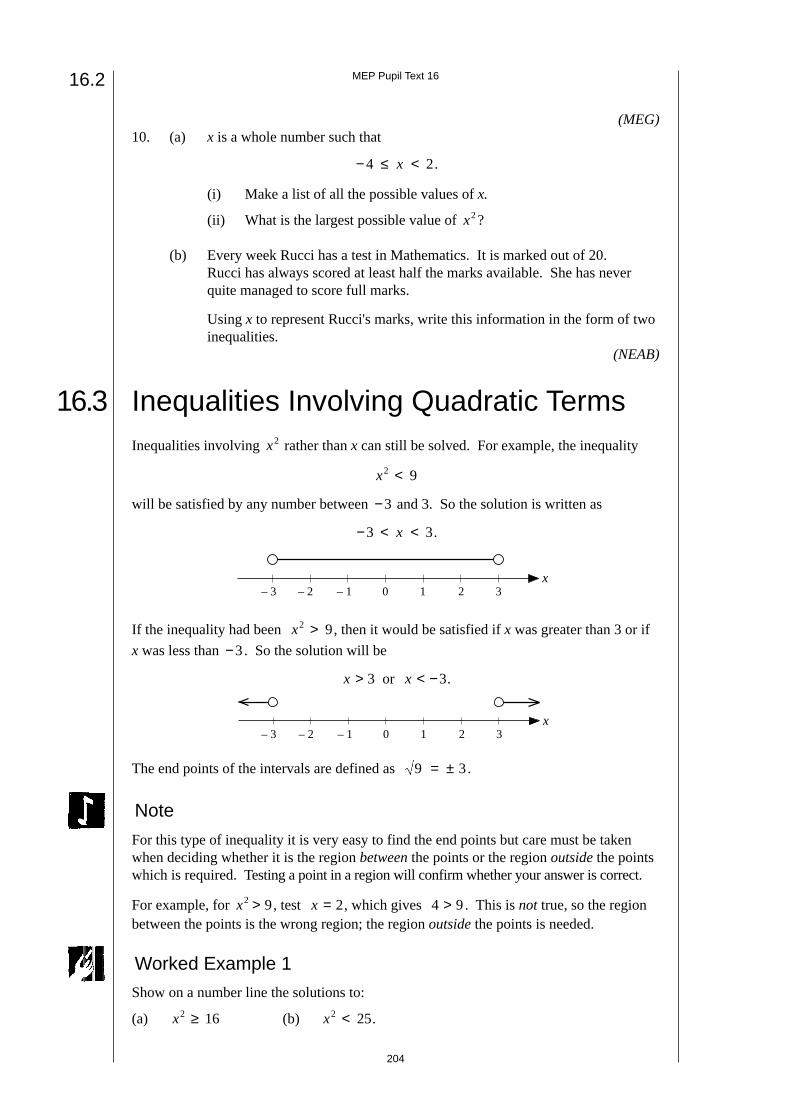
16.3 Inequalities Involving Quadratic TermsInequalities involving x2 rather than x can still be solved. For example, the inequality
x2 9<
will be satisfied by any number between −3 and 3. So the solution is written as
− < <3 3x .
– 3 – 2 – 1 0 1 2 3x
If the inequality had been x2 9> , then it would be satisfied if x was greater than 3 or if
x was less than −3. So the solution will be
x > 3 or x < −3.
– 3 – 2 – 1 0 1 2 3x
The end points of the intervals are defined as 9 3= ± .
Note
For this type of inequality it is very easy to find the end points but care must be takenwhen deciding whether it is the region between the points or the region outside the pointswhich is required. Testing a point in a region will confirm whether your answer is correct.
For example, for x2 9> , test x = 2, which gives 4 9> . This is not true, so the regionbetween the points is the wrong region; the region outside the points is needed.
Worked Example 1
Show on a number line the solutions to:
(a) x2 16≥ (b) x2 25< .
16.2
205
MEP Pupil Text 16
Solution
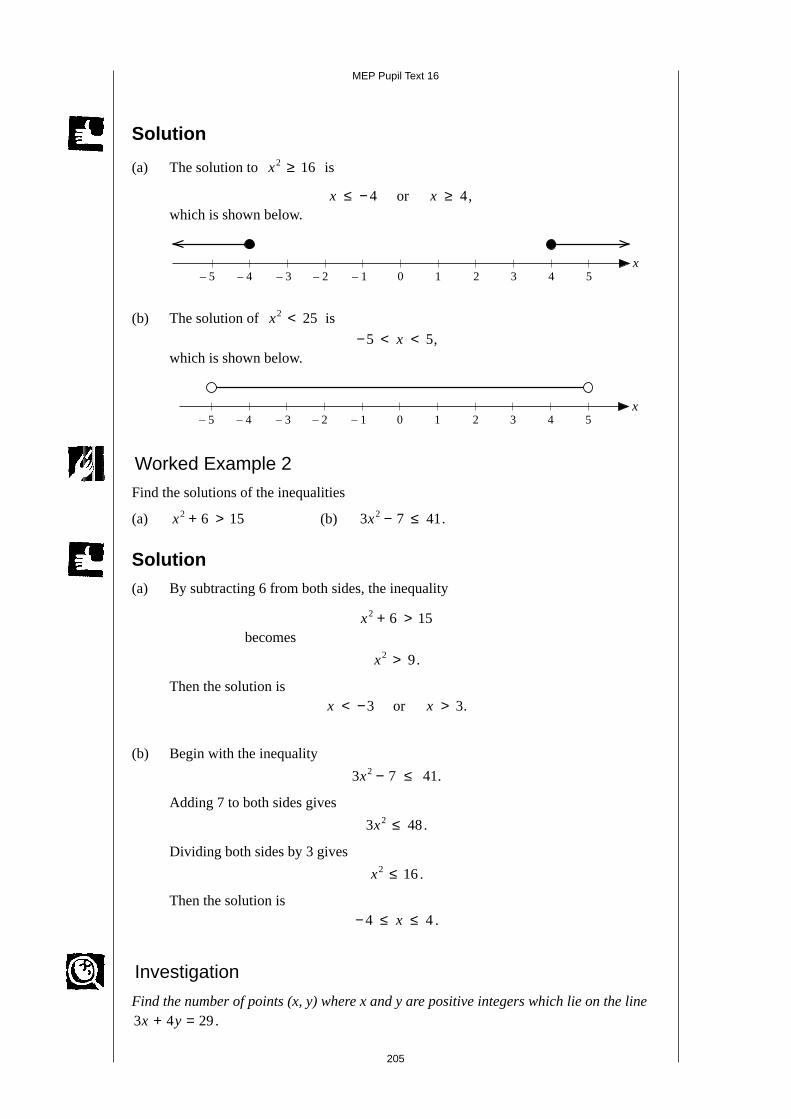
(a) The solution to x2 16≥ is
x ≤ −4 or x ≥ 4,which is shown below.
– 3 – 2 – 1 0 1 2 3x
– 4– 5 4 5
(b) The solution of x2 25< is
− < <5 5x ,which is shown below.
– 3 – 2 – 1 0 1 2 3
x– 4– 5 4 5
Worked Example 2
Find the solutions of the inequalities
(a) x2 6 15+ > (b) 3 7 412x − ≤ .
Solution(a) By subtracting 6 from both sides, the inequality
x2 6 15+ >becomes
x2 9> .
Then the solution isx < −3 or x > 3.
(b) Begin with the inequality
3 7 412x − ≤ .
Adding 7 to both sides gives
3 482x ≤ .
Dividing both sides by 3 gives
x2 16≤ .
Then the solution is− ≤ ≤4 4x .
Investigation
Find the number of points (x, y) where x and y are positive integers which lie on the line3 4 29x y+ = .
206
MEP Pupil Text 16
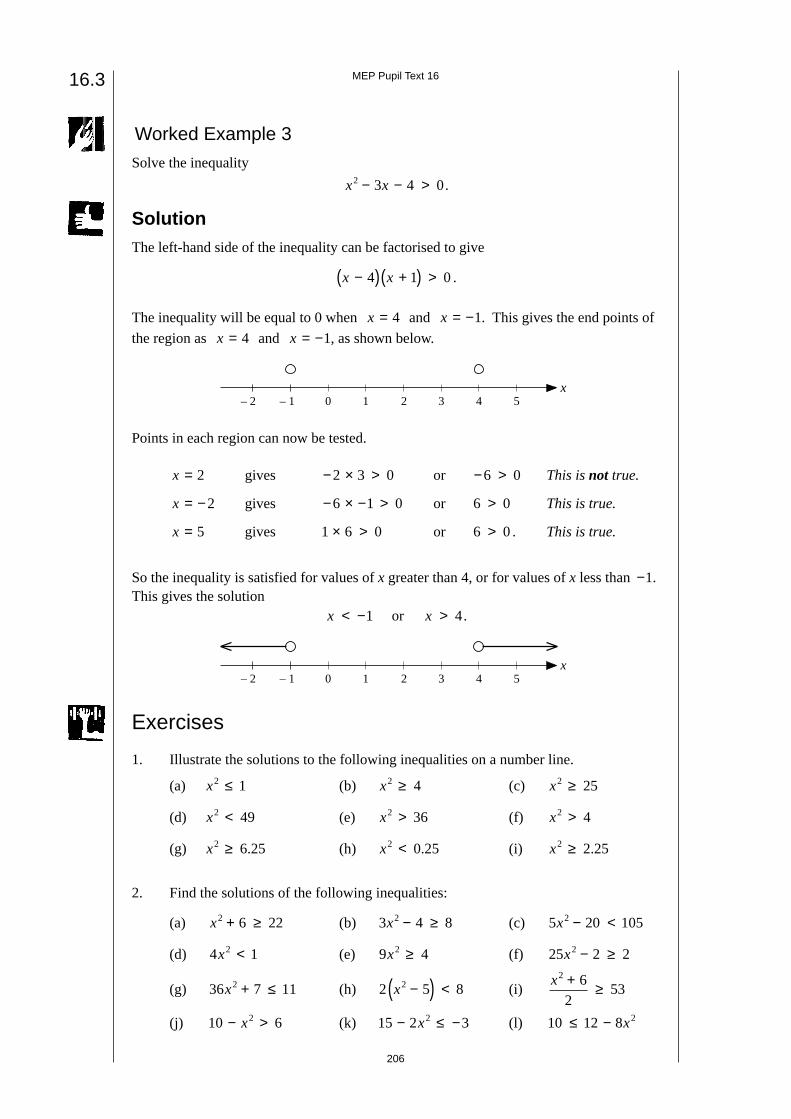
Worked Example 3
Solve the inequality
x x2 3 4 0− − > .
SolutionThe left-hand side of the inequality can be factorised to give
x x−( ) +( ) >4 1 0 .
The inequality will be equal to 0 when x = 4 and x = −1. This gives the end points of
the region as x = 4 and x = −1, as shown below.
– 2 – 1 0 1 2 3x
4 5
Points in each region can now be tested.
x = 2 gives − × >2 3 0 or − >6 0 This is not true.
x = −2 gives − × − >6 1 0 or 6 0> This is true.
x = 5 gives 1 6 0× > or 6 0> . This is true.
So the inequality is satisfied for values of x greater than 4, or for values of x less than −1.This gives the solution
x < −1 or x > 4.
– 2 – 1 0 1 2 3x
4 5
Exercises
1. Illustrate the solutions to the following inequalities on a number line.
(a) x2 1≤ (b) x2 4≥ (c) x2 25≥
(d) x2 49< (e) x2 36> (f) x2 4>
(g) x2 6 25≥ . (h) x2 0 25< . (i) x2 2 25≥ .
2. Find the solutions of the following inequalities:
(a) x2 6 22+ ≥ (b) 3 4 82x − ≥ (c) 5 20 1052x − <
(d) 4 12x < (e) 9 42x ≥ (f) 25 2 22x − ≥
(g) 36 7 112x + ≤ (h) 2 5 82x −( ) < (i)x2 6
253
+ ≥
(j) 10 62− >x (k) 15 2 32− ≤ −x (l) 10 12 8 2≤ − x
16.3
207
MEP Pupil Text 16
3. Find the solutions of the following inequalities.
(a) x x−( ) +( ) ≥2 3 0 (b) x x−( ) −( ) ≤5 2 0
(c) x x −( ) >5 0 (d) x x2 6 0− ≤
(e) x x2 7 10 0− + < (f) x x2 12 0+ − >
(g) 2 1 02x x− − ≥ (h) 2 6 02x x+ − ≤
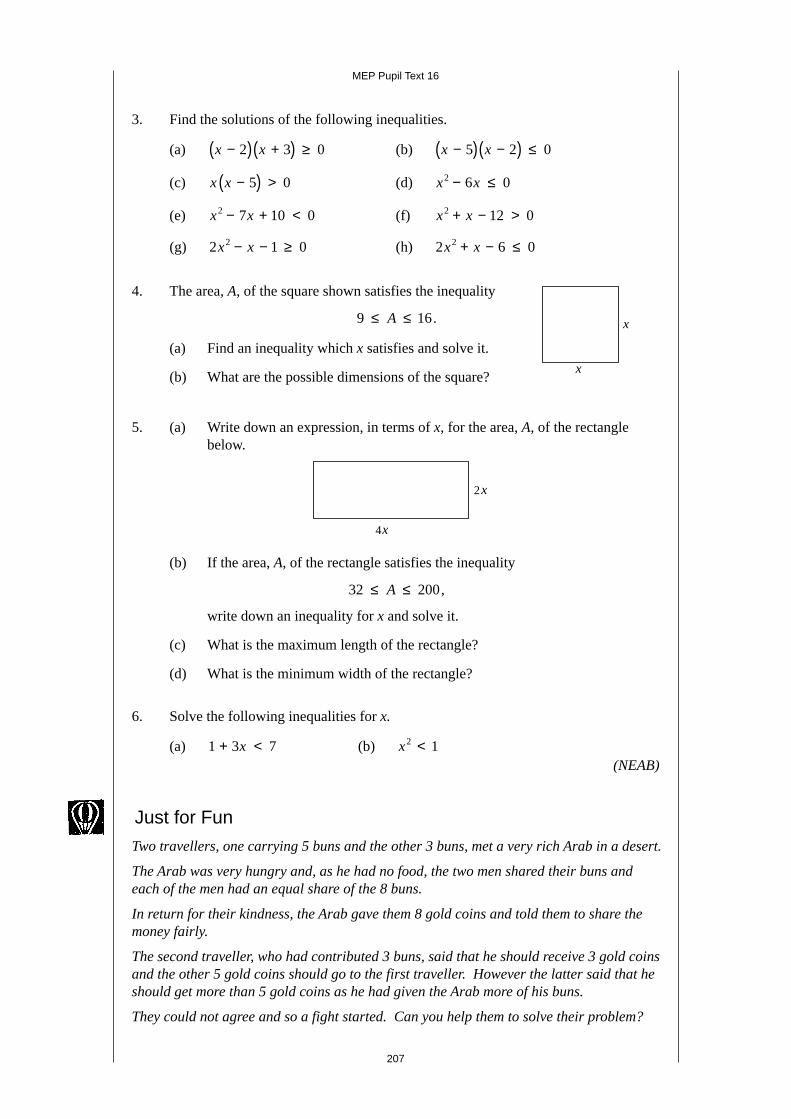
4. The area, A, of the square shown satisfies the inequality
9 16≤ ≤A .
(a) Find an inequality which x satisfies and solve it.
(b) What are the possible dimensions of the square?
5. (a) Write down an expression, in terms of x, for the area, A, of the rectanglebelow.
(b) If the area, A, of the rectangle satisfies the inequality
32 200≤ ≤A ,
write down an inequality for x and solve it.
(c) What is the maximum length of the rectangle?
(d) What is the minimum width of the rectangle?
6. Solve the following inequalities for x.
(a) 1 3 7+ <x (b) x2 1<(NEAB)
x
x
x4
x2
Just for Fun
Two travellers, one carrying 5 buns and the other 3 buns, met a very rich Arab in a desert.
The Arab was very hungry and, as he had no food, the two men shared their buns andeach of the men had an equal share of the 8 buns.
In return for their kindness, the Arab gave them 8 gold coins and told them to share themoney fairly.
The second traveller, who had contributed 3 buns, said that he should receive 3 gold coinsand the other 5 gold coins should go to the first traveller. However the latter said that heshould get more than 5 gold coins as he had given the Arab more of his buns.
They could not agree and so a fight started. Can you help them to solve their problem?
208
MEP Pupil Text 16
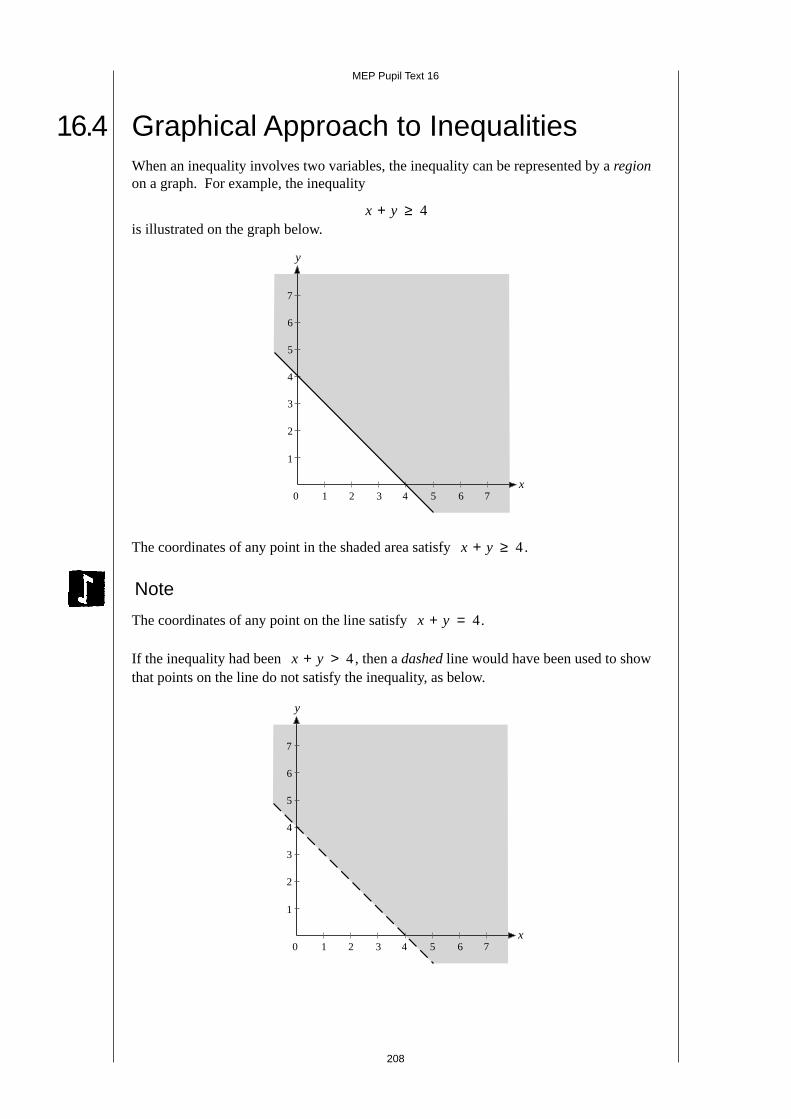
16.4 Graphical Approach to InequalitiesWhen an inequality involves two variables, the inequality can be represented by a regionon a graph. For example, the inequality
x y+ ≥ 4is illustrated on the graph below.
The coordinates of any point in the shaded area satisfy x y+ ≥ 4.
Note
The coordinates of any point on the line satisfy x y+ = 4.
If the inequality had been x y+ > 4, then a dashed line would have been used to showthat points on the line do not satisfy the inequality, as below.
1 2 3 4 5 6 7x
0
y
7
6
5
4
3
2
1
1 2 3 4 5 6 7x
0
y
7
6
5
4
3
2
1
209
MEP Pupil Text 16
1 2 3 4 5x
0
y
5
4
3
2
1
– 1
– 2
– 3
– 4
– 5
– 6
– 7
– 2 – 1
(3, 2)
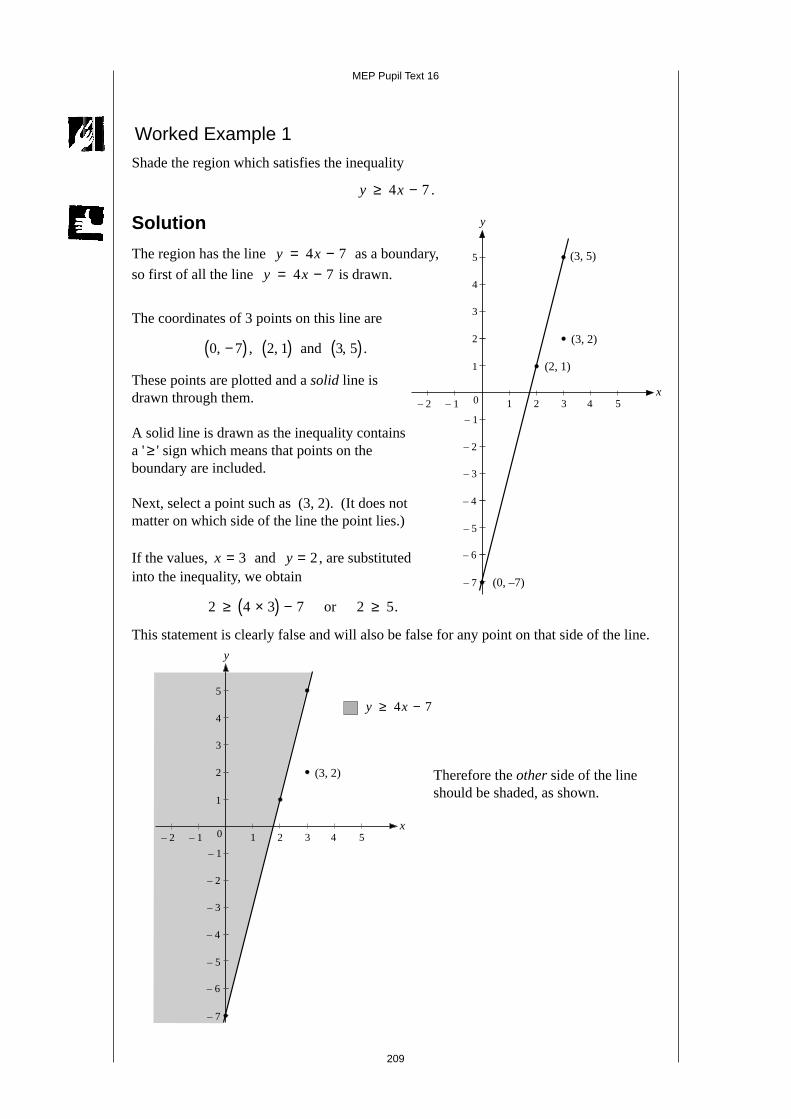
Worked Example 1
Shade the region which satisfies the inequality
y x≥ −4 7 .
Solution
The region has the line y x= −4 7 as a boundary,
so first of all the line y x= −4 7 is drawn.
The coordinates of 3 points on this line are
0 7, −( ) , 2 1,( ) and 3 5,( ) .
These points are plotted and a solid line isdrawn through them.
A solid line is drawn as the inequality containsa ' ≥ ' sign which means that points on theboundary are included.
Next, select a point such as (3, 2). (It does notmatter on which side of the line the point lies.)
If the values, x = 3 and y = 2, are substitutedinto the inequality, we obtain
2 4 3 7≥ ×( ) − or 2 5≥ .
This statement is clearly false and will also be false for any point on that side of the line.
Therefore the other side of the lineshould be shaded, as shown.
1 2 3 4 5x
0
y
5
4
3
2
1
– 1
– 2
– 3
– 4
– 5
– 6
– 7
– 2 – 1
(3, 2)
(3, 5)
(2, 1)
(0, –7)
y x≥ −4 7
210
MEP Pupil Text 16
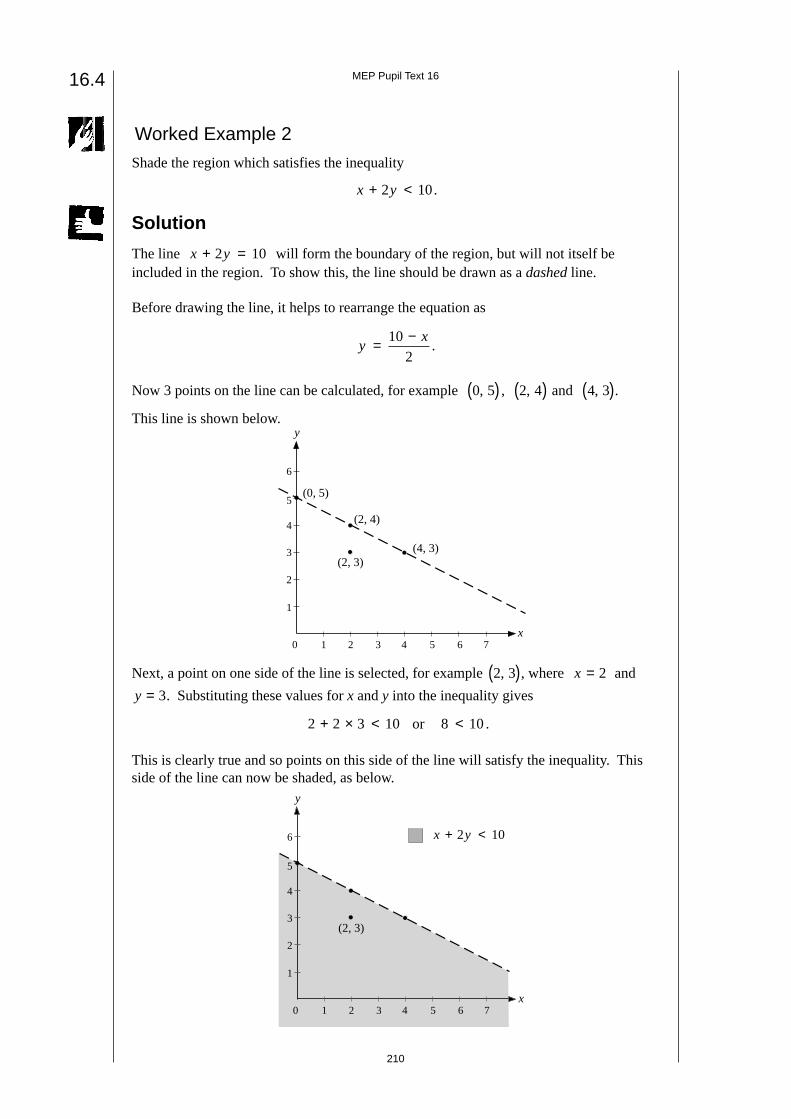
Worked Example 2
Shade the region which satisfies the inequality
x y+ <2 10.
Solution
The line x y+ =2 10 will form the boundary of the region, but will not itself beincluded in the region. To show this, the line should be drawn as a dashed line.
Before drawing the line, it helps to rearrange the equation as
yx= −10
2.
Now 3 points on the line can be calculated, for example 0 5,( ) , 2 4,( ) and 4 3,( ).This line is shown below.
Next, a point on one side of the line is selected, for example 2 3,( ), where x = 2 and
y = 3. Substituting these values for x and y into the inequality gives
2 2 3 10+ × < or 8 10< .
This is clearly true and so points on this side of the line will satisfy the inequality. Thisside of the line can now be shaded, as below.
1 2 3 4 5 6 7x
0
y
6
5
4
3
2
1
(2, 3)
x y+ <2 10
(4, 3)
(2, 4)
(0, 5)
16.4
1 2 3 4 5 6 7x
0
y
6
5
4
3
2
1
(2, 3)
211
MEP Pupil Text 16
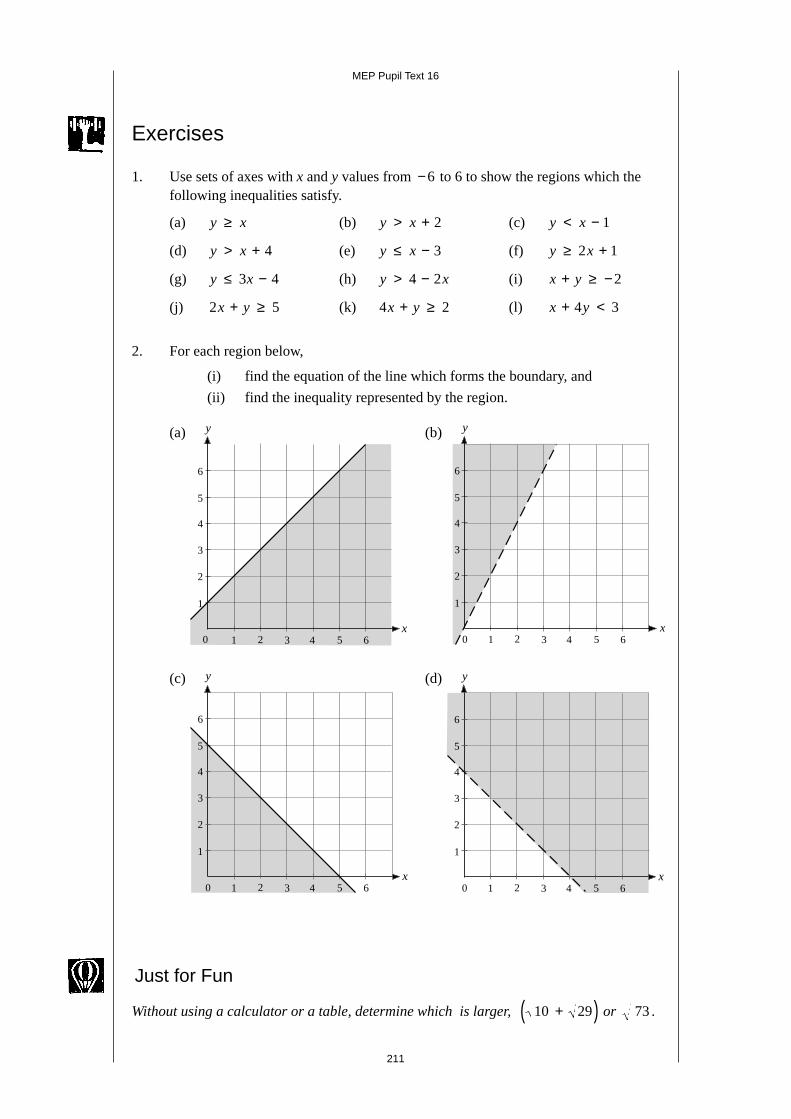
Exercises
1. Use sets of axes with x and y values from −6 to 6 to show the regions which thefollowing inequalities satisfy.
(a) y x≥ (b) y x> + 2 (c) y x< − 1
(d) y x> + 4 (e) y x≤ − 3 (f) y x≥ +2 1
(g) y x≤ −3 4 (h) y x> −4 2 (i) x y+ ≥ −2
(j) 2 5x y+ ≥ (k) 4 2x y+ ≥ (l) x y+ <4 3
2. For each region below,
(i) find the equation of the line which forms the boundary, and
(ii) find the inequality represented by the region.
(a) (b)
(c) (d)
Just for Fun
Without using a calculator or a table, determine which is larger, 10 29+( ) or 73 .
1 2 3 4 5x
0
y
6
5
4
3
2
1
6 1 2 3 4 5x
0
y
6
5
4
3
2
1
6
1 2 3 4 5x
0
y
6
5
4
3
2
1
61 2 3 4 5x
0
y
6
5
4
3
2
1
6
212
MEP Pupil Text 16
(e) (f)
3. (a) On the same set of axes, shade the regions which satisfy the inequalities
x y+ ≥ 3 and x y+ ≤ 5.
Which inequality is satisfied by the region shaded twice?
(b) Shade the region which satisfies the inequality 2 4≤ − ≤x y .
4. (a) Draw the graph of y x= 2 and shade the region which satisfies the
inequality y x≤ 2 .
(b) On the same set of axes, draw the graphs of
y x= +2 1 and y x= −2 1.
Shade the region which satisfies the inequality, x y x2 21 1− < < + .
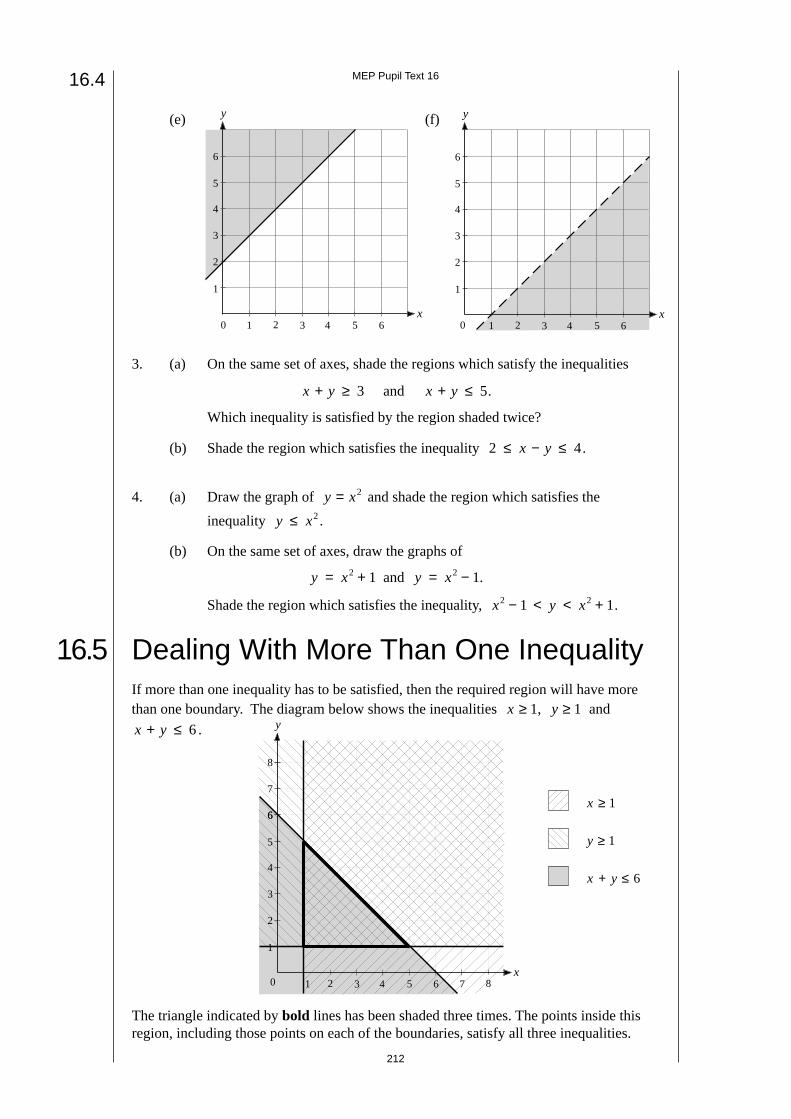
16.5 Dealing With More Than One InequalityIf more than one inequality has to be satisfied, then the required region will have morethan one boundary. The diagram below shows the inequalities x ≥ 1, y ≥ 1 and
x y+ ≤ 6 .
The triangle indicated by bold lines has been shaded three times. The points inside thisregion, including those points on each of the boundaries, satisfy all three inequalities.
x ≥ 1
y ≥ 1
x y+ ≤ 6
16.4
x
y
6
8
7
6
5
4
3
2
1
0 87654321
1 2 3 4 5x
0
y
6
5
4
3
2
1
6 1 2 3 4 5x
0
y
6
5
4
3
2
1
6
213
MEP Pupil Text 16
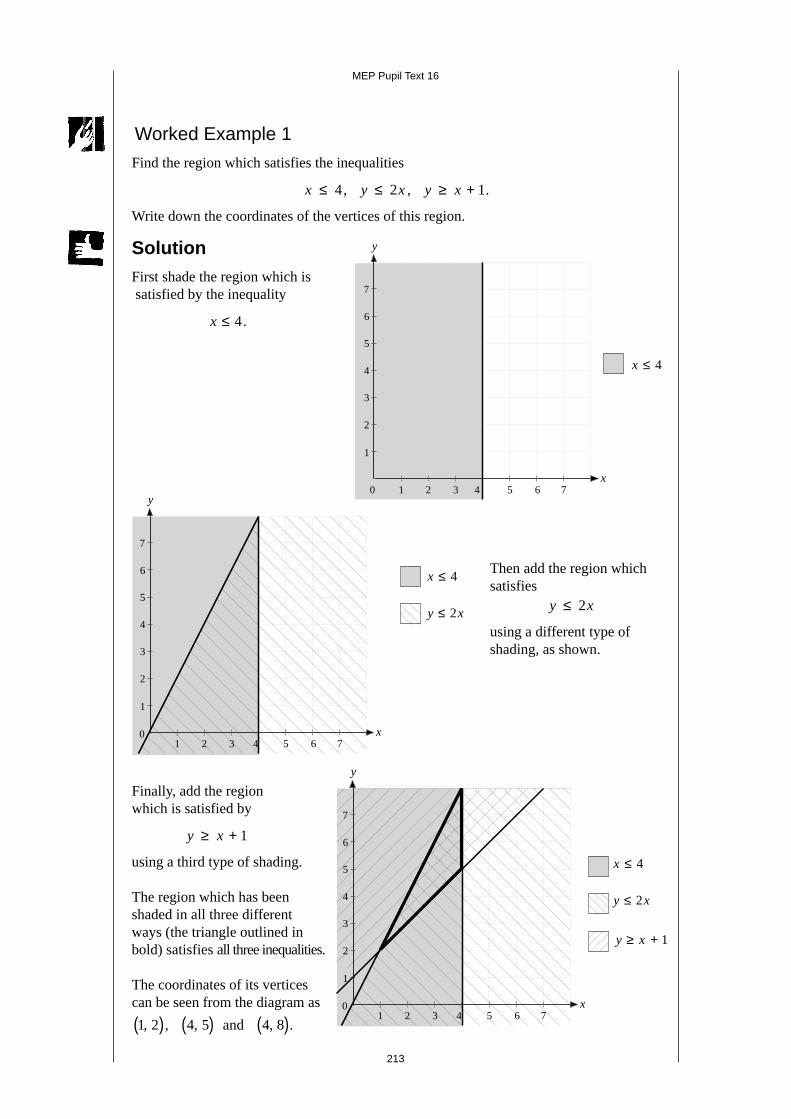
Worked Example 1
Find the region which satisfies the inequalities
x ≤ 4, y x≤ 2 , y x≥ + 1.
Write down the coordinates of the vertices of this region.
SolutionFirst shade the region which is satisfied by the inequality
x ≤ 4.
Then add the region whichsatisfies
y x≤ 2
using a different type ofshading, as shown.
Finally, add the regionwhich is satisfied by
y x≥ + 1
using a third type of shading.
The region which has beenshaded in all three differentways (the triangle outlined inbold) satisfies all three inequalities.
The coordinates of its verticescan be seen from the diagram as
1 2,( ), 4 5,( ) and 4 8,( ).
x ≤ 4
x ≤ 4
y x≤ 2
x ≤ 4
y x≤ 2
y x≥ + 1
1 2 3 4 5 6 7x
0
y
7
6
5
4
3
2
1
1 2 3 4 5 6 7x0
y
7
6
5
4
3
2
1
1 2 3 4 5 6 7x0
y
7
6
5
4
3
2
1
214
MEP Pupil Text 16
Note
When a large number of inequalities are involved, and therefore a greater amount ofshading, the required region becomes more difficult to see on the graph.
Therefore it is better to shade out rather shade in, leaving the required region unshaded.This method is used in the following example, where 'shadow' shading indicates the sideof the line which does not satisfy the relevant inequality.
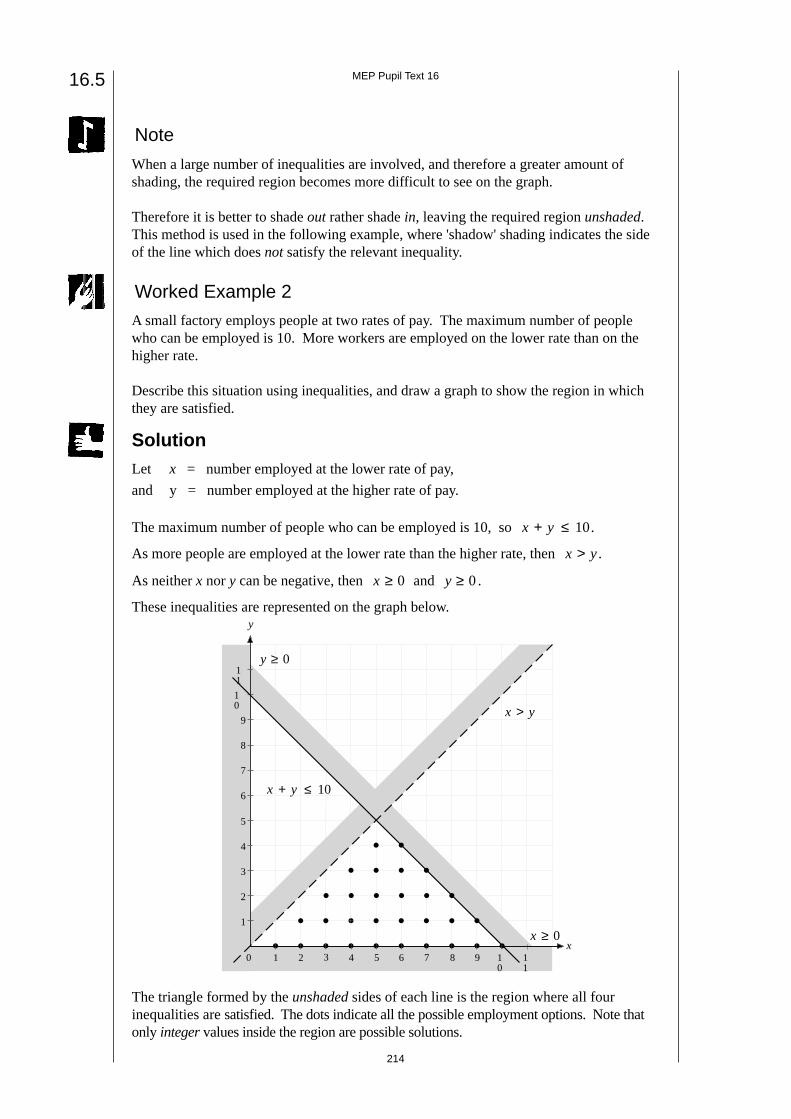
Worked Example 2
A small factory employs people at two rates of pay. The maximum number of peoplewho can be employed is 10. More workers are employed on the lower rate than on thehigher rate.
Describe this situation using inequalities, and draw a graph to show the region in whichthey are satisfied.
SolutionLet x = number employed at the lower rate of pay,
and y = number employed at the higher rate of pay.
The maximum number of people who can be employed is 10, so x y+ ≤ 10.
As more people are employed at the lower rate than the higher rate, then x y> .
As neither x nor y can be negative, then x ≥ 0 and y ≥ 0 .
These inequalities are represented on the graph below.
The triangle formed by the unshaded sides of each line is the region where all fourinequalities are satisfied. The dots indicate all the possible employment options. Note thatonly integer values inside the region are possible solutions.
x y>
y ≥ 0
x y+ ≤ 10
x ≥ 0
16.5
x0
y
11
10
9
8
7
6
5
4
3
2
1
10
1 2 3 4 5 6 7 8 9 11
215
MEP Pupil Text 16
Exercises
1. On a suitable set of axes, show by shading the regions which satisfy both theinequalities given below.
(a) x ≥ 4 (b) x < 7 (c) x ≥ −2
y < 8 y ≥ 1 y ≥ 4
(d) x y+ ≥ 2 (e) x y+ ≤ 4 (f) x y≥y < 6 x y+ > 1 x > 1
(g) y x≤ 2 (h) y x≥ 2 (i) y x≥y x≥ + 2 y x≤ 3 y x≤ + 3
2. For each set of three inequalities, draw graphs to show the regions which they allsatisfy. List the coordinates of the points which form the vertices of each region.
(a) x ≥ 2 (b) x ≥ 0 (c) x > −2
y x≥ + 1 x ≤ 5 y x≤ +2 3
y x≤ 3 y x≥ y x≥ − 2
(d) x y+ < 6 (e) y x≤ +2 1 (f) y x> − 1
x > 2 y x≥ − 1 y x> −2
y ≤ 3 x ≥ 2 y ≥ 4
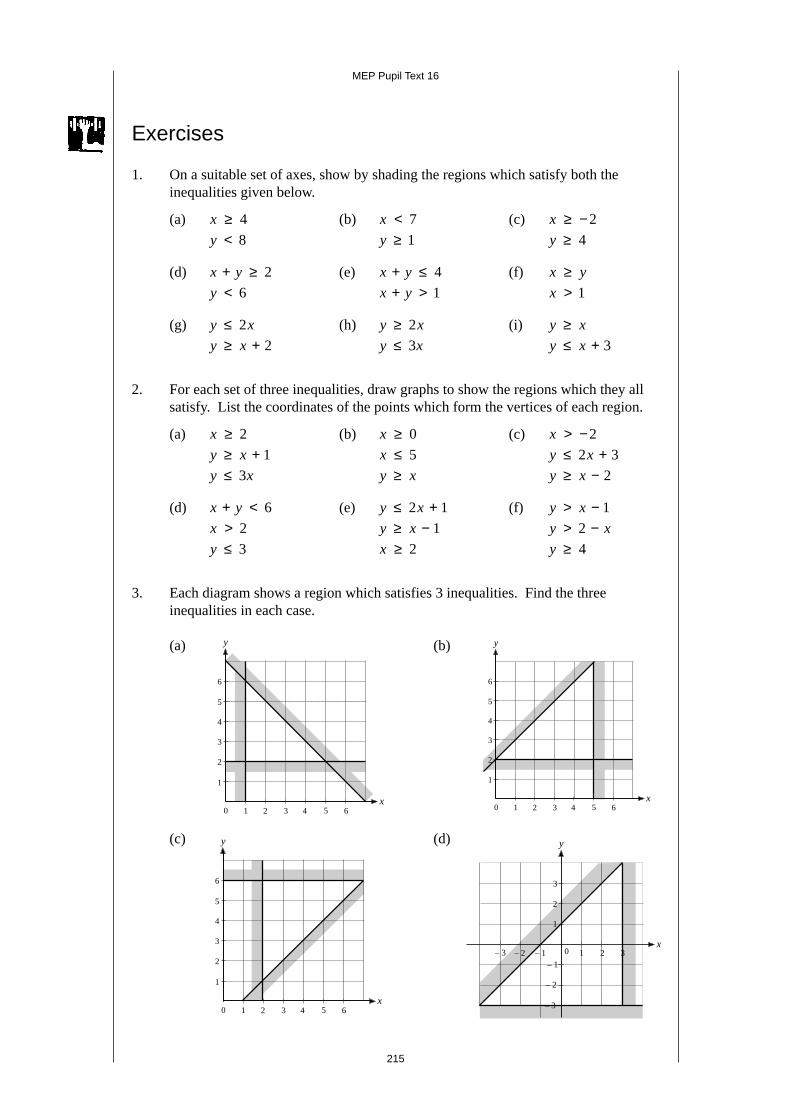
3. Each diagram shows a region which satisfies 3 inequalities. Find the threeinequalities in each case.
(a) (b)
(c) (d)
1 2 3 4 5x
0
y
6
5
4
3
2
1
6 1 2 3 4 5x
0
y
6
5
4
3
2
1
6
1 2 3 4 5x
0
y
6
5
4
3
2
1
6
– 2 – 1 0 1 2x
– 3
y
3
2
1
– 1
– 2
3
– 3
216
MEP Pupil Text 16
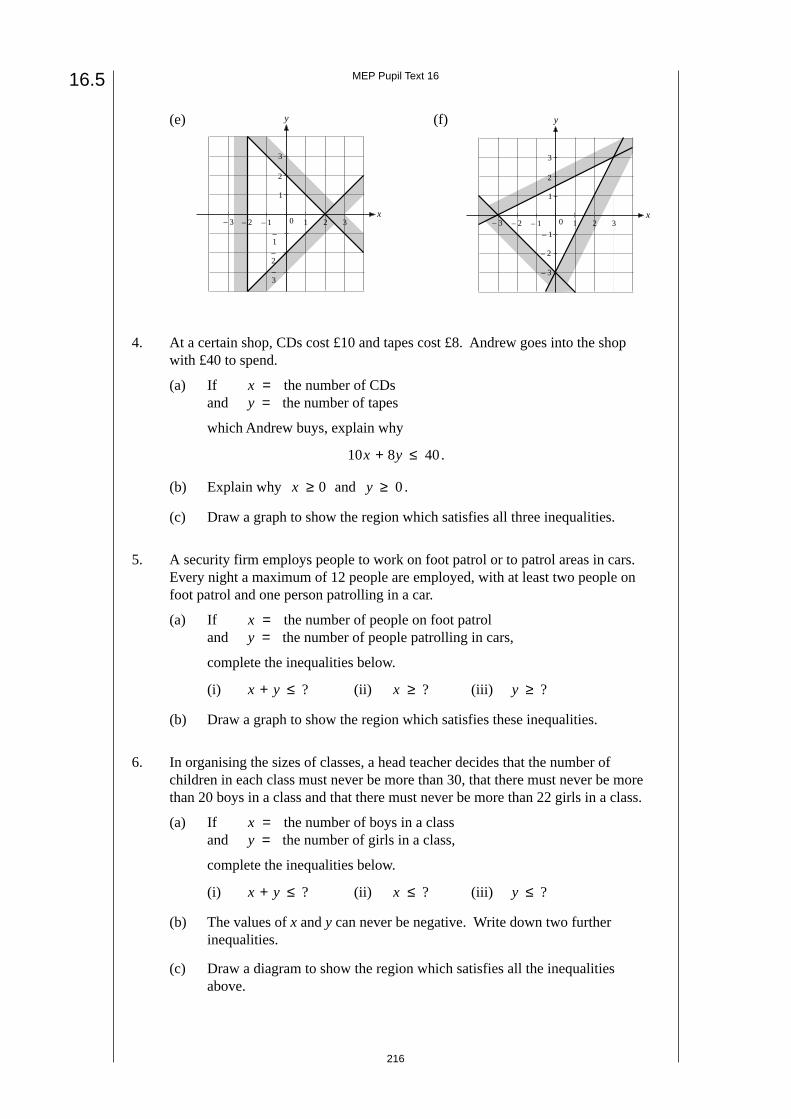
(e) (f)
4. At a certain shop, CDs cost £10 and tapes cost £8. Andrew goes into the shopwith £40 to spend.
(a) If x = the number of CDsand y = the number of tapes
which Andrew buys, explain why
10 8 40x y+ ≤ .
(b) Explain why x ≥ 0 and y ≥ 0 .
(c) Draw a graph to show the region which satisfies all three inequalities.
5. A security firm employs people to work on foot patrol or to patrol areas in cars.Every night a maximum of 12 people are employed, with at least two people onfoot patrol and one person patrolling in a car.
(a) If x = the number of people on foot patroland y = the number of people patrolling in cars,
complete the inequalities below.
(i) x y+ ≤ ? (ii) x ≥ ? (iii) y ≥ ?
(b) Draw a graph to show the region which satisfies these inequalities.
6. In organising the sizes of classes, a head teacher decides that the number ofchildren in each class must never be more than 30, that there must never be morethan 20 boys in a class and that there must never be more than 22 girls in a class.
(a) If x = the number of boys in a classand y = the number of girls in a class,
complete the inequalities below.
(i) x y+ ≤ ? (ii) x ≤ ? (iii) y ≤ ?
(b) The values of x and y can never be negative. Write down two furtherinequalities.
(c) Draw a diagram to show the region which satisfies all the inequalitiesabove.
16.5
– 2 – 1 0 1 2x
– 3
y
3
2
1
–1–2
3
–3
– 2 – 1 0 1 2x
– 3
y
3
2
1
– 1
– 2
3
– 3
217
MEP Pupil Text 16
7. Ice cream sundaes are sold for either £1 or £2. Veronica is going to buy sundaesfor some of the 6 members of her family, but only has £10 to spend.
Use x = the number of £1 sundaes boughtand y = the number of £2 sundaes bought.
(a) Write down 4 inequalities which describe the situation above.
(b) Draw a diagram to show the region which satisfies all four inequalities.
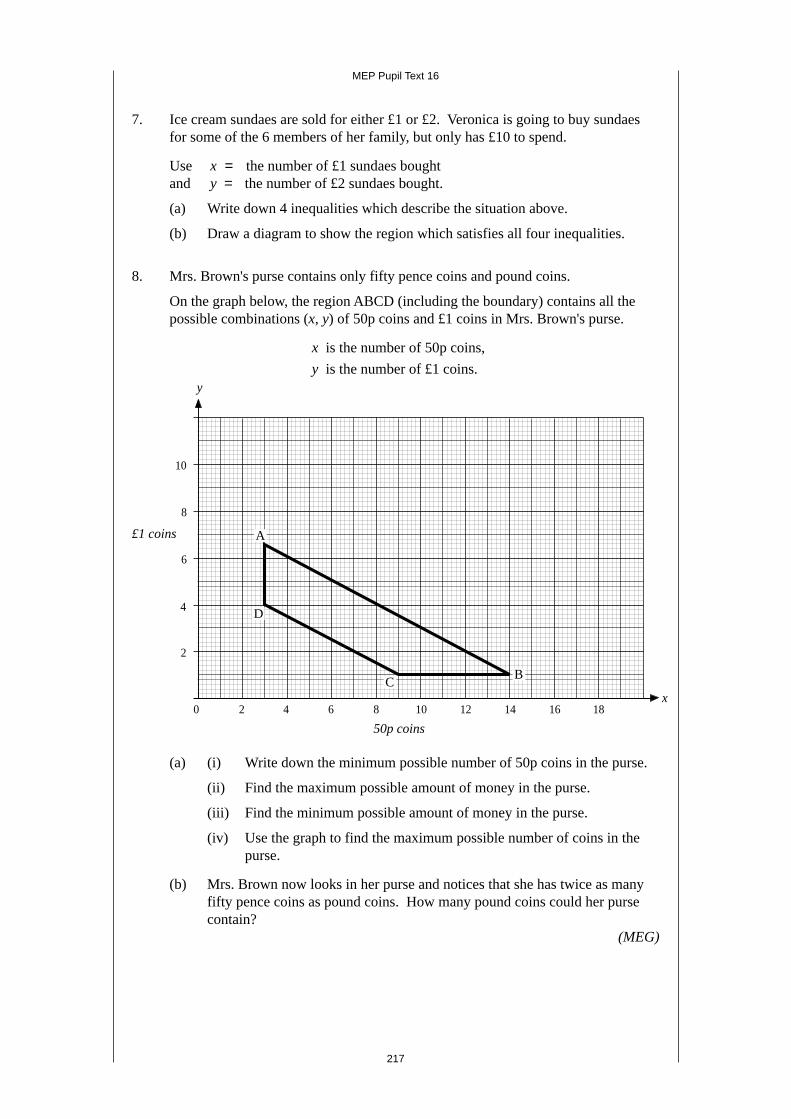
8. Mrs. Brown's purse contains only fifty pence coins and pound coins.
On the graph below, the region ABCD (including the boundary) contains all thepossible combinations (x, y) of 50p coins and £1 coins in Mrs. Brown's purse.
x is the number of 50p coins,
y is the number of £1 coins.
(a) (i) Write down the minimum possible number of 50p coins in the purse.
(ii) Find the maximum possible amount of money in the purse.
(iii) Find the minimum possible amount of money in the purse.
(iv) Use the graph to find the maximum possible number of coins in thepurse.
(b) Mrs. Brown now looks in her purse and notices that she has twice as manyfifty pence coins as pound coins. How many pound coins could her pursecontain?
(MEG)
y
0 2 4 6 8 10 12 14 16 18
2
4
10
8
6
x
A
D
CB
50p coins
£1 coins
218
MEP Pupil Text 16
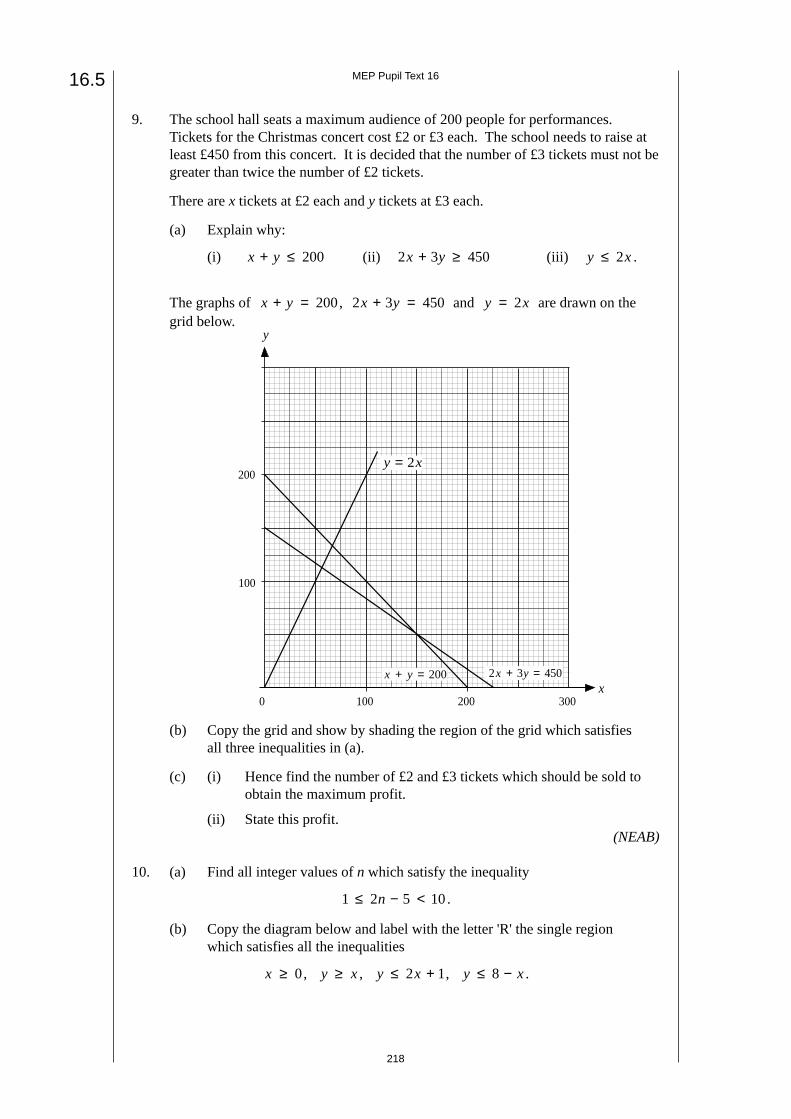
9. The school hall seats a maximum audience of 200 people for performances.Tickets for the Christmas concert cost £2 or £3 each. The school needs to raise atleast £450 from this concert. It is decided that the number of £3 tickets must not begreater than twice the number of £2 tickets.
There are x tickets at £2 each and y tickets at £3 each.
(a) Explain why:
(i) x y+ ≤ 200 (ii) 2 3 450x y+ ≥ (iii) y x≤ 2 .
The graphs of x y+ = 200, 2 3 450x y+ = and y x= 2 are drawn on thegrid below.
(b) Copy the grid and show by shading the region of the grid which satisfiesall three inequalities in (a).
(c) (i) Hence find the number of £2 and £3 tickets which should be sold toobtain the maximum profit.
(ii) State this profit.(NEAB)
10. (a) Find all integer values of n which satisfy the inequality
1 2 5 10≤ − <n .
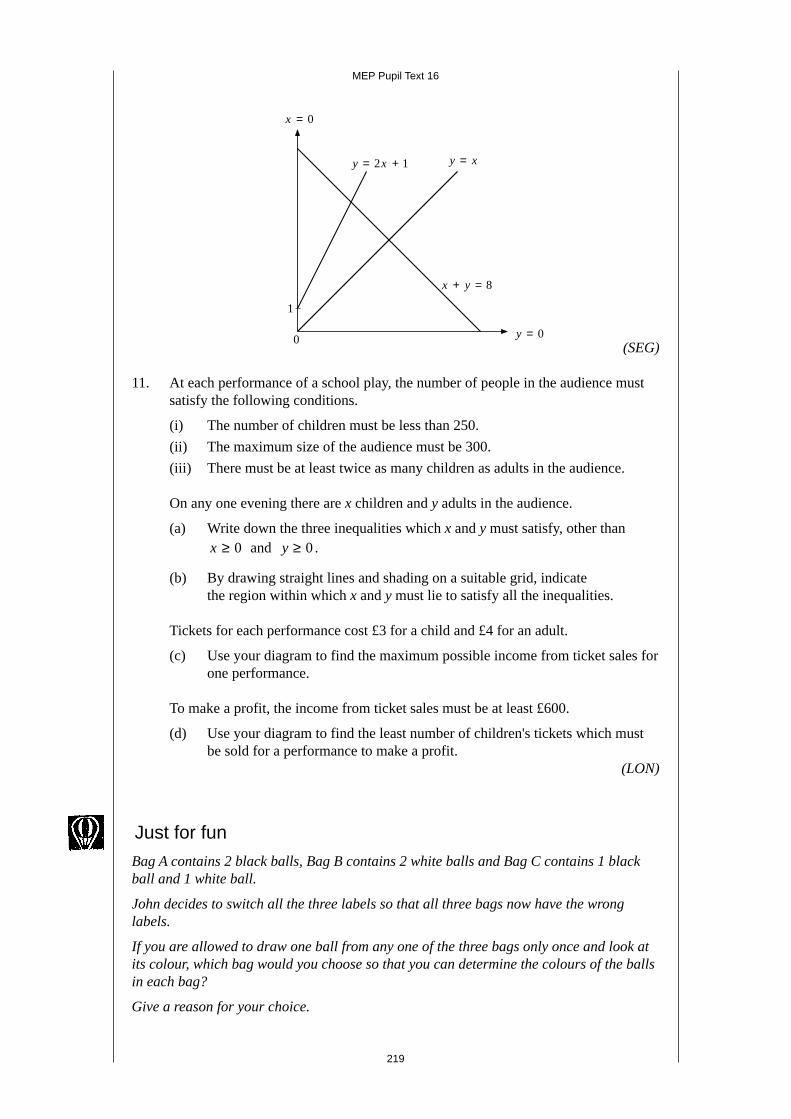
(b) Copy the diagram below and label with the letter 'R' the single regionwhich satisfies all the inequalities
x ≥ 0, y x≥ , y x≤ +2 1, y x≤ −8 .
y
0 100 200
100
200
x300
2 3 450x y+ =x y+ = 200
y x= 2
16.5
219
MEP Pupil Text 16
(SEG)
11. At each performance of a school play, the number of people in the audience mustsatisfy the following conditions.
(i) The number of children must be less than 250.
(ii) The maximum size of the audience must be 300.
(iii) There must be at least twice as many children as adults in the audience.
On any one evening there are x children and y adults in the audience.
(a) Write down the three inequalities which x and y must satisfy, other thanx ≥ 0 and y ≥ 0 .
(b) By drawing straight lines and shading on a suitable grid, indicatethe region within which x and y must lie to satisfy all the inequalities.
Tickets for each performance cost £3 for a child and £4 for an adult.
(c) Use your diagram to find the maximum possible income from ticket sales forone performance.
To make a profit, the income from ticket sales must be at least £600.
(d) Use your diagram to find the least number of children's tickets which mustbe sold for a performance to make a profit.
(LON)
x = 0
0
1
y = 0
y x= +2 1 y x=
x y+ = 8
Just for fun
Bag A contains 2 black balls, Bag B contains 2 white balls and Bag C contains 1 blackball and 1 white ball.
John decides to switch all the three labels so that all three bags now have the wronglabels.
If you are allowed to draw one ball from any one of the three bags only once and look atits colour, which bag would you choose so that you can determine the colours of the ballsin each bag?
Give a reason for your choice.