Embed Size (px)
Citation preview
8
Sait Bayrakdar School of Education, Communication and Society
No. 2020-09
June 2020
Inequalities in home learning and schools’ provision of distance teaching during school closure of COVID-19 lockdown in the UK
Ayse Guveli Department of Sociology
University of Essex
King’s College London
ISE
R W
ork
ing P
aper S
erie
s
ww
w.is
er.e
sse
x.a
c.u
k
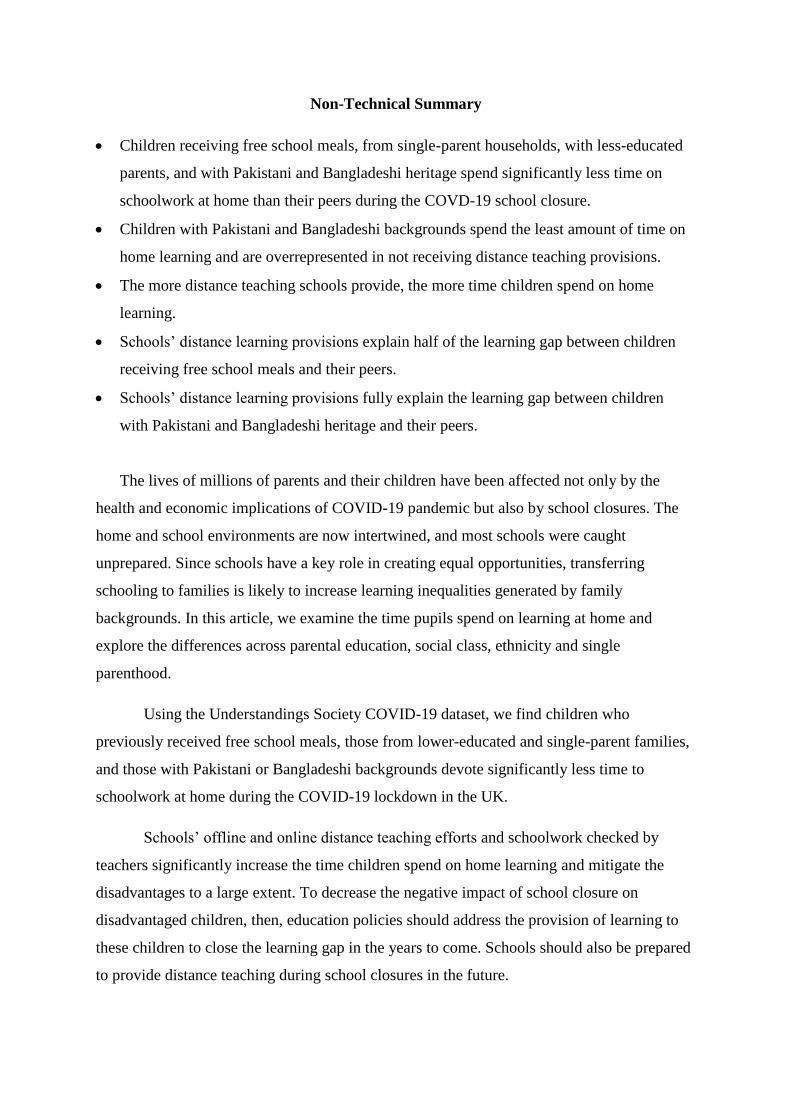
Non-Technical Summary
Children receiving free school meals, from single-parent households, with less-educated
parents, and with Pakistani and Bangladeshi heritage spend significantly less time on
schoolwork at home than their peers during the COVD-19 school closure.
Children with Pakistani and Bangladeshi backgrounds spend the least amount of time on
home learning and are overrepresented in not receiving distance teaching provisions.
The more distance teaching schools provide, the more time children spend on home
learning.
Schools’ distance learning provisions explain half of the learning gap between children
receiving free school meals and their peers.
Schools’ distance learning provisions fully explain the learning gap between children
with Pakistani and Bangladeshi heritage and their peers.
The lives of millions of parents and their children have been affected not only by the
health and economic implications of COVID-19 pandemic but also by school closures. The
home and school environments are now intertwined, and most schools were caught
unprepared. Since schools have a key role in creating equal opportunities, transferring
schooling to families is likely to increase learning inequalities generated by family
backgrounds. In this article, we examine the time pupils spend on learning at home and
explore the differences across parental education, social class, ethnicity and single
parenthood.
Using the Understandings Society COVID-19 dataset, we find children who
previously received free school meals, those from lower-educated and single-parent families,
and those with Pakistani or Bangladeshi backgrounds devote significantly less time to
schoolwork at home during the COVID-19 lockdown in the UK.
Schools’ offline and online distance teaching efforts and schoolwork checked by
teachers significantly increase the time children spend on home learning and mitigate the
disadvantages to a large extent. To decrease the negative impact of school closure on
disadvantaged children, then, education policies should address the provision of learning to
these children to close the learning gap in the years to come. Schools should also be prepared
to provide distance teaching during school closures in the future.
Inequalities in home learning and schools’ provision of distance teaching
during school closure of COVID-19 lockdown in the UK*
**Sait Bayrakdar, School of Education, Communication and Society, King’s College London
**Ayse Guveli, Department of Sociology, University of Essex
Abstract
Parents and schools were caught unprepared during the COVID-19 school closure. Since
schools have a key role in creating equal opportunities, transferring schooling to families is
likely to increase learning inequalities. Using the Understandings Society COVID-19 dataset,
we find children who received free school meals, children from lower-educated and single-
parent families and children with Pakistani or Bangladeshi backgrounds devote significantly
less time to schoolwork at home. Schools’ provisions of offline and online distance teaching
and homework checking significantly increase the time children spend on home learning and
mitigate most of the disadvantages.
Key words: Home learning, educational inequalities, schools, COVID-19, school closure
Corresponding Author: Ayse Guveli, [email protected]
* Acknowledgement: We would like to thank Dr Thijs Bol for collaborating on the survey questions on home
schooling and the Understanding Society team for making this research possible by fielding our suggested home
schooling questions in the Understanding Society COVID-19 wave 1. This research was supported by the ESRC
Research Centre on Micro-Social Change (MiSoC) (Grant No: ES/L009153/1).
**The order of the authors is alphabetical; their contributions are equal.
1
Introduction
COVID-19 transformed homes around the world into classrooms in a matter of
weeks, if not days. The learning environment was radically changed, and many schools had
to create distance teaching and resources overnight. The transition to home learning in such a
short time without warning or advance preparation has raised concerns that will be the focus
for researchers, educators, policymakers, and all those interested in the educational and social
welfare of young people for years to come.
In the UK, schools closed on 20 April 2020, except for schools for children of key
workers and children with special needs. Phased reopening started on 1 June 2020 for
children in Reception, Years 1 and 6 in England, if schools could guarantee social distancing
rules. The fate of the rest of the children is uncertain, but schools are likely to stay closed
until the next school year. Ongoing home learning is likely to generate new and accelerate
existing inequalities between children from disadvantaged families and their well-off peers,
but we suggest schools’ involvement in home learning and provision of distance teaching
might mitigate these disparities during the school interruption. In this article, we investigate
whether parental background generates inequalities in the time students spend on schoolwork
and how schools’ provision of learning opportunities during the lockdown mitigates these
inequalities.
Education is arguably the most important determinant of an individual’s life prospects
(Hout & DiPrete, 2006; Machin, 2006). Schools develop children’s talents and abilities and
play a key role in equalising opportunities in society, whilst not completely levelling the
playing field (Breen, 2004). The present transfer of teaching responsibilities to families is
likely to amplify the impact of family background on learning because the extent to which
children can continue learning at home may depend on the support and resources available in
the family. Even during summer holidays, children from underprivileged backgrounds
2
develop learning disadvantages whilst their well-off comparators continue to explore and
learn (Alexander et al., 2001). It is estimated that 12 weeks of schooling interruption drops
test scores significantly (Burgess & Sievertsen, 2020), suggesting further separation by
socioeconomic status, if one group can continue to learn and another cannot. Studies of
educational attainment and inequality in the UK reveal substantial disadvantages for working
class families and certain ethnic groups (Pensiero & Schoon, 2019; Stevens et al., 2019). The
school interruption will widen the gap if children in those socioeconomic and ethnic groups
are under-served. In fact, emerging research is already suggesting the lockdown will have far-
reaching educational consequences, especially for vulnerable children (Andrew et al., 2020;
Bol, 2020;).
Looking at the Netherlands, Bol (2020) finds lower-educated parents feel unable to
help or have limited understanding of the material schools have provided during the school
closure. In the UK, Andrew et al. (2020) compare time spent on ‘educational activities’
across groups of children during the school closure; the richest primary school children
spend, on average, six hours per day on educational activities, and secondary school students
spend five and a half hours per day. However, these studies do not examine the impact of
school closure on the learning of children with ethnic minority backgrounds and the poorest –
those on free school meals, and these may be among the hardest-hit groups.
We followed up these two studies by considering the effect of various socioeconomic
characteristics, ethnicity and single parenthood. More specifically, we comparatively
analysed how much time children spend on schoolwork during the UK school closure using
the nationally representative Understanding Society COVID-19 dataset. The data include
boost samples for people with ethnic minority backgrounds and thus allow comparisons of
ethnic groups. The data also have information from parents on schools’ provision of distance
teaching during the lockdown, giving us the unique opportunity to determine whether
3
schools’ involvement might explain disparities in home learning. We raise the following
questions:
1) How much time do students spend on schoolwork during the COVID-19 UK
school closure?
2) To what extent does the amount of time students spend on schoolwork during the
school closure differ by parental socioeconomic characteristics, ethnicity and single
parenthood?
3) To what extent does schools’ provision of distance teaching (online and/or offline
home learning material; checking homework) mitigate differences in the amount of time
spent on homework?
Family background and education
Research on the impact of parental background on educational attainment and
learning is extensive, and the subject is central in the social sciences. Many countries have
persistent class inequalities in educational attainment, and parents with more resources are
able to help their children to achieve better outcomes (Cooper & Stewart, 2013; OECD,
2013). The UK is no exception. Studies document that at various key stages of education,
students from working-class families acquire disproportionately lower qualifications and
follow less prestigious career routes and enter less prestigious universities than their middle-
class peers (Heath & Clifford, 1990; Bukodi & Goldthorpe, 2013; Sullivan et al., 2013).
Recent statistics based on administrative data indicate children entitled to free school meals
(FSM) because of family poverty have 18 to 20 per cent lower attainment than their more
advantaged peers (Social Mobility Commission, 2019).
There are also differences for some (but not all) ethnic minority groups. For example,
studies report that students with Black-African, Black-Caribbean, Pakistani and Bangladeshi
4
backgrounds, on average, have lower grades than their white comparators. However, these
gaps have diminished in the last decade (Rothon, 2007; DfE, 2015). Once socioeconomic
outcomes are controlled, the disadvantage of Black-African, Black-Caribbean, Bangladeshi
and Pakistani students is reduced, suggesting part of the finding of ethnic inequality is related
to lower socioeconomic backgrounds. Lack of language skills, cultural dissonance and unfair
treatment in schooling may explain the remaining education gap (Heath & Birnbaum, 2007;
Gillborn, 2008).
The classic social mobility literature suggests that the impact of parental background
on educational attainment and other life prospects will decrease and people’s talent, skills and
educational credentials will gradually become decisive over the course of industrialization
(Coleman et al., 1966; Blau & Duncan, 1968; Machin, 2006; Erikson & Goldthorpe, 2010;
Oreopoulos & Salvanes, 2010; Guveli at al., 2012; Zuccotti et al., 2017; Platt, 2019). In fact,
education is increasingly imperative in our post-industrial knowledge economy (Guveli,
2006). Accordingly, social policies aim to minimize the impact of family background on
education, to ensure equal opportunity for all members of society regardless of social or
family background (Roemer, 1998; Morgan et al., 2006). For example, the UK’s Industrial
Strategy policy paper (DfBEIS, 2018) argues for the need to increase social mobility by
expanding equal opportunities in education, working with young people and creating the
skills necessary for their future jobs.
The COVID-19 pandemic has disrupted the delivery of education. We argue that the
transfer of teaching responsibilities to families may increase social inequalities and widen the
education gap, as the hardest-hit children are likely to be those with working class and/or
less-educated parents, those in single parent families and those with ethnic minority
backgrounds.
5
COVID-19 and children with disadvantaged backgrounds
Concerns about the negative effects of home schooling during the COVID-19
pandemic have been raised by many stakeholders, not just parents and teachers, but also
policymakers, researchers and the third sector. A learning loss is expected, possibly affecting
students’ cognitive gains in the long-term (Brown et al., 2020) and disproportionately
affecting children from disadvantaged families (UNESCO, 2020).
Families with skills, resources and knowledge might compensate for the negative
impact of school closure (Andrew et al., 2020; Bol, 2020). Students with skilled and highly
educated parents may even make greater strides, as these parents might spend more time with
their children, teach them individually and/or hire online tutors to keep up with schoolwork
(Lareau, 2011; Calarco, 2018).
Children in poor families live mostly under deprived conditions; they mostly live in
small houses with no individual rooms or place to do their schoolwork. They might not have
Internet or IT facilities to do home learning; if they do, they will likely need to share them
with parents or siblings. They might not have access to outdoor spaces like a garden or
balcony to entertain themselves, which might foster and increase their time in home learning.
Parental involvement is known to increase educational achievement in normal times
(for a review, see Boonk et al., 2018). During the school interruption, it is important for
parents to remain involved, to closely follow the instructions of school, create a programme,
routine and conditions at home and monitor their children’s schoolwork. If parents are less
educated, these parents may feel less able to take up teaching responsibilities. Their cognitive
ability, aspirations and understanding of the importance of education for the future of their
children might lessen their involvement as well (Lee & Bowen, 2006). Recent research
suggests parents with lower educational qualifications feel less confident supporting their
children’s learning during the lockdown (Bol, 2020; Cullinane & Montacute, 2020).
6
Another group of children are those in single-parent families. The school shutdown
might place additional burdens on single parents; they will have limited time, support and
resources to foster home learning. Using the Understanding Society COVID-19 data,
Benzeval et al. (2020) find single parents face more economic loss than others during the
lockdown. Hardship and loneliness might further decrease their ability to dedicate time and
resources to home school their children.
Another group of children suffering relatively greater hardship in the UK because of
the pandemic are those belonging to ethnic minorities (Benzeval et al., 2020; Platt &
Warwick, 2020). As noted above, there is an education gap for children with Pakistani,
Bangladeshi, Black-African and Black-Caribbean backgrounds (Hutchinson et al., 2019).
School closure might widen the gap. Ethnic minority parents may have limited understanding
of the learning materials or limited ability to support their children’s learning. Whilst their
aspirations for success may be high, ethnic minority and migrant families generally have
limited resources and less knowledge of the education system, curricula and teaching style
(Bayrakdar, 2015; Bayrakdar & Guveli, 2020). Some might have weak English language
skills, further hampering their efforts.
Schools’ homeschooling provision
Schools have the responsibility to foster talent, skills and cognitive competences and
to provide knowledge transfer in our knowledge society. They enhance the chances of status
attainment by children from disadvantaged families whilst limiting the likelihood of well-off
families ensuring privileged positions for their children. In other words, schools are thought
to be the engine of social mobility, safeguarding equal opportunities in the labour market and
beyond. However, we have limited information on how schools prepared for the present
shutdown and to what extent they developed curricula, guidance, learning materials and
7
programmes to continue teaching from a distance and monitor their students’ learning.
Schools’ involvement might increase students’ motivation to do schoolwork, and this could
mitigate or limit learning drawbacks of the shutdown. That is, schools’ homeschooling
provisions might moderate the impact of parental background on students’ home learning.
Even if physically closed, schools could continue to deliver teaching by offering
online classes, materials, supervision and other kinds of communication to minimize the
disruptive effect of closure. Such efforts might prevent learning gaps and maintain schools’
equalizing function. However, schools might differ in their provision of distance teaching and
home learning guidance, depending on their resources, such as staffing, IT facilities and
distance teaching knowhow. In normal times, schools differ in terms of their resources,
funding and teacher quality, and these characteristics affect student outcomes (Levačić &
Vignoles, 2002; Rivkin et al., 2005; Steele et al., 2007). The effects remain significant even
after controlling for family background (Borman & Dowling, 2010), suggesting school
effects are not simply a result of student selection. It is reasonable to assume this effect will
continue during lockdown.
In the UK, school performance tables are published annually, and parents often base
their schooling decisions on them (Perryman et al., 2011). The creation of a ‘quasi-market’ in
education affects student intake, as parents with more resources try to send their children to
good schools (West & Pennell, 2010; Hobbs, 2016). At the same time, disadvantaged
students are likely to have unqualified, inexperienced and out-of-subject teachers, possibly in
schools with poor staff retention (Allen & Sims, 2018). Considering these factors, we
expected disadvantaged students (i.e., those in poor families, those with less educated
parents, those in single-parent families and those belonging to an ethnic minority) would less
likely be supported by their schools during the lockdown.
8
Data
To probe our hypotheses, we used the first wave COVID-19 dataset of the
Understanding Society study. Understanding Society is the UK’s main longitudinal
household survey, also known as the UKLHS; it includes information on all adults living in
over 40,000 households. According to Benzeval et al. (2020) the representativeness of the
Understanding Society data has been evaluated frequently, and these are considered high
quality data to make population inferences (Fisher et al., 2019).
The Understanding Society COVID-19 Web Survey has taken place monthly during
the pandemic (or lockdown), with the first wave occurring 24-29 April 2020 (Understanding
Society, 2020). All members of the four samples (General Population, Ethnic Minority Boost,
Immigrant and Ethnic Minority Boost, former British Household Panel Survey) who were
over 15 were invited to answer interview questions taking approximately 20 minutes on the
web and were offered a small financial incentive. A pre-notification letter was sent to their
postal address on 17 April 2020, followed by three reminders to their email address and/or
phone number during the fieldwork period. This dataset differs from many emerging
COVID-19 datasets because its sampling design is based on the Understanding Society
sample, and it is representative of the UK population.
The respondents were asked whether they had a child or children living in the
household for whom they were the parent or guardian. If they did, they were asked the
questions in the home schooling module included in the first wave of the Understanding
Society COVID-19 web survey; these data cover children attending primary, secondary or
higher secondary school. We used the children’s dataset, and the units of analysis were the
children. We added the parental characteristics from the main Understanding Society
COVID-19 wave 1 dataset and from the baseline Understanding Society wave 9 dataset.
9
The dataset includes an ethnic minority boost sample from the main ethnic minority
groups (Chinese, Indian, Pakistani, Bangladeshi, Black-Caribbean and Black-African), in
addition to respondents with a migration background in the nationally representative sample.
Our analysis focused on students who were not in school at the time of the survey and who
were receiving schoolwork from their schools; this accounted for 87.5 per cent of all the
children in the dataset (3,953 out of 4,519 cases). After taking out the cases with missing
information, 3,867 children were left. Wave 9 of Understanding Society does not include all
adults in the COVID-19 survey, so inclusion of this information reduced the number of cases
to 3,150. As a robustness check, we included the same model but excluded the information
from the main Understanding Society dataset in Appendix A.
Variables
As dependent variable, we used time children spend doing their schoolwork provided
by their school. The question is formulated as: ‘Thinking about the situation now, on an
average day when they are doing school work at home, how much time does {childname}
spend on this?’ Answer categories are: 1) less than an hour; 2) 1 to 2 hours; 3) 2 to 3 hours;
4) 3 to 4 hours; 5) 4 to 5 hours; 6) 5 or more hours. We treated these categories as the value
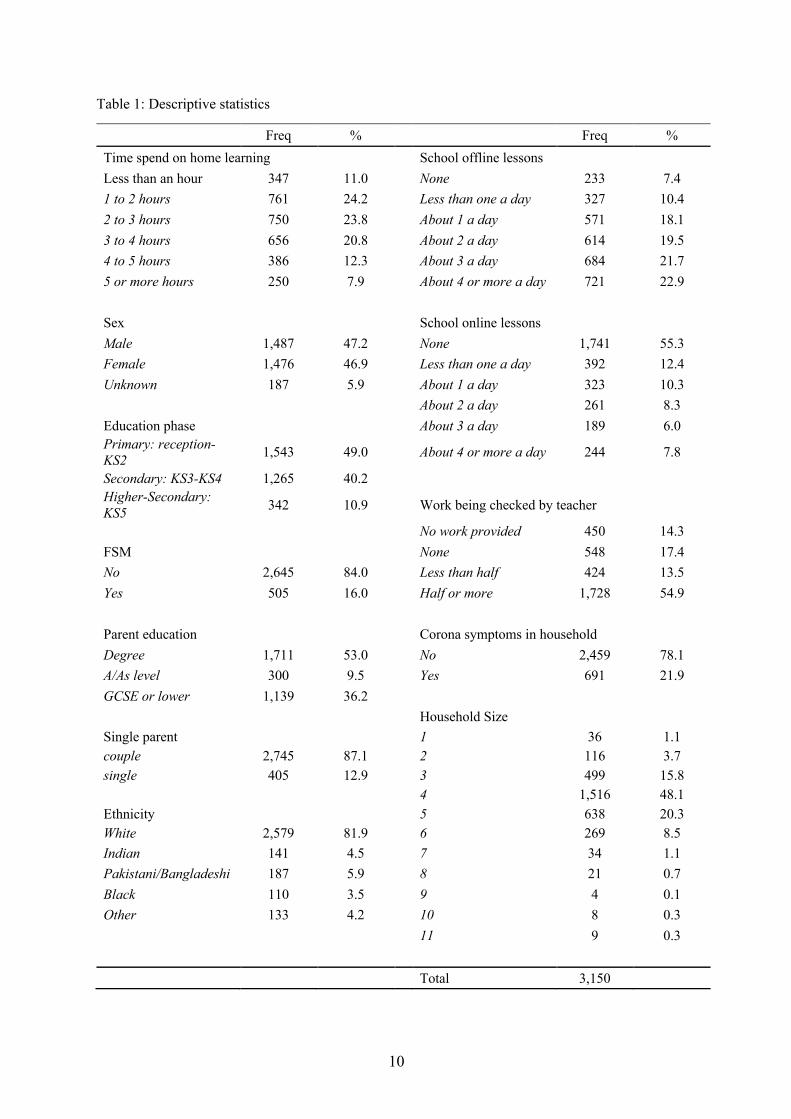
of their upper limit, and this should be kept in mind when interpreting the results. Table 1
shows frequency distribution of all variables. Our dependent variable has an approximately
normal distribution, with 24 per cent of children spending between 1 and 2 hours a day on
home learning and another 24 per cent spending between 2 and 3 hours a day. Children in
primary, secondary and higher secondary school spend, on average, 3.2 hours a day on
schoolwork they receive from school, considerably lower than previous research has
suggested (see Andrew et al., 2020).
10
Table 1: Descriptive statistics
Freq % Freq %
Time spend on home learning
School offline lessons
Less than an hour 347 11.0
None 233 7.4
1 to 2 hours 761 24.2
Less than one a day 327 10.4
2 to 3 hours 750 23.8
About 1 a day 571 18.1
3 to 4 hours 656 20.8
About 2 a day 614 19.5
4 to 5 hours 386 12.3
About 3 a day 684 21.7
5 or more hours 250 7.9
About 4 or more a day 721 22.9
Sex
School online lessons
Male 1,487 47.2
None 1,741 55.3
Female 1,476 46.9
Less than one a day 392 12.4
Unknown 187 5.9
About 1 a day 323 10.3
About 2 a day 261 8.3
Education phase
About 3 a day 189 6.0 Primary: reception-KS2 1,543 49.0
About 4 or more a day 244 7.8
Secondary: KS3-KS4 1,265 40.2
Higher-Secondary: KS5 342 10.9
Work being checked by teacher
No work provided 450 14.3
FSM
None 548 17.4
No 2,645 84.0
Less than half 424 13.5
Yes 505 16.0
Half or more 1,728 54.9
Parent education
Corona symptoms in household
Degree 1,711 53.0
No 2,459 78.1
A/As level 300 9.5
Yes 691 21.9
GCSE or lower 1,139 36.2
Household Size
Single parent 1 36 1.1 couple 2,745 87.1 2 116 3.7 single 405 12.9 3 499 15.8
4 1,516 48.1 Ethnicity 5 638 20.3 White 2,579 81.9 6 269 8.5
Indian 141 4.5
7 34 1.1
Pakistani/Bangladeshi 187 5.9
8 21 0.7
Black 110 3.5
9 4 0.1
Other 133 4.2
10 8 0.3
11 9 0.3
Total 3,150
11
As independent variables for child characteristics, we included sex of the child; the
distribution of male and female children was about the same (47.2 per cent male and 46.9 per
cent female). Sex is unknown for 308 children because they cannot be identified in the annual
baseline Understanding Society dataset (Table 1). Therefore, we added these to our analysis
as a separate category. The overwhelming majority of the total number of children in our
dataset (96.6 per cent) were not attending school because of the school closure; some were
going to school because either their parent(s) or guardian(s) were key workers or they were
special needs children. We dropped both from the analysis. Table 1 shows that children in
primary education constitute 49 per cent, about 40 per cent attend secondary school and about
11 percent are in higher secondary school. 1
For parental characteristics, we included eligibility for free school meals and
parent’s/guardian’s education as socioeconomic indicators. We also included whether
parent/guardian was a single parent and the parent’s ethnic background, using the parent (or
guardian) who reported on the child(ren). As it is a common measure in education research in
the UK, we used the information on whether child(ren) received free school meals at any
time in January and/or February 2020 as an indicator of poverty and social class. We coded
children 1 if received and 0 if they did not receive free school meals. Children who received
free school meals represent 16 per cent of the sample (Table 1).
We operationalized the education of parent or guardian in three categories: 1) degree;
2) A/AS level (or other level 3 qualifications); 3) GCSE or lower. Children with higher-
educated parents (a degree, its equivalent or higher) represent 53 per cent of the sample; 36
per cent of parents have GCSE or lower education; parents with an A or AS level constitute
about 10 per cent (Table 1). Children with a single parent represent about 13 per cent of our
1 The differences between time spent on home learning of children in different key stages led to similar conclusions: pupils in Reception spend the least time, and this increases almost linearly by stage level, as we show in Appendix A.
12
sample (Table 1). We amalgamated parental ethnic background into five categories. The
group White includes British, English, Scottish, Welsh, Northern, White Irish and any other
White background and constitutes the majority of the sample (81.9 per cent). Children with
Pakistani or Bangladeshi backgrounds represent about 6 per cent of the sample, and the
Black-Caribbean, Black-African group is about 3.5 per cent. We created a separate group for
Indian because of the fairly large number of children (4.5 per cent). We grouped the rest into
an Other group, including all mixed backgrounds, Chinese, any other Asian and any other
background (4.2 per cent).
We included three variables on schools’ provision of distance teaching opportunities.
One was the offline provision of lessons; the question is formulated as: ‘How many off-line
lessons (such as worksheets, assignments, videos) does {childname}’s school provide for
them?’ It has the following ordinal answer categories: 1) none; 2) less than one a day; 3)
about 1 a day; 4) about 2 a day; 5) about 3 a day; 6) about 4 or more a day. A considerable
proportion of children (7.4 per cent) do not receive any offline schoolwork from their school,
but about 23 per cent receive four or more offline lessons each day. The dataset also includes
information on school provision of online lessons; the question is formulated as: ‘How many
online (live or real-time) lessons or meetings does {childname}’s school provide for them?’
This question has the same ordinal answer categories as the previous variable. The majority
of the children (55.3 per cent) do not receive any online distance teaching from the school;
the rest receive it from less than once a day (12.4 per cent) to four or more times a day (7.8
per cent).
Parents/guardians were asked whether the teacher checked the schoolwork: ‘How
much of {childname}’s completed school work do the teachers check, if it is sent in or
uploaded?’ The answer categories are: 0) no work provided; 1) none of it; 2) less than half; 3)
13
half or more; 4) all of it. About 17 per cent of the children do not have their work checked;
about 55 per cent have half or more of their work checked (Table 2).
Finally, we controlled for whether somebody in the household showed COVID-19
symptoms and for household size.2
Methods of Analysis
We treated our dependent variable as linear and used Ordinary Least Square (OLS)
regression for the data analysis. We also ran our models using Ordered Logistic Regression
(see Appendix B), but these had the same conclusions. Since we are not interested in every
answer category’s size, in what follows, we discuss our OLS regression results to make the
interpretation of our findings easier.
All our regression models included cluster corrections at parent level, as our units of
analysis were children nested in parents/families; therefore, they were not independent units.
We ran three regression models on the same sample (Table 4); after dropping all missing
cases our sample size for each model constituted 3,150 children, thus allowing cross-model
comparison of the coefficients. Model 1 includes children’s sex, their school stage (primary,
secondary, higher secondary education), COVID-19 symptoms in the household and the
household size. Model 2 adds single parenthood, education of parent/guardian, child receipt
of free school meals in January and/or February 2020 and ethnicity of parent. Model 3 adds
variables on schools’ provision of ongoing learning. Model 2 displays family background
2 We included other variables to control the relations in our model building (see Appendix A) such as ‘relation to child’ (whether mother, father or a guardian) and ‘school type’ (state or private). The ‘relation to child’ variable did not change our conclusions or improve our model. The information about the school type was missing for almost one third of the sample; therefore, we did not include this variable in our models. For the children for whom school type data were available, a small share (about 4 per cent) attended private school. For these reasons, we did not include this variable.
14
disparities in home learning, and Model 3 tests our expectation that schools’ continued
involvement with home learning will mitigate these disparities.
Descriptive results
Before discussing how much time pupils spend on their schoolwork each day, we
present some descriptive findings about the share of children who still attend school because
they are the children of key workers or require special education. This variable also shows
children who do not attend school and do not receive schooling material from school for
home learning, and children who are not at school and receive schooling material from
school. We cross-tabulated these groups of students with eligibility for free school meals
(Table 2) and with parental ethnic background (Table 3) to look for selection in the
dependent variable.
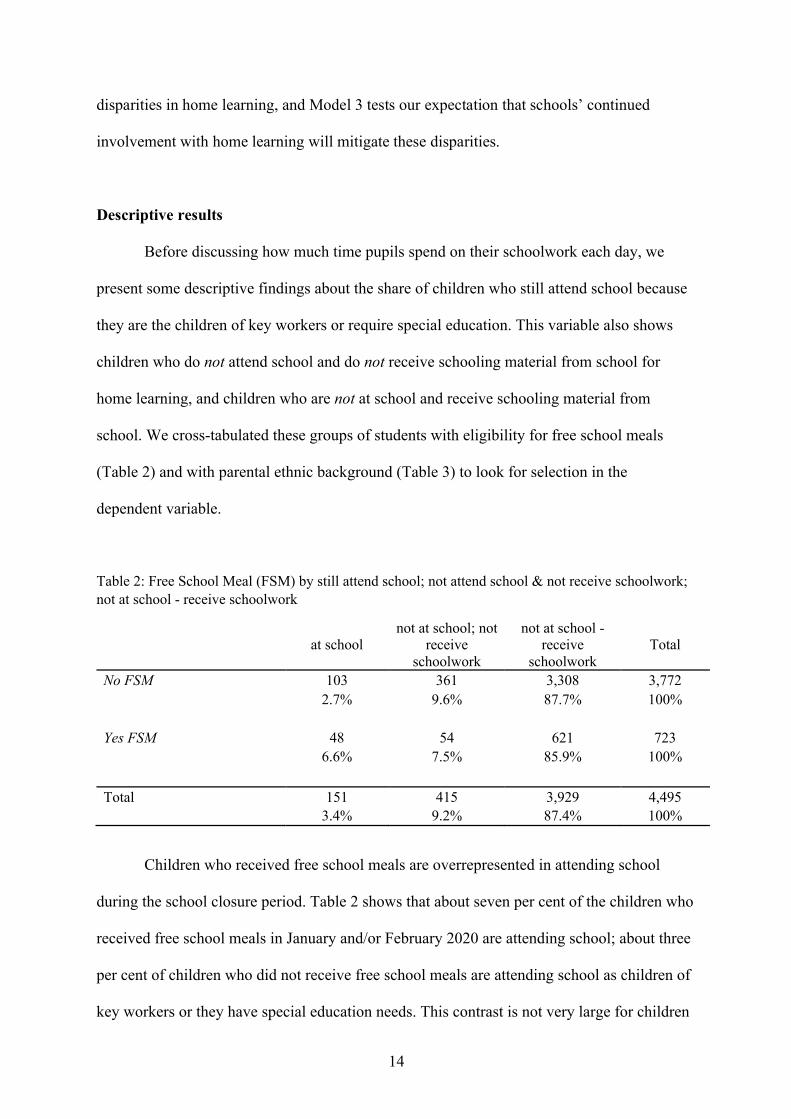
Table 2: Free School Meal (FSM) by still attend school; not attend school & not receive schoolwork; not at school - receive schoolwork
at school not at school; not
receive schoolwork
not at school - receive
schoolwork Total
No FSM 103 361 3,308 3,772
2.7% 9.6% 87.7% 100%
Yes FSM 48 54 621 723
6.6% 7.5% 85.9% 100%
Total 151 415 3,929 4,495 3.4% 9.2% 87.4% 100%
Children who received free school meals are overrepresented in attending school
during the school closure period. Table 2 shows that about seven per cent of the children who
received free school meals in January and/or February 2020 are attending school; about three
per cent of children who did not receive free school meals are attending school as children of
key workers or they have special education needs. This contrast is not very large for children
15
who are not attending school and not receiving distance learning provision; those who
received free meals represent 7.5 per cent and those who did not represent 9.6 per cent.
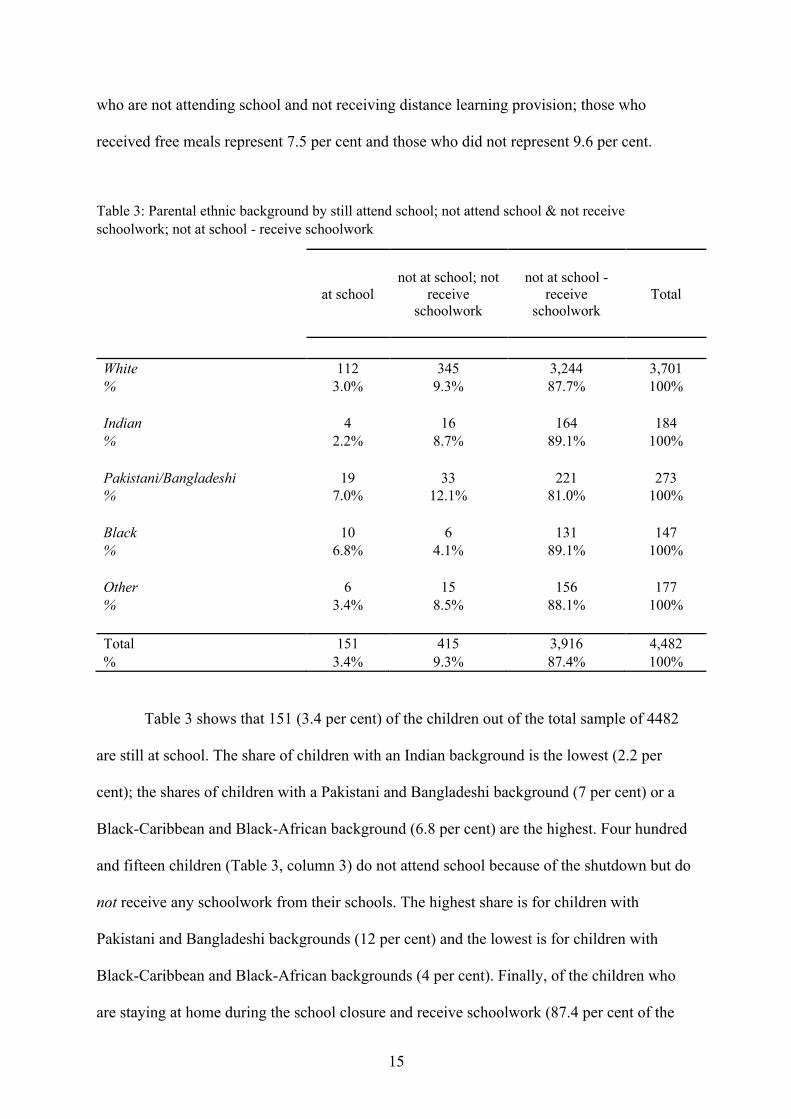
Table 3: Parental ethnic background by still attend school; not attend school & not receive schoolwork; not at school - receive schoolwork
at school not at school; not
receive schoolwork
not at school - receive
schoolwork Total
White 112 345 3,244 3,701 % 3.0% 9.3% 87.7% 100%
Indian 4 16 164 184 % 2.2% 8.7% 89.1% 100%
Pakistani/Bangladeshi 19 33 221 273 % 7.0% 12.1% 81.0% 100%
Black 10 6 131 147 % 6.8% 4.1% 89.1% 100%
Other 6 15 156 177 % 3.4% 8.5% 88.1% 100%
Total 151 415 3,916 4,482 % 3.4% 9.3% 87.4% 100%
Table 3 shows that 151 (3.4 per cent) of the children out of the total sample of 4482
are still at school. The share of children with an Indian background is the lowest (2.2 per
cent); the shares of children with a Pakistani and Bangladeshi background (7 per cent) or a
Black-Caribbean and Black-African background (6.8 per cent) are the highest. Four hundred
and fifteen children (Table 3, column 3) do not attend school because of the shutdown but do
not receive any schoolwork from their schools. The highest share is for children with
Pakistani and Bangladeshi backgrounds (12 per cent) and the lowest is for children with
Black-Caribbean and Black-African backgrounds (4 per cent). Finally, of the children who
are staying at home during the school closure and receive schoolwork (87.4 per cent of the
16
total), Pakistani and Bangladeshi students represent the lowest share (81 per cent). There are
minor differences between White, Black-Caribbean and Black-African, Indian and Other
ethnic groups. These tables show that the most affected children are those with Pakistani and
Bangladeshi backgrounds in all categories.
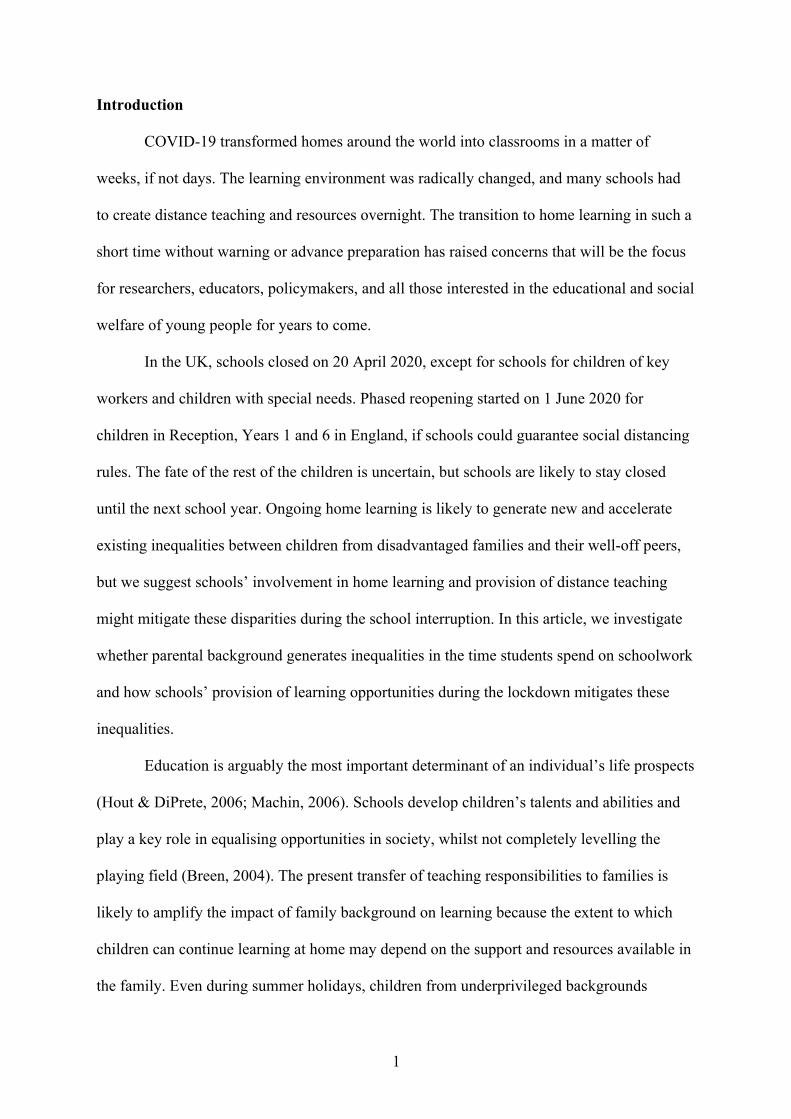
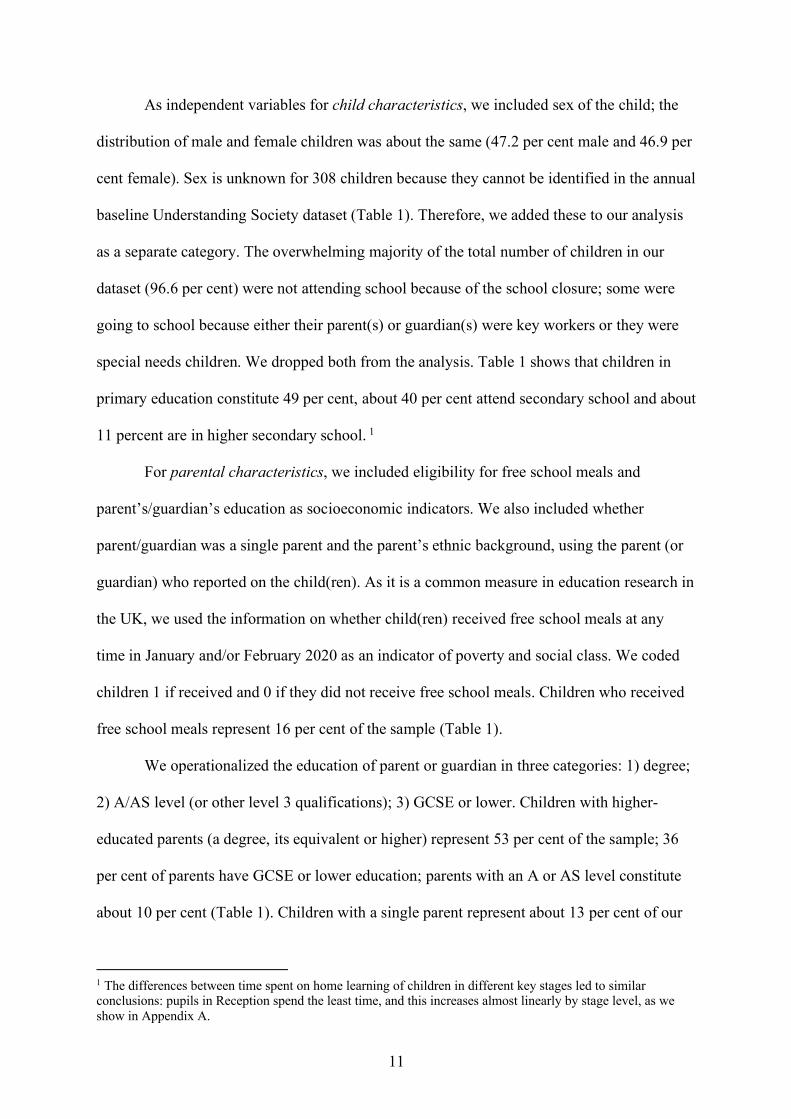
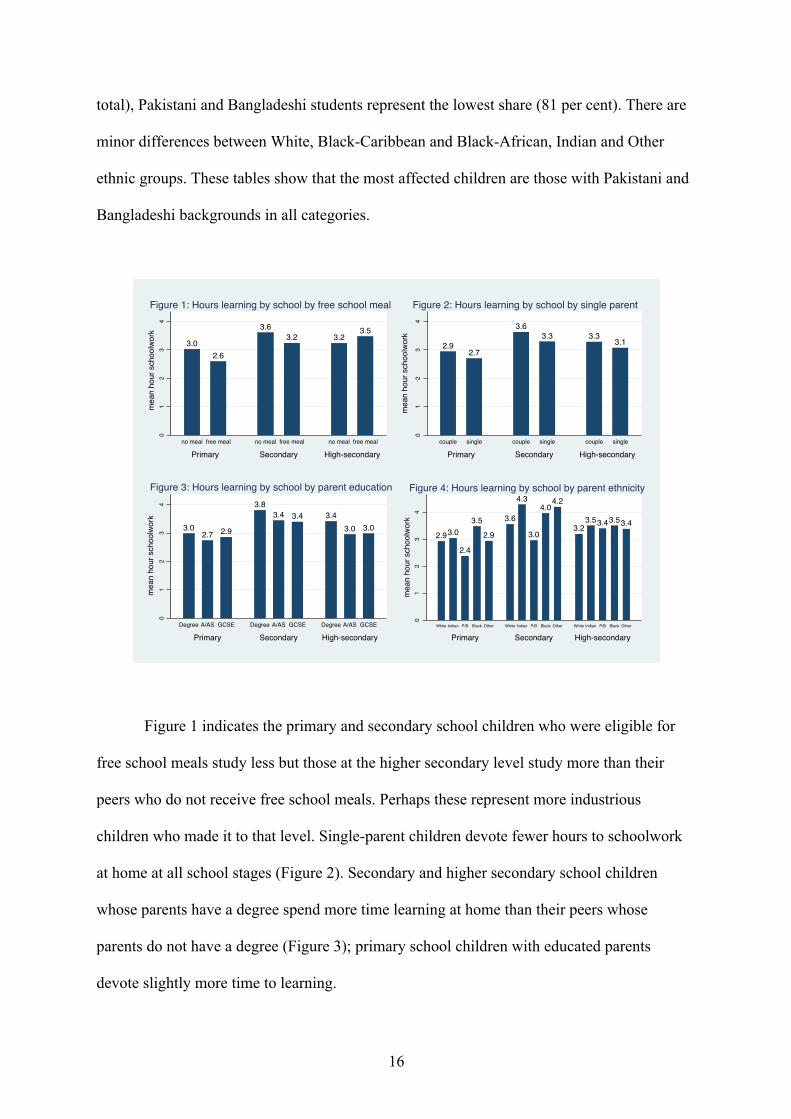
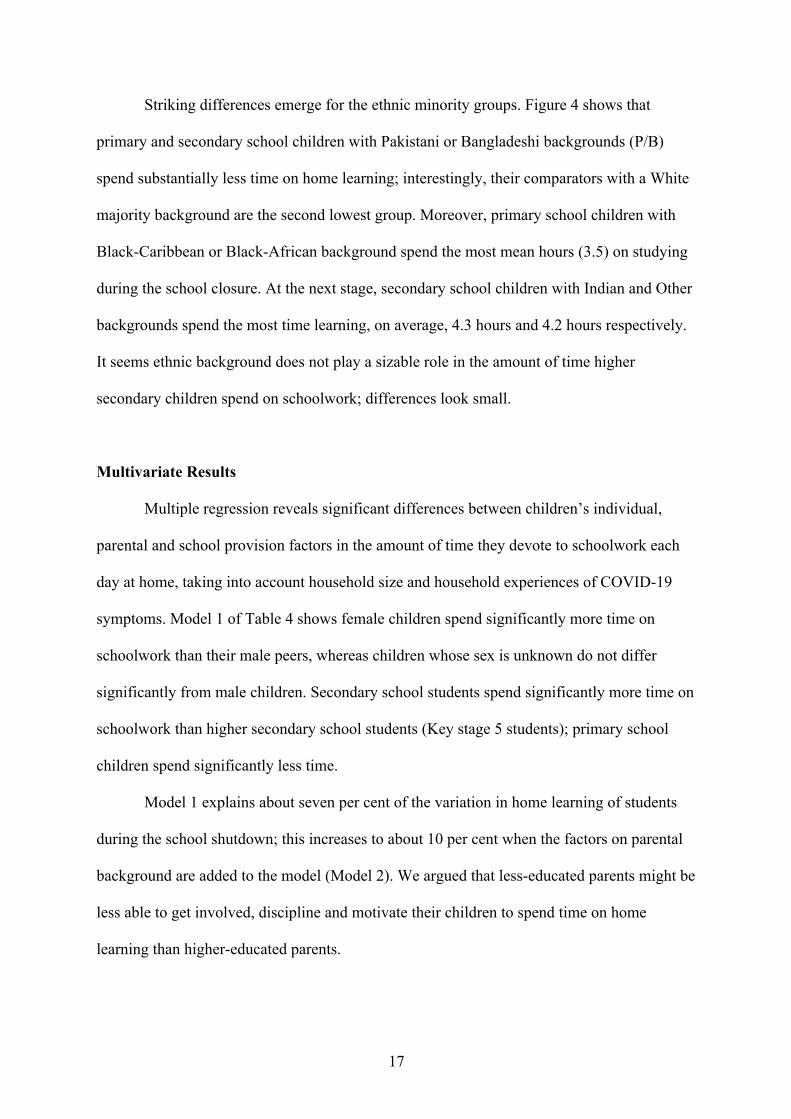
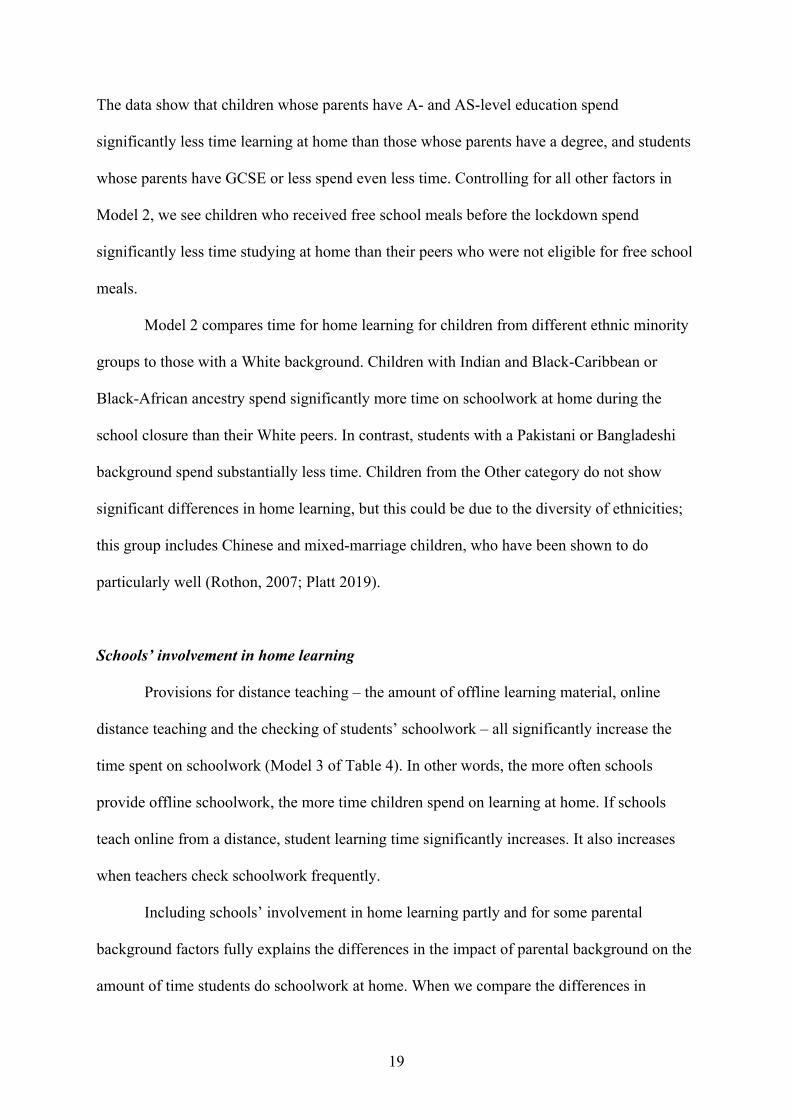
Figure 1 indicates the primary and secondary school children who were eligible for
free school meals study less but those at the higher secondary level study more than their
peers who do not receive free school meals. Perhaps these represent more industrious
children who made it to that level. Single-parent children devote fewer hours to schoolwork
at home at all school stages (Figure 2). Secondary and higher secondary school children
whose parents have a degree spend more time learning at home than their peers whose
parents do not have a degree (Figure 3); primary school children with educated parents
devote slightly more time to learning.
3.02.6
3.63.2 3.2
3.5
01
23
4m
ean
hour
sch
oolw
ork
Primary Secondary High-secondaryno meal free meal no meal free meal no meal free meal
Figure 1: Hours learning by school by free school meal
2.92.7
3.63.3 3.3
3.1
01
23
4
mea
n ho
ur s
choo
lwor
k
Primary Secondary High-secondarycouple single couple single couple single
Figure 2: Hours learning by school by single parent
3.02.7 2.9
3.83.4 3.4 3.4
3.0 3.0
01
23
4m
ean
hour
sch
oolw
ork
Primary Secondary High-secondaryDegree A/AS GCSE Degree A/AS GCSE Degree A/AS GCSE
Figure 3: Hours learning by school by parent education
2.93.0
2.4
3.5
2.9
3.6
4.3
3.0
4.04.2
3.23.53.43.53.4
01
23
4m
ean
hour
sch
oolw
ork
Primary Secondary High-secondaryWhite Indian P/B Black Other White Indian P/B Black Other White Indian P/B Black Other
Figure 4: Hours learning by school by parent ethnicity
17
Striking differences emerge for the ethnic minority groups. Figure 4 shows that
primary and secondary school children with Pakistani or Bangladeshi backgrounds (P/B)
spend substantially less time on home learning; interestingly, their comparators with a White
majority background are the second lowest group. Moreover, primary school children with
Black-Caribbean or Black-African background spend the most mean hours (3.5) on studying
during the school closure. At the next stage, secondary school children with Indian and Other
backgrounds spend the most time learning, on average, 4.3 hours and 4.2 hours respectively.
It seems ethnic background does not play a sizable role in the amount of time higher
secondary children spend on schoolwork; differences look small.
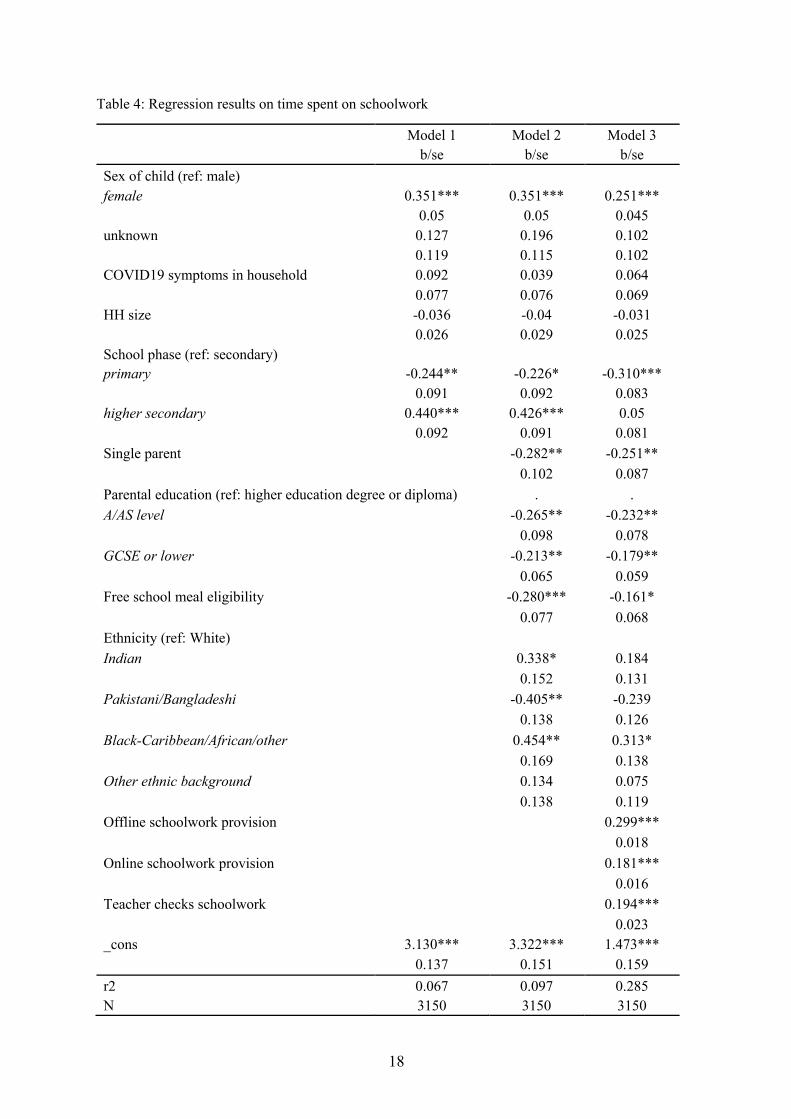
Multivariate Results
Multiple regression reveals significant differences between children’s individual,
parental and school provision factors in the amount of time they devote to schoolwork each
day at home, taking into account household size and household experiences of COVID-19
symptoms. Model 1 of Table 4 shows female children spend significantly more time on
schoolwork than their male peers, whereas children whose sex is unknown do not differ
significantly from male children. Secondary school students spend significantly more time on
schoolwork than higher secondary school students (Key stage 5 students); primary school
children spend significantly less time.
Model 1 explains about seven per cent of the variation in home learning of students
during the school shutdown; this increases to about 10 per cent when the factors on parental
background are added to the model (Model 2). We argued that less-educated parents might be
less able to get involved, discipline and motivate their children to spend time on home
learning than higher-educated parents.
18
Table 4: Regression results on time spent on schoolwork
Model 1 Model 2 Model 3 b/se b/se b/se
Sex of child (ref: male) female 0.351*** 0.351*** 0.251***
0.05 0.05 0.045 unknown 0.127 0.196 0.102
0.119 0.115 0.102 COVID19 symptoms in household 0.092 0.039 0.064
0.077 0.076 0.069 HH size -0.036 -0.04 -0.031
0.026 0.029 0.025 School phase (ref: secondary)
primary -0.244** -0.226* -0.310***
0.091 0.092 0.083 higher secondary 0.440*** 0.426*** 0.05
0.092 0.091 0.081 Single parent -0.282** -0.251**
0.102 0.087
Parental education (ref: higher education degree or diploma) . . A/AS level -0.265** -0.232**
0.098 0.078 GCSE or lower -0.213** -0.179**
0.065 0.059 Free school meal eligibility -0.280*** -0.161*
0.077 0.068 Ethnicity (ref: White) Indian 0.338* 0.184
0.152 0.131 Pakistani/Bangladeshi -0.405** -0.239
0.138 0.126
Black-Caribbean/African/other 0.454** 0.313*
0.169 0.138 Other ethnic background 0.134 0.075
0.138 0.119 Offline schoolwork provision 0.299***
0.018
Online schoolwork provision 0.181***
0.016 Teacher checks schoolwork
0.194***
0.023 _cons 3.130*** 3.322*** 1.473***
0.137 0.151 0.159
r2 0.067 0.097 0.285 N 3150 3150 3150
19
The data show that children whose parents have A- and AS-level education spend
significantly less time learning at home than those whose parents have a degree, and students
whose parents have GCSE or less spend even less time. Controlling for all other factors in
Model 2, we see children who received free school meals before the lockdown spend
significantly less time studying at home than their peers who were not eligible for free school
meals.
Model 2 compares time for home learning for children from different ethnic minority
groups to those with a White background. Children with Indian and Black-Caribbean or
Black-African ancestry spend significantly more time on schoolwork at home during the
school closure than their White peers. In contrast, students with a Pakistani or Bangladeshi
background spend substantially less time. Children from the Other category do not show
significant differences in home learning, but this could be due to the diversity of ethnicities;
this group includes Chinese and mixed-marriage children, who have been shown to do
particularly well (Rothon, 2007; Platt 2019).
Schools’ involvement in home learning
Provisions for distance teaching – the amount of offline learning material, online
distance teaching and the checking of students’ schoolwork – all significantly increase the
time spent on schoolwork (Model 3 of Table 4). In other words, the more often schools
provide offline schoolwork, the more time children spend on learning at home. If schools
teach online from a distance, student learning time significantly increases. It also increases
when teachers check schoolwork frequently.
Including schools’ involvement in home learning partly and for some parental
background factors fully explains the differences in the impact of parental background on the
amount of time students do schoolwork at home. When we compare the differences in
20
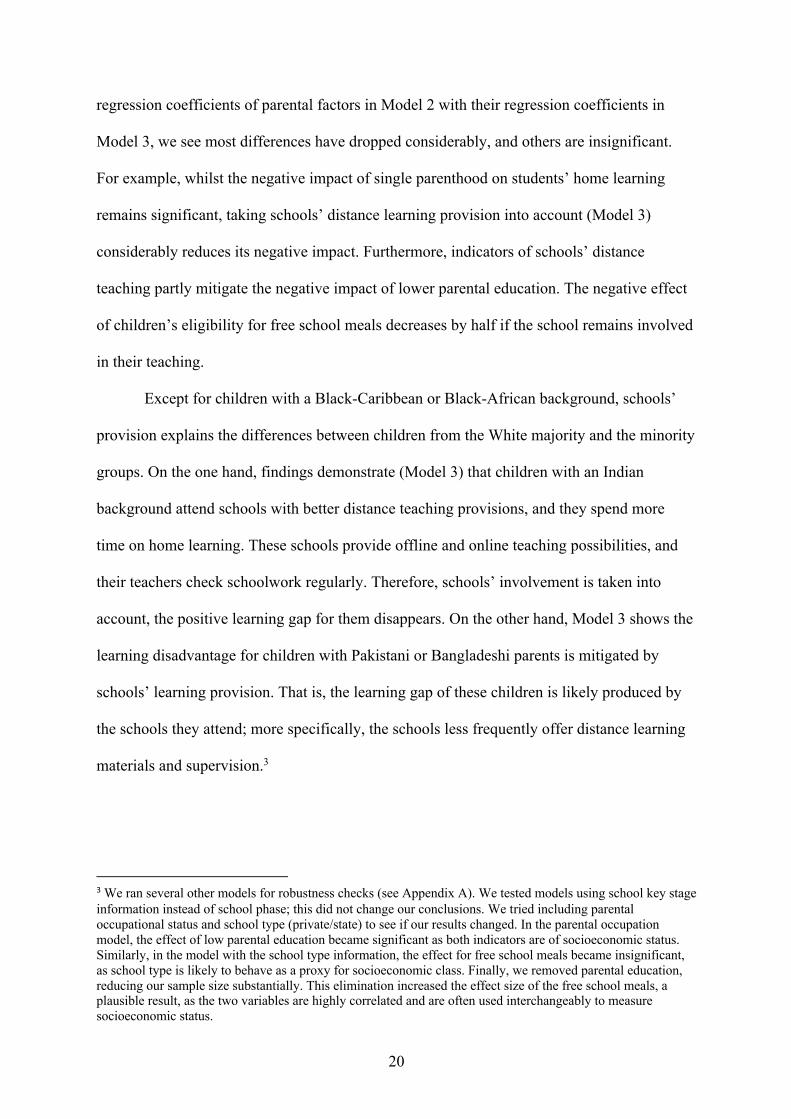
regression coefficients of parental factors in Model 2 with their regression coefficients in
Model 3, we see most differences have dropped considerably, and others are insignificant.
For example, whilst the negative impact of single parenthood on students’ home learning
remains significant, taking schools’ distance learning provision into account (Model 3)
considerably reduces its negative impact. Furthermore, indicators of schools’ distance
teaching partly mitigate the negative impact of lower parental education. The negative effect
of children’s eligibility for free school meals decreases by half if the school remains involved
in their teaching.
Except for children with a Black-Caribbean or Black-African background, schools’
provision explains the differences between children from the White majority and the minority
groups. On the one hand, findings demonstrate (Model 3) that children with an Indian
background attend schools with better distance teaching provisions, and they spend more
time on home learning. These schools provide offline and online teaching possibilities, and
their teachers check schoolwork regularly. Therefore, schools’ involvement is taken into
account, the positive learning gap for them disappears. On the other hand, Model 3 shows the
learning disadvantage for children with Pakistani or Bangladeshi parents is mitigated by
schools’ learning provision. That is, the learning gap of these children is likely produced by
the schools they attend; more specifically, the schools less frequently offer distance learning
materials and supervision.3
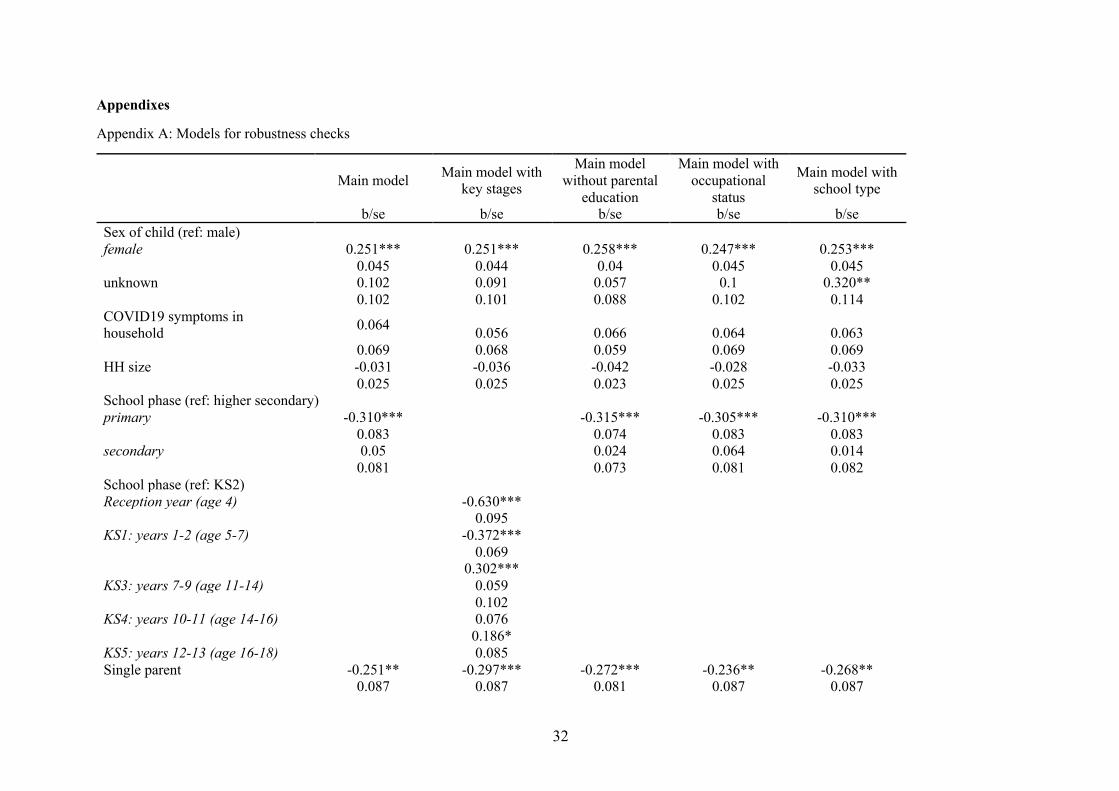
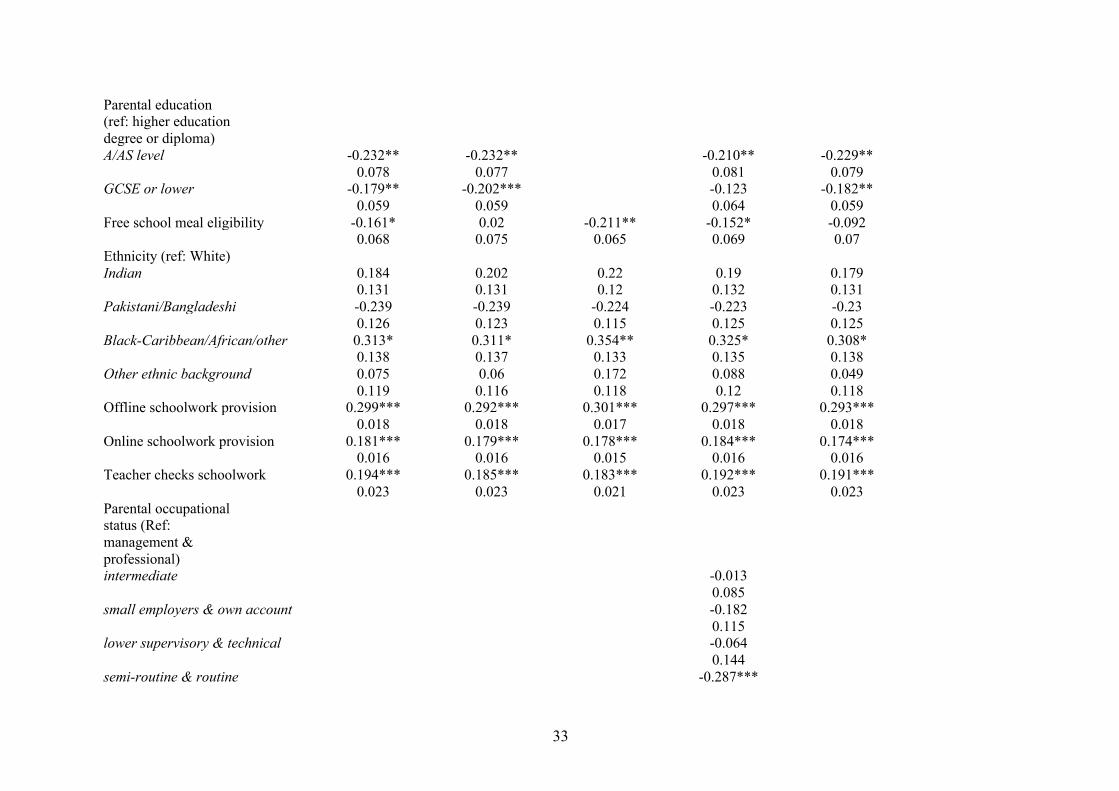
3 We ran several other models for robustness checks (see Appendix A). We tested models using school key stage information instead of school phase; this did not change our conclusions. We tried including parental occupational status and school type (private/state) to see if our results changed. In the parental occupation model, the effect of low parental education became significant as both indicators are of socioeconomic status. Similarly, in the model with the school type information, the effect for free school meals became insignificant, as school type is likely to behave as a proxy for socioeconomic class. Finally, we removed parental education, reducing our sample size substantially. This elimination increased the effect size of the free school meals, a plausible result, as the two variables are highly correlated and are often used interchangeably to measure socioeconomic status.
21
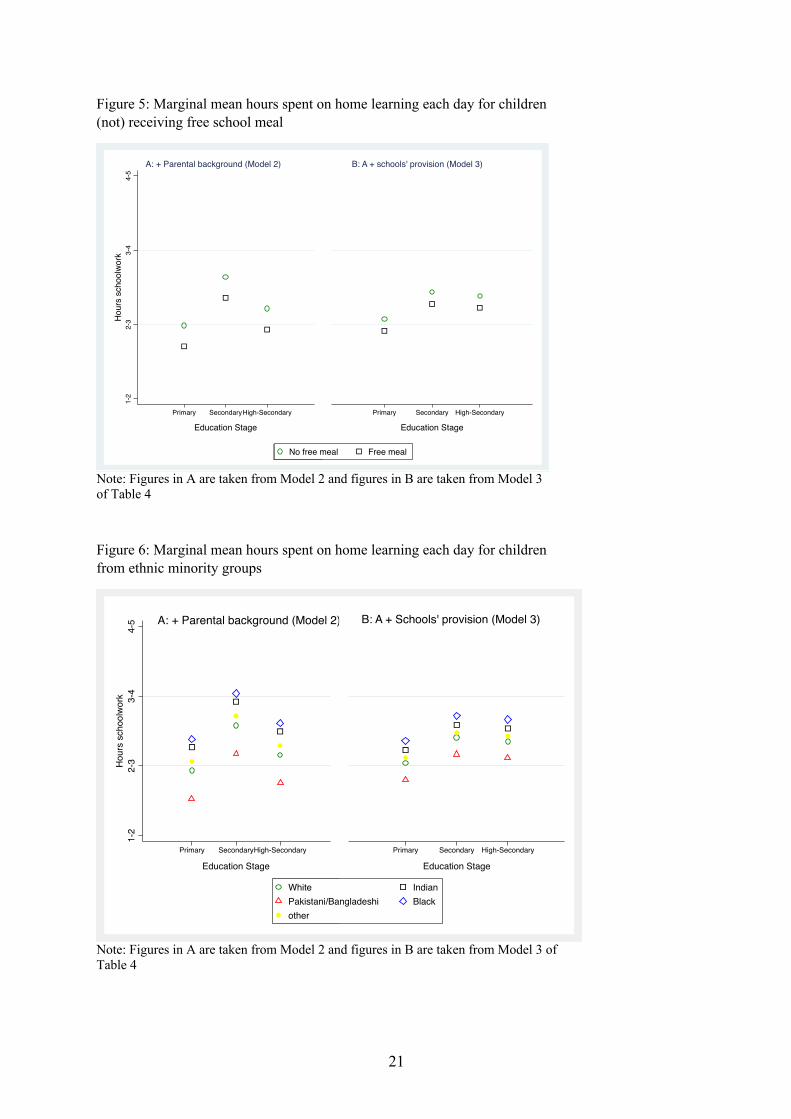
Figure 5: Marginal mean hours spent on home learning each day for children (not) receiving free school meal
Note: Figures in A are taken from Model 2 and figures in B are taken from Model 3 of Table 4
Figure 6: Marginal mean hours spent on home learning each day for children from ethnic minority groups
Note: Figures in A are taken from Model 2 and figures in B are taken from Model 3 of Table 4
1-2
2-3
3-4
4-5
Hou
rs s
choo
lwor
k
Primary SecondaryHigh-Secondary
Education Stage
No free meal Free meal
A: + Parental background (Model 2)
Primary Secondary High-Secondary
Education Stage
No free meal Free meal
B: A + schools' provision (Model 3)
1-2
2-3
3-4
4-5
Hou
rs s
choo
lwor
k
Primary SecondaryHigh-Secondary
Education Stage
White IndianPakistani/Bangladeshi Blackother
A: + Parental background (Model 2)
Primary Secondary High-Secondary
Education Stage
White IndianPakistani/Bangladeshi Blackother
B: A + Schools' provision (Model 3)
22
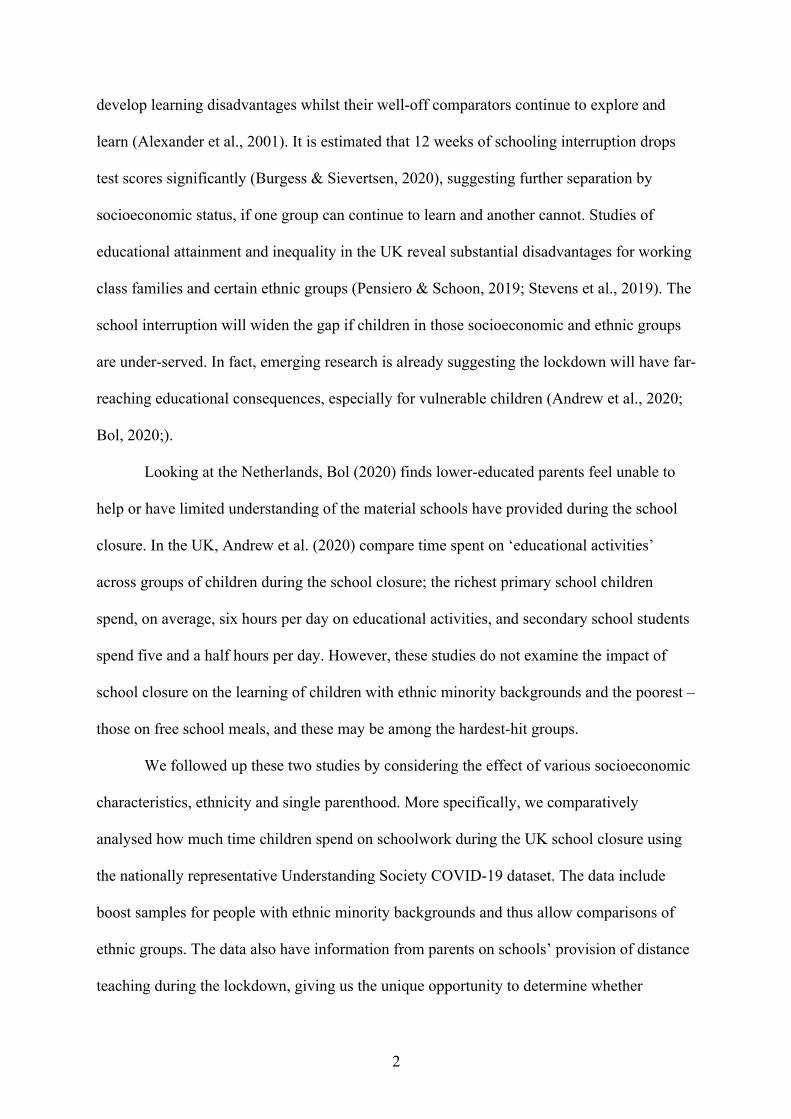
Figure 5 visualizes the study time of the children in primary, secondary and higher
secondary education who received free school meals in early 2020 and those who did not.
Part A shows the marginal mean study hours for the different groups without school
provision factors in the model (taken from Model 2 of Table 4). Part B shows the distances
between groups after taking those factors into account (Model 3). As the figure shows, the
home learning gap between students who did and did not receive free school meals decreases
considerably when schools’ distance teaching provisions are taken into account.
Figure 6 shows the study time of children with different ethnic backgrounds. Again,
Part A shows marginal mean study hours without schools’ distance teaching provisions in the
model (taken from Model 2 of Table 4), and Part B includes those factors (Model 3). As the
figure indicates, schools’ involvement in home learning substantially reduces differences
based on ethnicity, supporting our expectation that schools mitigate educational inequalities
generated by family backgrounds.
Model 3 greatly increases the explanatory power of the variance in students’ home
learning time. Children’s individual and parental characteristics and indicators for schools’
involvement in home learning explain about 29 per cent of the variation.4 The schools’
provisions of distance learning explains the largest share (about 19 per cent), and parental
background explains the smallest share (2 per cent) of variance in time spent on home
learning during lockdown, showing the major role of schools in pupils’ learning during the
lockdown.
4 We checked which school provisions explained most of the variance by including these variables one by one in the model. Providing offline schoolwork material explained 19 per cent, teachers checking schoolwork explained 16 per cent and providing online teaching explained 15 per cent of the variance. Schools’ provision of offline material and checking schoolwork explained 25 per cent, and these explained the lag for children with Pakistani/Bangladeshi heritage.
23
Discussion and conclusions
We asked whether family characteristics and schools’ distance teaching provision are
related to the amount of time students spend on home learning during the COVID-19
shutdown. We argued that children previously eligible for free school meals, children with
lower-educated or single parents and children belonging to certain ethnic minority groups
would be more disadvantaged because of the school interruption. We measured disadvantage
by looking at the amount of time spent on schoolwork at home. We suggested that close
involvement of schools in teaching their students at a distance will mitigate inequalities and
learning losses.
To probe our expectations, we used the special COVID-19 wave of the nationally
representative Understanding Society data, as its first wave, fielded during the school closure
period in April 2020, included a home schooling module. Our findings show children who
receive schoolwork from their school spend, on average, 3.2 hours a day on home learning,
but there are differences, based on the children’s social and family background. First,
children who received free school meals in January and February and those with Pakistani,
Bangladeshi, Black-African and Black-Caribbean heritage are overrepresented among those
who are still attending school during the lockdown, apparently because of their parents’ jobs
as key workers. Second, although the majority of children are receiving instructions,
materials and distance teaching from their schools, children with Pakistani or Bangladeshi
backgrounds are overrepresented among those who are not receiving any distance teaching.
The data support our expectation that children eligible for free school meals, those
with lower-educated parents and those in single parent families will spend less time in home
learning than their peers. They also support our ethnicity hypothesis, in that students with a
Pakistani or Bangladeshi background spend the lowest number of hours on schoolwork.
Although children with an Indian heritage do significantly more schoolwork, this is in line
24
with previous research on ethnic differences in educational attainment in the UK (Rothon,
2007). As there are proportionally more children with Pakistani or Bangladeshi backgrounds
who are in school but do not receive any schoolwork, the extent of disadvantage these
children experience might be even larger than our estimations. A remarkable result is that
children with Black-Caribbean or Black-African heritage spend the most average hours on
schoolwork across all ethnic groups and education stages. This may come as a surprise to
some, as their educational attainment is lower than their White and Indian peers (Richardson
et al., 2020). This difference could potentially be explained by the high aspirations of these
ethnic minority parents, but more research is needed to explain how parents and students’
aspirations affect home learning or to look for other possible drivers of the difference.
Schools are often considered the engines of social mobility, and, as such, they may
moderate the impact of family background on educational attainment and life prospects.
Acting on this understanding, we investigated the relations between schools’ provision of
distance teaching and the extent of children’s engagement with their schoolwork during the
lockdown. We expected that schools’ continued involvement with children’s learning would
mitigate the impact of school interruption. Our hypothesis was substantiated, in that schools’
online and offline distance teaching and homework checking significantly increases
children’s time on home learning. Schools’ distance teaching provisions explain the largest
part of the variation in children’s home learning whereas parental background constituted the
lowest share in this, demonstrating the crucial role of schools in motivating and facilitating
children’s learning.
Moreover, we found the indicators of schools’ distance teaching provisions moderate
the disparities generated by parental and ethnic backgrounds, albeit with some differences.
School provision explains the scarring impact of the shutdown on children with Pakistani or
Bangladeshi backgrounds but partly explains the substantially higher hours of home learning
25
of Black-Caribbean or Black-African children. That is, it is not ethnicity that makes Pakistani
or Bangladeshi children study less each day; rather, their schools are less involved in ongoing
learning. These schools may have fewer resources, or they may be in areas more affected by
the pandemic. Future research should consider these and other possibilities. Nevertheless, the
local and national authorities should invest in these schools in order to close the substantial
learning gap their pupils developed during the school interruption. Furthermore, our results
suggest schools should also be prepared to provide distance teaching during school
interruptions, not just now but in the future, to prevent learning losses and widening social
inequalities for the most vulnerable children.
Of course, spending more time on schoolwork may facilitate learning, but it does not
necessarily equate to learning. Children who are spending time on home learning but who
lack proper resources, such as a quiet space to study and parental guidance, will likely learn
less, even if they spend more time on schoolwork. Future research should investigate how
home learning happens, and how resources – a computer, a study space, online and offline
learning material etc. – interact with the time spent on schoolwork. Future work should also
focus on the consequences of home learning during the COVID-19 pandemic, looking for
learning gaps in test results in the years to come. Finally, as schools have remained open for a
considerable number of children of key workers, their learning should be followed over time
as well, to see if they have advantages over the home-schooled.
Our research makes two important contributions to the literature with strong
implications for policy development. First, education has been most disrupted for children
with Pakistani or Bangladeshi heritage and children who received free school meals before
lockdown. Second, schools can mitigate the impact of a long-term school lockdown and the
subsequent negative effect on learning if they can provide distance learning.
26
References
Alexander, K. L., Entwisle, D.R., & Olson, L.S. (2001). Schools, achievement, and
inequality: A seasonal perspective. Educational Evaluation and Policy Analysis, 23,
171-191.
Allen, R., & Sims, S. (2018). Teacher education and the challenge of development: A global
analysis. London: Routledge.
Andrew, A., Cattan, S., Costa-Dias, M., Farquharson, C., Kraftman, L., Krutikova, S.,
Phimister, A., & Sevilla, A. (2020). Learning during the lockdown: Real-time data on
children’s experiences during home learning. London: Institute for Fiscal Studies.
Bayrakdar, S., & Guveli, A. (2020). Understanding the benefits of migration:
multigenerational transmission, gender and educational outcomes of Turks in Europe.
Journal of Ethnic and Migration Studies.
https://doi.org/10.1080/1369183X.2020.1736531
Benzeval, M., Bollinger, C.R., Burton, J., Crossley, T.F., & Lynn, P. (2020). The
representativeness of Understanding Society. ISER Working Papers 2020-08.
Blau, P. M., & Duncan O. D. (1967). The American occupational structure. New York: Free
Press.
Bol, T. (2020). Inequality in homeschooling during the Corona crisis in the Netherlands. First
results from the LISS Panel. https://osf.io/preprints/socarxiv/hf32q
Boonk, L., Gijselaers, H. J., Ritzen, H., & Brand-Gruwel, S. (2018). A review of the
relationship between parental involvement indicators and academic achievement.
Educational Research Review, 24, 10-30.
Borman, G., & Dowling, D. (2010). Schools and inequality: A multilevel analysis of
Coleman's equality of educational opportunity data. Teachers College Record, 112(5),
1201-1246.
27
Brynin, M., & Guveli, A. (2012). Understanding the ethnic pay gap in Britain. Work,
Employment and Society, 26(4), 574-587.
Breen, R. (Ed.). (2004). Social mobility in Europe. Oxford: Oxford University Press.
Brown, N., Te Riele, K., Shelley, B., & Woodroffe, J. (2020). Learning at home during
COVID-19: Effects on vulnerable young Australians. Independent Rapid Response
Report. Hobart: University of Tasmania, Peter Underwood Centre for Educational
Attainment.
Bukodi, E., & Goldthorpe, J. H. (2013). Decomposing ‘social origins’: The effects of parents’
class, status, and education on the educational attainment of their children. European
Sociological Review, 29(5), 1024-1039.
Burgess, S., & Sievertsen, H. H. (2020), “Schools, skills, and learning: The impact of
COVID-19 on education”, VoxEu.org, 1 April.
Calarco, J. (2018). Negotiating opportunities: How the middle class secures advantages in
school. Oxford University Press.
Coleman, J. S., Campbell, E., Hobson, C., McPartland, J., Mood, A., & Weinfeld, F. (1966).
Equality of educational opportunity study. Washington, DC: United States
Department of Health, Education, and Welfare.
Cooper, K., & Stewart, K. (2013). Does money affect children’s outcomes? A systematic
review. York: Joseph Rowntree Foundation. https://www.jrf.org.uk/report/does-
money-affect-children%E2%80%99s-outcomes
Cullinane, C., & Montacute, R. (2020). Research Brief: April 2020: COVID-19 and Social
Mobility Impact Brief# 1: School Shutdown. Available at:
https://dera.ioe.ac.uk/35356/1/COVID-19-Impact-Brief-School-Shutdown.pdf
[Accessed: 21/06/2020]
28
DfBEIS (Department for Business, Energy and Industrial Strategy). (2018). The UK’s
industrial strategy. https://www.gov.uk/government/topical-events/the-uks-industrial-
strategy
DfE (Department for Education). (2015). A compendium of evidence on ethnic minority
resilience to the effects of deprivation on attainment. Research Report. National
Institute of Economic and Social Research.
Erikson, R., & Goldthorpe, J. H. (2010). Has social mobility in Britain decreased?
Reconciling divergent findings on income and class mobility. The British Journal of
Sociology, 61(2), 211-230.
Fisher, P., Fumagalli, L., Buck, N., & Avram, S. (2019). Understanding society and its
income data. ISER Working Papers (2019-08).
Gillborn, G. (2008). Racism and education: Coincidence or conspiracy? London: Routledge.
Guveli, A. (2006). Adjusting the EGP class schema for the technocrats and the social and
cultural specialists. Dissertation, Radboud University Nijmegen.
Guveli, A., Luijkx, R., & Ganzeboom, H. B. (2012). Patterns of intergenerational mobility of
the old and new middle classes in a post-industrial society: Netherlands 1970–
2006. Social Science Research, 41(2), 224-241.
Heath, A. F., & Clifford, P. (1990). Class inequalities in education in the twentieth
century. Journal of the Royal Statistical Society: Series A (Statistics in
Society), 153(1), 1-16.
Heath, A. & Birnbaum, Y. (2007). Guest editorial: Explaining ethnic inequalities in
educational attainment. Ethnicities, 7, 291–304.
Hobbs, G. (2016). Explaining social class inequalities in educational achievement in the UK:
quantifying the contribution of social class differences in school
‘effectiveness’. Oxford Review of Education, 42(1), 16-35.
29
Hout, M., & DiPrete, T. A. (2006). What we have learned: RC28's contributions to
knowledge about social stratification. Research in Social Stratification and
Mobility, 24(1), 1-20.
Hutchinson, J., Boneti, S., Crenna-Jennings, W., & Akhal, A. (2019). Education in England:
Annual Report 2019. Education Policy Institute.
Lareau, A. (2011). Unequal childhoods: Class, race, and family life. University of California
Press.
Lee, J-S., & Bowen, N.K. (2006). Parent involvement, cultural capital, and the achievement
gap among elementary school children. American Educational Research Journal,
43(2)
Levačić, R., & Vignoles, A. (2002). Researching the links between school resources and
student outcomes in the UK: A review of Issues and evidence. Education Economics,
10(3), 313-331. DOI: 10.1080/09645290210127534
Machin, S. (2006). Social disadvantage and education experiences. OECD Social,
Employment and Migration Working Papers, No. 32. Paris: OECD Publishing.
https://doi.org/10.1787/715165322333
Morgan, S. L., Grusky, D. B., & Fields, G. S. (2006). Mobility and inequality: frontiers of
research in sociology and economics. Stanford University Press.
OECD. (2013). PISA 2012 Results: Excellence through equity (Volume II): Giving every
student the chance to succeed. Paris: PISA, OECD Publishing.
https://doi.org/10.1787/9789264201132-en
Oreopoulos, P., & Salvanes, K. G. (2010). How large are returns to education? Hint: money
isn’t everything. Journal of Economic Perspectives, 25(1), 159-184.
30
Pensiero, N., & Schoon, I. (2019). Social inequalities in educational attainment: The
changing impact of parents' social class, social status, education and family income,
England 1986 and 2010. Longitudinal and Life Course Studies, 10(1), 87-108.
Perryman, J., Ball, S., Maguire, M., & Braun, A. (2011). Life in the pressure cooker: School
league tables and English and mathematics teachers’ responses to accountability in a
results-driven era. British Journal of Educational Studies, 59(2), 179-195.
Platt, L. (2019). Understanding inequalities: Stratification and difference. John Wiley &
Sons.
Platt, L. and Warwick, R. (2020). Are some ethnic groups more vulnerable to COVID-19
than others? IFS Deacon Review. https://www.ifs.org.uk/inequality/are-some-ethnic-
groups-more-vulnerable-to-covid-19-than-others/
Rivkin, S. G., Hanushek, E. A., & Kain, J. F. (2005). Teachers, schools, and academic
achievement. Econometrica, 73(2), 417-458.
Richardson, J. T., Mittelmeier, J., & Rienties, B. (2020). The role of gender, social class and
ethnicity in participation and academic attainment in UK higher education: an update.
Oxford Review of Education, 46(3), 346-362.
Roemer, J.E., 1998. Equality of opportunity. Harvard University Press.
Rothon, C. (2007). Can achievement differentials be explained by social class alone? An
examination of minority ethnic educational performance in England and Wales at the
end of compulsory schooling. Ethnicities, 7(3), 306-322.
Social Mobility Commission. (2019). State of the nation 2018-2019: Social mobility in Great
Britain. London: Social Mobility Commission.
Steele, F., Vignoles, A., & Jenkins, A. (2007). The effect of school resources on pupil
attainment: A multilevel simultaneous equation modelling approach. Journal of the
Royal Statistical Society: Series A (Statistics in Society), 170(3), 801-824.
31
Stevens, P. A., Mau, A., & Crozier, G. (2019). England: Critical perspectives on the role of
schools in developing race/ethnic inequalities. In P. Stevens & A. Dworkin (Eds.),
The Palgrave handbook of race and ethnic inequalities in education (pp. 421-484).
Palgrave Macmillan.
Sullivan, A., Ketende, S., & Joshi, H. (2013). Social class and inequalities in early cognitive
scores. Sociology, 47(6), 1187-1206.
Understanding Society. (2020). Covid-19 User Guide Version-1.
https://www.understandingsociety.ac.uk/sites/default/files/downloads/documentation/
covid-19/user-guides/covid-19-user-guide.pdf [Accessed 14 June 2020]
UNESCO. (2020). COVID-19 Educational disruption and response.
https://en.unesco.org/covid19/educationresponse [Accessed 14 June 2020]
West, A., & Pennell, H. (2000). Publishing school examination results in England: incentives
and consequences. Educational Studies, 26(4), 423-436.
Zuccotti, C. V., Ganzeboom, H. B., & Guveli, A. (2017). Has migration been beneficial for
migrants and their children? Comparing social mobility of Turks in Western Europe,
Turks in Turkey, and Western European Natives. International Migration
Review, 51(1), 97-126.
32
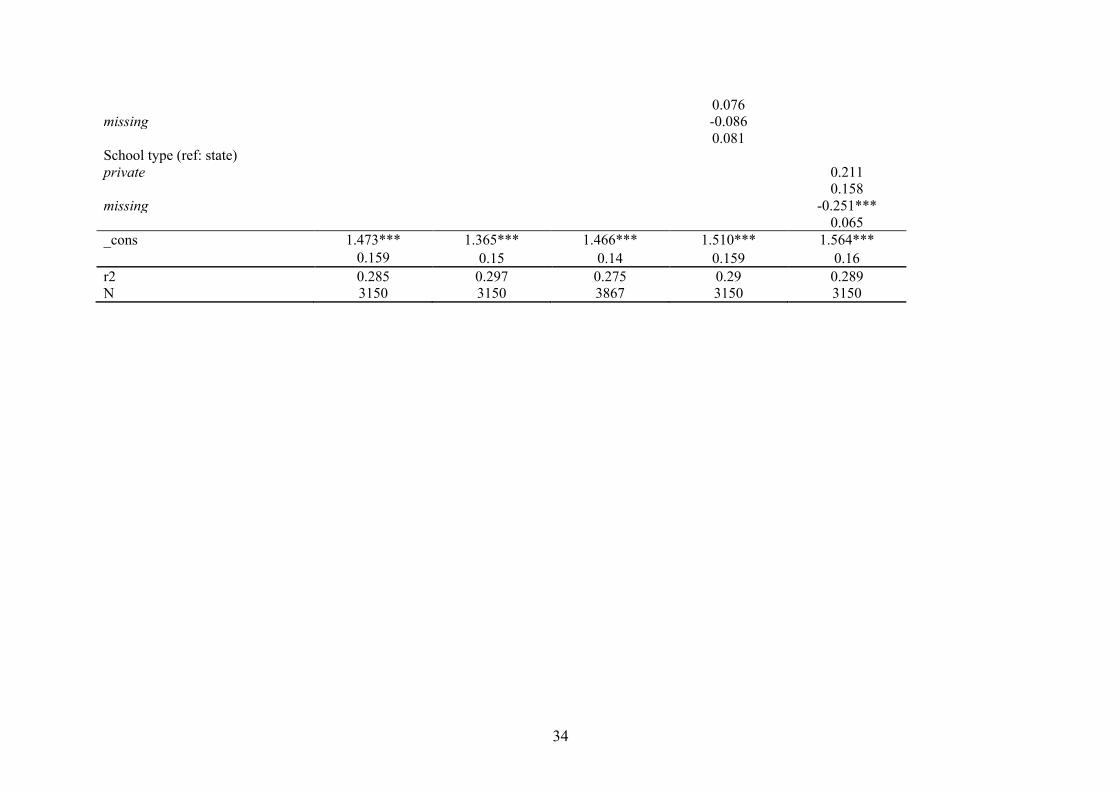
Appendixes
Appendix A: Models for robustness checks
Main model Main model with key stages
Main model without parental
education
Main model with occupational
status
Main model with school type
b/se b/se b/se b/se b/se Sex of child (ref: male) female 0.251*** 0.251*** 0.258*** 0.247*** 0.253***
0.045 0.044 0.04 0.045 0.045 unknown 0.102 0.091 0.057 0.1 0.320**
0.102 0.101 0.088 0.102 0.114 COVID19 symptoms in household 0.064 0.056 0.066 0.064 0.063
0.069 0.068 0.059 0.069 0.069 HH size -0.031 -0.036 -0.042 -0.028 -0.033
0.025 0.025 0.023 0.025 0.025 School phase (ref: higher secondary) primary -0.310*** -0.315*** -0.305*** -0.310***
0.083 0.074 0.083 0.083 secondary 0.05 0.024 0.064 0.014
0.081 0.073 0.081 0.082 School phase (ref: KS2) Reception year (age 4) -0.630***
0.095 KS1: years 1-2 (age 5-7) -0.372***
0.069 0.302***
KS3: years 7-9 (age 11-14) 0.059 0.102
KS4: years 10-11 (age 14-16) 0.076 0.186*
KS5: years 12-13 (age 16-18) 0.085 Single parent -0.251** -0.297*** -0.272*** -0.236** -0.268**
0.087 0.087 0.081 0.087 0.087
33
Parental education (ref: higher education degree or diploma)
A/AS level -0.232** -0.232** -0.210** -0.229**
0.078 0.077 0.081 0.079 GCSE or lower -0.179** -0.202*** -0.123 -0.182**
0.059 0.059 0.064 0.059 Free school meal eligibility -0.161* 0.02 -0.211** -0.152* -0.092
0.068 0.075 0.065 0.069 0.07 Ethnicity (ref: White) Indian 0.184 0.202 0.22 0.19 0.179
0.131 0.131 0.12 0.132 0.131 Pakistani/Bangladeshi -0.239 -0.239 -0.224 -0.223 -0.23
0.126 0.123 0.115 0.125 0.125 Black-Caribbean/African/other 0.313* 0.311* 0.354** 0.325* 0.308*
0.138 0.137 0.133 0.135 0.138 Other ethnic background 0.075 0.06 0.172 0.088 0.049
0.119 0.116 0.118 0.12 0.118 Offline schoolwork provision 0.299*** 0.292*** 0.301*** 0.297*** 0.293***
0.018 0.018 0.017 0.018 0.018 Online schoolwork provision 0.181*** 0.179*** 0.178*** 0.184*** 0.174***
0.016 0.016 0.015 0.016 0.016 Teacher checks schoolwork 0.194*** 0.185*** 0.183*** 0.192*** 0.191***
0.023 0.023 0.021 0.023 0.023 Parental occupational status (Ref: management & professional) intermediate -0.013
0.085 small employers & own account -0.182
0.115 lower supervisory & technical -0.064
0.144 semi-routine & routine -0.287***
34
0.076 missing -0.086
0.081 School type (ref: state) private 0.211
0.158 missing -0.251***
0.065 _cons 1.473*** 1.365*** 1.466*** 1.510*** 1.564*** 0.159 0.15 0.14 0.159 0.16 r2 0.285 0.297 0.275 0.29 0.289 N 3150 3150 3867 3150 3150
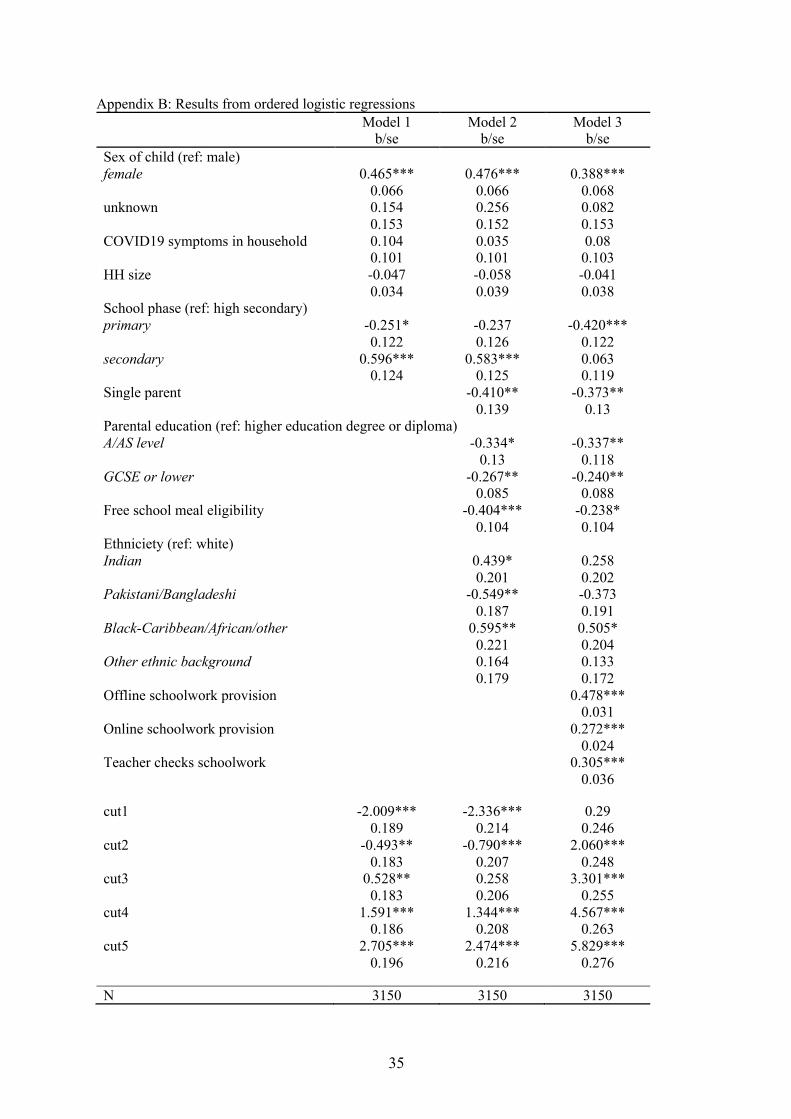
35
Appendix B: Results from ordered logistic regressions Model 1 Model 2 Model 3 b/se b/se b/se Sex of child (ref: male) female 0.465*** 0.476*** 0.388***
0.066 0.066 0.068 unknown 0.154 0.256 0.082
0.153 0.152 0.153 COVID19 symptoms in household 0.104 0.035 0.08
0.101 0.101 0.103 HH size -0.047 -0.058 -0.041
0.034 0.039 0.038 School phase (ref: high secondary) primary -0.251* -0.237 -0.420***
0.122 0.126 0.122 secondary 0.596*** 0.583*** 0.063
0.124 0.125 0.119 Single parent -0.410** -0.373**
0.139 0.13 Parental education (ref: higher education degree or diploma) A/AS level -0.334* -0.337**
0.13 0.118 GCSE or lower -0.267** -0.240**
0.085 0.088 Free school meal eligibility -0.404*** -0.238*
0.104 0.104 Ethniciety (ref: white) Indian 0.439* 0.258
0.201 0.202 Pakistani/Bangladeshi -0.549** -0.373
0.187 0.191 Black-Caribbean/African/other 0.595** 0.505*
0.221 0.204 Other ethnic background 0.164 0.133
0.179 0.172 Offline schoolwork provision 0.478***
0.031 Online schoolwork provision 0.272***
0.024 Teacher checks schoolwork 0.305***
0.036
cut1 -2.009*** -2.336*** 0.29 0.189 0.214 0.246
cut2 -0.493** -0.790*** 2.060*** 0.183 0.207 0.248
cut3 0.528** 0.258 3.301*** 0.183 0.206 0.255
cut4 1.591*** 1.344*** 4.567*** 0.186 0.208 0.263
cut5 2.705*** 2.474*** 5.829*** 0.196 0.216 0.276
N 3150 3150 3150