Embed Size (px)
Citation preview
Research
The member states of the Organization for EconomicCooperation and Development (OECD) represent thewealthiest and healthiest countries in the world.
Most of them achieved nearly universal coverage of theirpopulations for a fairly comprehensive package of medical
services decades ago. Their governments are committed notonly to pursuing the efficient delivery of high-quality med-ical care but also to ensuring equitable access to that care. Inmost OECD countries, access to good-quality physicianservices is ensured at relatively low and sometimes zero fi-nancial cost at the point of delivery. This is mainly the resultof a variety of public insurance arrangements aimed at en-suring equitable access. The increasing tension between af-fordability and equity has spurred a number of countries toreconsider their public–private mix and to study reformsthat may enhance efficiency while maintaining equity.
Like the World Health Organization, the OECD is commit-ted to a watchful monitoring and comparison of the perform-ance of its members’ health care systems, and equity in accessis regarded as a key objective.1 In 2002, the OECD Health Pro-ject commissioned a cross-country comparative study to as-sess how the very diverse health care delivery systems of itsmembers fare in terms of equitable access. This article sum-marizes some of the main results of this study, and full de-tails of the data and methods used can be found in the studypublished by the OECD.2
Methods
Most OECD countries finance the great majority of their es-sential health services from public sources3 and endorse theequity principle that these services ought to be allocated onthe basis of need and not willingness or ability to pay.4 There-fore, a logical yardstick for international comparisons basedon this principle of horizontal equity is the degree of inequal-ity in use by income that remains after standardization for(measurable) need differences.
The data for 10 European Union countries (Austria, Bel-gium, Denmark, Finland, Greece, Ireland, Italy, the Nether-lands, Portugal and Spain) are taken from the 2000 wave of theEuropean Community Household Panel (ECHP) survey con-ducted by Eurostat, the European Statistical Office. The surveyis based on a standardized questionnaire and involves annualinterviewing of a representative panel of households and peo-ple 16 years and older in each European Union member state.5
It covers a wide range of topics, including demographic char-acteristics, income, social transfers, health, housing, educa-tion and employment. The national surveys used for the other11 countries are listed in Table 1. Except for the United States
CMAJ • January 17, 2006 • 174(2) | 177© 2006 CMA Media Inc. or its licensors
DO
I:10
.150
3/cm
aj.0
5058
4
Eddy van Doorslaer, Cristina Masseria, Xander Koolman for the OECD Health Equity Research Group
@ See related article page 187
Inequalities in access to medical care by income in developed countries
Background: Most of the member countries of the Organi-zation for Economic Cooperation and Development (OECD)aim to ensure equitable access to health care. This is ofteninterpreted as requiring that care be available on the basis ofneed and not willingness or ability to pay. We sought to ex-amine equity in physician utilization in 21 OECD countriesfor the year 2000.
Methods: Using data from national surveys or from the Euro-pean Community Household Panel, we extracted the numberof visits to a general practitioner or medical specialist overthe previous 12 months. Visits were standardized for need dif-ferences using age, sex and reported health levels as proxies.We measured inequity in doctor utilization by income usingconcentration indices of the need-standardized use.
Results: We found inequity in physician utilization favouringpatients who are better off in about half of the OECD countriesstudied. The degree of pro-rich inequity in doctor use is high-est in the United States and Mexico, followed by Finland, Por-tugal and Sweden. In most countries, we found no evidence ofinequity in the distribution of general practitioner visits acrossincome groups, and where it does occur, it often indicates apro-poor distribution. However, in all countries for which dataare available, after controlling for need differences, peoplewith higher incomes are significantly more likely to see a spe-cialist than people with lower incomes and, in most countries,also more frequently. Pro-rich inequity is especially large inPortugal, Finland and Ireland.
Interpretation: Although in most OECD countries generalpractitioner care is distributed fairly equally and is often evenpro-poor, the very pro-rich distribution of specialist caretends to make total doctor utilization somewhat pro-rich.This phenomenon appears to be universal, but it is reinforcedwhen private insurance or private care options are offered.
Abstract
CMAJ 2006;174(2):177-83
(1999), the surveys refer to 2000 or a more recent year, and allare nationally representative of the free-living adult popula-tion. They were selected on the basis of their suitability for thisanalysis and their comparability to the ECHP data.
Measurement of annual health care utilization was based onthe ECHP question “During the past 12 months, about howmany times have you consulted a general practitioner or a med-ical specialist?” Similar 12-month reference-period questionswere used for the other countries, although not all surveys hadall information. Some countries’ surveys (Australia, Germany,Mexico, Sweden and the United States) did not distinguish be-tween general practitioner (GP) and specialist visits.
Variation in the number of physician visits is explained us-ing health, income and other factors. As predictors of needfor care, we used age, sex, self-reported general health andthe presence and degree of limitation of any chronic physicalor mental health problem, illness or disability. Income wasmeasured by disposable (i.e., after-tax) household incomeper equivalent adult. Some surveys (e.g., for Australia, Ca-nada) provided only categorical income data. Other explana-tory variables used in the analysis were education and activitystatus. Where available, 2 more policy-relevant variables wereused: (private) health insurance coverage for medical care ex-penditures, and region of residence (as a proxy for availabilityof care) or urban–rural division. For most ECHP-based coun-
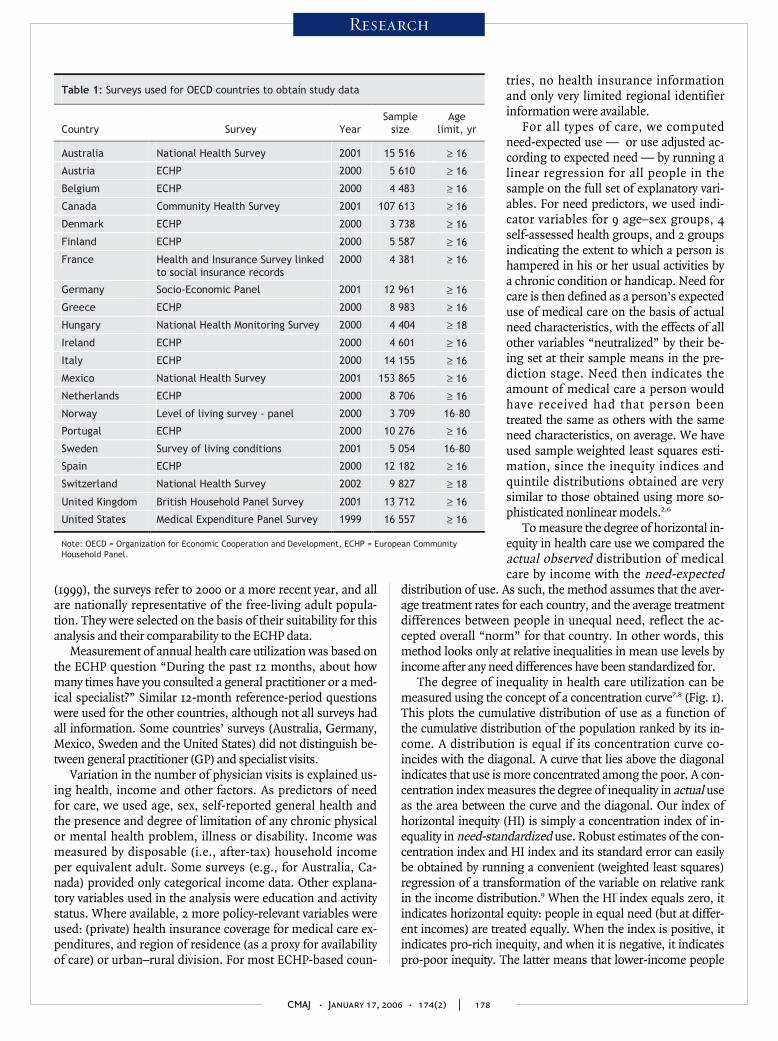
tries, no health insurance informationand only very limited regional identifierinformation were available.
For all types of care, we computedneed-expected use — or use adjusted ac-cording to expected need — by running alinear regression for all people in thesample on the full set of explanatory vari-ables. For need predictors, we used indi-cator variables for 9 age–sex groups, 4self-assessed health groups, and 2 groupsindicating the extent to which a person ishampered in his or her usual activities bya chronic condition or handicap. Need forcare is then defined as a person’s expecteduse of medical care on the basis of actualneed characteristics, with the effects of allother variables “neutralized” by their be-ing set at their sample means in the pre-diction stage. Need then indicates theamount of medical care a person wouldhave received had that person beentreated the same as others with the sameneed characteristics, on average. We haveused sample weighted least squares esti-mation, since the inequity indices andquintile distributions obtained are verysimilar to those obtained using more so-phisticated nonlinear models.2,6
To measure the degree of horizontal in-equity in health care use we compared theactual observed distribution of medicalcare by income with the need-expected
distribution of use. As such, the method assumes that the aver-age treatment rates for each country, and the average treatmentdifferences between people in unequal need, reflect the ac-cepted overall “norm” for that country. In other words, thismethod looks only at relative inequalities in mean use levels byincome after any need differences have been standardized for.
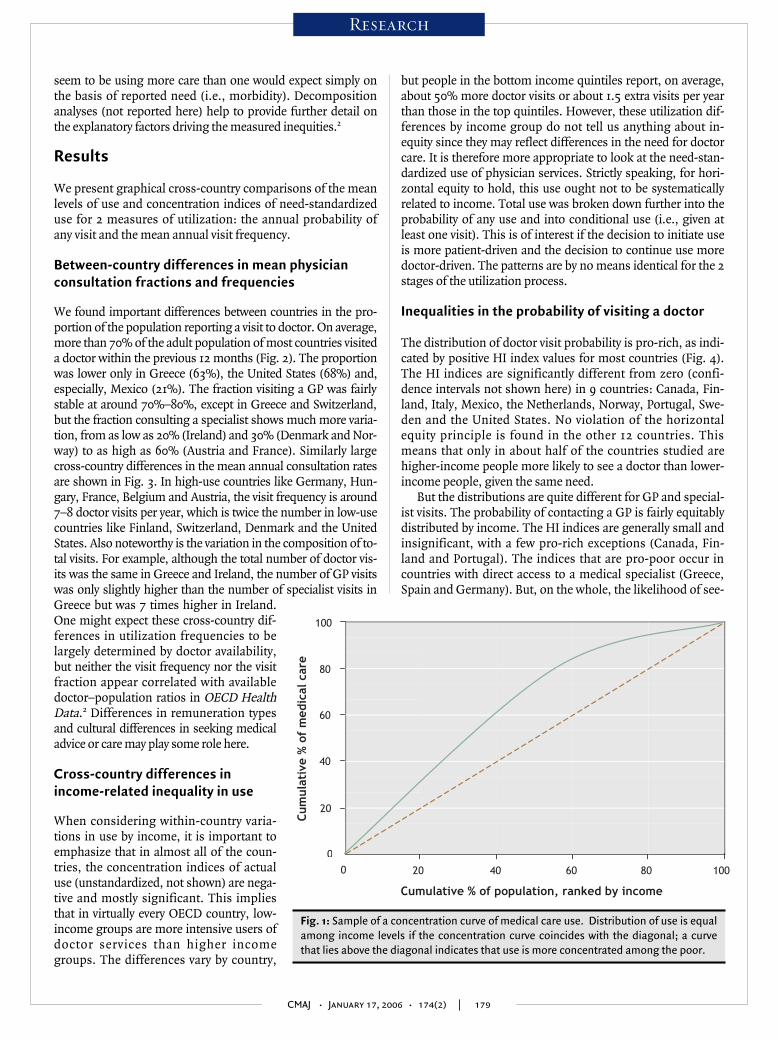
The degree of inequality in health care utilization can bemeasured using the concept of a concentration curve7,8 (Fig. 1).This plots the cumulative distribution of use as a function ofthe cumulative distribution of the population ranked by its in-come. A distribution is equal if its concentration curve co-incides with the diagonal. A curve that lies above the diagonalindicates that use is more concentrated among the poor. A con-centration index measures the degree of inequality in actual useas the area between the curve and the diagonal. Our index ofhorizontal inequity (HI) is simply a concentration index of in-equality in need-standardized use. Robust estimates of the con-centration index and HI index and its standard error can easilybe obtained by running a convenient (weighted least squares)regression of a transformation of the variable on relative rankin the income distribution.9 When the HI index equals zero, itindicates horizontal equity: people in equal need (but at differ-ent incomes) are treated equally. When the index is positive, itindicates pro-rich inequity, and when it is negative, it indicatespro-poor inequity. The latter means that lower-income people
CMAJ • January 17, 2006 • 174(2) | 178
Research
Table 1: Surveys used for OECD countries to obtain study data
Country Survey Year Sample
size Age
limit, yr
Australia National Health Survey 2001 15 516 ≥ 16
Austria ECHP 2000 5 610 ≥ 16
Belgium ECHP 2000 4 483 ≥ 16
Canada Community Health Survey 2001 107 613 ≥ 16
Denmark ECHP 2000 3 738 ≥ 16
Finland ECHP 2000 5 587 ≥ 16
France Health and Insurance Survey linked to social insurance records
2000 4 381 ≥ 16
Germany Socio-Economic Panel 2001 12 961 ≥ 16
Greece ECHP 2000 8 983 ≥ 16
Hungary National Health Monitoring Survey 2000 4 404 ≥ 18
Ireland ECHP 2000 4 601 ≥ 16
Italy ECHP 2000 14 155 ≥ 16
Mexico National Health Survey 2001 153 865 ≥ 16
Netherlands ECHP 2000 8 706 ≥ 16
Norway Level of living survey - panel 2000 3 709 16–80
Portugal ECHP 2000 10 276 ≥ 16
Sweden Survey of living conditions 2001 5 054 16–80
Spain ECHP 2000 12 182 ≥ 16
Switzerland National Health Survey 2002 9 827 ≥ 18
United Kingdom British Household Panel Survey 2001 13 712 ≥ 16
United States Medical Expenditure Panel Survey 1999 16 557 ≥ 16
Note: OECD = Organization for Economic Cooperation and Development, ECHP = European Community Household Panel.
seem to be using more care than one would expect simply onthe basis of reported need (i.e., morbidity). Decompositionanalyses (not reported here) help to provide further detail onthe explanatory factors driving the measured inequities.2
Results
We present graphical cross-country comparisons of the meanlevels of use and concentration indices of need-standardizeduse for 2 measures of utilization: the annual probability ofany visit and the mean annual visit frequency.
Between-country differences in mean physicianconsultation fractions and frequencies
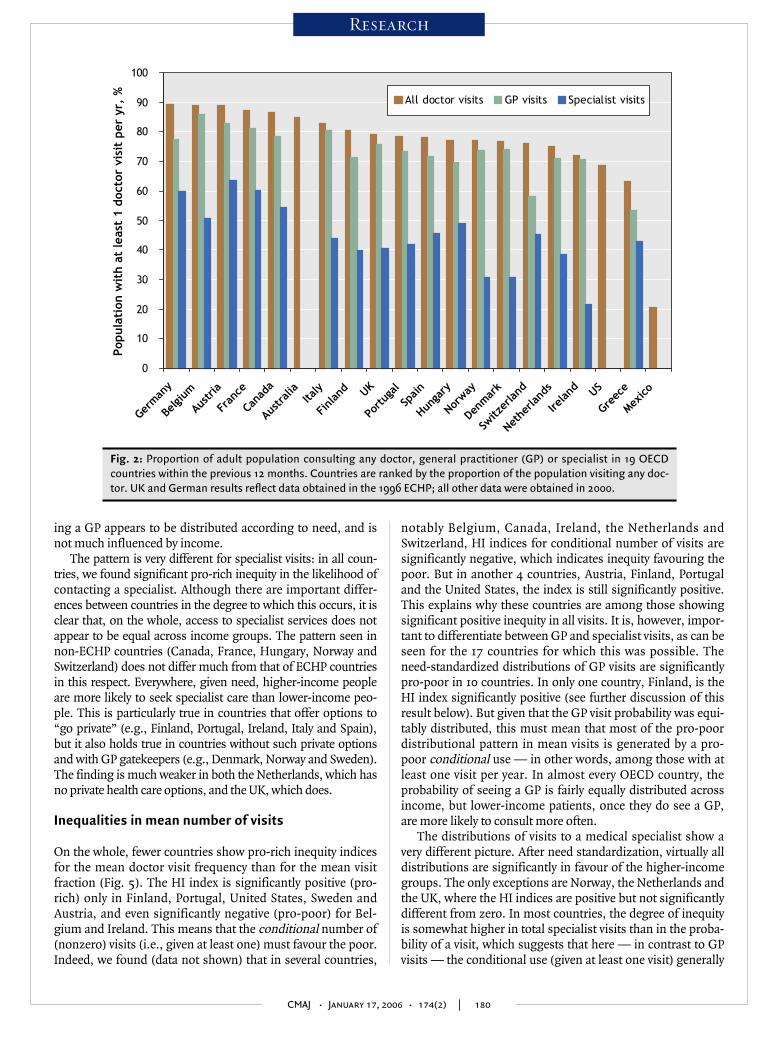
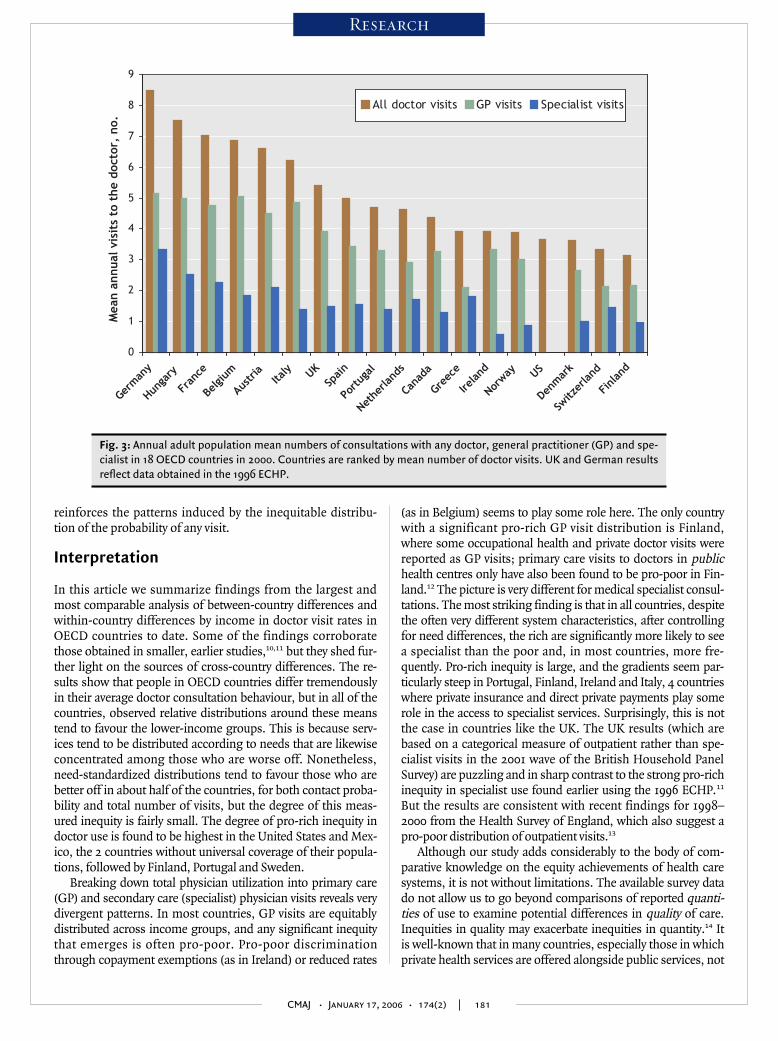
We found important differences between countries in the pro-portion of the population reporting a visit to doctor. On average,more than 70% of the adult population of most countries visiteda doctor within the previous 12 months (Fig. 2). The proportionwas lower only in Greece (63%), the United States (68%) and,especially, Mexico (21%). The fraction visiting a GP was fairlystable at around 70%–80%, except in Greece and Switzerland,but the fraction consulting a specialist shows much more varia-tion, from as low as 20% (Ireland) and 30% (Denmark and Nor-way) to as high as 60% (Austria and France). Similarly largecross-country differences in the mean annual consultation ratesare shown in Fig. 3. In high-use countries like Germany, Hun-gary, France, Belgium and Austria, the visit frequency is around7–8 doctor visits per year, which is twice the number in low-usecountries like Finland, Switzerland, Denmark and the UnitedStates. Also noteworthy is the variation in the composition of to-tal visits. For example, although the total number of doctor vis-its was the same in Greece and Ireland, the number of GP visitswas only slightly higher than the number of specialist visits inGreece but was 7 times higher in Ireland.One might expect these cross-country dif-ferences in utilization frequencies to belargely determined by doctor availability,but neither the visit frequency nor the visitfraction appear correlated with availabledoctor–population ratios in OECD HealthData.2 Differences in remuneration typesand cultural differences in seeking medicaladvice or care may play some role here.
Cross-country differences in income-related inequality in use
When considering within-country varia-tions in use by income, it is important toemphasize that in almost all of the coun-tries, the concentration indices of actualuse (unstandardized, not shown) are nega-tive and mostly significant. This impliesthat in virtually every OECD country, low-income groups are more intensive users ofdoctor services than higher incomegroups. The differences vary by country,
but people in the bottom income quintiles report, on average,about 50% more doctor visits or about 1.5 extra visits per yearthan those in the top quintiles. However, these utilization dif-ferences by income group do not tell us anything about in-equity since they may reflect differences in the need for doctorcare. It is therefore more appropriate to look at the need-stan-dardized use of physician services. Strictly speaking, for hori-zontal equity to hold, this use ought not to be systematicallyrelated to income. Total use was broken down further into theprobability of any use and into conditional use (i.e., given atleast one visit). This is of interest if the decision to initiate useis more patient-driven and the decision to continue use moredoctor-driven. The patterns are by no means identical for the 2stages of the utilization process.
Inequalities in the probability of visiting a doctor
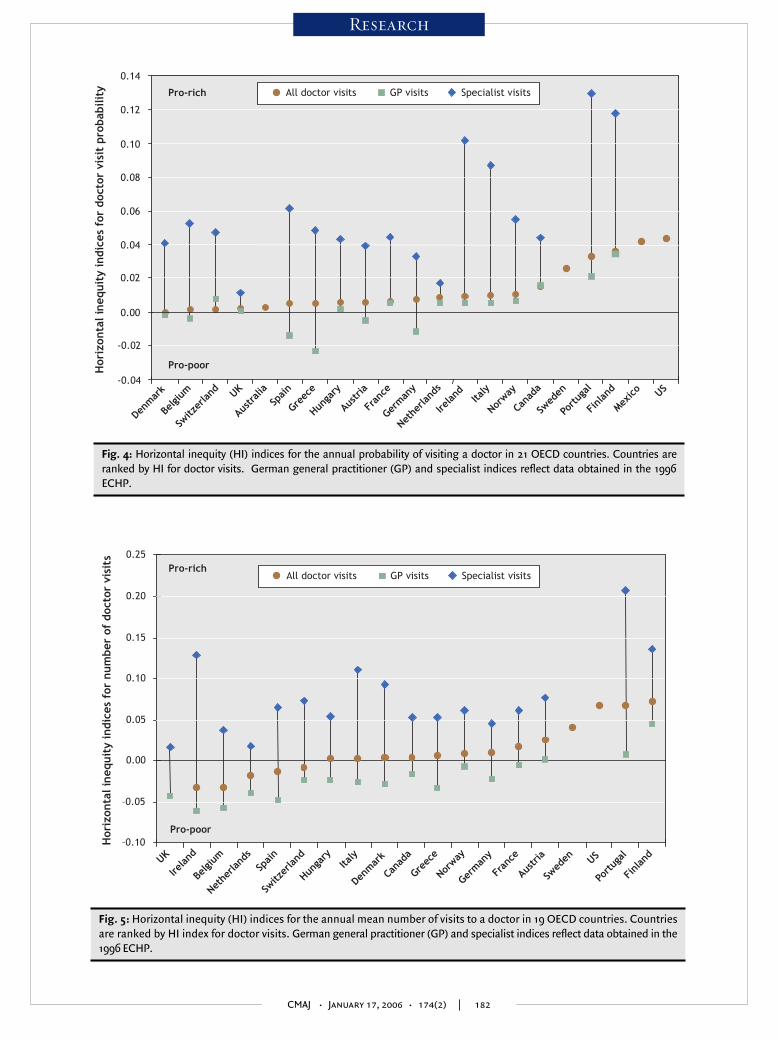
The distribution of doctor visit probability is pro-rich, as indi-cated by positive HI index values for most countries (Fig. 4).The HI indices are significantly different from zero (confi-dence intervals not shown here) in 9 countries: Canada, Fin-land, Italy, Mexico, the Netherlands, Norway, Portugal, Swe-den and the United States. No violation of the horizontalequity principle is found in the other 12 countries. Thismeans that only in about half of the countries studied arehigher-income people more likely to see a doctor than lower-income people, given the same need.
But the distributions are quite different for GP and special-ist visits. The probability of contacting a GP is fairly equitablydistributed by income. The HI indices are generally small andinsignificant, with a few pro-rich exceptions (Canada, Fin-land and Portugal). The indices that are pro-poor occur incountries with direct access to a medical specialist (Greece,Spain and Germany). But, on the whole, the likelihood of see-
CMAJ • January 17, 2006 • 174(2) | 179
Research
Cum
ula
tive
% o
f m
edic
al c
are
Cumulative % of population, ranked by income
10020 40 60 800
20
100
80
60
40
0
Fig. 1: Sample of a concentration curve of medical care use. Distribution of use is equalamong income levels if the concentration curve coincides with the diagonal; a curvethat lies above the diagonal indicates that use is more concentrated among the poor.
ing a GP appears to be distributed according to need, and isnot much influenced by income.
The pattern is very different for specialist visits: in all coun-tries, we found significant pro-rich inequity in the likelihood ofcontacting a specialist. Although there are important differ-ences between countries in the degree to which this occurs, it isclear that, on the whole, access to specialist services does notappear to be equal across income groups. The pattern seen innon-ECHP countries (Canada, France, Hungary, Norway andSwitzerland) does not differ much from that of ECHP countriesin this respect. Everywhere, given need, higher-income peopleare more likely to seek specialist care than lower-income peo-ple. This is particularly true in countries that offer options to“go private” (e.g., Finland, Portugal, Ireland, Italy and Spain),but it also holds true in countries without such private optionsand with GP gatekeepers (e.g., Denmark, Norway and Sweden).The finding is much weaker in both the Netherlands, which hasno private health care options, and the UK, which does.
Inequalities in mean number of visits
On the whole, fewer countries show pro-rich inequity indicesfor the mean doctor visit frequency than for the mean visitfraction (Fig. 5). The HI index is significantly positive (pro-rich) only in Finland, Portugal, United States, Sweden andAustria, and even significantly negative (pro-poor) for Bel-gium and Ireland. This means that the conditional number of(nonzero) visits (i.e., given at least one) must favour the poor.Indeed, we found (data not shown) that in several countries,
notably Belgium, Canada, Ireland, the Netherlands andSwitzerland, HI indices for conditional number of visits aresignificantly negative, which indicates inequity favouring thepoor. But in another 4 countries, Austria, Finland, Portugaland the United States, the index is still significantly positive.This explains why these countries are among those showingsignificant positive inequity in all visits. It is, however, impor-tant to differentiate between GP and specialist visits, as can beseen for the 17 countries for which this was possible. Theneed-standardized distributions of GP visits are significantlypro-poor in 10 countries. In only one country, Finland, is theHI index significantly positive (see further discussion of thisresult below). But given that the GP visit probability was equi-tably distributed, this must mean that most of the pro-poordistributional pattern in mean visits is generated by a pro-poor conditional use — in other words, among those with atleast one visit per year. In almost every OECD country, theprobability of seeing a GP is fairly equally distributed acrossincome, but lower-income patients, once they do see a GP,are more likely to consult more often.
The distributions of visits to a medical specialist show avery different picture. After need standardization, virtually alldistributions are significantly in favour of the higher-incomegroups. The only exceptions are Norway, the Netherlands andthe UK, where the HI indices are positive but not significantlydifferent from zero. In most countries, the degree of inequityis somewhat higher in total specialist visits than in the proba-bility of a visit, which suggests that here — in contrast to GPvisits — the conditional use (given at least one visit) generally
CMAJ • January 17, 2006 • 174(2) | 180
Research
0
10
20
30
40
50
60
70
80
90
100
German
y
Belgi
um
Austria
Fran
ce
Cana
da
Austra
liaIta
ly
Finl
and UK
Portu
gal
Spain
Hunga
ry
Norway
Denmar
k
Switz
erland
Nethe
rland
s
Ireland US
Greec
e
Mexico
Pop
ula
tion
wit
h a
t le
ast
1 d
octo
r vi
sit
per
yr,
% All doctor visits GP visits Specialist visits
Fig. 2: Proportion of adult population consulting any doctor, general practitioner (GP) or specialist in 19 OECDcountries within the previous 12 months. Countries are ranked by the proportion of the population visiting any doc-tor. UK and German results reflect data obtained in the 1996 ECHP; all other data were obtained in 2000.
reinforces the patterns induced by the inequitable distribu-tion of the probability of any visit.
Interpretation
In this article we summarize findings from the largest andmost comparable analysis of between-country differences andwithin-country differences by income in doctor visit rates inOECD countries to date. Some of the findings corroboratethose obtained in smaller, earlier studies,10,11 but they shed fur-ther light on the sources of cross-country differences. The re-sults show that people in OECD countries differ tremendouslyin their average doctor consultation behaviour, but in all of thecountries, observed relative distributions around these meanstend to favour the lower-income groups. This is because serv-ices tend to be distributed according to needs that are likewiseconcentrated among those who are worse off. Nonetheless,need-standardized distributions tend to favour those who arebetter off in about half of the countries, for both contact proba-bility and total number of visits, but the degree of this meas-ured inequity is fairly small. The degree of pro-rich inequity indoctor use is found to be highest in the United States and Mex-ico, the 2 countries without universal coverage of their popula-tions, followed by Finland, Portugal and Sweden.
Breaking down total physician utilization into primary care(GP) and secondary care (specialist) physician visits reveals verydivergent patterns. In most countries, GP visits are equitablydistributed across income groups, and any significant inequitythat emerges is often pro-poor. Pro-poor discriminationthrough copayment exemptions (as in Ireland) or reduced rates
(as in Belgium) seems to play some role here. The only countrywith a significant pro-rich GP visit distribution is Finland,where some occupational health and private doctor visits werereported as GP visits; primary care visits to doctors in publichealth centres only have also been found to be pro-poor in Fin-land.12 The picture is very different for medical specialist consul-tations. The most striking finding is that in all countries, despitethe often very different system characteristics, after controllingfor need differences, the rich are significantly more likely to seea specialist than the poor and, in most countries, more fre-quently. Pro-rich inequity is large, and the gradients seem par-ticularly steep in Portugal, Finland, Ireland and Italy, 4 countrieswhere private insurance and direct private payments play somerole in the access to specialist services. Surprisingly, this is notthe case in countries like the UK. The UK results (which arebased on a categorical measure of outpatient rather than spe-cialist visits in the 2001 wave of the British Household PanelSurvey) are puzzling and in sharp contrast to the strong pro-richinequity in specialist use found earlier using the 1996 ECHP.11
But the results are consistent with recent findings for 1998–2000 from the Health Survey of England, which also suggest apro-poor distribution of outpatient visits.13
Although our study adds considerably to the body of com-parative knowledge on the equity achievements of health caresystems, it is not without limitations. The available survey datado not allow us to go beyond comparisons of reported quanti-ties of use to examine potential differences in quality of care.Inequities in quality may exacerbate inequities in quantity.14 Itis well-known that in many countries, especially those in whichprivate health services are offered alongside public services, not
CMAJ • January 17, 2006 • 174(2) | 181
Research
0
1
2
3
4
5
6
7
8
9
Germ
any
Hunga
ry
Fran
ce
Belgi
um
Austria Ita
ly UKSp
ain
Portug
al
Nethe
rland
s
Cana
da
Greec
e
Ireland
Norway US
Denm
ark
Switz
erland
Finl
and
Mea
n a
nnual
vis
its
to t
he
doct
or,
no.
All doctor visits GP visits Specialist visits
Fig. 3: Annual adult population mean numbers of consultations with any doctor, general practitioner (GP) and spe-cialist in 18 OECD countries in 2000. Countries are ranked by mean number of doctor visits. UK and German resultsreflect data obtained in the 1996 ECHP.
CMAJ • January 17, 2006 • 174(2) | 182
Research
-0.04
-0.02
0.00
0.02
0.04
0.06
0.08
0.10
0.12
0.14
Pro-rich
Pro-poor
All doctor visits GP visits Specialist visitsH
oriz
onta
l in
equit
y in
dic
es f
or d
octo
r vi
sit
pro
bab
ilit
y
US
Denm
ark
Belgi
um
Switz
erland UK
Austra
liaSp
ain
Greec
e
Hunga
ry
Austria
Fran
ce
Germ
any
Nethe
rland
s
Ireland Ita
ly
Norway
Cana
da
Swed
en
Portug
al
Finl
and
Mexico
Fig. 4: Horizontal inequity (HI) indices for the annual probability of visiting a doctor in 21 OECD countries. Countries areranked by HI for doctor visits. German general practitioner (GP) and specialist indices reflect data obtained in the 1996ECHP.
–0.10
–0.05
0.00
0.05
0.10
0.15
0.20
0.25Pro-rich
Pro-poor
All doctor visits GP visits Specialist visits
Hor
izon
tal in
equit
y in
dice
s fo
r num
ber
of
doct
or v
isit
s
UK
Ireland
Belgi
um
Nethe
rland
s
Spain
Switz
erland
Hunga
ryIta
ly
Denm
ark
Cana
da
Greec
e
Norway
Germ
any
Fran
ce
Austria
Swed
en US
Portug
al
Finl
and
Fig. 5: Horizontal inequity (HI) indices for the annual mean number of visits to a doctor in 19 OECD countries. Countriesare ranked by HI index for doctor visits. German general practitioner (GP) and specialist indices reflect data obtained in the1996 ECHP.
all doctor visits can be assumed to be of the same quality. Theresults of a number of recent studies show that higher-incomegroups are more likely to use private services.15,16 The other ob-vious area to look into to improve current estimates of inequityis the “needs” adjustment. Clearly, some of the surveys used of-fer greater potential to measure the care needs of respondentsthan the common set of simple (though powerful) self-assessed health indicators used in this study. Sensitivity analy-ses have shown that inclusion of a much larger battery ofhealth measures into the needs adjustment does not changethe main thrust of these findings very much, and tends to findmore pro-rich (or less pro-poor) inequity. Alternatively, greaterneed comparability could be obtained by focusing attention onspecific treatments for specific subpopulations (e.g., pregnantwomen, chronically ill patients), but this would come at theprice of losing the system-wide perspective.
Finally, an important question is whether and to what ex-tent any inequities in health care usage reported here are notonly statistically significant but also policy-relevant. This de-pends a lot on the extent to which they also translate into in-equalities in health outcomes. Evidence of socioeconomicinequities in access to cardiac17 and stroke18 treatment in On-tario suggests that socioeconomic differences in diagnosticand therapeutic utilization are not trivial and do appear totranslate into differential outcomes by income. It seemstherefore justified to hypothesize that at least some of the in-come-related patterns of health care documented here maylead to similar differences in health outcomes.
REFERENCES1. Hurst JW. Performance measurement and improvement in OECD health systems:
overview of issues and challenges. In: Measuring up: improving health system per-formance in OECD countries. Paris: OECD; 2002.
2. Van Doorslaer E, Masseria C; OECD Health Equity Research Group. Income-re-lated inequality in the use of medical care in 21 OECD countries. In: Towards high-performing health systems: policy studies. Paris: OECD; 2004. p. 109-66.
3. Docteur E, Oxley H. Health system reform: lessons from experience. In: Towardshigh-performing health systems: policy studies. Paris: OECD; 2003. p. 19-85.
4. Van Doorslaer E, Wagstaff A, Rutten F, editors. Equity in the finance and deliveryof health care: an international perspective. Oxford: Oxford University Press; 1993.
5. Eurostat. European Community Household Panel (ECHP): selected indicatorsfrom the 1995 wave. Luxembourg: European Commission, Eurostat; 1999.
6. Van Doorslaer E, Koolman X, Jones AM. Explaining income-related inequalities indoctor utilization in Europe. Health Econ 2004;13:629-47.
7. Wagstaff A, Paci P, van Doorslaer E. On the measurement of inequalities in health.Soc Sci Med 1991;33:545-57.
8. Wagstaff A, van Doorslaer E. Equity in health care finance and delivery. In: New-house JP, editor. Handbook of health economics. Amsterdam: Elsevier North-Hol-land; 2000. p. 1803-62.
9. Kakwani N, Wagstaff A, van Doorslaer E. Socioeconomic inequalities in health:measurement, computation and statistical inference. J Econom 1997;77:87-103.
10. Van Doorslaer E, Wagstaff A, van der Burg H, et al. Equity in the delivery of healthcare in Europe and the US. J Health Econ 2000;19:553-83.
11. Van Doorslaer E, Koolman X, Puffer F. Equity in the use of physician visits inOECD countries: has equal treatment for equal need been achieved? In: Measuringup: improving health systems performance in OECD countries. Paris: OECD;2002. p. 225-48.
12. Arinen S, Häkkinen U, Klaukka T, et al. Health and the use of health services inFinland. Main findings of the Finnish Health Care surveys 1995/96 and changesfrom 1987. Helsinki: STAKES; 1998.
13. Morris S, Sutton M, Gravelle H. Inequity and inequality in the use of health care inEngland: an extended empirical investigation. York: University of York; 2003.
14. Fiscella K, Franks P, Gold MR, et al. Inequality in quality: addressing socioeco-nomic, racial, and ethnic disparities in health care. JAMA 2000;283:2579-84.
15. Rodriguez M, Stoyanova A. The effect of private insurance access on the choice ofGP/specialist and public/private provider in Spain. Health Econ 2004;13:689-703.
16. Atella V, Brindisi F, Deb P, et al. Determinants of access to physician services in Italy:a latent class seemingly unrelated probit approach. Health Econ 2004;13:657-68.
17. Alter DA NC, Austin P, Tu JV. Effects of socioeconomic status on access to invasivecardiac procedures and on mortality after acute myocardial infarction. N Engl JMed 1999;341:1359-67.
18. Kapral MK WH, Mamdani M, Tu JV. Effect of socioeconomic status on treatmentand mortality after stroke. Stroke 2002;33:268-73.
CMAJ • January 17, 2006 • 174(2) | 183
Research
Editor’s take
• Member countries of the Organization for Economic Cooper-ation and Development (OECD) include the world's wealthi-est nations. However, access to health care may not be equi-table across income groups in these countries.
• The authors report the results of a survey study of the generalpublic living in OECD countries. They found that althoughcare from general practitioners was distributed equally, spe-cialist care was biased to patients with higher incomes.
Implications for practice: Richer patients may be more likely torequest specialist care; however, it is unknown whether their ac-cess to specialist care represents the meeting of a genuineneed. Conversely, poorer (and possibly less educated) patientsmay not advocate for their own health needs as effectively as dopatients with higher incomes.
Correspondence to: Dr. Eddy van Doorslaer, Department of HealthPolicy and Management, Erasmus University Medical Centre, POBox 1738, 3000 DR Rotterdam, Netherlands;[email protected]
Other members of the OECD Health Equity Research Group:Gaetan Lafortune (Health Policy Unit, OECD, Paris); Philip Clarke(Health Economics Research Centre, University of Oxford andEconomics Research School of Social Sciences, AustralianNational University); Ulf-G Gerdtham (Department of CommunityMedicine, Lund University, Sweden), Unto Häkkinen (Centre forHealth Economics, STAKES, Helsinki, Finland); Agnès Couffinhaland Sandy Tubeuf (IRDES, France); Martin Schellhorn (IZA, Bonn,Germany); Agota Szende (MEDTAP, UK); Gustavo Nigenda(FUNSALUD, Mexico); Astrid Grasdal (Health EconomicsDepartment, University of Bergen, Norway); Robert E. Leu(Department of Economics, University of Bern, Switzerland);Frank Puffer and Elizabeth Seidler (Department of Economics,Clark University, Worcester, US)
This article has been peer reviewed.
From the Department of Health Policy and Management, Erasmus UniversityMedical Centre, Rotterdam, Netherlands (van Doorslaer, Masseria, Kool-man); and the London School of Economics, London, UK (Masseria)
Competing interests: None declared.
Contributors: All of the authors contributed substantially to the study designand execution, data analysis and meetings where preliminary results werediscussed, as well as to the drafting of the manuscript and its revision forcritical content. All of the authors approved the final version for publication.
Acknowledgements:: This study was supported by a grant from the OECDHealth Project. The design of the study and the preliminary results were dis-cussed at 2 meetings in Paris, in September and December 2003. The viewsexpressed in this paper are those of the authors and do not necessarily reflectthose of their employers or the OECD.
The study was initiated and funded by the OECD Health Project, but itsdesign and execution were the sole responsibility of the authors.