Embed Size (px)
Citation preview
Support for seed potatoes sales to Sri Lanka: determining
constraints to production
Peter Dawson Department of Agriculture
Western Australia
Project Number: PT03064

PT03064 This report is published by Horticulture Australia Ltd to pass on information concerning horticultural research and development undertaken for the potato industry. The research contained in this report was funded by Horticulture Australia Ltd with the financial support of Western Potatoes. All expressions of opinion are not to be regarded as expressing the opinion of Horticulture Australia Ltd or any authority of the Australian Government. The Company and the Australian Government accept no responsibility for any of the opinions or the accuracy of the information contained in this report and readers should rely upon their own enquiries in making decisions concerning their own interests. ISBN 0 7341 1224 6 Published and distributed by: Horticulture Australia Ltd Level 1 50 Carrington Street Sydney NSW 2000 Telephone: (02) 8295 2300 Fax: (02) 8295 2399 E-Mail: [email protected] © Copyright 2005

FINAL REPORT
HORTICULTURE AUSTRALIA LIMITED
PROJECT PT03064
SUPPORT FOR SEED POTATO SALES TO SRI LANKA: DETERMINING THE CONSTRAINTS TO PRODUCTION
Ian McPharlin, Fazal Sultanbawa*, Andrew Taylor and Peter Dawson
Department of Agriculture, Western Australia
&
*CIC Agri Businesses

HAL Project: PT03064 Project Leader: Dr Ian McPharlin Department of Agriculture, Western Australia Phone 08 9368 3671 Email [email protected] Other personnel Dr Fazal Sultanbawa CIC Agri Businesses Phone 0011 94 11 4721127 Email [email protected] Mr Andrew Taylor Department of Agriculture, Western Australia Phone 08 9777 0126 Email [email protected] Peter Dawson Department of Agriculture, Western Australia 444 Albany Highway ALBANY WA 6330 Fax 08 9841 2707 Email [email protected] Mr Brian Dickson Western Potatoes Ltd Phone 08 9433 6477 Email [email protected] Purpose of this Report: To identify agronomic practices that will maximise yield and
quality of crops grown from Australian seed in Sri Lanka. Funding Sources: Department of Agriculture, Western Australia, The Potato
Marketing Corporation of Western Australia (Western Potatoes), CIC Agri Businesses and Horticulture Australia Ltd.
Date 31 August 2005 Disclaimer: Any recommendations contained in this publication do not
necessarily represent current HAL policy. No person should act on the basis of the contents of this publication, whether as to matters of fact or opinion or other content, without first obtaining specific, independent professional advice in respect of the matters set out in this publication.

Frontispiece. Terraced potato crop at Nuwara Eliya, Sri Lanka


1
Contents PT03064 1. Media summary 2 2. Technical summary 3 3. Introduction 4 4. Material & methods Survey design 9 Assessment of agronomic practices and conditions 9 Data analysis 10 5. Results Yield 11 Training 11 Seed selections and supply 11 Seed quality 14 Seed selection 14 Seed preparation and treatment 16 Roguing crops 17 Pests and disease during planting 18 Pest and disease relationships 19 Soil treatments for disease and pest control 19 Irrigation practices 20 Rotation 21 Agronomic factors at planting 22 Nutrients in soil and plant 24 Concentration of nutrients in petioles and yield 26 Effects of more than one nutrient 29 Nutrient interactions 32 6. Discussion Seed 33 Agronomic factors 34 Nutrients 35 Diseases 36 Pests 41 7. Technology transfer 45 8. Recommendations 46 9. Acknowledgements 47 10. Literature 48 Abbreviations 52 Appendix 1. Survey questionnaire 53 Appendix 2. Additional Crop 1 data 67 Appendix 3. Additional Crop 2 data 75 Appendix 4. Crop Rotations 85
2
1. Media Summary
Key components of project Potato yield in Sri Lanka is low compared with Australia. Poor quality seed has been identified as a major limit to yield. However it has been shown that even with good quality seed yield may not improve substantially unless optimum agronomic practices are adopted. Yields need to be increased substantially to cover the cost of seed, maximise profit and increase international competitiveness. We surveyed agronomic conditions and practices in a number of crops to identify which factors could be used to maximise yield and quality of Sri Lankan potatoes.
Industry significance If potato yields in Sri Lanka can be increased through better agronomy in combination with good seed, then this will lead to higher profits for farmers. This will convince the farmers of the value of high quality seed and better agronomy and improve the prospects for Australian seed potato exports. Higher yields and profits for Sri Lankan farmers are needed if the Sri Lankan potato industry is to become sustainable. Currently the Sri Lankan potato industry is protected by a tariff on imported table potatoes.
Key outcomes Management of micronutrients such as copper, zinc and possibility iron and manganese, to avoid excess application, is needed to increase yields in Sri Lanka. We found that farmers’ capacity to identify pest and disease may also be crucial to increasing yield. Time of planting in both Badulla and Nuwara Eliya is also important in maximising yield. Improved management of diseases such as late blight will also lead to improved yield. The surveys showed that yield could be increased to at least twice the national average (26 versus 13 t/ha) by improved agronomic practices in each growing region. A longer-term goal would be to improve yields to 40 t/ha which is considered close to the potential for Sri Lanka.
Recommendations for future R&D • Investigate methods to reduce excess use of trace elements such as copper and zinc in
potatoes in Sri Lanka. • Investigate the cost benefit of improved irrigation systems in potatoes in Sri Lanka. • Develop training courses to enable farmers to improve their pest and disease identification
skills. • Time of planting should be investigated further. • There is a need to introduce IPM systems to potato production in Sri Lanka to delay the
onset of strains of late blight resistant to currently used fungicides.
Recommendations for practical application to industry This project has identified various possible constraints to production in Sri Lanka. This shows the value of export market development work. The Australian potato industry is encouraged to support further seed development projects in Sri Lanka in support of developing further seed exports.

3
2. Technical Summary Nature of problem The wealth of the potato industry can be substantially increased by expanding export seed markets. WA seed potato exports have grown from 600 tonnes in 99/00 to 1,421 tonnes in 2003/04 and are increasing. Sri Lanka is a new market which produced > 89,000 t of potatoes in 2001/02. The average yield is just 12 t/ha compared with > 40 t/ha for Australia. Poor seed quality has been identified as the major reason for low yields. However a yield response to improved seed will only occur if there are no other major constraints. This project investigated factors limiting yield for Sri Lankan potato growers. This will eventually allow Australian seed imports to perform to their true potential.
Research undertaken A literature review was conducted on current and historic crop management. A survey questionnaire was developed which enabled the research partners to identify sites to be surveyed and the format and extent of the survey. The survey concentrated on the variety Granola. 30 sites each in two cropping periods were surveyed. The locations were Nuwara Eliya and Badulla.
Major findings & industry outcomes • Low yields were associated with high copper (and possibly zinc) concentrations in the
plant in at least one planting in the highlands of Sri Lanka. This information alerts the Sri Lankan potato industry that the over use of copper and zinc in fertilisers and fungicides maybe an important issue. Testing soil amendments which may reduce the absorption of copper and disease control methods which require less copper could be investigated.
• The finding that sprinkler systems affect yield should be investigated further. Different systems could be compared and the benefit/cost for each system should be determined.
• Accurate pest and disease identification may be vital if farmers are to improve yields. Farmers require training to improve their pest and disease identification skills.
• Sowing date influence on yield should be investigated further to determine what factors are causing the yield decline. Planting all crops at the optimum time for yield may result in supply exceeding demand and the relationship between supply and demand and price needs to be investigated to determine how to tackle this issue.
• The frequent use of chemicals to control late blight will result in the development of resistant strains. There is a need to introduce IPM systems to potato production in Sri Lanka to delay the onset of strains of late blight resistant to currently used fungicides.
• We showed that surveys designed to identify yield constraints in new markets can provide helpful information in a relatively short period of time. The results can lead to research to overcome yield constraints and this information will help Australian seed potatoes perform to their potential in new export markets.
Recommendations & future work Phase 2 of the project will focus on trial work to further define the factors limiting potato crop management with Phase 3 being a series of Best Management Practice trials to demonstrate the potential of WA seed, grown as part of an integrated crop management program.

4
3. Introduction
3.1 Background
3.1.1. Production history Potatoes have been grown in Sri Lanka since at least 1812 but it was not until 1967, when the government stopped the importation of table potatoes, that rapid expansion occurred (Sathiamoorthy et al. 1985). Since then potato production has fluctuated depending on growing conditions and competition from imports. In 1994 table potato imports were once again permitted which resulted in Sri Lankan production decreasing from c. 110,000 t in 1995 to 25,000 t in 1998 (Figure 1) in response to imports from India and Pakistan undercutting the local industry (Hatherley et al. 2003). A tariff of 20 Rs/kg on imported table potatoes was introduced in 1999 for food security and development of the rural economy. This resulted in the recovery of domestic potato production to c. 89,000 t in 2002 (Hatherley et al. 2003) with an average yield of 13 t/ha (FAOSTAT). Farm gate price for potatoes in 2003 was 40 – 45 Rs/kg (Hatherley et al. 2003). In Sri Lanka potatoes are produced mainly for the fresh market with Desiree and Granola the main (56%) varieties.
0
20000
40000
60000
80000
100000
120000
140000
1995 1996 1997 1998 1999 2000 2001 2002
Year
Tonn
es
local production imports
Figure 1. Sri Lankan potato production and potato imports from 1995 to 2002 (Hatherley et al. 2003).
Tariff of 20 Rs/kg on imported table potatoes introduced in 1999
5
Currently the import of table potatoes depends heavily on the production levels within Sri Lanka as shown in Figure 1. If the tariff were dropped then domestic production would be expected to fall while imports will increase. Potato consumption is increasing in Sri Lanka: 9 kg of potatoes consumed per person in 2000 compared to 5 kg in 1990.
3.1.2. Production areas and seasons The main cropping season is called the Maha (wet season) which lasts from October to January. This includes the highest rainfall period from October to December caused by the north-east monsoon from the Bay of Bengal. The minor cropping season is called the Yala (dry season) and lasts from March to July. This period contains the high rainfall period of April to June caused by the south-west monsoon from the Indian Ocean. During the monsoons the central highlands cause a rain shadow, so that while the windward slopes received plentiful rain, the lee slopes are subjected to drying winds. Between the monsoons conventional rainfall occurs. Rainfall is most consistent in the highland areas while the lower lands require irrigation for cropping in the Yala season. Most (99%) potatoes are produced in the up country (highland) regions because of the milder climatic conditions compared with the lowlands. The two most important growing regions are Nuwara Eliya and Badulla. Nuwara Eliya is in the up country wet zone at an altitude of 1,800 to 2,000 m with average temperatures between 15 to 20°C. The average annual rainfall is 2,250 mm falling mainly between April and November with December to March usually dry. About 20,000 t of potatoes (29% of the national crop) are grown on 1,500 ha by 10,000 farmers at an average yield of 13.4t/ha. Maha Crops are planted between August and September and harvested between November and December. Yala crops are planted between February and March and harvested between April and May. The hilly topography requires the use of terraces for cropping and limits the level of mechanisation that can be adopted. Most potatoes in Nuwara Eliya are grown either for the fresh market with high quality tubers kept as seed for the next planting. Growers sow imported seed at both planting seasons. Planting cannot be done in May, June and July because of the heavy winds and rain. Similarly production in December and January is restricted because of the night frost in these two months. Badulla is in the up country intermediate zone at a lower altitude than Nuwara Eliya at 550 to 910 m with average temperatures between 18 and 25°C. The average annual rainfall is 1729 mm falling mainly between October and March. About 49,000t (70% of the national crop) of potatoes are grown on 4000 ha by 5,000 farmers at an average yield of 12.3t/ha. In Badulla there are two planting seasons, one in the uplands in November-December (Maha planting) and the other in June-July (Yala planting) in the paddy fields of lowlands after the rice harvest. Harvest is in March and April for the Maha planting and in October and November for the Yala planting. Most potatoes in Badulla are grown for the fresh market with growers using their own seed in June and July and imported seed for planting in November and December.
6
3.2.3. Seed supply Sri Lanka has a long history of importing seed potatoes and even imported Delaware seed from WA in the 1960s under the Colombo Plan. In the last decade the seed has come from Europe. There is no tariff on imported seed as it is recognised as a valuable input. The high production in 1995 was associated with high quantities (14,000 t) of imported seed. Recent quality problems have meant that new seed sources have been sought and WA received orders of about 2,000 tonnes in 2002. About 500 tonnes was sent mainly by “Potato International” (Iwan Gunawan, personal communication). This seed sold in the Sri Lankan highlands for about 100 Rs/kg (AUD $2.00 kg). Farm-gate price in WA was probably 0.70/kg for small tubers. In 2003 Western Potatoes had orders for 800 tonnes and Potato International planned to export another 500 tonnes to Sri Lanka. In Sri Lanka, imported seed is grown three times. The seed flow within Sri Lanka is shown in Figure 2. So total seed requirement can be estimated as ⅓ of their planting area multiplied by the seeding rate of 2.5 t/ha. In 2001 the area planted was 3,642 ha so seed requirement is 3,642/3 x 2.5 ≈ 3,000 tonnes. Demand may reach 6,500 tonnes if production returns to former high levels. European seed exporters are still active in this market. Most seed is imported by private companies (18 importers) with the government seed scheme only providing about 5% of requirements. Seed imports have fluctuated from 14,188 tonnes in 1995 to 7,029 tonnes in 2002 coming mainly from Germany, Holland, New Zealand and USA. The Sri Lankan Department of Agriculture also has a program to develop a local seed scheme based on pathogen tested material. Such schemes require isolated, “disease free” bulking areas large enough to produce sufficient seed to have a commercial impact on the industry. Similar schemes have failed in Indonesia, the Philippines and Vietnam because suitable seed bulking areas do not exist. Jayasinghe (2003) reports that in Indonesia such schemes have not worked because basic seed husbandry is neglected, early generation material becomes contaminated, government certification is not adequate and the quality seed that leaves the system is too small in quantity to have a practical impact on industry. The Department of Agriculture in Sri Lanka is also working to strengthen the informal seed potato systems used by farmers (Nugaliyadde, 2003).
3.2. Limits to yield Potatoes are an important crop in Sri Lanka but yields remain low: between 11-14 t/ha for the years 2000 to 2004 (FAOSTAT). Yield needs to be improved to increase production and profitability for the farmer. It is also imperative that Sri Lankan potato production becomes more competitive so that can become a sustainable industry, not dependent on tariff protection. Yields can reach 40 t/ha but unreliable rainfall, poor storage, variable seed quality, high incidence of bacterial and fungal diseases appear to be the major factors lowering yield (Sathiamoorthy et al. 1985). Considerable research has been undertaken in Sri Lanka to improve potato yield. Disease and pest research includes examining the incidence and control measures of late blight (Wimalajeewa and Thavam 1974), potato cyst nematode (Globodera rostochiensis) (Toida and Ekanayake 1992) and bacterial wilt (Kelaniyangoda et al. 2002, Velupillai 1985). Nutrition work includes the use of potassium (Wijewardena and Amarasiri 1997), nitrogen (Vaz and Gunasena 1974), and phosphorus (Wijewardena 1994)

7
fertiliser in potato crops. Other agronomy research includes investigations of cultural methods, such as tuber size and spacing (Rajadurai 1994), inter-cropping (Kuruppuarachchi 1990), time of planting (Kuruppuarachchi 1987) and storage (Rhoades 1986).
Nuwara EliyaPlanting(Aug - Sep)
Planting(Feb - Mar)
Badulla
DOA seed
Imported seed
Planting in hills(Nov - Dec)
Planting in lowerpaddy fields(Jun - Jul)
Figure 2. Seed flow for the Nuwara Eliya and Badulla districts in Sri Lanka (Nugaliyadde, personal communication). Surveys of agronomic conditions and practices have been used to identify limits to potato yields in different countries. For example a survey of agronomy conditions and practices were related to yield and used to identify factors limiting or enhancing potato yield in the Red River Delta of Vietnam (McPharlin et al. 2003). Low yield was associated with low N, P and K concentration in the petioles, low plant density, multiple rather than single incidence of diseases (late blight, bacterial wilt, Rhizoctonia) and single rather than multiple break crops (i.e. rice) between potatoes in the rotation. The higher incidence of pests identified in the higher yielding crops in the Vietnam survey suggested that maybe these farmers were better ‘educated’ in pest management. Other surveys have concluded that farmer education level leads to higher technical efficiency. For example it was concluded that better educated farmers were more technically efficient in a survey of 55 potato farmers in Badulla, Sri Lanka, during the July to October crop of 1999 (Amarasinghe and Weerahewa 2001). Either very low or very high plant density can reduce total yield (Struik and Weirsema 1999). In Vietnam low plant density, less than half the density used in Australian crops, was associated with low yield in flood-irrigated winter grown crops in the Red River Delta (McPharlin et al. 2003). In West Java total yield of Atlantic crops sown with whole seed was 29% higher at a 70 x 20 cm compared with a 70 x 30 cm spacing (Dawson et al. 2005).

8
Similarly yield of irrigated Desiree decreased as plant spacing increased from 60 x 20 cm to 60 x 50 cm in Kilinochchi, Sri Lanka (Rajadurai 1994). Increasing density usually leads to a higher yield of smaller tubers and the converse occurs as density is reduced (Travis 1987, Rajadurai 1994). Seed or seed piece size can influence potato yield either directly, as a source of energy for the growing plant, or indirectly through its influence on plant and stem density. The pattern of yield response to seed size is that yield can be reduced by small seed size but can also be reduced with large seeds because of very high stem density as there are more eyes on larger compared with smaller tubers (Struik and Weirsema 1999). The optimum size of seed to sow to obtain maximum yield can therefore vary with variety and a range of agronomic and environmental conditions but is usually between 30 and 80g. Yield of Desiree increased as seed size increased from 15-30 mm to 45-55 mm in Sri Lanka (Rajadurai 1994). However due to the high cost of seed, income was optimised if larger seed was sown at the highest (60 x 50 cm) spacing. Seed size doesn’t always effect yield as it did not appear to influence yield of survey crops in Vietnam (McPharlin et al. 2003). Measurements of soil structure, penetration resistance and fertiliser application were significantly correlated with potato yield in a survey of agronomic conditions on ferrosols and dermosols in Tasmania (Cotching et al. 2004). The purpose of this project was to identify agronomic factors limiting potato yield in major production areas of Sri Lanka. This information would enable future projects to test ways to overcome the constraints and lead to the development of best management practices which will assist Sri Lankan farmers produce higher yields. The ability to produce higher yields will help make expensive imported seed more affordable for farmers.

9
4. Materials & Methods
Survey Design Agronomic conditions and practices were examined over 2 crops by CIC field officers. The first crop (crop 1) was planted at Nuwara Eliya. Here 30 farmer sites were surveyed. These sites were sown from the 02/02/04 to the 24/04/04 and harvested from the 25/05/04 to the 24/07/04. The survey was repeated in Badulla (crop 2). Here 30 sites were surveyed with sites sown from the 28/06/04 to the10/08/04 and harvested from the 12/09/04 to the 27/10/04. This survey used a “Stratified Cluster Sampling” design as the regions were not randomly selected, i.e. stratified, but chosen because they were important potato growing regions. The grower sites within each region were randomly selected from crops planted with the variety Granola. The survey questionnaire is shown in Appendix 1.
Assessment of Agronomic practices and conditions
Practices Agronomic practices such as sowing (rate, depth, date, method), rotation, tillage (method, frequency, depth), irrigation, fertiliser, weed, pest and disease management, selection and treatment of seed, date and method of harvest etc were determined mainly from grower responses to the questionnaire.
Conditions Agronomic conditions such as soil and plant nutrient status, incidence of pests and diseases were determined from direct measurement or fortnightly monitoring before and/or after sowing. For example the soil samples were analysed for nutrients before sowing and plants for nutrients after sowing. Sampling and analysis of soil for nutrients Ten – 15 soil samples were collected from the topsoil (0-15 cm) at each site and dried at ambient temperature for 3-4 days prior to chemical analysis. Dried soil samples were submitted to the CIC Soil Laboratory and analysed for extractable or exchangeable nutrients using multinutrient extractants: NaHCO3, NH4F and EDTA for P, K, Mn, Cu, Zn, Fe; KCl for Ca, Mg and Na and Calcium phosphate for B and SO4-S (after Portch and Hunter 2002). All results were expressed as µg/g dry soil basis for nutrients and as 1:5 soil/water for pH.
Sampling and analysis of plants for nutrients At each site the petiole of the 4th or 5th leaf from the growing point was sampled form 20 plants. In crop 1 these were sampled twice at 42 and 60 days after sowing. In crop 2 petioles were sampled 3 times, 21, 42 and 60 days after sowing. All samples were dried at 70°Cin a force draught oven for 48 h and submitted to the CIC laboratory for macro (N, P, K, Mg, Ca, S, Na) and micro (Fe, Mn, Cu, Zn) nutrient analysis. All results were expressed as % dry petiole basis for macro-nutrients and as µg/g for micro-nutrients.

10
Identification of pest type and assessment of incidence Farmers recorded incidence of pests in the crop during growth as well as in the stored produce. Control measures, such as chemical application and cultural methods prior and during the crop was also recorded. Pests were identified by the farmer and confirmed by a CIC field officer.
Identification of disease type and assessment of incidence Farmers were asked to record the incidence of diseases that were present during the crop as well as during seed storage. Again, disease control measures used by each farmer was recorded. Diseases were diagnosed by the farmer and confirmed by a pathologist from the Agricultural Research Station, Sita Eliya.
Yield The total, marketable and reject yield of the crop at each site was determined at harvest from the total yield recorded by the farmer.
Data analysis Simple linear regression were used to analyse the relationship between the continuous measures of agronomic conditions (i.e. soil and plant nutrient concentrations), practices (i.e. plant spacing) versus yield across the all the sites in both crops. A probability of <0.05 was used as the minimum level of significance. Concentrations of nutrients considered deficient, adequate or excessive (toxic) according to Huett et al. (1999) were shown as vertical lines on each regression. Discrete data such as pest and disease presence was analysed by placing the 30 growers in quartiles according to yield. There were 9, 10 and 11 growers in the first, second and third quartiles respectively (for the first planting). The data was then tabulated according to quartile and a logistic regression (binomial function) or Poisson logarithmic linear regression (multinomial function), based on average yield, was then performed to determine significance. The Binomial function was performed when there were only two factors to choose from or when growers answered a question multiple times and a P value provided for each factor tested. The multinomial function was chosen when there were multiple options but growers only answered once and a single P value is provided for all factors tested. These functions are referred to in the results text as the logistic regression and the log linear regression respectively. Due to the small sample size (30 growers) a significance level of 0.1 (10%) was used. Data was converted to percentages of grower responses for the Highest Yielding Quartile (HYQ) and the Lowest Yielding Quartile (LYQ) by dividing the number of responses for each individual option by the number in each quartile, i.e 9 and 11. As there were growers who gave multiple responses for questions 7, 12, 18, 20, 38 and 40 the percentages in each quartile do not add to 100 percent in these questions. Each answer given in these questions were considered independent of one another and therefore each individual response in these questions was still converted to percentage by dividing by the numbers in its corresponding quartile.
11
5. Results
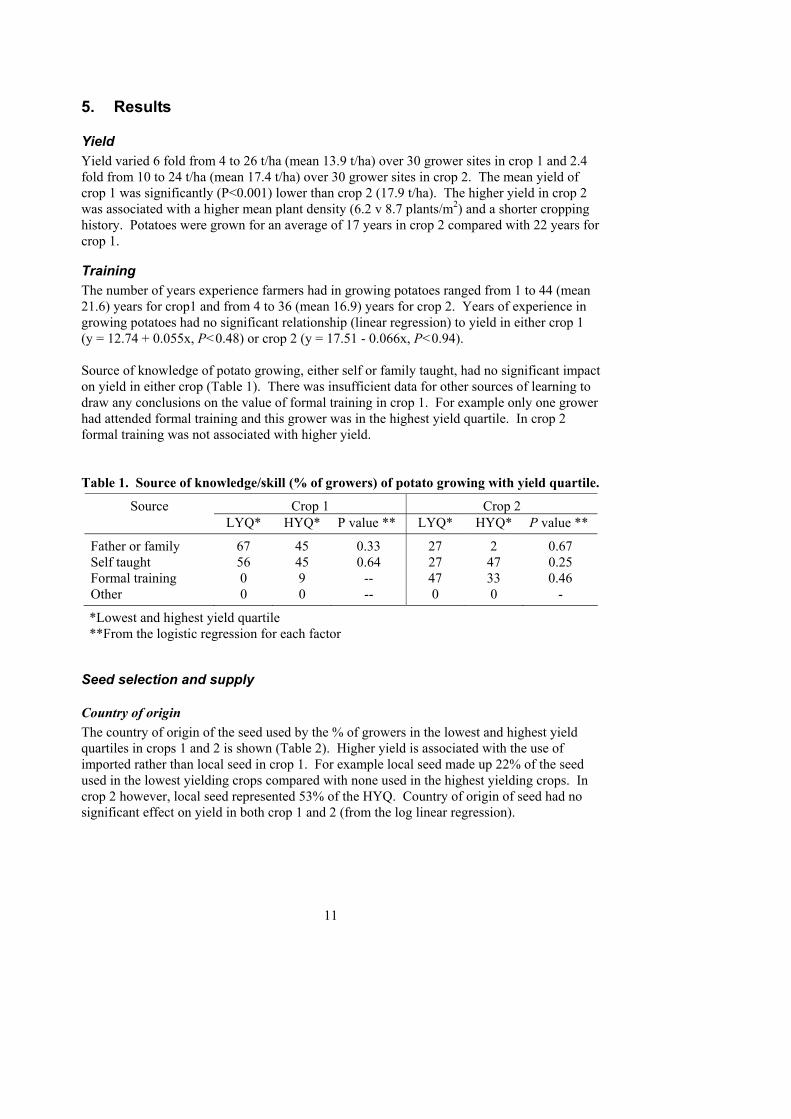
Yield Yield varied 6 fold from 4 to 26 t/ha (mean 13.9 t/ha) over 30 grower sites in crop 1 and 2.4 fold from 10 to 24 t/ha (mean 17.4 t/ha) over 30 grower sites in crop 2. The mean yield of crop 1 was significantly (P<0.001) lower than crop 2 (17.9 t/ha). The higher yield in crop 2 was associated with a higher mean plant density (6.2 v 8.7 plants/m2) and a shorter cropping history. Potatoes were grown for an average of 17 years in crop 2 compared with 22 years for crop 1.
Training The number of years experience farmers had in growing potatoes ranged from 1 to 44 (mean 21.6) years for crop1 and from 4 to 36 (mean 16.9) years for crop 2. Years of experience in growing potatoes had no significant relationship (linear regression) to yield in either crop 1 (y = 12.74 + 0.055x, P<0.48) or crop 2 (y = 17.51 - 0.066x, P<0.94). Source of knowledge of potato growing, either self or family taught, had no significant impact on yield in either crop (Table 1). There was insufficient data for other sources of learning to draw any conclusions on the value of formal training in crop 1. For example only one grower had attended formal training and this grower was in the highest yield quartile. In crop 2 formal training was not associated with higher yield. Table 1. Source of knowledge/skill (% of growers) of potato growing with yield quartile.
Crop 1 Crop 2 Source LYQ* HYQ* P value ** LYQ* HYQ* P value **
Father or family 67 45 0.33 27 2 0.67 Self taught 56 45 0.64 27 47 0.25 Formal training 0 9 -- 47 33 0.46 Other 0 0 -- 0 0 -
*Lowest and highest yield quartile **From the logistic regression for each factor
Seed selection and supply
Country of origin The country of origin of the seed used by the % of growers in the lowest and highest yield quartiles in crops 1 and 2 is shown (Table 2). Higher yield is associated with the use of imported rather than local seed in crop 1. For example local seed made up 22% of the seed used in the lowest yielding crops compared with none used in the highest yielding crops. In crop 2 however, local seed represented 53% of the HYQ. Country of origin of seed had no significant effect on yield in both crop 1 and 2 (from the log linear regression).

12
Table 2. The % of growers using seed of different origin with yield quartile.
Crop 1 Crop 2 Origin LYQ* HYQ* P value ** LYQ* HYQ* P value **
Holland 67 73 20 33 Germany 11 18 - 7 U.S.A 0 0 - - Australia 0 9 - - India 0 0 - 7 Sri Lanka 22 0 80 53 Other 0 0
0.28
- -
0.25
*Lowest and highest yield quartile **From the log linear regression for all factors
Local source of seed The local source of the seed used by the % of growers in the lowest and highest yield quartiles is shown (Table 3). A greater proportion of growers (78% of LYQ and 91% of HYQ in crop 1, 60% of LYQ and 73% of HYQ in crop 2) used seed that wasn’t their own. However, using their own seed or other sources had no significant effect on yield in crop 1 and 2 (from the logistic regression). Table 3. The % of growers using different methods of seed supply with yield quartile.
Crop 1 Crop 2 Source LYQ* HYQ* P value ** LYQ* HYQ* P value **
Own seed 22 9 0.32 40 27 0.44 Other 78 91 0.32 60 73 0.44
*Lowest and highest yield quartile **From the logistic regression for each factor
Number of seasons that seed was retained The number of seasons for which growers retained and re-used seed by the % of growers in the lowest and highest yield quartiles is shown (Table 4). Of the thirty growers in crop 1, 89% and 91% of the LYQ and HYQ, respectively, used seed that they had retained for 2 seasons. The number of seasons that the seed had been retained had no significant effect on yield (from the logistic regression) in crop 1 and 2 (Table 4).

13
Table 4. The % of growers retaining seed for different times by yield quartile.
Crop 1 Crop 2 Number of season seed kept LYQ* HYQ* P value ** LYQ* HYQ* P value **
Previous season 11 9 0.43 60 30 0.29 2 seasons 89 91 0.43 40 70 0.29
>2 seasons 0 0 - 0 0 -
*Lowest and highest yield quartile **From the logistic regression for each factor
Reasons for buying seed The reason for buying of seed by the % of growers in the lowest and highest yield quartiles is shown (Table 5). Buying seed based on variety was significantly (P<0.024, logistic regression) related to yield in crop 1 (Table 5). No other reasons for buying seed had any significant impact on yield in crops 1 and 2. Table 5. The % of growers buying seed for different reasons with yield quartile.
CROP 1 CROP 2 Reason for seed purchase LYQ* HYQ* P value ** LYQ* HYQ* P value **
Price 0 0 - 0 0 - Country of origin 22 27 0.80 20 27 0.67 Variety 67 100 0.02 80 67 0.40 Availability 11 0 - 0 0 - Previous experience 22 36 0.48 47 47 0.87 Other 11 0 - 0 7 0.23
*Lowest and highest yield quartile **From the logistic regression for each factor
Price of seed The price growers paid for seed ranged from 100 to 125 Rs/kg (mean 120) in crop 1 to 100 to 135 Rs/kg (mean 109) in crop 2. There was no significant relationship (linear regression) between the price paid for seed and yield (y = 2.5 + 0.098x,P<0.56) in crop 1 whilst in crop 2 yield increased significantly (y = 60.5 + 0.104x,P<0.05) with seed price.
Grading seed Grading seed (or not) by the % of growers in the lowest and highest yield quartiles is shown (Table 6). Of the thirty growers in the first crop, only 44 and 36% of the LYQ and HYQ, respectively, graded their seed before planting. In crop 2, 67% of the LYQ and 87% of the HYQ graded their crop. There was no significant effect of grading seed before planting and yield in both crops (from the logistic regression).

14
Table 6. The % of growers who graded seed with yield quartile.
Crop 1 Crop 2 Grading LYQ* HYQ* P value ** LYQ* HYQ* P value **
Yes 44 36 0.71 67 87 0.19 No 56 64 0.71 33 13 0.19
*Lowest and highest yield quartile **From the logistic regression for each factor
Seed quality
Generation number The generation number of seed purchased by the % of growers in the lowest and highest yield quartiles is shown (Table 7). There was no significant effect (P<0.42) of seed generation on yield (log linear regression) in either crop. However lowest yield was associated with higher use of seed of unknown generation and there was more use of seed of known generation in the highest yield quartile. Table 7. The % of growers using seed of different generation with yield quartile.
Crop 1 Crop 2 Generation number LYQ* HYQ* P value ** LYQ* HYQ* P value **
G2 0 0 0 7 G4 0 9 0 0 G5 0 0 0 0 G6 0 18 0 0 G7 11 9 0 0 G7 11 9 0 0
Unknown 89 63
<0.42
100 93
0.23
*Lowest and highest yield quartile **From the log linear regression for all factors
Seed Selection
External factors The reasons for selecting seed by % of growers in the lowest and highest yield quartile is shown (Table 8). Selecting seed based on size or appearance had no significant effect on yield in both crop 1 and crop 2 (log linear regression). However most (72% of the HYQ and 78% of the LYQ) of the growers in crop 1 selected seed based on appearance. The majority of LYQ and HYQ growers (both 86%) in crop 2 selected their seed based on both size and appearance.

15
Table 8. The% of growers using different criterion for selecting seed with yield quartile.
Crop 1 Crop 2 Selection LYQ* HYQ* P value ** LYQ* HYQ* P value **
Size 0 9 7 7 Appearance 78 72 7 7 Size & appearance 22 18
0.24
86 86
1.00
*Lowest and highest yield quartile **From the log linear regression for all factors
Pest and diseases of seed The pests and or diseases on seed by % of growers in the lowest and highest yield quartiles are shown (Table 9). Higher rodent numbers on seed were associated with higher yield (logistic regression). The absence of pests or diseases on seed during storage had no significant effect on yield on both crop 1 and crop 2. Table 9. The % of grower seed lots with different pests and diseases and yield quartile.
Crop 1 Crop 2 Pest or disease LYQ* HYQ* P value ** LYQ* HYQ* P value **
None 44 18 0.16 7 13 0.54 Soft Rot 0 0 - 7 0 0.23 Dry Rot/Fusarium 0 0 - 20 7 0.27 Bacterial Wilt 0 0 - 0 7 0.23 Mealy Bug 0 0 - 0 0 - Tuber moth 56 27 0.21 47 67 0.27 Aphids on sprout 67 72 0.79 47 67 0.27 Rodents 0 36 0.02 13 13 - Shrinkage 0 0 - 0 0
*Lowest and highest yield quartile **From the logistic regression for each factor
Seed sprout number length and yield There was slightly lower number of sprouts/seed in the HYQ (4.8) compared with LYQ (5.3) in crop 1 but this was not significantly different (P<0.22, t test). Y = 21.0 - 1.39X (R2=0.06, P<0.11). Sprout length of seed from LYQ (2.7 mm) was not significantly different (P<0.88) to seed from the HYQ (2.6 mm) in crop 1.
Seed Storage The method of seed storage by % of growers in the lowest and highest yield quartiles is shown (Table 10). All thirty growers in crop 1 bought seed in boxes while 22% and 18% of the LYQ and HYQ, respectively, bought further seed in net bags. Buying seed in net bags

16
had no significant effect on yield in crop 1 (logistic regression). In crop 2 there was a significant relationship between yields and storing seed in boxes. The mean length of seed storage was the same for both LYQ and HYQ in crop 1 (15.8 weeks) and 2 (15.3 weeks) and therefore had no significant effect on yield (t test). Table 10. The% of growers using different storage methods and yield quartile.
Crop 1 Crop 2 Source LYQ* HYQ* P value ** LYQ* HYQ* P value **
Boxes 100 100 0.86 87 80 0.001 Net bags 22 18 0.86 13 20 0.001 Other 0 0 - 0 0 -
*Lowest and highest yield quartile **From the logistic regression for each factor
Seed preparation and treatment The method of seed preparation by % of growers in the lowest and highest yield quartiles is shown (Table 11). A greater proportion of the HYQ (63%) planted small tubers at high densities while a greater proportion of the LYQ (56%) used cut large tubers in crop 1. A greater proportion of the HYQ (66%) used cut large tubers in crop 2. The method of grading seed had no significant effect on yield in crop 1 and crop 2 (log linear regression). Table 11. The % of growers using various grading techniques prior to planting and
yield quartile.
Crop 1 Crop 2 Source LYQ* HYQ* P value ** LYQ* HYQ* P value **
Cut large tubers 56 18 46 66 Plant small tubers at higher density
33 63 27 7
Discard bad seed 11 18
0.44
27 27
0.29
*Lowest and highest yield quartile **From the log linear regression for all factors
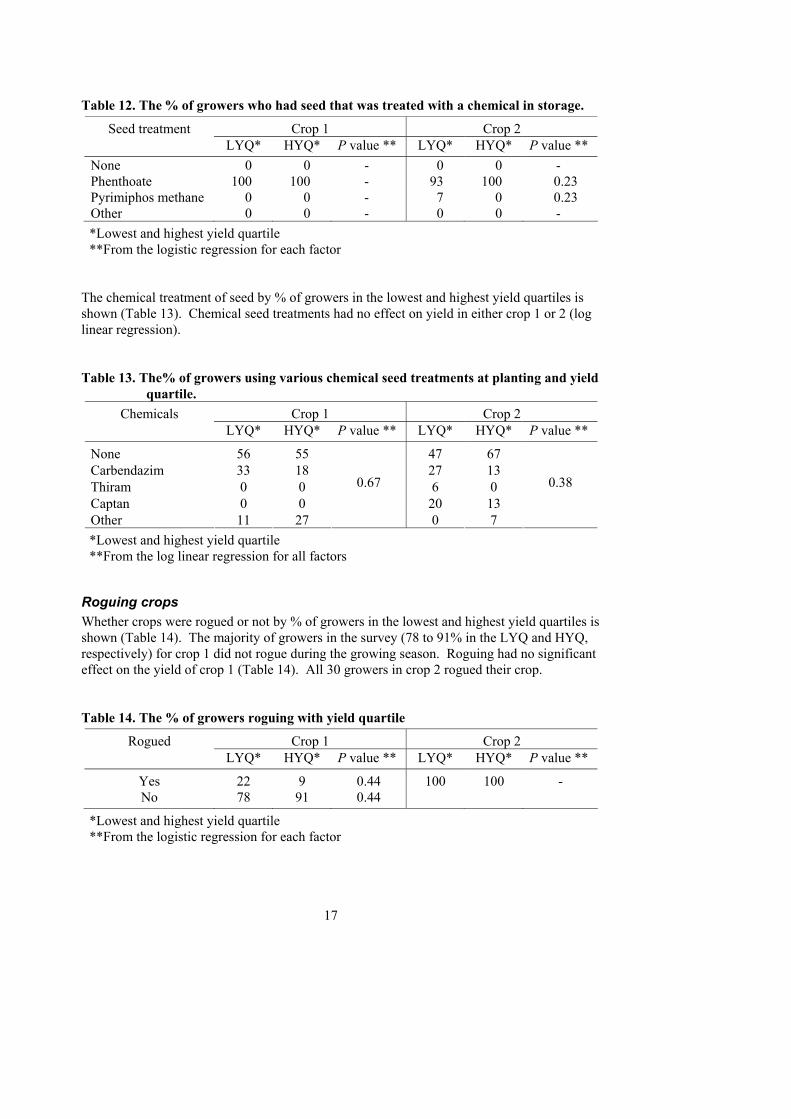
The pesticide seed treatment by % of growers in the lowest and highest yield quartiles is shown (Table 12). All thirty growers in the first crop bought seed that was treated with phenthoate in storage. The majority of growers in crop 2 also used phenthoate. There was no significant difference in yield between using phenthoate and pyrimiphos methane in crop 2.
17
Table 12. The % of growers who had seed that was treated with a chemical in storage.
Crop 1 Crop 2 Seed treatment LYQ* HYQ* P value ** LYQ* HYQ* P value **
None 0 0 - 0 0 - Phenthoate 100 100 - 93 100 0.23 Pyrimiphos methane 0 0 - 7 0 0.23 Other 0 0 - 0 0 - *Lowest and highest yield quartile **From the logistic regression for each factor
The chemical treatment of seed by % of growers in the lowest and highest yield quartiles is shown (Table 13). Chemical seed treatments had no effect on yield in either crop 1 or 2 (log linear regression). Table 13. The% of growers using various chemical seed treatments at planting and yield
quartile. Crop 1 Crop 2 Chemicals
LYQ* HYQ* P value ** LYQ* HYQ* P value **
None 56 55 47 67 Carbendazim 33 18 27 13 Thiram 0 0 6 0 Captan 0 0 20 13 Other 11 27
0.67
0 7
0.38
*Lowest and highest yield quartile **From the log linear regression for all factors
Roguing crops Whether crops were rogued or not by % of growers in the lowest and highest yield quartiles is shown (Table 14). The majority of growers in the survey (78 to 91% in the LYQ and HYQ, respectively) for crop 1 did not rogue during the growing season. Roguing had no significant effect on the yield of crop 1 (Table 14). All 30 growers in crop 2 rogued their crop. Table 14. The % of growers roguing with yield quartile
Crop 1 Crop 2 Rogued LYQ* HYQ* P value ** LYQ* HYQ* P value **
Yes 22 9 0.44 100 100 - No 78 91 0.44
*Lowest and highest yield quartile **From the logistic regression for each factor

18
Pest and Diseases during planting The type of pests in crops by % of growers in the lowest and highest yield quartiles is shown (Table 15). The relationship between the presence of cutworm in crops and yield was significant (logistic regression) with a higher % of growers reporting cutworm at higher yields in crop 1. A higher incidence of mites during crop 2 was associated with higher yields. A higher incidence of white grubs during crop 2 was significantly related to lower yields. The presence of other pests had no significant effect on the yield on both crop 1 and crop 2. Table 15. The % of grower crops with different pests and yield quartile.
Crop 1 Crop 2 Pest LYQ* HYQ* P value ** LYQ* HYQ* P value **
Don’t know 11 0 - 7 0 0.23 Aphids 22 0 0.19 13 33 0.19 Cutworm 67 100 0.04 80 87 0.62 Thrips 11 0 - 7 7 - Leaf miner 78 45 0.14 60 33 0.14 Mites 22 0 0.25 0 27 0.01 White grubs 33 27 0.78 40 7 0.03 Other 0 0 - 0 0 -
*Lowest and highest yield quartile **From the logistic regression for each factor
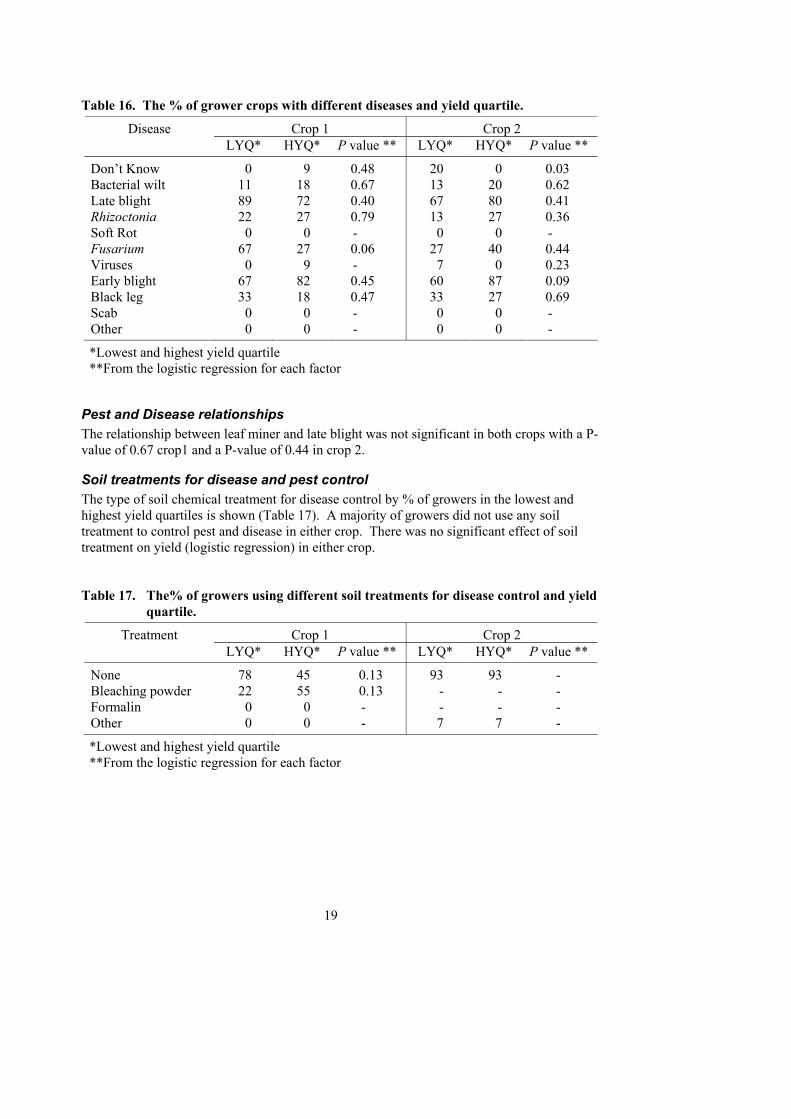
The type of diseases in crops by % of growers in the lowest and highest yield quartiles is shown (Table 16). The presence of Fusarium dry rot in the potato crops of crop 1 had a significant effect on yield (logistic regression). A higher percentage (67%) of the LYQ reported having Fusarium than the HYQ (27%) in crop 1. There was a significant relationship between those growers in crop 2 that did not know what disease was present in their crop and low yields. Higher yields were associated with early blight incidence in crop 2 but other diseases did not have a significant effect on the yield in both crops 1 and crop 2.
19
Table 16. The % of grower crops with different diseases and yield quartile.
Crop 1 Crop 2 Disease LYQ* HYQ* P value ** LYQ* HYQ* P value **
Don’t Know 0 9 0.48 20 0 0.03 Bacterial wilt 11 18 0.67 13 20 0.62 Late blight 89 72 0.40 67 80 0.41 Rhizoctonia 22 27 0.79 13 27 0.36 Soft Rot 0 0 - 0 0 - Fusarium 67 27 0.06 27 40 0.44 Viruses 0 9 - 7 0 0.23 Early blight 67 82 0.45 60 87 0.09 Black leg 33 18 0.47 33 27 0.69 Scab 0 0 - 0 0 - Other 0 0 - 0 0 -
*Lowest and highest yield quartile **From the logistic regression for each factor
Pest and Disease relationships The relationship between leaf miner and late blight was not significant in both crops with a P-value of 0.67 crop1 and a P-value of 0.44 in crop 2.
Soil treatments for disease and pest control The type of soil chemical treatment for disease control by % of growers in the lowest and highest yield quartiles is shown (Table 17). A majority of growers did not use any soil treatment to control pest and disease in either crop. There was no significant effect of soil treatment on yield (logistic regression) in either crop. Table 17. The% of growers using different soil treatments for disease control and yield
quartile.
Crop 1 Crop 2 Treatment LYQ* HYQ* P value ** LYQ* HYQ* P value **
None 78 45 0.13 93 93 - Bleaching powder 22 55 0.13 - - - Formalin 0 0 - - - - Other 0 0 - 7 7 -
*Lowest and highest yield quartile **From the logistic regression for each factor

20
The type of chemical treatment of soil for nematode control by % of growers in the lowest and highest yield quartiles is shown (Table 18). The majority of growers, 89% (LYQ) and 81% (HYQ), used carbofuran to control nematodes before planting their potato crop in crop 1. Again the majority, 87% (LYQ) and 86% (HYQ), used carbofuran to control nematodes in crop 2. The use of nematicides to control nematodes prior to planting had no significant effect on yield in both crops (log linear regression). Table 18. The % of growers using a nematicide before planting and yield quartile.
Crop 1 Crop 2 Nematicide LYQ* HYQ* P value ** LYQ* HYQ* P value **
None 11 9 13 7 Carbofuran 89 82 87 86 Unknown 0 9
0.72
0 7
0.42
*Lowest and highest yield quartile **From the log linear regression for all factors
The type of soil treatment for insect control by % of growers in the lowest and highest yield quartiles is shown (Table 19). Fifty-six percent and 82% of growers in the LYQ and HYQ respectively in crop1 and 100% and 93% in crop 2 used chemicals to control insects prior to planting their potato crop. The different techniques used to control insects prior planting had no significant on yield (log linear regression). Table 19. The % of growers using different pre-plant insect control and yield quartile.
Crop 1 Crop 2 Treatment LYQ* HYQ* P value ** LYQ* HYQ* P value **
Neem 33 18 0 0 Tea waste 11 0 0 7 Tobacco waste 0 0 0 0 Chemical 56 82
0.74
100 93
0.7
*Lowest and highest yield quartile **From the log linear regression for all factors
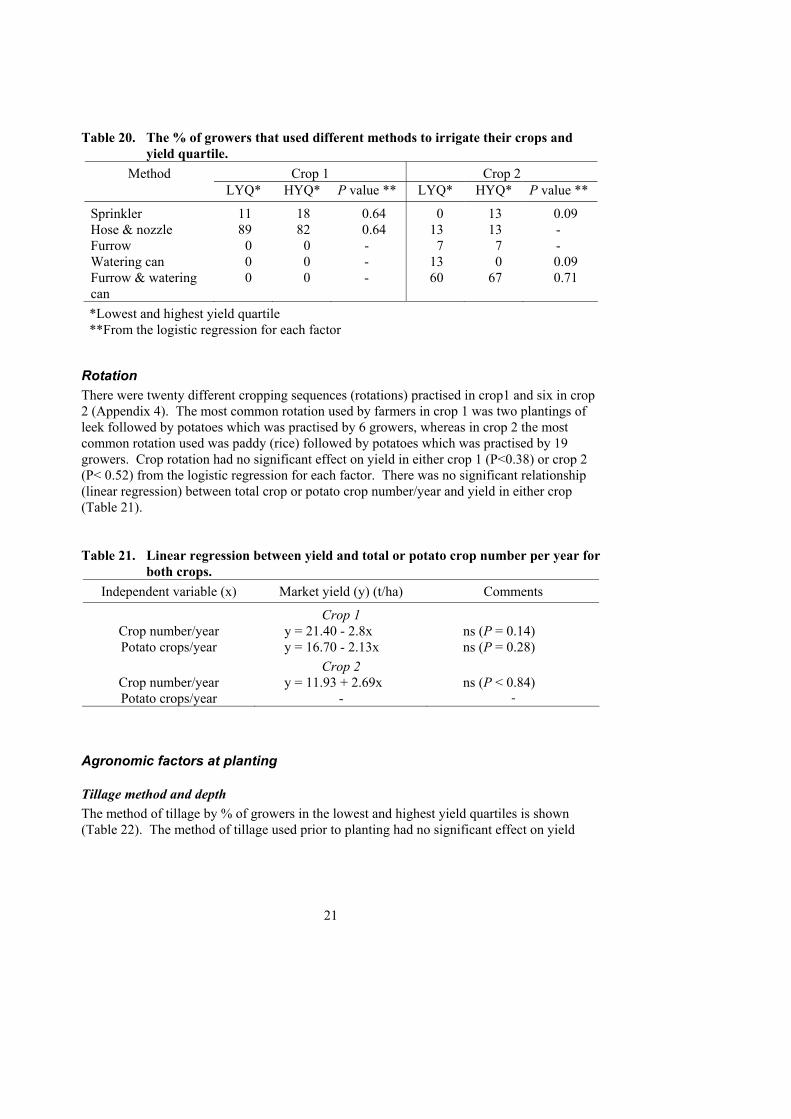
Irrigation practices The different irrigation practices used by % of growers in the lowest and highest yield quartiles are shown (Table 20). The majority of growers, 88% and 81% of LYQ and HYQ, irrigated their crops using a hose and nozzle, while 11% and 18% of LYQ and HYQ used a sprinkler system in crop 1. The use of a hose and nozzle to irrigate had no significant effect on yield (logistic regression) in crop 1 nor furrow and watering can in crop 2. In crop 2 the use of sprinklers was significantly related to higher yield and the use of watering cans with lower yield. There was a trend for yield to increase with number of irrigations in crop 1 (y = 4.96 + 0.53x,P<0.09) but not in crop 2 (y = 15.13 + 0.14x,P<0.6).
21
Table 20. The % of growers that used different methods to irrigate their crops and
yield quartile. Crop 1 Crop 2 Method
LYQ* HYQ* P value ** LYQ* HYQ* P value **
Sprinkler 11 18 0.64 0 13 0.09 Hose & nozzle 89 82 0.64 13 13 - Furrow 0 0 - 7 7 - Watering can 0 0 - 13 0 0.09 Furrow & watering can
0 0 - 60 67 0.71
*Lowest and highest yield quartile **From the logistic regression for each factor
Rotation There were twenty different cropping sequences (rotations) practised in crop1 and six in crop 2 (Appendix 4). The most common rotation used by farmers in crop 1 was two plantings of leek followed by potatoes which was practised by 6 growers, whereas in crop 2 the most common rotation used was paddy (rice) followed by potatoes which was practised by 19 growers. Crop rotation had no significant effect on yield in either crop 1 (P<0.38) or crop 2 (P< 0.52) from the logistic regression for each factor. There was no significant relationship (linear regression) between total crop or potato crop number/year and yield in either crop (Table 21). Table 21. Linear regression between yield and total or potato crop number per year for
both crops. Independent variable (x) Market yield (y) (t/ha) Comments
Crop 1 Crop number/year y = 21.40 - 2.8x ns (P = 0.14) Potato crops/year y = 16.70 - 2.13x ns (P = 0.28)
Crop 2 Crop number/year y = 11.93 + 2.69x ns (P < 0.84) Potato crops/year - -
Agronomic factors at planting
Tillage method and depth The method of tillage by % of growers in the lowest and highest yield quartiles is shown (Table 22). The method of tillage used prior to planting had no significant effect on yield
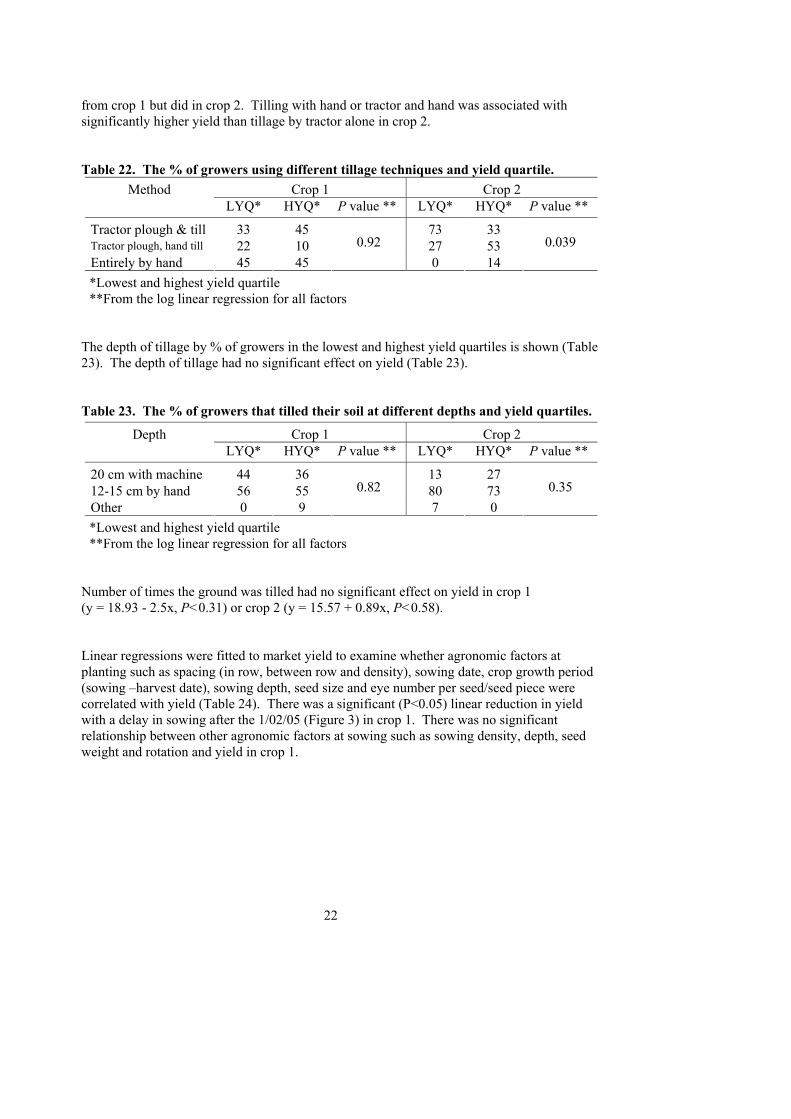
22
from crop 1 but did in crop 2. Tilling with hand or tractor and hand was associated with significantly higher yield than tillage by tractor alone in crop 2. Table 22. The % of growers using different tillage techniques and yield quartile.
Crop 1 Crop 2 Method LYQ* HYQ* P value ** LYQ* HYQ* P value **
Tractor plough & till 33 45 73 33 Tractor plough, hand till 22 10 27 53 Entirely by hand 45 45
0.92
0 14
0.039
*Lowest and highest yield quartile **From the log linear regression for all factors
The depth of tillage by % of growers in the lowest and highest yield quartiles is shown (Table 23). The depth of tillage had no significant effect on yield (Table 23). Table 23. The % of growers that tilled their soil at different depths and yield quartiles.
Crop 1 Crop 2 Depth LYQ* HYQ* P value ** LYQ* HYQ* P value **
20 cm with machine 44 36 13 27 12-15 cm by hand 56 55 80 73 Other 0 9
0.82
7 0
0.35
*Lowest and highest yield quartile **From the log linear regression for all factors
Number of times the ground was tilled had no significant effect on yield in crop 1 (y = 18.93 - 2.5x, P<0.31) or crop 2 (y = 15.57 + 0.89x, P<0.58). Linear regressions were fitted to market yield to examine whether agronomic factors at planting such as spacing (in row, between row and density), sowing date, crop growth period (sowing –harvest date), sowing depth, seed size and eye number per seed/seed piece were correlated with yield (Table 24). There was a significant (P<0.05) linear reduction in yield with a delay in sowing after the 1/02/05 (Figure 3) in crop 1. There was no significant relationship between other agronomic factors at sowing such as sowing density, depth, seed weight and rotation and yield in crop 1.

23
Table 24. Linear regressions between agronomic factors at planting and yield. Independent variable (x) Market yield (y) (t/ha) Comments
Crop 1 Between row spacing (cm) y =31.3 - 0.296x ns (P = 0.36) Within row spacing (cm) y = 18.6 - 0.17x ns (P = 0.67) Density (plants/ha) y = 7.84 + 0.98x ns (P = 0.50) Sowing depth (cm) y = 11.24 + 0.635x ns (P = 0.42) Seed weight (g) y = 16.97 - 0.14x ns (P = 0.45) Crop number/year y = 21.40 - 2.8x ns P = 0.14) Potato crops/year y = 16.70 - 2.13x ns (P = 0.28) Sowing date (days after 01/02/04) y = 17.40 - 0.12x significant (P < 0.05) Crop growth period* y = 24.24 - 0.95x ns (P < 0.18) Crop 2 Between row spacing (cm) y = 13.9 + 0.067x ns (P < 0.84) Within row spacing (cm) y = 14.3 + 0.14x ns (P < 0.59) Density(plants/ha) y = 19.68 - 0.26x ns (P < 0.63) Sowing depth (cm) y = 15.37 + 0.41x ns (P < 0.37) Seed weight (g) y = 36.23 - 0.34x significant (P < 0.03) Sowing date(days after 15/06/04) y = 19.07 - 0.078x ns (P < 0.38) Crop growth period** y = 14.87 + 0.032x ns (P < 0.54)
*Period between the date of sowing and harvest.
Time of planting(days after 1/2/04)0 20 40 60 80 100
Yiel
d (t/
ha)
0
5
10
15
20
25
30
y=17.40-0.12x, R2=0.10, P<0.05
Figure 3. Relationship between time of planting (days after 01/02/04) and yield.

24
Nutrients in Soil and Plant
Relationship between soil nutrients, pH and nutrients in petioles and yield The concentration (mean, range) of extractable or exchangeable nutrients in topsoil and their relationship to concentrations in petioles at the first sampling from crop 1 and crop 2 is shown (Table 25). Mean concentrations ranged from 0.08mg/kg B dry soil for extractable B to 1277mg/kg for exchangeable Ca in crop1 (Table 25) and from 0.72mg/kg B dry soil for extractable B to 761mg/kg for exchangeable Ca in crop2 (Table 25). There was no significant correlation (from the linear regression) between concentrations of soil nutrients and petiole nutrient concentrations in either crop. However there was a trend towards increasing petiole Mg with increasing soil exchangeable Mg (P<0.09) in crop 1 only. Table 25: Concentration (mean +/- SE, range in mg/kg dry soil) of nutrients in topsoil
(0-15 cm) prior to planting and results of linear regression of soil versus petiole concentrations at first sampling.
Nutrient Mean +/- SE (mg/kg dry wt)
Range (mg/kg dry wt)
Linear Regression of soil nutrient concentration and petiole nutrient
concentration
Crop 1 B* 0.08 +/- 0.02 0.01 - 0.31 - Ca** 1277 +/- 68 559 - 2098 y = 1.215-0.00173*x (P<0.43, ns) Cu*** 4.9 +/- 0.44 1.8 - 13.2 y = 9.21+0.338x (P<0.64, ns) Fe*** 358 +/- 15 154 - 587 y = 52+0.51x (P<0.08, ns) K*** 240 +/- 18 13 - 463 y = 12+0.004x (P<0.59, ns) Mg** 112 +/- 6 48 - 190 y = 0.19+0.0006x (P<0.09, ns) Mn*** 18 +/-1 .4 8 - 35 y = 504+6.5x (P<0.17, ns) NH4-N** 4.3 +/- .65 1 - 15 - P*** 92 +/- 7 21 - 184 y = 0.45+0.0008x (P<0.32, ns) Zn*** 8.5 +/- 3 - 18 y = 90.2+0.45x (P<0.75, ns) pH (1:5H2O) 5.3 +/- 0.09 4.5 - 6.6 - Crop 2 B* 0.72 +/- 0.11 0.01 - 2.38 - Ca** 761 +/- 39 364 - 1150 y = 1.62-0.0008x (P<0.36,ns) Cu*** 7.64 +/- 0.47 3.16 - 11.6 y = 16.33-0.48x (P<0.13,ns) Fe*** 440 +/- 39 91 - 1046 y = 224+0.6x (P<0.99,ns) K*** 132 +/- 16 42 - 460 y = 16.36-0.007x (P<0.08,) Mg** 8.64 +/- 0.59 4 - 16 y = 0.23+0.0009x (P<0.3,ns) Mn*** 26 +/- 4 4 - 90 y = 199+2.36x (P<0.003, R2=0.3) NH4-N** 18 +/- 9 1 - 279 y = 2.67-0.002x (P<0.34,ns) P*** 37 +/- 6 9 - 126 y = 0.24+0.0008x (P<0.12,ns) Zn*** 5.84 +/- 1.42 1.2 - 40.6 y = 40.5+0.47x (P<0.15,ns) pH (H2O) 5.41 +/- 0.09 4.6 - 6.4 -
*Extractable in calcium phosphate **Exchangeable in KCl and *** Extractable in NaHCO3, NH4F and EDTA for P, K, Mn, Cu, Zn, Fe (after Portch and Hunter 2002).

25
The linear regressions between concentrations of nutrients in petioles at the first sampling of both crops and topsoil pH are shown (Table 26a). In crop 1 concentrations of Mg in the petiole increased significantly (P<0.023) and Mn decreased (P<0.027) with soil pH but pH was not correlated with the concentrations of other nutrients (Table 26a). In crop 2 concentrations of Zn in the petiole increased significantly (P<0.03) with soil pH but pH was not correlated with the concentrations of other nutrients (Table 26a).
Table 26a. Linear regressions of soil pH versus petiole nutrient concentrations at first sampling for Crop 1 & Crop 2.
Nutrient in petiole Linear regression of petiole nutrient levels and soil pH
Significance
Crop 1 Ca y = 2.17 - 0.22x (P<0.16) ns Cu y = 22.3 - 2.14x (P<0.48) ns Fe y = 285 - 9.5x (P<0.89) ns Mn y = 1414 - 149x (P<0.027) * Mg y = - 0.028 + 0.054x (P<0.023) * Zn y = 165 - 13.3x (P<0.20) ns Crop 2 Ca y = 2.12 - 0.21x (P<0.60) ns Cu y = 5.96 + 1.23x (P<0.44) ns Fe y = 70 + 28.6x (P<0.57) ns Mn y = 116 + 27x (P<0.52) ns Mg y = 0.63 - 0.06x (P<0.33) ns Zn y = - 17 + 11.19x (P<0.03, R2=0.17) **
Significance at *(P<0.05) or **(P<0.01) respectively The linear regressions between concentrations of nutrients in the soil prior to planting and yield are shown in Table 26b. Concentrations of Ca and Mg in the soil were significantly correlated with higher yield in crop 1 but not 2. The was no significant correlation between the concentrations of other nutrient in the soil and yield in either crop.

26
Table 26b. Linear regressions between soil nutrient concentrations and yield.
Nutrient in soil Linear regression between yield and soil nutrient concentration
Significance
Crop 1 B y =15.46 -1.1x (P<0.91) ns Ca y = 7.56 + 0.005x (P<0.04, R2=0.12) * Cu y = 16.24- 0.47x (P<0.22) ns Fe y = 17.55 – 0.01x (P<0.37) ns K y = 9.98 - 01x (P<0.08) ns Mg y = 8.2 + 0.05x (P<0.05, R2=0.10) * Mn y = 13.10+0.05x (P<0.7) ns NH4-N y = 12.41+0.36x (P<0.16) ns P y = 10.27+0.04x (P<0.08) ns Zn y = 11.36+0.30x (P<0.2) ns pH y = 2.89-1.46x (P<0.10, R2=0.06) ns Crop 2 B y = 16.72+0.63x (P<0.66) ns Ca y = 14.41 +0.0035x (P<0.38) ns Cu y = 17.12 +0.004x (P<0.99) ns Fe y = 15.77+ 0.003x (P<0.44) ns K y = 17.14+0.00013x (P<0.98) ns Mg y = 17.45 -0.0033x (P<0.89) ns Mn y = 16.65+0.02x (P<0.60) ns NH4-N y = 16.8 + 0.02x (P<0.2) ns P y = 15.39+0.05x (P<0.06) ns Zn y = 17.27-0.02x (P<0.86) ns pH y =15.88+0.24x (P<0.90)
Concentration of nutrients in petioles and yield
Micronutrients The concentration (mean, range) of micronutrients in petioles for two sampling times (crop 1) and for three sampling times (crop2) and their relationship to yield is shown Table 27. Mean Cu concentrations in petioles decreased from 10.9 mg/kg dry weight in sample 1 to 5.4 mg/kg in sample 2 in crop 1 and from 14.8 mg/kg in sample 3 to 8.46 mg/kg in sample 2 in crop 2. There was a significant negative correlation (P<0.01 sampling time 1, P<0.05 sampling time 2, from the linear regression) between yield and mg/kg Cu in the petioles at both sampling times in crop 1 (Figure 4) but not in crop 2 (Appendix 3, Figure 1). Although yields were reduced at high mg/kg Cu they were not significantly lower at Cu concentrations considered deficient (i.e., 3 to 5 mg/kg) at either sampling time in crop 1. Mean Fe concentrations in petioles decreased from 234 mg/kg dry weight in sample 1 to 151 in sample 2 in crop 1 and from 221 at sample 1 to 77 at sample 3 in crop 2. There was no significant correlation (from the linear regression) between mg/kg Fe in the petioles and yield

27
at either sampling time or crop (Appendix 2, Figure 1 and Appendix 3, Figure 2). Also there was no evidence of either Fe deficiency or toxicity at either sampling time. However there were some very low yields (<10 t/ha) at Fe concentrations considered excessive (i.e. > 150 mg/kg, Huett et al. 1997) at the first but not the second sampling. Table 27. Concentration (mean +/- SE and range in mg/kg dry basis) of micro-
nutrients in petioles at 2 or 3 samples times and linear regression of petiole concentrations versus yield for Crop 1 & Crop 2.
Nutrient Sampling time
Mean +/- SE (mg/kg)
Range (mg/kg)
Regression
Crop 1 Cu 1 10.9 +/- 1.4 0.5 - 23 y = 18.30 - 0.38x (P<0.01, R2=0.30) 2 5.4 +/- 0.44 2.2 - 11 y = 19.92 - 1.01x (P<0.05, R2=0.17) Fe 1 234 +/- 23 84 - 556 y = 16.69 - 0.012x (P<0.09, R2=0.06) 2 151 +/- 20 70 - 460 y = 14.35 - 0.001x (ns) Mn 1 618 +/- 34 166 - 933 y = 17.7 - 0.005x (ns) 2 812 +/- 71 337 - 1840 y = 15.2 - 0.0013x (ns) Zn 1 94 +/- 5.2 50 - 140 y = 18.39 - 0.047x (ns) 2 136 +/- 17 38 - 432 y = 15.52 - 0.008x (ns) Cu & Fe 1 - - y = 17.9 - 0.4Cu + 0.003Fe (P<0.014, R2=0.27) 2 - - y = 19.7 - 1.04Cu + 0.002Fe (P<0.09, R2=0.13) Cu & Zn 1 - - y = 23.2 - 0.4Cu - 0.05Zn (P<0.004R2=0.35) 2 - - y = 19.7 - 1.09Cu + 0.005Zn (P<0.08, R2=0.13) Cu 1 12.35 +/- 0.72 8 - 22 y = 18.15 - 0.075x (ns) 2 8.46 +/- 0.51 6 - 15 y = 18.73 - 0.154x (ns) 3 14.8 +/- 1.5 6 - 24 y = 17.20 + 0.054x (ns) Fe 1 221 +/- 22 95 - 650 y = 17.63 - 0.0018x (ns) 2 206 +/- 31 75 - 760 y = 17.65 - 0.00106x (ns) 3 77 +/- 6 55 - 125 y = 24.92 - 0.0895x (ns) Mn 1 260 +/- 19 80 - 460 y = 17.22 + 0.00005x (ns) 2 496 +/- 35 260 - 950 y = 16.15 + 0.00258x (ns) 3 772 +/- 67 380 - 1240 y = 19.92 - 0.00248x (ns) Zn 1 44 +/- 2.4 26 - 80 y = 21.92 - 19.1x (ns) 2 76 +/- 5 43 - 137 y = 18.93 - 0.0197x (ns) 3 76 +/- 5 55 - 110 y = 22.93 - 0.065x (ns) Cu & Fe 1 - - y = 18.3 - 0.06Cu - 0.0001Fe (ns) 2 - - y = 18.8 - 0.02Cu + 0.0007Fe (ns) 3 - - y = 23.2 + 0.2Cu + 0.11Fe (P<0.03, R2=0.30) Cu & Zn 1 - - y = 21.2 + 0.08Cu - 0.1Zn (ns) 2 - - y = 21.2 - 0.12Cu - 0.02Zn (ns) 3 - - y = 22.7 + 0.2Cu - 0.1Zn (ns)
Formatted: Bullets andNumbering
Formatted: Bullets andNumbering
Formatted: Bullets andNumbering

28
Sampling 2
Cu in petioles (ug/g DW)
0 2 4 6 8 10 12 14
Mar
keta
ble
Yiel
d (t/
ha)
-5
0
5
10
15
20
25
30
y=19.92-1.009x R2=0.17
P<0.05
Sampling 1
Cu in petioles (ug/g DW)
0 5 10 15 20 25 30
Mar
keta
ble
Yiel
d (t/
ha)
0
5
10
15
20
25
30
y=18.30-0.38x R2=0.30
P<0.01
Figure 4. Cu in petioles (mg/kg DW) with yield at 2 sampling times. Vertical, lines correspond to range of concentrations from minimum (< is deficient), left line, to maximum (> is toxic), right line, at each time.
29
Mean Mn concentrations in petioles increased from 618 mg/kg dry weight in sample 1 to 812 mg/kg in sample 2 in crop 1 and from 260 mg/kg in sample 1 to 772 mg/kg in sample 3 in crop 2. There was no significant correlation (from the linear regression) between Mn concentration in the petioles and yield at either sampling time or crop (Appendix 2, Figure 2 and Appendix 3, Figure 3). Also there was no evidence of either Mn deficiency or toxicity at either sampling time. However there were some very low yields (<10 t/ha) at Mn concentrations considered excessive (i.e. > 300mg/kg, Walworth and Muniiz 1993) at both sampling times. Mean Zn concentrations in petioles increased from 94mg/kg dry weight in sample 1 to 136 mg/kg in sample 2 in crop 1 and from 44 in sample 1 to 76 in samples 2 and 3 in crop 2. There was no significant correlation (from the linear regression) between mg/kg Zn in the petioles and yield at either sampling time or crop (Appendix 2, Figure 3 and Appendix 3, Figure 4). However one third of the sites at sampling one and two thirds at sampling two recorded Zn concentrations in petioles that maybe excessive (i.e. >110-180 mg/kg, Huett et al. 1997).
Effects of more than one nutrient The yield reduction in crop 1 with increasing Cu concentrations in the petioles was better explained when Zn concentration was included (R2 higher) in the regression than by Cu alone at least in sample 2 (Table 27). Yield reduction was not better explained with the addition of any other micronutrient concentration in the regression with Cu. In crop 2 yield reduction was best explained by concentrations of both Cu and Fe in the regression, for sample 3 only, compared to other nutrients alone or in combinations with others. Macronutrients
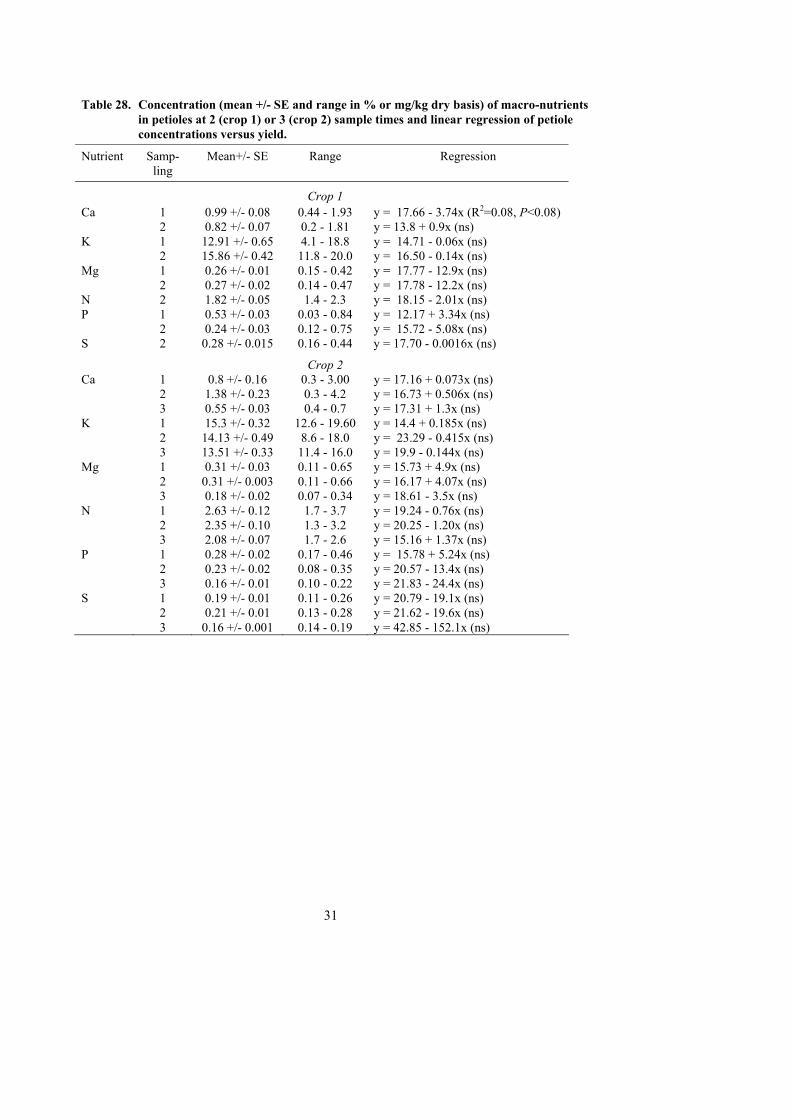
Crop 1 The concentration (mean and range) of macro nutrients in petioles and their relationship to yield at 2 sample times for crop 1 is shown in Table 28 and 3 sample times for crop 2 is shown in Table 28. Mean Ca concentrations in petioles were 0.99% and 0.82% dry basis in sample 1 and 2 respectively in crop 1 and increased from 0.55% in sample 3 to 1.38% in sample 2 in crop 2. There was no significant correlation (from the linear regression) between %Ca in the petioles and yield at either sampling time or crop (Appendix 2, Figure 4 and Appendix 3, Figure 5). Also there was no evidence of either Ca deficiency or excess at either sampling time. However there were some very low yields (<12 t/ha) at Ca concentrations considered excessive (i.e. > 1.5%, Huett et al. 1997) in sample 1 but not sample 2. Mean K concentrations in petioles increased from 12.91% dry weight in sample 1 to 15.86 in sample 2 in crop 1 and decreased from 15.3% in sample 1 to 13.51% in sample 3 in crop 2. There was no significant correlation (from the linear regression) between %K in the petioles and yield at either sampling time or crop (Appendix 2, Figure 5 and Appendix 3, Figure 6). Also there was no evidence of either K deficiency or excess at either sampling time in crop 1. However at the second sampling in crop 1 most sites recorded %K in petioles that maybe excessive (i.e. >14%, Huett et al. 1997).

30
Mean Mg concentrations in petioles were 0.26 and 0.27% dry weight in samples 1 and 2 respectively in crop 1 and from 0.31% in sample 1 and 2 to 0.18% in sample 3 in crop 2. There was no significant correlation (from the linear regression) between %Mg in the petioles and yield at either sampling time or crop (Appendix 2, Figure 6 and Appendix 3, Figure 7). Also there was no evidence of either Mg deficiency or excess at either sampling time. However there were some very low yields (<10t/ha) at Mg concentrations considered deficient (i.e. <0.3%, Huett et al. 1997) at both sampling times.
Nitrogen Mean N concentration in petioles was 1.82% dry weight in sample 2 in crop 1 and from 2.08 to 2.63% in crop 2. There was no significant correlation (from the linear regression) between %N in the petioles and yield in either crop at any sampling time (Appendix 2, Figure 7a, Appendix 3, Figure 8). Also there was no evidence of either N deficiency or excess although crops with <1.5% N in either crop maybe deficient (Maier et al. 1994).
Phosphorus Mean P concentrations in petioles decreased from 0.53% dry weight in sample 1 to 0.24 in sample 2. There was no significant correlation (from the linear regression) between %P in the petioles and yield at either sampling time (Appendix 2, Figure 8 and Appendix 3, Figure 9). Also there was no evidence of either P deficiency or excess at either sampling time. However at the second sampling most sites recorded %P in petioles that maybe inadequate (i.e. <0.3%, Huett et al. 1999).
Sulphur Mean S concentration in petioles in crop 1 was 0.28% dry weight in sample 2. There was no significant correlation (from the linear regression) between %S in the petioles and yield at sampling time two (Appendix 2, Figure 7b). Also there was no evidence of either S deficiency or excess.
31
Table 28. Concentration (mean +/- SE and range in % or mg/kg dry basis) of macro-nutrients in petioles at 2 (crop 1) or 3 (crop 2) sample times and linear regression of petiole concentrations versus yield.
Nutrient Samp- ling
Mean+/- SE Range Regression
Crop 1 Ca 1 0.99 +/- 0.08 0.44 - 1.93 y = 17.66 - 3.74x (R2=0.08, P<0.08) 2 0.82 +/- 0.07 0.2 - 1.81 y = 13.8 + 0.9x (ns) K 1 12.91 +/- 0.65 4.1 - 18.8 y = 14.71 - 0.06x (ns) 2 15.86 +/- 0.42 11.8 - 20.0 y = 16.50 - 0.14x (ns) Mg 1 0.26 +/- 0.01 0.15 - 0.42 y = 17.77 - 12.9x (ns) 2 0.27 +/- 0.02 0.14 - 0.47 y = 17.78 - 12.2x (ns) N 2 1.82 +/- 0.05 1.4 - 2.3 y = 18.15 - 2.01x (ns) P 1 0.53 +/- 0.03 0.03 - 0.84 y = 12.17 + 3.34x (ns) 2 0.24 +/- 0.03 0.12 - 0.75 y = 15.72 - 5.08x (ns) S 2 0.28 +/- 0.015 0.16 - 0.44 y = 17.70 - 0.0016x (ns) Crop 2
Ca 1 0.8 +/- 0.16 0.3 - 3.00 y = 17.16 + 0.073x (ns) 2 1.38 +/- 0.23 0.3 - 4.2 y = 16.73 + 0.506x (ns) 3 0.55 +/- 0.03 0.4 - 0.7 y = 17.31 + 1.3x (ns) K 1 15.3 +/- 0.32 12.6 - 19.60 y = 14.4 + 0.185x (ns) 2 14.13 +/- 0.49 8.6 - 18.0 y = 23.29 - 0.415x (ns) 3 13.51 +/- 0.33 11.4 - 16.0 y = 19.9 - 0.144x (ns) Mg 1 0.31 +/- 0.03 0.11 - 0.65 y = 15.73 + 4.9x (ns) 2 0.31 +/- 0.003 0.11 - 0.66 y = 16.17 + 4.07x (ns) 3 0.18 +/- 0.02 0.07 - 0.34 y = 18.61 - 3.5x (ns) N 1 2.63 +/- 0.12 1.7 - 3.7 y = 19.24 - 0.76x (ns) 2 2.35 +/- 0.10 1.3 - 3.2 y = 20.25 - 1.20x (ns) 3 2.08 +/- 0.07 1.7 - 2.6 y = 15.16 + 1.37x (ns) P 1 0.28 +/- 0.02 0.17 - 0.46 y = 15.78 + 5.24x (ns) 2 0.23 +/- 0.02 0.08 - 0.35 y = 20.57 - 13.4x (ns) 3 0.16 +/- 0.01 0.10 - 0.22 y = 21.83 - 24.4x (ns) S 1 0.19 +/- 0.01 0.11 - 0.26 y = 20.79 - 19.1x (ns) 2 0.21 +/- 0.01 0.13 - 0.28 y = 21.62 - 19.6x (ns) 3 0.16 +/- 0.001 0.14 - 0.19 y = 42.85 - 152.1x (ns)

32
Nutrient Interactions The linear regression between the concentrations of 2 selected nutrients in the petioles for both crops is given in Table 29. No regression was significant in either crops or any sampling time.
Table 29. Linear regressions of the relationship between the petiole concentrations of two selected nutrients at 2 (Crop 1) or 3 (Crop 2) sampling times.
Interaction Sampling Regression R2 P value
Crop 1 Cu & Fe 1 Cu = 0.72 + 0.04Fe 0.46 <0.001 2 Cu = 5.3 + 0.006Fe 0.02 ns (<0.89) Cu & Mn 1 Cu = 4.13 + 0.01Mn 0.04 ns(<0.19) 2 Cu = 5.08 + 0.0004Mn 0.02 ns(<0.78) Cu & N 1 - - - 2 Cu = 9.36 – 2.2N 0.03 ns(<0.21) Cu & Zn 1 Cu13.97 - 0.03Zn 0 ns (<0.58) 2 Cu = 3.8 + 0.011Zn 0.16 <0.03 Mn & Zn 1 Mn = 449 + 1.81Zn 0.04 ns(<0.15) 2 Mn = 745 + 0.49Zn 0 ns(<0.6)
Crop 2 Cu & Fe 1 Cu = 10.74 + 0.007Fe 0.09 ns (<0.3) 2 Cu = 6.42 + 0.009Fe 0.34 *** (<0.001) 3 Cu = 7.57 + 0.094Fe 0.08 ns (<0.16) Cu & Mn 1 Cu = 12.9 - 0.002Mn 0 0.79 2 Cu = 8.38 - 0.002Mn 0 0.94 3 Cu = 26.75 - 0.015Mn 0.43 **(<0.005) Cu & N 1 Cu = 18.37 -2.29N 0.11 *(<0.05) 2 Cu = 12.39 -1.67N 0.06 ns(<0.10) 3 Cu = -16.97 + 15.27N 0.46 **(<0.003) Cu & Zn 1 Cu = 11.8 + 0.005Zn 0.04 ns(<0.17) 2 Cu = 10.5 – 0.026Zn 0.03 ns(<0.19) 3 Cu = -1.19 + 0.18Zn 0.12 ns(<0.1) Mn & Zn 1 Mn = 218 + 0.09Zn 0 ns(<0.6) 2 Mn = 150 + 4.6Zn 0.39 ***(<0.001) 3 Mn = 1176 – 5.34Zn 0.06 ns(<0.19)

33
6. DISCUSSION
Seed The farmer’s decisions on seed selection and the resultant impact on yield were variable. Whilst the country of origin of seed had no impact on yield overall, where Australian seed was used (crop 1) yields were in the higher quartile and there was a higher use of local seed in the lower compared with higher yield quartiles in both crops. The dominance of the use of Dutch seed made it difficult to assess the impact of seed from other countries. Other results that suggest farmers make careful decisions in the selection of seed is the positive correlation between price paid for seed and yield in crop 2 and the trend for greater use of seed of known generation in the higher yielding quartiles of each crop (Table 7). This is encouraging as it shows farmers know the value of good quality seed and are prepared to pay for it. The use of round seed rather than cut seed was not consistently associated with higher yield between crops. Whilst there was a trend to higher use of cut seed in lower yields in crop 1 this was not the case in crop 2. This supports work in both Vietnam (McPharlin et al. 2003) and Indonesia (Dawson et al. 2005) that crops grown from cut seed can yield as well or better than crops grown from round seed in tropical conditions. It appears that the use of cut seed in the tropics can be successful if the seed is high quality and good management practices (adequate curing, good storage conditions and hygienic cutting) are followed (McPharlin et al. 2003). Following simple good management practices with seed appears to be more important than applying expensive chemicals to seed by farmers who can least afford it. In Vietnam the highest yields were often achieved with cut and cured seed with no additional chemical seed treatments (McPharlin et al. 2003). These results are important as it means there may be the potential for Australian farmers to export larger seed tubers to Sri Lanka. This will enable them to become more price competitive in the export market as they could sell a larger fraction of their crop for seed. There is some indication from the results that seed age maybe important in yield. Sprout number and length have been used to as criteria for seed physiological age in Sri Lanka (Carls and Caesar 1979) with older seed having more and longer sprouts. There was a trend towards higher yield being associated with fewer sprouts/seed in crop 1 (page 19). This suggests that younger seed may yield better than older seed in Sri Lanka. Crops grown from older seed (12 months) yielded less than from younger seed (8 months) in Atlantic crops in West Java (Dawson et al. 2005). It may therefore be important for both exporters and growers to supply seed of an appropriate age to maximise yield. This will take careful planning because of the different planting times in Sri Lanka and the likelihood that planting times may be delayed for months because of seasonal conditions. Such delays can easily lead to seed being too old when planted which may result in a decrease in yield compared to that of younger seed. Australian seed exporters experienced these problems in West Java because of quarantine delays. The effect on yield by grading seed based on size/appearance and/or the presence of pests and diseases was inconclusive. However there was some evidence that storage in net bags was better than in boxes (crop 2) probably because of better ventilation in net bags.

34
There was no evidence that using larger seed increased yield in either crop. By contrast in crop 1 reduction in yield was associated with increasing seed size whilst seed size did not appear to influence yield in crop 2. These findings contrast with work that shows yield increases with seed size to an optimum usually between 40 and 80g per seed or seed piece (Struik and Wiersema 1999). Reductions in yield with seed size are usually associated with inadequate (small seed) or excess crop density (large seed) as determined by plant and stem density. There was no evidence in this work that lower yield associated with larger seed size was related to density in either crop.
Agronomic factors The higher mean yield of crops in Badulla (crop 2) than in Nuwara Eliya (crop 1) was most likely related to better climatic conditions in Badulla. The higher rainfall, number of rain days, cloud cover and lower temperature and solar radiation in Nuwara Eliya (Sathiamoorthy et al. 1985) would lead to lower yield compared with Badulla. Also crops in Nuwara Eliya are closer together in the narrow valleys compared with the more widely separated plantings in Badulla. The reduced isolation may result in higher pests and disease incidence. Planting date Delaying sowing of cv.Granola in Nuwara Eliya (crop 1) after 01/02/04 resulted in a significant reduction in yield (Figure 3). There was also a trend, though not significant, to reduced yield of Granola yield with planting after 15/06/04 in Badulla (crop 2). Other work in Sri Lanka has shown time of sowing influences potato yield. For example the total yield of cvs Arka and Desiree declined, and yield of small tubers (<25 mm), increased, when sown after November from 1983-87 in Kalitiya in the North West of Sri Lanka (Kuruppuarachchi 1987). The reduction in yield in Nuwara Eliya was not related to crop longevity (i.e. period between sowing and harvest date). This was shown by the highest yielding site (26 t/ha) which grew for the shortest period (80 days) while the longest growing site (139 days) only yielded (14 t/ha). Similarly there was no relationship between crop longevity and yield in Badulla. By contrast the length of the crop growth period was positively correlated with yield of Atlantic in West Java where the highest yielding crops grew the longest (Dawson et al. 2005). The severity of late blight was thought to be a key determinant of the length of time the crop grew in West Java. Given the similar importance of late blight as a limit to production in Sri Lanka it is surprising crop growth period was not related to yield. Irrigation systems Trends for improved yield with different irrigation and cultivation practices were also shown. For example there appeared to be higher yield with the use of sprinklers compared with other irrigation methods in crop 2 (Table 20). This table also showed lower yield s were associated with the use of watering cans. There was also a trend towards higher yield with more frequent irrigation in crop 1 (page 22). This suggests that improvements in methods and amount of irrigation may increase yield. The use of sprinklers may indicate the adoption of improved irrigation technology compared with watering cans. Certainly it would be easier to apply irrigation more frequently with a sprinkler system than with watering cans. Planting density Planting density, as determined by in-row and between-row spacing, had no significant influence on yield within each crop. However the mean density was 39% higher in crop 2 compared with crop 1 and this may have contributed, along with climatic factors, to the

35
higher yield in crop 2. Planting density has been reported to influence yield of potatoes in tropical potato growing regions such as in Sri Lanka, West Java and Vietnam. For example total yield declined as planting density decreased from 8.3 to 3.3 plants/m2 in the north of Sri Lanka (Rajadurai 1994). The range of planting densities reported in this study (4.8 to 7.8 m2 and 6.9 to 11.5 m2) may have been too narrow, or the minimum densities too high, to influence yield. The association of higher yield with higher density in crop 2 versus crop 1 suggests increasing density may be important in raising yields. This was shown in Indonesia where yield of Atlantic sown from whole seed increased significantly from 24.8 to 32.1 t/ha as density increased from 4.6 to 6.9 plants/m2 (Dawson et al. 2005). Yields of potatoes of a number of varieties, including TPS, Dutch and Chinese varieties, increased from 10 to 35 t/ha as planting density increased from 3.5 to 7.5 plants /m2 in Vietnam (McPharlin et al. 2003). However even though this effect was shown over a wider range of densities the correlation between density and yield was highly significant (P<0.001) so significant effects of density on yield could be discerned with smaller changes in density. Cultivation There was no evidence that mechanical cultivation was better than manual methods in either crop. Given the steep topography of Nuwara Eliya, the use of mechanical cultivation must proceed carefully so as not to increase soil erosion. A combination of mechanical and manual methods of cultivation appears the most appropriate in these regions at present.
Nutrients Low yields of crops in Nuwara Eliya, but not Badulla, were significantly correlated with high concentrations of copper in the plant petioles at both samplings. Yields were low at petiole Cu concentrations considered to be excessive i.e. >10 to 16 µg/g (Huett et al. 1999) in the 2 samplings. The high plant Cu concentrations could be explained by the high concentrations of extractable Cu in the top soil before sowing which ranged from 1.8 to 13.2 µg/g with a mean of 4.9 µg/g (Table 25). These concentrations could have contributed to high plant concentrations as soil concentrations from 0.5 to 5.0 µg/g (DTPA extractable) is considered adequate (Jones 1981) or high (Rayment 1993) for vegetable crops. Our Cu extraction method did not used DTPA but instead used NaHCO3, NH4F and EDTA (Portch and Hunter 2002) which would most likely have extracted more Cu from the soil than DTPA alone (Brennan and Best 1999), but how much more is unknown. However if we had used the DTPA extraction, assuming that it only extracted 50% of our soil Cu values, then the levels we found would be equivalent to 2.0 µg/g to 6.0 µg/g DTPA which would still be high enough to cause plant growth problems. These high concentrations of Cu in the soil would have arisen from application of Cu in trace elements and fungicides (CuSO4, Cu (OH)2 and CuO) over a long time i.e. residual copper. Cu in the plant could have originated from this residual copper as well as from current applications of Cu fertilisers and or fungicides. Copper phyto-toxicity has been reported in other crops from long term use of copper fungicides. For example replanted vines exhibited symptoms of copper phyto-toxicity in vineyards in Brazil (Giovanni 1997). Long term use of copper fungicides and fertilisers were shown to contribute to reduced growth of citrus trees in sandy soils in Florida (Reuther and Smith 1952). For example the dry weight of ‘Citrange’ seedlings was significantly reduced when extractable Cu in the soil exceeded 19 µg/g (Graham et al. 1986). The soil Cu concentrations are higher than that determined in this study but Graham et al. (1986) used a double acid extraction (Mehlich 1953) which is now
36
known to extract much higher amounts of Cu than DTPA or ETDA alone or in combination with non acid extractants (Brennan and Best 1999). Making conclusions about soil Cu by comparing different soil tests is problematic. Plant concentrations of Cu are a more direct measure of Cu status of the crop than soil measures and this study shows high plant concentrations of Cu may have reduced yield. The lack of a significant correlation between soil Cu versus petiole Cu or yield means soil Cu data from this survey cannot predict petiole Cu or yield accurately as is possible with properly calibrated soil tests. Some improvements in this prediction in surveys can be made by accounting for differences in bulk density, pH, cation exchange capacity, organic matter or silt and clay % across sites (Dolar and Kenney 1971 and Osiname et al. 1973) which was not possible here apart from using pH. Consequently data from controlled experiments which calibrate soil Cu with plant Cu and yield are preferred for determining soil tests which provide target levels for deficiency and toxicity in the plant (Brennan and Best 1999). It appears that the concentrations of other micronutrients such as Zn may contribute to reduced yield in combination with Cu at least in crop 1. Zn is also a component of fungicides (mancozeb) and it is possible overuse could occur similar to Cu. There was a trend towards lower yields with increasing Zn rather than Cu concentrations in crop 2. However low yield could be explained by high Cu concentrations decreasing Fe concentrations in petioles at least in sample 3. This negative interaction between Cu and Fe has been reported before in potatoes (Gupta et al. 1995). Thus visual symptoms of Fe deficiency in leaves induced by high Cu are sometimes evident on crops. A negative interaction between Cu and Zn concentrations in petioles which was expected was not found in either crop. By contrast the reduced yield with increasing Cu concentrations in crop 1 was associated with increasing Zn concentrations. The association of higher yield with higher soil Ca and Mg concentrations in crop 1 may suggest higher soil pH decreases Cu and Zn concentrations in the plant and improves yield. However there was no significant correlation between high yield and high pH in either crop although there was a non-significant trend towards higher yield with higher pH in crop 1. Amendments to increase soil pH maybe useful in lowering copper and zinc levels in crops and should be examined further.
Diseases Several diseases affected the potato crops during each crop and these are discussed separately below. First though, the significant effect in crop 2 where an inability to identify disease was related to low yield is discussed.
Inability to identify disease may be related to low yield Table 16 shows that for crop 2 there was a significant relationship between low yield and inability to identify disease. 20% of crop 2 LYQ growers couldn’t identify the disease affecting their crop while no growers in the HYQ had this problem. The converse is easier to discuss. On several occasions, especially from crop 2, the HYQ reported higher disease incidences than those of the LYQ (Table 16). Although this appears contradictory it can be explained by the higher yielding growers being better at disease identification than the LYQ

37
growers. With greater disease identification skills it is possible that the HYQ farmers will be able to control the diseases more efficiently and effectively than the LYQ growers and thus achieve higher yields. A similar result was found in Vietnam where the higher yielding growers reported more disease incidents than the lower yielding growers (McPharlin et al. 2003).
Fusarium The presence of Fusarium spp. was associated with lower potato yields in crop 1, with the LYQ reporting a higher (67%) incidence of Fusarium spp. than the HYQ (27%) (Table 16). Fusarium spp. are known to cause dry rot and wilt of potatoes. Fusarium dry rot affects tubers in storage and seed tubers at planting, while the less common Fusarium wilt reduces the tuber yield and quality by affecting the plants vascular tissues (Stevenson et al. 2001). The sources of inoculum that cause Fusarium dry rot or wilt includes infected soil and contaminated seed tubers (Stevenson et al. 2001). There are several species of Fusarium that affect potatoes but the specific species or species that caused the yield loss in this study was not identified. However, previous studies by Velupillai and French (1983) found Fusarium oxysporum and F. solani associated with dry rot and wilt of potatoes in plantings at Kalpitiya and Jaffna, Sri Lanka. In addition F. avenaceum has been reported on medicinal plant species used in Sri Lanka (Fernando and Abeywickrama 1996). A larger proportion of the LYQ (56%) used cut seed compared to the HYQ (18%) at planting (Table 11). Stevenson et al. (2001) indicate that infection of seed tubers occurs when Fusarium spores or propagules enter wounds made during seed handling and cutting. Therefore by cutting the seed without proper curing conditions, an entry wound for the Fusarium dry rot is provided which could affect crop yield. This is supported by Leach (1985) who found that daughter tuber contamination was greatest when non-treated cut tubers were used, whilst the lowest contamination occurred from whole non-treated seed. Interestingly both the lower and higher yielding quartiles in crop 1 did not record any Fusarium dry rot in their seed (Table 9). It is known that Fusarium spp. infection of tubers can either develop rapidly or remain latent and therefore it is possible that the tubers did not begin to break down until after planting, especially if conditions during storage did not promote disease expression. Stevenson et al. (2001) indicate that some level of Fusarium dry rot is always present in commercially available seed. Furthermore, only 44% of the LYQ and 36% of the HYQ graded their seed before planting in crop 1 (Table 6). Hence, either the potato growers in crop 1 couldn’t distinguish between Fusarium dry rot symptoms and other rots or the Fusarium dry rot began after planting from latent infections. The presence of Fusarium dry rot was not significant in crop 2 but it was the HYQ (40%) that recorded a higher incidence than the LYQ (27%) (Table 16). Also in crop 2 a larger proportion of the HYQ (66%) used cut seed than the LYQ (46%) (Table 11). However, both the seed storage and seed preparation, were not significant in crop 2.
Early blight (Alternaria solani) Early blight caused by Alternaria solani was another disease that was present in high numbers in the LYQ (67% and 60%, crops 1 & 2) and the HYQ (82% & 87% crops 1 & 2) of both crops (Table 16). Early blight is present in potato growing areas worldwide and has the

38
potential to reduce yield by decreasing the leaf surface of the plant (Stevenson et al. 2001). The HYQ in both crops recorded more early blight than the LYQ and this difference was significant in the crop 2. We think this is an indication that the higher yielding growers are better at disease diagnosis, and therefore disease control, than the lower yielding growers. The possibility of fungicide resistance must also be considered. Farmers in Sri Lanka spray fungicides often, every 3 days in some incidences, for the control of diseases including early blight. Products such as mancozeb, Anthracol WP 70% (propineb), Previcur (propamocarb) and Trimiltox Forte (copper and mancozeb) are used for early blight control in Sri Lanka on both potatoes and rotation crops. Studies by Holm et al. (2003) and Pasche et al. (2002) found that continual use of chlorothalonil and azoxystrobin, respectively, on potato fields in the USA meant that isolates of A. solani were developing resistance over the growing season and over the longer term. This could be occurring in Sri Lanka with certain fungicides and hence it is possible that this is why the incidence of early blight was the second highest recorded, behind late blight, in both crops. Further work on the resistance of chemicals in Sri Lanka is required.
Late blight Although the effect late blight (Phytophthora infestans) had on yield was not significant in both crops, based on numbers of growers that reported the disease and observations of the crops, late blight was the most damaging of potato diseases present in Sri Lanka. 89% of the LYQ and 72% of the HYQ reporting the disease in crop 1, compared with 67% of the LYQ and 80% of the HYQ reporting the disease in crop 2 (Table 16). Experiments on the mating type of P. infestans in Sri Lanka revealed that although not common, the A2 mating type was present in two imported potato varieties at the Regional Agricultural Research and Development Centre, Bandarawela (Kelaniyangoda and Somachandra 2001). It was also determined that several pathotypes of late blight exist in the up country of Sri Lanka, including Bandarawela and Sita Eliya, and that these pathotypes are different from location to location and have changed over time (Kelaniyangoda and Somachandra 2001). Fungicides have been screened in Sri Lanka for their effectiveness against P. infestans for several years and a spraying schedule was developed based on seasonal reports (Kelaniyangoda and Somachandra 2001). In late blight favourable conditions during the Maha season (Feb-Mar) in Badulla, two sprays of systemic fungicides and three contact/protective fungicides have been encouraged. In Nuwara Eliya, growers are encouraged to spray a minimum of two systemic sprays and three or more protective sprays. Although this was encouraged, during field visits to growers it was observed that growers were spraying more regularly with products such as mancozeb and metalaxyl, due to the severity of the late blight, which was seen to infect crops within a month of emergence. A recent trial has now found that spraying with mancozeb three times a week is providing better protection than previous schedules (George Babu, personal communication). By spraying so often in the presence of both A1 and A2 mating types there is a strong possibility that the late blight strains present in Sri Lanka are becoming resistant to certain chemicals. With the A1 and A2 mating types, sexual reproduction can occur which would enable a greater genetic variability of P. infestans in Sri Lanka and a greater chance of

39
fungicide resistance developing. Metalaxyl resistant isolates of P. infestans have been found in many places around the world, including Nepal (Ghimire et al. 2001), Scotland (Cooke et al. 2003) and Brazil (Reis et al. 2003). The development of resistance limits fungicide options and may even result in farmers wasting money through the application of expensive but ineffective fungicides. Studies on the resistance of late blight to fungicides are required in Sri Lanka. To initiate this work a set of agar plates containing various concentrations of metalaxyl was given to Agricultural Research Station, Sita Eliya researchers. This will allow them to perform preliminary tests to determine the metalaxyl resistance of P. infestans isolates found on potatoes in Sri Lanka. The most common potato varieties grown in Sri Lanka are of European origin with Desiree accounting for 70% of plantings in the Badulla region and Desiree, Lyra, Granola and Escort being the most common in Nuwara Eliya (Kelaniyangoda and Somachandra 2001). With several pathotypes of late blight existing in Sri Lanka it is no surprise that the varieties most commonly grown in Sri Lanka are highly susceptible to late blight infection. Several varieties have been developed in Sri Lanka to be resistant to the late blight races that exist there, including Sita and Krushi, but these varieties are not popular with the farmers as they have a long growing period (Kelaniyangoda and Somachandra 2001). There is ongoing evaluation/screening of new potato clones obtained from CIP to the late blight races present in Sri Lanka. Recently a variety known as Hillstar was released which had moderate resistance to late blight (George Babu, personal communication). Kelaniyangoda and Somachandra (2001) indicate that the destruction of infected crop residues, crop rotation and the avoidance of staggered cultivation are all commonly used cultural practices that are used in Sri Lanka to control late blight. However, although the main rotation crop in crop 1 was leeks and the main rotation crop in crop 2 was paddy (rice), we observed in the field that other solanaceous crops such as tomato (Lycopersicon esculentum) were often planted close to mature and emerging potato crops. This means that in Sri Lanka there is a large amount of late blight inoculum present all year round. This inoculum infects newly planted crops very early in the season and makes control difficult. Minimising the amount of initial inoculum is critical for late blight control (Stevenson et al. 2001). The ever-present inoculum also means that growers who do rotate their potato crops with non host crops are still likely to suffer infections even if the inoculum source is quite some distance away. In a study on the dispersal and release of late blight sporangia, Aylor et al. (2001) found that wind speeds of 1 to 2 m s-1 (3.6 - 7.2 km h-1) are sufficient for a sizeable proportion of late blight sporangia to leave the potato canopy and be dispersed 10 to 20 km within 3 hours. Weather conditions are a very important factor in the dispersal and severity of late blight. Sporangial germination occurs at temperatures of 18-24oC, while production of zoospores occurs at 8-18oC (Stevenson et al. 2001). Infections at optimal temperatures (18-22oC) can became visible within 3 days and temperatures of 10-25oC with wet conditions (prolonged surface wetness or 100% relative humidity) induce sporulation. As mentioned previously, the average weather conditions in both the Nuwara Eliya (crop 1) and Badulla (crop 2) are suitable for these events to occur. This means that in Sri Lanka repeated cycles of infection can occur rapidly. Hence controlling late blight is difficult in Sri Lanka with weather conditions so conducive for disease development.

40
Surface water is another condition that is conducive to the development of late blight epidemics. Porter and Johnson (2004) found that spores of P. infestans could survive in surface water for between 14 and 21 days and stated that avoidance of conditions that promote surface water would aid in the management of late blight. Potato growers in Sri Lanka often create fields that pool water as a result of the rotation of potatoes with paddy and other crops. Areas under potato cultivation also experience substantial soil erosion, with estimates of 15 tonnes/ha during the Maha and 9 tonnes/ha during the Yala seasons (Samarakoon and Abeygunawardena 1995), which would also lead to greater surface water in and around potato crops. Hence these condition in Sri Lanka are likely to promote the spread of P. infestans in the potato crop. The presence of other pest and diseases in the potato crop also influences the effect late blight has on the crop and visa versa. Stevenson et al. (2001) mentions that late blight lesions in tubers allow soft rot bacteria, Fusarium spp. and Phytophthora erythroseptica to gain access to the tubers. This may explain why the LYQ, who reported higher late blight incidence, also reported higher Fusarium dry rot in crop 1 (Table 16). Leaf miner which has been a problem in potato crops in Sri Lanka (Table 15) is also known to provide an entry point for the infection of late blight (George Babu, personal communication). Furthermore, rodent damage to the HYQ in crop 1 was significant, and was present in crop 2 (Table 9). This damage could provide suitable wounds for late blight infections. Other diseases, be they bacterial or fungal, and pests may also be providing entry wounds on plants and tubers for late blight. Therefore controlling these diseases and pests may also aid late blight control in Sri Lanka. So to improve yields there is a need to train growers in integrated pest management (IPM) techniques to reducing pest and disease impacts.
Black leg Similar levels of black leg were reported in both crops, none of which had any significant affect on yield (Table 16). Interestingly no grower in each crop reported any soft rot decay of tubers during the planting (Table 16) and very little was recorded in the seed (Table 9). Black leg and soft rot are both caused by Erwinia spp. which are known to remain symptomless (latent) until the conditions favour disease expression. Therefore this may explain why only very little soft rot was recorded in the seed. Also it is known that the presence of other tuber diseases such as Fusarium dry rot and late blight often increases the incidence of bacterial pathogens by providing wounds through which they can invade (Stevenson et al. 2001). Both crops 1 and 2 recorded high levels of late blight and recorded Fusarium dry rot. Furthermore it is probable that in Sri Lanka with continual cropping and high rainfall there is an inherent level of bacteria in the soil. Pérombelon and Hyman (1989) found low levels of Erwinia spp. in Scottish soils that had not been cropped for 16 months and found that populations increased after cropping with brassicas. Pérombelon (2002) also indicated that prolonged periods of irrigation/rainfall that lead to high soil water levels also promotes black leg in potato crops.
Rhizoctonia Rhizoctonia solani was present in similar numbers in the LYQ and HYQ of both crops (Table 16). Based on the proportion of growers that recorded Rhizoctonia in both crops it does not appear that Rhizoctonia causes large yield losses of potatoes in Sri Lanka. It was however expected that the growers in Nuwara Eliya (crop 1) would experience more Rhizoctonia than the growers in Badulla (crop 2) as a result of cooler temperatures. The average temperature in
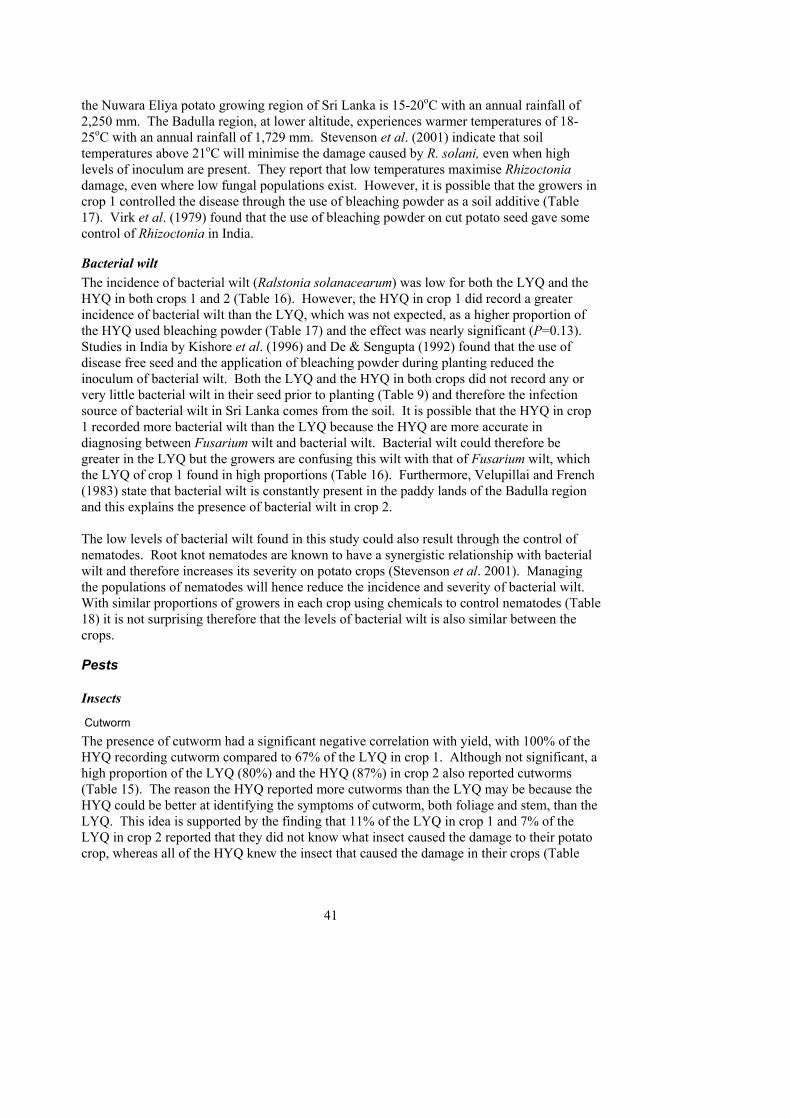
41
the Nuwara Eliya potato growing region of Sri Lanka is 15-20oC with an annual rainfall of 2,250 mm. The Badulla region, at lower altitude, experiences warmer temperatures of 18-25oC with an annual rainfall of 1,729 mm. Stevenson et al. (2001) indicate that soil temperatures above 21oC will minimise the damage caused by R. solani, even when high levels of inoculum are present. They report that low temperatures maximise Rhizoctonia damage, even where low fungal populations exist. However, it is possible that the growers in crop 1 controlled the disease through the use of bleaching powder as a soil additive (Table 17). Virk et al. (1979) found that the use of bleaching powder on cut potato seed gave some control of Rhizoctonia in India.
Bacterial wilt The incidence of bacterial wilt (Ralstonia solanacearum) was low for both the LYQ and the HYQ in both crops 1 and 2 (Table 16). However, the HYQ in crop 1 did record a greater incidence of bacterial wilt than the LYQ, which was not expected, as a higher proportion of the HYQ used bleaching powder (Table 17) and the effect was nearly significant (P=0.13). Studies in India by Kishore et al. (1996) and De & Sengupta (1992) found that the use of disease free seed and the application of bleaching powder during planting reduced the inoculum of bacterial wilt. Both the LYQ and the HYQ in both crops did not record any or very little bacterial wilt in their seed prior to planting (Table 9) and therefore the infection source of bacterial wilt in Sri Lanka comes from the soil. It is possible that the HYQ in crop 1 recorded more bacterial wilt than the LYQ because the HYQ are more accurate in diagnosing between Fusarium wilt and bacterial wilt. Bacterial wilt could therefore be greater in the LYQ but the growers are confusing this wilt with that of Fusarium wilt, which the LYQ of crop 1 found in high proportions (Table 16). Furthermore, Velupillai and French (1983) state that bacterial wilt is constantly present in the paddy lands of the Badulla region and this explains the presence of bacterial wilt in crop 2. The low levels of bacterial wilt found in this study could also result through the control of nematodes. Root knot nematodes are known to have a synergistic relationship with bacterial wilt and therefore increases its severity on potato crops (Stevenson et al. 2001). Managing the populations of nematodes will hence reduce the incidence and severity of bacterial wilt. With similar proportions of growers in each crop using chemicals to control nematodes (Table 18) it is not surprising therefore that the levels of bacterial wilt is also similar between the crops.
Pests
Insects
Cutworm The presence of cutworm had a significant negative correlation with yield, with 100% of the HYQ recording cutworm compared to 67% of the LYQ in crop 1. Although not significant, a high proportion of the LYQ (80%) and the HYQ (87%) in crop 2 also reported cutworms (Table 15). The reason the HYQ reported more cutworms than the LYQ may be because the HYQ could be better at identifying the symptoms of cutworm, both foliage and stem, than the LYQ. This idea is supported by the finding that 11% of the LYQ in crop 1 and 7% of the LYQ in crop 2 reported that they did not know what insect caused the damage to their potato crop, whereas all of the HYQ knew the insect that caused the damage in their crops (Table

42
15). Cutworms are also major pests of rotation crops such as cabbage, so it is likely that there is a high level present year round in Sri Lankan agricultural fields. Mites The presence of mites was significantly associated with higher yields in crop 2 (Table 15). Mites are not considered to be a serious pest of potatoes in Sri Lanka, but they are considered a serious perennial pest of tea plantations. Danthanarayana and Ranaweera (1970) indicated that the control of mites in tea crops in Sri Lanka was economically worthwhile. Hence as potatoes are grown close to tea crops in Sri Lanka it is likely that the mites found on the potatoes in crop 2 moved from the surrounding tea plantations. It appears that the mites are not yield limiting because more were reported by the higher yielding growers. Alternatively the identification of this small, cryptic pest could be an indication of farmers with superior pest identification skills. These farmers are then able to apply better pest management, as discussed under cutworm and the inverse relationship between disease prevalence and yield. White grubs In both crops, white grubs were associated with lower yields, significantly in crop 2 (Table 15). White grubs are the larvae of scarab beetles, which are very destructive on a wide variety of hosts, including potatoes. White grubs are known to eat the roots of potato plants and damage the tubers, which leads to a reduction in quality and yield. Interestingly, both the HYQ and the LYQ in crop 2 used carbofuran (Table 18) and other chemical seed treatments (Table 13) before planting. Also, the majority of growers in crop 2 rotated their potato crops with paddy, which would reduce the level of soil insects, including white grubs, prior to the potato crop being planted. Hence although the LYQ are using similar control measures as the HYQ it is possible that the LYQ are not applying the insecticides at the correct rates or time to ensure adequate control. Leaf miner Leaf miner was another pest that was recorded in high proportions in both the LYQ (78% and 60%) and the HYQ (45% and 33%) but this was not significant in both crops (Table 15). The leaf miner, Liriomyza huidobrensis, was recorded in Sri Lanka for the first time in 1997 and has been associated with potato crop losses of 100% in some areas (Nugakiyada 2000). When first accounted in Sri Lanka, farmers sprayed their potato crops with insecticides and other chemicals such as chlorine, lime and kerosene oil in an attempt to control it (Nugakiyada 2000). However, Braun and Shepard (1997) indicate that Liriomyza species tend to be resistant to commonly used pesticides and fungicide use can lead to heavier infestations in subsequent seasons. Adding to the difficulty in controlling leaf miner is the fact that it is a polyphagous insect that attacks several crops including tomatoes, crucifers, carrots, beans and several commonly occurring weeds (Braun and Shepard 1997). Furthermore, it is known that damaged potato crops from leaf miner infection are more susceptible to late blight, including late blight resistant varieties (Nugakiyada 2000). Hence, controlling leaf miner is not only difficult in Sri Lanka but can also play an important role in increasing the impact of other pests and diseases.

43
Aphids A large proportion of growers in both crops indicated that aphids were present on the sprouts during storage (Table 9). A lower proportion of growers in both crops reported aphids on their crops during planting (Table 15). As the majority of growers used phenthoate when the seed was in storage, it is likely that this reduced the numbers of aphids present prior to planting. Plus with the continual use of other chemical insecticides during the crops, including neem (Table 19), the levels of aphids were kept minimal during this study. With only a small proportion of growers indicating that they had aphids on their crops it was also expected that the proportion of growers reporting viruses would be low (Table 16). Although the levels of viruses were low it was interesting to note that the majority of growers in crop 1 did not rogue their crops for viruses, whereas the majority of growers in crop 2 did (Table 14). Encouraging growers in Sri Lanka to rogue potato crops for diseased plants will help increase yields. Does neem use increase insect damage compared with synthetic chemical use? Apart from cutworm, a greater proportion of the LYQ reported problems with every insect than the HYQ in crop 1 (Table 15). An explanation might be that although similar proportions of the LYQ and HYQ used phenthoate (Table 12) and other chemicals (Table 13) prior to planting for insect control, only 56% of the LYQ used chemicals at the time of planting, compared to 82% of the HYQ (Table 19). The differences in insecticides used at planting is most likely a result of costs with the cheaper, more environmentally friendly, neem being preferred by the LYQ over the more expensive synthetic chemicals. Neem however is not an as efficient insecticide as other insecticides on the market. Viji and Bhagat (2001) compared neem products with synthetic insecticides on black cutworm (Agrotis ipsilon) in India, and found that although neem provided good protection and higher yields than the control, the synthetic insecticides resulted in higher yields and less plant mortality. Only a small percentage of growers in crop 2 used tea waste as an insecticide, the remainder used chemicals (Table 19), and they achieved significant higher yields than crop 1.
Nematodes The majority of growers in both the LYQ and HYQ of the surveys used carbofuran as a nematicide but this did not have a significant effect on yield (Table 18). Carbofuran is a non-fumigant nematicide from the carbamate group and is known to control several genera of nematodes, including cyst nematodes (Whitehead 1998). A previous study by Hirata et al. (2000) found 15 genera and nine species of plant parasitic nematodes associated with vegetables, fruit trees and ornamental plants in Sri Lanka. In trials by Lamberti et al. (1993) and Ekanayake and Jayasundara (1994) it was found that the use of carbofuran, as a soil applied nematicide, controlled root-knot nematodes Meloidogyne javanica and M. incognita and increased yields of tomatoes in Sri Lanka. Potato cyst nematode (Globodera rostochiensis) was first discovered in Sri Lanka in 1990 from soil samples taken from Nuwara Eliya (Ekanayake 1990). A survey of the major potato production areas of Sri Lanka in 1991 by Toida and Ekanayake (1992) revealed that G. rostochiensis was restricted to the Nuwara Eliya region after presumably being introduced from imported seed potatoes around 1984. Further studies have identified the pathotype of G. rostochiensis in Sri Lanka to be that of Ro1 (Mangalika Nugaliyadde, personal communication). Monitoring and sampling of PCN is conducted at the Agricultural Research

44
Station, Sita Eliya on a regular basis. Seed potato farms in Nuwara Eliya are taking biosecurity precautions to exclude PCN.

45
7. Technology Transfer This project was planned as a first stage in the development of best management practices for Australian seed potatoes in Sri Lanka. If the project continues the next stage would involve experimental work and later a technology transfer stage would demonstration the best management practices that had been developed. Nevertheless this project did involve technology transfer related to the participation of the farmers in the survey in both crops. This involved regular visits of CIC staff to each site before planting to take measurements and collate answers to survey questions on agronomic practices and on a weekly basis after planting to take measurements. DAWA staff visited prior to commencement of the project to plan the surveys and during each of the cropping cycles. In addition DAWA staff visited after the surveys were completed to get feedback from growers particularly on major limits to yield. Staff of Agricultural Research Station, Sita Eliya were involved in disease and pest identification. Feedback from growers included:
• Information that yield had declined markedly since the 1970s in both cropping regions.
• Good quality seed was critical in producing high yields. • Imported seed was an important source of high quality seed. • Control of diseases and pests especially late blight and leaf miner was fundamental to
successful potato production. • The information that, on the sites identified with high copper levels, poor emergence
was a noticeable problem. Information from this project that is of importance to Sri Lankan farmers includes:
• Different agronomic practices in the survey crops meant yield varied from 2.4 to 6.0 times. This indicates that there is potential for the lower yielding sites to improve productivity through sharing information with the better performing farmers. The CIC file officers will be in a good position to identify high yielding and influential farmers.
• Even the best yields in each region (26 t/ha) were below ‘potential’ of at least 40 t/ha. This indicates that further research on constraints to production may have the potential to increase yields of even the high yielding farms.
• Overuse of micronutrients appears to have contributed to yield decline and this is now an important sustainability issue for the potato growers. A combination of high quality seed and good agronomic practices will be essential if yields close to their maximum potential are to be realised.
Formatted: Bullets andNumbering

46
8. Recommendations This project aimed to determine the constraints to potato production in Sri Lanka. We were able to identify by a survey of 2 cropping periods several factors that had a significant effect on yield. Future work should test these findings experimentally to determine whether best management practices can be developed to overcome these constraints. The finding that copper and possibly zinc concentrations may reduce potato yield requires experimentation to determine methods to reduce copper and zinc uptake by the potato crop. Also there is a need to determine the sources that have lead to the high copper and zinc concentrations in the soil. Soil amendments such as lime could be tested. At the same time disease control methods which deliver less copper to the crops could be investigated. The finding that sprinkler systems affect yield should be investigated further. Different systems could be compared and the benefit/cost for each system could be determined. We found that accurate pest and disease identification may be vital if farmers are to improve the yield of their crops. Appropriate training courses should be developed to enable farmers to improve their identification skills. Sowing date appeared to influence yield. This should be investigated further to determine what factors are causing the yield decline. Planting all crops at the optimum time for yield may result in supply exceeding demand and the relationship between supply and demand and price needs to be investigated to determine how to tackle this issue. The frequent use of chemicals to control late blight will result in resistant strains developing. There is a need to introduce IPM systems to potato production in Sri Lanka to delay the onset of strains of late blight resistant to currently used fungicides. The survey to identify yield constraints in new markets has been successful. This shows that our methodology has merit and is a sound way to identify which agronomic areas require improvement if Australian seed potatoes are to perform to their potential in new export markets. We have found that survey work was strongly supported by our in-country partners in Sri Lanka and Vietnam (McPharlin et al. 2003). This leads to the development of mutually beneficial partnerships.
Formatted: Bullets andNumbering

47
9. Acknowledgements
Funding was supplied by the Department of Agriculture, Western Australia, by Western Potatoes, by CIC Agri Businesses and by Horticulture Australia Ltd. The survey was conducted in growers' crops and their assistance is greatly appreciated. We gratefully appreciate the diligent and accurate work done by CIC Agri Businesses field and laboratory staff. The anonymous reviewer is thanked for constructive comments.
Formatted: Bullets andNumbering

48
10. Literature Amarasinghe, STC, Weerahewa J (2001) An assessment of technical efficiency of potato
production. Tropical Agricultural Research 13, 292-300. Aylor DE, Fry WE, Mayton H, Andrade-Piedra JL (2001) Quantifying the rate of release
and escape of Phytophthora infestans sporangia from a potato canopy. Phytopathology 91, 1189-1196.
Braun AR, Shepard M (1997) ‘Leafminer Fly: Liriomyza huidobrensis.’ Technical Bulletin. The International Potato Centre and The Clemson University Palawija Project. 10pp.
Brennan RF, Best EK (1999) ‘Copper. In ‘Soil Analysis: An interpretation manual,’ Peverill K.I., Sparrow L.A. and Reuter D.J. Eds (CSIRO: Melbourne) p 263-280.
Carls J, Caesar K (1979) Influence of storage growth and temperature on the physiological age and yield of progeny seed potatoes under tropical conditions. Potato Research 22, 87-97.
Cooke DEL, Young V, Birch PRJ, Toth R., Gourlay F, Day JP, Carnegie SF, Duncan JM (2003) Phenotypic and genotypic diversity of Phytophthora infestans populations in Scotland (1995-97). Plant Pathology 52, 181-192.
Cotching WE, Sparrow LA, Hawkins K, McCorkell BE, Rowley W (2004) Linking Tasmanian potato and poppy yields to selected soil physical and chemical properties. Australian Journal of Experimental Agriculture 44, 1241-1249.
Danthanarayana W, Ranaweera DJW (1970) The red spider mite and the scarlet mite of tea and their control. Tea Quarterly 41(1), 19-33
Dawson P, McPharlin IR, Dharmadi BB (2005) A partnership to build Indonesian crisping potato capacity and Australian seed potato sales. Final Report Project PT02018. (Horticulture Australia Ltd, Sydney).
Dolar SG, Keeney DR (1975) Availability Cu, Zn and Mn in soils. Journal of Science of Food and Agriculture 22, 279-82.
De BK, Sengupta PC (1992) Control of brown rot diseases of potato through cultural practices in West Bengal Plains. Journal of the Indian Potato Association 19, 90-92.
Ekanayake HMRK, Jayasundara NJ (1994) Effect of Paecilomyces lilacinus and Beauveria bassiana in controlling Meloidogyne incognita on tomato in Sri Lanka. Nematologia Mediterranea 22(1), 87-88.
Ekanayake HMRK (1990) New record on the occurrence of Globodera rostochiensis in Sri Lanka. International Nematology Network Newsletter 7(3), 50.
FAOSTAT http://faostat.fao.org/faostat/servlet/XteServlet3?Areas=38&Items=116&Elements =41&Years=2004&Years=2003&Years=2002&Years=2001&Years=2000&Format=Table&Xaxis=Years&Yaxis=Countries&Aggregate=&Calculate=&Domain=SUA&ItemTypes=Production.Crops.Primary&language=ENFAOSTAT World Database
Fernando L, Abeywickrama K (1996) Isolation of toxigenic fungi from commercially available medicinal plant material. Journal of the National Science Council of Sri Lanka 21(1),1-7.
Ghimire SR, Hyde KD, Hodgkiss IJ, Liew ECY (2001) Phenotypes of Phytophthora infestans in Nepal: mating types and metalaxyl sensitivity. Potato Research 44, 337-347.
Giovanni E (1997) Copper toxicity in vineyards. Pesquisa agropecuaria gaucha 2, 115-117. Graham JH, Timmer LW, Fardelman D (1986) Toxicity of fungicidal copper in soil to citrus
seedlings and vesicular arbuscular mycorrhizal fungi. Phytopathology 76, 66-70.

49
Gupta UC, MacLeod JA, Sanderson JB, White RP (1995) Nutrient status of potato grown on fine sandy loams of Prince Edward Island. Communications in Soil Science and Plant Analysis 26, 1247-55.
Hatherley CA, Nugaliyadde MM, Kularathue RJKN (2003) Investigating the Supply Chain of Seed and Ware Potatoes in Sri Lanka. Report Agricultural Research Station, Sita Eliya, Sri Lanka.
Hirata K, Fernando KGI, Hewage LC (2000) ‘Plant parasitic nematodes associated with crops in Sri Lanka.’ Research Bulletin of the Plant Protection Service, Japan. No. 36, 61-66
Holm AL, Rivera VV, Secor GA, Gudmestad NC (2003) Temporal sensitivity of Alternaria solani to foliar fungicides. American Journal of Potato Research 80(1), 33-40.
Huett DO Maier NA, Sparrow LA, Piggott TJ (1997) ’Chapter 8, Vegetables’ In ‘Plant Analysis: An interpretation manual, second edition’ Reuter DJ, Robinson JB, Dutkiewicz C eds (CSIRO: Melbourne) p 385-464.
Jayasinghe U (2003) Potato seed system in Indonesia: A baseline survey In ‘Progress in Potato and Sweetpotato Research in Indonesia.’ Fuglie KO ed (CIP - ESEAP) pp 70-78.
Jones JB (1985) Soil testing and plant analysis: guides to the fertilization of horticultural crops. Horticultural Reviews 7,1-67.
Kelaniyangoda DB, Tharmarajah SK, Herath LG (2002) Bacterial wilt (Ralstonia solanacearum E.F. Smith) management in potato rooted stem cuttings in the net-house. Tropical Agriculturist 151, 53-58
Kelaniyangoda DB, Somachandra KP (2001) Present status and prospects for management of late blight in Sri Lanka. Annals of the Sri Lanka Department of Agriculture 3, 87-94.
Kishore V, Shekhawat GS, Sunaina V (1996) Cultural practices to reduce Pseudomonas solanacearum in the infested soil. Journal of the Indian Potato Association 23, 130-133.
Kuruppuarachchi DSP (1990) Intercropped potato (Solanum spp.): Effect of shade on growth and tuber yield in the northwestern regosol belt of Sri Lanka. Field Crops Research 25 (1-2), 61-72
Kuruppuarachchi DSP (1987) Potato (Solanum tuberosum L.) tuber yield as influenced by planting date in the northwestern regosol belt of Sri Lanka. Tropical Agriculturist 143, 67-79.
Lamberti F, Ekanayake HMRK, Sasanelli N, Zacheo,F (2003) Control of root-knot nematodes in Sri Lanka. Nematologia Mediterranea 21(2), 227-234.
Leach SS (1985) ontamination of soil and transmission of seedborne potato dry rot fungi (Fusarium spp.) to progeny tubers. American Potato Journal 62, 129-136.
Maier N A, Dahlenburg AP, Williams CMJ (1994) Effect of nitrogen, phosphorus and potassium on yield and petiolar nutrient concentration of potato (Solanum tuberosum L.) cvv. Kennebec and Atlantic. Australian Journal of Experimental Agriculture 34, 825-34.
McPharlin IR, Dawson,PD, Hue DT, Tuyen TC (2003) Cut seed experiments. In “Increasing the capacity of the Food Crops Research Institute to enhance the production and management of potatoes in the Red River Delta”. Final Report of AusAID project, July 2003 (Western Australian Department of Agriculture: South Perth Western Australia), pp85-95.
Mehlich A (1953) Determination of P, Ca, Mg, K, Na and NH4 by the North Carolina Soil Testing Laboratories. Mimeo (North Carolina State University: Raleigh NC).

50
Nugakiyada M (2000) A new pest, Leaf Miner, Liriomyza huidobrensis (Blanchard) of potato in Sri Lanka. In ‘South & West Asia Region ternational Potato Centre Newsletter’ 3 (2), March 2000.
Nugaliyadde MM (2003) Strengthening of informal seed potato production systems in Sri Lanka. Briefing paper No. 5. Law & Society Trust (Colombo).
Osaname OA, Schulte EE, Corey RB (1973) Soil tests for available copper and zinc in soils of western Nigeria. Journal of Science of Food and Agriculture 24, 1341-9.
Pasche JS, Wharam CM, Gudmestad NC (2002) Shift in sensitivity of Alternaria solani (potato early blight) to strobilurin fungicides. In ‘The BCPC Conference: Pests and diseases, Volumes 1 and 2.’ Brighton. pp. 841-846. (Brighton: UK)
Pérombelon MCM, Hyman LJ (1989) Survival of soft rot coliforms, Erwinia carotovora subsp. carotovora and E. carotovora subsp. atroseptica in soil in Scotland. Journal of Applied Bacteriology 66(2), 95-106.
Pérombelon MCM (2002) Potato diseases caused by soft rot erwinias: an overview of pathogenesis Plant Pathology 51, 1–12
Portch S, Hunter A (2002) A systematic approach to soil fertility evaluation and improvement. PPI/PPIC China programme Special Publication no. 5.
Porter LD, Johnson DA (2004) Survival of Phytophthora infestans in surface water. Phytopathology 94, 380-387.
Rajadurai S (1994) Effect of seed tuber size and planting space on growth, yield and tuber size distribution of potato (Solanum tuberosum) in irrigated red-yellow latosols of the dry zone. Journal of the National Science Council of Sri Lanka 22(2), 115-123.
Rayment GE (1993) Excessive levels of nutrients in horticultural soils and vegetables. In “Nutrition in Horticulture. (Eds M.N. Hunter and V.J.Eldershaw) pp. 55-69. Proceedings of a Review Workshop. Gatton, Queensland.
Reis A, Smart CD, Fry WE, Maffia LA, Mizubuti ESG (2003) Characterization of isolates of Phytophthora infestans from southern and Southeastern Brazil from 1998 to 2000. Plant Disease 87(8), 896-900.
Reuther W, Smith PF (1952) Effects of high copper content of sandy soil on growth of citrus seedlings. Soil Science 75, 19-224.
Rhoades RE (1986) Changing a post-harvest system: impact of diffused light potato stores in Sri Lanka. Agricultural Systems 19(1), 1-19.
Samarakoon SMM, Abeygunawardena P (1995) An economic assessment of on-site effects of soil erosion in potato lands in Nuwara Eliya district of Sri Lanka. Journal of Sustainable Agriculture 6, 81-92.
Sathiamoorthy K, Prange R, Mapplebeck L, Haliburton T (1985) Potato production in Sri Lanka. American Potato Journal 62(10), 555-564
Stevenson WR, Loria R, Franc GD, Weingartner PD (Eds.) (2001) Compendium of Potato Diseases, 2nd ed. APS Press, St Paul, Minnesota
Struik PC, Wiersema SG (1999). ‘Seed potato technology’ (Wageningen Press: Wageningen), p212.
Toida Y, Ekanayake HMRK (1992) Occurrence and distribution of the potato cyst nematode, Globodera rostochiensis (Wollenweber, 1923) in Sri Lanka. Japanese Journal of Nematology 22: 43-48.
Travis KZ (1987) Use of a simple model to study factors affecting the size distribution of tubers in potato crops. Journal of Science Cambridge. 109, 563-71.

51
Vaz CR de, Gunasena HPM (1974) Effect of time and rate of nitrogen application on growth and yield of potato (Solanum tuberosum L.) in the up-country wet zone. Tropical Agriculturist 130(3/4), 215-224.
Velupillai M (1985) Bacterial wilt in Sri Lanka. In “Bacterial wilt disease in Asia and the South Pacific”. p57-64.
Velupillai M, French (1983) Diseases and pests of the potato in Sri Lanka: 1975-1982. In ‘Proceedings of the Sixth Symposium of the International Society for Tropical Root Crops.’ Peru (Eds. Shideler FS and Rincon H) p. 529.
Viji CP, Bhagat RM (2001) Efficacy of some plant products, synthetic insecticides and entomopathogenic fungi against black cutworm, Agrotis ipsilon larvae on maize. Indian Journal of Entomology 63(1), 26-32.
Virk KS, Chauhan MS, Tripathi NM, Duhan JC (1979) Treatment of cut tuber pieces of potato with fungitoxicants to control decay in autumn sowing. Journal of the Indian Potato Association 6(2): 109-113.
Walworth JL, Muniz JE (1993) A compendium of tissue nutrient concentrations for field grown potatoes. American potato Journal 70, 579-97.
Whitehead AG (1998) ‘Plant Nematode Control.’ (CAB International: Wallingford, UK) Wijewardena JDH, Amarasiri SL (1997) Long-term use of potassium fertilizer for vegetable
crops in the upcountry intermediate zone. Journal of the National Science Council of Sri Lanka 25(1), 59-68
Wijewardena JDH (1994/1995) Response to potato and vegetable crops grown sequentially to phosphorus application in an Ultisol. Tropical Agriculturist 150, 27-34
Wimalajeewa DLS, Thavam P (1974) Field investigations on the control of "late blight" of potato. 2. Dosage, frequency and timing of fungicide application and economics of control Tropical Agriculturist 130(3/4), 163-170.

52
Abbreviations ° degrees B boron C Celsius Ca calcium CIC Chemical Industries Colombo Cl chloride Cu copper cv. cultivar DW dry weight Fe iron G generation h hour ha hectare HAL Horticultural Australia Ltd HYQ highest yielding quartile K potassium LYQ lowest yielding quartile m metres Mg magnesium mg milligram Mn manganese N nitrogen Na sodium NH4-N ammonium nitrogen ns not significant P phosphorus P probability pH (H20) acidity (measured in a solution of water) R2 regression coefficient Rs Sri Lankan rupee S sulphur t tonne(s) t/ha tonnes per hectare WA Western Australia µ micro wt Weight Zn zinc

Appendix 1. Survey questionnaire
53
Soil 1) Site Number? 2) Date when soil sampled? 3) What is the slope of the land? ………………….. (Gradient) 4) What is the soil depth? ………….. (Measure)
3 sites to 40 cm
5) Soil Analysis
Collect 20 sub-samples of soil 0-15 cm from each site. Bulk together to give a single sample
for analysis for each site.
5.1 Soil structure analysis
5.2 Nutrient analysis
NUTRIENT VALUE UNITS
pH N-total NO3-extractable NH4-extractable P K Mg Ca S Na Fe Mn Ca Zn
AGRONOMIC PRACTICES 6) How many years have you grown potatoes?
7) Where did you learn to grow potatoes?
1. Father or family
2. Self taught
3. Formal training
SURVEY QUESTIONAIRE Formatted: Bullets andNumbering
Formatted: Bullets andNumbering

Appendix 1. Survey questionnaire
54
4. Other (specify)
8) From which country did your Seed come?
1. Holland
2. Germany
3. United Kingdom
4. U.S.A.
5. Australia
6. India
7. Sri Lanka (local)
8. Other
9) Who was the supplier?
1. Own Seed
2. Other (specify)
10) If own Seed, how many season have you kept the Seed?
1. Previous season
2. 2 seasons
3. >2 seasons
11) What was the generation of the seed? Give number
12) Why did you buy this seed?
1.Price
2. Country of origin
3. Variety
4. Availability
5. Previous experience
6. Other (specify)
13) What was the price of the seed? …………... Rs/kg
14) Did you grade the Seed before planting?
1. Yes
2. No
15) If yes, what did you do?
1. Cut large tubers
2. Plant small tubers at higher density

Appendix 1. Survey questionnaire
55
3. Discard bad Seed. % discarded …………%?
16) Will you rogue the crop during the growing season?
1. Yes
1. No
17) What criteria will you use to select tubers to retain for seed?
1. Size
2. Appearance (Disease/Damage)
3. Size & Appearance
18) How was the Seed stored?
1. Boxes in store
2. Net bags in store
3. Other (specify)
19) How long was the Seed stored before planting? ………… weeks
20) Was the Seed damaged by pests and disease in storage? If so, name them
1. No
2. Soft Rot
3. Dry Rot/Fusarium
4. Bacterial Wilt
5. Mealy Bug
6. Tuber Moth
7. Aphids on Sprouts
8. Rodents
9. Shrinkage
21) Was the Seed treated with fungicide, insecticide or rodenticide in storage? If so, name
them
1. No
2. Phenthoate
3. Pyrimiphos Methane
4. Other (specify)
22) Estimate number of sprouts per tuber
23) How long were the sprouts? ………….. cm

Appendix 1. Survey questionnaire
56
PLANTING 24) Was the Seed treated with a chemical at planting? If so, name them
1. No
2. Carbendazim
3. Thiram
4. Captan
5. Other (specify)
25) What depth was the Seed planted? ………… cm
26) What was the spacing?
Within the row? …………. cm
Between rows? …………. cm
27) What Seed size was planted?
…………. number per kg
28) What was the date of planting?
CROP ROTATION 29) How many crops were grown a year on this site ?
30) How many potato crops were grown a year on this site ?
31) What crops other than potatoes were grown on this site?
32) How far is the nearest crop of potatoes?
TILLAGE 33) What method of tillage was used prior to planting?
1. Plough and till by small tractor
2. Plough by small tractor and till by hand
3. Entirely by hand
34) How many times was the ground tilled?

Appendix 1. Survey questionnaire
57
35) How deep was the tillage?
1. 20 cm with machine
2. 12-15 cm by hand
3. Other
PEST & DISEASE CONTROL 36) What soil treatments were used for pest and disease control ?
1. None
2. Bleaching Powder
3. Formalin
4. Other (specify)
37) Were nematicides used to control nematodes before planting? If so, give names
1. None
2. Carbofuran
3. Other (specify)
38) What insects were problems in your potato crop?
1. Don’t know
2. Aphids
3. Cutworm
4. Thrips
5. Leaf Miner
6. Mites
7. White Grubs
8. Other (specify)
39) How were insects controlled prior to planting?
1. Neem
2. Tea waste
3. Tobacco waste
4. Chemical (specify)

Appendix 1. Survey questionnaire
58
40) What diseases were problems in your potato crop?
1. Don’t know
2. Bacterial Wilt
3. Late Blight
4. Rhizoctonia
5. Soft Rot
6. Fusarium
7. Viruses
8. Early Blight
9. Black Leg
10. Scab
11. Other (specify)
41) Were weeds a problem in your crop?
42) How were weeds controlled before planting?
1. Round up (Glyphosate): Rate …………..
2. Gramoxone (Paraquat): Rate …………..
3. Other (specify)
43) How were weeds controlled after planting ? Specify
44) List names of fertilizers (e.g. Urea) and amendments (e.g. Dolomite, manure) applied both pre and post planting
DATE NAME RATE UNITS COMMENTS
45) What method was used to irrigate the crop ?

Appendix 1. Survey questionnaire
59
1. Furrow
2. Watering can
3. Furrow & Watering can
4. Sprinkler
5. Hose & Nozzle
46 How many times was the crop irrigated?
MONITORING CROP To be done fortnightly until four sets of data have been collected.
3 single row plots, each 3 metres long are to be assessed. Plots to be chosen at random at each
visit. Leaf analysis - Collect a total of 10 leaves at each visit. Tear off leaflets to leave petiole
and rachis for analysis.
Monitoring growth & soil moisture PLOT 1 PLOT 2 PLOT 3
47) Date of first visit : 48) Rainfall since planting (mm) 49) Number of plants 50) Number of stems 51) Canopy height (cm) 52) Is canopy cover 100% (Yes/No) 53) Length of longest tuber (mm) 54) Soil moisture (dry, wet, too wet) 55) Date of second visit : 56) Rainfall since planting (mm) 57) Number of plants 58) Number of stems 59) Canopy height (cm) 60) Is canopy cover 100% (Yes/No) 61) Length of longest tuber (mm) 62) Soil moisture (dry, wet, too wet) 63) Date of third visit : 64) Rainfall since planting (mm) 65) Number of plants 66) Number of stems 67) Canopy height (cm) 68) Is canopy cover 100% (Yes/No) 69) Length of longest tuber (mm)

Appendix 1. Survey questionnaire
60
70) Soil moisture (dry, wet, too wet) 71) Date of fourth visit : 72) Rainfall since planting (mm) 73) Number of plants 74) Number of stems 75) Canopy height (cm) 76) Is canopy cover 100% (Yes/No) 77) Length of longest tuber (mm) 78) Soil moisture (dry, wet, too wet)

Appendix 1. Survey questionnaire
61
Insect Monitoring & Control 79) Insect Monitoring & Control
PLOT 1 PLOT 2 PLOT 3 Date Insect Number per plant Severity (Light/Medium/Heavy)1 Control applied by Farmer2:
Date Insect Number per plant Severity (Light/Medium/Heavy) Control applied by Farmer:
Date Insect Number per plant Severity (Light/Medium/Heavy) Control applied by Farmer:
Date Insect Number per plant Severity (Light/Medium/Heavy) Control applied by Farmer:
1For aphids > 20 per plant = Heavy, for leaf miner use published scale 2Describe chemical, number of applications and rate

Appendix 1. Survey questionnaire
62
PLOT 1 PLOT 2 PLOT 3 Date Insect Number per plant Severity (Light/Medium/Heavy)1. Control applied by Farmer 2:
Date Insect Number per plant Severity (Light/Medium/Heavy) Control applied by Farmer :
Date Insect Number per plant Severity (Light/Medium/Heavy) Control applied by Farmer :
Date Insect Number per plant Severity (Light/Medium/Heavy) Control applied by Farmer :
1For aphids > 20 per plant = Heavy, for leaf miner use published scale 2Describe chemical, number of applications and rate

Appendix 1. Survey questionnaire
63
80) Disease Monitoring & Control
PLOT 1 PLOT 2 PLOT 3 Date Disease Number of plants affected Severity (Light/Medium/Heavy) Control applied by Farmer1:
Date Disease Number of plants affected Severity (Light/Medium/Heavy) Control applied by Farmer:
Date Disease Number of plants affected Severity (Light/Medium/Heavy) Control applied by Farmer:
Date Disease Number of plants affected Severity (Light/Medium/Heavy) Control applied by Farmer:
1Describe chemical, number of applications and rate

Appendix 1. Survey questionnaire
64
PLOT 1 PLOT 2 PLOT 3 Date Disease Number of plants affected Severity (Light/Medium/Heavy) Control applied by Farmer1:
Date Disease Number of plants affected Severity (Light/Medium/Heavy) Control applied by Farmer:
Date Disease Number of plants affected Severity (Light/Medium/Heavy) Control applied by Farmer:
Date Disease Number of plants affected Severity (Light/Medium/Heavy) Control applied by Farmer:
1Describe chemical, number of applications and rate

Appendix 1. Survey questionnaire
65
81) Other Damage Monitoring & Control
PLOT 1 PLOT 2 PLOT 3 Date Describe Damage Number of plants affected Severity of Damage (Light/Medium/Heavy)1. Control used by Farmer2:
Date Describe Damage Number of plants affected Severity of Damage (Light/Medium/Heavy) Control used by Farmer:
Date Describe Damage Number of plants affected Severity of Damage (Light/Medium/Heavy)1. Control used by Farmer 2. :
Date Describe Damage Number of plants affected Severity of Damage (Light/Medium/Heavy)1. Control used by Farmer 2. :
1Describe what was done

Appendix 1. Survey questionnaire
66
82) Harvest Date:
83) Why was this date chosen?
84) Weeks of growth left if crop harvested early:
85) Yield: weigh and record 5 single row plots, each 3 metres long
PLOT 1 TUBER GRADE WEIGHT (g) NO. OF TUBERS < 30 mm 30-50 mm >50 mm Reject
1
Reason for most rejects * < 30 mm 30-50 mm >50 mm Reject
2
Reason for most rejects * < 30 mm 30-50 mm >50 mm Reject
3
Reason for most rejects * < 30 mm 30-50 mm >50 mm Reject
4
Reason for most rejects * < 30 mm 30-50 mm >50 mm Reject
5
Reason for most rejects * * Choose From: Diseased, Pest Damage, Mechanical Damage, Oversize, Other Name of Evaluator: ……………………………………………………….

Appendix 2. Additional Crop 1 data
67
Sampling 1
Fe in petioles (ug/g DW)
0 100 200 300 400 500 600
Mar
keta
ble
Yie
ld (t
/ha)
0
5
10
15
20
25
30
y=16.69-0.01178x R2=0.06
P<0.09
Fe in petioles (ug/g DW)
0 100 200 300 400 500
Mar
keta
ble
Yiel
d (t/
ha)
0
5
10
15
20
25
30
Sampling 2
y=14.35+0.0010x R2=0
P<0.93
Figure 1. Fe in petioles (mg/kg DW) with yield at 2 sampling times. Vertical lines correspond to range of concentrations from minimum (< is deficient), left line, to maximum (> is toxic), right line at each time.

Appendix 2. Additional Crop 1 data
68
Sampling 1
Mn in petioles (ug/g DW)
200 400 600 800 1000
Mar
keta
ble
Yie
ld (t
/ha)
0
5
10
15
20
25
30 y=17.7-0.00523x R2=0.08
P<0.28
Sampling 2
Mn in petioles (ug/g DW)
200 400 600 800 1000 1200 1400 1600 1800 2000
Mar
keta
ble
Yie
ld (t
/ha)
0
5
10
15
20
25
30
y=15.52-0.00126x R2=0
P<0.67
Figure 2. Mn in petioles (mg/kg DW) with yield at 2 sampling times. Vertical line corresponds to concentration above which toxicity may occur.

Appendix 2. Additional Crop 1 data
69
Sampling 1
Zn in petioles (ug/g DW)
40 60 80 100 120 140 160
Mar
keta
ble
Yie
ld (t
/ha)
0
5
10
15
20
25
30
y=18.39-0.0474x
P<0.13
R2=0.05
Sampling 2
Zn in petioles (ug/g DW)
0 100 200 300 400 500
Mar
keta
ble
Yie
ld (t
/ha)
0
5
10
15
20
25
30
y=15.52-0.0075x (ns)
Figure 3. Zn in petioles (mg/kg DW) with yield at two samples time. Vertical line corresponds to concentration of Zn which maybe toxic.

Appendix 2. Additional Crop 1 data
70
Sampling 1
Ca in petioles (% DW)
0.2 0.4 0.6 0.8 1.0 1.2 1.4 1.6 1.8 2.0 2.2
Mar
keta
ble
Yiel
d (t/
ha)
0
5
10
15
20
25
30
y=17.66-3.74x R2=0.08
P<0.08
Sampling 2
Ca in petioles (% DW)
0.0 0.2 0.4 0.6 0.8 1.0 1.2 1.4 1.6 1.8 2.0
Mar
keta
ble
Yiel
d (t/
ha)
0
5
10
15
20
25
30y=13.8+0.9x (ns)
Figure 4. Ca in petioles (mg/kg DW) with yield at 2 sampling times. Vertical, lines correspond to range of concentrations from minimum (< is deficient), left line, to maximum (> is toxic), right line, at each time

Appendix 2. Additional Crop 1 data
71
K in petioles (% DW)
2 4 6 8 10 12 14 16 18 20 22
Mar
keta
ble
Yie
ld (t
/ha)
0
5
10
15
20
25
30
35
Sampling 1
y=14.71-0.06x R2=0
P<0.82
Sampling 2
K in petioles (% DW)
10 12 14 16 18 20 22
Mar
keta
ble
Yiel
d (t/
ha)
0
5
10
15
20
25
30
y=16.65-0.136x R2=0
P<0.79
Figure 5. K in petioles (% DW) with yield at 2 sampling times. Vertical lines correspond to range of concentrations from minimum (< is deficient), left line, to maximum (> is toxic), right line, at each time

Appendix 2. Additional Crop 1 data
72
Sampling 1
Mg in petioles (% DW)
0.10 0.15 0.20 0.25 0.30 0.35 0.40 0.45 0.50
Mar
keta
ble
Yiel
d (t/
ha)
0
5
10
15
20
25
30
y=17.77-12.9x R2=0
P<0.35
Sampling 2
Mg in petioles (% DW)
0.1 0.2 0.3 0.4 0.5
Mar
keta
ble
Yiel
d (t/
ha)
0
5
10
15
20
25
30
35
y=17.78-12.2x R2=0.01
P<0.32
Figure 6. Mg in petioles (%DW) with yield at 2 sampling times. Vertical line corresponds to concentration below which deficiency may occur?

Appendix 2. Additional Crop 1 data
73
Figure 7. N (A) and S (B) in petioles (% DW) with yield at one sampling time. Vertical lines correspond to range of concentrations from minimum (< is deficient), left line, to maximum (> is toxic), right line, at each time
Sampling 2
N in petioles (% DW)
1.2 1.4 1.6 1.8 2.0 2.2 2.4
Mar
keta
ble
Yiel
d (t/
ha)
0
5
10
15
20
25
30
y=18.15-2.01x (ns) (A)
Sampling 2
S in petioles (% DW)
1000 1500 2000 2500 3000 3500 4000 4500 5000
Mar
keta
ble
Yiel
d (t/
ha)
0
5
10
15
20
25
30
35
(B)y=17.70-0.0016x (ns)

Appendix 2. Additional Crop 1 data
74
Sampling 1
P in petioles (% DW)
0.0 0.2 0.4 0.6 0.8 1.0
Mar
keta
ble
Yie
ld (t
/ha)
0
5
10
15
20
25
30
y=12.17+3.34x (ns)
Sampling 2
P in petioles (% DW)
0.0 0.2 0.4 0.6 0.8
Mar
keta
ble
Yiel
d (t/
ha)
0
5
10
15
20
25
30
y=15.72-5.08x (ns)
Figure 8. P in petioles (%DW) with yield at 2 sampling times. Vertical lines correspond to range of concentrations from minimum (< is deficient), left line, to maximum (> is toxic), right line, at each time

Appendix 3. Additional Crop 2 data
75
Figure 1. Cu in petioles (mg/kg DW) with yield at 3 sampling times. Vertical lines correspond to range of concentrations from minimum (< is deficient), left line, to maximum (> is toxic), right line (sampling 1) or for maximum (sampling 2 &3)
Sampling 1
Cu in petioles (m g/kg DW )
4 6 8 10 12 14 16 18 20 22 24
Mar
keta
ble
Yiel
d (t/
ha)
8
10
12
14
16
18
20
22
24
26
y=17.2+0.054x (ns)
4 6 8 10 12 14 168
10
12
14
16
18
20
22
24
26Sampling 2
Mar
keta
ble
Yiel
d (t/
ha)
Cu in petioles (m g/kg DW )
y=18.73-0.154x (ns)
4 6 8 10 12 14 16 18 20 22 24 268
10
12
14
16
18
20
22
24
26
Sampling 3
Mar
keta
ble
Yiel
d (t/
ha)
Cu in petioles (m g/kg DW )
y=17.2+0.054x (ns)
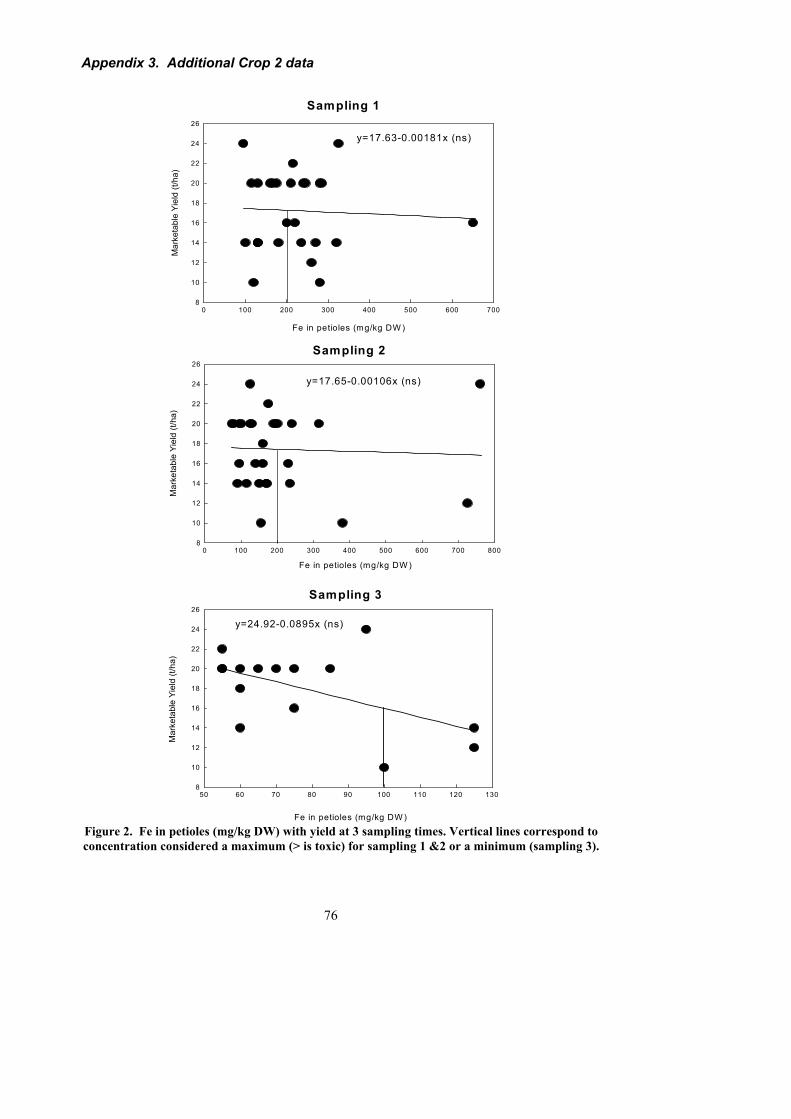
Appendix 3. Additional Crop 2 data
76
Sampling 1
Fe in petioles (mg/kg DW )
0 100 200 300 400 500 600 700
Mar
keta
ble
Yiel
d (t/
ha)
8
10
12
14
16
18
20
22
24
26
0 100 200 300 400 500 600 700 8008
10
12
14
16
18
20
22
24
26
Mar
keta
ble
Yiel
d (t/
ha)
Fe in petioles (mg/kg DW )
Sampling 2
50 60 70 80 90 100 110 120 1308
10
12
14
16
18
20
22
24
26
Mar
keta
ble
Yiel
d (t/
ha)
Fe in petioles (mg/kg DW )
Sampling 3
y=17.63-0.00181x (ns)
y=17.65-0.00106x (ns)
y=24.92-0.0895x (ns)
Figure 2. Fe in petioles (mg/kg DW) with yield at 3 sampling times. Vertical lines correspond to concentration considered a maximum (> is toxic) for sampling 1 &2 or a minimum (sampling 3).
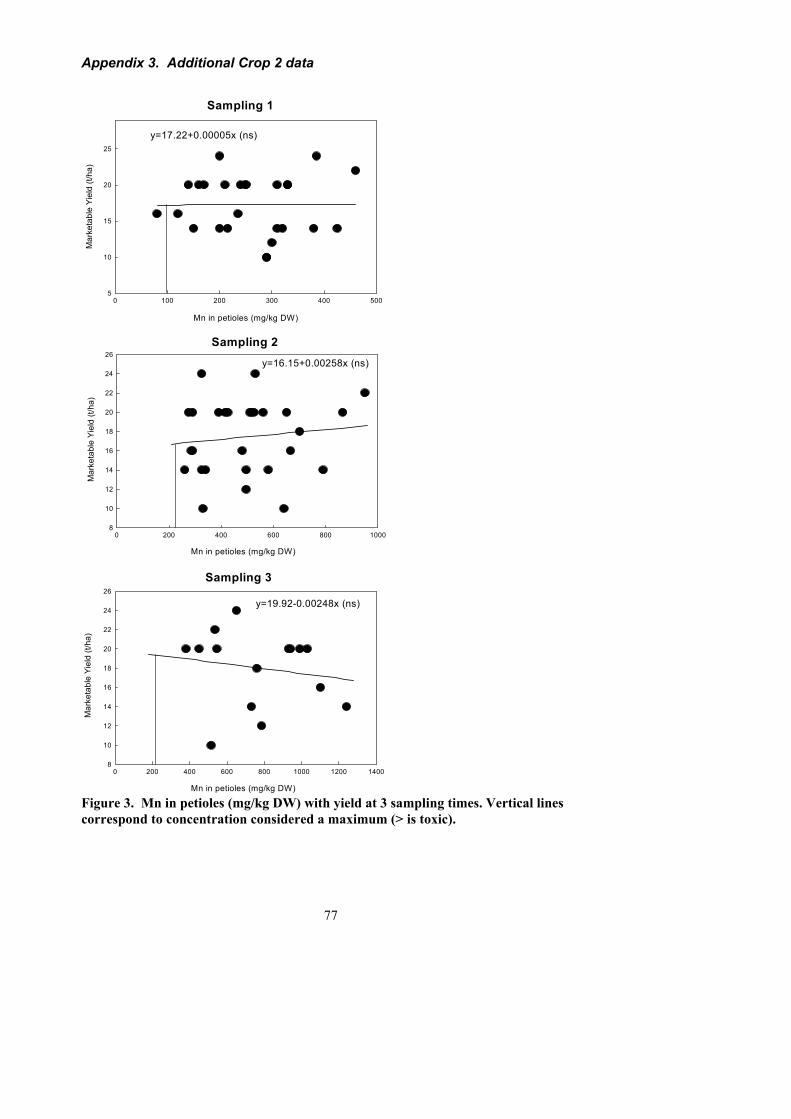
Appendix 3. Additional Crop 2 data
77
Sampling 1
Mn in petioles (mg/kg DW)
0 100 200 300 400 500
Mar
keta
ble
Yiel
d (t/
ha)
5
10
15
20
25
0 200 400 600 800 10008
10
12
14
16
18
20
22
24
26Sampling 2
Mar
keta
ble
Yiel
d (t/
ha)
Mn in petioles (mg/kg DW)
0 200 400 600 800 1000 1200 14008
10
12
14
16
18
20
22
24
26
Mar
keta
ble
Yiel
d (t/
ha)
Mn in petioles (mg/kg DW)
Sampling 3
y=17.22+0.00005x (ns)
y=16.15+0.00258x (ns)
y=19.92-0.00248x (ns)
Figure 3. Mn in petioles (mg/kg DW) with yield at 3 sampling times. Vertical lines correspond to concentration considered a maximum (> is toxic).

Appendix 3. Additional Crop 2 data
78
Sampling 1
Zn in petioles (mg/kg DW)
20 30 40 50 60 70 80 90
Mar
keta
ble
Yiel
d (t/
ha)
8
10
12
14
16
18
20
22
24
26
y=21.92-0.1015x (ns)
0 20 40 60 80 100 120 140 1608
10
12
14
16
18
20
22
24
26
Sampling 2
Mar
keta
ble
Yiel
d (t/
ha)
Zn in petioles (mg/kg DW)
y=18.93-0.0197x (ns)
50 60 70 80 90 100 110 1208
10
12
14
16
18
20
22
24
26
Zn in petioles (mg/kg DW)
Mar
keta
ble
Yiel
d (t/
ha)
y=22.93-0.0652x (ns)
Sampling 3
Figure 4. Zn in petioles (mg/kg DW) with yield at 3 sampling times. Vertical lines correspond to range of concentrations from minimum (< is deficient) left line, to maximum (> is toxic), right line (sampling 2) a minimum (sampling 1) or maximum (sampling 3).
Appendix 3. Additional Crop 2 data
79
Sampling 1
Ca in petioles (mg/kg DW)
0.0 0.5 1.0 1.5 2.0 2.5 3.0 3.5
Mar
keta
ble
Yiel
d (t/
ha)
8
10
12
14
16
18
20
22
24
26
y=17.16+0.073x (ns)
0.0 0.5 1.0 1.5 2.0 2.5 3.0 3.5 4.0 4.58
10
12
14
16
18
20
22
24
26
Sampling 2
Mar
keta
ble
Yiel
d (t/
ha)
Ca in petioles (mg/kg DW)
y=16.73+0.506x (ns)
0.35 0.40 0.45 0.50 0.55 0.60 0.65 0.70 0.758
10
12
14
16
18
20
22
24
26
Mar
keta
ble
Yiel
d (t/
ha)
Ca in petioles (mg/kg DW)
Sampling 3
y=17.31+1.3x (ns)
Figure 5. Ca in petioles (mg/kg DW) with yield at 3 sampling times. Vertical lines correspond to range of concentrations from minimum (< is deficient) left line, to maximum (> is toxic), right line (sampling 1 &2) or minimum only (sampling 3).

Appendix 3. Additional Crop 2 data
80
Sampling 1
K in petioles (mg/kg DW)
12 13 14 15 16 17 18 19 20
Mar
keta
ble
Yiel
d (t/
ha)
8
10
12
14
16
18
20
22
24
26
6 8 10 12 14 16 18 208
10
12
14
16
18
20
22
24
26
Sampling 2
Mar
keta
ble
Yiel
d (t/
ha)
K in petioles (mg/kg DW)
11 12 13 14 15 16 178
10
12
14
16
18
20
22
24
26
K in petioles (mg/kg DW)
Mar
keta
ble
Yiel
d (t/
ha)
Sampling 3
y=14.40+0.185x (ns)
y=23.29-0.415x (ns)
y=19.9-0.144x (ns)
Figure 6. K in petioles (mg/kg DW) with yield at 3 sampling times. Vertical lines correspond to range of concentrations from minimum (< is deficient), left line, to maximum (> is toxic), right line (sampling 2) or maximum only (sampling 1 & 3).

Appendix 3. Additional Crop 2 data
81
Mg in petioles (mg/kg DW)
0.0 0.2 0.4 0.6 0.8
Mar
keta
ble
Yiel
d (t/
ha)
8
10
12
14
16
18
20
22
24
26
y=15.73+4.9x (ns)
0.0 0.2 0.4 0.6 0.88
10
12
14
16
18
20
22
24
26
Mg in petioles (mg/kg DW)
Mar
keta
ble
Yiel
d (t/
ha)
y=16.17+4.07x (ns)
0.05 0.10 0.15 0.20 0.25 0.30 0.35 0.408
10
12
14
16
18
20
22
24
26
Mg in petioles (mg/kg DW)
Mar
keta
ble
Yiel
d (t/
ha)
y=18.61-3.5x (ns)
Sampling 1
Sampling 2
Sampling 3
Figure 7. Mg in petioles (mg/kg DW) with yield at 3 sampling times. Vertical lines correspond to concentration considered a minimum (< is deficient) for sampling 1 & 2.

Appendix 3. Additional Crop 2 data
82
Sampling 2
Sampling 3
N in petioles (mg/kg DW)
1.5 2.0 2.5 3.0 3.5 4.0
Mar
keta
ble
Yiel
d (t/
ha)
8
10
12
14
16
18
20
22
24
26
Sampling 1
N in petioles (mg/kg DW)
1.0 1.5 2.0 2.5 3.0 3.5
Mar
keta
ble
Yiel
d (t/
ha)
8
10
12
14
16
18
20
22
24
26
N in petioles (mg/kg DW)
1.6 1.8 2.0 2.2 2.4 2.6 2.8
Mar
keta
ble
Yiel
d (t/
ha)
8
10
12
14
16
18
20
22
24
26
y=19.24-0.76x (ns)
y=20.25-1.20x (ns)
y=15.16+1.37x (ns)
Figure 8. N in petioles (mg/kg DW) with yield at 3 sampling times. Vertical lines correspond to concentrations considered a minimum (< is deficient) at each sampling.

Appendix 3. Additional Crop 2 data
83
Sampling 1
P in petioles (mg/kg DW)
0.15 0.20 0.25 0.30 0.35 0.40 0.45 0.50
Mar
keta
ble
Yiel
d (t/
ha)
5
10
15
20
25
30
y=15.16+1.37x (ns)
0.05 0.10 0.15 0.20 0.25 0.30 0.35 0.40
Mar
keta
ble
Yiel
d (t/
ha)
8
10
12
14
16
18
20
22
24
26Sampling 2
P in petioles (mg/kg DW)
0.08 0.10 0.12 0.14 0.16 0.18 0.20 0.22 0.24 0.26
Mar
keta
ble
Yiel
d (t/
ha)
8
10
12
14
16
18
20
22
24
26
P in petioles (mg/kg DW)
y=20.57-13.4x (ns)
y=21.83-24.4x (ns)
Sampling 3
Figure 9. P in petioles (mg/kg DW) with yield at 3 sampling times. Vertical lines correspond to concentrations considered a minimum (< is deficient) at each sampling.

Appendix 3. Additional Crop 2 data
84
Sampling 1
S in petioles (mg/kg DW)
0.10 0.12 0.14 0.16 0.18 0.20 0.22 0.24 0.26 0.28
Mar
keta
ble
Yiel
d (t/
ha)
8
10
12
14
16
18
20
22
24
26
y=20.79-19.1x (ns)
0.12 0.14 0.16 0.18 0.20 0.22 0.24 0.26 0.28 0.308
10
12
14
16
18
20
22
24
26
Sampling 2
Mar
keta
ble
Yiel
d (t/
ha)
S in petioles (mg/kg DW)
y=21.62-19.6x (ns)
0.13 0.14 0.15 0.16 0.17 0.18 0.19 0.208
10
12
14
16
18
20
22
24
26
S in petioles (mg/kg DW)
Mar
keta
ble
Yiel
d (t/
ha)
Sampling 3
y=42.85-152.1x (ns)
Figure 10. S in petioles (mg/kg DW) with yield at 3 sampling times. Vertical lines correspond to concentrations considered a minimum (< is deficient) at each sampling.

Appendix 4. Rotation data for Crop 1 & Crop 2
85
Table 1. Annual cropping sequences (rotation) used by growers in the year of the surveys. The number in each cell is the number of growers using the rotation for each crop and quartile. The number of different rotations used for each Quartile is shown as the Total of each column.
Crop 1 Crop 2 Cropping sequence
Quartile Quartile 1 2 3 1 2 beet + leeks*, potato 1 beet, leeks, potato 1 beet, potato 1 cabbage, cabbage, potato 1 cabbage, potato, potato 1 1 carrots, carrots, potato 1 carrots, leeks, potato 1 carrots, potato 1 1 1 carrots, potato, potato 1 1 carrots, radish, potato 1 leeks + carrots, potato 1 leeks + carrots, potato, potato 1 leeks, leeks, potato 4 2 leeks, potato 1 2 1 leeks, potato, potato 1 1 potato, fallow 1 1 potato, potato 1 radish, potato, potato 1 radish, radish ,potato 1 strawberry, potato 1 cabbage, potato 3 3 paddy, potato 9 10 radish, potato 1
Total 9 10 11 15 15
* + = interplanted crops, i.e. leeks + carrots = leek and carrot in one planting