Embed Size (px)
Citation preview

Industry insights
28 July 2016
ContentsSummary 02
Introducing the horticulture sector 03
Fast ripening: Horticulture exports 05
Trend One: Consolidation and corporatisation 07
Trend Two: Technology’s productivity boost 10
Trend Three: Sharply rising land value 12
Other risks and opportunities 13
Kiwifruit 14
Apples 16
Honey 18
Other fruit 20
Vegetables and other crops 22
Horticulture

INDUSTRY INSIGHTS | July 2016 | 2
The horticulture sector in New Zealand is small in terms of direct employment, at around 39,000 FTEs, but is responsible for more than 7% of New Zealand’s merchandise exports. The sector is enjoying a period of exceptional growth across almost all sub-sectors. Kiwifruit, apples, honey, and even much smaller sub-sectors like cherries are enjoying solid gains in export revenues.
Recent performance of the sector
While 40% of horticultural production is consumed domestically or used as inputs into other industries, the key story in horticulture has been export growth. Total export revenues reached $3.4 billion in the year to May 2016. This equates to an increase of nearly 140% in 16 years (compared to 94% for all New Zealand merchandise exports), or 5.6% a year.
In the last four years, growth accelerated, despite the strength of the NZD against major trading partner currencies. In the four years to May, revenues from exports of our three most important horticulture products (by value) grew by 54% (kiwifruit), 105% (apples) and 158% (honey).
But growth was not limited to these headliners. Other products also fared exceptionally well, including blueberries (116%), onions (81%), and cherries (303%).
The recipe for success
A number of factors have driven this recent success. Many industries, including kiwifruit, apples and cherries, have increased yields by up to 50% through new on-farm practices, or growing different varieties. These include better coordination and consolidation of horticulture businesses and an increase in the number of varieties grown, particularly in apple growing. Marketing of individual varieties as brands has opened up new markets internationally, while trade with China and other parts of Asia has benefitted from freer trade, often aided by Free Trade Agreements.
Risks, opportunities and outlook
At the same time, huge changes are underfoot in the sector. Some of these pose additional opportunities for the sector’s growth, while others mean considerable risk is developing.
– Increased consolidation and corporatisation: The number of “front doors” in the horticulture sector is falling as more consolidation of businesses occurs. Reasons for this consolidation include the importance of scale in ensuring financial viability through better technology, being able to attract more skilled management, and reducing risk across the business through geographic dispersion of growing capability. We expect to see more corporatisation across sub-sectors, especially in Manuka honey (where little has occurred to date) as the cost to enter the sector rises.
– Technology gains: Low-tech technology improvements include accumulated know-how on planting and pruning, and new varieties. But digital technology to monitor ripeness, quality, and weather patterns to optimise production; more automation in sorting and packing; and better atmosphere control in refrigerated units are also playing a role. However, these improvements are also available to overseas competitors, especially in the northern hemisphere, where most of our produce goes. This may reduce the attractiveness of fresh New Zealand produce relative to refrigerated northern hemisphere produce stored using newer refrigeration technology, for example. We expect more automation of sorting and packing, and the need to employ technology to further support corporatisation.
– Rising export market concentration: Some products are sold overwhelmingly to just one or two major export markets. The key examples are blueberries (94% to Australia) and avocados (86%). Increasingly, China is coming to play a dominant role in some product categories, particularly in honey (and honey-based neutraceutical products, not covered in this study). Over the short-term, we expect to see more export concentration in China, but opportunities in emerging markets like India and Indonesia may offer some diversification.
– Growing debt: As a result of some sub-sectors returning yields of 7% to 12%, land values have almost doubled in four years. This is increasing debt levels in the sector, and creates the risk of financial strife for some growers making purchasing decisions on the expectation that yields will stay this strong. External events, such as a regulatory change in a major export market, could affect the ability of some to service debt. Nevertheless, at current returns, we expect to see further gains in land values especially in kiwifruit and apples.
– Potential for more non-tariff barriers: Some industry sources were concerned that the current political environment globally may be turning away from free trade, and that more non-tariff barriers to trade may be adopted. Examples already in play include subsidies to local growers, changing relationships in markets where trade is driven by government-to-government negotiations, and the use of biosecurity regulations as a trade barrier.
– Risk of labour shortages: The Recognised Seasonal Employer (RSE) scheme, which allows growers to bring in overseas-based labour for seasonal work, is one way of tackling a shortage of workers in the sector. However, there are more structural concerns around succession planning of an ageing workforce, and access to skilled scientists and teachers to ensure businesses here can remain competitive with global competitors. Without planning to attract and keep younger people in the sector, and to boost the number of technical exports in the sector, New Zealand risks falling behind competitors.
David Norman Industry Economist
Summary

INDUSTRY INSIGHTS | July 2016 | 3
– The horticulture sector punches far above its weight in terms of the export economy, given its relatively small size in employment terms.
– The sector draws on a large number of industries for its inputs, indicating its importance in creating upstream economic activity.
– Overall, the sector’s recent strength has been reflected in strongly rising returns on equity, but also in strong borrowing, which has resulted in lower current ratios and higher total debt to equity ratios.
The horticulture sector contributed approximately $2.1 billion toward GDP in the year to March 2015, or 0.9% of national GDP.¹ The sector employed more than 39,000 full-time equivalent workers (FTEs) as at February 2014 although this was a relatively small share of national employment. However, the sector plays a far more important role in exports, accounting for 7.2% of merchandise exports from New Zealand in the year to May 2016, a point we examine in detail later.
In this report, the horticulture sector is defined as:
– Kiwifruit growing
– Pipfruit growing, with apples being the largest but far from the only product
– Summerfruit growing, also known as stonefruit – dominated by cherries on the export front, but also nectarines, peaches, and apricots
– Other fruit, including avocado and berry growing
– Vegetable and other crop growing, including grains and major export crops such as onions and potatoes
– Honey (increasingly Manuka)
– Nurseries and floriculture
– Processing of fruit and vegetables, categorised separately by Statistics New Zealand, but often vertically integrated into other fruit or vegetable businesses.²
Of the 39,000 FTEs in the sector, the largest proportion was in vegetable and other crop growing. Nearly one quarter worked in pipfruit, mainly apples, while around 3,800 worked in kiwifruit growing, New Zealand’s largest horticulture export in dollar terms.
These figures are not the complete picture, however, as they are based on Statistics New Zealand Business Demography employee count data, adjusted for the full-time part-time mix of each industry and to include employers. However, because the count is done each February, it does not take into account seasonal employment patterns industries like fruit growing. It is likely to include a large number of seasonal workers in apple picking, for instance, but to exclude a large number of kiwifruit pickers who are active from March to May. As a result, the employment figures may overstate the level of annual employment in pipfruit, but understate employment in other production such as kiwifruit.
Upstream and downstream industries
National input-output tables allow us to examine what industries are major suppliers (upstream sources) to the horticulture sector, and where the outputs (downstream beneficiaries) from the sector go. This helps clarify how closely the fortunes of certain industries are linked to horticulture.
Big inputs into the horticulture sector include imports, other food manufacturing, and road transport. More than half of all inputs come from a wide range of sectors other than the top seven.
Introducing the horticulture sector
¹ New Zealand GDP and the constituent value added by specific sectors or sub-sectors consist predominantly of pre-tax and depreciation profits (economic profits) and salaries and wages. All GDP and value added figures in this report are in 2015 dollars. Estimates of 2015 contribution to GDP by Horticulture or its sub-sectors are still preliminary.
² Beverages such as wine (including grape growing), fruit juice, beer and spirits are excluded as they will be dealt with in future Industry Insights reports.
Horticulture employment (FTEs), 2014
3,798
9,555
4,651
4,622
10,810
1,517
4,415
Kiwifruit
Pipfruit
Other fruit
Processing
Vegetables and other crops
Honey
Nurseries and floriculture
39,368
Source: Westpac
Horticulture businesses, 2014
1,881
797
2,346
130
3,983
545
1,274
Kiwifruit
Pipfruit
Other fruit
Processing
Vegetables and other crops
Honey
Nurseries and floriculture
39,368
Source: Westpac

INDUSTRY INSIGHTS | July 2016 | 4
On the outputs side, however, the vast bulk of products from the horticulture sector is exported or directly consumed in New Zealand. While 40% of production is consumed in New Zealand or used as inputs into other industries, the growth in recent years has been overwhelmingly in exports, and the potential for growth is largely concentrated in exports. As a result, much of the focus of this report is on exports.
Commercial benchmark indicators
Businesses can monitor their own commercial performance against that of other businesses in their sub-sector by comparing themselves to sub-sector averages. Where possible, this report provides the most recent available information on three key commercial ratios for each sub-sector. The three indicators are return on equity, current ratio (current assets divided by current liabilities), and liabilities structure (share of total liabilities provided by shareholder or owners’ equity).
Over the last few years, returns on equity in the sector have risen sharply from near zero as fortunes have improved. By 2014,
returns were close to 13%. At the same time, however, the sector’s ability to service short-term debt from current assets fell markedly, from 100% to 70% as businesses took on more debt. As a result, the liabilities structure of the sector fell to around 41% (i.e. owner’s equity is less than half the asset value of the sector), from 47% in 2012.
Key commercial indicators
2.2%
100.1%
47.4%
7.0%
69.6%
40.6%
12.7%
70.9%
40.8%
0%
20%
40%
60%
80%
100%
120%
Return on equity Current ratio Liabilities structure0%
20%
40%
60%
80%
100%
120%
201220132014
Source: Westpac, Statistics New Zealand
Where inputs come from
19.1%
10.1%
6.2%
3.4%3.0%
52.6%
Imports
Other food mfg
Hort & fruit growing
Agri, forest & fish support svs
Road transport
Dairy mfg
Sheep & beef farming
Other
Source: Statistics New Zealand, Westpac
Where outputs go
22.3%
59.8%
5.7%
7.0% Consumption
Exports
Other food mfg
Beverage & tobacco mfg
Food & beverage svs
Dairy mfg
Hort & fruit growing
Other
Source: Westpac

INDUSTRY INSIGHTS | July 2016 | 5
– The opportunities for growth in horticulture are in exports, given New Zealand’s small population.
– Horticulture has enjoyed stellar growth in exports in recent years.
– At the same time, many industry sources believe growth could have been significantly stronger were it not for a variety of non-tariff barriers. These have included subsidies and political resistance of overseas growers to competition, the limitations of government-to-government trade relations, and biosecurity and carbon footprint policies.
– More than 50% of all growth in horticulture export values over the last four years was from trade with just three countries. This significantly increases the risk that an economic downturn or regulatory change in just one or two markets could have a big impact on the sector.
Industry sources agreed that almost all new opportunities within the horticulture sector are those offered by growing exports. New Zealand has a small population, meaning most new production will be exported.
As a result, the huge productivity gains being seen in horticulture, and which we discuss in detail later, means that the sector plays an increasingly important role in the New Zealand export picture. Over the last 16 years, its share of total export values has risen from 5.8% to 7.2%. In NZD terms, exports are up nearly 140% in 16 years (compared to 94% for all exports), or 5.6% a year. In USD terms, growth averaged an even stronger 7.5% a year.
Horticulture export values, annual rolling average
0
1
2
3
4
2000 2004 2008 2012 20160
1
2
3
4
NZDUSD
$bn
Source: Westpac, Statistics New Zealand
$bn
Growth over the last couple of years through to May 2016 has been particularly strong. Some of this change has been the result of a beneficial exchange rate as the NZD weakened, making our exports more attractive. But even in USD terms, exports were up 25% in 27 months.
Horticulture exports by product ($mn), year to May 2016
$1,566
$689
$310
$110$86
$83$68
$363
KiwifruitApplesHoneyOnionsPeasAvocadoesCherriesSquashBlueberriesOther horticulture
Source: Westpac, Statistics New Zealand
In the year to May 2016, New Zealand exported $1.57 billion of kiwifruit, and nearly $700 million in apples. After several years of strong growth, honey has become the third largest horticulture export, at $310 million. Onions, peas and avocados all each had over $80 million in exports in the year. A wide range of horticulture products played a smaller role, accounting for around $526 between them.
In a pickle: Increased export concentration
We explore export growth by key trading partners in the sections on each major product category, but at a headline level, it is worth highlighting the concentration of exports across each major export product in just a handful of destination countries. In the graph (overleaf), the more concentrated products are those with just a few key export partners. A high score presents risks that a change in economic conditions, regulations, preferences, or exchange rates in just one or a handful of countries may massively affect exports in the product category.
Overall, the industry’s export concentration by this measure is around 0.40, but across key products the ratio varies from 0.26 to 0.93.
Blueberries and avocados are two products with the highest concentrations. As much as 93% of blueberry and 86% of avocado exports are to Australia. At the other end of the spectrum, apples are exported to a wide variety of countries, protecting the category against sudden changes in one market. The United States, our biggest apple purchaser, takes just 14% of products by value, followed by the United Kingdom (12%) and Taiwan (11%).
A further point to consider is how these concentrations have changed over the last few years. In most product categories, the concentration ratio has not changed much. But as some export categories have grown faster than others, the overall level of
Fast ripening: Horticulture exports

INDUSTRY INSIGHTS | July 2016 | 6
concentration across the top eight trading partners has grown. In other words, we are far more dependent on a handful of countries to take our horticulture exports than we were even four years ago.
The big story has been the growth in horticulture exports to China, up 353% in four years. That's more than 30% of all growth in horticulture exports. But remarkable growth has also been seen in a couple of other major horticulture markets, most notably Taiwan (149% growth in four years) and the United States (101%). Those 2 countries accounted for 13% and 9% of total horticulture export value growth since 2012.
The concentration of export growth in just a few countries can in some cases mean that risk is even higher than the export concentrations ratios introduced earlier suggest. For instance, industry sources have suggested that the vast bulk of growth in honey exports has been Manuka honey exports to China. Yet honey still has one of the lowest export concentrations in the export sector as traditional, lower priced honey exports have been sold to a number of trading partners for several years.
The other clear trend in exports is the increasing importance of Asia, and the diminished role of Europe. Japan, China, Taiwan and Hong Kong (the latter often as just an entry point into China) account for 41% of horticulture export values. Australia accounts for just 10% of export values, and the four largest European partners together for just 11%.
What tariffs?
Several industry sources expressed concern that, despite Free Trade Agreements (FTAs) theoretically making it easier for New Zealand products to enter foreign markets, several other non-tariff barriers have emerged. These barriers are limiting opportunities for international growth and/or pose serious risks to ongoing trade. Key examples include:
– Subsidies to local growers: Growers in many countries continue to receive subsidies, giving them an advantage over imported horticultural products.
– Local grower response: In some markets, when overseas producers (like New Zealand) begin to play a bigger role in supplying horticultural products, it results in local growers pushing governments to keep out overseas grown produce using whatever measures are available within World Trade Organisation (WTO) rules.
– Trade on a government-to-government basis: Many trading partners, particularly in Asia, still rely on government-to-government negotiations for trade, rather than free market trade. This means opportunities for trade growth are limited to whatever governments can agree, and are subject to sometimes rapidly-changing government policies or geopolitical factors in those countries.
– Biosecurity concerns: New Zealand has arguably the most stringent biosecurity regime in the world, which supports exports from here as it provides confidence to trading partners. However, in some cases biosecurity concerns have been raised as reasons to limit access. In the case of New Zealand apple exports to Australia, for instance, the WTO ruled after 90 years of New Zealand exports being banned that fears over fire blight spreading to Australia from New Zealand apple exports were unfounded.
– Carbon footprint expectations: In many developed countries, where concerns over environmental degradation are more prominent, some supermarkets are responding to consumer preferences by limiting stocks of products from far-away countries like New Zealand. This is because the transport component of getting that product to the shelf is higher, and thus assumed to have a bigger negative impact on the environment. New Zealand’s geographic isolation continues to be a challenge despite the rise of far more efficient international transport and the resultant fall in the carbon emissions per tonne transported.
Concentration across top 8 export destinations
ApplesOnions
KiwifruitHoney
PeasBulbs
CherriesFlowers
SweetcornMaize
PotatoesCapsicum
SquashAvocadoesBlueberries
All horticulture
0.0 0.2 0.4 0.6 0.8 1.0
20162012
Source: Westpac, Statistics New Zealand
Horticulture exports, May years (NZ$mn)
$487
$515 $478
$304
$326 $267 $220
$810
$1,212
2012
2016
0 900 1,800 2,700 3,600Japan China AustraliaTaiwan United States United KingdomHong Kong Spain Other countries
Source: Westpac, Statistics New Zealand

INDUSTRY INSIGHTS | July 2016 | 7
– The number of “front doors” in the horticulture sector is falling as more consolidation of businesses occurs.
– There are a number of reasons for this consolidation, including the importance of scale in ensuring financial viability through better technology, and reducing risk across the business.
– We expect to see more consolidation and corporatisation across all sub-sectors over the next decade.
– The corporatisation in the sector raises the question of which marketing model is best to achieve growth, competition and innovation.
– Many industry sources hinted at a model somewhere between the single-desk and the deregulated model as a means of capturing the best of both worlds.
Businesses in the sector tend to be small, in part skewed again by the seasonal nature of the workflow. While the average New Zealand business employs around 4.3 FTEs, in horticulture the average is around 3.6 FTEs. But this varies between just 2.0 FTEs in kiwifruit and some other fruit businesses, to 36 FTEs per processing facility on average.
Horticulture FTEs per business
2.0
12.0
2.0
35.6
2.7
2.8
3.5
3.6
4.3
Kiwifruit
Pipfruit
Other fruit
Processing
Vegetables and other crops
Honey
Nurseries and floriculture
Horticulture
All New Zealand industries
0 9 18 27 36Source: Westpac
Yet change is clearly afoot, with businesses becoming larger and more corporatised. Several industry sources viewed mergers and corporatisation of the sector as crucial for success. However, there were also some who believed scale can weaken the business.
The numbers speak for themselves with regard to the dominant trends in the sector. Over the last decade and a half, the sector has seen dramatic changes (almost always reductions) in the number of business “front doors” operating. i.e. the number of discrete locations where specific activities are undertaken.
Change in "front doors" and enterprises, 2000 to 2014
-8.4%
-54.1%
-4.3%
10.2%
-4.6%
52.7%
-50.1%
-9.2%
-57.0%
-2.9%
8.6%
-55.9%
53.8%
-50.8%
Kiwifruit
Pipfruit
Other fruit
Processing
Vegetables and other crops
Honey
Nurseries and floriculture
-60% -40% -20% 0% 20% 40% 60%
Front doorsEnterprises
Source: Westpac
The number of front doors at which honey is being grown as a primary activity has risen by more than 50%, and the number of processing facilities by 10%. But all other components of the sector have seen a reduction in front doors. This does not necessarily imply weakness or decline in each sub-sector. Instead, in the case of pipfruit, for instance, it highlights significant consolidation into larger, more corporatised organisations.
But when we compare the number of front doors with the number of enterprises (the number of discrete legal entities) operating, other patterns emerge. In most cases the number of enterprises and the number of front doors decreased by similar percentages. This implies that owners are purchasing a number of neighbouring properties and incorporating those geographic units or front doors into their existing businesses.
In the case of vegetables and other crops, however, the story is different. The number of front doors has fallen slightly, but the number of enterprises has fallen far more. This occurs when a farm owner purchases and incorporates into their business other farms that are geographically distant. This difference can be explained by the diagram below.
Farm A Farm B Farm C
Merger One
Merger Two
In the case of Merger One, the owner of Farm B purchases neighbouring Farm A, incorporating Farm A into their existing
Trend One: Consolidation and corporatisation

INDUSTRY INSIGHTS | July 2016 | 8
business. This reduces the number of enterprises by one, and the number of geographic units by one. This has been the case across most product categories in horticulture.
In the case of Merger Two, the owner of Farm B purchases Farm C located at a separate location two kilometres down the road, incorporating Farm C into their existing business. In this case, the number of enterprises also falls by one, but the number of geographic units remains unchanged. This has occurred to a large extent in vegetable and other crop growing sector.
Key reasons cited by industry sources for the consolidation of the sector include:
– Cost of skilled workers: Employing managers with the right skills to help an orchard or farm succeed is expensive. Salaries of $100,000 or more are not uncommon. This requires an operation of sufficient scale to support top quality staff.
– Advantages of technology: Similarly, the benefits that can be gained from advanced technology (discussed in its own chapter) often require scale for the benefits to outweigh the costs.
– Cost barriers to entry: The cost of entering the sector is now high, with land averaging over $200,000 per hectare. Many producers suggested at least 10 hectares were required to maximise productivity, implying an entry cost of over $2 million just for the land.
– Intensity of production through scale: Estimates indicate that the largest 20% of vegetable producers, for instance, produce around 80% of produce.
– Risk reduction: Multiple, geographically separate sites reduce risk. A range of horticultural products or varieties similarly diminishes exposure to a price downturn, biosecurity hazard, or crop failure in one. This favours businesses with sites spread across New Zealand.
One industry where the move to corporatisation is seen quite clearly is avocados. Several industry sources mentioned that they had seen a lot more corporatisation of the product category, whereby larger players bought up multiple orchards to develop the scale required to ensure financial viability.
Two further changes being seen in the sector are vertical integration and disintermediation. Vertical integration has seen more businesses increasingly do their own growing, harvesting, packing and marketing. This allows them to capture margins wherever they lie in the value chain.
At the same time, more businesses are bypassing traditional intermediary marketing channels and wholesale markets to deal directly with overseas purchaser of horticulture products. This effectively turns a grower-packer into a marketer as well.
Like bees to a honeypot
The big exception to the trend toward smaller numbers of front doors and enterprises is in honey. This is likely due to the massive expansion in the sector on the back of Manuka honey exports. Honey exports have risen 3,000% in 16 years.
Yet industry sources explained that even in the Manuka honey industry, the need for larger producers is evident. One reason is that bees can fly up to a kilometre from the hive to collect pollen.
This implies an area of collection of 300 hectares. To maximise productivity, a large area of Manuka planting is required.
Marketing models in horticulture
Given the increase in consolidation and corporatisation of the sector, discussions with industry players often turned to which models are best to promote export growth. In an industry as diverse as horticulture, there are several models for getting products from the farm orchard to overseas markets. Speaking to industry leaders across product categories presented a unique opportunity to explore strengths and weaknesses of the different approaches. Several industry sources had or currently operated across more than one marketing model, and could speak of the advantages and challenges of each.
The kiwi way? Single desk model
Zespri occupies a unique position in the New Zealand kiwifruit export market in that it is the only business that can export kiwifruit to countries other than Australia. Other businesses looking to export directly must collaborate with Zespri subject to approval from Kiwifruit NZ.
Most growers we spoke to seemed fairly satisfied with the work Zespri does in marketing and protecting the New Zealand brand internationally. Overall, the product that growers are producing is being sold. One of the key advantages of this model that was repeatedly cited was the ability to coordinate release of product across the selling window, and across markets, to maximise revenues. Zespri has been able to prevent particular markets from being flooded by managing how much product is released.
However, some concerns that were raised about a single-desk approach include:
– The incentive to promote varietals for which the single desk has proprietary rights, such as gold kiwifruit. If promotion of gold kiwifruit at the expense of green kiwifruit occurred, this could imply a misalignment between growers and Zespri’s interests. The prices orchardists are paying Zespri for a license to grow gold kiwifruit, at nearly $200,000 per hectare, points not only to the success of gold kiwifruit and its profitability for the grower, but also the incentive for Zespri to prioritise promotion and sale of gold kiwifruit.
– The ability of a single desk to cover all markets adequately. Some crop management, where “excess” crops are withdrawn from the market to keep prices up, suggests a marketer with a sound understanding of its markets and a desire to maximise prices. However, too much crop management, or a sharp rise in product withdrawals, may point to weaknesses in marketing certain varieties into certain markets.
Pear-shaped: End of the single-desk model in apples and pears
In contrast to the overall success of the single-desk approach in kiwifruit, industry sources were unanimous in the view that the dissolution of the Apple and Pear Marketing Board was the best outcome for the apple industry.
An increase in competition, which can lead to the commoditisation of products to the detriment of margins for all producers was a risk for producers for several years. However,

INDUSTRY INSIGHTS | July 2016 | 9
a subsequent rise in the number of apple varieties has created opportunities for growers and marketers to target specific niche markets. Growers now see the old model as having stifled growth, innovation, the introduction of new varieties, and as a result, new overseas markets.
But having multiple producers and a large number of marketers can create challenges. This has been seen in other sectors like seafood. Most notably, this approach can create a splintered, uncoordinated sector where products are highly commoditised, or where an absence of scale required to market effectively into big target countries weakens growth opportunities.
While the apple sub-sector appears to have made the transition away from a single desk to relatively sophisticated network of producers and marketers, this has not been the case in some other sub-sectors. For instance, several vegetable growers were concerned at the lack of coordinated marketing efforts in their sub-sector, and resultant poorer export outcomes. A further consequence of a lack of coordination and information sharing was that producers simply produced whatever they thought was best and then relied on marketers to sell their products. A better approach would be find out what the market wants and then supply that to the greatest possible extent. But fractured sub-sectors do not allow for that.
Seeds of a hybrid
More than one industry source proposed that a model somewhere between the current kiwifruit and apple models could work well, with a half dozen or fewer marketers in
each product category, each with responsibilities for specific geographic regions or varieties.
At very least, a coordinated approach to bringing product to market across the selling window was viewed as necessary, to create price stability and underpin rational grower and marketer behaviour. Any such coordination must be conducted within the legal boundaries set by the WTO and the New Zealand Horticulture Export Authority Act.
Some would argue that this kind of model is already in place in some sub-sectors, such as avocados, where the number of exporters is quite limited (although the product is highly homogenous). A structured approach to keeping other exporters apprised of each exporter’s intentions is in place so as to ensure coordinated delivery of product to market.
The hybrid model could be successful across other product types if it could stimulate innovation by providing opportunity to pursue new varieties. It would need to allow revenues from individual markets to be maximised as specific, in-depth expertise in each major market developed. It would further need to provide growers choice as to which varieties to grow, based on their opinions of which marketers were doing the best job at selling different varieties internationally.
A small number of marketers (probably a handful per product category) would allow for the scale needed for marketing purposes. This would ensure that marketers could gain an in-depth understanding of their particular (perhaps geographic) market and provide growers with timely insights as to what was most likely to sell well over the next few seasons.
Horticulture is experiencing significant consolidation and corporatisation which offer benefits, including the scale to ensure financial viability through better technology, and reducing risk across the business via diversification.

INDUSTRY INSIGHTS | July 2016 | 10
– Low- and high-tech innovations have led to huge gains in yield in many horticultural products.
– More opportunities exist and will be required, especially in locations where pressures on land to be used for other purposes like housing exist.
– To justify a particular land use, or make do with less land, yields will need to continue to rise.
As a whole, the horticulture sector has seen phenomenal increases in productivity as measured by yield per hectare in recent years, with further opportunities to boost productivity. Examples include a 50% increase in yields per hectare in kiwifruit in under 10 years, and a 66% increase in apple yields in a similar period. Carrot yields are up 40% in a few years, while wheat, grass and white clover have seen gains of 100% to 150% over 30 years across many farms.
These gains are far faster than the productivity gains seen per worker across the New Zealand economy, which typically averages around 1% a year. Discussions with industry sources highlighted numerous reasons for the improvements, ranging from low-tech to very sophisticated solutions. Productivity gains are being seen at all points in the supply and value chains.
In the lab
New varieties of horticultural products that are disease-resistant and that boost yields have been developed. For instance, the gold kiwifruit variety Zespri developed is estimated to have a yield around 50% higher than the traditional green kiwifruit.
Discussions with industry sources suggested that the secret to developing successful new varieties requires a combination of six factors, one of which is yield. Farmers are looking to grow products that will see them boost productivity per hectare.
What makes a successful horticultural product
Yield
Shelf life
Hardiness / disease
resistanceShelf life
Health propertiesTaste
On-farm
One relatively straight forward change has been in how trees are planted and pruned. For instance, some apple orchards now plant 3,000 trees per hectare as opposed to 600, pruning them differently to increase yields from 60 tonnes per hectare to 100. In the case of summerfruit such as cherries, trees are also pruned differently, such that they can be grown below permanent rows of canopies, minimising the impact of heavy rain on fruit quality. This boosts fruit quality and thus revenue per hectare. These recent changes are simply the result of thinking about new ways of doing something that has been done another way for decades.
In fact, several industry sources pointed out that many of the on-farm changes that boost productivity require very little (if any) ongoing costs. Unlike other sectors, like dairy, where boosting productivity often required far more inputs, such as food supplements, simply applying increased know-how to how trees were planted or pruned could make a difference in the orchard.
But there are many other changes occurring on-farm that are boosting productivity that make use of higher tech solutions. These include:
– software apps and real-time monitoring of ripeness, quality, blemishes, and fertiliser needs
– tractors with GPS systems
– the analysis of big data and weather patterns so the grower responds to information in the best way to optimise production
– automated irrigators.
Sorting and packingOnce fruit or vegetables have been harvested, there are a number of other technologies that are already increasing efficiencies, while other opportunities are ripe for the picking. The move toward more automated sorting and packing is already underway. Many more businesses are looking to take advantage of the current low interest rates to increase automation in their businesses.
New packaging technologies that control the pace at which produce ripens are also increasingly being developed and deployed.
Transport and storageNew Zealand’s geographic isolation make getting produce to market either an expensive (air freight) or lengthy (surface freight) process. Refrigerated containers are the typical way produce is transported abroad, but even refrigerated produce poses challenges that technology is increasingly overcoming.
One example is the Dynamic Controlled Atmosphere (DCA) technology that was trialled on avocados and could be applied across product types. The DCA system uses sensors within
Trend Two: Technology’s productivity boost

INDUSTRY INSIGHTS | July 2016 | 11
an air-tight refrigerated container to monitor conditions and adjusts the air composition within the container to remain within a specific range that will limit ripening of the produce.
At the same time as this type of technology presents opportunities for New Zealand, it poses risks. All of New Zealand’s main horticulture export destinations other than Australia are in the northern hemisphere. We sell to these countries in their own off-season. As refrigeration technology improves, making it more difficult to tell the difference between a four-month old
European apple and a four-week old New Zealand apple, the need to purchase from New Zealand to satisfy customer preferences in Europe may diminish.
This closing of the gap between fresh and refrigerated produce makes it imperative that New Zealand relies not just on the freshness of its produce serving the northern hemisphere. Instead, marketing must focus on the sustainability, provenance and safety of produce to ensure it continues to be seen as desirable in overseas produce markets.
Productivity in many parts of the horticulture sector is surging, with improvements across the value chain from orchard to laboratory.

INDUSTRY INSIGHTS | July 2016 | 12
– Land values in some parts of horticulture have doubled in the last few years as the sector booms.
– While no immediate risks loom over the industry suggesting a major correction in prices, questions are being raised as to whether land values are too high.
– Land vaules are being affected by the economic value of alternative uses of the land, such as what is happening in dairy or housing provision.
– Higher land values are also affecting entry to the sector.
The recent success of many parts of the horticulture sector has seen land values rise sharply. Returns of between 7% and 12% on land are not uncommon, so unsurprisingly, that has led to land values rising as investors who are satisfied with lower returns than the current highs being experienced bid up prices. In addition, record-low interest rates are making it possible to offer more for land and still service debt, at least in the short term.
Horticulture land values($/ha), rolling 12-month average
0
50
100
150
200
250
2011 2012 2013 2014 2015 20160
50
100
150
200
250$000
Source: Westpac, REINZ
$000
This increase in land values poses a number of challenges, discussed below.
Risk associated with rising debt
Investors buying land for horticultural purposes who buy on the expectation that exports will continue to grow as strongly as they are now, or that shocks to the sector are unlikely, may find themselves in financial difficulty should things change.
Dairy is an example of this, where many conversions over the last five years appear to have been made on the assumption that payouts would remain above $6 per kilogram of milk solids. In some parts of horticulture, land values have doubled recently as new entrants look to cash in on the sector’s growth. The possibility that some of these decisions have been made on unrealistic expectations of future growth and returns cannot be ruled out.
Cost of entry challenges
With land values often well over $200,000 per hectare, and licensing rights to grow particular varieties also growing (e.g. almost $200,000 per hectare to grow gold kiwifruit), the sector is getting more difficult to enter. This means that the number of potential operators entering the market is limited. This makes expansion of the sector all the more difficult, especially in sub-sectors where smaller growers are the norm.
In future, an increasing share of expansion is likely to be from corporate growers who can afford what it takes to enter or increase land under production in the sector.
Other impacts of land value changes
Horticulture land values do not change in a vacuum. They are a function of the current success of the sector, but are also linked to the alternative uses of the land. Two examples include:
– Switch away from dairy use: As dairy payouts have fallen, more marginal dairying land is being considered for conversion to horticultural uses.
– Switch to housing use: As demand for housing in Auckland rises, rural areas close to the city are coming under pressure for land use change. An example is Pukekohe, where land owners may be paid much more to sell their land to developers rather than to another farmer on retirement. While use for housing may achieve the highest value for the land (suggesting it is the use that has the greatest economic value), this does reduce New Zealand’s ability to grow horticultural exports, or perhaps even to sustain self-sufficiency of some of the vegetable crops grown there. Industry sources agree that the country is a long way from ceasing to be self-sufficient in onions, carrots and potatoes, for instance, but they are worried about the irrevocable loss of some of the most productive horticultural land in the country.
Trend Three: Sharply rising land values

INDUSTRY INSIGHTS | July 2016 | 13
– Labour shortages across the skills spectrum pose risks to the ongoing success of the sector, including the passing on of know-how and developing the productivity gains that will ensure New Zealand remains competitive in horticulture production.
– A changing regulatory environment is increasing costs. We expect the sector to be increasingly challenged by tighter environmental regulations.
– In addition to the gains from corporatisation, more productive use of land, and particularly strong overseas demand, the recent success of horticulture holds huge opportunities for iwi.
Risk: Availability of labour
Several industry sources highlighted the value of the current Recognised Seasonal Employer (RSE) scheme, which allowed them to bring in short-term overseas-based workers to help with the seasonal components of work, typically harvesting.
In recent years, some in the sector have become concerned that the RSE programme may be scrapped. Many cited the difficulty of finding New Zealand-based workers and therefore the risks to their production if the RSE were to be scrapped.
But labour risks were far from limited to seasonal workers. The sector’s workforce is ageing, and many older farmers do not have clear succession plans. This is a challenge seen in many parts of New Zealand’s agricultural sector, but poses real challenges to the passing down of know-how. This creates risks to maintaining and increasing production. The recent success of horticulture may spur more interest from younger people, but the high costs
to entry suggest that in many cases the easiest way to ensure production continues would be through passing the farm on to children. This is often not occurring.
Finally, some industry sources raised concerns about an all-round shortage of skilled, educated workers to support productivity growth in the sector, including scientists (soil, plant pathologists, breeders, entomologists, agronomists), teachers, and robotics experts.
Risk: Regulatory environment
There appears to be increasing regulation on water use and access. This is increasing the cost of doing business for many growers. Local government is at the forefront of changing how water can be used, whether there are any charges associated with it for the land owner, and how much those charges should be. Some industry sources believed that irrigation is becoming increasingly expensive as a proportion of the total cost of production.
Several industry sources were concerned that regulations on the use of agri-chemicals may be tightened. The horticulture sector has been relatively immune from the scrutiny the dairy sector is enduring around environmental impacts. It is possible that attention may soon turn to the horticulture sector.
Opportunity: Iwi – land, skills and value
Several industry sources raised the prospect of greater iwi involvement in horticulture. Many iwi already have land holdings, and given the importance of the Maori relationship with the land, and the opportunities the horticulture sector affords, this seemed a logical way to increase returns on land holdings for Maori. Examples of opportunities cited included Manuka honey and fruit growing.
Other risks and opportunities

INDUSTRY INSIGHTS | July 2016 | 14
– Kiwifruit exports have recovered strongly after the psa virus outbreak, reaching nearly $1.6 billion in the year to May 2016.
– Exports are spread across a number of countries, meaning the industry is quite well buffered against downturns in any one market.
– Continued growth is expected, but high returns are pushing up land values, creating risks that investors may overpay.
Kiwifruit has long been the most important part of New Zealand’s horticulture exports story. Exports grew by 150% between May 2000 and August 2009 before the psa virus took its toll on the industry. By November 2013, exports bottomed out at just $800 million, down from $1.08 million. But with the rise of psa-resistant strains and a surge in production and sale of gold kiwifruit, export values have boomed.
At nearly $1.6 billion in the year to May 2016, kiwifruit exports have all but doubled since the trough of 2013, a remarkable achievement in less than three years.
In terms of trading partners, the big story in recent years has been the growth in exports to China. An increase of 280% in the value of exports to that country has seen them draw level with Japan as our largest kiwifruit export destination. China has accounted for 45% of all growth in export values over the last four years. Taiwan has also seen strong growth, reaching nearly $150 million in exports in the latest year, from $71 million in 2012.
With a top eight export market concentration of 0.33, kiwifruit is nevertheless one of the least concentrated of the 15 product categories examined in this study. While the role of China in the growth picture has been dominant in recent years, the industry currently enjoys a relatively wide spread of markets, which provides a buffer against downturns in any one of them.
Productivity gains in recent years have been remarkable in kiwifruit growing. The switch to gold kiwifruit, where yields can be 50% higher, has played a major role. As a result, returns range between 7% for green kiwifruit and 12% for gold kiwifruit in some cases. However, another impact of these strong results has been a large rise in land values of orchards, and the high prices paid for licences to grow gold kiwifruit, most recently nearing $200,000 per hectare.
The rise in land value does constitute a gain to orchard owners on paper, but also makes it more difficult to enter the market, especially if the aim is to grow gold kiwifruit. At current licensing fees and land values, converting from green to gold kiwifruit is becoming a marginal proposition for many growers.
Opportunities, risks and outlook
A number of trends, risks and opportunities are emerging in the kiwifruit industry. Most of these are the result of the industry’s success:
– Continued growth is expected: There is no immediate reason to expect growth in kiwifruit exports to stumble. We will likely see a continued emphasis on marketing gold kiwifruit, possibly to the detriment of green kiwifruit.
– Risk of increased competition: Whenever returns like gold kiwifruit in particular is able to achieve at present arise, incentive to compete increases. Within the New Zealand context, the ability to compete outside of the single-desk system limits the rise of domestic competitors (and some would argue, stifles innovation). However, international competitors will be working hard to develop varieties with the same advantages that the New Zealand gold kiwifruit variety offers.
– Risk of over-valued land: With returns as high as they are in kiwifruit, there is a risk that investors will over-pay for land with an expectation that the current, possibly unsustainable returns, will continue. If a downturn occurs, as it has in dairy, land values could fall leaving those who have paid too much at risk.
Kiwifruit
Kiwifruit export values (NZD), annual rolling average
200
400
600
800
1000
1200
1400
1600
2000 2004 2008 2012 2016200
400
600
800
1,000
1,200
1,400
1,600$mn
Source: Westpac, Statistics New Zealand
$mn
Kiwifruit exports, May years (NZ$mn)
$303
$337 $333 $148 $103
$308
$458
2012
2016
0 400 800 1,200 1,600Japan China TaiwanSpain South Korea United StatesAustralia Italy Other countries
Source: Westpac, Statistics New Zealand

INDUSTRY INSIGHTS | July 2016 | 15
– Risk of export concentration: There was sufficient growth across a number of kiwifruit markets in the last four years for no real change to occur in export concentration across the top eight markets. But if growth in Chinese demand continues, concentration risk may accelerate. That said, even if exports to China doubled while exports to other countries remained flat, the overall export concentration would only rise to 0.41, which would remain one of the lowest concentrations in the horticulture sector.
The success of kiwifruit, and the gold variety in particular, has likely sown the seeds of increased competition from overseas competitors.
INDUSTRY INSIGHTS | July 2016 | 16
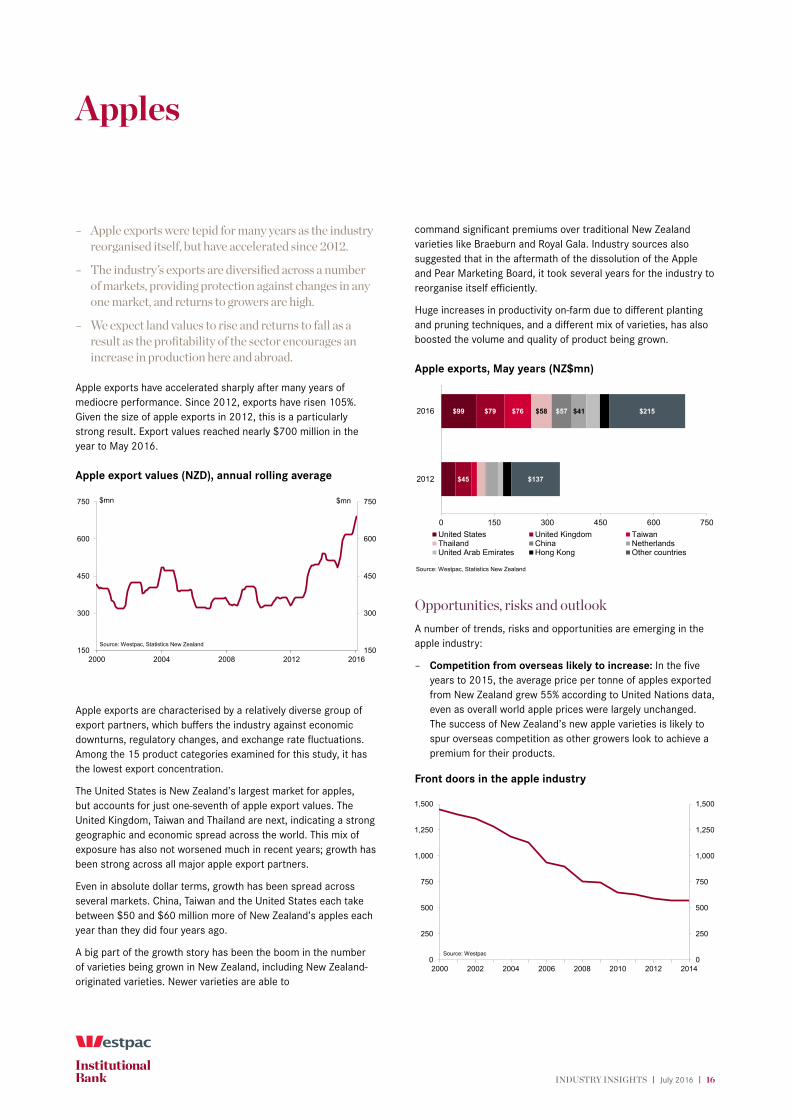
– Apple exports were tepid for many years as the industry reorganised itself, but have accelerated since 2012.
– The industry’s exports are diversified across a number of markets, providing protection against changes in any one market, and returns to growers are high.
– We expect land values to rise and returns to fall as a result as the profitability of the sector encourages an increase in production here and abroad.
Apple exports have accelerated sharply after many years of mediocre performance. Since 2012, exports have risen 105%. Given the size of apple exports in 2012, this is a particularly strong result. Export values reached nearly $700 million in the year to May 2016.
Apple export values (NZD), annual rolling average
150
300
450
600
750
2000 2004 2008 2012 2016150
300
450
600
750$mn
Source: Westpac, Statistics New Zealand
$mn
Apple exports are characterised by a relatively diverse group of export partners, which buffers the industry against economic downturns, regulatory changes, and exchange rate fluctuations. Among the 15 product categories examined for this study, it has the lowest export concentration.
The United States is New Zealand’s largest market for apples, but accounts for just one-seventh of apple export values. The United Kingdom, Taiwan and Thailand are next, indicating a strong geographic and economic spread across the world. This mix of exposure has also not worsened much in recent years; growth has been strong across all major apple export partners.
Even in absolute dollar terms, growth has been spread across several markets. China, Taiwan and the United States each take between $50 and $60 million more of New Zealand’s apples each year than they did four years ago.
A big part of the growth story has been the boom in the number of varieties being grown in New Zealand, including New Zealand-originated varieties. Newer varieties are able to
command significant premiums over traditional New Zealand varieties like Braeburn and Royal Gala. Industry sources also suggested that in the aftermath of the dissolution of the Apple and Pear Marketing Board, it took several years for the industry to reorganise itself efficiently.
Huge increases in productivity on-farm due to different planting and pruning techniques, and a different mix of varieties, has also boosted the volume and quality of product being grown.
Apple exports, May years (NZ$mn)
$99
$45
$79 $76 $58 $57 $41
$137
$215
2012
2016
0 150 300 450 600 750United States United Kingdom TaiwanThailand China NetherlandsUnited Arab Emirates Hong Kong Other countries
Source: Westpac, Statistics New Zealand
Opportunities, risks and outlook
A number of trends, risks and opportunities are emerging in the apple industry:
– Competition from overseas likely to increase: In the five years to 2015, the average price per tonne of apples exported from New Zealand grew 55% according to United Nations data, even as overall world apple prices were largely unchanged. The success of New Zealand’s new apple varieties is likely to spur overseas competition as other growers look to achieve a premium for their products.
Front doors in the apple industry
0
250
500
750
1,000
1,250
1,500
0
250
500
750
1,000
1,250
1,500
2000 2002 2004 2006 2008 2010 2012 2014
Source: Westpac
Apples

INDUSTRY INSIGHTS | July 2016 | 17
– Technology will continue to boost productivity: We expect ongoing replanting to improve productivity through choice of varieties and planting methods.
– Risks to growth more limited than in many cases: The broad-based growth in exports means the risks of export concentration impacting the industry negatively are minimised. A strong NZD is the biggest risk.
– Land values will continue to rise and competition will increase: Orchard values will continue to rise given the attractive returns being achieved. The strong returns will also encourage an increase in production in New Zealand and abroad.
– Corporatisation is likely to continue: We expect to see further consolidation of ownership of orchards in the industry, such that both front doors and enterprises fall, albeit at a slower rate than in the period of industry reorganisation between 2000 and 2010.
We expect further productivity gains in apple production, more corporatisation, and more competition in overseas markets.

INDUSTRY INSIGHTS | July 2016 | 18
– Honey exports have increased 3,000% in 16 years.
– Growth has been across a number of markets, led by Australia and China.
– The industry needs to rapidly determine a standardised definition of what Manuka honey is and to put in place provenance measures to minimise the risk of massive loss of brand value through the sale of imitation or sub-standard products.
Exports of honey have grown more strongly than those of any other product category in this study in recent years.³ Annual export growth has averaged 24% over the 16 years to May 2016. Growth rates have accelerated in recent years.
Honey export values (NZD), annual rolling average
0
50
100
150
200
250
300
350
2000 2004 2008 2012 20160
50
100
150
200
250
300
350$mn
Source: Westpac, Statistics New Zealand
$mn
New Zealand has exported some honey products overseas for many years, but it is the rise of Manuka honey over the last decade or so, with its purported health properties, that has seen exports rocket up.
Some in the industry tended to see this growth as solely a China story, but the numbers suggest something different. China has certainly seen the largest growth in percentage terms among major export nations over the last four years – a surge of 1,100%. But this was off a small base of just $4.2 million in exports of honey per year. Australia’s growth in absolute terms has matched China’s; exports to both are up $46 million in four years. Strong growth has also been seen in exports to Hong Kong (up $26 million although possibly much of this is destined for mainland China), the United States (up $22 million), and Japan ($19 million).
Other industries that rely on Manuka honey as inputs for nutraceutical products are arguably more exposed than those exporting honey in a relatively unprocessed state as included in this study. The neutraceutical market appears to be more focused on China than the raw honey exports market.
Honey exports, May years (NZ$mn)
$59 $50
$35
$41 $39 $29 $29
$22
$30
2012
2016
0 80 160 240 320
Australia China United KingdomHong Kong United States JapanSingapore Germany Other countries
Source: Westpac, Statistics New Zealand
Industry sources suggested that as demand for Manuka honey has grown, and awareness of its potential profitability has risen, increasingly large proportions of value have shifted up the chain toward land-owners, from the marketers and exporters.
Shifting value
Exporter-marketerLand owner Beekeeper
Flow of value over time
In the early days of the Manuka honey export growth story, most of the value accrued to the exporter-marketer. Over time, the shortage of bees that once plagued the industry (due to varroa mites) led to strong growth in beehive costs as beekeepers were able to capture more of the value. In the last few years, land owners have been able to capture a greater share of the value, with some receiving a base land lease cost as well as a share of the crop up to 30%.
Returns to landowners typically exceed 10%, a very good return in the current business environment.
Opportunities, risks and outlook
A number of trends, risks and opportunities are emerging in the honey sector:
– Bee numbers are strong and unlikely to be a major constraint on growth: The Ministry for Primary Industries
Honey
³ Note that this report excludes highly-processed honey exports such as nutraceuticals. The focus is on honey harvested and processed to a “bottled” state.

INDUSTRY INSIGHTS | July 2016 | 19
reports that by 2015, bee numbers were at double pre-varroa levels, meaning a shortage of bees is unlikely to hinder growth.
– Standardisation of what Manuka honey is must be completed: There are at least two standards used by New Zealand exporters to classify honey as Manuka. For instance, the Unique Manuka Factor (UMF) certification is promoted as a quality and purity measure. But there is no nationwide, or government-approved measure of quality and standardisation, meaning just about anything can be labelled as Manuka honey. There is strong support for a national standard among all honey sector participants we spoke to.
– Risks of “brand” damage are strong until provenance is improved: Directly linked to the need for standardisation is the risk associated with not doing so. Cases have already emerged in China of products being sold as New Zealand Manuka honey that have been diluted or may not be Manuka
at all. This makes it essential that the honey industry is able to show where its products come from, and what quality standards they meet, to head off any potential damage to the New Zealand Manuka honey “brand”.
– Continue to grow diverse markets: Individual exporters appear to have widely different exposure to certain markets. Some are highly exposed to China while others have a broader base. This latter approach is essential to ensure the sector can withstand a downturn in any one market.
– Risk of competition will grow: Manuka is now being grown in Australia. Whenever returns are as high relative to typical market returns as they are in the honey industry today, competition will develop. The industry needs to determine how best to position and market New Zealand’s honey relative to potential competitors beginning to develop the same type of honey.
The potential for further growth in honey exports is huge, but a lack of standardisation of product creates risks of brand damage.

INDUSTRY INSIGHTS | July 2016 | 20
– Avocados, blueberries and cherries have all seen strong growth in export values in recent years.
– However, avocado exports vary sharply from year-to-year due to their highly irregular fruit bearing qualities. Both avocados and blueberries are strongly dependent on one export destination.
– Substantial opportunities for further growth exist if avocados and blueberries can expand beyond Australia, and if cherries can expand beyond the continent of Asia.
The highly irregular fruit bearing qualities (whereby trees bear far more fruit every second year) for avocados mitigate against a consistent performance from that industry, and make it difficult to manage cash flow and borrowings. Recent cycles in export values have been particularly inconsistent. For instance, exports in the year to August 2012 reached $98 million, before falling to $33 million in the year to August 2013. Exports rebounded to $99 million in the year to August 2014 before seeing further growth to a peak of $119 million. In the May 2016 year, exports were down to $83 million. Season-by-season challenges notwithstanding, the trajectory in avocados is clearly up.
Selected fruit export values (NZD), annual total
0
30
60
90
120
2000 2004 2008 2012 20160
30
60
90
120
AvocadoesCherriesBlueberries
$mn
Source: Westpac
$mn
Growth in cherry exports is even more stellar, quadrupling in four years to $68 million by the year to May 2016. Growth in blueberry exports has been steadier, from just $7 million in 2004 to more than $36 million in 2016.
However, when we consider where most of these products go, it is evident that avocados in particular exposed to just one market – Australia. As much as 86% of exports of New Zealand avocados in the year to May 2016 went to Australia.
Cherry exports (mostly from Otago) are going to a larger number of significant markets. However, the top seven destinations are all in Asia, meaning a top eight export destinations concentration of 0.45 compared to 0.86 for avocados.
Avocado exports, May years (NZ$mn)
$84
$71
2012
2016
0 20 40 60 80 100
Australia Thailand SingaporeSouth Korea Japan MalaysiaTaiwan India Other countries
Source: Westpac, Statistics New Zealand
Cherry exports, May years (NZ$mn)
$8
$22 $18 $7 $6 $7
2012
2016
0 15 30 45 60 75
Taiwan China ThailandSouth Korea Hong Kong SingaporeMalaysia United States Other countries
Source: Westpac, Statistics New Zealand
The avocado industry is dominated by two or three major exporters among a total of around 11 exporters. The small number of exporters is sufficiently limited to allow some degree of coordination to ensure growers don’t flood the market at certain times. However, growers are concerned at the fact that such a wide proportion of New Zealand’s avocados go to just one country. If South American producers such as Mexico, which produces more than 40% of the world’s avocados, gain access to the Australian market, it could be disastrous for New Zealand avocado growers.
Opportunities, risks and outlook
A number of trends, risks and opportunities are emerging in these other fruit categories:
– Berries present a big opportunity: Several industry sources identified berries as a massive growth opportunity. Exports are already up 430% in 16 years, but with berries increasingly seen as “super-foods”, demand is growing rapidly. Australia takes
Other fruit

INDUSTRY INSIGHTS | July 2016 | 21
93% of blueberry exports at the moment, but export growth to Asia (albeit off low bases) is particularly strong – 200% and more in Thailand, Taiwan, Hong Kong and Malaysia in just four years.
– Cherries to continue growing, but can the industry diversify: New planting approaches are helping increase yields and product quality in cherries. There is a lot more scope to grow exports, but risks arise because exports focus on one part of the world (albeit several countries there).
– Avocado export concentration is a major risk: Increased planting in Australia, and a preference by the retail market there to buy Australian-made first may see a smaller volume of New Zealand avocado exports to that nation. Similarly, if biosecurity concerns over fruit-flies are dealt with and Australia opens up to other exporters, New Zealand producers will face much stiffer competition.
– Asia presents major opportunities for avocados: In contrast, New Zealand’s access and scale of exports to China and India, among other Asian nations, is minimal. Phytosanitary access to China is expected imminently – within the next six months – and could offer immense
opportunities for growth and diversification beyond the Australian market.
– Improved biosecurity may expose domestic market: If the New Zealand market opened up to overseas-grown avocados, prices here could well drop and profitability of the industry could fall. Overseas-grown avocados cannot currently be imported into New Zealand.
– Technology may conquer avocados’ season-to-season inconsistency: Some orchardists are managing to reduce the variability between seasons of avocado production. Industry sources are confident that these seasonal variations will be managed better in years to come although it is unclear what technologies will enable this.
– Coordination and corporatisation in avocados will continue: More corporatisation is already evident, as well as coordination among exporters. However, particularly if greater season-to-season export volume certainty can be achieved, we would expect more larger-scale tie-ups. Securing finance is one challenge of the season-to-season uncertainty. Reducing variability in production would make it easier for grower-marketers to secure the finance to scale up.
Several other fruit products have seen strong growth in exports in recent years, but some are highly exposed to just one or two markets.

INDUSTRY INSIGHTS | July 2016 | 22
– Unlike most sub-sectors, vegetables and other crops have seen limited export growth in recent times.
– Simultaneously, falling yields on potatoes, and loss of demand for grain from the domestic dairy sector have posed challenges.
– Opportunities in vegetable seeds and new markets in Asia exist, but more consolidation and coordination will be required in the sector to take advantage of these.
In recent years, the value of our most important vegetable exports has been relatively stable. The exception is onions, where export values have fluctuated significantly over time, between $60 million and $120 million a year. Peas have not seen as much fluctuation in fortunes, and exports have broadly increased from $65 million to around $80 million over the last 16 years.
Key vegetable export values (NZD), annual rolling average
0
20
40
60
80
100
120
140
2000 2004 2008 2012 20160
20
40
60
80
100
120
140
Onions
Peas
Squash
$mn
Source: Westpac, Statistics New Zealand
$mn
Onions and peas enjoy some of the least concentrated export markets. Among the 15 product categories analysed, only apples have a more diverse mix of major export destinations than onions. Peas have the 5th least concentrated major export markets, and diversification has actually improved in recent years.
Onion exports, May years (NZ$mn)
$22
$5
$11
$10
$10 $10
$8
$9 $7
$19
$28
2012
2016
0 30 60 90 120
Indonesia Belgium NetherlandsGermany Japan MalaysiaTaiwan Fiji Other countries
Source: Westpac, Statistics New Zealand
The most important growth story in onions has been Indonesia, which has quintupled its imports of New Zealand onions in four years. And unlike many horticulture products, trade with Europe is relatively important. Belgium, the Netherlands and Germany took nearly a third of onion exports in the year to May 2016.
Pea exports, May years (NZ$mn)
$40
$34
$4
$10
$11
$8
$6
$6 $4
$19
$18
2012
2016
0 15 30 45 60 75 90
Australia China United StatesJapan Thailand PakistanIndia Taiwan Other countries
Source: Westpac, Statistics New Zealand
Pea exports are far more concentrated in the Australian market although there has recently been growth in exports to China. Other export markets have remained relatively unchanged in recent times. One area where significant growth has occurred, and where much more is possible, is in the emerging India and Pakistan markets. While these two markets account for only 5.2% of current pea exports, the value of exports to both of these countries have increased 160% in four years.
Opportunities, risks and outlook
A number of trends, risks and opportunities are emerging in the vegetable and crop growing sector:
– Potatoes will continue to be challenged: Yields on white-flesh potatoes, the traditional mainstay of New Zealand production, have been falling, making them an unattractive crop. Recently, some restaurant chains have switched to yellow-flesh potatoes in New Zealand, allowing farmers to switch to these higher yield varieties. However, this may also open the door to greater competition in the New Zealand domestic market from Europe, where a number of yellow-flesh producers are based.
– Grain is seeking a new home: Grain-growing has been hit hard by the downturn in the dairy sector, with demand from domestic purchasers falling sharply. Often used as a break-crop, grain plays an important part in many vegetable-growing businesses. As a result of diary’s weakness, growers are having to look for export markets although often the prices achieved are much lower – by up to 30%.
Vegetables and other crops

INDUSTRY INSIGHTS | July 2016 | 23
– Opportunity for vegetable seeds is growing: New Zealand produces between 30% and 50% of the world’s hybrid carrot, beet and radish seeds. This could offer opportunities for further employment growth.
– New markets are emerging: Vegetable growing is one horticultural sub-sector where the role of China and other east Asian economies as export destinations is quite small. Partly this is because China has traditionally been a big grower of many vegetable products, but there are opportunities to expand exports into Asia significantly.
– Further corporatisation and coordination is needed: This was one sub-sector in which many growers believed they were missing out on opportunities through a lack of coordinated marketing and supply. Along with further growth in the average business size as smaller producers sell up, we expect more coordination if the sub-sector is going to return to stronger growth.
– Biosecurity worries may challenge pea industry: As we go to press, pea farming in the Wairarapa has been shut down for two years in an effort to eradicate the pea weevil, which could potentially devastate the industry if not successful. The Wairarapa produces about 10% of New Zealand’s peas.
Growth in vegetable exports in recent years has been weak, but there are opportunities to grow exports particularly in Asia.

INDUSTRY INSIGHTS | July 2016 | 24
Contact the Westpac economics team
Michael Gordon, Acting Chief Economist +64 9 336 5670
Satish Ranchhod, Senior Economist +64 9 336 5668
Anne Boniface, Senior Economist +64 9 336 5669
David Norman, Industry Economist +64 9 336 5656
Sarah Drought, Economist +64 9 352 0057
Any questions email: [email protected]
Disclaimer
Things you should know
Westpac Institutional Bank is a division of Westpac Banking Corporation ABN 33 007 457 141 (‘Westpac’). This information is correct at 1 July 2016.
Disclaimer
This material contains general commentary, research, and market colour. The material does not constitute investment advice. The material may contain investment recommendations, including information recommending an investment strategy. Reasonable steps have been taken to ensure that the material is presented in a clear, accurate and objective manner. Certain types of transactions, including those involving futures, options and high yield securities give rise to substantial risk and are not suitable for all investors. We recommend that you seek your own independent legal or financial advice before proceeding with any investment decision. This information has been prepared without taking account of your objectives, financial situation or needs. This material may contain material provided by third parties. While such material is published with the necessary permission none of Westpac or its related entities accepts any responsibility for the accuracy or completeness of any such material. Although we have made every effort to ensure the information is free from error, none of Westpac or its related entities warrants the accuracy, adequacy or completeness of the information, or otherwise endorses it in any way. Except where contrary to law, Westpac and its related entities intend by this notice to exclude liability for the information. The information is subject to change without notice and none of Westpac or its related entities is under any obligation to update the information or correct any inaccuracy which may become apparent at a later date. The information contained in this material does not constitute an offer, a solicitation of an offer, or an inducement to subscribe for, purchase or sell any financial instrument or to enter a legally binding contract. Past performance is not a reliable indicator of future performance. Whilst every effort has been taken to ensure that the assumptions on which the forecasts are based are reasonable, the forecasts may be affected by incorrect assumptions or by known or unknown risks and uncertainties. The ultimate outcomes may differ substantially from these forecasts.
Country disclosures
Australia: Westpac holds an Australian Financial Services Licence (No. 233714). This material is provided to you solely for your own use and in your capacity as a wholesale client of Westpac.
New Zealand: In New Zealand, Westpac Institutional Bank refers to the brand under which products and services are provided by either Westpac or Westpac New Zealand Limited (“WNZL”). Any product
or service made available by WNZL does not represent an offer from Westpac or any of its subsidiaries (other than WNZL). Neither Westpac nor its other subsidiaries guarantee or otherwise support the performance of WNZL in respect of any such product. The current disclosure statements for the New Zealand branch of Westpac and WNZL can be obtained at the internet address www.westpac.co.nz. For further information please refer to the Product Disclosure Statement (available from your Relationship Manager) for any product for which a Product Disclosure Statement is required, or applicable customer agreement. Download the Westpac NZ QFE Group Financial Advisers Act 2008 Disclosure Statement at www.westpac.co.nz.
China, Hong Kong, Singapore and India: This material has been prepared and issued for distribution in Singapore to institutional investors, accredited investors and expert investors (as defined in the applicable Singapore laws and regulations) only. Recipients in Singapore of this material should contact Westpac Singapore Branch in respect of any matters arising from, or in connection with, this material. Westpac Singapore Branch holds a wholesale banking licence and is subject to supervision by the Monetary Authority of Singapore. Westpac Hong Kong Branch holds a banking license and is subject to supervision by the Hong Kong Monetary Authority. Westpac Hong Kong branch also holds a license issued by the Hong Kong Securities and Futures Commission (SFC) for Type 1 and Type 4 regulated activities. This material is intended only to “professional investors” as defined in the Securities and Futures Ordinance and any rules made under that Ordinance. Westpac Shanghai and Beijing Branches hold banking licenses and are subject to supervision by the China Banking Regulatory Commission (CBRC). Westpac Mumbai Branch holds a banking license from Reserve Bank of India (RBI) and subject to regulation and supervision by the RBI.
UK: The contents of this communication, which have been prepared by and are the sole responsibility of Westpac Banking Corporation London and Westpac Europe Limited. Westpac (a) has its principal place of business in the United Kingdom at Camomile Court, 23 Camomile Street, London EC3A 7LL, and is registered at Cardiff in the UK (as Branch No. BR00106), and (b) authorised and regulated by the Australian Prudential Regulation Authority in Australia. Westpac is authorised in the United Kingdom by the Prudential Regulation Authority. Westpac is subject to regulation by the Financial Conduct Authority and limited regulation by the Prudential Regulation Authority. Details about the extent of our regulation by the Prudential Regulation Authority are available from us on request. Westpac Europe Limited is a company registered in England (number 05660023) and is authorised by the Prudential Regulation Authority and regulated by the Financial Conduct Authority and the Prudential Regulation Authority.

INDUSTRY INSIGHTS | July 2016 | 25
This communication is being made only to and is directed at (a) persons who have professional experience in matters relating to investments who fall within Article 19(5) of the Financial Services and Markets Act 2000 (Financial Promotion) Order 2005 (the “Order”) or (b) high net worth entities, and other persons to whom it may otherwise lawfully be communicated, falling within Article 49(2)(a) to (d) of the Order (all such persons together being referred to as “relevant persons”). Any person who is not a relevant person should not act or rely on this communication or any of its contents. The investments to which this communication relates are only available to and any invitation, offer or agreement to subscribe, purchase or otherwise acquire such investments will be engaged in only with, relevant persons. Any person who is not a relevant person should not act or rely upon this communication or any of its contents. In the same way, the information contained in this communication is intended for “eligible counterparties” and “professional clients” as defined by the rules of the Financial Conduct Authority and is not intended for “retail clients”. With this in mind, Westpac expressly prohibits you from passing on the information in this communication to any third party. In particular this communication and, in each case, any copies thereof may not be taken, transmitted or distributed, directly or indirectly into any restricted jurisdiction. This communication is made in compliance with the Market Abuse Regulation (Regulation (EU) 596/2014).
U.S.: Westpac operates in the United States of America as a federally licensed branch, regulated by the Office of the Comptroller of the Currency. Westpac is also registered with the US Commodity Futures Trading Commission (“CFTC”) as a Swap Dealer, but is neither registered as, or affiliated with, a Futures Commission Merchant registered with the US CFTC. Westpac Capital Markets, LLC (‘WCM’), a wholly-owned subsidiary of Westpac, is a broker-dealer registered under the U.S. Securities Exchange Act of 1934 (‘the Exchange Act’) and member of the Financial Industry Regulatory Authority (‘FINRA’). This communication is provided for distribution to U.S. institutional investors in reliance on the exemption from registration provided by Rule 15a-6 under the Exchange Act and is not subject to all of the independence and disclosure standards applicable to debt research reports prepared for retail investors in the United States. WCM is the U.S. distributor of this communication and accepts responsibility for the contents of this communication. All disclaimers set out with respect to Westpac apply equally to WCM. If you would like to speak to someone regarding any security mentioned herein, please contact WCM on +1 212 389 1269. All disclaimers set out with respect to Westpac apply equally to WCM.
Investing in any non-U.S. securities or related financial instruments mentioned in this communication may present certain risks. The securities of non-U.S. issuers may not be registered with, or be subject to the regulations of, the SEC in the United States. Information on such non-U.S. securities or related financial instruments may be limited. Non-U.S. companies may not subject to audit and reporting standards and regulatory requirements comparable to those in effect in the United States. The value of any investment or income from any securities or related derivative instruments denominated in a currency other than U.S. dollars is subject to exchange rate fluctuations that may have a positive or adverse effect on the value of or income from such securities or related derivative instruments.
The author of this communication is employed by Westpac and is not registered or qualified as a research analyst, representative, or associated person under the rules of FINRA, any other U.S. self-regulatory organisation, or the laws, rules or regulations of any State. Unless otherwise specifically stated, the views expressed herein are solely those of the author and may differ from the information, views or analysis expressed by Westpac and/or its affiliates.
Investment Recommendations Disclosure
Investment Recommendations for Financial Instruments covered by MAR are made in compliance with Article 20 MAR. Westpac does not apply MAR Investment Recommendation requirements to Spot Foreign Exchange which is out of scope for MAR.
Unless otherwise indicated, there are no planned updates to this Investment Recommendation at the time of publication. Westpac has no obligation to update, modify or amend this Investment Recommendation or to notify the recipients of this Investment Recommendation should any information, including opinion, forecast or estimate set out in this Investment Recommendation change or subsequently become inaccurate.
Westpac will from time to time dispose of and acquire financial instruments of companies covered in this Investment Recommendation as principal and act as a market maker or liquidity provider in such financial instruments.
Westpac does not have any proprietary positions in equity shares of issuers that are the subject of an investment recommendation.
Westpac may have provided investment banking services to the issuer in the course of the past 12 months.
Westpac does not permit any issuer to see or comment on any investment recommendation prior to its completion and distribution.
Individuals who produce investment recommendations are not permitted to undertake any transactions in any financial instruments or derivatives in relation to the issuers covered by the investment recommendations they produce.
Westpac has implemented policies and procedures, which are designed to ensure conflicts of interests are managed consistently and appropriately, and to treat clients fairly.
The following arrangements have been adopted for the avoidance and prevention of conflicts in interests associated with the provision of investment recommendations.
(i) Chinese Wall/Cell arrangements;
(ii) physical separation of various Business/Support Units;
(iii) Strict and well defined wall/cell crossing procedures;
(iv) a “need to know” policy;
(v) documented and well defined procedures for dealing with conflicts of interest;
(vi) reasonable steps by Compliance to ensure that the Chinese Wall/Cell arrangements remain effective and that such arrangements are adequately monitored.
Disclaimer continued