Embed Size (px)
Citation preview
ed-TH / sa- BC
Completing the AMPC Puzzle
• Double tracking and HSR toDouble tracking and HSR toDouble tracking and HSR toDouble tracking and HSR to largelylargelylargelylargely complete complete complete complete AMPCAMPCAMPCAMPC
• CroCroCroCrossssssss----bbbborder order order order oooopportunities pportunities pportunities pportunities will bewill bewill bewill be vitalvitalvitalvital
• Earnings delivery becoming more crucialEarnings delivery becoming more crucialEarnings delivery becoming more crucialEarnings delivery becoming more crucial
• Top picks Gamuda and SunTop picks Gamuda and SunTop picks Gamuda and SunTop picks Gamuda and Sunway way way way ConConConConstructionstructionstructionstruction
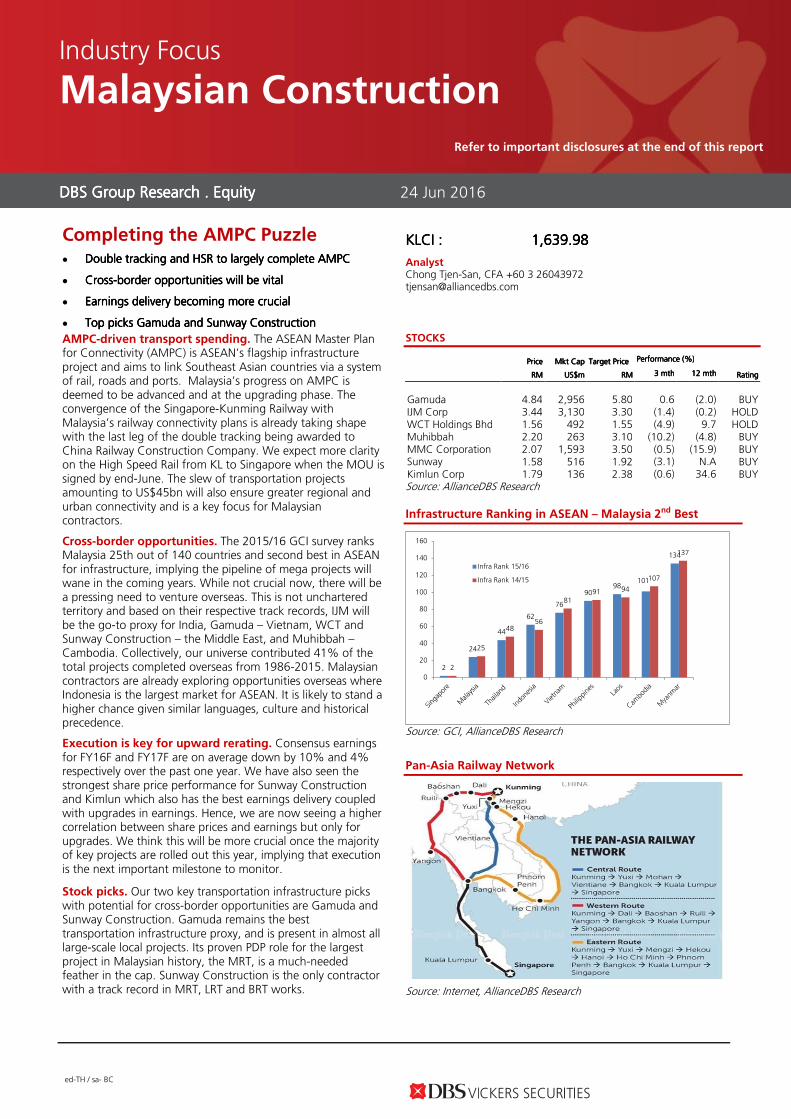
AMPC-driven transport spending. The ASEAN Master Plan for Connectivity (AMPC) is ASEAN’s flagship infrastructure project and aims to link Southeast Asian countries via a system of rail, roads and ports. Malaysia’s progress on AMPC is deemed to be advanced and at the upgrading phase. The convergence of the Singapore-Kunming Railway with Malaysia’s railway connectivity plans is already taking shape with the last leg of the double tracking being awarded to China Railway Construction Company. We expect more clarity on the High Speed Rail from KL to Singapore when the MOU is signed by end-June. The slew of transportation projects amounting to US$45bn will also ensure greater regional and urban connectivity and is a key focus for Malaysian contractors.
Cross-border opportunities. The 2015/16 GCI survey ranks Malaysia 25th out of 140 countries and second best in ASEAN for infrastructure, implying the pipeline of mega projects will wane in the coming years. While not crucial now, there will be a pressing need to venture overseas. This is not unchartered territory and based on their respective track records, IJM will be the go-to proxy for India, Gamuda – Vietnam, WCT and Sunway Construction – the Middle East, and Muhibbah – Cambodia. Collectively, our universe contributed 41% of the total projects completed overseas from 1986-2015. Malaysian contractors are already exploring opportunities overseas where Indonesia is the largest market for ASEAN. It is likely to stand a higher chance given similar languages, culture and historical precedence.
Execution is key for upward rerating. Consensus earnings for FY16F and FY17F are on average down by 10% and 4% respectively over the past one year. We have also seen the strongest share price performance for Sunway Construction and Kimlun which also has the best earnings delivery coupled with upgrades in earnings. Hence, we are now seeing a higher correlation between share prices and earnings but only for upgrades. We think this will be more crucial once the majority of key projects are rolled out this year, implying that execution is the next important milestone to monitor.
Stock picks. Our two key transportation infrastructure picks with potential for cross-border opportunities are Gamuda and Sunway Construction. Gamuda remains the best transportation infrastructure proxy, and is present in almost all large-scale local projects. Its proven PDP role for the largest project in Malaysian history, the MRT, is a much-needed feather in the cap. Sunway Construction is the only contractor with a track record in MRT, LRT and BRT works.
KLCIKLCIKLCIKLCI :::: 1,639.981,639.981,639.981,639.98
Analyst Chong Tjen-San, CFA +60 3 26043972 [email protected]
STOCKS
Source: AllianceDBS Research
Infrastructure Ranking in ASEAN – Malaysia 2nd Best
2
24
44
62
76
9098
101
134
2
25
4856
8191 94
107
137
0
20
40
60
80
100
120
140
160
Infra Rank 15/16
Infra Rank 14/15
Source: GCI, AllianceDBS Research
Pan-Asia Railway Network
Source: Internet, AllianceDBS Research
DBS Group Research . Equity DBS Group Research . Equity DBS Group Research . Equity DBS Group Research . Equity
24 Jun 2016
Industry Focus
Malaysian Construction
Refer to important disclosures at the end of this report
Price Price Price Price Mkt CapMkt CapMkt CapMkt Cap Target PriceTarget PriceTarget PriceTarget Price Performance (%)Performance (%)Performance (%)Performance (%)
RMRMRMRM US$mUS$mUS$mUS$m RMRMRMRM 3 mth3 mth3 mth3 mth 12 mth12 mth12 mth12 mth RatingRatingRatingRating
Gamuda 4.84 2,956 5.80 0.6 (2.0) BUY IJM Corp 3.44 3,130 3.30 (1.4) (0.2) HOLD WCT Holdings Bhd 1.56 492 1.55 (4.9) 9.7 HOLD Muhibbah Engineering
2.20 263 3.10 (10.2) (4.8) BUY MMC Corporation 2.07 1,593 3.50 (0.5) (15.9) BUY Sunway Construction Group
1.58 516 1.92 (3.1) N.A BUY Kimlun Corp 1.79 136 2.38 (0.6) 34.6 BUY
Industry Focus
Malaysian Construction
Page 2
CHONG Tjen-San, CFA (603)-26043972
Table of Contents
ASEAN Master Plan for Connectivity and Malaysia’s Infrastructure Plans 3
Other Transport-based Infrastructure Projects: 7
Global Competitiveness Index – Standings and Opportunities? 11
Cross Border Opportunities 13
Earnings momentum and Consensus Change 19
Valuation and Sector Comparison 21
Malaysia – Public Sector to drive growth 23
Company Guides 25
Gamuda 26
Sunway Construction Group 32
Muhibbah Engineering 38
Kimlun Corp 44
Industry Focus
Malaysian Construction
Page 3
ASEAN MASTER PLAN FOR CONNECTIVITY AND MALAYSIA’S INFRASTRUCTURE PLANS
AMPC AMPC AMPC AMPC –––– Regional Connectivity and Emphasis on TransportRegional Connectivity and Emphasis on TransportRegional Connectivity and Emphasis on TransportRegional Connectivity and Emphasis on Transport----
based infrastructurebased infrastructurebased infrastructurebased infrastructure
The ASEAN Masterplan for Connectivity (AMPC) was launched
in 2010 and is ASEAN's flagship infrastructure project aimed at
enhancing land connectivity and integration among ASEAN
member countries. This is crucial as infrastructure development
forms the backbone of the economy of ASEAN countries and is
vital in the region’s economic, social and connectivity
development.
Besides improving the level of public transport ridership locally,
the interconnectivity within ASEAN member states is also
important through national, sub-regional and regional
infrastructure development. This will eventually improve logistic
efficiency, support growth of investment, trade and tourism
and could lower the cost of doing business.
Similar to the One Belt, One Road (OBOR) project, the AMPC
which is more mature aims to link Southeast Asian countries
via a system of rail, roads and even ports for RoRo (roll-on and
roll-off). OBOR's goals are also to boost infrastructure
connectivity and economic growth, albeit, a much larger scale.
Launched in Beijing in 2013, the initiative will start at Fujian,
China and transcend 65 countries over three continents,
through the overland route known as the Silk Road Economic
Belt, while the sea route is billed the Maritime Silk Road.
Of significance from an infrastructure standpoint, the focus for
AMPC has been the Pan-Asia Rail Network and Asian Highway
Network. It remains to be seen how compatible AMPC and
OBOR are, which shares some similarities on wanting to
enhance transport connectivity.
China has recently been involved in Indonesia’s Jakarta-to-
Bandung High Speed Rail (HSR) and Malaysia’s Gemas-JB
double tracking and Bandar Malaysia. Meanwhile, it is also
aggressively pursuing the KL-Singapore HSR, which is a positive
sign and indicates the momentum for China-ASEAN initiatives
to ensure AMPC comes to fruition.
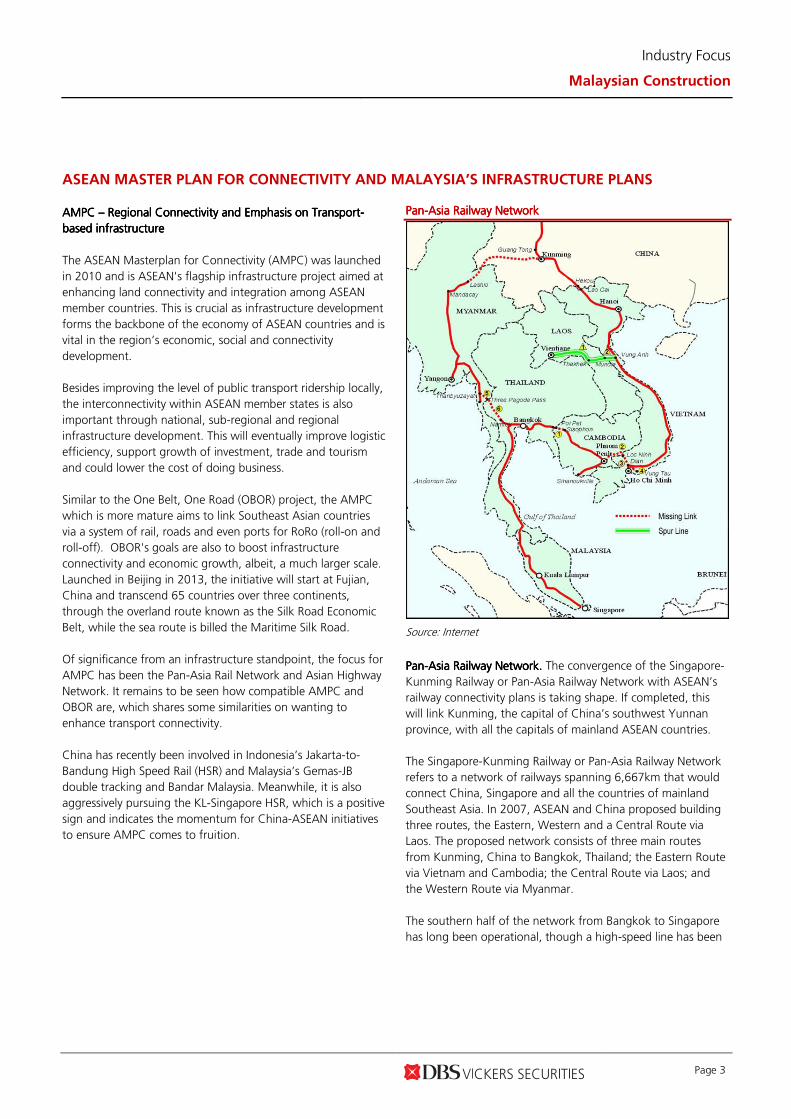
PanPanPanPan----Asia Railway NetworkAsia Railway NetworkAsia Railway NetworkAsia Railway Network
Source: Internet
PanPanPanPan----Asia Railway Network.Asia Railway Network.Asia Railway Network.Asia Railway Network. The convergence of the Singapore-
Kunming Railway or Pan-Asia Railway Network with ASEAN’s
railway connectivity plans is taking shape. If completed, this
will link Kunming, the capital of China’s southwest Yunnan
province, with all the capitals of mainland ASEAN countries.
The Singapore-Kunming Railway or Pan-Asia Railway Network
refers to a network of railways spanning 6,667km that would
connect China, Singapore and all the countries of mainland
Southeast Asia. In 2007, ASEAN and China proposed building
three routes, the Eastern, Western and a Central Route via
Laos. The proposed network consists of three main routes
from Kunming, China to Bangkok, Thailand; the Eastern Route
via Vietnam and Cambodia; the Central Route via Laos; and
the Western Route via Myanmar.
The southern half of the network from Bangkok to Singapore
has long been operational, though a high-speed line has been
Industry Focus
Malaysian Construction
Page 4
proposed. The missing links are mainly in Cambodia,
Myanmar, Thailand and Vietnam.
Malaysia and the missing links for AMPCMalaysia and the missing links for AMPCMalaysia and the missing links for AMPCMalaysia and the missing links for AMPC. . . . Based on the Global
Competitiveness Index (a topic which we will focus on later),
Malaysia is the second most advanced country in ASEAN for
infrastructure. In terms of Malaysia’s status on its infrastructure
linkages for AMPC, it is deemed to be at the stage for more
upgrade works.
The electrified double tracking works is part of this ambitious
Pan-Asia Railway Network. So far, all sections have been
completed apart from the Gemas-Johor Bahru section which
was awarded to a consortium led by China Railways
Corporation for RM7bn.
There are parties from China, Japan, South Korea and many
others who are keen to bid for the KL-Singapore HSR project.
Of significance is the China Railway Group Limited (CREC)
which is partnering Iskandar Waterfront. Together with its
partner, it has bought a 60% stake in Bandar Malaysia which
will be a key station. For Malaysia, it has given its commitment
towards China’s Pan-Asia Railway and its One Belt One Road
Project.
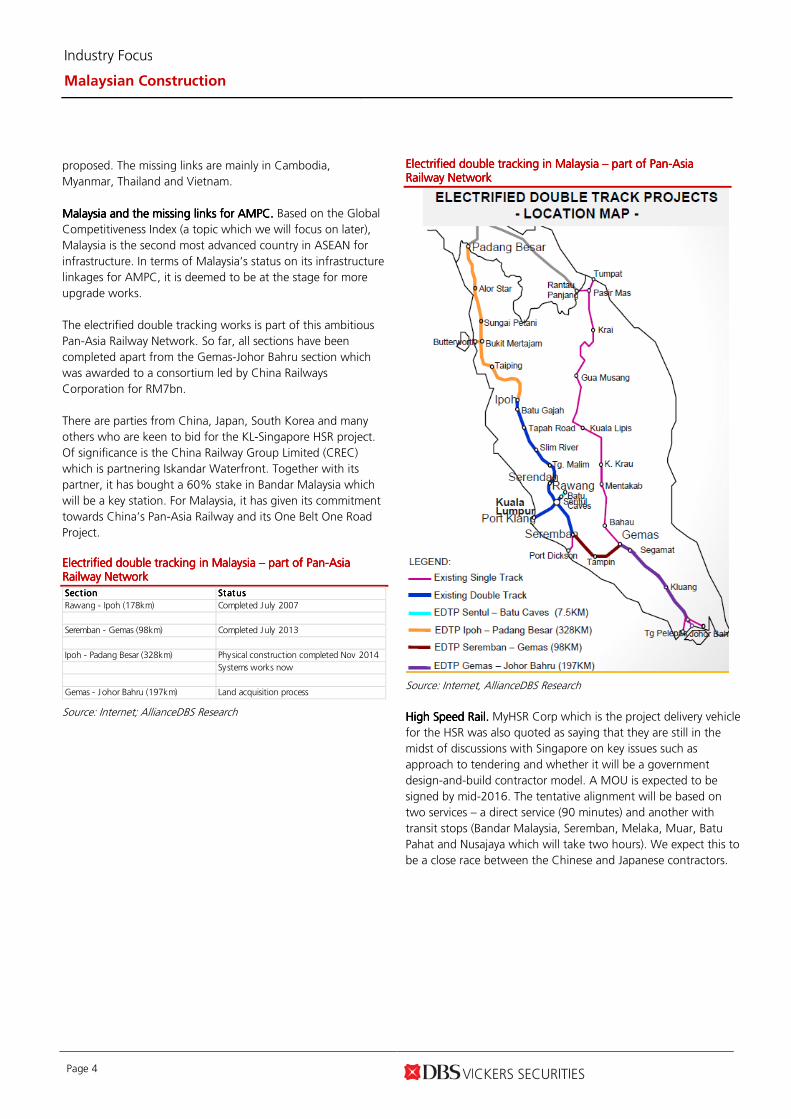
Electrified double tracking in Malaysia Electrified double tracking in Malaysia Electrified double tracking in Malaysia Electrified double tracking in Malaysia –––– part of Panpart of Panpart of Panpart of Pan----Asia Asia Asia Asia Railway NetworkRailway NetworkRailway NetworkRailway Network
Sect ionSect ionSect ionSect ion StatusStatusStatusStatus
Rawang - Ipoh (178km) Completed July 2007
Seremban - Gemas (98km) Completed July 2013
Ipoh - Padang Besar (328km) Physical construction completed Nov 2014
Systems works now
Gemas - Johor Bahru (197km) Land acquisition process
Source: Internet; AllianceDBS Research
Electrified double tracking in Malaysia Electrified double tracking in Malaysia Electrified double tracking in Malaysia Electrified double tracking in Malaysia –––– part of Panpart of Panpart of Panpart of Pan----Asia Asia Asia Asia Railway NetworkRailway NetworkRailway NetworkRailway Network
Source: Internet, AllianceDBS Research
High Speed Rail. High Speed Rail. High Speed Rail. High Speed Rail. MyHSR Corp which is the project delivery vehicle
for the HSR was also quoted as saying that they are still in the
midst of discussions with Singapore on key issues such as
approach to tendering and whether it will be a government
design-and-build contractor model. A MOU is expected to be
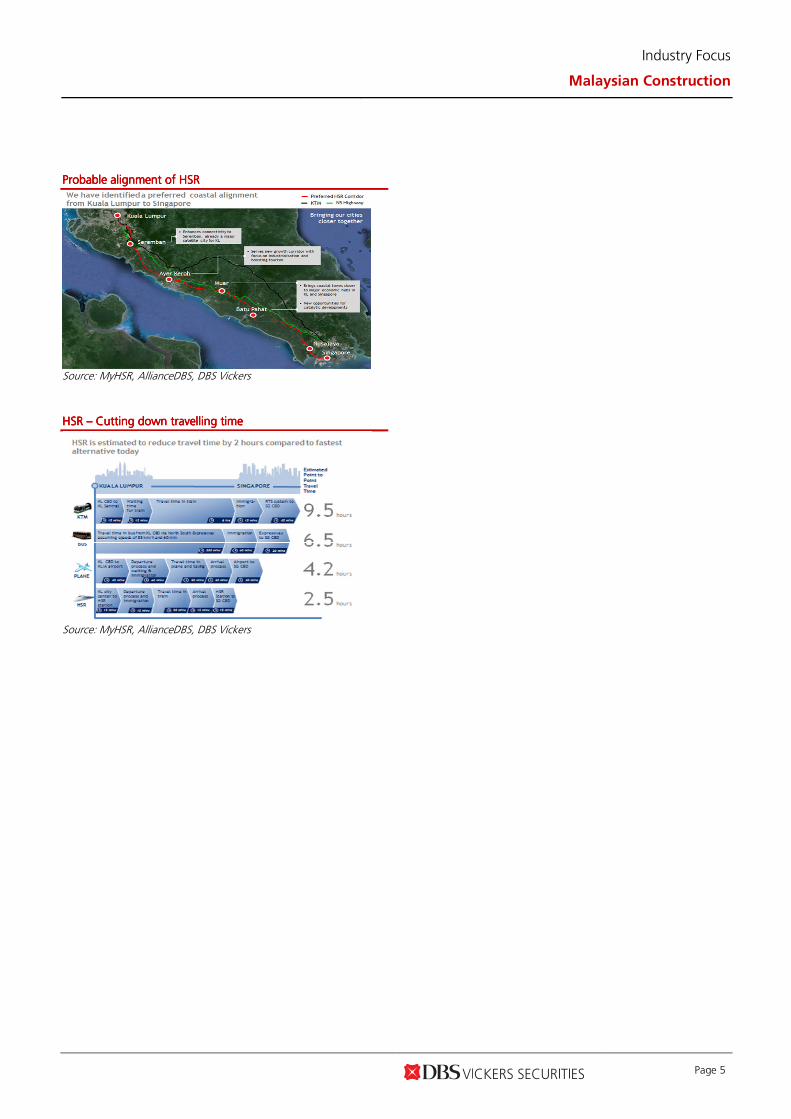
signed by mid-2016. The tentative alignment will be based on
two services – a direct service (90 minutes) and another with
transit stops (Bandar Malaysia, Seremban, Melaka, Muar, Batu
Pahat and Nusajaya which will take two hours). We expect this to
be a close race between the Chinese and Japanese contractors.
Industry Focus
Malaysian Construction
Page 5
ProbableProbableProbableProbable alignment of HSRalignment of HSRalignment of HSRalignment of HSR
Source: MyHSR, AllianceDBS, DBS Vickers
HSR HSR HSR HSR –––– Cutting down travelling timeCutting down travelling timeCutting down travelling timeCutting down travelling time
Source: MyHSR, AllianceDBS, DBS Vickers
Industry Focus
Malaysian Construction
Page 6
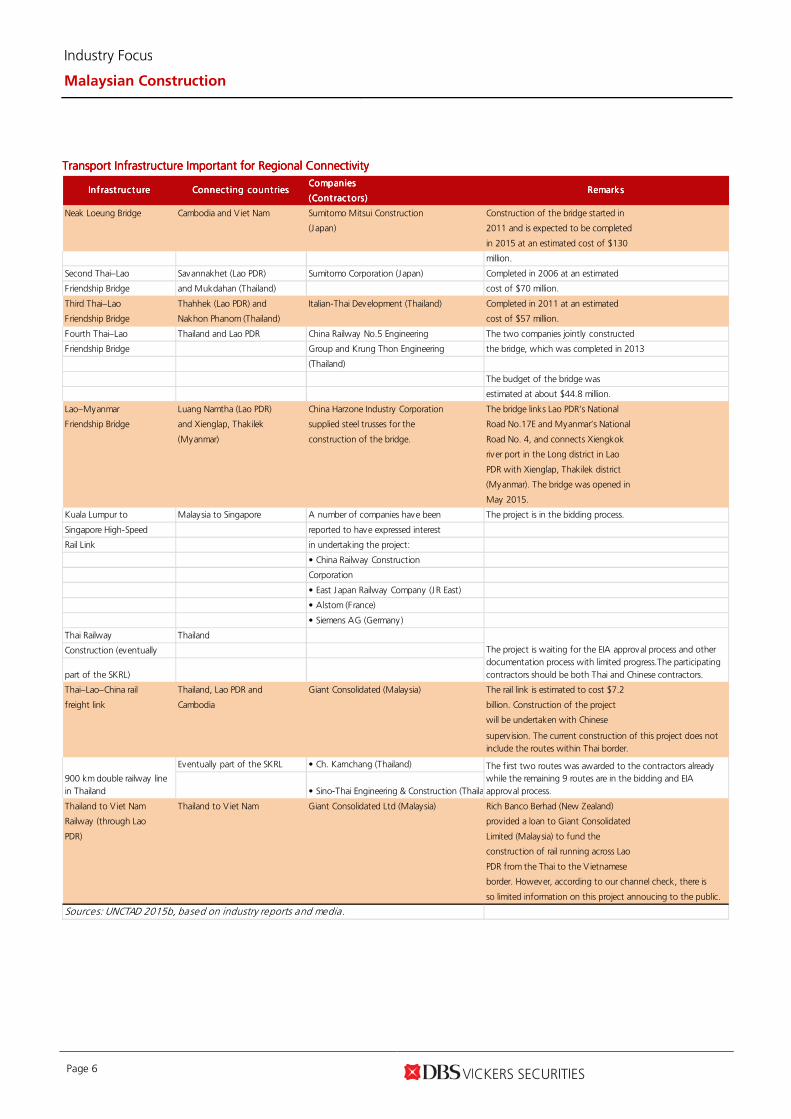
Transport Infrastructure Important for Regional ConnectivityTransport Infrastructure Important for Regional ConnectivityTransport Infrastructure Important for Regional ConnectivityTransport Infrastructure Important for Regional Connectivity CompaniesCompaniesCompaniesCompanies
(Cont ractors)(Cont ractors)(Cont ractors)(Cont ractors)
Neak Loeung Bridge Cambodia and V iet Nam Sumitomo Mitsui Construction Construction of the bridge started in
(Japan) 2011 and is expected to be completed
in 2015 at an estimated cost of $130
million.
Second Thai–Lao Savannakhet (Lao PDR) Sumitomo Corporation (Japan) Completed in 2006 at an estimated
Friendship Bridge and Mukdahan (Thailand) cost of $70 million.
Third Thai–Lao Thahhek (Lao PDR) and Italian-Thai Development (Thailand) Completed in 2011 at an estimated
Friendship Bridge Nakhon Phanom (Thailand) cost of $57 million.
Fourth Thai–Lao Thailand and Lao PDR China Railway No.5 Engineering The two companies jointly constructed
Friendship Bridge Group and Krung Thon Engineering the bridge, which was completed in 2013
(Thailand)
The budget of the bridge was
estimated at about $44.8 million.
Lao–Myanmar Luang Namtha (Lao PDR) China Harzone Industry Corporation The bridge links Lao PDR’s National
Friendship Bridge and Xienglap, Thakilek supplied steel trusses for the Road No.17E and Myanmar’s National
(Myanmar) construction of the bridge. Road No. 4, and connects Xiengkok
river port in the Long district in Lao
PDR with Xienglap, Thakilek district
(Myanmar). The bridge was opened in
May 2015.
Kuala Lumpur to Malaysia to Singapore A number of companies have been The project is in the bidding process.
Singapore High-Speed reported to have expressed interest
Rail Link in undertaking the project:
• China Railway Construction
Corporation
• East Japan Railway Company (JR East)
• Alstom (France)
• Siemens AG (Germany)
Thai Railway Thailand
Construction (eventually
part of the SKRL)
Thai–Lao–China rail Thailand, Lao PDR and Giant Consolidated (Malaysia) The rail link is estimated to cost $7.2
freight link Cambodia billion. Construction of the project
will be undertaken with Chinese
supervision. The current construction of this project does not
include the routes within Thai border.
Eventually part of the SKRL • Ch. Karnchang (Thailand)
• Sino-Thai Engineering & Construction (Thailand)
Thailand to V iet Nam Thailand to V iet Nam Giant Consolidated Ltd (Malaysia) Rich Banco Berhad (New Zealand)
Railway (through Lao provided a loan to Giant Consolidated
PDR) Limited (Malaysia) to fund the
construction of rail running across Lao
PDR from the Thai to the V ietnamese
border. However, according to our channel check, there is
so limited information on this project annoucing to the public.
Sources: UNCTAD 2015b, based on industry reports and media.
The first two routes was awarded to the contractors already
while the remaining 9 routes are in the bidding and EIA
approval process.
900 km double railway line
in Thailand
Inf rast ructureInf rast ructureInf rast ructureInf rast ructure Connect ing count riesConnect ing count riesConnect ing count riesConnect ing count ries Remark sRemark sRemark sRemark s
The project is waiting for the EIA approval process and other
documentation process with limited progress.The participating
contractors should be both Thai and Chinese contractors.
Industry Focus
Malaysian Construction
Page 7
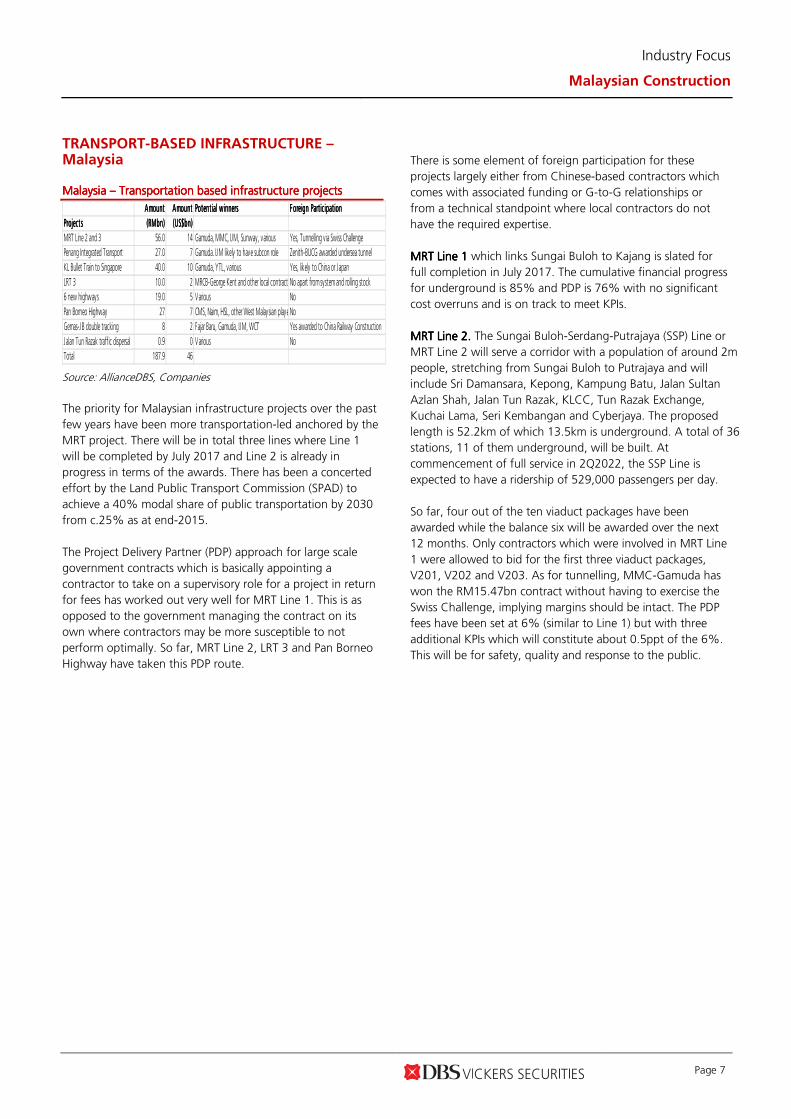
TRANSPORT-BASED INFRASTRUCTURE – Malaysia Malaysia Malaysia Malaysia Malaysia –––– Transportation based infrastructure projectsTransportation based infrastructure projectsTransportation based infrastructure projectsTransportation based infrastructure projects
AmountAmountAmountAmount AmountAmountAmountAmount Potent ial w innersPotent ial w innersPotent ial w innersPotent ial w inners F oreign Part ic ipat ionF oreign Part ic ipat ionF oreign Part ic ipat ionF oreign Part ic ipat ion
Project sProject sProject sProject s (RMbn) (RMbn) (RMbn) (RMbn) (US$bn)(US$bn)(US$bn)(US$bn)
MRT Line 2 and 3 56.0 14 Gamuda, MMC, IJM, Sunway, various Yes, Tunnelling via Swiss Challenge
Penang Integrated Transport 27.0 7 Gamuda. IJM likely to have subcon role Zenith-BUCG awarded undersea tunnel
KL Bullet Train to Singapore 40.0 10 Gamuda, YTL, various Yes, likely to China or Japan
LRT 3 10.0 2 MRCB-George Kent and other local contractorsNo apart from system and rolling stock
6 new highways 19.0 5 Various No
Pan Borneo Highway 27 7 CMS, Naim, HSL, other West Malaysian playersNo
Gemas-JB double tracking 8 2 Fajar Baru, Gamuda, IJM, WCT Yes awarded to China Railway Construction
Jalan Tun Razak traffic dispersal 0.9 0 Various No
Total 187.9 46
Source: AllianceDBS, Companies
The priority for Malaysian infrastructure projects over the past
few years have been more transportation-led anchored by the
MRT project. There will be in total three lines where Line 1
will be completed by July 2017 and Line 2 is already in
progress in terms of the awards. There has been a concerted
effort by the Land Public Transport Commission (SPAD) to
achieve a 40% modal share of public transportation by 2030
from c.25% as at end-2015.
The Project Delivery Partner (PDP) approach for large scale
government contracts which is basically appointing a
contractor to take on a supervisory role for a project in return
for fees has worked out very well for MRT Line 1. This is as
opposed to the government managing the contract on its
own where contractors may be more susceptible to not
perform optimally. So far, MRT Line 2, LRT 3 and Pan Borneo
Highway have taken this PDP route.
There is some element of foreign participation for these
projects largely either from Chinese-based contractors which
comes with associated funding or G-to-G relationships or
from a technical standpoint where local contractors do not
have the required expertise.
MRT Line 1MRT Line 1MRT Line 1MRT Line 1 which links Sungai Buloh to Kajang is slated for
full completion in July 2017. The cumulative financial progress
for underground is 85% and PDP is 76% with no significant
cost overruns and is on track to meet KPIs.
MRT Line 2MRT Line 2MRT Line 2MRT Line 2.... The Sungai Buloh-Serdang-Putrajaya (SSP) Line or
MRT Line 2 will serve a corridor with a population of around 2m
people, stretching from Sungai Buloh to Putrajaya and will
include Sri Damansara, Kepong, Kampung Batu, Jalan Sultan
Azlan Shah, Jalan Tun Razak, KLCC, Tun Razak Exchange,
Kuchai Lama, Seri Kembangan and Cyberjaya. The proposed
length is 52.2km of which 13.5km is underground. A total of 36
stations, 11 of them underground, will be built. At
commencement of full service in 2Q2022, the SSP Line is
expected to have a ridership of 529,000 passengers per day.
So far, four out of the ten viaduct packages have been
awarded while the balance six will be awarded over the next
12 months. Only contractors which were involved in MRT Line
1 were allowed to bid for the first three viaduct packages,
V201, V202 and V203. As for tunnelling, MMC-Gamuda has
won the RM15.47bn contract without having to exercise the
Swiss Challenge, implying margins should be intact. The PDP
fees have been set at 6% (similar to Line 1) but with three
additional KPIs which will constitute about 0.5ppt of the 6%.
This will be for safety, quality and response to the public.
Industry Focus
Malaysian Construction
Page 8
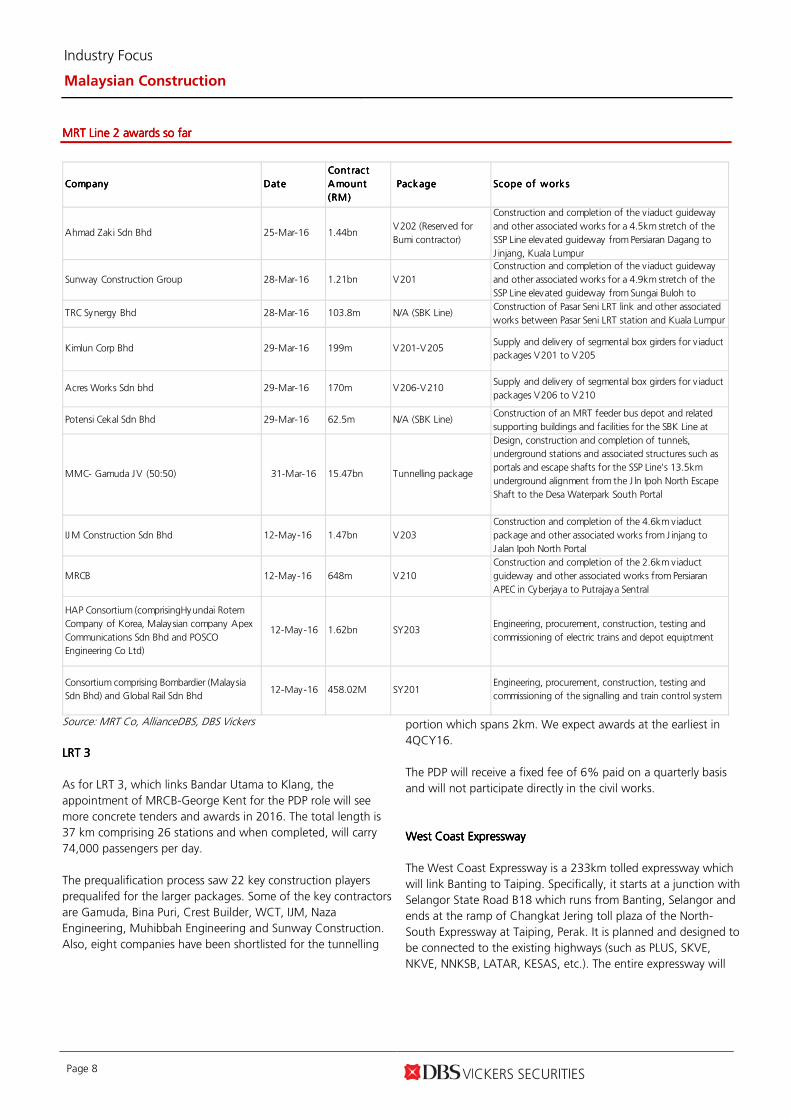
MRT Line 2 awards so farMRT Line 2 awards so farMRT Line 2 awards so farMRT Line 2 awards so far
CompanyCompanyCompanyCompany DateDateDateDate
Cont ract Cont ract Cont ract Cont ract
Amount Amount Amount Amount
(RM)(RM)(RM)(RM)
Package Package Package Package Scope of worksScope of worksScope of worksScope of works
Ahmad Zaki Sdn Bhd 25-Mar-16 1.44bnV202 (Reserved for
Bumi contractor)
Construction and completion of the v iaduct guideway
and other associated works for a 4.5km stretch of the
SSP Line elevated guideway from Persiaran Dagang to
J injang, Kuala Lumpur
Sunway Construction Group 28-Mar-16 1.21bn V201
Construction and completion of the v iaduct guideway
and other associated works for a 4.9km stretch of the
SSP Line elevated guideway from Sungai Buloh to
TRC Synergy Bhd 28-Mar-16 103.8m N/A (SBK Line)Construction of Pasar Seni LRT link and other associated
works between Pasar Seni LRT station and Kuala Lumpur
Kimlun Corp Bhd 29-Mar-16 199m V201-V205Supply and delivery of segmental box girders for viaduct
packages V201 to V205
Acres Works Sdn bhd 29-Mar-16 170m V206-V210Supply and delivery of segmental box girders for viaduct
packages V206 to V210
Potensi Cekal Sdn Bhd 29-Mar-16 62.5m N/A (SBK Line)Construction of an MRT feeder bus depot and related
supporting buildings and facilities for the SBK Line at
IJM Construction Sdn Bhd 12-May-16 1.47bn V203
Construction and completion of the 4.6km v iaduct
package and other associated works from J injang to
J alan Ipoh North Portal
MRCB 12-May-16 648m V210
Construction and completion of the 2.6km v iaduct
guideway and other associated works from Persiaran
APEC in Cyberjaya to Putrajaya Sentral
Engineering, procurement, construction, testing and
commissioning of electric trains and depot equiptment
Engineering, procurement, construction, testing and
commissioning of the signalling and train control system
Consortium comprising Bombardier (Malaysia
Sdn Bhd) and Global Rail Sdn Bhd12-May-16 458.02M SY201
HAP Consortium (comprisingHyundai Rotem
Company of Korea, Malaysian company Apex
Communications Sdn Bhd and POSCO
Engineering Co Ltd)
SY20312-May-16 1.62bn
Design, construction and completion of tunnels,
underground stations and associated structures such as
portals and escape shafts for the SSP Line's 13.5km
underground alignment from the J ln Ipoh North Escape
Shaft to the Desa Waterpark South Portal
Tunnelling package31-Mar-16 15.47bnMMC- Gamuda JV (50:50)
Source: MRT Co, AllianceDBS, DBS Vickers
LRT 3LRT 3LRT 3LRT 3
As for LRT 3, which links Bandar Utama to Klang, the
appointment of MRCB-George Kent for the PDP role will see
more concrete tenders and awards in 2016. The total length is
37 km comprising 26 stations and when completed, will carry
74,000 passengers per day.
The prequalification process saw 22 key construction players
prequalifed for the larger packages. Some of the key contractors
are Gamuda, Bina Puri, Crest Builder, WCT, IJM, Naza
Engineering, Muhibbah Engineering and Sunway Construction.
Also, eight companies have been shortlisted for the tunnelling
portion which spans 2km. We expect awards at the earliest in
4QCY16.
The PDP will receive a fixed fee of 6% paid on a quarterly basis
and will not participate directly in the civil works.
West Coast ExpresswayWest Coast ExpresswayWest Coast ExpresswayWest Coast Expressway
The West Coast Expressway is a 233km tolled expressway which
will link Banting to Taiping. Specifically, it starts at a junction with
Selangor State Road B18 which runs from Banting, Selangor and
ends at the ramp of Changkat Jering toll plaza of the North-
South Expressway at Taiping, Perak. It is planned and designed to
be connected to the existing highways (such as PLUS, SKVE,
NKVE, NNKSB, LATAR, KESAS, etc.). The entire expressway will
Industry Focus
Malaysian Construction
Page 9
have 21 interchanges. According to its website, progress has
reached 19.8% as at April 2016. IJM is the main contractor for
this project and has been awarded RM2.8bn worth of works out
of the RM5bn contract amount.
WCT was awarded a RM282m contract from IJM for
subcontracting works for Section 3,4,5,8 & 9 for WCE. This
forms part of IJM’s RM2.8bn contract for the WCE. The scope of
works consists of site clearance and earthworks, geotechnical
works, drainage works and box culverts, sub-base, road base and
pavement, traffic signs, road markings and road furniture,
utilities and services, erosion control sediment plan,
environmental protection and enhancement.
We understand tenders from the RM2.2bn open tender portion
for packages 1, 2, 6, 7, 10 and 11 will be called in 2016.
High Speed RailHigh Speed RailHigh Speed RailHigh Speed Rail
Malaysia's and Singapore's land transport regulators (SPAD and
LTA) said they received 98 submissions in response to the
request-for-information exercise for the High Speed Rail (HSR)
project. They include companies from Malaysia, Singapore, the
Asia-Pacific, Europe, the Middle East and North America. Of the
98 submissions, there were 13 from Malaysia and four from
Singapore.
At the recent China High Speed Railway symposium in KL, 14
companies were shortlisted to present their views on the project.
Apparently, the companies are France’s Alstom SA, Germany’s
Siemens AG, Spain's CAF and Talgo SA, Canada’s Bombardier,
China Railway and consortiums from South Korea and Japan.
SPAD is also exploring the use of Transport Oriented
Development (TOD), which is a mixed-use residential and
commercial area aimed at maximising access to public transport
along the HSR line.
SPAD and LTA’s CEOs were also quoted as saying that the
governments of Malaysia and Singapore expect to finalise the
commercial model and procurement approach of the project by
2016. A MOU is expected to be signed by mid-2016.
According to a local daily as reported in early January 2016,
both the Malaysian and Singaporean governments have
agreed on the alignment and have decided on two services – a
direct service (90 minutes) and another with transit stops
(Bandar Malaysia, Seremban, Melaka, Muar, Batu Pahat and
Nusajaya, which will take two hours).
Prime Minister Najib has also confirmed China’s interest in the
HSR following the signing of the eight G-to-G MOU. The sale of
1MDB’s power assets to China General Nuclear Power Corp for
RM9.83bn and China Railway Engineering Corp.'s involvement in
Bandar Malaysia could be a precursor to more Chinese
involvement in Malaysia’s mega infrastructure projects like the
HSR.
We expect local contractors which have some of expertise in rail-
related works gathered from the LRT and MRT to have a role. In
particular, we think Gamuda and YTL would be frontrunners to
lead the local contractors.
Penang Transport Master PlanPenang Transport Master PlanPenang Transport Master PlanPenang Transport Master Plan
Gamuda, via SRS Consortium, has been appointed by the Penang
State Government to be PDP for the Roads and Public Transport
Projects in Penang (Penang Transport Master Plan Strategy 2013-
2030). The shareholding structure is as follows: Gamuda (60%),
Ideal Property Development (20%), and Loh Poh Yen Holdings
(20%).
Gamuda is hoping to have two bites of the cherry – being PDP,
and also turnkey contractor for some key components, but that is
still uncertain at this stage.
The components are an LRT from Komtar to Bayan Lepas, a
monorail from Komtar to Air Itam and Tanjung Bungah, e-buses
across North Channel, bus rapid transits on the mainland and a
20-km Pan Island Link Highway connecting Tanjung Bungah to
Penang International Airport and Tun Dr Lim Chong Eu
Expressway (LCE) with tunnels cutting through the hills.
The first components are supposed to be the LRT (which is 20km
in length) and the Pan Island Link Highway, given their high
economic IRR of 12.2% and 14% respectively. The media also
highlighted the plan to reclaim two islands in the south of
Penang Island, which will be fully owned by the Penang
government. The land will then be auctioned to finance the
project. The estimated cost for reclaiming two islands of 1,300
acres and 2,100 acres respectively is RM7-8bn. This works out to
be RM47-54psf as compared to E&O’s reclamation cost at Seri
Tanjung Pinang of RM90-140psf. The previously speculated land
to be reclaimed in Middle Bank is not likely to happen given the
strong protests from environmentalists and civic groups.
The PDP where Gamuda has a 60% stake is in the midst of
extending the signing of the PDP agreement which has since
lapsed. Presentations have been made to the Federal
government, with the feedback being positive so far. There are
two key milestones to achieve which are:
Industry Focus
Malaysian Construction
Page 10
1) SPAD submission by June/July for the whole public
transportation system
2) Department of Environment submission likely by 4QCY16.
GemasGemasGemasGemas----totototo----Johor Bahru double trackingJohor Bahru double trackingJohor Bahru double trackingJohor Bahru double tracking.
This 197-km stretch represents the last link for the whole
double tracking project in Malaysia. The contract, worth an
estimated RM7bn, was awarded to an entity headed by China
Railway Construction Company. However, local contractors are
eyeing a subcontractor role.
Pan Borneo HighwayPan Borneo HighwayPan Borneo HighwayPan Borneo Highway
In 2013, the Prime Minister stated his commitment towards the
Pan Borneo Highway which was also included in Budget 2016
where a total allocation of RM29bn was made for the total
stretch of 2,239km. The Sarawak portion costing c.RM16bn
has been progressing with the appointment of the PDP role to
Lebuhraya Borneo Utara for the 1,090-km stretch. The
Sarawak portion will be rolled out in two phases and be fully
completed by 2023. So far, the timing of the Sabah portion
costing RM12.8bn remains elusive but the PDP has been
appointed, comprising Warisan Tarang (60%) and a JV
between UEM and MMC holding 20% equity stake each. This
will run from Sindumin to Tawau where the total length is
706km.
The total length of the Sarawak portion is 1,089 km stretching
from Tanjung Datu to Merapok. The scope of the project is
mostly on the upgrading of the current road system from the
present 2-lane single carriageway to a 4-lane dual carriageway
(JKR R5 standard design). At present, only 144km of federal
route 1 is a 4-lane dual carriageway. But there will also be
construction of some additional 30km of roadworks.
So far, two work packages have been awarded in 2015 and
there are now eight remaining work packages to be awarded
this year. The tenders for this eight closed at the end of May
and will be awarded from June to July onwards. On average,
each work package will be for 60-90km and will be at least
RM1bn in value. The initial portions will be from Jalan Nyabau
to Bakun junctions (43km) and Telok Melano to Sematan
(33km). Phase 1 is from Sematan to Miri (746km) and Phase 2
from Kuala Baram (Jalan Perlis) to Sg Tujuh, Limbang, Lawas
area (96km).
This project will involve participation from West Malaysian
contractors where they are allowed to take a maximum of
30% equity stake in a JV company where there must be a
Sarawak partner which will take the balance 70%. Our
conversations with the listed players (Gamuda, IJM, WCT,
Sunway Construction, Binapuri) have revealed their keen
interest. Cahya Mata Sarawak is the most obvious direct proxy
as besides having a main contractor role, it also supplies
premix, RMC, and aggregates for roadworks. We believe the
West Malaysian contractors have a crucial role to play given
their vast experience in the construction of toll roads .
Industry Focus
Malaysian Construction
Page 11
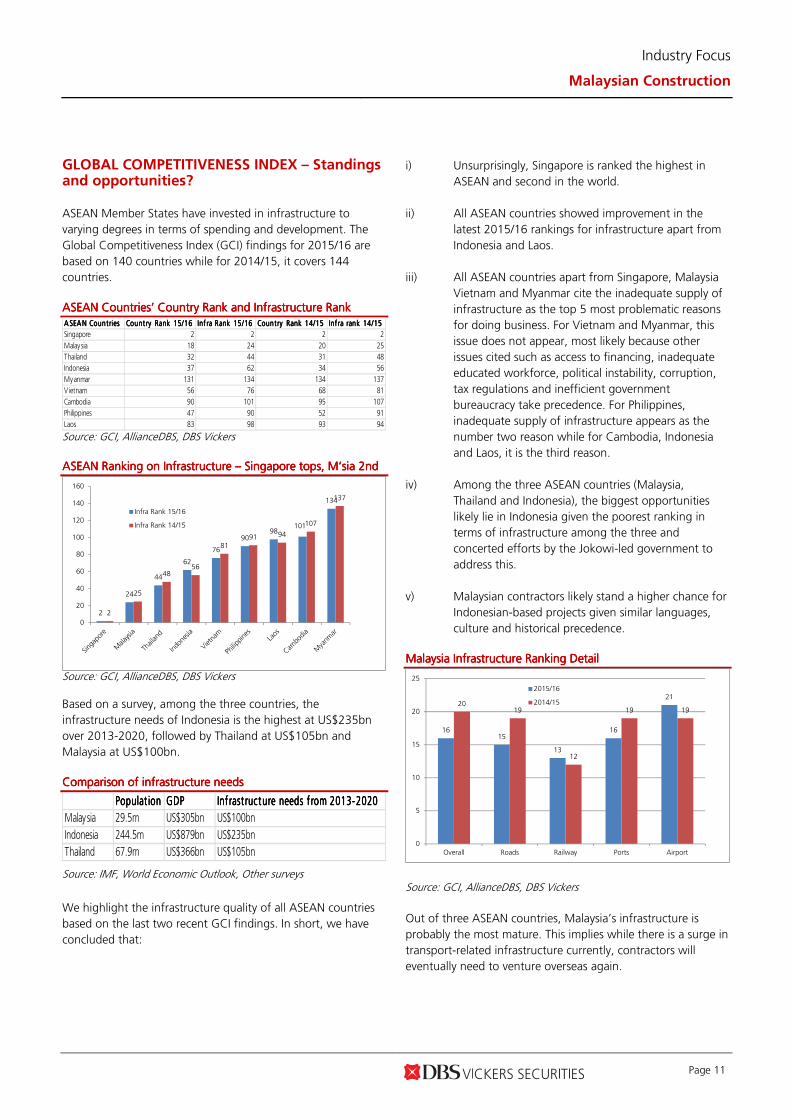
GLOBAL COMPETITIVENESS INDEX – Standings and opportunities?
ASEAN Member States have invested in infrastructure to
varying degrees in terms of spending and development. The
Global Competitiveness Index (GCI) findings for 2015/16 are
based on 140 countries while for 2014/15, it covers 144
countries.
ASEAN CountriesASEAN CountriesASEAN CountriesASEAN Countries’’’’ Country Rank and Infrastructure RankCountry Rank and Infrastructure RankCountry Rank and Infrastructure RankCountry Rank and Infrastructure Rank ASEAN CountriesA SEAN CountriesA SEAN CountriesA SEAN Countries Count ry Rank 15/16Count ry Rank 15/16Count ry Rank 15/16Count ry Rank 15/16 Inf ra Rank 15/16Inf ra Rank 15/16Inf ra Rank 15/16Inf ra Rank 15/16 Country Rank 14/15Country Rank 14/15Country Rank 14/15Country Rank 14/15 Inf ra rank 14/15Inf ra rank 14/15Inf ra rank 14/15Inf ra rank 14/15
Singapore 2 2 2 2
Malaysia 18 24 20 25
Thailand 32 44 31 48
Indonesia 37 62 34 56
Myanmar 131 134 134 137
Vietnam 56 76 68 81
Cambodia 90 101 95 107
Philippines 47 90 52 91
Laos 83 98 93 94
Source: GCI, AllianceDBS, DBS Vickers
ASEAN Ranking on Infrastructure ASEAN Ranking on Infrastructure ASEAN Ranking on Infrastructure ASEAN Ranking on Infrastructure –––– Singapore tops, M’sia 2ndSingapore tops, M’sia 2ndSingapore tops, M’sia 2ndSingapore tops, M’sia 2nd
2
24
44
62
76
9098
101
134
2
25
4856
8191 94
107
137
0
20
40
60
80
100
120
140
160
Infra Rank 15/16
Infra Rank 14/15
Source: GCI, AllianceDBS, DBS Vickers
Based on a survey, among the three countries, the
infrastructure needs of Indonesia is the highest at US$235bn
over 2013-2020, followed by Thailand at US$105bn and
Malaysia at US$100bn.
Comparison of infrastrucComparison of infrastrucComparison of infrastrucComparison of infrastructttture needsure needsure needsure needs
Populat ionPopulat ionPopulat ionPopulat ion GDPGDPGDPGDP Inf rast ructure needs f rom 2013-2020Inf rast ructure needs f rom 2013-2020Inf rast ructure needs f rom 2013-2020Inf rast ructure needs f rom 2013-2020
Malaysia 29.5m US$305bn US$100bn
Indonesia 244.5m US$879bn US$235bn
Thailand 67.9m US$366bn US$105bn
Source: IMF, World Economic Outlook, Other surveys
We highlight the infrastructure quality of all ASEAN countries
based on the last two recent GCI findings. In short, we have
concluded that:
i) Unsurprisingly, Singapore is ranked the highest in
ASEAN and second in the world.
ii) All ASEAN countries showed improvement in the
latest 2015/16 rankings for infrastructure apart from
Indonesia and Laos.
iii) All ASEAN countries apart from Singapore, Malaysia
Vietnam and Myanmar cite the inadequate supply of
infrastructure as the top 5 most problematic reasons
for doing business. For Vietnam and Myanmar, this
issue does not appear, most likely because other
issues cited such as access to financing, inadequate
educated workforce, political instability, corruption,
tax regulations and inefficient government
bureaucracy take precedence. For Philippines,
inadequate supply of infrastructure appears as the
number two reason while for Cambodia, Indonesia
and Laos, it is the third reason.
iv) Among the three ASEAN countries (Malaysia,
Thailand and Indonesia), the biggest opportunities
likely lie in Indonesia given the poorest ranking in
terms of infrastructure among the three and
concerted efforts by the Jokowi-led government to
address this.
v) Malaysian contractors likely stand a higher chance for
Indonesian-based projects given similar languages,
culture and historical precedence.
Malaysia Infrastructure Ranking DetailMalaysia Infrastructure Ranking DetailMalaysia Infrastructure Ranking DetailMalaysia Infrastructure Ranking Detail
1615
13
16
2120
19
12
19 19
0
5
10
15
20
25
Overall Roads Railway Ports Airport
2015/16
2014/15
Source: GCI, AllianceDBS, DBS Vickers
Out of three ASEAN countries, Malaysia’s infrastructure is
probably the most mature. This implies while there is a surge in
transport-related infrastructure currently, contractors will
eventually need to venture overseas again.
Industry Focus
Malaysian Construction
Page 12
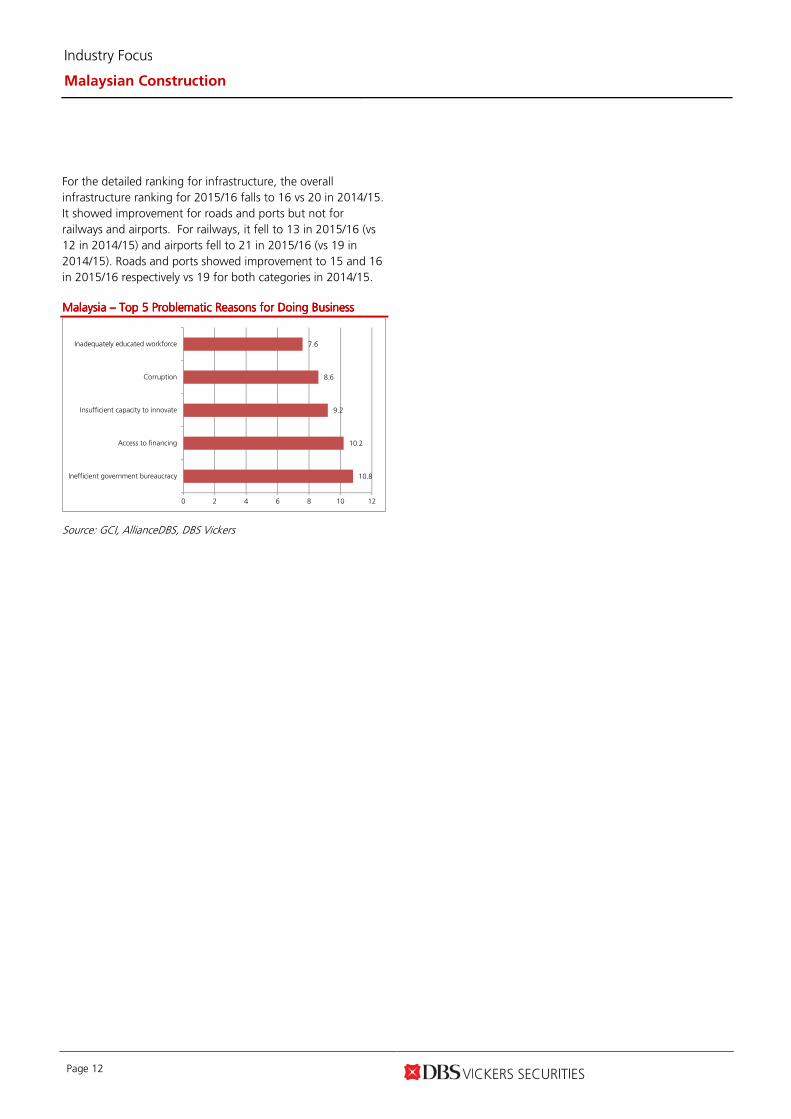
For the detailed ranking for infrastructure, the overall
infrastructure ranking for 2015/16 falls to 16 vs 20 in 2014/15.
It showed improvement for roads and ports but not for
railways and airports. For railways, it fell to 13 in 2015/16 (vs
12 in 2014/15) and airports fell to 21 in 2015/16 (vs 19 in
2014/15). Roads and ports showed improvement to 15 and 16
in 2015/16 respectively vs 19 for both categories in 2014/15.
Malaysia Malaysia Malaysia Malaysia –––– Top 5 Problematic Reasons for Doing BusinessTop 5 Problematic Reasons for Doing BusinessTop 5 Problematic Reasons for Doing BusinessTop 5 Problematic Reasons for Doing Business
10.8
10.2
9.2
8.6
7.6
0 2 4 6 8 10 12
Inefficient government bureaucracy
Access to financing
Insufficient capacity to innovate
Corruption
Inadequately educated workforce
Source: GCI, AllianceDBS, DBS Vickers
Industry Focus
Malaysian Construction
Page 13
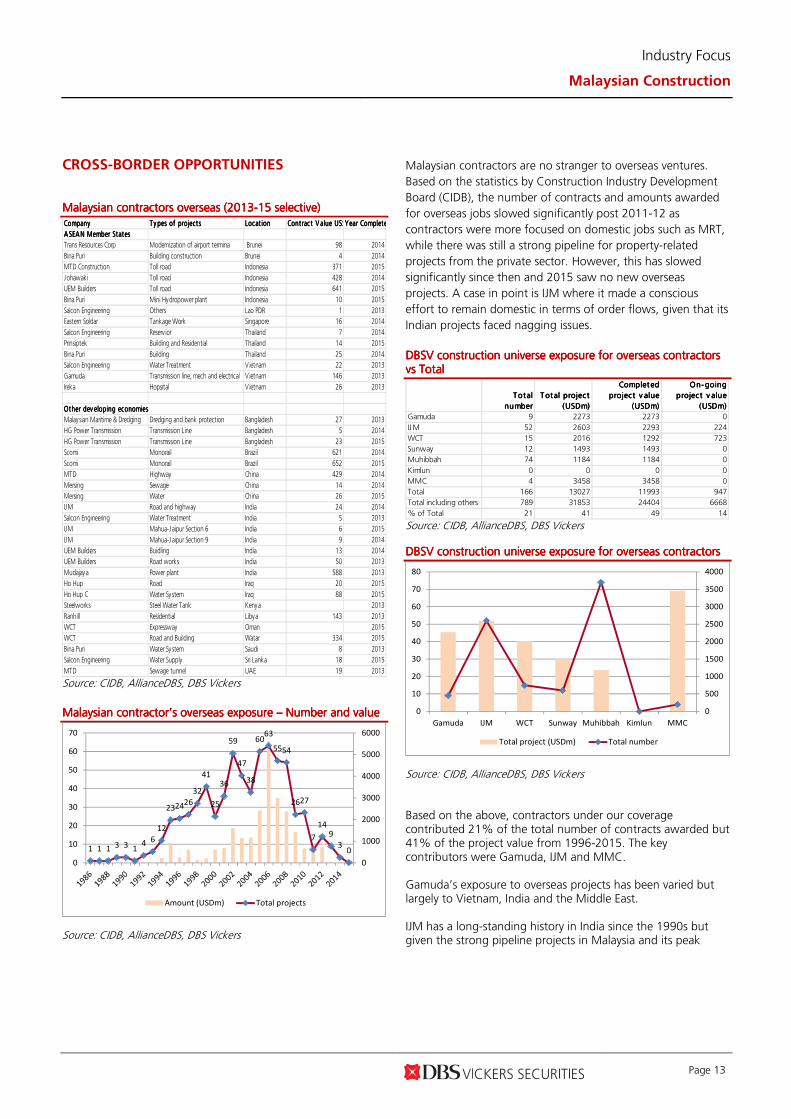
CROSS-BORDER OPPORTUNITIES MalaysiaMalaysiaMalaysiaMalaysiannnn contractors overseas (2013contractors overseas (2013contractors overseas (2013contractors overseas (2013----15 selective)15 selective)15 selective)15 selective) Company Company Company Company T y pes of project sT y pes of project sT y pes of project sT y pes of project s Locat ionLocat ionLocat ionLocat ion Cont ract V alue US$mCont ract V alue US$mCont ract V alue US$mCont ract V alue US$mYear CompletedYear CompletedYear CompletedYear Completed
ASEAN Member StatesA SEAN Member StatesA SEAN Member StatesA SEAN Member States
Trans Resources Corp Modernization of airport termina Brunei 98 2014
Bina Puri Building construction Brunei 4 2014
MTD Construction Toll road Indonesia 371 2015
Johawaki Toll road Indonesia 428 2014
UEM Builders Toll road Indonesia 641 2015
Bina Puri Mini Hydropower plant Indonesia 10 2015
Salcon Engineering Others Lao PDR 1 2013
Eastern Soldar Tankage Work Singapore 16 2014
Salcon Engineering Reserv ior Thailand 7 2014
Prinsiptek Building and Residential Thailand 14 2015
Bina Puri Building Thailand 25 2014
Salcon Engineering Water Treatment Vietnam 22 2013
Gamuda Transmission line, mech and electrical V ietnam 146 2013
Ireka Hopsital V ietnam 26 2013
Other dev eloping economiesOther dev eloping economiesOther dev eloping economiesOther dev eloping economies
Malaysian Maritime & Dredging Dredging and bank protection Bangladesh 27 2013
HG Power Transmission Transmission Line Bangladesh 5 2014
HG Power Transmission Transmission Line Bangladesh 23 2015
Scomi Monorail Brazil 621 2014
Scomi Monorail Brazil 652 2015
MTD Highway China 429 2014
Mersing Sewage China 14 2014
Mersing Water China 26 2015
IJM Road and highway India 24 2014
Salcon Engineering Water Treatment India 5 2013
IJM Mahua-Jaipur Section 6 India 6 2015
IJM Mahua-Jaipur Section 9 India 9 2014
UEM Builders Buidling India 13 2014
UEM Builders Road works India 50 2013
Mudajaya Power plant India 588 2013
Ho Hup Road Iraq 20 2015
Ho Hup C Water System Iraq 88 2015
Steelworks Steel Water Tank Kenya 2013
Ranhill Residential Libya 143 2013
WCT Expressway Oman 2015
WCT Road and Building Watar 334 2015
Bina Puri Water System Saudi 8 2013
Salcon Engineering Water Supply Sri Lanka 18 2015
MTD Sewage tunnel UAE 19 2013 Source: CIDB, AllianceDBS, DBS Vickers
MalaysiaMalaysiaMalaysiaMalaysiannnn contractor’s overseas exposure contractor’s overseas exposure contractor’s overseas exposure contractor’s overseas exposure –––– Number and valueNumber and valueNumber and valueNumber and value
1 1 1 3 3 14 6
12
232426
32
41
25
36
59
47
38
6063
5554
2627
7
149
30
0
1000
2000
3000
4000
5000
6000
0
10
20
30
40
50
60
70
Amount (USDm) Total projects
Source: CIDB, AllianceDBS, DBS Vickers
Malaysian contractors are no stranger to overseas ventures.
Based on the statistics by Construction Industry Development
Board (CIDB), the number of contracts and amounts awarded
for overseas jobs slowed significantly post 2011-12 as
contractors were more focused on domestic jobs such as MRT,
while there was still a strong pipeline for property-related
projects from the private sector. However, this has slowed
significantly since then and 2015 saw no new overseas
projects. A case in point is IJM where it made a conscious
effort to remain domestic in terms of order flows, given that its
Indian projects faced nagging issues.
DBSV construction universe exposure for overseas contractors DBSV construction universe exposure for overseas contractors DBSV construction universe exposure for overseas contractors DBSV construction universe exposure for overseas contractors vsvsvsvs TotalTotalTotalTotal
Total Total Total Total
numbernumbernumbernumber
Total project T otal project T otal project T otal project
(USDm)(USDm)(USDm)(USDm)
Completed Completed Completed Completed
project v alue project v alue project v alue project v alue
(USDm)(USDm)(USDm)(USDm)
On-going On-going On-going On-going
project v alue project v alue project v alue project v alue
(USDm)(USDm)(USDm)(USDm)
Gamuda 9 2273 2273 0
IJM 52 2603 2293 224
WCT 15 2016 1292 723
Sunway 12 1493 1493 0
Muhibbah 74 1184 1184 0
Kimlun 0 0 0 0
MMC 4 3458 3458 0
Total 166 13027 11993 947
Total including others 789 31853 24404 6668
% of Total 21 41 49 14 Source: CIDB, AllianceDBS, DBS Vickers DBSV construction universe exposure for overseas contractors DBSV construction universe exposure for overseas contractors DBSV construction universe exposure for overseas contractors DBSV construction universe exposure for overseas contractors
0
500
1000
1500
2000
2500
3000
3500
4000
0
10
20
30
40
50
60
70
80
Gamuda IJM WCT Sunway Muhibbah Kimlun MMC
Total project (USDm) Total number
Source: CIDB, AllianceDBS, DBS Vickers Based on the above, contractors under our coverage contributed 21% of the total number of contracts awarded but 41% of the project value from 1996-2015. The key contributors were Gamuda, IJM and MMC. Gamuda’s exposure to overseas projects has been varied but largely to Vietnam, India and the Middle East. IJM has a long-standing history in India since the 1990s but given the strong pipeline projects in Malaysia and its peak
Industry Focus
Malaysian Construction
Page 14
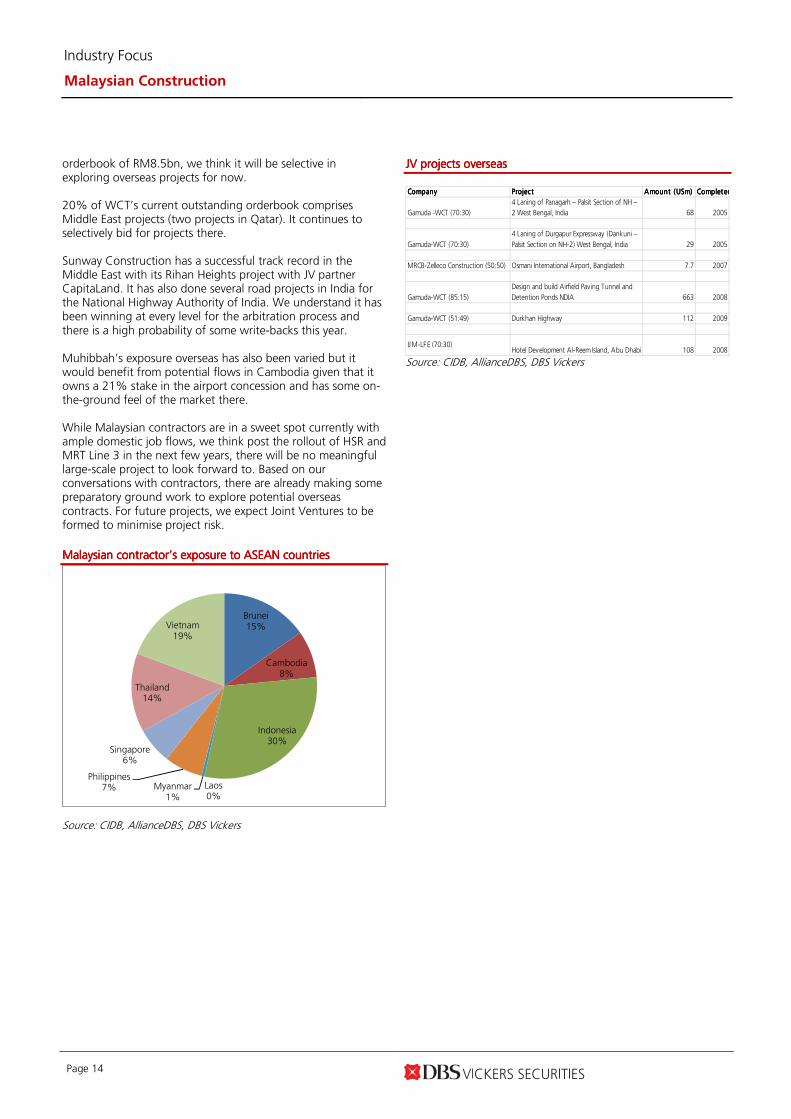
orderbook of RM8.5bn, we think it will be selective in exploring overseas projects for now. 20% of WCT’s current outstanding orderbook comprises Middle East projects (two projects in Qatar). It continues to selectively bid for projects there. Sunway Construction has a successful track record in the Middle East with its Rihan Heights project with JV partner CapitaLand. It has also done several road projects in India for the National Highway Authority of India. We understand it has been winning at every level for the arbitration process and there is a high probability of some write-backs this year. Muhibbah’s exposure overseas has also been varied but it would benefit from potential flows in Cambodia given that it owns a 21% stake in the airport concession and has some on-the-ground feel of the market there. While Malaysian contractors are in a sweet spot currently with ample domestic job flows, we think post the rollout of HSR and MRT Line 3 in the next few years, there will be no meaningful large-scale project to look forward to. Based on our conversations with contractors, there are already making some preparatory ground work to explore potential overseas contracts. For future projects, we expect Joint Ventures to be formed to minimise project risk.
Malaysian contractor’s exposure to ASEAN countriesMalaysian contractor’s exposure to ASEAN countriesMalaysian contractor’s exposure to ASEAN countriesMalaysian contractor’s exposure to ASEAN countries
Brunei15%
Cambodia8%
Indonesia30%
Laos0%
Myanmar1%
Philippines7%
Singapore6%
Thailand14%
Vietnam19%
Source: CIDB, AllianceDBS, DBS Vickers
JV projects overseas JV projects overseas JV projects overseas JV projects overseas
Company Company Company Company ProjectProjectProjectProject Amount (USm)Amount (USm)Amount (USm)Amount (USm) CompletedCompletedCompletedCompleted
Gamuda -WCT (70:30)
4 Laning of Panagarh – Palsit Section of NH –
2 West Bengal, India 68 2005
Gamuda-WCT (70:30)
4 Laning of Durgapur Expressway (Dankuni –
Palsit Section on NH-2) West Bengal, India 29 2005
MRCB-Zelleco Construction (50:50) Osmani International Airport, Bangladesh 7.7 2007
Gamuda-WCT (85:15)
Design and build Airfield Paving Tunnel and
Detention Ponds NDIA 663 2008
Gamuda-WCT (51:49) Durkhan Highway 112 2009
IJM-LFE (70:30)Hotel Development Al-Reem Island, Abu Dhabi 108 2008
Source: CIDB, AllianceDBS, DBS Vickers
Industry Focus
Malaysian Construction
Page 15
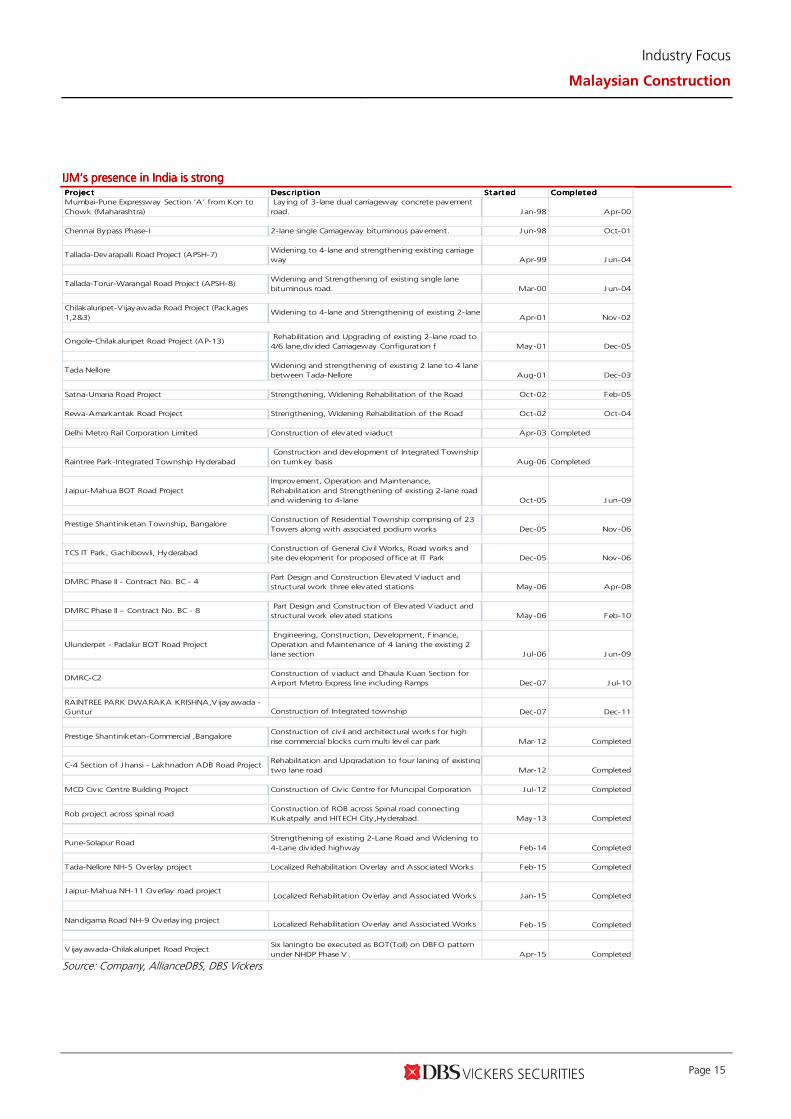
IJM’s presence in India is strongIJM’s presence in India is strongIJM’s presence in India is strongIJM’s presence in India is strong ProjectProjectProjectProject Descript ionDescript ionDescript ionDescript ion Started Started Started Started CompletedCompletedCompletedCompleted
Mumbai-Pune Expressway Section ‘A’ from Kon to
Chowk (Maharashtra)
Lay ing of 3-lane dual carriageway concrete pavement
road. Jan-98 Apr-00
Chennai Bypass Phase-I 2-lane single Carriageway bituminous pavement. Jun-98 Oct-01
Tallada-Devarapalli Road Project (APSH-7)Widening to 4-lane and strengthening existing carriage
way Apr-99 Jun-04
Tallada-Torur-Warangal Road Project (APSH-8)Widening and Strengthening of existing single lane
bituminous road. Mar-00 Jun-04
Chilakaluripet-V ijayawada Road Project (Packages
1,2&3)Widening to 4-lane and Strengthening of existing 2-lane
Apr-01 Nov-02
Ongole-Chilakaluripet Road Project (AP-13) Rehabilitation and Upgrading of existing 2-lane road to
4/6 lane,div ided Carriageway Configuration f May-01 Dec-05
Tada Nellore Widening and strengthening of existing 2 lane to 4 lane
between Tada-Nellore Aug-01 Dec-03
Satna-Umaria Road Project Strengthening, Widening Rehabilitation of the Road Oct-02 Feb-05
Rewa-Amarkantak Road Project Strengthening, Widening Rehabilitation of the Road Oct-02 Oct-04
Delhi Metro Rail Corporation Limited Construction of elevated viaduct Apr-03 Completed
Raintree Park-Integrated Township Hyderabad
Construction and development of Integrated Township
on turnkey basis Aug-06 Completed
Jaipur-Mahua BOT Road Project
Improvement, Operation and Maintenance,
Rehabilitation and Strengthening of existing 2-lane road
and widening to 4-lane Oct-05 Jun-09
Prestige Shantiniketan Township, BangaloreConstruction of Residential Township comprising of 23
Towers along with associated podium works Dec-05 Nov-06
TCS IT Park, Gachibowli, HyderabadConstruction of General Civ il Works, Road works and
site development for proposed office at IT Park Dec-05 Nov-06
DMRC Phase II - Contract No. BC - 4 Part Design and Construction Elevated V iaduct and
structural work three elevated stations May-06 Apr-08
DMRC Phase II – Contract No. BC - 8 Part Design and Construction of Elevated V iaduct and
structural work elevated stations May-06 Feb-10
Ulunderpet - Padalur BOT Road Project
Engineering, Construction, Development, F inance,
Operation and Maintenance of 4 laning the existing 2
lane section Jul-06 Jun-09
DMRC-C2Construction of v iaduct and Dhaula Kuan Section for
Airport Metro Express line including Ramps Dec-07 Jul-10
RAINTREE PARK DWARAKA KRISHNA,V ijayawada -
Guntur Construction of Integrated township Dec-07 Dec-11
Prestige Shantiniketan-Commercial ,BangaloreConstruction of civ il and architectural works for high
rise commercial blocks cum multi level car park Mar-12 Completed
C-4 Section of Jhansi - Lakhnadon ADB Road ProjectRehabilitation and Upgradation to four laning of existing
two lane road Mar-12 Completed
MCD Civ ic Centre Building Project Construction of Civ ic Centre for Muncipal Corporation Jul-12 Completed
Rob project across spinal roadConstruction of ROB across Spinal road connecting
Kukatpally and HITECH City ,Hyderabad. May-13 Completed
Pune-Solapur RoadStrengthening of existing 2-Lane Road and Widening to
4-Lane div ided highway Feb-14 Completed
Tada-Nellore NH-5 Overlay project Localized Rehabilitation Overlay and Associated Works Feb-15 Completed
Jaipur-Mahua NH-11 Overlay road project Localized Rehabilitation Overlay and Associated Works Jan-15 Completed
Nandigama Road NH-9 Overlay ing project Localized Rehabilitation Overlay and Associated Works Feb-15 Completed
V ijayawada-Chilakaluripet Road ProjectSix laningto be executed as BOT(Toll) on DBFO pattern
under NHDP Phase V . Apr-15 Completed Source: Company, AllianceDBS, DBS Vickers
Industry Focus
Malaysian Construction
Page 16
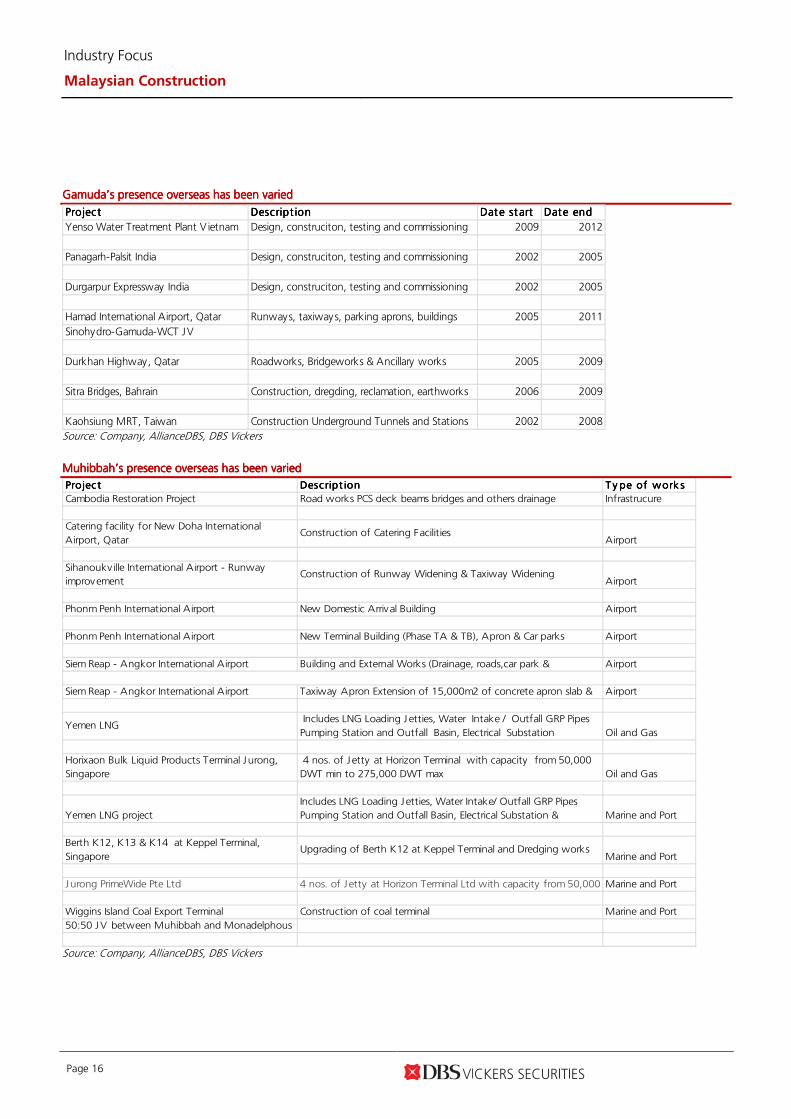
Gamuda’s presence overseas has been variedGamuda’s presence overseas has been variedGamuda’s presence overseas has been variedGamuda’s presence overseas has been varied
ProjectProjectProjectProject Descript ionDescript ionDescript ionDescript ion Date st art Date st art Date st art Date st art Date endDate endDate endDate end
Yenso Water Treatment Plant V ietnam Design, construciton, testing and commissioning 2009 2012
Panagarh-Palsit India Design, construciton, testing and commissioning 2002 2005
Durgarpur Expressway India Design, construciton, testing and commissioning 2002 2005
Hamad International Airport, Qatar Runways, taxiways, parking aprons, buildings 2005 2011
Sinohydro-Gamuda-WCT JV
Durkhan Highway, Qatar Roadworks, Bridgeworks & Ancillary works 2005 2009
Sitra Bridges, Bahrain Construction, dregding, reclamation, earthworks 2006 2009
Kaohsiung MRT, Taiwan Construction Underground Tunnels and Stations 2002 2008 Source: Company, AllianceDBS, DBS Vickers
Muhibbah’s presence overseas has been variedMuhibbah’s presence overseas has been variedMuhibbah’s presence overseas has been variedMuhibbah’s presence overseas has been varied
ProjectProjectProjectProject Descript ionDescript ionDescript ionDescript ion Ty pe of work sT y pe of work sT y pe of work sT y pe of work s
Cambodia Restoration Project Road works PCS deck beams bridges and others drainage Infrastrucure
Catering facility for New Doha International
Airport, QatarConstruction of Catering Facilities
Airport
Sihanoukville International Airport - Runway
improvementConstruction of Runway Widening & Taxiway Widening
Airport
Phonm Penh International Airport New Domestic Arrival Building Airport
Phonm Penh International Airport New Terminal Building (Phase TA & TB), Apron & Car parks Airport
Siem Reap - Angkor International Airport Building and External Works (Drainage, roads,car park & Airport
Siem Reap - Angkor International Airport Taxiway Apron Extension of 15,000m2 of concrete apron slab & Airport
Yemen LNG Includes LNG Loading J etties, Water Intake / Outfall GRP Pipes
Pumping Station and Outfall Basin, Electrical Substation Oil and Gas
Horixaon Bulk Liquid Products Terminal Jurong,
Singapore
4 nos. of Jetty at Horizon Terminal with capacity from 50,000
DWT min to 275,000 DWT max Oil and Gas
Yemen LNG project
Includes LNG Loading Jetties, Water Intake/ Outfall GRP Pipes
Pumping Station and Outfall Basin, Electrical Substation & Marine and Port
Berth K12, K13 & K14 at Keppel Terminal,
SingaporeUpgrading of Berth K12 at Keppel Terminal and Dredging works
Marine and Port
Jurong PrimeWide Pte Ltd 4 nos. of Jetty at Horizon Terminal Ltd with capacity from 50,000 Marine and Port
Wiggins Island Coal Export Terminal Construction of coal terminal Marine and Port
50:50 JV between Muhibbah and Monadelphous
Source: Company, AllianceDBS, DBS Vickers
Industry Focus
Malaysian Construction
Page 17
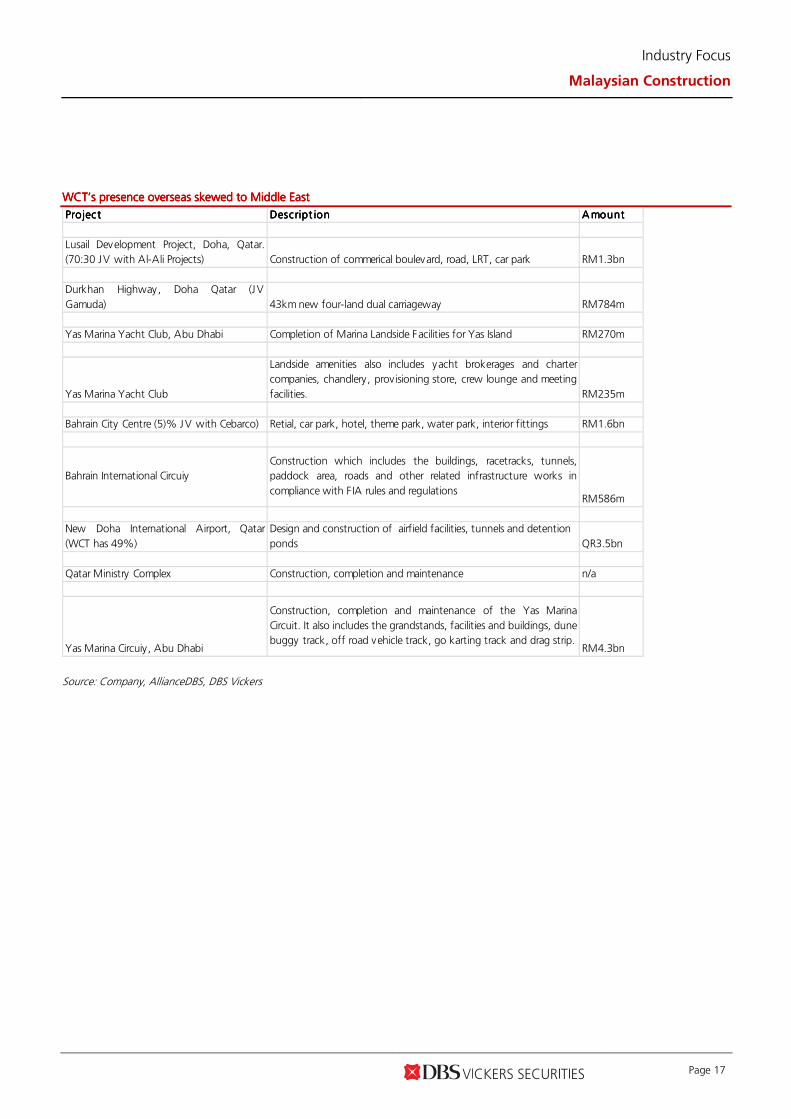
WCT’s presence overseas skewed to Middle EastWCT’s presence overseas skewed to Middle EastWCT’s presence overseas skewed to Middle EastWCT’s presence overseas skewed to Middle East
ProjectProjectProjectProject Descript ionDescript ionDescript ionDescript ion AmountAmountAmountAmount
Lusail Development Project, Doha, Qatar.
(70:30 JV with Al-Ali Projects) Construction of commerical boulevard, road, LRT, car park RM1.3bn
Durkhan Highway, Doha Qatar (JV
Gamuda) 43km new four-land dual carriageway RM784m
Yas Marina Yacht Club, Abu Dhabi Completion of Marina Landside Facilities for Yas Island RM270m
Yas Marina Yacht Club
Landside amenities also includes yacht brokerages and charter
companies, chandlery, provisioning store, crew lounge and meeting
facilities. RM235m
Bahrain City Centre (5)% JV with Cebarco) Retial, car park, hotel, theme park, water park, interior fittings RM1.6bn
Bahrain International Circuiy
Construction which includes the buildings, racetracks, tunnels,
paddock area, roads and other related infrastructure works in
compliance with F IA rules and regulationsRM586m
New Doha International Airport, Qatar
(WCT has 49%)
Design and construction of airfield facilities, tunnels and detention
ponds QR3.5bn
Qatar Ministry Complex Construction, completion and maintenance n/a
Yas Marina Circuiy, Abu Dhabi
Construction, completion and maintenance of the Yas Marina
Circuit. It also includes the grandstands, facilities and buildings, dune
buggy track, off road vehicle track, go karting track and drag strip.RM4.3bn
Source: Company, AllianceDBS, DBS Vickers
Industry Focus
Malaysian Construction
Page 18
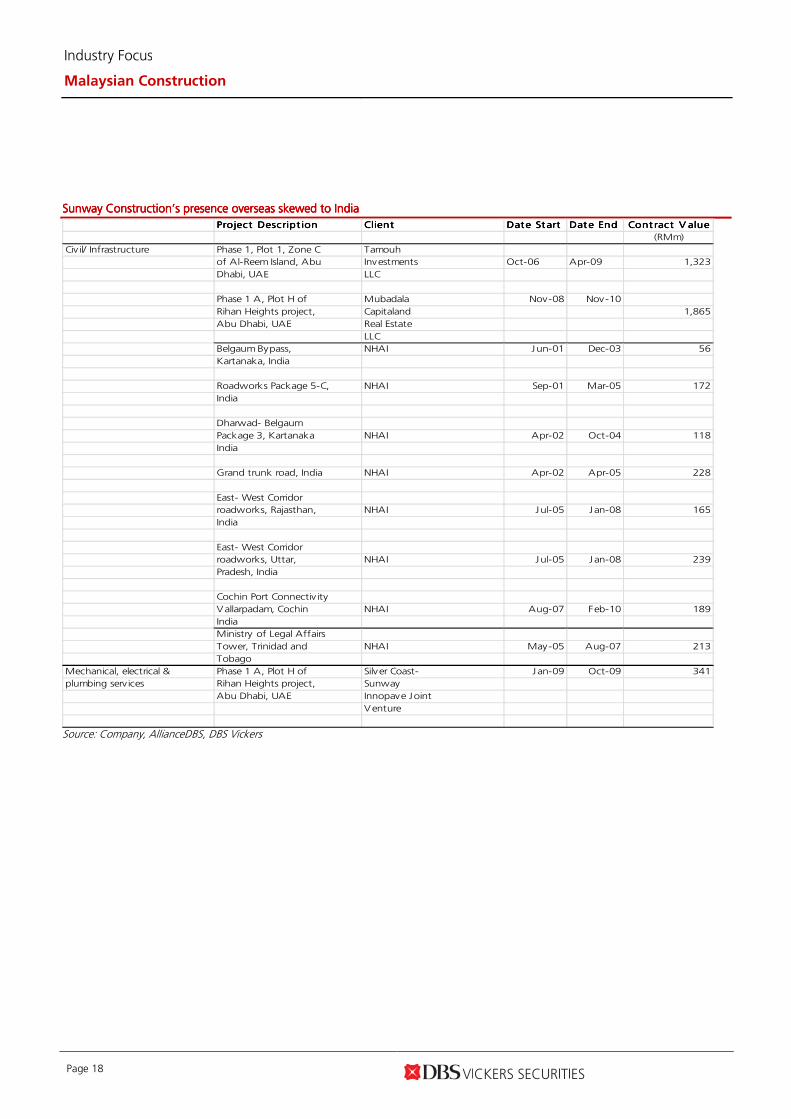
Sunway Construction’s presence overseas skewedSunway Construction’s presence overseas skewedSunway Construction’s presence overseas skewedSunway Construction’s presence overseas skewed to Indiato Indiato Indiato India
Project Descript ionProject Descript ionProject Descript ionProject Descript ion ClientClientClientClient Date St artDate St artDate St artDate St art Date EndDate EndDate EndDate End
(RMm)
Civil/ Infrastructure Phase 1, Plot 1, Zone C Tamouh
of Al-Reem Island, Abu Investments Oct-06 Apr-09 1,323
Dhabi, UAE LLC
Phase 1 A, Plot H of Mubadala Nov-08 Nov-10
Rihan Heights project, Capitaland 1,865
Abu Dhabi, UAE Real Estate
LLC
Belgaum Bypass, NHAI Jun-01 Dec-03 56
Kartanaka, India
Roadworks Package 5-C, NHAI Sep-01 Mar-05 172
India
Dharwad- Belgaum
Package 3, Kartanaka NHAI Apr-02 Oct-04 118
India
Grand trunk road, India NHAI Apr-02 Apr-05 228
East- West Corridor
roadworks, Rajasthan, NHAI Jul-05 Jan-08 165
India
East- West Corridor
roadworks, Uttar, NHAI Jul-05 Jan-08 239
Pradesh, India
Cochin Port Connectiv ity
Vallarpadam, Cochin NHAI Aug-07 Feb-10 189
India
Ministry of Legal Affairs
Tower, Trinidad and NHAI May-05 Aug-07 213
Tobago
Mechanical, electrical & Phase 1 A, Plot H of Silver Coast- Jan-09 Oct-09 341
plumbing services Rihan Heights project, Sunway
Abu Dhabi, UAE Innopave Joint
Venture
Cont ract V alueCont ract V alueCont ract V alueCont ract V alue
Source: Company, AllianceDBS, DBS Vickers
Industry Focus
Malaysian Construction
Page 19
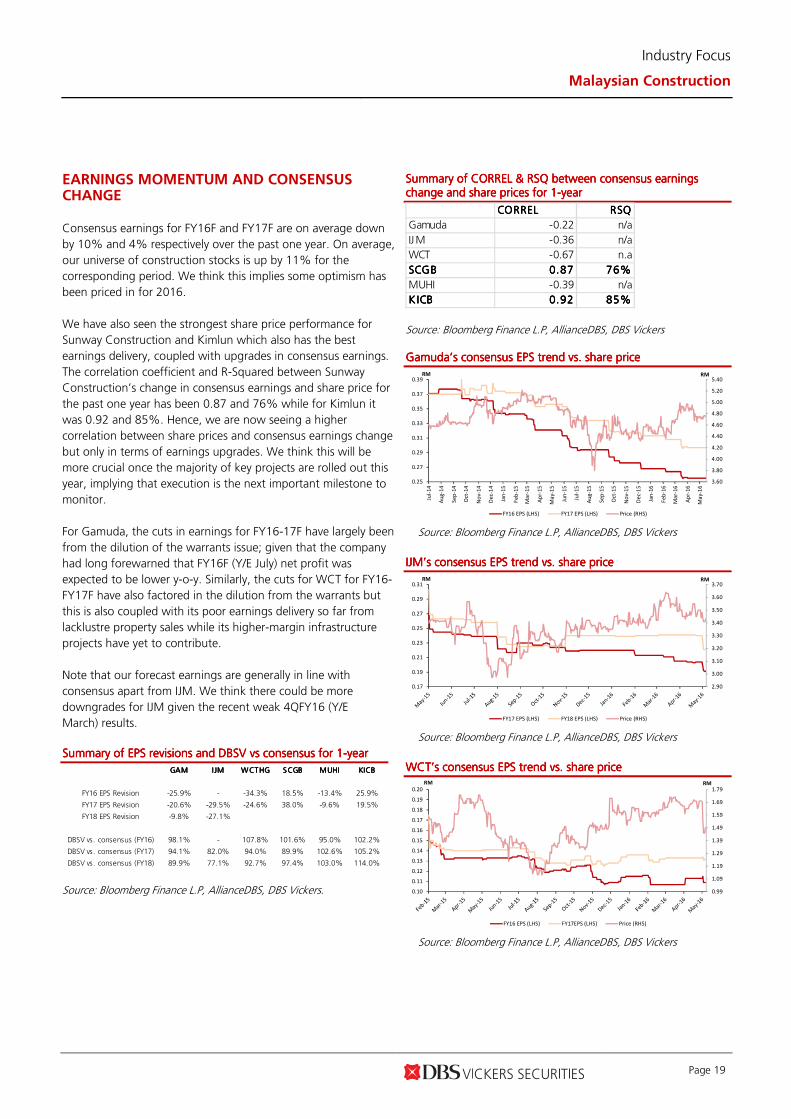
EARNINGS MOMENTUM AND CONSENSUS CHANGE
Consensus earnings for FY16F and FY17F are on average down
by 10% and 4% respectively over the past one year. On average,
our universe of construction stocks is up by 11% for the
corresponding period. We think this implies some optimism has
been priced in for 2016.
We have also seen the strongest share price performance for
Sunway Construction and Kimlun which also has the best
earnings delivery, coupled with upgrades in consensus earnings.
The correlation coefficient and R-Squared between Sunway
Construction’s change in consensus earnings and share price for
the past one year has been 0.87 and 76% while for Kimlun it
was 0.92 and 85%. Hence, we are now seeing a higher
correlation between share prices and consensus earnings change
but only in terms of earnings upgrades. We think this will be
more crucial once the majority of key projects are rolled out this
year, implying that execution is the next important milestone to
monitor.
For Gamuda, the cuts in earnings for FY16-17F have largely been
from the dilution of the warrants issue; given that the company
had long forewarned that FY16F (Y/E July) net profit was
expected to be lower y-o-y. Similarly, the cuts for WCT for FY16-
FY17F have also factored in the dilution from the warrants but
this is also coupled with its poor earnings delivery so far from
lacklustre property sales while its higher-margin infrastructure
projects have yet to contribute.
Note that our forecast earnings are generally in line with
consensus apart from IJM. We think there could be more
downgrades for IJM given the recent weak 4QFY16 (Y/E
March) results.
Summary of EPS revisions Summary of EPS revisions Summary of EPS revisions Summary of EPS revisions and DBSV vs consensus for 1and DBSV vs consensus for 1and DBSV vs consensus for 1and DBSV vs consensus for 1----yearyearyearyear
GAMGAMGAMGAM IJMIJMIJMIJM WCTHGWCTHGWCTHGWCTHG SCGBSCGBSCGBSCGB MUHIMUHIMUHIMUHI KICBKICBKICBKICB
-25.9% - -34.3% 18.5% -13.4% 25.9%
-20.6% -29.5% -24.6% 38.0% -9.6% 19.5%
-9.8% -27.1%
98.1% - 107.8% 101.6% 95.0% 102.2%
94.1% 82.0% 94.0% 89.9% 102.6% 105.2%
89.9% 77.1% 92.7% 97.4% 103.0% 114.0%
FY16 EPS Revision
FY17 EPS Revision
DBSV vs. consensus (FY16)
DBSV vs. consensus (FY17)
FY18 EPS Revision
DBSV vs. consensus (FY18) Source: Bloomberg Finance L.P, AllianceDBS, DBS Vickers.
Summary of CORREL & RSQ between consensus earnings Summary of CORREL & RSQ between consensus earnings Summary of CORREL & RSQ between consensus earnings Summary of CORREL & RSQ between consensus earnings change and share prices for 1change and share prices for 1change and share prices for 1change and share prices for 1----yearyearyearyear
CORRELCORRELCORRELCORREL RSQRSQRSQRSQ
Gamuda -0.22 n/a
IJM -0.36 n/a
WCT -0.67 n.a
SCGBSCGBSCGBSCGB 0.870.870.870.87 76%76%76%76%
MUHI -0.39 n/a
K ICBKICBKICBKICB 0.920.920.920.92 85%85%85%85% Source: Bloomberg Finance L.P, AllianceDBS, DBS Vickers Gamuda’s consensus EPS trend vs. share priceGamuda’s consensus EPS trend vs. share priceGamuda’s consensus EPS trend vs. share priceGamuda’s consensus EPS trend vs. share price
3.60
3.80
4.00
4.20
4.40
4.60
4.80
5.00
5.20
5.40
0.25
0.27
0.29
0.31
0.33
0.35
0.37
0.39
Jul-
14
Au
g-1
4
Se
p-1
4
Oct
-14
No
v-1
4
De
c-1
4
Jan
-15
Fe
b-1
5
Ma
r-1
5
Ap
r-1
5
Ma
y-1
5
Jun
-15
Jul-
15
Au
g-1
5
Se
p-1
5
Oct
-15
No
v-1
5
De
c-1
5
Jan
-16
Fe
b-1
6
Ma
r-1
6
Ap
r-1
6
Ma
y-1
6
RMRM
FY16 EPS (LHS) FY17 EPS (LHS) Price (RHS)
Source: Bloomberg Finance L.P, AllianceDBS, DBS Vickers
IJM’s consensus EPS trend vs. share priceIJM’s consensus EPS trend vs. share priceIJM’s consensus EPS trend vs. share priceIJM’s consensus EPS trend vs. share price
2.90
3.00
3.10
3.20
3.30
3.40
3.50
3.60
3.70
0.17
0.19
0.21
0.23
0.25
0.27
0.29
0.31RMRM
FY17 EPS (LHS) FY18 EPS (LHS) Price (RHS)
Source: Bloomberg Finance L.P, AllianceDBS, DBS Vickers
WCT’s consensus EPS trend vs. share priceWCT’s consensus EPS trend vs. share priceWCT’s consensus EPS trend vs. share priceWCT’s consensus EPS trend vs. share price
0.99
1.09
1.19
1.29
1.39
1.49
1.59
1.69
1.79
0.10
0.11
0.12
0.13
0.14
0.15
0.16
0.17
0.18
0.19
0.20RMRM
FY16 EPS (LHS) FY17EPS (LHS) Price (RHS)
Source: Bloomberg Finance L.P, AllianceDBS, DBS Vickers
Industry Focus
Malaysian Construction
Page 20
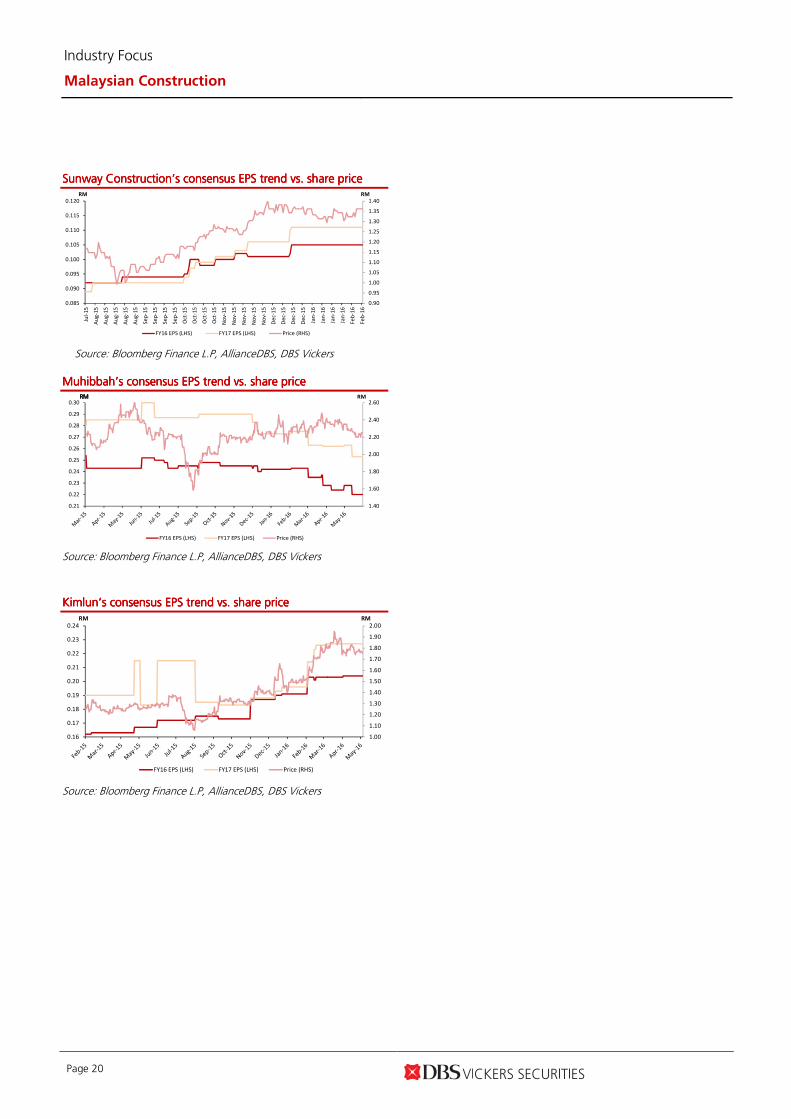
SunSunSunSunway way way way CCCCononononstructionstructionstructionstruction’s consensus EPS trend vs. share price’s consensus EPS trend vs. share price’s consensus EPS trend vs. share price’s consensus EPS trend vs. share price
0.90
0.95
1.00
1.05
1.10
1.15
1.20
1.25
1.30
1.35
1.40
0.085
0.090
0.095
0.100
0.105
0.110
0.115
0.120
Jul-
15
Au
g-1
5
Au
g-1
5
Au
g-1
5
Au
g-1
5
Au
g-1
5
Se
p-1
5
Se
p-1
5
Se
p-1
5
Se
p-1
5
Oct
-15
Oct
-15
Oct
-15
Oct
-15
No
v-1
5
No
v-1
5
No
v-1
5
No
v-1
5
No
v-1
5
De
c-1
5
De
c-1
5
De
c-1
5
De
c-1
5
Jan
-16
Jan
-16
Jan
-16
Jan
-16
Fe
b-1
6
Fe
b-1
6
RMRM
FY16 EPS (LHS) FY17 EPS (LHS) Price (RHS)
Source: Bloomberg Finance L.P, AllianceDBS, DBS Vickers
Muhibbah’s consensus EPS trend vs. share priceMuhibbah’s consensus EPS trend vs. share priceMuhibbah’s consensus EPS trend vs. share priceMuhibbah’s consensus EPS trend vs. share price
1.40
1.60
1.80
2.00
2.20
2.40
2.60
0.21
0.22
0.23
0.24
0.25
0.26
0.27
0.28
0.29
0.30RMRM RM RM RM
FY16 EPS (LHS) FY17 EPS (LHS) Price (RHS)
Source: Bloomberg Finance L.P, AllianceDBS, DBS Vickers
Kimlun’s consensus EPKimlun’s consensus EPKimlun’s consensus EPKimlun’s consensus EPS trend vs. share priceS trend vs. share priceS trend vs. share priceS trend vs. share price
1.00
1.10
1.20
1.30
1.40
1.50
1.60
1.70
1.80
1.90
2.00
0.16
0.17
0.18
0.19
0.20
0.21
0.22
0.23
0.24RMRM
FY16 EPS (LHS) FY17 EPS (LHS) Price (RHS)
Source: Bloomberg Finance L.P, AllianceDBS, DBS Vickers
Industry Focus
Malaysian Construction
Page 21
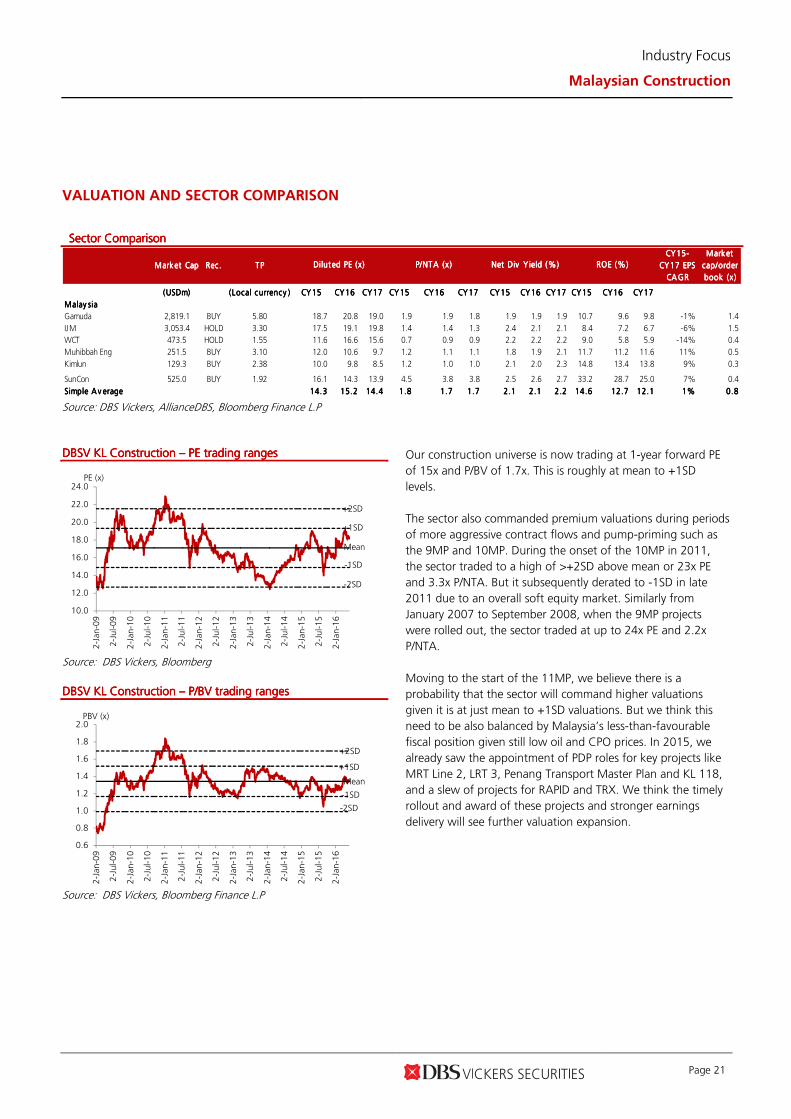
VALUATION AND SECTOR COMPARISON
Sector ComparisonSector ComparisonSector ComparisonSector Comparison
Market CapMarket CapMarket CapMarket Cap Rec.Rec.Rec.Rec. TPTPTPTP
Market Market Market Market
cap/order cap/order cap/order cap/order
book (x )book (x )book (x )book (x )
(USDm)(USDm)(USDm)(USDm) (Local currency )(Local currency )(Local currency )(Local currency ) CY15CY15CY15CY15 CY16CY16CY16CY16 CY17CY17CY17CY17 CY15CY15CY15CY15 CY16CY16CY16CY16 CY17CY17CY17CY17 CY15CY15CY15CY15 CY16CY16CY16CY16 CY17CY17CY17CY17 CY15CY15CY15CY15 CY16CY16CY16CY16 CY17CY17CY17CY17
Malay siaMalay siaMalay siaMalay sia
Gamuda 2,819.1 BUY 5.80 18.7 20.8 19.0 1.9 1.9 1.8 1.9 1.9 1.9 10.7 9.6 9.8 -1% 1.4
IJM 3,053.4 HOLD 3.30 17.5 19.1 19.8 1.4 1.4 1.3 2.4 2.1 2.1 8.4 7.2 6.7 -6% 1.5
WCT 473.5 HOLD 1.55 11.6 16.6 15.6 0.7 0.9 0.9 2.2 2.2 2.2 9.0 5.8 5.9 -14% 0.4
Muhibbah Eng 251.5 BUY 3.10 12.0 10.6 9.7 1.2 1.1 1.1 1.8 1.9 2.1 11.7 11.2 11.6 11% 0.5
Kimlun 129.3 BUY 2.38 10.0 9.8 8.5 1.2 1.0 1.0 2.1 2.0 2.3 14.8 13.4 13.8 9% 0.3
SunCon 525.0 BUY 1.92 16.1 14.3 13.9 4.5 3.8 3.8 2.5 2.6 2.7 33.2 28.7 25.0 7% 0.4
Simple A v erageSimple A v erageSimple A v erageSimple A v erage 14.314.314.314.3 15.215.215.215.2 14.414.414.414.4 1.81.81.81.8 1.71.71.71.7 1.71.71.71.7 2.12.12.12.1 2.12.12.12.1 2.22.22.22.2 14.614.614.614.6 12.712.712.712.7 12.112.112.112.1 1%1%1%1% 0.80.80.80.8
Diluted PE (x)Diluted PE (x)Diluted PE (x)Diluted PE (x) P/NTA (x )P/NTA (x )P/NTA (x )P/NTA (x ) Net Div Y ield (%)Net Div Y ield (%)Net Div Y ield (%)Net Div Y ield (%) ROE (%)ROE (%)ROE (%)ROE (%)
CY15-CY15-CY15-CY15-
CY17 EPS CY17 EPS CY17 EPS CY17 EPS
CAGRCAGRCAGRCAGR
Source: DBS Vickers, AllianceDBS, Bloomberg Finance L.P
DBSV KL Construction DBSV KL Construction DBSV KL Construction DBSV KL Construction –––– PE trading rangesPE trading rangesPE trading rangesPE trading ranges
-2SD
-1SD
Mean
+1SD
+2SD
10.0
12.0
14.0
16.0
18.0
20.0
22.0
24.0
2-Jan-09
2-Jul-09
2-Jan-10
2-Jul-10
2-Jan-11
2-Jul-11
2-Jan-12
2-Jul-12
2-Jan-13
2-Jul-13
2-Jan-14
2-Jul-14
2-Jan-15
2-Jul-15
2-Jan-16
PE (x)
Source: DBS Vickers, Bloomberg
DBSV KL Construction DBSV KL Construction DBSV KL Construction DBSV KL Construction –––– P/BVP/BVP/BVP/BV trading rangestrading rangestrading rangestrading ranges
-2SD
-1SD
Mean
+1SD
+2SD
0.6
0.8
1.0
1.2
1.4
1.6
1.8
2.0
2-Jan-09
2-Jul-09
2-Jan-10
2-Jul-10
2-Jan-11
2-Jul-11
2-Jan-12
2-Jul-12
2-Jan-13
2-Jul-13
2-Jan-14
2-Jul-14
2-Jan-15
2-Jul-15
2-Jan-16
PBV (x)
Source: DBS Vickers, Bloomberg Finance L.P
Our construction universe is now trading at 1-year forward PE
of 15x and P/BV of 1.7x. This is roughly at mean to +1SD
levels.
The sector also commanded premium valuations during periods
of more aggressive contract flows and pump-priming such as
the 9MP and 10MP. During the onset of the 10MP in 2011,
the sector traded to a high of >+2SD above mean or 23x PE
and 3.3x P/NTA. But it subsequently derated to -1SD in late
2011 due to an overall soft equity market. Similarly from
January 2007 to September 2008, when the 9MP projects
were rolled out, the sector traded at up to 24x PE and 2.2x
P/NTA.
Moving to the start of the 11MP, we believe there is a
probability that the sector will command higher valuations
given it is at just mean to +1SD valuations. But we think this
need to be also balanced by Malaysia’s less-than-favourable
fiscal position given still low oil and CPO prices. In 2015, we
already saw the appointment of PDP roles for key projects like
MRT Line 2, LRT 3, Penang Transport Master Plan and KL 118,
and a slew of projects for RAPID and TRX. We think the timely
rollout and award of these projects and stronger earnings
delivery will see further valuation expansion.
Industry Focus
Malaysian Construction
Page 22
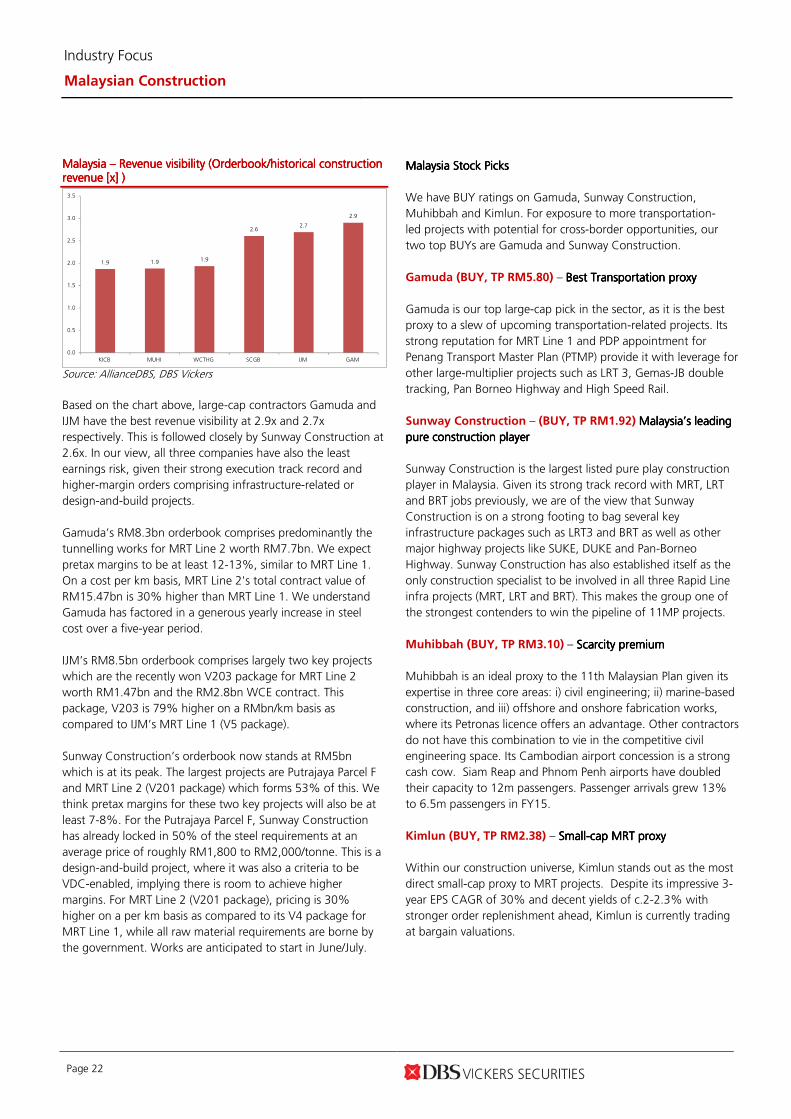
Malaysia Malaysia Malaysia Malaysia –––– Revenue visibility (Orderbook/historical constructioRevenue visibility (Orderbook/historical constructioRevenue visibility (Orderbook/historical constructioRevenue visibility (Orderbook/historical constructionnnn revenue revenue revenue revenue [[[[xxxx]]]] ))))
1.9 1.9 1.9
2.62.7
2.9
0.0
0.5
1.0
1.5
2.0
2.5
3.0
3.5
KICB MUHI WCTHG SCGB IJM GAM
Source: AllianceDBS, DBS Vickers
Based on the chart above, large-cap contractors Gamuda and
IJM have the best revenue visibility at 2.9x and 2.7x
respectively. This is followed closely by Sunway Construction at
2.6x. In our view, all three companies have also the least
earnings risk, given their strong execution track record and
higher-margin orders comprising infrastructure-related or
design-and-build projects.
Gamuda’s RM8.3bn orderbook comprises predominantly the
tunnelling works for MRT Line 2 worth RM7.7bn. We expect
pretax margins to be at least 12-13%, similar to MRT Line 1.
On a cost per km basis, MRT Line 2's total contract value of
RM15.47bn is 30% higher than MRT Line 1. We understand
Gamuda has factored in a generous yearly increase in steel
cost over a five-year period.
IJM’s RM8.5bn orderbook comprises largely two key projects
which are the recently won V203 package for MRT Line 2
worth RM1.47bn and the RM2.8bn WCE contract. This
package, V203 is 79% higher on a RMbn/km basis as
compared to IJM’s MRT Line 1 (V5 package).
Sunway Construction’s orderbook now stands at RM5bn
which is at its peak. The largest projects are Putrajaya Parcel F
and MRT Line 2 (V201 package) which forms 53% of this. We
think pretax margins for these two key projects will also be at
least 7-8%. For the Putrajaya Parcel F, Sunway Construction
has already locked in 50% of the steel requirements at an
average price of roughly RM1,800 to RM2,000/tonne. This is a
design-and-build project, where it was also a criteria to be
VDC-enabled, implying there is room to achieve higher
margins. For MRT Line 2 (V201 package), pricing is 30%
higher on a per km basis as compared to its V4 package for
MRT Line 1, while all raw material requirements are borne by
the government. Works are anticipated to start in June/July.
Malaysia Stock PicksMalaysia Stock PicksMalaysia Stock PicksMalaysia Stock Picks
We have BUY ratings on Gamuda, Sunway Construction,
Muhibbah and Kimlun. For exposure to more transportation-
led projects with potential for cross-border opportunities, our
two top BUYs are Gamuda and Sunway Construction.
Gamuda (BUY, TP RM5.80) – Best Transportation proxyBest Transportation proxyBest Transportation proxyBest Transportation proxy
Gamuda is our top large-cap pick in the sector, as it is the best
proxy to a slew of upcoming transportation-related projects. Its
strong reputation for MRT Line 1 and PDP appointment for
Penang Transport Master Plan (PTMP) provide it with leverage for
other large-multiplier projects such as LRT 3, Gemas-JB double
tracking, Pan Borneo Highway and High Speed Rail.
Sunway Construction – (BUY, TP RM1.92) Malaysia’s leading Malaysia’s leading Malaysia’s leading Malaysia’s leading
pure construction playerpure construction playerpure construction playerpure construction player
Sunway Construction is the largest listed pure play construction
player in Malaysia. Given its strong track record with MRT, LRT
and BRT jobs previously, we are of the view that Sunway
Construction is on a strong footing to bag several key
infrastructure packages such as LRT3 and BRT as well as other
major highway projects like SUKE, DUKE and Pan-Borneo
Highway. Sunway Construction has also established itself as the
only construction specialist to be involved in all three Rapid Line
infra projects (MRT, LRT and BRT). This makes the group one of
the strongest contenders to win the pipeline of 11MP projects.
Muhibbah (BUY, TP RM3.10) – Scarcity premiumScarcity premiumScarcity premiumScarcity premium
Muhibbah is an ideal proxy to the 11th Malaysian Plan given its
expertise in three core areas: i) civil engineering; ii) marine-based
construction, and iii) offshore and onshore fabrication works,
where its Petronas licence offers an advantage. Other contractors
do not have this combination to vie in the competitive civil
engineering space. Its Cambodian airport concession is a strong
cash cow. Siam Reap and Phnom Penh airports have doubled
their capacity to 12m passengers. Passenger arrivals grew 13%
to 6.5m passengers in FY15.
Kimlun (BUY, TP RM2.38) – SmallSmallSmallSmall----cap MRT proxycap MRT proxycap MRT proxycap MRT proxy
Within our construction universe, Kimlun stands out as the most
direct small-cap proxy to MRT projects. Despite its impressive 3-
year EPS CAGR of 30% and decent yields of c.2-2.3% with
stronger order replenishment ahead, Kimlun is currently trading
at bargain valuations.
Industry Focus
Malaysian Construction
Page 23
Malaysia - Public sector to drive growth
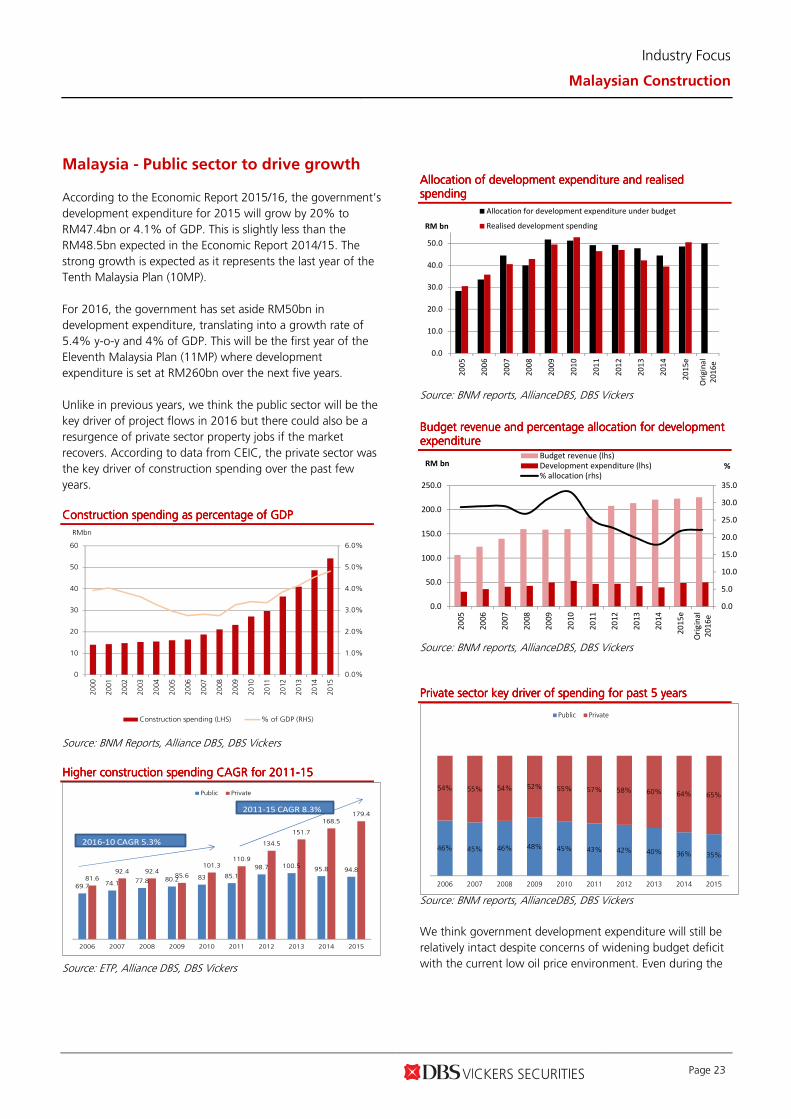
According to the Economic Report 2015/16, the government’s
development expenditure for 2015 will grow by 20% to
RM47.4bn or 4.1% of GDP. This is slightly less than the
RM48.5bn expected in the Economic Report 2014/15. The
strong growth is expected as it represents the last year of the
Tenth Malaysia Plan (10MP).
For 2016, the government has set aside RM50bn in
development expenditure, translating into a growth rate of
5.4% y-o-y and 4% of GDP. This will be the first year of the
Eleventh Malaysia Plan (11MP) where development
expenditure is set at RM260bn over the next five years.
Unlike in previous years, we think the public sector will be the
key driver of project flows in 2016 but there could also be a
resurgence of private sector property jobs if the market
recovers. According to data from CEIC, the private sector was
the key driver of construction spending over the past few
years.
Construction spending as percentage of GDPConstruction spending as percentage of GDPConstruction spending as percentage of GDPConstruction spending as percentage of GDP
0.0%
1.0%
2.0%
3.0%
4.0%
5.0%
6.0%
0
10
20
30
40
50
60
2000
2001
2002
2003
2004
2005
2006
2007
2008
2009
2010
2011
2012
2013
2014
2015
RMbn
Construction spending (LHS) % of GDP (RHS)
Source: BNM Reports, Alliance DBS, DBS Vickers
Higher construction spending CAGRHigher construction spending CAGRHigher construction spending CAGRHigher construction spending CAGR for 2011for 2011for 2011for 2011----15151515
69.7 74.1 77.8 80.2 83 85.1
98.7 100.595.8 94.8
81.692.4 92.4
85.6
101.3110.9
134.5
151.7
168.5179.4
2006 2007 2008 2009 2010 2011 2012 2013 2014 2015
Public Private
2016-10 CAGR 5.3%
2011-15 CAGR 8.3%
Source: ETP, Alliance DBS, DBS Vickers
Allocation of development expenditure and realised Allocation of development expenditure and realised Allocation of development expenditure and realised Allocation of development expenditure and realised spendingspendingspendingspending
0.0
10.0
20.0
30.0
40.0
50.0
20
05
20
06
20
07
20
08
20
09
20
10
20
11
20
12
20
13
20
14
20
15
e
Ori
gin
al
20
16
e
RM bn
Allocation for development expenditure under budget
Realised development spending
Source: BNM reports, AllianceDBS, DBS Vickers
Budget revenue and Budget revenue and Budget revenue and Budget revenue and percenpercenpercenpercentagetagetagetage allocation for development allocation for development allocation for development allocation for development expenditureexpenditureexpenditureexpenditure
0.0
5.0
10.0
15.0
20.0
25.0
30.0
35.0
0.0
50.0
100.0
150.0
200.0
250.0
20
05
20
06
20
07
20
08
20
09
20
10
20
11
20
12
20
13
20
14
20
15
e
Ori
gin
al
20
16
e
%RM bn
Budget revenue (lhs)
Development expenditure (lhs)
% allocation (rhs)
Source: BNM reports, AllianceDBS, DBS Vickers
Private sector key driver of spending for past 5 yearsPrivate sector key driver of spending for past 5 yearsPrivate sector key driver of spending for past 5 yearsPrivate sector key driver of spending for past 5 years
46% 45% 46% 48% 45% 43% 42% 40% 36% 35%
54% 55% 54% 52% 55% 57% 58% 60% 64% 65%
2006 2007 2008 2009 2010 2011 2012 2013 2014 2015
Public Private
Source: BNM reports, AllianceDBS, DBS Vickers
We think government development expenditure will still be
relatively intact despite concerns of widening budget deficit
with the current low oil price environment. Even during the
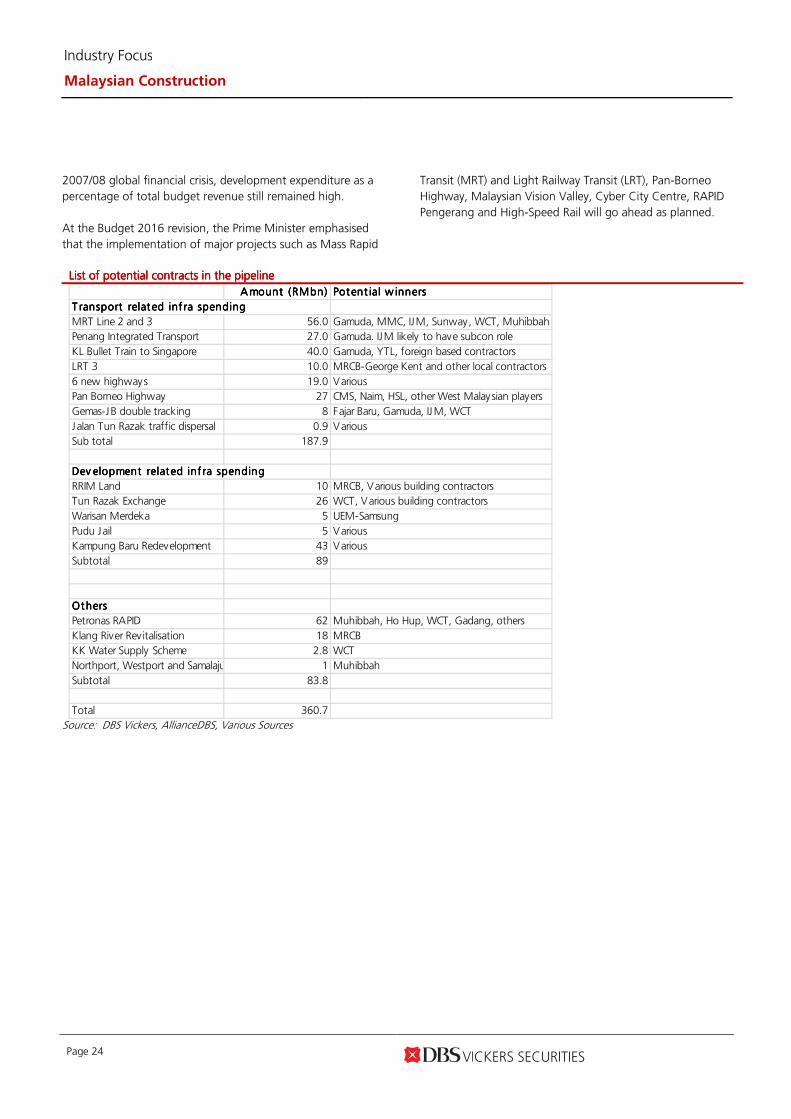
Industry Focus
Malaysian Construction
Page 24
2007/08 global financial crisis, development expenditure as a
percentage of total budget revenue still remained high.
At the Budget 2016 revision, the Prime Minister emphasised
that the implementation of major projects such as Mass Rapid
Transit (MRT) and Light Railway Transit (LRT), Pan-Borneo
Highway, Malaysian Vision Valley, Cyber City Centre, RAPID
Pengerang and High-Speed Rail will go ahead as planned.
List of potential contracts in the pipeline List of potential contracts in the pipeline List of potential contracts in the pipeline List of potential contracts in the pipeline
Amount (RMbn)Amount (RMbn)Amount (RMbn)Amount (RMbn) Potent ial w innersPotent ial w innersPotent ial w innersPotent ial w inners
T ransport relat ed inf ra spendingT ransport relat ed inf ra spendingT ransport relat ed inf ra spendingT ransport relat ed inf ra spending
MRT Line 2 and 3 56.0 Gamuda, MMC, IJM, Sunway, WCT, Muhibbah
Penang Integrated Transport 27.0 Gamuda. IJM likely to have subcon role
KL Bullet Train to Singapore 40.0 Gamuda, YTL, foreign based contractors
LRT 3 10.0 MRCB-George Kent and other local contractors
6 new highways 19.0 Various
Pan Borneo Highway 27 CMS, Naim, HSL, other West Malaysian players
Gemas-JB double tracking 8 Fajar Baru, Gamuda, IJM, WCT
Jalan Tun Razak traffic dispersal 0.9 Various
Sub total 187.9
Dev elopment related inf ra spendingDev elopment related inf ra spendingDev elopment related inf ra spendingDev elopment related inf ra spending
RRIM Land 10 MRCB, Various building contractors
Tun Razak Exchange 26 WCT, Various building contractors
Warisan Merdeka 5 UEM-Samsung
Pudu Jail 5 Various
Kampung Baru Redevelopment 43 Various
Subtotal 89
OthersOthersOthersOthers
Petronas RAPID 62 Muhibbah, Ho Hup, WCT, Gadang, others
Klang River Revitalisation 18 MRCB
KK Water Supply Scheme 2.8 WCT
Northport, Westport and Samalaju Port 1 Muhibbah
Subtotal 83.8
Total 360.7 Source: DBS Vickers, AllianceDBS, Various Sources

Industry Focus
Malaysian Construction
Page 25
AppendixAppendixAppendixAppendix: Company Guides: Company Guides: Company Guides: Company Guides
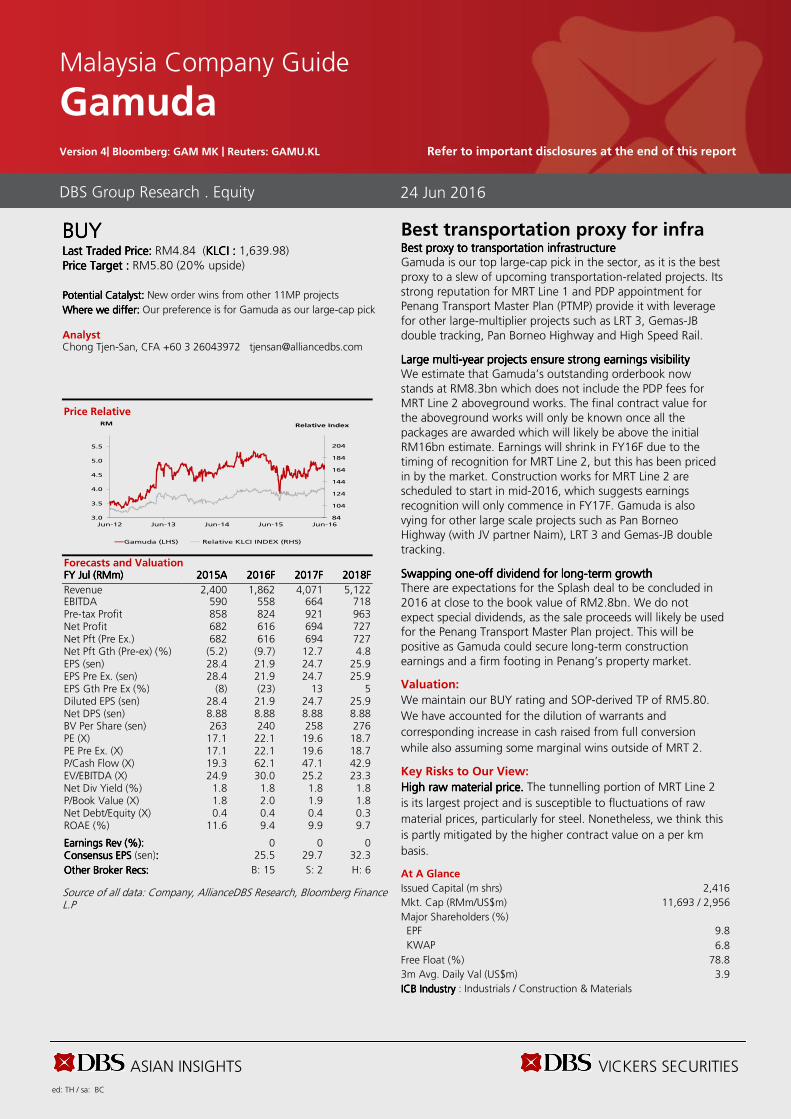
ASIAN INSIGHTS VICKERS SECURITIES ed: TH / sa: BC
BUYBUYBUYBUY Last Traded Price: Last Traded Price: Last Traded Price: Last Traded Price: RM4.84 (KLCIKLCIKLCIKLCI : : : : 1,639.98) Price Target :Price Target :Price Target :Price Target : RM5.80 (20% upside)
Potential Catalyst: Potential Catalyst: Potential Catalyst: Potential Catalyst: New order wins from other 11MP projects
Where we differWhere we differWhere we differWhere we differ:::: Our preference is for Gamuda as our large-cap pick Analyst Chong Tjen-San, CFA +60 3 26043972 [email protected]
Price Relative
Forecasts and Valuation FY FY FY FY JulJulJulJul ((((RMRMRMRMmmmm) ) ) ) 2015201520152015AAAA 2016201620162016FFFF 2017201720172017FFFF 2018201820182018FFFF
Revenue 2,400 1,862 4,071 5,122 EBITDA 590 558 664 718 Pre-tax Profit 858 824 921 963 Net Profit 682 616 694 727 Net Pft (Pre Ex.) 682 616 694 727 Net Pft Gth (Pre-ex) (%) (5.2) (9.7) 12.7 4.8 EPS (sen) 28.4 21.9 24.7 25.9 EPS Pre Ex. (sen) 28.4 21.9 24.7 25.9 EPS Gth Pre Ex (%) (8) (23) 13 5 Diluted EPS (sen) 28.4 21.9 24.7 25.9 Net DPS (sen) 8.88 8.88 8.88 8.88 BV Per Share (sen) 263 240 258 276 PE (X) 17.1 22.1 19.6 18.7 PE Pre Ex. (X) 17.1 22.1 19.6 18.7 P/Cash Flow (X) 19.3 62.1 47.1 42.9 EV/EBITDA (X) 24.9 30.0 25.2 23.3 Net Div Yield (%) 1.8 1.8 1.8 1.8 P/Book Value (X) 1.8 2.0 1.9 1.8 Net Debt/Equity (X) 0.4 0.4 0.4 0.3 ROAE (%) 11.6 9.4 9.9 9.7 Earnings Rev (%):Earnings Rev (%):Earnings Rev (%):Earnings Rev (%): 0 0 0 Consensus EPS Consensus EPS Consensus EPS Consensus EPS (sen):::: 25.5 29.7 32.3
Other Broker Recs:Other Broker Recs:Other Broker Recs:Other Broker Recs: B: 15 S: 2 H: 6
Source of all data: Company, AllianceDBS Research, Bloomberg Finance L.P
Best transportation proxy for infra Best proxy to transportation infrastructureBest proxy to transportation infrastructureBest proxy to transportation infrastructureBest proxy to transportation infrastructure Gamuda is our top large-cap pick in the sector, as it is the best proxy to a slew of upcoming transportation-related projects. Its strong reputation for MRT Line 1 and PDP appointment for Penang Transport Master Plan (PTMP) provide it with leverage for other large-multiplier projects such as LRT 3, Gemas-JB double tracking, Pan Borneo Highway and High Speed Rail.
Large multiLarge multiLarge multiLarge multi----year projects ensure strong earnings visibilityyear projects ensure strong earnings visibilityyear projects ensure strong earnings visibilityyear projects ensure strong earnings visibility We estimate that Gamuda’s outstanding orderbook now stands at RM8.3bn which does not include the PDP fees for MRT Line 2 aboveground works. The final contract value for the aboveground works will only be known once all the packages are awarded which will likely be above the initial RM16bn estimate. Earnings will shrink in FY16F due to the timing of recognition for MRT Line 2, but this has been priced in by the market. Construction works for MRT Line 2 are scheduled to start in mid-2016, which suggests earnings recognition will only commence in FY17F. Gamuda is also vying for other large scale projects such as Pan Borneo Highway (with JV partner Naim), LRT 3 and Gemas-JB double tracking.
Swapping oneSwapping oneSwapping oneSwapping one----off dividend for longoff dividend for longoff dividend for longoff dividend for long----term growthterm growthterm growthterm growth There are expectations for the Splash deal to be concluded in 2016 at close to the book value of RM2.8bn. We do not expect special dividends, as the sale proceeds will likely be used for the Penang Transport Master Plan project. This will be positive as Gamuda could secure long-term construction earnings and a firm footing in Penang’s property market.
Valuation:
We maintain our BUY rating and SOP-derived TP of RM5.80.
We have accounted for the dilution of warrants and
corresponding increase in cash raised from full conversion
while also assuming some marginal wins outside of MRT 2.
Key Risks to Our View:
High raw material price.High raw material price.High raw material price.High raw material price. The tunnelling portion of MRT Line 2
is its largest project and is susceptible to fluctuations of raw
material prices, particularly for steel. Nonetheless, we think this
is partly mitigated by the higher contract value on a per km
basis.
At A Glance Issued Capital (m shrs) 2,416
Mkt. Cap (RMm/US$m) 11,693 / 2,956
Major Shareholders (%)
EPF 9.8
KWAP 6.8
Free Float (%) 78.8
3m Avg. Daily Val (US$m) 3.9
ICB IndustryICB IndustryICB IndustryICB Industry : Industrials / Construction & Materials
DBS Group Research . Equity
24 Jun 2016
Malaysia Company Guide
Gamuda Version 4| Bloomberg: GAM MK | Reuters: GAMU.KL Refer to important disclosures at the end of this report
84
104
124
144
164
184
204
3.0
3.5
4.0
4.5
5.0
5.5
Jun-12 Jun-13 Jun-14 Jun-15 Jun-16
Relative IndexRM
Gamuda (LHS) Relative KLCI INDEX (RHS)
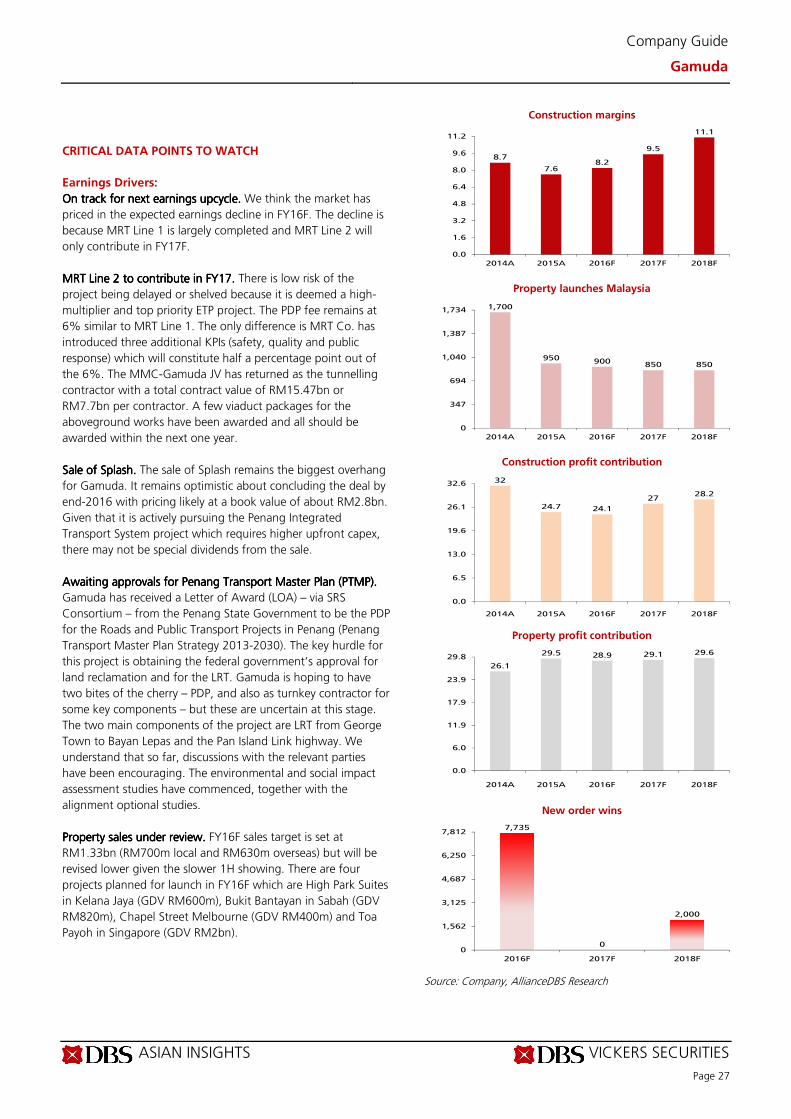
ASIAN INSIGHTS VICKERS SECURITIES
Page 27
Company Guide
Gamuda
CRITICAL DATA POINTS TO WATCH
Earnings Drivers:
On track for next earnings upcycle.On track for next earnings upcycle.On track for next earnings upcycle.On track for next earnings upcycle. We think the market has
priced in the expected earnings decline in FY16F. The decline is
because MRT Line 1 is largely completed and MRT Line 2 will
only contribute in FY17F.
MRT Line 2 to contribute in FY17.MRT Line 2 to contribute in FY17.MRT Line 2 to contribute in FY17.MRT Line 2 to contribute in FY17. There is low risk of the
project being delayed or shelved because it is deemed a high-
multiplier and top priority ETP project. The PDP fee remains at
6% similar to MRT Line 1. The only difference is MRT Co. has
introduced three additional KPIs (safety, quality and public
response) which will constitute half a percentage point out of
the 6%. The MMC-Gamuda JV has returned as the tunnelling
contractor with a total contract value of RM15.47bn or
RM7.7bn per contractor. A few viaduct packages for the
aboveground works have been awarded and all should be
awarded within the next one year.
Sale of Splash.Sale of Splash.Sale of Splash.Sale of Splash. The sale of Splash remains the biggest overhang
for Gamuda. It remains optimistic about concluding the deal by
end-2016 with pricing likely at a book value of about RM2.8bn.
Given that it is actively pursuing the Penang Integrated
Transport System project which requires higher upfront capex,
there may not be special dividends from the sale.
Awaiting approvals for Penang Transport Master Plan (PTMP).Awaiting approvals for Penang Transport Master Plan (PTMP).Awaiting approvals for Penang Transport Master Plan (PTMP).Awaiting approvals for Penang Transport Master Plan (PTMP).
Gamuda has received a Letter of Award (LOA) – via SRS
Consortium – from the Penang State Government to be the PDP
for the Roads and Public Transport Projects in Penang (Penang
Transport Master Plan Strategy 2013-2030). The key hurdle for
this project is obtaining the federal government’s approval for
land reclamation and for the LRT. Gamuda is hoping to have
two bites of the cherry – PDP, and also as turnkey contractor for
some key components – but these are uncertain at this stage.
The two main components of the project are LRT from George
Town to Bayan Lepas and the Pan Island Link highway. We
understand that so far, discussions with the relevant parties
have been encouraging. The environmental and social impact
assessment studies have commenced, together with the
alignment optional studies.
Property sales under review.Property sales under review.Property sales under review.Property sales under review. FY16F sales target is set at
RM1.33bn (RM700m local and RM630m overseas) but will be
revised lower given the slower 1H showing. There are four
projects planned for launch in FY16F which are High Park Suites
in Kelana Jaya (GDV RM600m), Bukit Bantayan in Sabah (GDV
RM820m), Chapel Street Melbourne (GDV RM400m) and Toa
Payoh in Singapore (GDV RM2bn).
Construction margins
Property launches Malaysia
Construction profit contribution
Property profit contribution
New order wins
Source: Company, AllianceDBS Research
8.7
7.68.2
9.5
11.1
0.0
1.6
3.2
4.8
6.4
8.0
9.6
11.2
2014A 2015A 2016F 2017F 2018F
1,700
950 900 850 850
0
347
694
1,040
1,387
1,734
2014A 2015A 2016F 2017F 2018F
32
24.7 24.1
2728.2
0.0
6.5
13.0
19.6
26.1
32.6
2014A 2015A 2016F 2017F 2018F
26.1
29.5 28.9 29.1 29.6
0.0
6.0
11.9
17.9
23.9
29.8
2014A 2015A 2016F 2017F 2018F
7,735
0
2,000
0
1,562
3,125
4,687
6,250
7,812
2016F 2017F 2018F
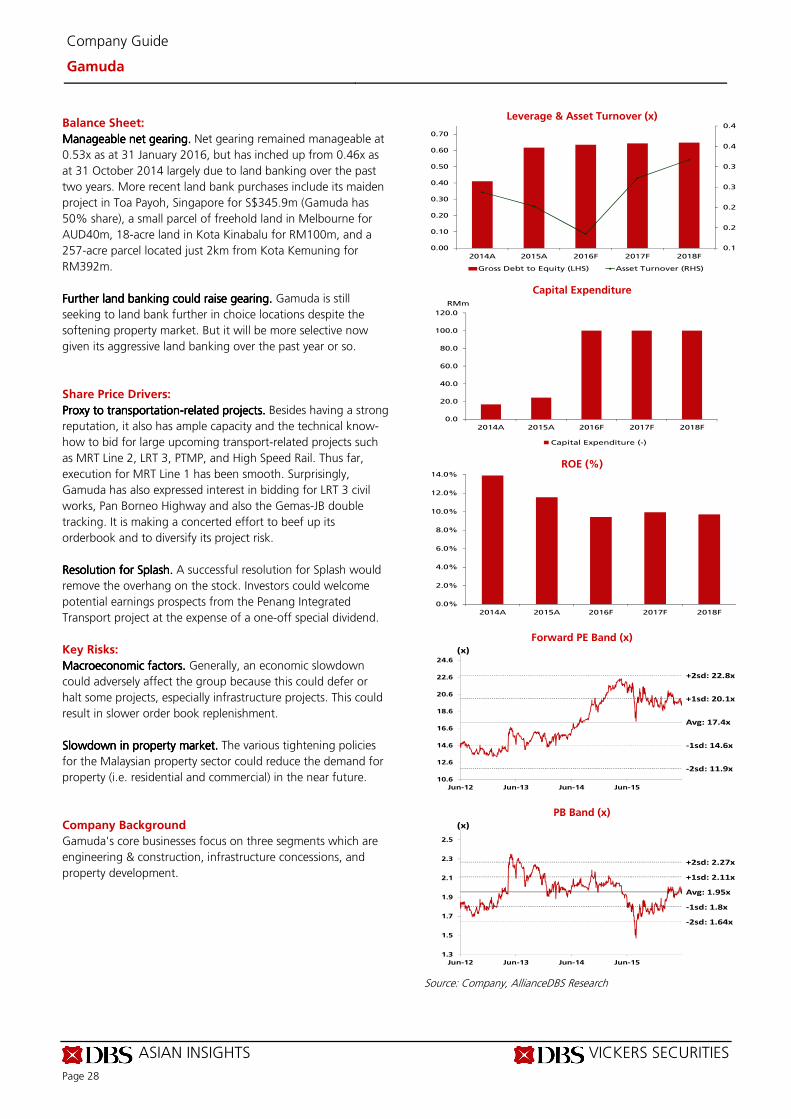
ASIAN INSIGHTS VICKERS SECURITIES
Page 28
Company Guide
Gamuda
Balance Sheet:
Manageable net gearing.Manageable net gearing.Manageable net gearing.Manageable net gearing. Net gearing remained manageable at
0.53x as at 31 January 2016, but has inched up from 0.46x as
at 31 October 2014 largely due to land banking over the past
two years. More recent land bank purchases include its maiden
project in Toa Payoh, Singapore for S$345.9m (Gamuda has
50% share), a small parcel of freehold land in Melbourne for
AUD40m, 18-acre land in Kota Kinabalu for RM100m, and a
257-acre parcel located just 2km from Kota Kemuning for
RM392m.
Further land banking could raise gearing.Further land banking could raise gearing.Further land banking could raise gearing.Further land banking could raise gearing. Gamuda is still
seeking to land bank further in choice locations despite the
softening property market. But it will be more selective now
given its aggressive land banking over the past year or so.
Share Price Drivers:
Proxy to Proxy to Proxy to Proxy to transportationtransportationtransportationtransportation----related projects. related projects. related projects. related projects. Besides having a strong
reputation, it also has ample capacity and the technical know-
how to bid for large upcoming transport-related projects such
as MRT Line 2, LRT 3, PTMP, and High Speed Rail. Thus far,
execution for MRT Line 1 has been smooth. Surprisingly,
Gamuda has also expressed interest in bidding for LRT 3 civil
works, Pan Borneo Highway and also the Gemas-JB double
tracking. It is making a concerted effort to beef up its
orderbook and to diversify its project risk.
Resolution for Splash.Resolution for Splash.Resolution for Splash.Resolution for Splash. A successful resolution for Splash would
remove the overhang on the stock. Investors could welcome
potential earnings prospects from the Penang Integrated
Transport project at the expense of a one-off special dividend.
Key Risks:
Macroeconomic factors. Macroeconomic factors. Macroeconomic factors. Macroeconomic factors. Generally, an economic slowdown
could adversely affect the group because this could defer or
halt some projects, especially infrastructure projects. This could
result in slower order book replenishment.
Slowdown in propertSlowdown in propertSlowdown in propertSlowdown in property market. y market. y market. y market. The various tightening policies
for the Malaysian property sector could reduce the demand for
property (i.e. residential and commercial) in the near future.
Company Background
Gamuda's core businesses focus on three segments which are
engineering & construction, infrastructure concessions, and
property development.
Leverage & Asset Turnover (x)
Capital Expenditure
ROE (%)
Forward PE Band (x)
PB Band (x)
Source: Company, AllianceDBS Research
0.1
0.2
0.2
0.3
0.3
0.4
0.4
0.00
0.10
0.20
0.30
0.40
0.50
0.60
0.70
2014A 2015A 2016F 2017F 2018F
Gross Debt to Equity (LHS) Asset Turnover (RHS)
0.0
20.0
40.0
60.0
80.0
100.0
120.0
2014A 2015A 2016F 2017F 2018F
Capital Expenditure (-)
RMm
0.0%
2.0%
4.0%
6.0%
8.0%
10.0%
12.0%
14.0%
2014A 2015A 2016F 2017F 2018F
Avg: 17.4x
+1sd: 20.1x
+2sd: 22.8x
-1sd: 14.6x
-2sd: 11.9x
10.6
12.6
14.6
16.6
18.6
20.6
22.6
24.6
Jun-12 Jun-13 Jun-14 Jun-15
(x)
Avg: 1.95x
+1sd: 2.11x
+2sd: 2.27x
-1sd: 1.8x
-2sd: 1.64x
1.3
1.5
1.7
1.9
2.1
2.3
2.5
Jun-12 Jun-13 Jun-14 Jun-15
(x)
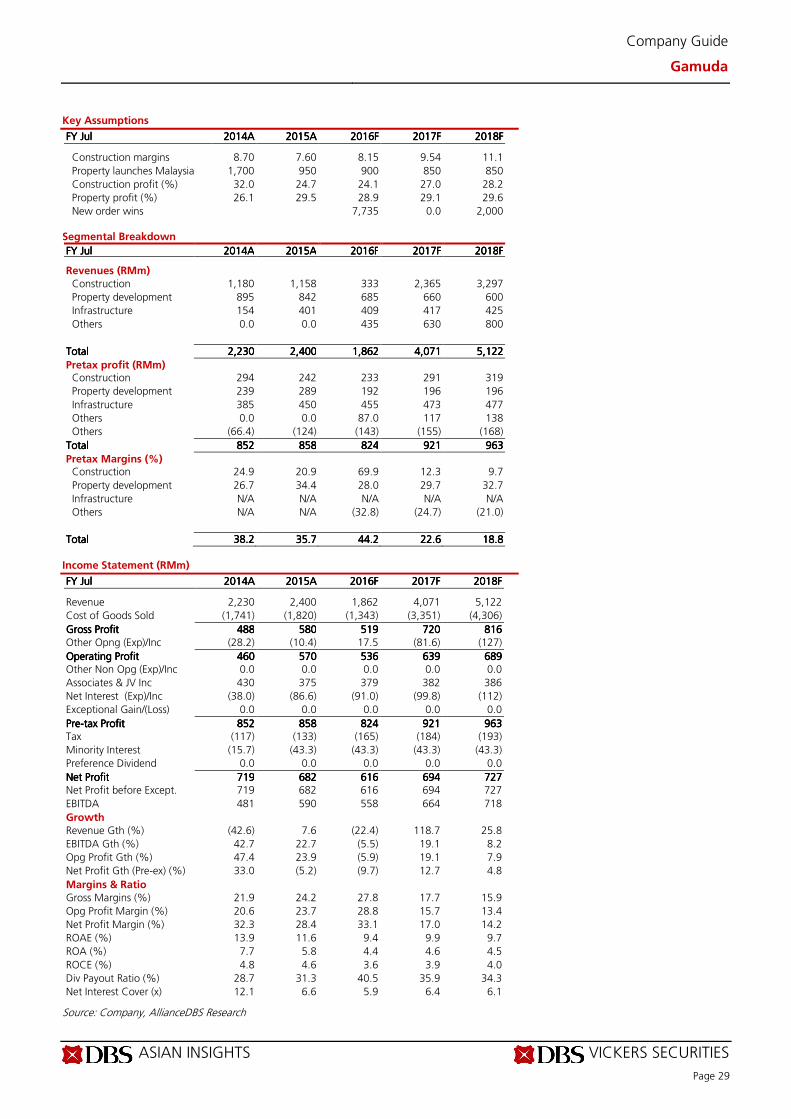
ASIAN INSIGHTS VICKERS SECURITIES
Page 29
Company Guide
Gamuda
Key Assumptions
FY FY FY FY JulJulJulJul 2014201420142014AAAA 2015201520152015AAAA 2016201620162016FFFF 2017201720172017FFFF 2018201820182018FFFF
Construction margins 8.70 7.60 8.15 9.54 11.1
Property launches Malaysia 1,700 950 900 850 850
Construction profit (%) 32.0 24.7 24.1 27.0 28.2
Property profit (%) 26.1 29.5 28.9 29.1 29.6
New order wins 7,735 0.0 2,000 Segmental Breakdown
FY FY FY FY JulJulJulJul 2014201420142014AAAA 2015201520152015AAAA 2016201620162016FFFF 2017201720172017FFFF 2018201820182018FFFF Revenues (RMm)
Construction 1,180 1,158 333 2,365 3,297
Property development 895 842 685 660 600
Infrastructure 154 401 409 417 425
Others 0.0 0.0 435 630 800
TotalTotalTotalTotal 2,2302,2302,2302,230 2,4002,4002,4002,400 1,8621,8621,8621,862 4,0714,0714,0714,071 5,1225,1225,1225,122
Pretax profit (RMm) Construction 294 242 233 291 319
Property development 239 289 192 196 196
Infrastructure 385 450 455 473 477
Others 0.0 0.0 87.0 117 138
Others (66.4) (124) (143) (155) (168)
TotalTotalTotalTotal 852852852852 858858858858 824824824824 921921921921 963963963963
Pretax Margins (%) Construction 24.9 20.9 69.9 12.3 9.7
Property development 26.7 34.4 28.0 29.7 32.7
Infrastructure N/A N/A N/A N/A N/A
Others N/A N/A (32.8) (24.7) (21.0)
TotalTotalTotalTotal 38.238.238.238.2 35.735.735.735.7 44.244.244.244.2 22.622.622.622.6 18.818.818.818.8
Income Statement (RMm)
FY FY FY FY JulJulJulJul 2014201420142014AAAA 2015201520152015AAAA 2016201620162016FFFF 2017201720172017FFFF 2018201820182018FFFF Revenue 2,230 2,400 1,862 4,071 5,122
Cost of Goods Sold (1,741) (1,820) (1,343) (3,351) (4,306)
Gross ProfitGross ProfitGross ProfitGross Profit 488488488488 580580580580 519519519519 720720720720 816816816816
Other Opng (Exp)/Inc (28.2) (10.4) 17.5 (81.6) (127)
Operating ProfitOperating ProfitOperating ProfitOperating Profit 460460460460 570570570570 536536536536 639639639639 689689689689 Other Non Opg (Exp)/Inc 0.0 0.0 0.0 0.0 0.0
Associates & JV Inc 430 375 379 382 386
Net Interest (Exp)/Inc (38.0) (86.6) (91.0) (99.8) (112)
Exceptional Gain/(Loss) 0.0 0.0 0.0 0.0 0.0
PrePrePrePre----tax Profittax Profittax Profittax Profit 852852852852 858858858858 824824824824 921921921921 963963963963 Tax (117) (133) (165) (184) (193)
Minority Interest (15.7) (43.3) (43.3) (43.3) (43.3)
Preference Dividend 0.0 0.0 0.0 0.0 0.0
Net ProfitNet ProfitNet ProfitNet Profit 719719719719 682682682682 616616616616 694694694694 727727727727 Net Profit before Except. 719 682 616 694 727
EBITDA 481 590 558 664 718
Growth
Revenue Gth (%) (42.6) 7.6 (22.4) 118.7 25.8
EBITDA Gth (%) 42.7 22.7 (5.5) 19.1 8.2
Opg Profit Gth (%) 47.4 23.9 (5.9) 19.1 7.9
Net Profit Gth (Pre-ex) (%) 33.0 (5.2) (9.7) 12.7 4.8
Margins & Ratio
Gross Margins (%) 21.9 24.2 27.8 17.7 15.9
Opg Profit Margin (%) 20.6 23.7 28.8 15.7 13.4
Net Profit Margin (%) 32.3 28.4 33.1 17.0 14.2
ROAE (%) 13.9 11.6 9.4 9.9 9.7
ROA (%) 7.7 5.8 4.4 4.6 4.5
ROCE (%) 4.8 4.6 3.6 3.9 4.0
Div Payout Ratio (%) 28.7 31.3 40.5 35.9 34.3
Net Interest Cover (x) 12.1 6.6 5.9 6.4 6.1
Source: Company, AllianceDBS Research
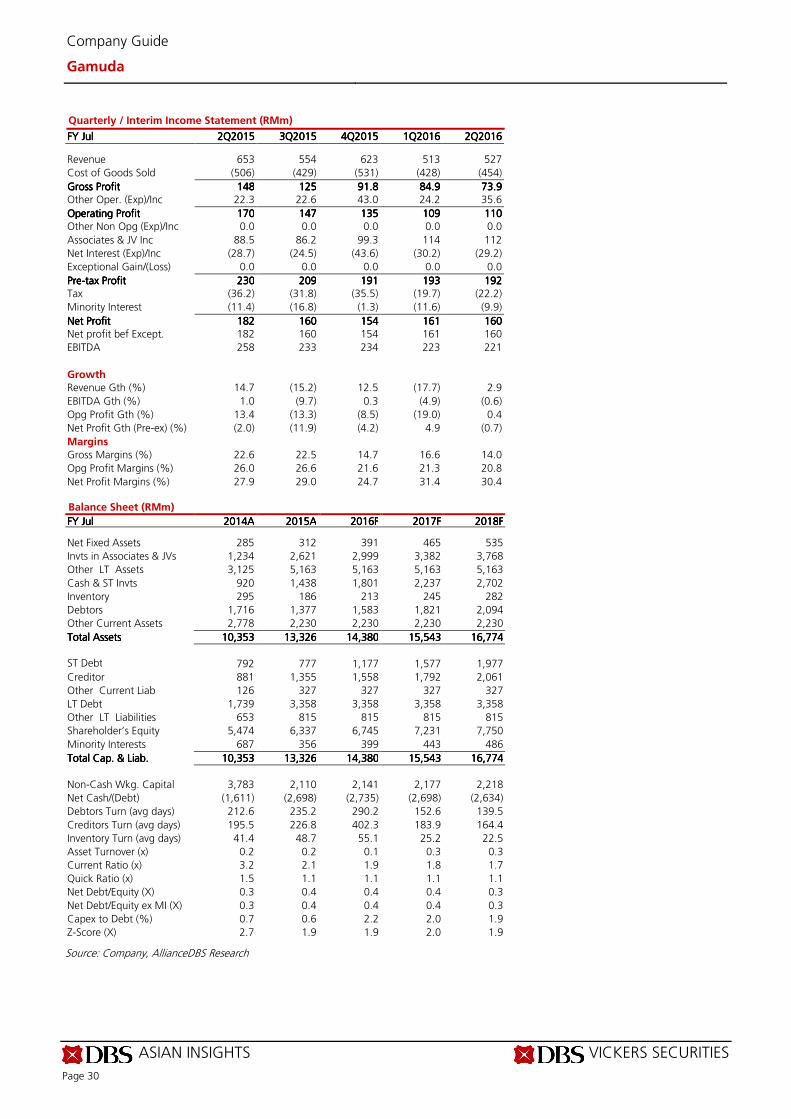
ASIAN INSIGHTS VICKERS SECURITIES
Page 30
Company Guide
Gamuda
Quarterly / Interim Income Statement (RMm)
FY FY FY FY JulJulJulJul 2Q2Q2Q2Q2015201520152015 3Q3Q3Q3Q2015201520152015 4Q4Q4Q4Q2015201520152015 1Q1Q1Q1Q2016201620162016 2Q2Q2Q2Q2016201620162016 Revenue 653 554 623 513 527
Cost of Goods Sold (506) (429) (531) (428) (454)
Gross ProfitGross ProfitGross ProfitGross Profit 148148148148 125125125125 91.891.891.891.8 84.984.984.984.9 73.973.973.973.9 Other Oper. (Exp)/Inc 22.3 22.6 43.0 24.2 35.6
Operating ProfitOperating ProfitOperating ProfitOperating Profit 170170170170 147147147147 135135135135 109109109109 110110110110 Other Non Opg (Exp)/Inc 0.0 0.0 0.0 0.0 0.0
Associates & JV Inc 88.5 86.2 99.3 114 112
Net Interest (Exp)/Inc (28.7) (24.5) (43.6) (30.2) (29.2)
Exceptional Gain/(Loss) 0.0 0.0 0.0 0.0 0.0
PrePrePrePre----tax Profittax Profittax Profittax Profit 230230230230 209209209209 191191191191 193193193193 192192192192 Tax (36.2) (31.8) (35.5) (19.7) (22.2)
Minority Interest (11.4) (16.8) (1.3) (11.6) (9.9)
Net ProfitNet ProfitNet ProfitNet Profit 182182182182 160160160160 154154154154 161161161161 160160160160 Net profit bef Except. 182 160 154 161 160
EBITDA 258 233 234 223 221
Growth
Revenue Gth (%) 14.7 (15.2) 12.5 (17.7) 2.9
EBITDA Gth (%) 1.0 (9.7) 0.3 (4.9) (0.6)
Opg Profit Gth (%) 13.4 (13.3) (8.5) (19.0) 0.4
Net Profit Gth (Pre-ex) (%) (2.0) (11.9) (4.2) 4.9 (0.7)
Margins
Gross Margins (%) 22.6 22.5 14.7 16.6 14.0
Opg Profit Margins (%) 26.0 26.6 21.6 21.3 20.8
Net Profit Margins (%) 27.9 29.0 24.7 31.4 30.4 Balance Sheet (RMm)
FY FY FY FY JulJulJulJul 2014201420142014AAAA 2015201520152015AAAA 2016201620162016FFFF 2017201720172017FFFF 2018201820182018FFFF Net Fixed Assets 285 312 391 465 535
Invts in Associates & JVs 1,234 2,621 2,999 3,382 3,768
Other LT Assets 3,125 5,163 5,163 5,163 5,163
Cash & ST Invts 920 1,438 1,801 2,237 2,702
Inventory 295 186 213 245 282
Debtors 1,716 1,377 1,583 1,821 2,094
Other Current Assets 2,778 2,230 2,230 2,230 2,230
Total AssetsTotal AssetsTotal AssetsTotal Assets 10,35310,35310,35310,353 13,32613,32613,32613,326 14,38014,38014,38014,380 15,54315,54315,54315,543 16,77416,77416,77416,774
ST Debt
792 777 1,177 1,577 1,977
Creditor 881 1,355 1,558 1,792 2,061
Other Current Liab 126 327 327 327 327
LT Debt 1,739 3,358 3,358 3,358 3,358
Other LT Liabilities 653 815 815 815 815
Shareholder’s Equity 5,474 6,337 6,745 7,231 7,750
Minority Interests 687 356 399 443 486
Total Cap. & Liab.Total Cap. & Liab.Total Cap. & Liab.Total Cap. & Liab. 10,35310,35310,35310,353 13,32613,32613,32613,326 14,38014,38014,38014,380 15,54315,54315,54315,543 16,77416,77416,77416,774
Non-Cash Wkg. Capital 3,783 2,110 2,141 2,177 2,218
Net Cash/(Debt) (1,611) (2,698) (2,735) (2,698) (2,634)
Debtors Turn (avg days) 212.6 235.2 290.2 152.6 139.5
Creditors Turn (avg days) 195.5 226.8 402.3 183.9 164.4
Inventory Turn (avg days) 41.4 48.7 55.1 25.2 22.5
Asset Turnover (x) 0.2 0.2 0.1 0.3 0.3
Current Ratio (x) 3.2 2.1 1.9 1.8 1.7
Quick Ratio (x) 1.5 1.1 1.1 1.1 1.1
Net Debt/Equity (X) 0.3 0.4 0.4 0.4 0.3
Net Debt/Equity ex MI (X) 0.3 0.4 0.4 0.4 0.3
Capex to Debt (%) 0.7 0.6 2.2 2.0 1.9
Z-Score (X) 2.7 1.9 1.9 2.0 1.9
Source: Company, AllianceDBS Research
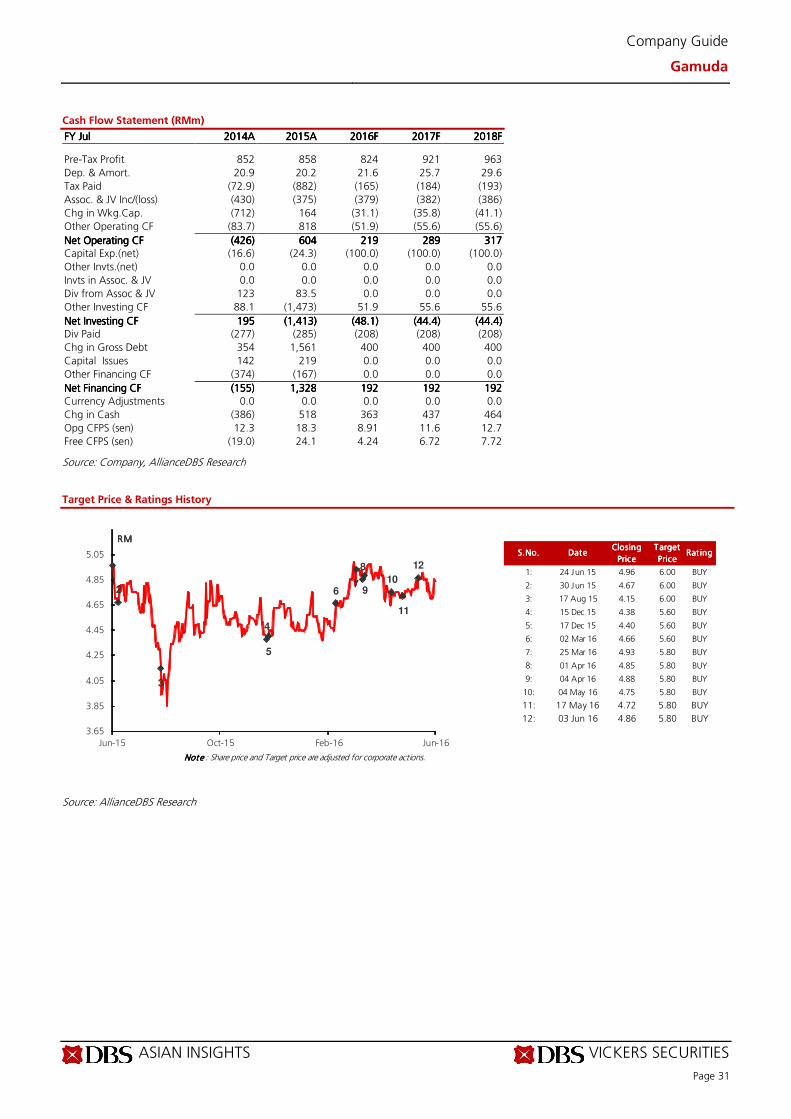
ASIAN INSIGHTS VICKERS SECURITIES
Page 31
Company Guide
Gamuda
Cash Flow Statement (RMm)
FY FY FY FY JulJulJulJul 2014201420142014AAAA 2015201520152015AAAA 2016201620162016FFFF 2017201720172017FFFF 2018201820182018FFFF Pre-Tax Profit 852 858 824 921 963
Dep. & Amort. 20.9 20.2 21.6 25.7 29.6
Tax Paid (72.9) (882) (165) (184) (193)
Assoc. & JV Inc/(loss) (430) (375) (379) (382) (386)
Chg in Wkg.Cap. (712) 164 (31.1) (35.8) (41.1)
Other Operating CF (83.7) 818 (51.9) (55.6) (55.6)
Net Operating CFNet Operating CFNet Operating CFNet Operating CF (426)(426)(426)(426) 604604604604 219219219219 289289289289 317317317317 Capital Exp.(net) (16.6) (24.3) (100.0) (100.0) (100.0)
Other Invts.(net) 0.0 0.0 0.0 0.0 0.0
Invts in Assoc. & JV 0.0 0.0 0.0 0.0 0.0
Div from Assoc & JV 123 83.5 0.0 0.0 0.0
Other Investing CF 88.1 (1,473) 51.9 55.6 55.6
Net Investing CFNet Investing CFNet Investing CFNet Investing CF 195195195195 (1,413)(1,413)(1,413)(1,413) (48.1)(48.1)(48.1)(48.1) (44.4)(44.4)(44.4)(44.4) (44.4)(44.4)(44.4)(44.4) Div Paid (277) (285) (208) (208) (208)
Chg in Gross Debt 354 1,561 400 400 400
Capital Issues 142 219 0.0 0.0 0.0
Other Financing CF (374) (167) 0.0 0.0 0.0
Net Financing CFNet Financing CFNet Financing CFNet Financing CF (155)(155)(155)(155) 1,3281,3281,3281,328 192192192192 192192192192 192192192192
Currency Adjustments 0.0 0.0 0.0 0.0 0.0
Chg in Cash (386) 518 363 437 464
Opg CFPS (sen) 12.3 18.3 8.91 11.6 12.7
Free CFPS (sen) (19.0) 24.1 4.24 6.72 7.72
Source: Company, AllianceDBS Research
Target Price & Ratings History
Source: AllianceDBS Research
S.No.S.No.S.No.S.No. DateDateDateDateClosing Closing Closing Closing
PricePricePricePrice
Target Target Target Target
PricePricePricePriceRat ing Rat ing Rat ing Rat ing
1: 24 Jun 15 4.96 6.00 BUY
2: 30 Jun 15 4.67 6.00 BUY
3: 17 Aug 15 4.15 6.00 BUY
4: 15 Dec 15 4.38 5.60 BUY
5: 17 Dec 15 4.40 5.60 BUY
6: 02 Mar 16 4.66 5.60 BUY
7: 25 Mar 16 4.93 5.80 BUY
8: 01 Apr 16 4.85 5.80 BUY
9: 04 Apr 16 4.88 5.80 BUY
10: 04 May 16 4.75 5.80 BUY
11: 17 May 16 4.72 5.80 BUY
12: 03 Jun 16 4.86 5.80 BUY
Note Note Note Note : Share price and Target price are adjusted for corporate actions.
12
3
4
5
67
8
9
10
11
12
3.65
3.85
4.05
4.25
4.45
4.65
4.85
5.05
Jun-15 Oct-15 Feb-16 Jun-16
RMRMRMRM
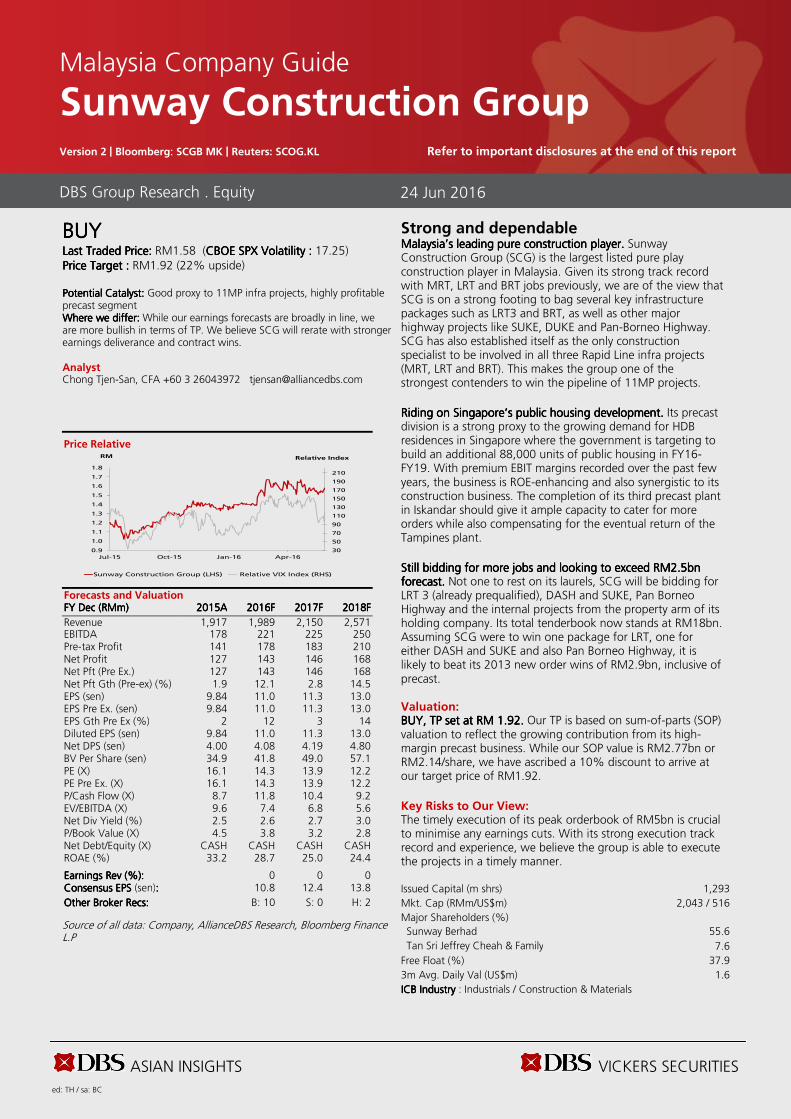
ASIAN INSIGHTS VICKERS SECURITIES ed: TH / sa: BC
BUYBUYBUYBUY Last Traded Price: Last Traded Price: Last Traded Price: Last Traded Price: RM1.58 (CBOE SPX VolatilityCBOE SPX VolatilityCBOE SPX VolatilityCBOE SPX Volatility : : : : 17.25) Price Target :Price Target :Price Target :Price Target : RM1.92 (22% upside) Potential Catalyst: Potential Catalyst: Potential Catalyst: Potential Catalyst: Good proxy to 11MP infra projects, highly profitable precast segment Where we differ:Where we differ:Where we differ:Where we differ: While our earnings forecasts are broadly in line, we are more bullish in terms of TP. We believe SCG will rerate with stronger earnings deliverance and contract wins. Analyst Chong Tjen-San, CFA +60 3 26043972 [email protected]
Price Relative
Forecasts and Valuation FY FY FY FY DecDecDecDec ((((RMRMRMRMmmmm) ) ) ) 2015201520152015AAAA 2016201620162016FFFF 2017201720172017FFFF 2018201820182018FFFF
Revenue 1,917 1,989 2,150 2,571 EBITDA 178 221 225 250 Pre-tax Profit 141 178 183 210 Net Profit 127 143 146 168 Net Pft (Pre Ex.) 127 143 146 168 Net Pft Gth (Pre-ex) (%) 1.9 12.1 2.8 14.5 EPS (sen) 9.84 11.0 11.3 13.0 EPS Pre Ex. (sen) 9.84 11.0 11.3 13.0 EPS Gth Pre Ex (%) 2 12 3 14 Diluted EPS (sen) 9.84 11.0 11.3 13.0 Net DPS (sen) 4.00 4.08 4.19 4.80 BV Per Share (sen) 34.9 41.8 49.0 57.1 PE (X) 16.1 14.3 13.9 12.2 PE Pre Ex. (X) 16.1 14.3 13.9 12.2 P/Cash Flow (X) 8.7 11.8 10.4 9.2 EV/EBITDA (X) 9.6 7.4 6.8 5.6 Net Div Yield (%) 2.5 2.6 2.7 3.0 P/Book Value (X) 4.5 3.8 3.2 2.8 Net Debt/Equity (X) CASH CASH CASH CASH ROAE (%) 33.2 28.7 25.0 24.4 Earnings Rev (%):Earnings Rev (%):Earnings Rev (%):Earnings Rev (%): 0 0 0 Consensus EPS Consensus EPS Consensus EPS Consensus EPS (sen):::: 10.8 12.4 13.8
Other Broker Recs:Other Broker Recs:Other Broker Recs:Other Broker Recs: B: 10 S: 0 H: 2
Source of all data: Company, AllianceDBS Research, Bloomberg Finance L.P
Strong and dependable Malaysia’s leading pure construction player.Malaysia’s leading pure construction player.Malaysia’s leading pure construction player.Malaysia’s leading pure construction player. Sunway Construction Group (SCG) is the largest listed pure play construction player in Malaysia. Given its strong track record with MRT, LRT and BRT jobs previously, we are of the view that SCG is on a strong footing to bag several key infrastructure packages such as LRT3 and BRT, as well as other major highway projects like SUKE, DUKE and Pan-Borneo Highway. SCG has also established itself as the only construction specialist to be involved in all three Rapid Line infra projects (MRT, LRT and BRT). This makes the group one of the strongest contenders to win the pipeline of 11MP projects.
Riding on Singapore’s public housing development. Riding on Singapore’s public housing development. Riding on Singapore’s public housing development. Riding on Singapore’s public housing development. Its precast division is a strong proxy to the growing demand for HDB residences in Singapore where the government is targeting to build an additional 88,000 units of public housing in FY16-FY19. With premium EBIT margins recorded over the past few years, the business is ROE-enhancing and also synergistic to its construction business. The completion of its third precast plant in Iskandar should give it ample capacity to cater for more orders while also compensating for the eventual return of the Tampines plant.
Still bidding for more jobs and looking to exceed RM2.5bn Still bidding for more jobs and looking to exceed RM2.5bn Still bidding for more jobs and looking to exceed RM2.5bn Still bidding for more jobs and looking to exceed RM2.5bn forecast. forecast. forecast. forecast. Not one to rest on its laurels, SCG will be bidding for LRT 3 (already prequalified), DASH and SUKE, Pan Borneo Highway and the internal projects from the property arm of its holding company. Its total tenderbook now stands at RM18bn. Assuming SCG were to win one package for LRT, one for either DASH and SUKE and also Pan Borneo Highway, it is likely to beat its 2013 new order wins of RM2.9bn, inclusive of precast. Valuation: BUY, TP set at RM 1.92. BUY, TP set at RM 1.92. BUY, TP set at RM 1.92. BUY, TP set at RM 1.92. Our TP is based on sum-of-parts (SOP) valuation to reflect the growing contribution from its high-margin precast business. While our SOP value is RM2.77bn or RM2.14/share, we have ascribed a 10% discount to arrive at our target price of RM1.92.
Key Risks to Our View: The timely execution of its peak orderbook of RM5bn is crucial to minimise any earnings cuts. With its strong execution track record and experience, we believe the group is able to execute the projects in a timely manner. Issued Capital (m shrs) 1,293
Mkt. Cap (RMm/US$m) 2,043 / 516
Major Shareholders (%)
Sunway Berhad 55.6
Tan Sri Jeffrey Cheah & Family 7.6
Free Float (%) 37.9
3m Avg. Daily Val (US$m) 1.6
ICB IndustryICB IndustryICB IndustryICB Industry : Industrials / Construction & Materials
DBS Group Research . Equity
24 Jun 2016
Malaysia Company Guide
Sunway Construction Group Version 2 | Bloomberg: SCGB MK | Reuters: SCOG.KL Refer to important disclosures at the end of this report
30
50
70
90
110
130
150
170
190
210
0.9
1.0
1.1
1.2
1.3
1.4
1.5
1.6
1.7
1.8
Jul-15 Oct-15 Jan-16 Apr-16
Relative IndexRM
Sunway Construction Group (LHS) Relative VIX Index (RHS)
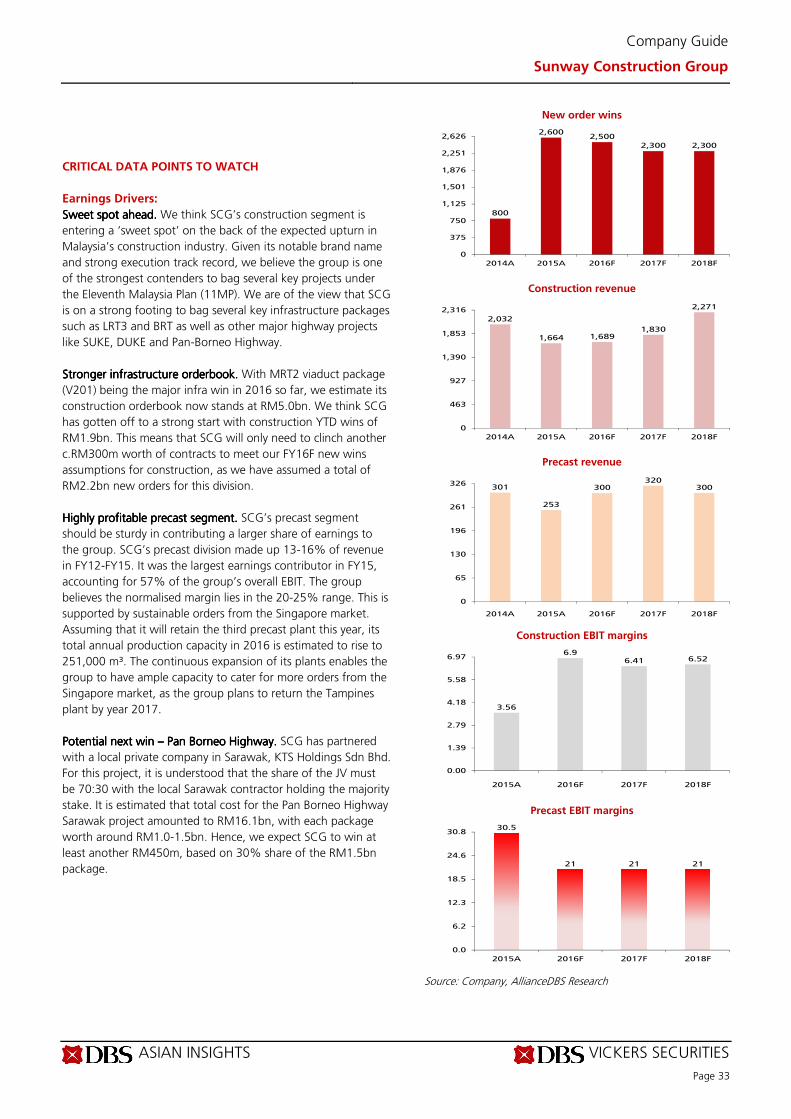
ASIAN INSIGHTS VICKERS SECURITIES
Page 33
Company Guide
Sunway Construction Group
CRITICAL DATA POINTS TO WATCH
Earnings Drivers:
Sweet spot ahead. Sweet spot ahead. Sweet spot ahead. Sweet spot ahead. We think SCG’s construction segment is
entering a ‘sweet spot’ on the back of the expected upturn in
Malaysia’s construction industry. Given its notable brand name
and strong execution track record, we believe the group is one
of the strongest contenders to bag several key projects under
the Eleventh Malaysia Plan (11MP). We are of the view that SCG
is on a strong footing to bag several key infrastructure packages
such as LRT3 and BRT as well as other major highway projects
like SUKE, DUKE and Pan-Borneo Highway.
Stronger infrastructure orderbook.Stronger infrastructure orderbook.Stronger infrastructure orderbook.Stronger infrastructure orderbook. With MRT2 viaduct package
(V201) being the major infra win in 2016 so far, we estimate its
construction orderbook now stands at RM5.0bn. We think SCG
has gotten off to a strong start with construction YTD wins of
RM1.9bn. This means that SCG will only need to clinch another
c.RM300m worth of contracts to meet our FY16F new wins
assumptions for construction, as we have assumed a total of
RM2.2bn new orders for this division.
Highly profitable precast segmentHighly profitable precast segmentHighly profitable precast segmentHighly profitable precast segment. . . . SCG’s precast segment
should be sturdy in contributing a larger share of earnings to
the group. SCG’s precast division made up 13-16% of revenue
in FY12-FY15. It was the largest earnings contributor in FY15,
accounting for 57% of the group’s overall EBIT. The group
believes the normalised margin lies in the 20-25% range. This is
supported by sustainable orders from the Singapore market.
Assuming that it will retain the third precast plant this year, its
total annual production capacity in 2016 is estimated to rise to
251,000 m³. The continuous expansion of its plants enables the
group to have ample capacity to cater for more orders from the
Singapore market, as the group plans to return the Tampines
plant by year 2017.
Potential next win Potential next win Potential next win Potential next win –––– Pan Borneo Highway. Pan Borneo Highway. Pan Borneo Highway. Pan Borneo Highway. SCG has partnered
with a local private company in Sarawak, KTS Holdings Sdn Bhd.
For this project, it is understood that the share of the JV must
be 70:30 with the local Sarawak contractor holding the majority
stake. It is estimated that total cost for the Pan Borneo Highway
Sarawak project amounted to RM16.1bn, with each package
worth around RM1.0-1.5bn. Hence, we expect SCG to win at
least another RM450m, based on 30% share of the RM1.5bn
package.
New order wins
Construction revenue
Precast revenue
Construction EBIT margins
Precast EBIT margins
Source: Company, AllianceDBS Research
800
2,6002,500
2,300 2,300
0
375
750
1,125
1,501
1,876
2,251
2,626
2014A 2015A 2016F 2017F 2018F
2,032
1,664 1,6891,830
2,271
0
463
927
1,390
1,853
2,316
2014A 2015A 2016F 2017F 2018F
301
253
300320
300
0
65
130
196
261
326
2014A 2015A 2016F 2017F 2018F
3.56
6.96.41 6.52
0.00
1.39
2.79
4.18
5.58
6.97
2015A 2016F 2017F 2018F
30.5
21 21 21
0.0
6.2
12.3
18.5
24.6
30.8
2015A 2016F 2017F 2018F
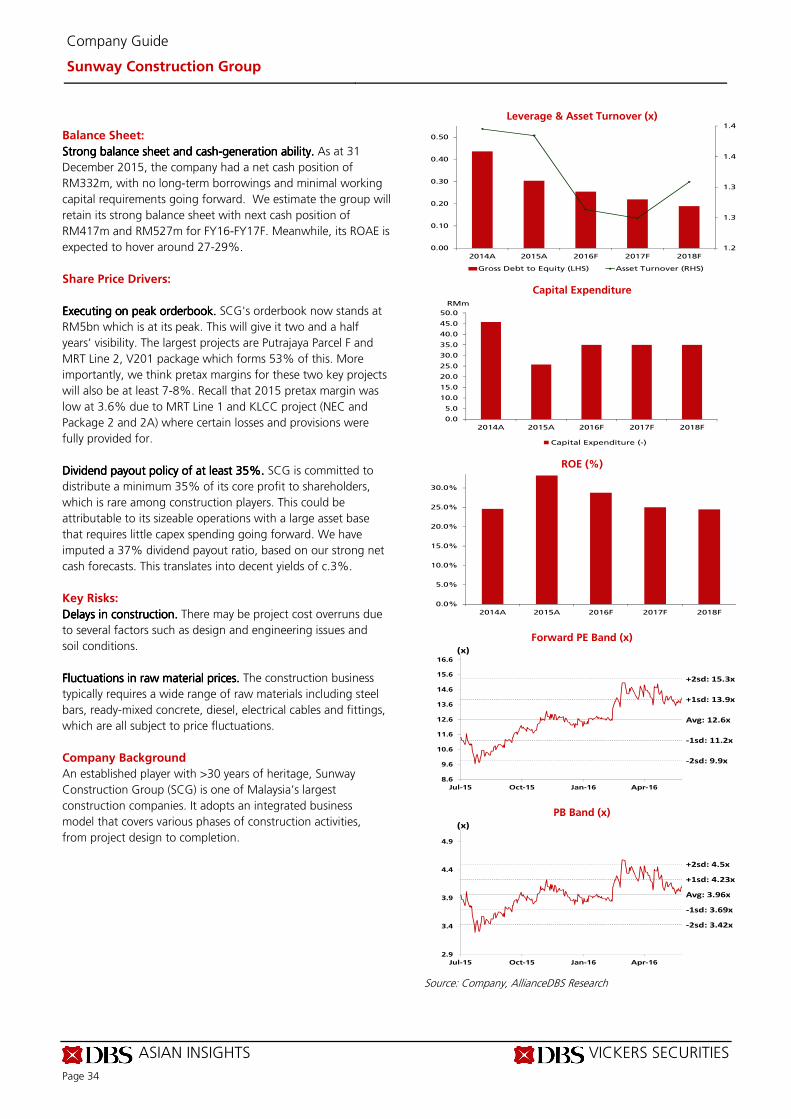
ASIAN INSIGHTS VICKERS SECURITIES
Page 34
Company Guide
Sunway Construction Group
Balance Sheet:
Strong balance sheet and cashStrong balance sheet and cashStrong balance sheet and cashStrong balance sheet and cash----generation ability.generation ability.generation ability.generation ability. As at 31
December 2015, the company had a net cash position of
RM332m, with no long-term borrowings and minimal working
capital requirements going forward. We estimate the group will
retain its strong balance sheet with next cash position of
RM417m and RM527m for FY16-FY17F. Meanwhile, its ROAE is
expected to hover around 27-29%.
Share Price Drivers:
Executing on peak orderbook.Executing on peak orderbook.Executing on peak orderbook.Executing on peak orderbook. SCG's orderbook now stands at
RM5bn which is at its peak. This will give it two and a half
years’ visibility. The largest projects are Putrajaya Parcel F and
MRT Line 2, V201 package which forms 53% of this. More
importantly, we think pretax margins for these two key projects
will also be at least 7-8%. Recall that 2015 pretax margin was
low at 3.6% due to MRT Line 1 and KLCC project (NEC and
Package 2 and 2A) where certain losses and provisions were
fully provided for.
Dividend payout policy of at least 35%.Dividend payout policy of at least 35%.Dividend payout policy of at least 35%.Dividend payout policy of at least 35%. SCG is committed to
distribute a minimum 35% of its core profit to shareholders,
which is rare among construction players. This could be
attributable to its sizeable operations with a large asset base
that requires little capex spending going forward. We have
imputed a 37% dividend payout ratio, based on our strong net
cash forecasts. This translates into decent yields of c.3%.
Key Risks:
Delays in construction. Delays in construction. Delays in construction. Delays in construction. There may be project cost overruns due
to several factors such as design and engineering issues and
soil conditions.
Fluctuations Fluctuations Fluctuations Fluctuations inininin raw material raw material raw material raw material pricespricespricesprices.... The construction business
typically requires a wide range of raw materials including steel
bars, ready-mixed concrete, diesel, electrical cables and fittings,
which are all subject to price fluctuations.
Company Background
An established player with >30 years of heritage, Sunway
Construction Group (SCG) is one of Malaysia’s largest
construction companies. It adopts an integrated business
model that covers various phases of construction activities,
from project design to completion.
Leverage & Asset Turnover (x)
Capital Expenditure
ROE (%)
Forward PE Band (x)
PB Band (x)
Source: Company, AllianceDBS Research
1.2
1.3
1.3
1.4
1.4
0.00
0.10
0.20
0.30
0.40
0.50
2014A 2015A 2016F 2017F 2018F
Gross Debt to Equity (LHS) Asset Turnover (RHS)
0.0
5.0
10.0
15.0
20.0
25.0
30.0
35.0
40.0
45.0
50.0
2014A 2015A 2016F 2017F 2018F
Capital Expenditure (-)
RMm
0.0%
5.0%
10.0%
15.0%
20.0%
25.0%
30.0%
2014A 2015A 2016F 2017F 2018F
Avg: 12.6x
+1sd: 13.9x
+2sd: 15.3x
-1sd: 11.2x
-2sd: 9.9x
8.6
9.6
10.6
11.6
12.6
13.6
14.6
15.6
16.6
Jul-15 Oct-15 Jan-16 Apr-16
(x)
Avg: 3.96x
+1sd: 4.23x
+2sd: 4.5x
-1sd: 3.69x
-2sd: 3.42x
2.9
3.4
3.9
4.4
4.9
Jul-15 Oct-15 Jan-16 Apr-16
(x)
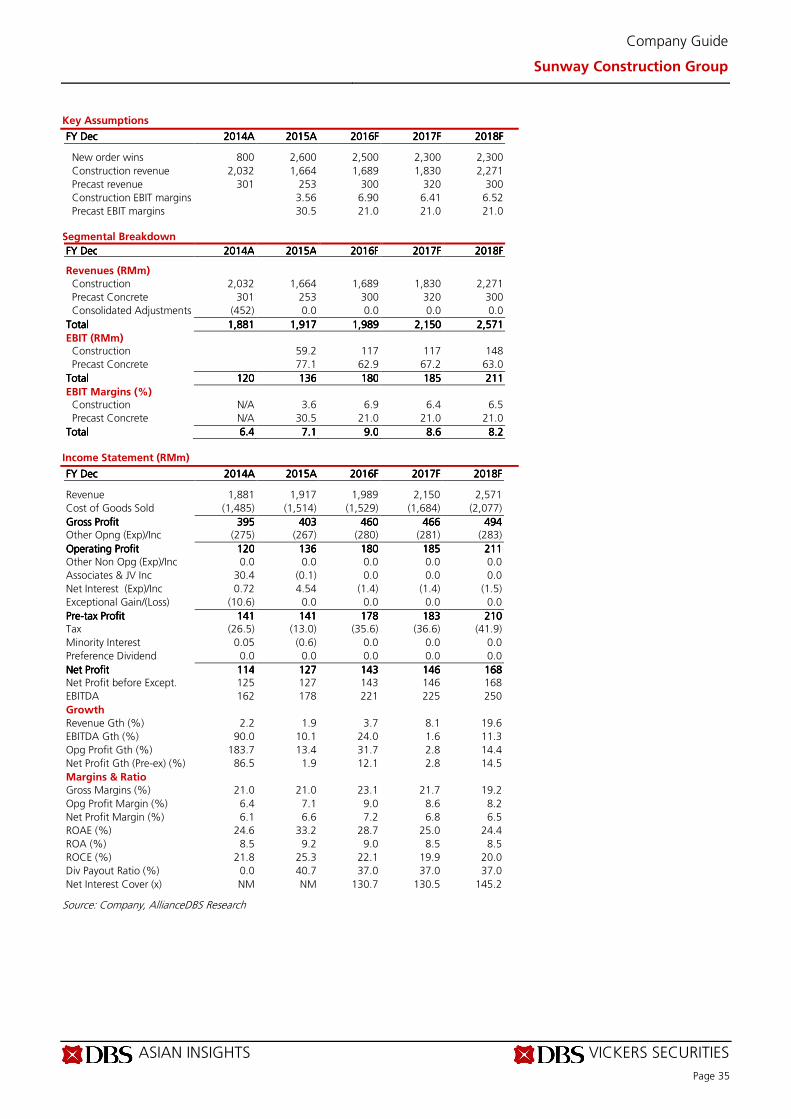
ASIAN INSIGHTS VICKERS SECURITIES
Page 35
Company Guide
Sunway Construction Group
Key Assumptions
FY FY FY FY DecDecDecDec 2014201420142014AAAA 2015201520152015AAAA 2016201620162016FFFF 2017201720172017FFFF 2018201820182018FFFF
New order wins 800 2,600 2,500 2,300 2,300
Construction revenue 2,032 1,664 1,689 1,830 2,271
Precast revenue 301 253 300 320 300
Construction EBIT margins 3.56 6.90 6.41 6.52
Precast EBIT margins 30.5 21.0 21.0 21.0 Segmental Breakdown
FY FY FY FY DecDecDecDec 2014201420142014AAAA 2015201520152015AAAA 2016201620162016FFFF 2017201720172017FFFF 2018201820182018FFFF Revenues (RMm)
Construction 2,032 1,664 1,689 1,830 2,271
Precast Concrete 301 253 300 320 300
Consolidated Adjustments (452) 0.0 0.0 0.0 0.0
TotalTotalTotalTotal 1,8811,8811,8811,881 1,9171,9171,9171,917 1,9891,9891,9891,989 2,1502,1502,1502,150 2,5712,5712,5712,571
EBIT (RMm) Construction 59.2 117 117 148
Precast Concrete 77.1 62.9 67.2 63.0
TotalTotalTotalTotal 120120120120 136136136136 180180180180 185185185185 211211211211
EBIT Margins (%) Construction N/A 3.6 6.9 6.4 6.5
Precast Concrete N/A 30.5 21.0 21.0 21.0
TotalTotalTotalTotal 6.46.46.46.4 7.17.17.17.1 9.09.09.09.0 8.68.68.68.6 8.28.28.28.2
Income Statement (RMm)
FY FY FY FY DecDecDecDec 2014201420142014AAAA 2015201520152015AAAA 2016201620162016FFFF 2017201720172017FFFF 2018201820182018FFFF Revenue 1,881 1,917 1,989 2,150 2,571
Cost of Goods Sold (1,485) (1,514) (1,529) (1,684) (2,077)
Gross ProfitGross ProfitGross ProfitGross Profit 395395395395 403403403403 460460460460 466466466466 494494494494 Other Opng (Exp)/Inc (275) (267) (280) (281) (283)
Operating ProfitOperating ProfitOperating ProfitOperating Profit 120120120120 136136136136 180180180180 185185185185 211211211211
Other Non Opg (Exp)/Inc 0.0 0.0 0.0 0.0 0.0
Associates & JV Inc 30.4 (0.1) 0.0 0.0 0.0
Net Interest (Exp)/Inc 0.72 4.54 (1.4) (1.4) (1.5)
Exceptional Gain/(Loss) (10.6) 0.0 0.0 0.0 0.0
PrePrePrePre----tax Profittax Profittax Profittax Profit 141141141141 141141141141 178178178178 183183183183 210210210210 Tax (26.5) (13.0) (35.6) (36.6) (41.9)
Minority Interest 0.05 (0.6) 0.0 0.0 0.0
Preference Dividend 0.0 0.0 0.0 0.0 0.0
Net ProfitNet ProfitNet ProfitNet Profit 114114114114 127127127127 143143143143 146146146146 168168168168 Net Profit before Except. 125 127 143 146 168
EBITDA 162 178 221 225 250
Growth
Revenue Gth (%) 2.2 1.9 3.7 8.1 19.6
EBITDA Gth (%) 90.0 10.1 24.0 1.6 11.3
Opg Profit Gth (%) 183.7 13.4 31.7 2.8 14.4
Net Profit Gth (Pre-ex) (%) 86.5 1.9 12.1 2.8 14.5
Margins & Ratio
Gross Margins (%) 21.0 21.0 23.1 21.7 19.2
Opg Profit Margin (%) 6.4 7.1 9.0 8.6 8.2
Net Profit Margin (%) 6.1 6.6 7.2 6.8 6.5
ROAE (%) 24.6 33.2 28.7 25.0 24.4
ROA (%) 8.5 9.2 9.0 8.5 8.5
ROCE (%) 21.8 25.3 22.1 19.9 20.0
Div Payout Ratio (%) 0.0 40.7 37.0 37.0 37.0
Net Interest Cover (x) NM NM 130.7 130.5 145.2
Source: Company, AllianceDBS Research
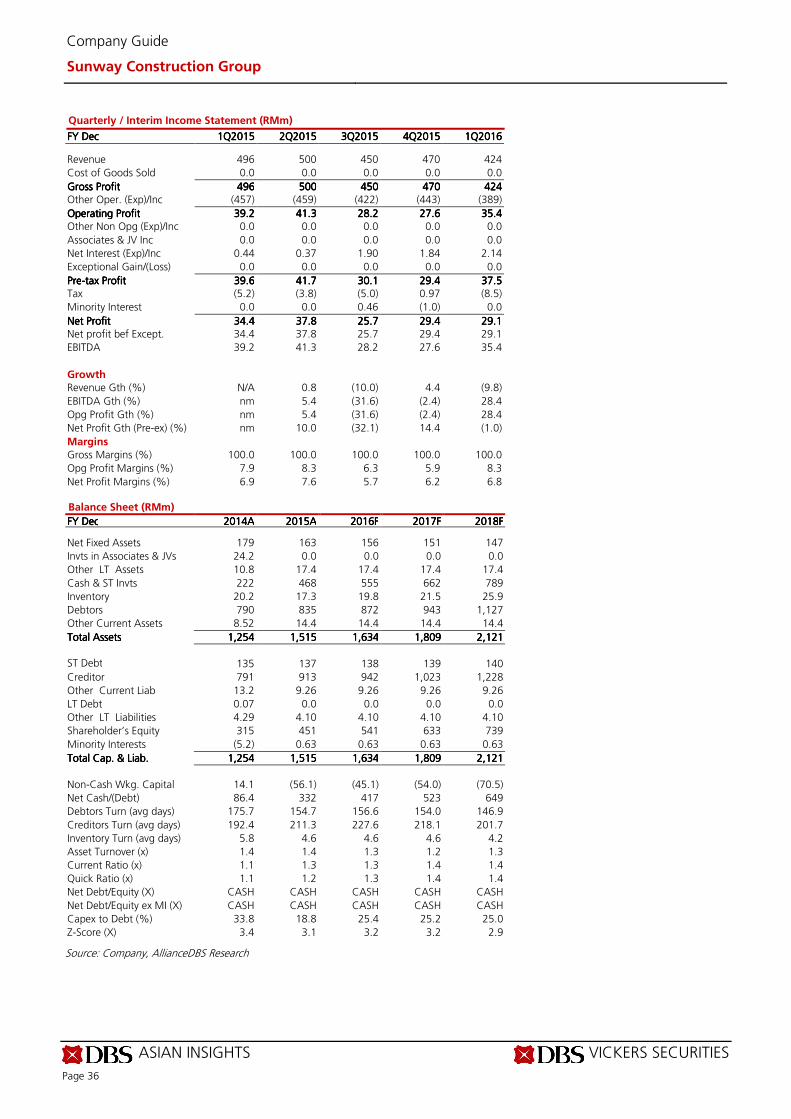
ASIAN INSIGHTS VICKERS SECURITIES
Page 36
Company Guide
Sunway Construction Group
Quarterly / Interim Income Statement (RMm)
FY FY FY FY DecDecDecDec 1Q1Q1Q1Q2015201520152015 2Q2Q2Q2Q2015201520152015 3Q3Q3Q3Q2015201520152015 4Q4Q4Q4Q2015201520152015 1Q1Q1Q1Q2016201620162016 Revenue 496 500 450 470 424
Cost of Goods Sold 0.0 0.0 0.0 0.0 0.0
Gross ProfitGross ProfitGross ProfitGross Profit 496496496496 500500500500 450450450450 470470470470 424424424424 Other Oper. (Exp)/Inc (457) (459) (422) (443) (389)
Operating ProfitOperating ProfitOperating ProfitOperating Profit 39.239.239.239.2 41.341.341.341.3 28.228.228.228.2 27.627.627.627.6 35.435.435.435.4 Other Non Opg (Exp)/Inc 0.0 0.0 0.0 0.0 0.0
Associates & JV Inc 0.0 0.0 0.0 0.0 0.0
Net Interest (Exp)/Inc 0.44 0.37 1.90 1.84 2.14
Exceptional Gain/(Loss) 0.0 0.0 0.0 0.0 0.0
PrePrePrePre----tax Profittax Profittax Profittax Profit 39.639.639.639.6 41.741.741.741.7 30.130.130.130.1 29.429.429.429.4 37.537.537.537.5 Tax (5.2) (3.8) (5.0) 0.97 (8.5)
Minority Interest 0.0 0.0 0.46 (1.0) 0.0
Net ProfitNet ProfitNet ProfitNet Profit 34.434.434.434.4 37.837.837.837.8 25.725.725.725.7 29.429.429.429.4 29.129.129.129.1 Net profit bef Except. 34.4 37.8 25.7 29.4 29.1
EBITDA 39.2 41.3 28.2 27.6 35.4
Growth
Revenue Gth (%) N/A 0.8 (10.0) 4.4 (9.8)
EBITDA Gth (%) nm 5.4 (31.6) (2.4) 28.4
Opg Profit Gth (%) nm 5.4 (31.6) (2.4) 28.4
Net Profit Gth (Pre-ex) (%) nm 10.0 (32.1) 14.4 (1.0)
Margins
Gross Margins (%) 100.0 100.0 100.0 100.0 100.0
Opg Profit Margins (%) 7.9 8.3 6.3 5.9 8.3
Net Profit Margins (%) 6.9 7.6 5.7 6.2 6.8 Balance Sheet (RMm)
FY FY FY FY DecDecDecDec 2014201420142014AAAA 2015201520152015AAAA 2016201620162016FFFF 2017201720172017FFFF 2018201820182018FFFF Net Fixed Assets 179 163 156 151 147
Invts in Associates & JVs 24.2 0.0 0.0 0.0 0.0
Other LT Assets 10.8 17.4 17.4 17.4 17.4
Cash & ST Invts 222 468 555 662 789
Inventory 20.2 17.3 19.8 21.5 25.9
Debtors 790 835 872 943 1,127
Other Current Assets 8.52 14.4 14.4 14.4 14.4
Total AssetsTotal AssetsTotal AssetsTotal Assets 1,2541,2541,2541,254 1,5151,5151,5151,515 1,6341,6341,6341,634 1,8091,8091,8091,809 2,1212,1212,1212,121
ST Debt
135 137 138 139 140
Creditor 791 913 942 1,023 1,228
Other Current Liab 13.2 9.26 9.26 9.26 9.26
LT Debt 0.07 0.0 0.0 0.0 0.0
Other LT Liabilities 4.29 4.10 4.10 4.10 4.10
Shareholder’s Equity 315 451 541 633 739
Minority Interests (5.2) 0.63 0.63 0.63 0.63
Total Cap. & Liab.Total Cap. & Liab.Total Cap. & Liab.Total Cap. & Liab. 1,2541,2541,2541,254 1,5151,5151,5151,515 1,6341,6341,6341,634 1,8091,8091,8091,809 2,1212,1212,1212,121
Non-Cash Wkg. Capital 14.1 (56.1) (45.1) (54.0) (70.5)
Net Cash/(Debt) 86.4 332 417 523 649
Debtors Turn (avg days) 175.7 154.7 156.6 154.0 146.9
Creditors Turn (avg days) 192.4 211.3 227.6 218.1 201.7
Inventory Turn (avg days) 5.8 4.6 4.6 4.6 4.2
Asset Turnover (x) 1.4 1.4 1.3 1.2 1.3
Current Ratio (x) 1.1 1.3 1.3 1.4 1.4
Quick Ratio (x) 1.1 1.2 1.3 1.4 1.4
Net Debt/Equity (X) CASH CASH CASH CASH CASH
Net Debt/Equity ex MI (X) CASH CASH CASH CASH CASH
Capex to Debt (%) 33.8 18.8 25.4 25.2 25.0
Z-Score (X) 3.4 3.1 3.2 3.2 2.9
Source: Company, AllianceDBS Research
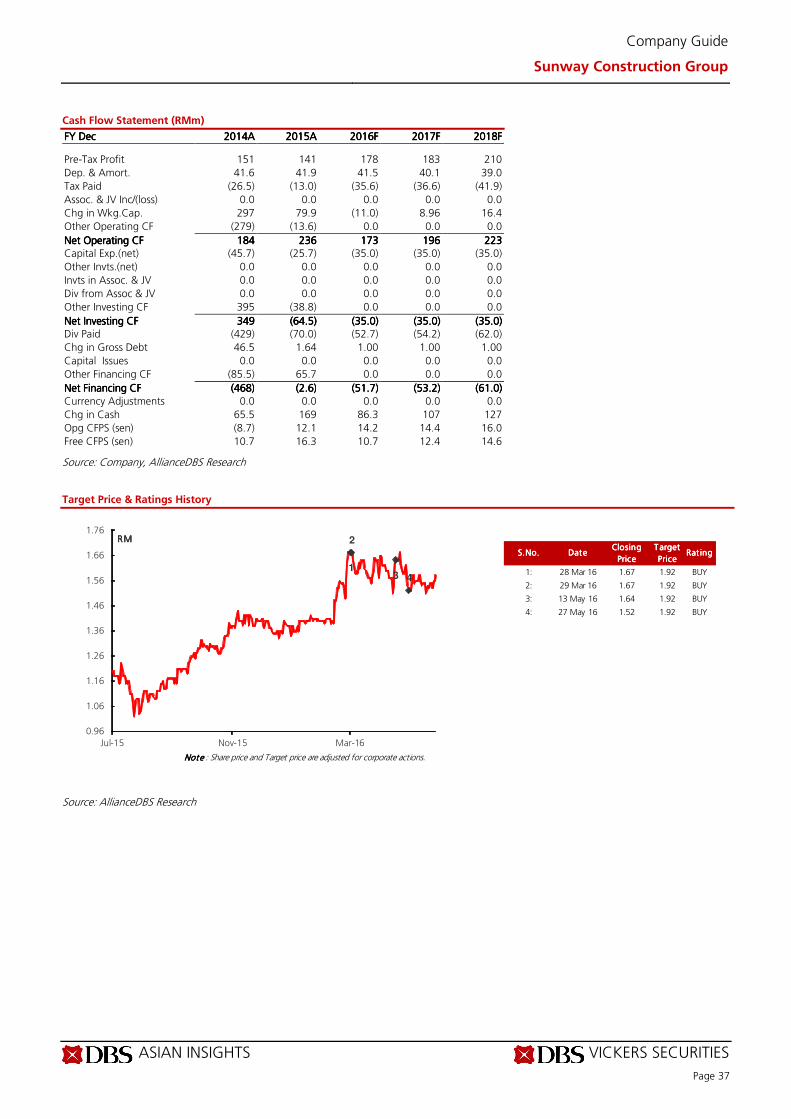
ASIAN INSIGHTS VICKERS SECURITIES
Page 37
Company Guide
Sunway Construction Group
Cash Flow Statement (RMm)
FY FY FY FY DecDecDecDec 2014201420142014AAAA 2015201520152015AAAA 2016201620162016FFFF 2017201720172017FFFF 2018201820182018FFFF Pre-Tax Profit 151 141 178 183 210
Dep. & Amort. 41.6 41.9 41.5 40.1 39.0
Tax Paid (26.5) (13.0) (35.6) (36.6) (41.9)
Assoc. & JV Inc/(loss) 0.0 0.0 0.0 0.0 0.0
Chg in Wkg.Cap. 297 79.9 (11.0) 8.96 16.4
Other Operating CF (279) (13.6) 0.0 0.0 0.0
Net Operating CFNet Operating CFNet Operating CFNet Operating CF 184184184184 236236236236 173173173173 196196196196 223223223223 Capital Exp.(net) (45.7) (25.7) (35.0) (35.0) (35.0)
Other Invts.(net) 0.0 0.0 0.0 0.0 0.0
Invts in Assoc. & JV 0.0 0.0 0.0 0.0 0.0
Div from Assoc & JV 0.0 0.0 0.0 0.0 0.0
Other Investing CF 395 (38.8) 0.0 0.0 0.0
Net Investing CFNet Investing CFNet Investing CFNet Investing CF 349349349349 (64.5)(64.5)(64.5)(64.5) (35.0)(35.0)(35.0)(35.0) (35.0)(35.0)(35.0)(35.0) (35.0)(35.0)(35.0)(35.0) Div Paid (429) (70.0) (52.7) (54.2) (62.0)
Chg in Gross Debt 46.5 1.64 1.00 1.00 1.00
Capital Issues 0.0 0.0 0.0 0.0 0.0
Other Financing CF (85.5) 65.7 0.0 0.0 0.0
Net Financing CFNet Financing CFNet Financing CFNet Financing CF (468)(468)(468)(468) (2.6)(2.6)(2.6)(2.6) (51.7)(51.7)(51.7)(51.7) (53.2)(53.2)(53.2)(53.2) (61.0)(61.0)(61.0)(61.0)
Currency Adjustments 0.0 0.0 0.0 0.0 0.0
Chg in Cash 65.5 169 86.3 107 127
Opg CFPS (sen) (8.7) 12.1 14.2 14.4 16.0
Free CFPS (sen) 10.7 16.3 10.7 12.4 14.6
Source: Company, AllianceDBS Research
Target Price & Ratings History
Source: AllianceDBS Research
S.No.S.No.S.No.S.No. DateDateDateDateClosing Closing Closing Closing
PricePricePricePrice
Target Target Target Target
PricePricePricePriceRat ing Rat ing Rat ing Rat ing
1: 28 Mar 16 1.67 1.92 BUY
2: 29 Mar 16 1.67 1.92 BUY
3: 13 May 16 1.64 1.92 BUY
4: 27 May 16 1.52 1.92 BUY
Note Note Note Note : Share price and Target price are adjusted for corporate actions.
1
2
3 4
0.96
1.06
1.16
1.26
1.36
1.46
1.56
1.66
1.76
Jul-15 Nov-15 Mar-16
RMRMRMRM
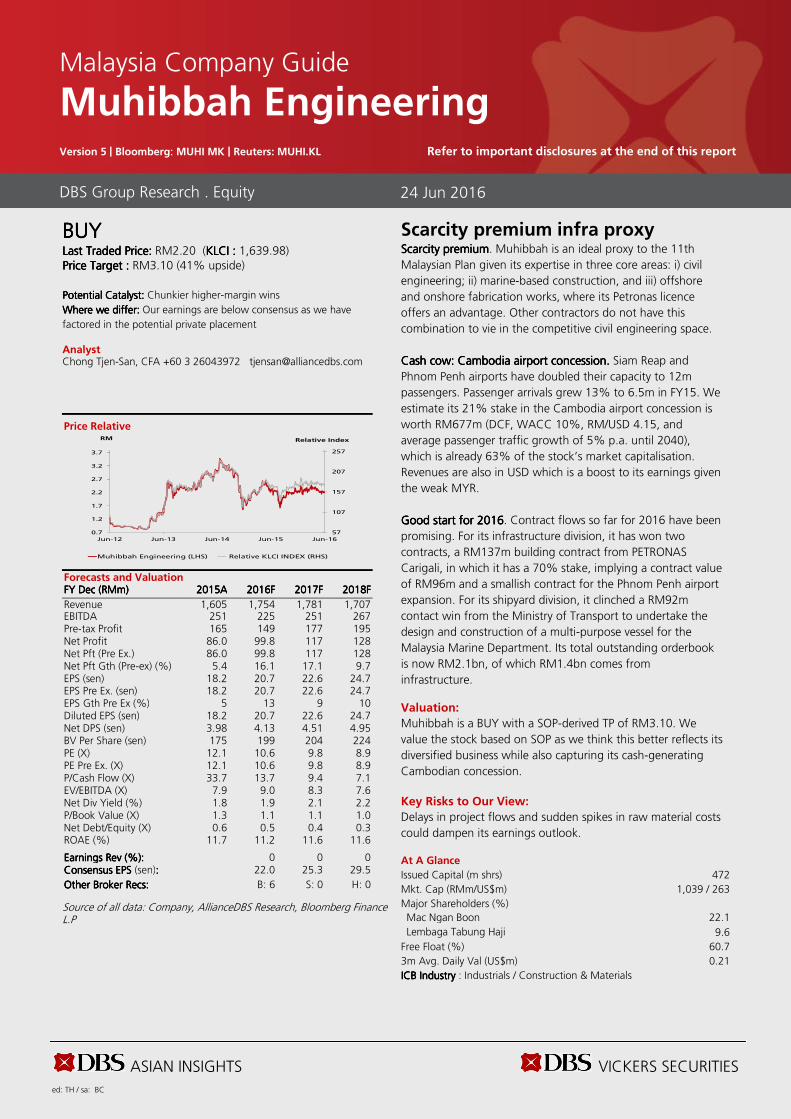
ASIAN INSIGHTS VICKERS SECURITIES ed: TH / sa: BC
BUYBUYBUYBUY Last Traded Price: Last Traded Price: Last Traded Price: Last Traded Price: RM2.20 (KLCIKLCIKLCIKLCI : : : : 1,639.98) Price Target :Price Target :Price Target :Price Target : RM3.10 (41% upside)
Potential Catalyst: Potential Catalyst: Potential Catalyst: Potential Catalyst: Chunkier higher-margin wins
Where we differWhere we differWhere we differWhere we differ:::: Our earnings are below consensus as we have
factored in the potential private placement Analyst Chong Tjen-San, CFA +60 3 26043972 [email protected]
Price Relative
Forecasts and Valuation FY FY FY FY DecDecDecDec ((((RMRMRMRMmmmm) ) ) ) 2015201520152015AAAA 2016201620162016FFFF 2017201720172017FFFF 2018201820182018FFFF
Revenue 1,605 1,754 1,781 1,707 EBITDA 251 225 251 267 Pre-tax Profit 165 149 177 195 Net Profit 86.0 99.8 117 128 Net Pft (Pre Ex.) 86.0 99.8 117 128 Net Pft Gth (Pre-ex) (%) 5.4 16.1 17.1 9.7 EPS (sen) 18.2 20.7 22.6 24.7 EPS Pre Ex. (sen) 18.2 20.7 22.6 24.7 EPS Gth Pre Ex (%) 5 13 9 10 Diluted EPS (sen) 18.2 20.7 22.6 24.7 Net DPS (sen) 3.98 4.13 4.51 4.95 BV Per Share (sen) 175 199 204 224 PE (X) 12.1 10.6 9.8 8.9 PE Pre Ex. (X) 12.1 10.6 9.8 8.9 P/Cash Flow (X) 33.7 13.7 9.4 7.1 EV/EBITDA (X) 7.9 9.0 8.3 7.6 Net Div Yield (%) 1.8 1.9 2.1 2.2 P/Book Value (X) 1.3 1.1 1.1 1.0 Net Debt/Equity (X) 0.6 0.5 0.4 0.3 ROAE (%) 11.7 11.2 11.6 11.6 Earnings Rev (%):Earnings Rev (%):Earnings Rev (%):Earnings Rev (%): 0 0 0 Consensus EPS Consensus EPS Consensus EPS Consensus EPS (sen):::: 22.0 25.3 29.5
Other Broker Recs:Other Broker Recs:Other Broker Recs:Other Broker Recs: B: 6 S: 0 H: 0
Source of all data: Company, AllianceDBS Research, Bloomberg Finance L.P
Scarcity premium infra proxy Scarcity premiumScarcity premiumScarcity premiumScarcity premium. Muhibbah is an ideal proxy to the 11th
Malaysian Plan given its expertise in three core areas: i) civil
engineering; ii) marine-based construction, and iii) offshore
and onshore fabrication works, where its Petronas licence
offers an advantage. Other contractors do not have this
combination to vie in the competitive civil engineering space.
Cash cow: Cambodia airport concession.Cash cow: Cambodia airport concession.Cash cow: Cambodia airport concession.Cash cow: Cambodia airport concession. Siam Reap and
Phnom Penh airports have doubled their capacity to 12m
passengers. Passenger arrivals grew 13% to 6.5m in FY15. We
estimate its 21% stake in the Cambodia airport concession is
worth RM677m (DCF, WACC 10%, RM/USD 4.15, and
average passenger traffic growth of 5% p.a. until 2040),
which is already 63% of the stock’s market capitalisation.
Revenues are also in USD which is a boost to its earnings given
the weak MYR.
Good start for 2016Good start for 2016Good start for 2016Good start for 2016. Contract flows so far for 2016 have been
promising. For its infrastructure division, it has won two
contracts, a RM137m building contract from PETRONAS
Carigali, in which it has a 70% stake, implying a contract value
of RM96m and a smallish contract for the Phnom Penh airport
expansion. For its shipyard division, it clinched a RM92m
contact win from the Ministry of Transport to undertake the
design and construction of a multi-purpose vessel for the
Malaysia Marine Department. Its total outstanding orderbook
is now RM2.1bn, of which RM1.4bn comes from
infrastructure. Valuation:
Muhibbah is a BUY with a SOP-derived TP of RM3.10. We
value the stock based on SOP as we think this better reflects its
diversified business while also capturing its cash-generating
Cambodian concession.
Key Risks to Our View:
Delays in project flows and sudden spikes in raw material costs
could dampen its earnings outlook. At A Glance Issued Capital (m shrs) 472
Mkt. Cap (RMm/US$m) 1,039 / 263
Major Shareholders (%)
Mac Ngan Boon 22.1
Lembaga Tabung Haji 9.6
Free Float (%) 60.7
3m Avg. Daily Val (US$m) 0.21
ICB IndustryICB IndustryICB IndustryICB Industry : Industrials / Construction & Materials
DBS Group Research . Equity
24 Jun 2016
Malaysia Company Guide
Muhibbah Engineering Version 5 | Bloomberg: MUHI MK | Reuters: MUHI.KL Refer to important disclosures at the end of this report
57
107
157
207
257
0.7
1.2
1.7
2.2
2.7
3.2
3.7
Jun-12 Jun-13 Jun-14 Jun-15 Jun-16
Relative IndexRM
Muhibbah Engineering (LHS) Relative KLCI INDEX (RHS)
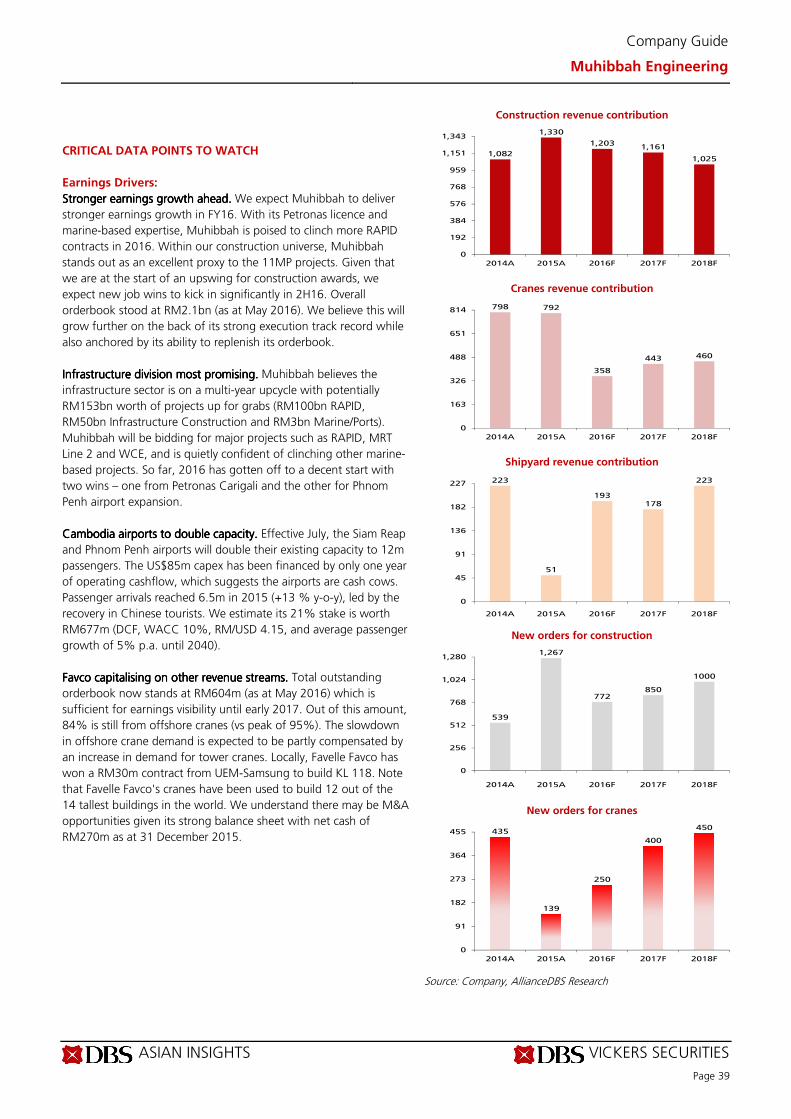
ASIAN INSIGHTS VICKERS SECURITIES
Page 39
Company Guide
Muhibbah Engineering
CRITICAL DATA POINTS TO WATCH
Earnings Drivers:
Stronger earnings growth ahead.Stronger earnings growth ahead.Stronger earnings growth ahead.Stronger earnings growth ahead. We expect Muhibbah to deliver
stronger earnings growth in FY16. With its Petronas licence and
marine-based expertise, Muhibbah is poised to clinch more RAPID
contracts in 2016. Within our construction universe, Muhibbah
stands out as an excellent proxy to the 11MP projects. Given that
we are at the start of an upswing for construction awards, we
expect new job wins to kick in significantly in 2H16. Overall
orderbook stood at RM2.1bn (as at May 2016). We believe this will
grow further on the back of its strong execution track record while
also anchored by its ability to replenish its orderbook.
Infrastructure division most promising.Infrastructure division most promising.Infrastructure division most promising.Infrastructure division most promising. Muhibbah believes the
infrastructure sector is on a multi-year upcycle with potentially
RM153bn worth of projects up for grabs (RM100bn RAPID,
RM50bn Infrastructure Construction and RM3bn Marine/Ports).
Muhibbah will be bidding for major projects such as RAPID, MRT
Line 2 and WCE, and is quietly confident of clinching other marine-
based projects. So far, 2016 has gotten off to a decent start with
two wins – one from Petronas Carigali and the other for Phnom
Penh airport expansion.
Cambodia airports to double capacity.Cambodia airports to double capacity.Cambodia airports to double capacity.Cambodia airports to double capacity. Effective July, the Siam Reap
and Phnom Penh airports will double their existing capacity to 12m
passengers. The US$85m capex has been financed by only one year
of operating cashflow, which suggests the airports are cash cows.
Passenger arrivals reached 6.5m in 2015 (+13 % y-o-y), led by the
recovery in Chinese tourists. We estimate its 21% stake is worth
RM677m (DCF, WACC 10%, RM/USD 4.15, and average passenger
growth of 5% p.a. until 2040).
Favco capitalising on other revenue streams.Favco capitalising on other revenue streams.Favco capitalising on other revenue streams.Favco capitalising on other revenue streams. Total outstanding
orderbook now stands at RM604m (as at May 2016) which is
sufficient for earnings visibility until early 2017. Out of this amount,
84% is still from offshore cranes (vs peak of 95%). The slowdown
in offshore crane demand is expected to be partly compensated by
an increase in demand for tower cranes. Locally, Favelle Favco has
won a RM30m contract from UEM-Samsung to build KL 118. Note
that Favelle Favco's cranes have been used to build 12 out of the
14 tallest buildings in the world. We understand there may be M&A
opportunities given its strong balance sheet with net cash of
RM270m as at 31 December 2015.
Construction revenue contribution
Cranes revenue contribution
Shipyard revenue contribution
New orders for construction
New orders for cranes
Source: Company, AllianceDBS Research
1,082
1,330
1,2031,161
1,025
0
192
384
576
768
959
1,151
1,343
2014A 2015A 2016F 2017F 2018F
798 792
358
443 460
0
163
326
488
651
814
2014A 2015A 2016F 2017F 2018F
223
51
193178
223
0
45
91
136
182
227
2014A 2015A 2016F 2017F 2018F
539
1,267
772850
1000
0
256
512
768
1,024
1,280
2014A 2015A 2016F 2017F 2018F
435
139
250
400
450
0
91
182
273
364
455
2014A 2015A 2016F 2017F 2018F
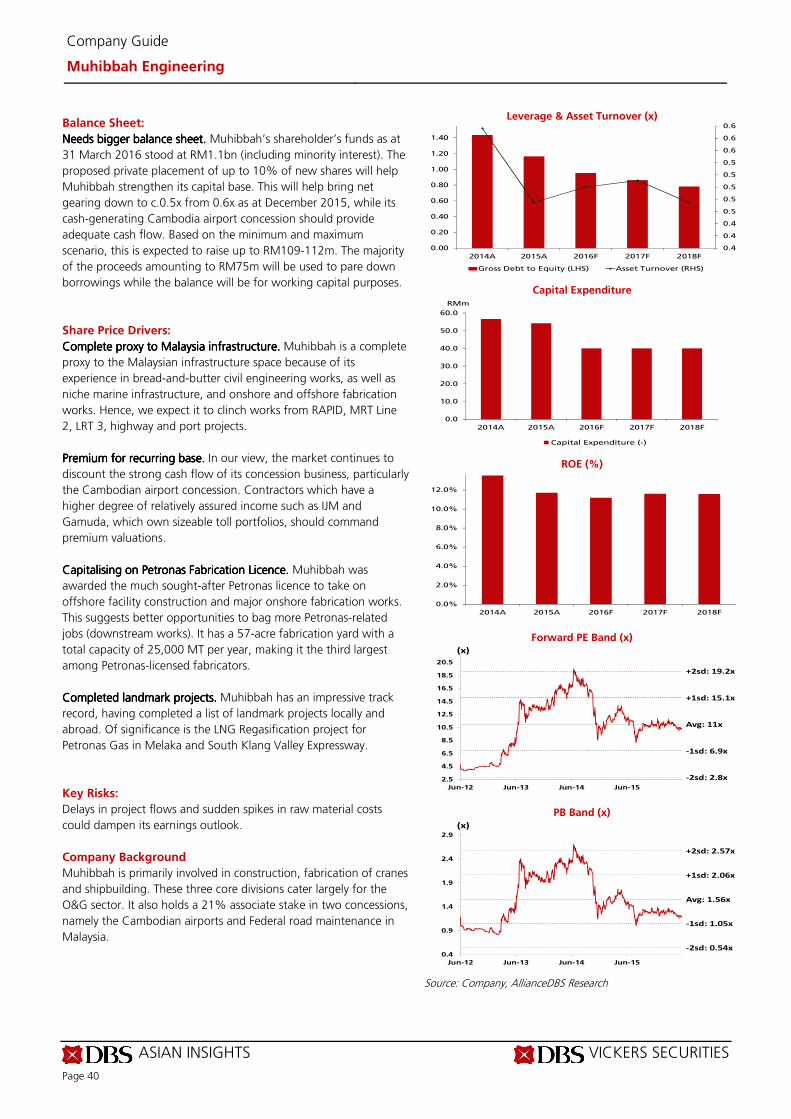
ASIAN INSIGHTS VICKERS SECURITIES
Page 40
Company Guide
Muhibbah Engineering
Balance Sheet:
Needs bigger balance sheet. Needs bigger balance sheet. Needs bigger balance sheet. Needs bigger balance sheet. Muhibbah’s shareholder’s funds as at
31 March 2016 stood at RM1.1bn (including minority interest). The
proposed private placement of up to 10% of new shares will help
Muhibbah strengthen its capital base. This will help bring net
gearing down to c.0.5x from 0.6x as at December 2015, while its
cash-generating Cambodia airport concession should provide
adequate cash flow. Based on the minimum and maximum
scenario, this is expected to raise up to RM109-112m. The majority
of the proceeds amounting to RM75m will be used to pare down
borrowings while the balance will be for working capital purposes.
Share Price Drivers:
Complete proxy to Malaysia infrastructure. Complete proxy to Malaysia infrastructure. Complete proxy to Malaysia infrastructure. Complete proxy to Malaysia infrastructure. Muhibbah is a complete
proxy to the Malaysian infrastructure space because of its
experience in bread-and-butter civil engineering works, as well as
niche marine infrastructure, and onshore and offshore fabrication
works. Hence, we expect it to clinch works from RAPID, MRT Line
2, LRT 3, highway and port projects.
Premium for recurPremium for recurPremium for recurPremium for recurring base.ring base.ring base.ring base. In our view, the market continues to
discount the strong cash flow of its concession business, particularly
the Cambodian airport concession. Contractors which have a
higher degree of relatively assured income such as IJM and
Gamuda, which own sizeable toll portfolios, should command
premium valuations.
Capitalising on Petronas Fabrication LicenCapitalising on Petronas Fabrication LicenCapitalising on Petronas Fabrication LicenCapitalising on Petronas Fabrication Licencccce.e.e.e. Muhibbah was
awarded the much sought-after Petronas licence to take on
offshore facility construction and major onshore fabrication works.
This suggests better opportunities to bag more Petronas-related
jobs (downstream works). It has a 57-acre fabrication yard with a
total capacity of 25,000 MT per year, making it the third largest
among Petronas-licensed fabricators.
Completed landmark projects. Completed landmark projects. Completed landmark projects. Completed landmark projects. Muhibbah has an impressive track
record, having completed a list of landmark projects locally and
abroad. Of significance is the LNG Regasification project for
Petronas Gas in Melaka and South Klang Valley Expressway.
Key Risks:
Delays in project flows and sudden spikes in raw material costs
could dampen its earnings outlook.
Company Background
Muhibbah is primarily involved in construction, fabrication of cranes
and shipbuilding. These three core divisions cater largely for the
O&G sector. It also holds a 21% associate stake in two concessions,
namely the Cambodian airports and Federal road maintenance in
Malaysia.
Leverage & Asset Turnover (x)
Capital Expenditure
ROE (%)
Forward PE Band (x)
PB Band (x)
Source: Company, AllianceDBS Research
0.4
0.4
0.4
0.5
0.5
0.5
0.5
0.5
0.6
0.6
0.6
0.00
0.20
0.40
0.60
0.80
1.00
1.20
1.40
2014A 2015A 2016F 2017F 2018F
Gross Debt to Equity (LHS) Asset Turnover (RHS)
0.0
10.0
20.0
30.0
40.0
50.0
60.0
2014A 2015A 2016F 2017F 2018F
Capital Expenditure (-)
RMm
0.0%
2.0%
4.0%
6.0%
8.0%
10.0%
12.0%
2014A 2015A 2016F 2017F 2018F
Avg: 11x
+1sd: 15.1x
+2sd: 19.2x
-1sd: 6.9x
-2sd: 2.8x2.5
4.5
6.5
8.5
10.5
12.5
14.5
16.5
18.5
20.5
Jun-12 Jun-13 Jun-14 Jun-15
(x)
Avg: 1.56x
+1sd: 2.06x
+2sd: 2.57x
-1sd: 1.05x
-2sd: 0.54x0.4
0.9
1.4
1.9
2.4
2.9
Jun-12 Jun-13 Jun-14 Jun-15
(x)
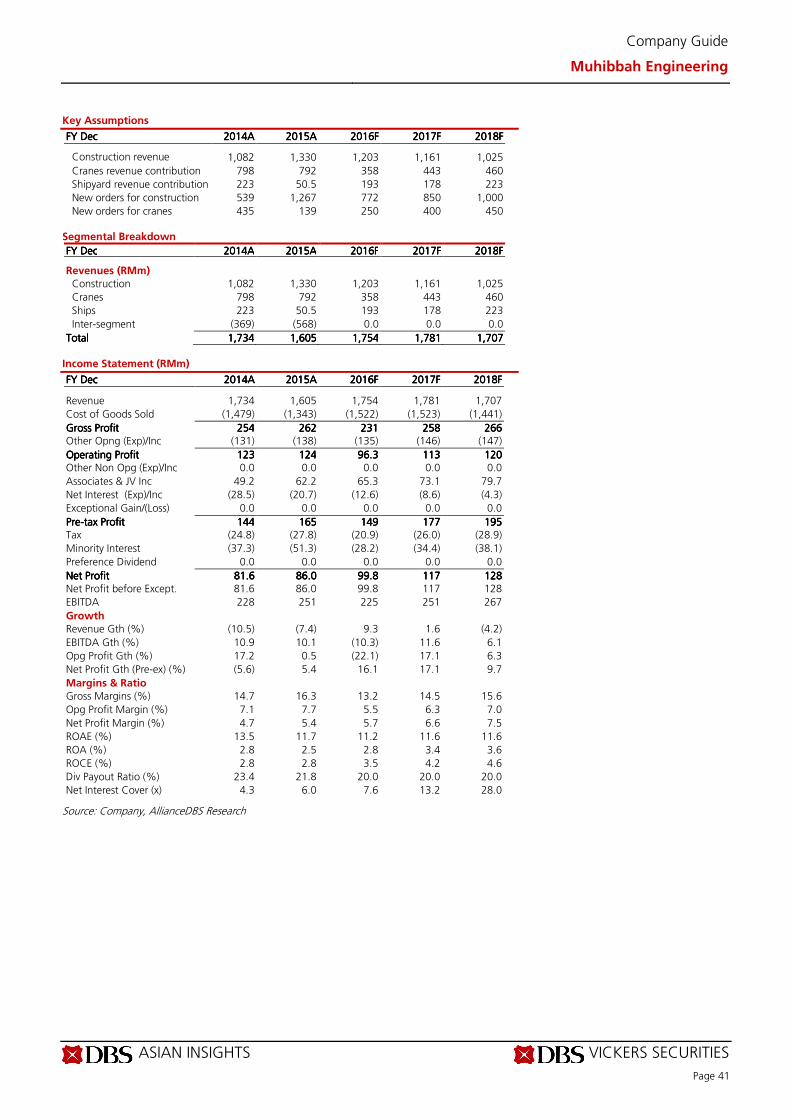
ASIAN INSIGHTS VICKERS SECURITIES
Page 41
Company Guide
Muhibbah Engineering
Key Assumptions
FY FY FY FY DecDecDecDec 2014201420142014AAAA 2015201520152015AAAA 2016201620162016FFFF 2017201720172017FFFF 2018201820182018FFFF
Construction revenue contribution
1,082 1,330 1,203 1,161 1,025
Cranes revenue contribution 798 792 358 443 460
Shipyard revenue contribution 223 50.5 193 178 223
New orders for construction 539 1,267 772 850 1,000
New orders for cranes 435 139 250 400 450 Segmental Breakdown
FY FY FY FY DecDecDecDec 2014201420142014AAAA 2015201520152015AAAA 2016201620162016FFFF 2017201720172017FFFF 2018201820182018FFFF Revenues (RMm)
Construction 1,082 1,330 1,203 1,161 1,025
Cranes 798 792 358 443 460
Ships 223 50.5 193 178 223
Inter-segment (369) (568) 0.0 0.0 0.0
TotalTotalTotalTotal 1,7341,7341,7341,734 1,6051,6051,6051,605 1,7541,7541,7541,754 1,7811,7811,7811,781 1,7071,7071,7071,707
Income Statement (RMm)
FY FY FY FY DecDecDecDec 2014201420142014AAAA 2015201520152015AAAA 2016201620162016FFFF 2017201720172017FFFF 2018201820182018FFFF Revenue 1,734 1,605 1,754 1,781 1,707
Cost of Goods Sold (1,479) (1,343) (1,522) (1,523) (1,441)
Gross ProfitGross ProfitGross ProfitGross Profit 254254254254 262262262262 231231231231 258258258258 266266266266 Other Opng (Exp)/Inc (131) (138) (135) (146) (147)
Operating ProfitOperating ProfitOperating ProfitOperating Profit 123123123123 124124124124 96.396.396.396.3 113113113113 120120120120 Other Non Opg (Exp)/Inc 0.0 0.0 0.0 0.0 0.0
Associates & JV Inc 49.2 62.2 65.3 73.1 79.7
Net Interest (Exp)/Inc (28.5) (20.7) (12.6) (8.6) (4.3)
Exceptional Gain/(Loss) 0.0 0.0 0.0 0.0 0.0
PrePrePrePre----tax Profittax Profittax Profittax Profit 144144144144 165165165165 149149149149 177177177177 195195195195 Tax (24.8) (27.8) (20.9) (26.0) (28.9)
Minority Interest (37.3) (51.3) (28.2) (34.4) (38.1)
Preference Dividend 0.0 0.0 0.0 0.0 0.0
Net ProfitNet ProfitNet ProfitNet Profit 81.681.681.681.6 86.086.086.086.0 99.899.899.899.8 117117117117 128128128128 Net Profit before Except. 81.6 86.0 99.8 117 128
EBITDA 228 251 225 251 267
Growth
Revenue Gth (%) (10.5) (7.4) 9.3 1.6 (4.2)
EBITDA Gth (%) 10.9 10.1 (10.3) 11.6 6.1
Opg Profit Gth (%) 17.2 0.5 (22.1) 17.1 6.3
Net Profit Gth (Pre-ex) (%) (5.6) 5.4 16.1 17.1 9.7
Margins & Ratio
Gross Margins (%) 14.7 16.3 13.2 14.5 15.6
Opg Profit Margin (%) 7.1 7.7 5.5 6.3 7.0
Net Profit Margin (%) 4.7 5.4 5.7 6.6 7.5
ROAE (%) 13.5 11.7 11.2 11.6 11.6
ROA (%) 2.8 2.5 2.8 3.4 3.6
ROCE (%) 2.8 2.8 3.5 4.2 4.6
Div Payout Ratio (%) 23.4 21.8 20.0 20.0 20.0
Net Interest Cover (x) 4.3 6.0 7.6 13.2 28.0
Source: Company, AllianceDBS Research
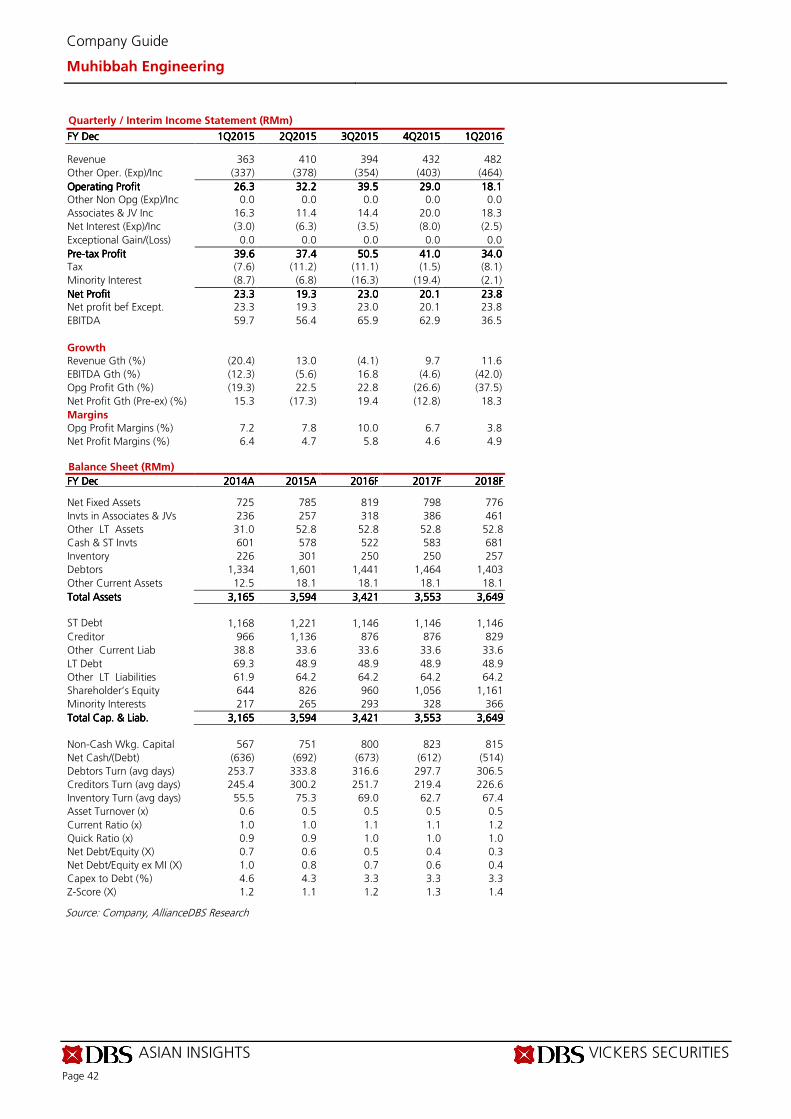
ASIAN INSIGHTS VICKERS SECURITIES
Page 42
Company Guide
Muhibbah Engineering
Quarterly / Interim Income Statement (RMm)
FY FY FY FY DecDecDecDec 1Q1Q1Q1Q2015201520152015 2Q2Q2Q2Q2015201520152015 3Q3Q3Q3Q2015201520152015 4Q4Q4Q4Q2015201520152015 1Q1Q1Q1Q2016201620162016 Revenue 363 410 394 432 482
Other Oper. (Exp)/Inc (337) (378) (354) (403) (464)
Operating ProfitOperating ProfitOperating ProfitOperating Profit 26.326.326.326.3 32.232.232.232.2 39.539.539.539.5 29.029.029.029.0 18.118.118.118.1 Other Non Opg (Exp)/Inc 0.0 0.0 0.0 0.0 0.0
Associates & JV Inc 16.3 11.4 14.4 20.0 18.3
Net Interest (Exp)/Inc (3.0) (6.3) (3.5) (8.0) (2.5)
Exceptional Gain/(Loss) 0.0 0.0 0.0 0.0 0.0
PrePrePrePre----tax Profittax Profittax Profittax Profit 39.639.639.639.6 37.437.437.437.4 50.550.550.550.5 41.041.041.041.0 34.034.034.034.0 Tax (7.6) (11.2) (11.1) (1.5) (8.1)
Minority Interest (8.7) (6.8) (16.3) (19.4) (2.1)
Net ProfitNet ProfitNet ProfitNet Profit 23.323.323.323.3 19.319.319.319.3 23.023.023.023.0 20.120.120.120.1 23.823.823.823.8 Net profit bef Except. 23.3 19.3 23.0 20.1 23.8
EBITDA 59.7 56.4 65.9 62.9 36.5
Growth
Revenue Gth (%) (20.4) 13.0 (4.1) 9.7 11.6
EBITDA Gth (%) (12.3) (5.6) 16.8 (4.6) (42.0)
Opg Profit Gth (%) (19.3) 22.5 22.8 (26.6) (37.5)
Net Profit Gth (Pre-ex) (%) 15.3 (17.3) 19.4 (12.8) 18.3
Margins
Opg Profit Margins (%) 7.2 7.8 10.0 6.7 3.8
Net Profit Margins (%) 6.4 4.7 5.8 4.6 4.9
Balance Sheet (RMm)
FY FY FY FY DecDecDecDec 2014201420142014AAAA 2015201520152015AAAA 2016201620162016FFFF 2017201720172017FFFF 2018201820182018FFFF Net Fixed Assets 725 785 819 798 776
Invts in Associates & JVs 236 257 318 386 461
Other LT Assets 31.0 52.8 52.8 52.8 52.8
Cash & ST Invts 601 578 522 583 681
Inventory 226 301 250 250 257
Debtors 1,334 1,601 1,441 1,464 1,403
Other Current Assets 12.5 18.1 18.1 18.1 18.1
Total AssetsTotal AssetsTotal AssetsTotal Assets 3,1653,1653,1653,165 3,5943,5943,5943,594 3,4213,4213,4213,421 3,5533,5533,5533,553 3,6493,6493,6493,649
ST Debt
1,168 1,221 1,146 1,146 1,146
Creditor 966 1,136 876 876 829
Other Current Liab 38.8 33.6 33.6 33.6 33.6
LT Debt 69.3 48.9 48.9 48.9 48.9
Other LT Liabilities 61.9 64.2 64.2 64.2 64.2
Shareholder’s Equity 644 826 960 1,056 1,161
Minority Interests 217 265 293 328 366
Total Cap. & Liab.Total Cap. & Liab.Total Cap. & Liab.Total Cap. & Liab. 3,1653,1653,1653,165 3,5943,5943,5943,594 3,4213,4213,4213,421 3,5533,5533,5533,553 3,6493,6493,6493,649
Non-Cash Wkg. Capital 567 751 800 823 815
Net Cash/(Debt) (636) (692) (673) (612) (514)
Debtors Turn (avg days) 253.7 333.8 316.6 297.7 306.5
Creditors Turn (avg days) 245.4 300.2 251.7 219.4 226.6
Inventory Turn (avg days) 55.5 75.3 69.0 62.7 67.4
Asset Turnover (x) 0.6 0.5 0.5 0.5 0.5
Current Ratio (x) 1.0 1.0 1.1 1.1 1.2
Quick Ratio (x) 0.9 0.9 1.0 1.0 1.0
Net Debt/Equity (X) 0.7 0.6 0.5 0.4 0.3
Net Debt/Equity ex MI (X) 1.0 0.8 0.7 0.6 0.4
Capex to Debt (%) 4.6 4.3 3.3 3.3 3.3
Z-Score (X) 1.2 1.1 1.2 1.3 1.4
Source: Company, AllianceDBS Research
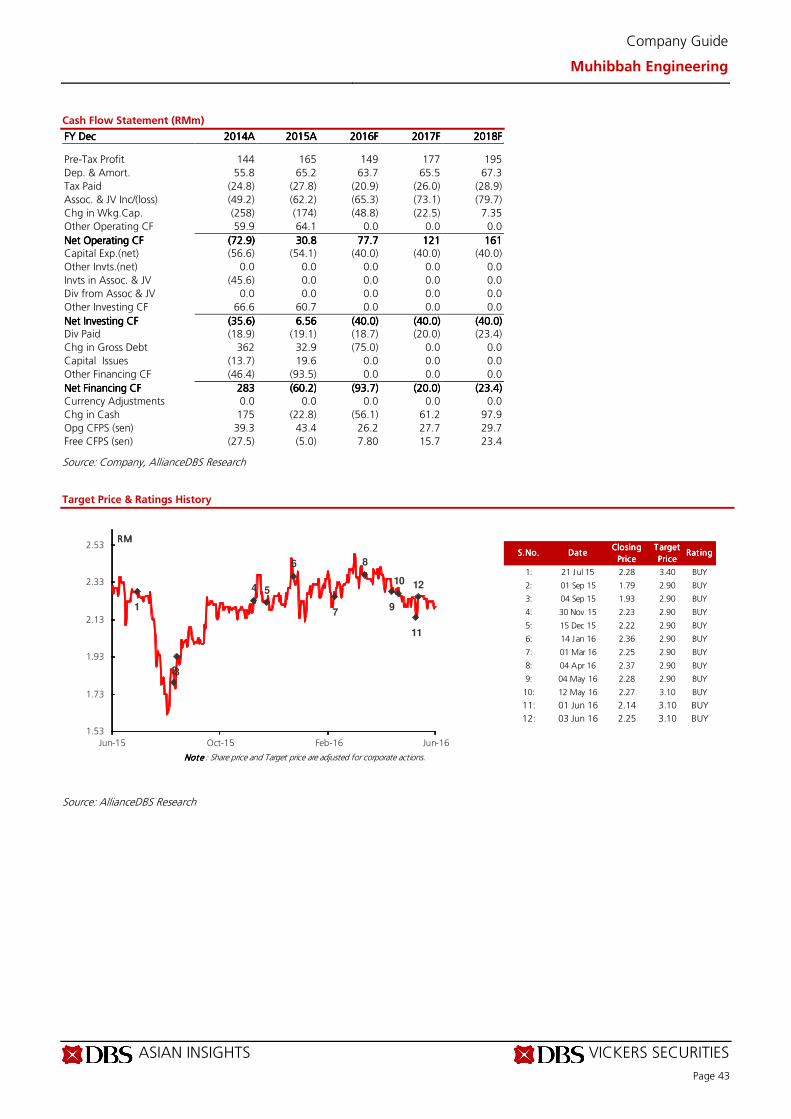
ASIAN INSIGHTS VICKERS SECURITIES
Page 43
Company Guide
Muhibbah Engineering
Cash Flow Statement (RMm)
FY FY FY FY DecDecDecDec 2014201420142014AAAA 2015201520152015AAAA 2016201620162016FFFF 2017201720172017FFFF 2018201820182018FFFF Pre-Tax Profit 144 165 149 177 195
Dep. & Amort. 55.8 65.2 63.7 65.5 67.3
Tax Paid (24.8) (27.8) (20.9) (26.0) (28.9)
Assoc. & JV Inc/(loss) (49.2) (62.2) (65.3) (73.1) (79.7)
Chg in Wkg.Cap. (258) (174) (48.8) (22.5) 7.35
Other Operating CF 59.9 64.1 0.0 0.0 0.0
Net Operating CFNet Operating CFNet Operating CFNet Operating CF (72.9)(72.9)(72.9)(72.9) 30.830.830.830.8 77.777.777.777.7 121121121121 161161161161 Capital Exp.(net) (56.6) (54.1) (40.0) (40.0) (40.0)
Other Invts.(net) 0.0 0.0 0.0 0.0 0.0
Invts in Assoc. & JV (45.6) 0.0 0.0 0.0 0.0
Div from Assoc & JV 0.0 0.0 0.0 0.0 0.0
Other Investing CF 66.6 60.7 0.0 0.0 0.0
Net Investing CFNet Investing CFNet Investing CFNet Investing CF (35.6)(35.6)(35.6)(35.6) 6.566.566.566.56 (40.0)(40.0)(40.0)(40.0) (40.0)(40.0)(40.0)(40.0) (40.0)(40.0)(40.0)(40.0) Div Paid (18.9) (19.1) (18.7) (20.0) (23.4)
Chg in Gross Debt 362 32.9 (75.0) 0.0 0.0
Capital Issues (13.7) 19.6 0.0 0.0 0.0
Other Financing CF (46.4) (93.5) 0.0 0.0 0.0
Net Financing CFNet Financing CFNet Financing CFNet Financing CF 283283283283 (60.2)(60.2)(60.2)(60.2) (93.7)(93.7)(93.7)(93.7) (20.0)(20.0)(20.0)(20.0) (23.4)(23.4)(23.4)(23.4)
Currency Adjustments 0.0 0.0 0.0 0.0 0.0
Chg in Cash 175 (22.8) (56.1) 61.2 97.9
Opg CFPS (sen) 39.3 43.4 26.2 27.7 29.7
Free CFPS (sen) (27.5) (5.0) 7.80 15.7 23.4
Source: Company, AllianceDBS Research
Target Price & Ratings History
Source: AllianceDBS Research
S.No.S.No.S.No.S.No. DateDateDateDateClosing Closing Closing Closing
PricePricePricePrice
Target Target Target Target
PricePricePricePriceRat ing Rat ing Rat ing Rat ing
1: 21 Jul 15 2.28 3.40 BUY
2: 01 Sep 15 1.79 2.90 BUY
3: 04 Sep 15 1.93 2.90 BUY
4: 30 Nov 15 2.23 2.90 BUY
5: 15 Dec 15 2.22 2.90 BUY
6: 14 Jan 16 2.36 2.90 BUY
7: 01 Mar 16 2.25 2.90 BUY
8: 04 Apr 16 2.37 2.90 BUY
9: 04 May 16 2.28 2.90 BUY
10: 12 May 16 2.27 3.10 BUY
11: 01 Jun 16 2.14 3.10 BUY
12: 03 Jun 16 2.25 3.10 BUY
Note Note Note Note : Share price and Target price are adjusted for corporate actions.
1
23
4 5
6
7
8
9
10
11
12
1.53
1.73
1.93
2.13
2.33
2.53
Jun-15 Oct-15 Feb-16 Jun-16
RMRMRMRM
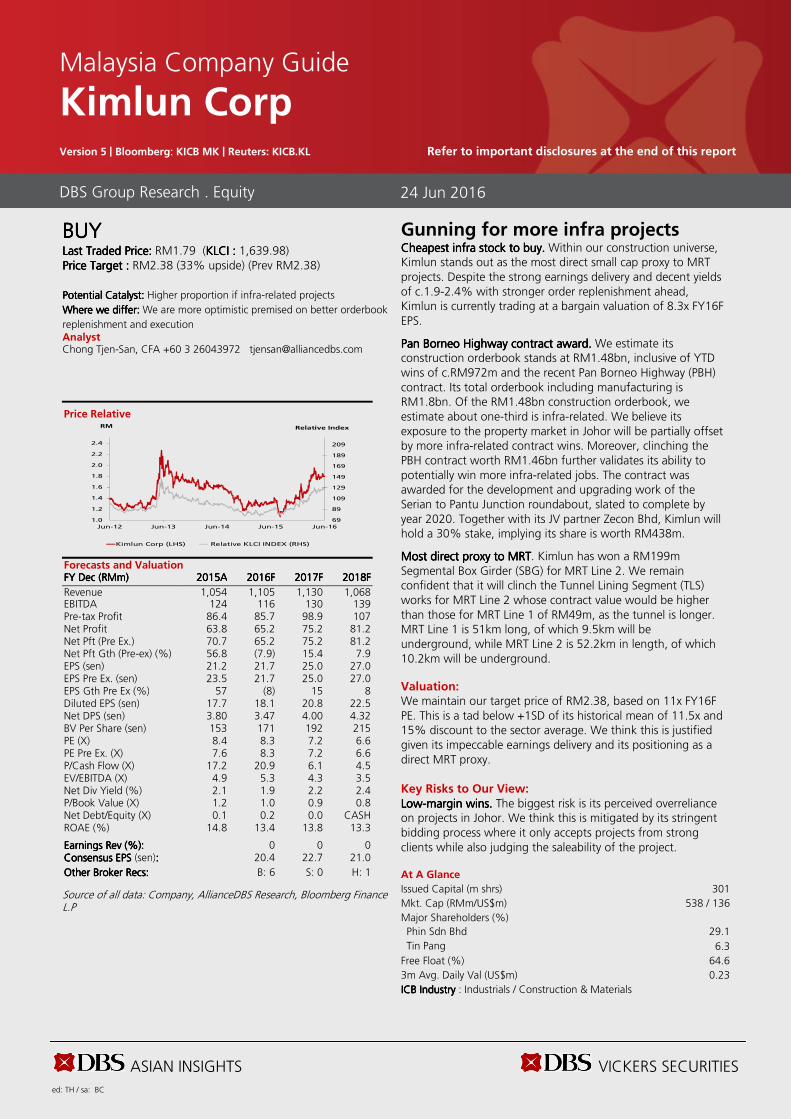
ASIAN INSIGHTS VICKERS SECURITIES ed: TH / sa: BC
BUYBUYBUYBUY Last Traded Price: Last Traded Price: Last Traded Price: Last Traded Price: RM1.79 (KLCIKLCIKLCIKLCI : : : : 1,639.98) Price Target :Price Target :Price Target :Price Target : RM2.38 (33% upside) (Prev RM2.38)
Potential Catalyst: Potential Catalyst: Potential Catalyst: Potential Catalyst: Higher proportion if infra-related projects
Where we differWhere we differWhere we differWhere we differ:::: We are more optimistic premised on better orderbook
replenishment and execution Analyst Chong Tjen-San, CFA +60 3 26043972 [email protected]
Price Relative
Forecasts and Valuation FY FY FY FY DecDecDecDec ((((RMRMRMRMmmmm) ) ) ) 2015201520152015AAAA 2016201620162016FFFF 2017201720172017FFFF 2018201820182018FFFF
Revenue 1,054 1,105 1,130 1,068 EBITDA 124 116 130 139 Pre-tax Profit 86.4 85.7 98.9 107 Net Profit 63.8 65.2 75.2 81.2 Net Pft (Pre Ex.) 70.7 65.2 75.2 81.2 Net Pft Gth (Pre-ex) (%) 56.8 (7.9) 15.4 7.9 EPS (sen) 21.2 21.7 25.0 27.0 EPS Pre Ex. (sen) 23.5 21.7 25.0 27.0 EPS Gth Pre Ex (%) 57 (8) 15 8 Diluted EPS (sen) 17.7 18.1 20.8 22.5 Net DPS (sen) 3.80 3.47 4.00 4.32 BV Per Share (sen) 153 171 192 215 PE (X) 8.4 8.3 7.2 6.6 PE Pre Ex. (X) 7.6 8.3 7.2 6.6 P/Cash Flow (X) 17.2 20.9 6.1 4.5 EV/EBITDA (X) 4.9 5.3 4.3 3.5 Net Div Yield (%) 2.1 1.9 2.2 2.4 P/Book Value (X) 1.2 1.0 0.9 0.8 Net Debt/Equity (X) 0.1 0.2 0.0 CASH ROAE (%) 14.8 13.4 13.8 13.3 Earnings Rev (%):Earnings Rev (%):Earnings Rev (%):Earnings Rev (%): 0 0 0 Consensus EPS Consensus EPS Consensus EPS Consensus EPS (sen):::: 20.4 22.7 21.0
Other Broker Recs:Other Broker Recs:Other Broker Recs:Other Broker Recs: B: 6 S: 0 H: 1
Source of all data: Company, AllianceDBS Research, Bloomberg Finance L.P
Gunning for more infra projects Cheapest infra stock to buy. Cheapest infra stock to buy. Cheapest infra stock to buy. Cheapest infra stock to buy. Within our construction universe, Kimlun stands out as the most direct small cap proxy to MRT projects. Despite the strong earnings delivery and decent yields of c.1.9-2.4% with stronger order replenishment ahead, Kimlun is currently trading at a bargain valuation of 8.3x FY16F EPS. Pan Borneo Highway contract award. Pan Borneo Highway contract award. Pan Borneo Highway contract award. Pan Borneo Highway contract award. We estimate its construction orderbook stands at RM1.48bn, inclusive of YTD wins of c.RM972m and the recent Pan Borneo Highway (PBH) contract. Its total orderbook including manufacturing is RM1.8bn. Of the RM1.48bn construction orderbook, we estimate about one-third is infra-related. We believe its exposure to the property market in Johor will be partially offset by more infra-related contract wins. Moreover, clinching the PBH contract worth RM1.46bn further validates its ability to potentially win more infra-related jobs. The contract was awarded for the development and upgrading work of the Serian to Pantu Junction roundabout, slated to complete by year 2020. Together with its JV partner Zecon Bhd, Kimlun will hold a 30% stake, implying its share is worth RM438m. Most direct proxy to MRTMost direct proxy to MRTMost direct proxy to MRTMost direct proxy to MRT. Kimlun has won a RM199m Segmental Box Girder (SBG) for MRT Line 2. We remain confident that it will clinch the Tunnel Lining Segment (TLS) works for MRT Line 2 whose contract value would be higher than those for MRT Line 1 of RM49m, as the tunnel is longer. MRT Line 1 is 51km long, of which 9.5km will be underground, while MRT Line 2 is 52.2km in length, of which 10.2km will be underground. Valuation: We maintain our target price of RM2.38, based on 11x FY16F PE. This is a tad below +1SD of its historical mean of 11.5x and 15% discount to the sector average. We think this is justified given its impeccable earnings delivery and its positioning as a direct MRT proxy. Key Risks to Our View: LowLowLowLow----margin wins. margin wins. margin wins. margin wins. The biggest risk is its perceived overreliance on projects in Johor. We think this is mitigated by its stringent bidding process where it only accepts projects from strong clients while also judging the saleability of the project. At A Glance Issued Capital (m shrs) 301
Mkt. Cap (RMm/US$m) 538 / 136
Major Shareholders (%)
Phin Sdn Bhd 29.1
Tin Pang 6.3
Free Float (%) 64.6
3m Avg. Daily Val (US$m) 0.23
ICB IndustryICB IndustryICB IndustryICB Industry : Industrials / Construction & Materials
DBS Group Research . Equity
24 Jun 2016
Malaysia Company Guide
Kimlun Corp Version 5 | Bloomberg: KICB MK | Reuters: KICB.KL Refer to important disclosures at the end of this report
69
89
109
129
149
169
189
209
1.0
1.2
1.4
1.6
1.8
2.0
2.2
2.4
Jun-12 Jun-13 Jun-14 Jun-15 Jun-16
Relative IndexRM
Kimlun Corp (LHS) Relative KLCI INDEX (RHS)
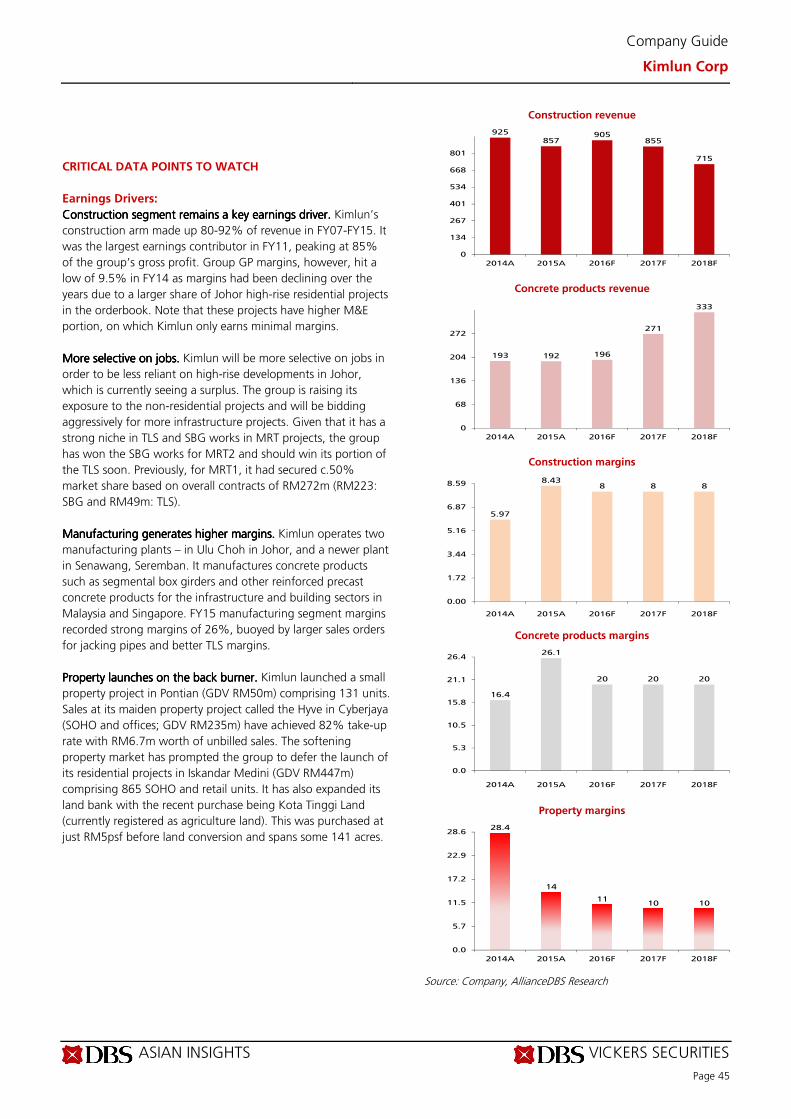
ASIAN INSIGHTS VICKERS SECURITIES
Page 45
Company Guide
Kimlun Corp
CRITICAL DATA POINTS TO WATCH
Earnings Drivers:
Construction segment remains a key earnings driver.Construction segment remains a key earnings driver.Construction segment remains a key earnings driver.Construction segment remains a key earnings driver. Kimlun’s
construction arm made up 80-92% of revenue in FY07-FY15. It
was the largest earnings contributor in FY11, peaking at 85%
of the group’s gross profit. Group GP margins, however, hit a
low of 9.5% in FY14 as margins had been declining over the
years due to a larger share of Johor high-rise residential projects
in the orderbook. Note that these projects have higher M&E
portion, on which Kimlun only earns minimal margins.
More selective on jobs.More selective on jobs.More selective on jobs.More selective on jobs. Kimlun will be more selective on jobs in
order to be less reliant on high-rise developments in Johor,
which is currently seeing a surplus. The group is raising its
exposure to the non-residential projects and will be bidding
aggressively for more infrastructure projects. Given that it has a
strong niche in TLS and SBG works in MRT projects, the group
has won the SBG works for MRT2 and should win its portion of
the TLS soon. Previously, for MRT1, it had secured c.50%
market share based on overall contracts of RM272m (RM223:
SBG and RM49m: TLS).
Manufacturing generates higher margins.Manufacturing generates higher margins.Manufacturing generates higher margins.Manufacturing generates higher margins. Kimlun operates two
manufacturing plants – in Ulu Choh in Johor, and a newer plant
in Senawang, Seremban. It manufactures concrete products
such as segmental box girders and other reinforced precast
concrete products for the infrastructure and building sectors in
Malaysia and Singapore. FY15 manufacturing segment margins
recorded strong margins of 26%, buoyed by larger sales orders
for jacking pipes and better TLS margins.
Property launches on the back burner. Property launches on the back burner. Property launches on the back burner. Property launches on the back burner. Kimlun launched a small
property project in Pontian (GDV RM50m) comprising 131 units.
Sales at its maiden property project called the Hyve in Cyberjaya
(SOHO and offices; GDV RM235m) have achieved 82% take-up
rate with RM6.7m worth of unbilled sales. The softening
property market has prompted the group to defer the launch of
its residential projects in Iskandar Medini (GDV RM447m)
comprising 865 SOHO and retail units. It has also expanded its
land bank with the recent purchase being Kota Tinggi Land
(currently registered as agriculture land). This was purchased at
just RM5psf before land conversion and spans some 141 acres.
Construction revenue
Concrete products revenue
Construction margins
Concrete products margins
Property margins
Source: Company, AllianceDBS Research
925857
905855
715
0
134
267
401
534
668
801
2014A 2015A 2016F 2017F 2018F
193 192 196
271
333
0
68
136
204
272
2014A 2015A 2016F 2017F 2018F
5.97
8.438 8 8
0.00
1.72
3.44
5.16
6.87
8.59
2014A 2015A 2016F 2017F 2018F
16.4
26.1
20 20 20
0.0
5.3
10.5
15.8
21.1
26.4
2014A 2015A 2016F 2017F 2018F
28.4
14
1110 10
0.0
5.7
11.5
17.2
22.9
28.6
2014A 2015A 2016F 2017F 2018F
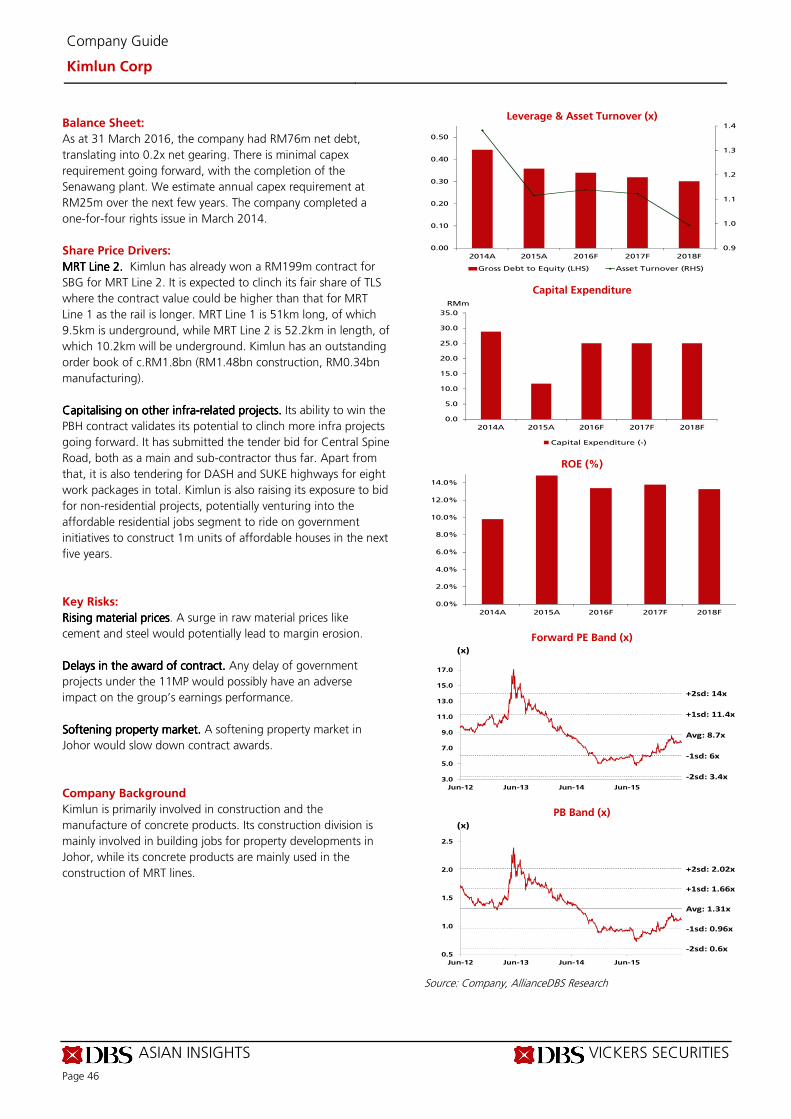
ASIAN INSIGHTS VICKERS SECURITIES
Page 46
Company Guide
Kimlun Corp
Balance Sheet:
As at 31 March 2016, the company had RM76m net debt,
translating into 0.2x net gearing. There is minimal capex
requirement going forward, with the completion of the
Senawang plant. We estimate annual capex requirement at
RM25m over the next few years. The company completed a
one-for-four rights issue in March 2014.
Share Price Drivers:
MRT Line 2. MRT Line 2. MRT Line 2. MRT Line 2. Kimlun has already won a RM199m contract for
SBG for MRT Line 2. It is expected to clinch its fair share of TLS
where the contract value could be higher than that for MRT
Line 1 as the rail is longer. MRT Line 1 is 51km long, of which
9.5km is underground, while MRT Line 2 is 52.2km in length, of
which 10.2km will be underground. Kimlun has an outstanding
order book of c.RM1.8bn (RM1.48bn construction, RM0.34bn
manufacturing).
Capitalising on other infraCapitalising on other infraCapitalising on other infraCapitalising on other infra----related projects.related projects.related projects.related projects. Its ability to win the
PBH contract validates its potential to clinch more infra projects
going forward. It has submitted the tender bid for Central Spine
Road, both as a main and sub-contractor thus far. Apart from
that, it is also tendering for DASH and SUKE highways for eight
work packages in total. Kimlun is also raising its exposure to bid
for non-residential projects, potentially venturing into the
affordable residential jobs segment to ride on government
initiatives to construct 1m units of affordable houses in the next
five years.
Key Risks:
Rising material pricesRising material pricesRising material pricesRising material prices. A surge in raw material prices like
cement and steel would potentially lead to margin erosion.
DelaysDelaysDelaysDelays in the award of contract. in the award of contract. in the award of contract. in the award of contract. Any delay of government
projects under the 11MP would possibly have an adverse
impact on the group’s earnings performance.
Softening property market. Softening property market. Softening property market. Softening property market. A softening property market in
Johor would slow down contract awards.
Company Background
Kimlun is primarily involved in construction and the
manufacture of concrete products. Its construction division is
mainly involved in building jobs for property developments in
Johor, while its concrete products are mainly used in the
construction of MRT lines.
Leverage & Asset Turnover (x)
Capital Expenditure
ROE (%)
Forward PE Band (x)
PB Band (x)
Source: Company, AllianceDBS Research
0.9
1.0
1.1
1.2
1.3
1.4
0.00
0.10
0.20
0.30
0.40
0.50
2014A 2015A 2016F 2017F 2018F
Gross Debt to Equity (LHS) Asset Turnover (RHS)
0.0
5.0
10.0
15.0
20.0
25.0
30.0
35.0
2014A 2015A 2016F 2017F 2018F
Capital Expenditure (-)
RMm
0.0%
2.0%
4.0%
6.0%
8.0%
10.0%
12.0%
14.0%
2014A 2015A 2016F 2017F 2018F
Avg: 8.7x
+1sd: 11.4x
+2sd: 14x
-1sd: 6x
-2sd: 3.4x3.0
5.0
7.0
9.0
11.0
13.0
15.0
17.0
Jun-12 Jun-13 Jun-14 Jun-15
(x)
Avg: 1.31x
+1sd: 1.66x
+2sd: 2.02x
-1sd: 0.96x
-2sd: 0.6x0.5
1.0
1.5
2.0
2.5
Jun-12 Jun-13 Jun-14 Jun-15
(x)
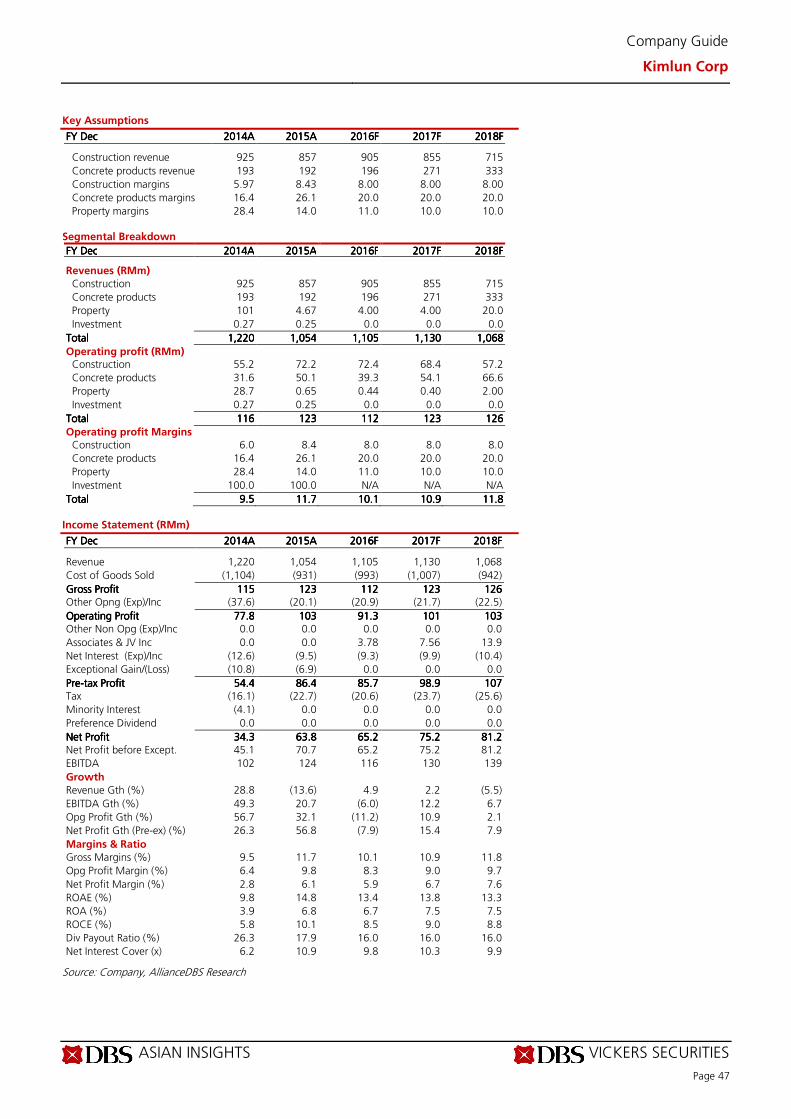
ASIAN INSIGHTS VICKERS SECURITIES
Page 47
Company Guide
Kimlun Corp
Key Assumptions
FY FY FY FY DecDecDecDec 2014201420142014AAAA 2015201520152015AAAA 2016201620162016FFFF 2017201720172017FFFF 2018201820182018FFFF
Construction revenue 925 857 905 855 715
Concrete products revenue 193 192 196 271 333
Construction margins 5.97 8.43 8.00 8.00 8.00
Concrete products margins 16.4 26.1 20.0 20.0 20.0
Property margins 28.4 14.0 11.0 10.0 10.0 Segmental Breakdown
FY FY FY FY DecDecDecDec 2014201420142014AAAA 2015201520152015AAAA 2016201620162016FFFF 2017201720172017FFFF 2018201820182018FFFF Revenues (RMm)
Construction 925 857 905 855 715
Concrete products 193 192 196 271 333
Property 101 4.67 4.00 4.00 20.0
Investment 0.27 0.25 0.0 0.0 0.0
TotalTotalTotalTotal 1,2201,2201,2201,220 1,0541,0541,0541,054 1,1051,1051,1051,105 1,1301,1301,1301,130 1,0681,0681,0681,068
Operating profit (RMm) Construction 55.2 72.2 72.4 68.4 57.2
Concrete products 31.6 50.1 39.3 54.1 66.6
Property 28.7 0.65 0.44 0.40 2.00
Investment 0.27 0.25 0.0 0.0 0.0
TotalTotalTotalTotal 116116116116 123123123123 112112112112 123123123123 126126126126
Operating profit Margins (%)
Construction 6.0 8.4 8.0 8.0 8.0
Concrete products 16.4 26.1 20.0 20.0 20.0
Property 28.4 14.0 11.0 10.0 10.0
Investment 100.0 100.0 N/A N/A N/A
TotalTotalTotalTotal 9.59.59.59.5 11.711.711.711.7 10.110.110.110.1 10.910.910.910.9 11.811.811.811.8
Income Statement (RMm)
FY FY FY FY DecDecDecDec 2014201420142014AAAA 2015201520152015AAAA 2016201620162016FFFF 2017201720172017FFFF 2018201820182018FFFF Revenue 1,220 1,054 1,105 1,130 1,068
Cost of Goods Sold (1,104) (931) (993) (1,007) (942)
Gross ProfitGross ProfitGross ProfitGross Profit 115115115115 123123123123 112112112112 123123123123 126126126126 Other Opng (Exp)/Inc (37.6) (20.1) (20.9) (21.7) (22.5)
Operating ProfitOperating ProfitOperating ProfitOperating Profit 77.877.877.877.8 103103103103 91.391.391.391.3 101101101101 103103103103 Other Non Opg (Exp)/Inc 0.0 0.0 0.0 0.0 0.0
Associates & JV Inc 0.0 0.0 3.78 7.56 13.9
Net Interest (Exp)/Inc (12.6) (9.5) (9.3) (9.9) (10.4)
Exceptional Gain/(Loss) (10.8) (6.9) 0.0 0.0 0.0
PrePrePrePre----tax Profittax Profittax Profittax Profit 54.454.454.454.4 86.486.486.486.4 85.785.785.785.7 98.998.998.998.9 107107107107 Tax (16.1) (22.7) (20.6) (23.7) (25.6)
Minority Interest (4.1) 0.0 0.0 0.0 0.0
Preference Dividend 0.0 0.0 0.0 0.0 0.0
Net ProfitNet ProfitNet ProfitNet Profit 34.334.334.334.3 63.863.863.863.8 65.265.265.265.2 75.275.275.275.2 81.281.281.281.2 Net Profit before Except. 45.1 70.7 65.2 75.2 81.2
EBITDA 102 124 116 130 139
Growth
Revenue Gth (%) 28.8 (13.6) 4.9 2.2 (5.5)
EBITDA Gth (%) 49.3 20.7 (6.0) 12.2 6.7
Opg Profit Gth (%) 56.7 32.1 (11.2) 10.9 2.1
Net Profit Gth (Pre-ex) (%) 26.3 56.8 (7.9) 15.4 7.9
Margins & Ratio
Gross Margins (%) 9.5 11.7 10.1 10.9 11.8
Opg Profit Margin (%) 6.4 9.8 8.3 9.0 9.7
Net Profit Margin (%) 2.8 6.1 5.9 6.7 7.6
ROAE (%) 9.8 14.8 13.4 13.8 13.3
ROA (%) 3.9 6.8 6.7 7.5 7.5
ROCE (%) 5.8 10.1 8.5 9.0 8.8
Div Payout Ratio (%) 26.3 17.9 16.0 16.0 16.0
Net Interest Cover (x) 6.2 10.9 9.8 10.3 9.9
Source: Company, AllianceDBS Research
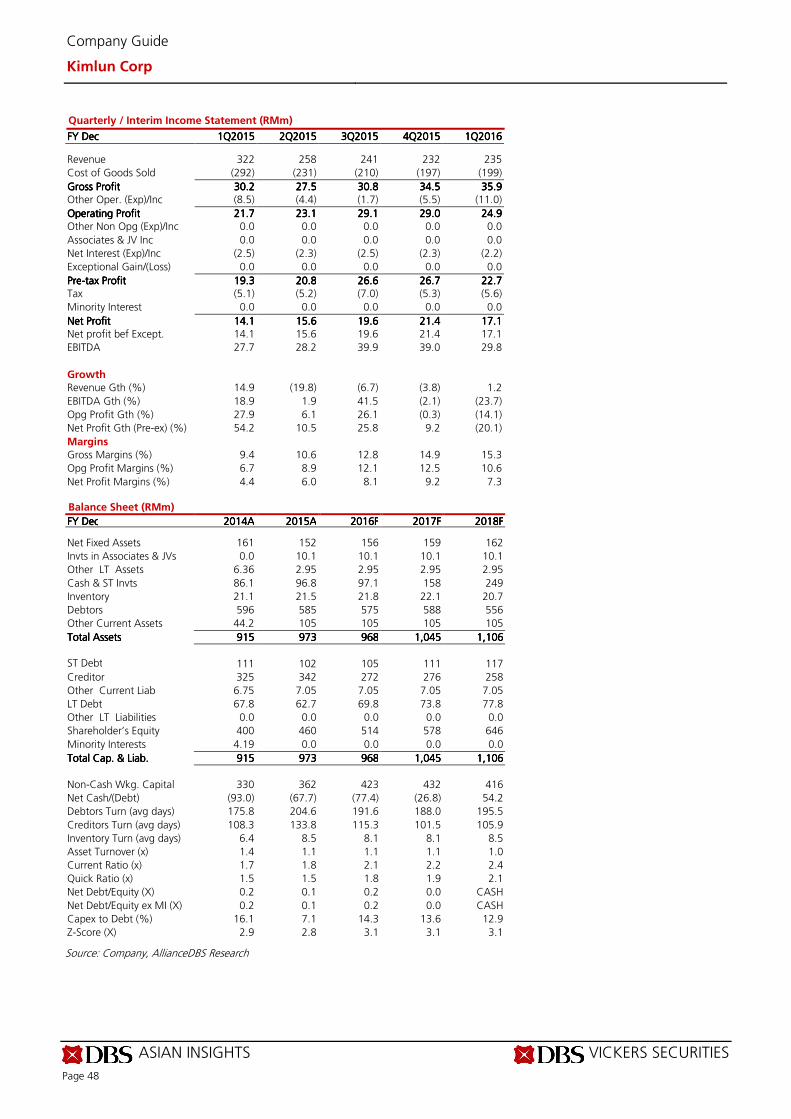
ASIAN INSIGHTS VICKERS SECURITIES
Page 48
Company Guide
Kimlun Corp
Quarterly / Interim Income Statement (RMm)
FY FY FY FY DecDecDecDec 1Q1Q1Q1Q2015201520152015 2Q2Q2Q2Q2015201520152015 3Q3Q3Q3Q2015201520152015 4Q4Q4Q4Q2015201520152015 1Q1Q1Q1Q2016201620162016 Revenue 322 258 241 232 235
Cost of Goods Sold (292) (231) (210) (197) (199)
Gross ProfitGross ProfitGross ProfitGross Profit 30.230.230.230.2 27.527.527.527.5 30.830.830.830.8 34.534.534.534.5 35.935.935.935.9 Other Oper. (Exp)/Inc (8.5) (4.4) (1.7) (5.5) (11.0)
Operating ProfitOperating ProfitOperating ProfitOperating Profit 21.721.721.721.7 23.123.123.123.1 29.129.129.129.1 29.029.029.029.0 24.924.924.924.9 Other Non Opg (Exp)/Inc 0.0 0.0 0.0 0.0 0.0
Associates & JV Inc 0.0 0.0 0.0 0.0 0.0
Net Interest (Exp)/Inc (2.5) (2.3) (2.5) (2.3) (2.2)
Exceptional Gain/(Loss) 0.0 0.0 0.0 0.0 0.0
PrePrePrePre----tax Profittax Profittax Profittax Profit 19.319.319.319.3 20.820.820.820.8 26.626.626.626.6 26.726.726.726.7 22.722.722.722.7 Tax (5.1) (5.2) (7.0) (5.3) (5.6)
Minority Interest 0.0 0.0 0.0 0.0 0.0
Net ProfitNet ProfitNet ProfitNet Profit 14.114.114.114.1 15.615.615.615.6 19.619.619.619.6 21.421.421.421.4 17.117.117.117.1 Net profit bef Except. 14.1 15.6 19.6 21.4 17.1
EBITDA 27.7 28.2 39.9 39.0 29.8
Growth
Revenue Gth (%) 14.9 (19.8) (6.7) (3.8) 1.2
EBITDA Gth (%) 18.9 1.9 41.5 (2.1) (23.7)
Opg Profit Gth (%) 27.9 6.1 26.1 (0.3) (14.1)
Net Profit Gth (Pre-ex) (%) 54.2 10.5 25.8 9.2 (20.1)
Margins
Gross Margins (%) 9.4 10.6 12.8 14.9 15.3
Opg Profit Margins (%) 6.7 8.9 12.1 12.5 10.6
Net Profit Margins (%) 4.4 6.0 8.1 9.2 7.3 Balance Sheet (RMm)
FY FY FY FY DecDecDecDec 2014201420142014AAAA 2015201520152015AAAA 2016201620162016FFFF 2017201720172017FFFF 2018201820182018FFFF Net Fixed Assets 161 152 156 159 162
Invts in Associates & JVs 0.0 10.1 10.1 10.1 10.1
Other LT Assets 6.36 2.95 2.95 2.95 2.95
Cash & ST Invts 86.1 96.8 97.1 158 249
Inventory 21.1 21.5 21.8 22.1 20.7
Debtors 596 585 575 588 556
Other Current Assets 44.2 105 105 105 105
Total AssetsTotal AssetsTotal AssetsTotal Assets 915915915915 973973973973 968968968968 1,0451,0451,0451,045 1,1061,1061,1061,106
ST Debt
111 102 105 111 117
Creditor 325 342 272 276 258
Other Current Liab 6.75 7.05 7.05 7.05 7.05
LT Debt 67.8 62.7 69.8 73.8 77.8
Other LT Liabilities 0.0 0.0 0.0 0.0 0.0
Shareholder’s Equity 400 460 514 578 646
Minority Interests 4.19 0.0 0.0 0.0 0.0
Total Cap. & Liab.Total Cap. & Liab.Total Cap. & Liab.Total Cap. & Liab. 915915915915 973973973973 968968968968 1,0451,0451,0451,045 1,1061,1061,1061,106
Non-Cash Wkg. Capital 330 362 423 432 416
Net Cash/(Debt) (93.0) (67.7) (77.4) (26.8) 54.2
Debtors Turn (avg days) 175.8 204.6 191.6 188.0 195.5
Creditors Turn (avg days) 108.3 133.8 115.3 101.5 105.9
Inventory Turn (avg days) 6.4 8.5 8.1 8.1 8.5
Asset Turnover (x) 1.4 1.1 1.1 1.1 1.0
Current Ratio (x) 1.7 1.8 2.1 2.2 2.4
Quick Ratio (x) 1.5 1.5 1.8 1.9 2.1
Net Debt/Equity (X) 0.2 0.1 0.2 0.0 CASH
Net Debt/Equity ex MI (X) 0.2 0.1 0.2 0.0 CASH
Capex to Debt (%) 16.1 7.1 14.3 13.6 12.9
Z-Score (X) 2.9 2.8 3.1 3.1 3.1
Source: Company, AllianceDBS Research
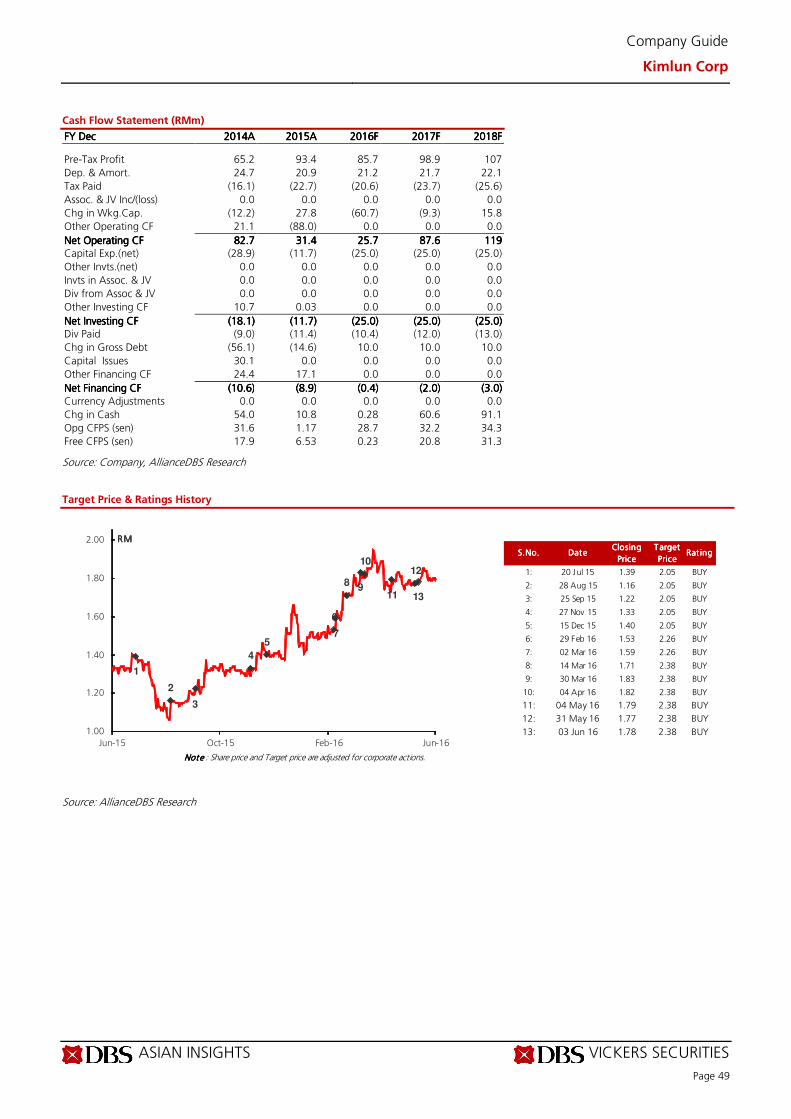
ASIAN INSIGHTS VICKERS SECURITIES
Page 49
Company Guide
Kimlun Corp
Cash Flow Statement (RMm)
FY FY FY FY DecDecDecDec 2014201420142014AAAA 2015201520152015AAAA 2016201620162016FFFF 2017201720172017FFFF 2018201820182018FFFF Pre-Tax Profit 65.2 93.4 85.7 98.9 107
Dep. & Amort. 24.7 20.9 21.2 21.7 22.1
Tax Paid (16.1) (22.7) (20.6) (23.7) (25.6)
Assoc. & JV Inc/(loss) 0.0 0.0 0.0 0.0 0.0
Chg in Wkg.Cap. (12.2) 27.8 (60.7) (9.3) 15.8
Other Operating CF 21.1 (88.0) 0.0 0.0 0.0
Net Operating CFNet Operating CFNet Operating CFNet Operating CF 82.782.782.782.7 31.431.431.431.4 25.725.725.725.7 87.687.687.687.6 119119119119 Capital Exp.(net) (28.9) (11.7) (25.0) (25.0) (25.0)
Other Invts.(net) 0.0 0.0 0.0 0.0 0.0
Invts in Assoc. & JV 0.0 0.0 0.0 0.0 0.0
Div from Assoc & JV 0.0 0.0 0.0 0.0 0.0
Other Investing CF 10.7 0.03 0.0 0.0 0.0
Net Investing CFNet Investing CFNet Investing CFNet Investing CF (18.1)(18.1)(18.1)(18.1) (11.7)(11.7)(11.7)(11.7) (25.0)(25.0)(25.0)(25.0) (25.0)(25.0)(25.0)(25.0) (25.0)(25.0)(25.0)(25.0) Div Paid (9.0) (11.4) (10.4) (12.0) (13.0)
Chg in Gross Debt (56.1) (14.6) 10.0 10.0 10.0
Capital Issues 30.1 0.0 0.0 0.0 0.0
Other Financing CF 24.4 17.1 0.0 0.0 0.0
Net Financing CFNet Financing CFNet Financing CFNet Financing CF (10.6)(10.6)(10.6)(10.6) (8.9)(8.9)(8.9)(8.9) (0.4)(0.4)(0.4)(0.4) (2.0)(2.0)(2.0)(2.0) (3.0)(3.0)(3.0)(3.0)
Currency Adjustments 0.0 0.0 0.0 0.0 0.0
Chg in Cash 54.0 10.8 0.28 60.6 91.1
Opg CFPS (sen) 31.6 1.17 28.7 32.2 34.3
Free CFPS (sen) 17.9 6.53 0.23 20.8 31.3
Source: Company, AllianceDBS Research
Target Price & Ratings History
Source: AllianceDBS Research
S.No.S.No.S.No.S.No. DateDateDateDateClosing Closing Closing Closing
PricePricePricePrice
Target Target Target Target
PricePricePricePriceRat ing Rat ing Rat ing Rat ing
1: 20 Jul 15 1.39 2.05 BUY
2: 28 Aug 15 1.16 2.05 BUY
3: 25 Sep 15 1.22 2.05 BUY
4: 27 Nov 15 1.33 2.05 BUY
5: 15 Dec 15 1.40 2.05 BUY
6: 29 Feb 16 1.53 2.26 BUY
7: 02 Mar 16 1.59 2.26 BUY
8: 14 Mar 16 1.71 2.38 BUY
9: 30 Mar 16 1.83 2.38 BUY
10: 04 Apr 16 1.82 2.38 BUY
11: 04 May 16 1.79 2.38 BUY
12: 31 May 16 1.77 2.38 BUY
13: 03 Jun 16 1.78 2.38 BUY
Note Note Note Note : Share price and Target price are adjusted for corporate actions.
1
2
3
4
5
6
7
89
10
11
12
13
1.00
1.20
1.40
1.60
1.80
2.00
Jun-15 Oct-15 Feb-16 Jun-16
RMRMRMRM
Industry Focus
Malaysian Construction
Page 50
AllianceDBS Research recommendations are based an Absolute Total Return* Rating system, defined as follows:
STRONG BUYSTRONG BUYSTRONG BUYSTRONG BUY (>20% total return over the next 3 months, with identifiable share price catalysts within this time frame)
BUY BUY BUY BUY (>15% total return over the next 12 months for small caps, >10% for large caps)
HOLDHOLDHOLDHOLD (-10% to +15% total return over the next 12 months for small caps, -10% to +10% for large caps)
FULLY VALUEDFULLY VALUEDFULLY VALUEDFULLY VALUED (negative total return i.e. > -10% over the next 12 months)
SELL SELL SELL SELL (negative total return of > -20% over the next 3 months, with identifiable catalysts within this time frame)
Share price appreciation + dividends
GENERAL DISCLOSURE/DISCLAIMER GENERAL DISCLOSURE/DISCLAIMER GENERAL DISCLOSURE/DISCLAIMER GENERAL DISCLOSURE/DISCLAIMER
This report is prepared by This report is prepared by This report is prepared by This report is prepared by AllianceDBS Research Sdn BhdAllianceDBS Research Sdn BhdAllianceDBS Research Sdn BhdAllianceDBS Research Sdn Bhd. . . . This report is solely intended for the clients of DBS Bank Ltd and DBS Vickers Securities
(Singapore) Pte Ltd, its respective connected and associated corporations and affiliates only and no part of this document may be (i) copied,
photocopied or duplicated in any form or by any means or (ii) redistributed without the prior written consent of AllianceDBS Research Sdn Bhd.
The research set out in this report is based on information obtained from sources believed to be reliable, but we (which collectively refers to DBS
Bank Ltd., its respective connected and associated corporations, affiliates and their respective directors, officers, employees and agents (collectively,
the “DBS Group”)) do not make any representation or warranty as to its accuracy, completeness or correctness. Opinions expressed are subject to
change without notice. This document is prepared for general circulation. Any recommendation contained in this document does not have regard
to the specific investment objectives, financial situation and the particular needs of any specific addressee. This document is for the information of
addressees only and is not to be taken in substitution for the exercise of judgement by addressees, who should obtain separate independent legal
or financial advice. The DBS Group accepts no liability whatsoever for any direct, indirect and/or consequential loss (including any claims for loss of
profit) arising from any use of and/or reliance upon this document and/or further communication given in relation to this document. This
document is not to be construed as an offer or a solicitation of an offer to buy or sell any securities. The DBS Group, along with its affiliates and/or
persons associated with any of them may from time to time have interests in the securities mentioned in this document. The DBS Group may have
positions in, and may effect transactions in securities mentioned herein and may also perform or seek to perform broking, investment banking and
other banking services for these companies.
Any valuations, opinions, estimates, forecasts, ratings or risk assessments herein constitutes a judgment as of the date of this report, and there can
be no assurance that future results or events will be consistent with any such valuations, opinions, estimates, forecasts, ratings or risk assessments.
The information in this document is subject to change without notice, its accuracy is not guaranteed, it may be incomplete or condensed and it
may not contain all material information concerning the company (or companies) referred to in this report.
This publication has not been reviewed or authorized by any regulatory authority in Singapore, Hong Kong or elsewhere.
The valuations, opinions, estimates, forecasts, ratings or risk assessments described in this report were based upon a number of estimates and
assumptions and are inherently subject to significant uncertainties and contingencies. It can be expected that one or more of the estimates on
which the valuations, opinions, estimates, forecasts, ratings or risk assessments were based will not materialize or will vary significantly from actual
results. Therefore, the inclusion of the valuations, opinions, estimates, forecasts, ratings or risk assessments described herein IS NOT TO BE RELIED
UPON as a representation and/or warranty by the DBS Group (and/or any persons associated with the aforesaid entities), that:
(a) such valuations, opinions, estimates, forecasts, ratings or risk assessments or their underlying assumptions will be achieved, and
(b) there is any assurance that future results or events will be consistent with any such valuations, opinions, estimates, forecasts, ratings or risk
assessments stated therein.
Any assumptions made in this report that refers to commodities, are for the purposes of making forecasts for the company (or companies)
mentioned herein. They are not to be construed as recommendations to trade in the physical commodity or in the futures contract relating to the
commodity referred to in this report.
DBS Vickers Securities (USA) Inc ("DBSVUSA")"), a U.S.-registered broker-dealer, does not have its own investment banking or research
department, has not participated in any public offering of securities as a manager or co-manager or in any other investment banking transaction
in the past twelve months and does not engage in market-making.
Industry Focus
Malaysian Construction
Page 51
ANALYST CERTIFICATIONANALYST CERTIFICATIONANALYST CERTIFICATIONANALYST CERTIFICATION
The research analyst(s) primarily responsible for the content of this research report, in part or in whole, certifies that the views about the
companies and their securities expressed in this report accurately reflect his/her personal views. The analyst(s) also certifies that no part of his/her
compensation was, is, or will be, directly, or indirectly, related to specific recommendations or views expressed in this report. As of 24 Jun 2016,
the analyst(s) and his/her spouse and/or relatives who are financially dependent on the analyst(s), do not hold interests in the securities
recommended in this report (“interest” includes direct or indirect ownership of securities).
COMPANYCOMPANYCOMPANYCOMPANY----SPECIFIC / REGULATORY DISCLOSURES SPECIFIC / REGULATORY DISCLOSURES SPECIFIC / REGULATORY DISCLOSURES SPECIFIC / REGULATORY DISCLOSURES
1.1.1.1. DBS Bank Ltd, DBS Vickers Securities (Singapore) Pte Ltd (''DBSVS''), their subsidiaries and/or other affiliates do not have a proprietary
position in the securities recommended in this report as of 31 May 2016
2.2.2.2. Compensation for investment banking services: Compensation for investment banking services: Compensation for investment banking services: Compensation for investment banking services:
DBSVUSA does not have its own investment banking or research department, nor has it participated in any public offering of securities as a
manager or co-manager or in any other investment banking transaction in the past twelve months. Any US persons wishing to obtain further
information, including any clarification on disclosures in this disclaimer, or to effect a transaction in any security discussed in this document
should contact DBSVUSA exclusively.
RESTRICTIONS ON DISTRIBUTION RESTRICTIONS ON DISTRIBUTION RESTRICTIONS ON DISTRIBUTION RESTRICTIONS ON DISTRIBUTION
GeneralGeneralGeneralGeneral This report is not directed to, or intended for distribution to or use by, any person or entity who is a citizen or resident of or located in any locality, state, country or other jurisdiction where such distribution, publication, availability or use would be contrary to law or regulation.
AustraliaAustraliaAustraliaAustralia This report is being distributed in Australia by DBS Bank Ltd. (“DBS”) or DBS Vickers Securities (Singapore) Pte Ltd (“DBSVS”), both of which are exempted from the requirement to hold an Australian Financial Services Licence under the Corporation Act 2001 (“CA”) in respect of financial services provided to the recipients. Both DBS and DBSVS are regulated by the Monetary Authority of Singapore under the laws of Singapore, which differ from Australian laws. Distribution of this report is intended only for “wholesale investors” within the meaning of the CA.
Hong KongHong KongHong KongHong Kong This report is being distributed in Hong Kong by DBS Vickers (Hong Kong) Limited which is licensed and regulated by the Hong Kong Securities and Futures Commission and/or by DBS Bank (Hong Kong) Limited which is regulated by the Hong Kong Monetary Authority and the Securities and Futures Commission. Where this publication relates to a research report, unless otherwise stated in the research report(s), DBS Bank (Hong Kong) Limited is not the issuer of the research report(s). This publication including any research report(s) is/are distributed on the express understanding that, whilst the information contained within is believed to be reliable, the information has not been independently verified by DBS Bank (Hong Kong) Limited. This report is intended for distribution in Hong Kong only to professional investors (as defined in the Securities and Futures Ordinance (Chapter 571 of the Laws of Hong Kong) and any rules promulgated thereunder.)
IndonesiaIndonesiaIndonesiaIndonesia This report is being distributed in Indonesia by PT DBS Vickers Securities Indonesia.
MalaysiaMalaysiaMalaysiaMalaysia This report is distributed in Malaysia by AllianceDBS Research Sdn Bhd ("ADBSR"). Recipients of this report, received from ADBSR are to contact the undersigned at 603-2604 3333 in respect of any matters arising from or in connection with this report. In addition to the General Disclosure/Disclaimer found at the preceding page, recipients of this report are advised that ADBSR (the preparer of this report), its holding company Alliance Investment Bank Berhad, their respective connected and associated corporations, affiliates, their directors, officers, employees, agents and parties related or associated with any of them may have positions in, and may effect transactions in the securities mentioned herein and may also perform or seek to perform broking, investment banking/corporate advisory and other services for the subject companies. They may also have received compensation and/or seek to obtain compensation for broking, investment banking/corporate advisory and other services from the subject companies.
Wong Ming Tek, Executive Director, ADBSR
SingaporeSingaporeSingaporeSingapore This report is distributed in Singapore by DBS Bank Ltd (Company Regn. No. 196800306E) or DBSVS (Company Regn No. 198600294G), both of which are Exempt Financial Advisers as defined in the Financial Advisers Act and regulated by the Monetary Authority of Singapore. DBS Bank Ltd and/or DBSVS, may distribute reports produced by its respective foreign entities, affiliates or other foreign research houses pursuant to an arrangement under Regulation 32C of the Financial Advisers Regulations. Where the report is distributed in Singapore to a person who is not an Accredited Investor, Expert Investor or an Institutional Investor, DBS Bank Ltd accepts legal responsibility for the contents of the report to such persons only to the extent required by law. Singapore recipients should contact DBS Bank Ltd at 6327 2288 for matters arising from, or in connection with the report.
ThailandThailandThailandThailand This report is being distributed in Thailand by DBS Vickers Securities (Thailand) Co Ltd. Research reports distributed are only intended for institutional clients only and no other person may act upon it.
United KingdomUnited KingdomUnited KingdomUnited Kingdom This report is being distributed in the UK by DBS Vickers Securities (UK) Ltd, who is an authorised person in the meaning of the Financial Services and Markets Act and is regulated by The Financial Conduct Authority. Research distributed in the UK is intended only for institutional clients.
DubaiDubaiDubaiDubai This research report is being distributed in The Dubai International Financial Centre (“DIFC”) by DBS Bank Ltd., (DIFC Branch)
Industry Focus
Malaysian Construction
Page 52
having its office at PO Box 506538, 3rd Floor, Building 3, East Wing, Gate Precinct, Dubai International Financial Centre (DIFC),
Dubai, United Arab Emirates. DBS Bank Ltd., (DIFC Branch) is regulated by The Dubai Financial Services Authority. This research report is intended only for professional clients (as defined in the DFSA rulebook) and no other person may act upon it.
United StatesUnited StatesUnited StatesUnited States This report was prepared by AllianceDBS Research Sdn Bhd. DBSVUSA did not participate in its preparation. The research analyst(s) named on this report are not registered as research analysts with FINRA and are not associated persons of DBSVUSA. The research analyst(s) are not subject to FINRA Rule 2241 restrictions on analyst compensation, communications with a subject company, public appearances and trading securities held by a research analyst. This report is being distributed in the United States by DBSVUSA, which accepts responsibility for its contents. This report may only be distributed to Major U.S. Institutional Investors (as defined in SEC Rule 15a-6) and to such other institutional investors and qualified persons as DBSVUSA may authorize. Any U.S. person receiving this report who wishes to effect transactions in any securities referred to herein should contact DBSVUSA directly and not its affiliate.
Other jurisdictionsOther jurisdictionsOther jurisdictionsOther jurisdictions In any other jurisdictions, except if otherwise restricted by laws or regulations, this report is intended only for qualified, professional, institutional or sophisticated investors as defined in the laws and regulations of such jurisdictions.
AllianceDBS Research Sdn BhdAllianceDBS Research Sdn BhdAllianceDBS Research Sdn BhdAllianceDBS Research Sdn Bhd
(128540 U) 19th Floor, Menara Multi-Purpose, Capital Square,
8 Jalan Munshi Abdullah 50100 Kuala Lumpur, Malaysia.
Tel.: +603 2604 3333 Fax: +603 2604 3921 email : [email protected]