Embed Size (px)
Citation preview
Fur Goods
USITC Publication 2702 November 1993
OFFICE OF INDUSTRIES U.S. International Trade Commission Washington, DC 20436
UNITED STATES INTERNATIONAL TRADE COMMISSION
COMMISSIONERS
Don E. Newquist, Chairman Peter S. Watson, Vice Chairman
David B. Rohr Anne E. Brunsdale Carol T. Crawford
Janet A. Nuzum
Roben A. Rogowsky
Director of Operations
Vern Simpson Director of Industries
This report was prepared principally by
Amy K. Harney
Textiles and Apparel Branch Energy, Chemicals, and Textiles Division
Address all communications to Secretary to the Commission
United States International Trade Commission Washington, DC 20436
PREFACE
In 1991 the United States International Trade Commission initiated its current Industry and Trade Summary series of infonnational reports on the thousands of products imported into and exported from the United States. Each summary addresses a different commodityfmdustty. area and contains infonnation on product uses, U.S. and foreign producers, and customs treabnenL Also included is an analysis of the basic factors affecting trends in consumption, production, and trade of the commodity, as well as those bearing on the competitiveness of U.S. industries in ·domestic and foreign marlcets.1
This report on fur goods primarily covers the period 1987-92 and represents one of approximately 250 to 300 individual reports to be produced in this series during the first half of the 1990s. Listed below are the individual summary reports published to date on the chemicals and textiles sectors.
usrrc publication number
Chemicals:
2458
2509 2548
2578 2588
2598
Textiles and apparel:
2543 2580 2642 2695
Publication date Title
November 1991 . . . . • . . . Soaps, Detergents, and Surface-Active Agents
May 1992 • • . . • • • . . . • . . Inorganic Acids August 1992 . • . • . • • • • • • Paints, Inks, and Related
Items November 1992 . . . . . • . . Crude Petroleum December 1992......... Major Primary Oleflns February 1993 ...•....•.... Polyethylene Resins in
Primary Fonns March 1993............ Perfumes, Cosmetics, and
Toiletries
August 1992 ...•......• December 1992 ........ . June 1993 ....•.....•.. November 1993 ....... .
Nonwoven Fabrics Gloves Yams Carpets and Rugs
1 The information and analysis provided in this report are for the pwpose of this report only. Nothing in this report should be construed to indicate how the Commission would find in an investigation conducted wider statutory authority covering the same or similar subject matter.

CONTENTS
Page
Preface . . • . . . . . . . . . . . • . • . . . . • . . . . . . . • . . . . . . • • . • . • . . . • . . . . . . • . . . . • . • . . . . . . • . . . • . . . • . . . i
Introduction •.........••...........••... ~ • . . . . . . . . • . • . . . . . . . . . . . . . . . • . . . . • . . . . . . . . . . . 1
Production process . . . . . . . . . . • . . . . . . . • . . . . . . . . . • . . . . . . . . . . . . • . . . . . . . . . . . • . . . . . . . . . . . . . 1
U. S. industry profile . . . • • . • . . . . . . . . . • . . . . • . . • . • . . . . . . . . • . • . • . . . • • . • . . . . . . . . . . . . . . . . . . 1 Industry structure • . . . • • . . • • • . . • • . . • . . . • . . • . . . . . . . . • . . . . • • . • • . . . • . . • . . . . . . . . . . . . . . . . . 1 Productim costs . • • • . • • • . . . . • . . . . . . . • • . . • • . • • • . . . . . . . . • . • . • • . . • • • . . . . . . . • . . . . . . . . . . . 1 Employees . . • • • . • • . . • . . . • • . . • . . . . • . . • . . . • . . . • • . . • • . • . . . • . . • . . • • . • • • . . . . . . • . • . . . . . . . 3 Profitab~ty • • . . . : . • . . . . . • • . . . • . . • . • . . • . • . • . . . • . . . . . . . . . . . • • . . . • . . . • . . . . • . • . • • . . . . . . s Compeuuve strategies . . . . . • • . . . . . . . • • . . . . . . . . . . . • . . . . . . . . . . . • • . . • . • • • . . • . . . . • . . . . . • . . S
Foreign industry profile . • . . • . • . . . • • . . . • . . . . . . • . . • . • . . • . • . • . • • . . . . • • . . . • • • . • . . . . . . . . . . . 7
International trade measures . . . . . .. . . . . • • . . . . . . . . . . . . . . . . • . . • . • . • . . . . . . . . . • • • . . . • • . . . . . . 9 U.S. tariffs • • . . . • • . • • . . . . . • . . • • . . . . • . . . . . • . . . . • . . . • • . . . • . . • • . . . . . . . • • . • • . . . . • . . . . . . . 9 U.S. Government ttade-related investigations . . . . . . . . . • . . . . . . . . . . . . . . . . . . . . . . . . . . . . . . . . • . . 9 Foreign tariffs . . . . . . . . . . . . . . . . . . . . . . . . . . . . . . . . . . . . . . . . . . . . . . . . . . . . . . . . . . . . . . . . . . . . . . 10 Nontariff ttade measures . . . . . . . . . .. . . . . . . . . . . . . . . . . . . . . . . . . . . . . . . . . . . . . . • . • . . . . . . . . . . . 10
U.S. market • . . . . • • • . . . . . . • . . . . • • . . • • . . . . . . . . • • . . . . . . . . • . . . • . . . • • • . . . . . . . . . . . . . . . . . . . 10
Consumption • • . . • • . . • • . . • • . . . . . . . . • . . . . . . . . . . . . . . . . . . • . . . • . . . . . . . • . . . . . . . . . . . . . . . . . 11 U.S. fur apparel impons ....•..........•....................• ·....•. . . • . . . . . . . . • . • . . . . . 12 U.S. fur article imports • . . . • • . • . . . • . . • • . . . . • . . • • . . . . . . . . . . . . • • . . . . . • . . . . . . . . . . • . .. . . . . . 13
Foreign markets .•.....•......•...........•.. ·.... . . . . . . . . . . . • • . . . • . . . . . . • • . . . • . . . . . . . . 14
U.S. fur apparel exports . . . • . . . . . . . . . . • . . . . . . . . . . . . • . . . . • . . . . • . . . • . . • . . . . • . . . • . • . .. • . . . 14 U.S. fm article exports ..................... · ...•...•. • ...•.........•........•........ · ·... 16
U.S. trade balance . . . . . . . . . . . . . . . . . . . . . . . . . . . . . . . . . . . . . . . . . . . . . . . • . . . . . . . . . . . . . . . . . . . . 16
Appendix A Explanation of tariff and ttade agreement terms • • .. .. • . . . . . . . . . . . . . . . . . . . . . • . . . . . . . . . . . . A-1 Figures 1. Fur goods: Flowchart of U.S. manufacturing sector • • • • . . • • . • • • • . • • • • • . • • • • • • . . • • • . . • • . • 2 2. Fur apparel: Percentage distribution of U.S.
production costs, 1990 . • • • . . . . . . . . • . . . . . . . • . . . . . . . . . • . . . . . . . . . • . . . . . . . . . . . . . . . . . . . 4 3 .. Fur goods: Mink prices and U.S. producer price index,
1983-92. . • . . . . . • • . . . • • . . . . . . . . . . . . . . . . . • . . . . . . . . . • . . . • . . . • . . • . . . . . . . . . . • . . . . . . . 4 4. Fur apparel: U.S. consumption, by sources, 1983-92 . • . . . . . . . . . . . . • . . . . . . . . . . . . . . . . . • • . . 11 Tables 1. Fur goods, SIC 2371: U.S. industry structure, 1972,
1977, 1982, 1987, and 1990-92 .. . . . .. • . .. . . . .. . . . .. . .. . . . .. .. . .. . . .. .. .. . . .. .. .. .. 2 2. Fur apparel: U.S. industry shipments and producer
price index, 1983-92 . . . . . . . . . . • . . . . . . . . . . . . . . . . . . . . . . . • . . . • . . . . . . . . . . • . . . • . . . . . . . 5 3. Fur apparel: U.S. value added and production
worker hours, 1983-92 • . . . • . . . • . . . . . . . . . . . . . . . • . . . . . . . . • . . . . . . . • • . . • . . . . • . . . . . . . . 6 4. Fur apparel: U.S. net sales and median retmn on
sales and assets, for reporting establishments, 1984-92 . . • . . . . . . . . . . . . . • • . . • • . . . . . . . . . • . 6 5. Fur goods: World exports, by principal sources and
markets, 1983, 1987, 1990, and 1991 . . . • . . • • . . . . • . . . • . . . • . . . . • . . . . . . . . . . . . . • . . • • • . . 8 6. Fur apparel: U.S. producers' shipments, exports of
domestic merchandise, imports for consumption, and apparent consumptim, 1983-92 . • • • . . . . . . • . . . . . . • . . . . • . . . . . . • . . . . . . . . . • • . . . . . . . . . . . 8
7. Fur goods: Foreign tariff rates applying to U.S. exports, by selected marlcets • • . . • . . . . . • . . . . . . . . • . . . . . . . . . . . . . • . . . . • . . . . . . . . . • . • . • . . 11
8. Fur apparel: U.S. imports for consumption, by principal sources, 1987-92 • . . . . . . . . . . . . . . . . . . . . . . . . . . . . . . . . . . . . . . . . . • . . . . . . . . . . . . . . . . . . . . . 13
9. Nonapparel fur articles: U.S. imports for consumption, by principal sources, 1987-92 . . . . • . . . . . . . . . . . . • • . . . . . . . . . . . . . . . . . . . . . . • . . . • • . . . . • . . 13
iii
CONTENTS-Continued Page
10. Fm goods: World imports, by principal markets and · sources, 1983, 1987, 1990, and 1991 .. . .. .. .. .. . .. .. .. .. .. .. . .. .. .. .. .. .. . . . . .. .. . .. 15
11. Fm apparel: U.S. exports, by principal markets, 1987-92................................. 15 .12. Nonapparel fm articles: U.S. exports, by principal
markets, 1987-92 . . • • . . • . . . . . . . . . . . . . . . • . . • • . . • • . . . . . . . . . . . . . • . . . . . . • • . . . • . . . . . . . 16 13. Fm goods: U.S. exports of domestic merchandise,
imports for consumption, and merchandise ttade balance, by selected countries and country groups, 1988-92 . . .. . . . . . . . .. . . . . . . . . .. . • . .. • . . .. . . . 17
iv

INTRODUCTION . The U.S. fur goods industry has undergone considerable consolidation during the past two decades, having lost over three-quarters of its producers and workers since 1972. During the 1970s, intense competition among domestic producers forced many of the smallest ones out of business. However, . the industry as a whole continued to expand its shipments until 1980-81, the only years when annual shipments exceeded $500 million. Throughout the remainder of the 1980s, a combination of intense impon competition and weakened consumer demand precipitated a decline in shipments to a 16-year low of an estimated $210 million in 1992.
This summary examines the fur goods industry over the past decade, with emphasis on changes occurring between 1987 ·and 1992. Its focus will be on fur apparel and clothing accessories which, along with fur apparel trimmings, account for the entire output under Standard Industrial Classification (SIC) code 2371, Fur Goods. I U.S. output of fur apparel products represents only about 1 percent of all apparel manufacturing and trade in the United States.
PRODUCTION PROCESS Fm apparel manufacturing is very much a craft, not
suited to mass production methods or large-scale operations. It takes place on a very small scale with highly skilled labor and little automation. Considerable time is spent processing the furskin pelts prior to ~ ·elaborate cut and sew operations involved in assembly. The manufacture of fur apparel also often requires a high level of customized service.
Prior to assembly, the pelts2 are often dyed, printed, sheared, and/or plucked of their~ hairs, and almost all mink pelts are ••1et-out." Although several hand tools and machines have been developed to perfonn these processing functions, the assembly of fur pieces into apparel remains largely a labor-intensive craft wilh limited technology. The pieces must first be laid out, stretched, and nailed
1 Under the U.S. tariff schedule. fur goods include both apparel and non-apparel articles of fur (such as rugs, car seat covers, handbags. key chains, small animal toys, taxidermy animals, dusting and painting tools, and polishing equipment parts) During 1987-92, these nonapparel articles accounted for only about 8 percent of the total value of fur goods imports and 14 percent of total value of fur goods exports, and U.S. production of these articles is believed to be small. Thus, nonapparel fur articles will be discussed only minimally since the report focuses on apparel products. Apparel products do not include gloves, footwear, headwear other than ear muffs, or 'iannents lined with sheepskin.
Many varieties of furskin pelts are used, including: mink. fox, beaver, nutria, raccoon, sable, fisher, lynx, lamb, and chinchilla. After the pelts are purchased at auction, they must first be cleaned, conditioned, and preserved by fur "dressers" who work on contract with manufacturers.
3 The .. letting-out" process is very time consuming and consists of cutting thin strips throughout the pelt, rearranging them side-by-side to elongate the pelt, and sewing one strip to the next. The elongated pelts are then sewn together to construct one broad piece, which can be handled like cloth yardage.
before lhey are cut into patterns, sewn, and closed. Afterwards, the gannent is lined, fitted, and glazed wilh a steam iron. In many cases, the manufacturer will also offer custom tailoring services, which may involve repeated fittings and alterations, to retailers with whom they have established an ongoing business relationship or to final consumers wilh whom they deal directly.
U.S. INDUSTRY PROFILE
Industry Structure The U.S. fm apparel industry in 1992 comprised an
estimated 170 very small, privately held fmns, many of which were family operated, having been handed down from one generation to the nexL In 1990, nearly every fmn in the industry operated just one establishment, and 87 percent of the establishments employed fewer than 10 workers.4 Data representing industry structure are shown in table 1.
The industry remains rooted in New York City, where European immigrants skilled in the fur trade settled and opened shops during the early 1900s. In 1990, approximately 85 percent of all fur apparel producers operated in New York City,S the majority within a three-square block .. fur district" in mid-town Manhattan. The geographic concentration of the fur industry has not only generated rigorous competition among the producers, but has also fostered a degree of cooperation in both manufacturing and marketing. New York manufacturers often perform contract work for one another, enabling them to carry a varied product line, while specializing in what they produce most competitively. They also cooperate by planning national and· international fur fashion fairs and by promoting the fm industry as a whole.
Many U.S. fur apparel manufacturers are involved in bolh international trading and retailing (figure 1). Allhough the industry sells most of its output to independent fur retailers and chain stores, a growing number of manufacturers maintain retail as well as wholesale showrooms adjoining their production facilities. One industry analyst estimated direct consumer sales at 12 percent of total industry shipments in 1991.6 Many industry sources believe the figure to be much higher-at least 20 percent and perhaps as high as 40 percenL In addition, manufacturers often bypass trading companies, importing fm apparel directly from foreign producers and exponing directly to foreign retailers.
Production Costs Allhough a number of technological advancements
have been introduced in the production process during the past decade, lhe manufacture of fur apparel remains
4 U.S. Bureau of the Census, Counly Business Patterns • 1990: United Stales, No. CBP-90-1, Dec. 1992.
5 U.S. Bureau of the Census, County Business Patterns. 1990: New York, No. CBP-90-34, Dec. 1992.
6 Mail and telephone survey of the fur industry by Southwick Associates for the International Association of Fish and Wildlife Agencies by a grant from the U.S. Department of the Interior.
1
Table 1 Fur goods, SIC 2371: U.S. Industry structure, 1972, 1977, 1982, 1987, and 1990-92 Item 1972 1977 1982 1987 1990 1991 19921
Number of establishments ••••.••••••• 797 620 504 380 2291 2236 170
Number of employees 322 (thousands) ••••••••.•.••.• 4.7 4.0 3.4 2.1 1.5 1.0
Number of production workers (thousands) •••••••• 4.0 3.2 2.5 1.5 1.5 1.0 .7
Capital expenditures (4) (4) {million dollars) •••••••••••. 1.1 .5 .3 1.2 1.9
lndusti:y shipments 220.0 383.4 419.3 422.6 378.7 257.4 (million dollarsi ••••••.••.•. 210.0
Material cost (mil ion
va~~1::J&d °(mii1i0r1 · • · • · · · · · · · 135.5 273.3 287.2 292.6 263.3 189.5 153.0
dollars) •••••••••••••..•... 86.2 112.8 131.6 131.2 103.6 69.9 57.0 Payroll (million
aollars) ••••••••••••••••••. 41.2. 51.5 59.6 48.2 46.2 29.2 20.0
1 Data estimated by the Commission staff. 2 Data estimated ~ the Commission staff on the basis of annual changes in the number of reporting units as
comfiiled by the U.S. ureau of Labor Statistics. Employment data published by the U.S. Bureau of Labor Statistics, Emplo~ment and Wages, Annual Averages
(ES-202 data series) show employment for SIC 2371 at 1, 700 employees in 19 0. 4 Less than $50,000.
Source: Compiled from official statistics of the U.S. Bureau of the Census, 1987 Census of Manufactures and Annual Survey of Manufactures, 1990-91 editions, except as noted.
Figure 1 Fur goods: Flowchart of U.S. manufacturing sector
Exporters
'.·.:.:-:.;.:·:·=···:::··:····::···· ..
Source: U.S. lntemational Trade Commission.
2
highly labor intensive. In 1990, labor costs7 represented nearly 50 percent of the value added by manufacture (figure 2). Nevertheless, the largest cost of producing fur apparel is not labor, but the cost of materials, mainly the fur itself. The cost of materials represented over 70 percent of industry shipments in 1990, while labor costs accounted for only about 14 percenLS
Furskin pelts commonly used in the production of apparel generally range in price from about $15 to $80 a piece. Some species and grades of pelts, such as Russian sables, can cost as much as $300 apiece or more. In addition to the raw pelt price, such other charges are added:
$21.70 = market price of an average mink pelt + 1.19 = auction fee (5.5% of market price) 22.89
+ .22 = fee collected by IF'IF9 (1 % of market price)
23.11 + .08 = packing fee 23.19
+ .65 = dealer feelO (3% of market price) 23.84
+ 5.00 = dresser fee 28.84 = subtotal
+ 2.88 = transportation fee (roughly 10% of subtotal)
$31.72 = total cost
As the manufacture of an average mink coat requires 25 male pelts (or 45 to 50 female pelts), the cost of the fur involved in the production of an average mink coat could range from about $800 to $1,600 or more.
Since pelt costs account for a large share of the cost of materials, the Producer Price Index (PPI) for fur goods is almost entirely driven by the previous year's market price of pelts; the year lag reflecting pelt delivery and a~l production time (figure 3). The PPI for fur goodsll leaped from 101.3, in 1986, to 120.1, in 1987, after a 54-percent increase in the average price of U.S. mink pelts between 1985 and
7 Labor costs include payroll, social security, and other
~=: the cost of materials involved in the production of other types of apparel represented only 49 percent of industry shipments, whereas labor costs accounted for 26 percent.
9 IFl'F, the Jntemational Fur Trade Federation, collects a fee on the purchase of every pelt sold al auction and uses the fimds to promote conswner education, market research. and pro-fur industry campaigns Sponsored by fm trade organizations worldwide.
10 If the manufacturer purchases the pelt directly, there will be no dealer fee. If a dealer is employed, however, and the dealer finances a firm's purc:hases by offering extended credit terms, the dealer fee may range between 3 and 10 percenL
11 U.S. Bureau of Labor Statistics, The SupplemDll to Producer Price Indices, 1983-92. The base year for the index is 1983.
1987. The rising pelt prices were caused by increased. demand from the expanding Far Eastern fur apparelmanufacturing industries and by a limited world supply of pelts. After 1987, however, the supply of mink pelts on the world market grew to surpass demand, 12 and their price fell by 50 percent between 1987 and 1991. During this later period, the PPI also declined steadily.
The wide fluctuations in pelt prices have distorted the value of U.S. producers' shipments of fur apparel in current dollars, especially shipments in 1987 (table 2). Furthermore, pelt price fluctuations have also distorted the value of foreign producers' shipments because foreign producers face a production cost structure similar to that of U.S. producers and are subject to the same pelt prices as U.S. producers, given the fact that all pelts, aside from a few species of fox, are ttaded duty free on the world markeL13 This duty-free treatment has made the international pelt market a very active and efficient one in which changes in supply arid demand have an immediate impact upon pelt prices worldwide. Thus, for the purpose of analyzing time ttends in this summary, U.S. industry and trade data have been deflated by the U.S. PPI.
Employees In addition to its effect on producer prices, the high
cost of materials also precipitates a high cost of error involved in the manufacture of these materials. Thus, to avoid costly errors, managers in the U.S. fur apparel industry ensure that production workers are highly skilled craftsmen.14 Nearly 70 percent of all employees in· this industry are production workers, while 30 percent are clerical workers, pilrchasers, sales and delivery oersons, advertisers, supervisors, and designers. IS The production workers are largely men with little fonnal education, but many years of experience in the trade. Very few employees in the fur apparel industry are unionized.
12 OvetplOduction occurred largely because Danish fanners received government assistance to convert many of their daiJy farms to mink ranches and increased their production by 25 percent in 3 years. As Denmarlt is one of the foremost world mink producers, this production increase made up a significant portion of the expanded world supply of pelts.
13 The impact of pelt price fluctuations upon fur apparel plOChx:ers worldwide is not always equal. Exchange rates can influence the effective prices. Jn 198f.-87, while pelt prices were rising, the value of the dollar fell against the Geiman mark and Korean won. Thus, the pelt prices borne by German and Korean manufacturers in 1987 were probably not quite a.<i high as those borne by U.S. manufacturers. Since the -~~ 5. dollar remained fairly stable against the Hong Kong Gvllar and Greek drachma, the prices borne by manufacturers in Hong Kong and Greece were probably the same relative to U.S. prices.
14 Industry sources note that the lost production capacity of this industry over the past two decades cannot be readily restored, because the high skill level of displaced workers would be too costly and difficult to replace.
IS Every manufacturer has al least one designer who works either in-house or on conttact. In some cases, however, manufacturers enter licensing agreements with designers established in the nonfur apparel markeL
3
Figure 2 Fur apparel: Precentage distribution of U.S. production costs, 1990
c ital ~
Total costs Value added
Source: U.S. Bureau of the Census, Annual Survey of Manufactures, 1990.
Figure 3 Fur goods: Mink prices and U.S. producer price Index, 1983·92
30
20
87 88 89 90
Source: U.S. Bureau of Labor Statistics and U.S. Department of Agriculture.
4
Overhead and other
49%
PP/ (1983-100) 125
120
115
110
105
100
95
90 91 92
Table 2 Fur apparel: U.S. Industry shipments and producer price Index, 1983-92
Year Current value of Industry shipments
Million dollars
1983......................... 444.5 1984......................... 398.1 1985 ......•.................. 383.7 1986 ......................... 360.4 1987..................... .. . . 422.6 1988........... .. . . . . . . . . .. . . 407.2 1989 ..•...................... 402.4 1990 ..........•.............. 378.7 1991........... •. . . . . . . . . .. . . 257.4 1992 . . . . . . • . . . . . . . . . . . . . . . . . . 1210.0
1 Estimated by the Commission staff.
PPI for fur goods
(1983=100)
100.0 100.1 101.8 101.3 120.1 115.9 104.9
98.7 100.5 103.1
Constant value of Industry shipments
Million 1983 dollars
444.5 397.7 376.9 355.8 351.8 351.3 383.6 383.7 256.1
1203.7
Source: Industry shipment data compiled from official statistics of the U.S. Bureau of the Census, Annual Survey of Manufactures, 1983-91 editions, and PPI compiled from official statistics of the U.S. Bureau of Labor Statistics, The Supplement to Producer Price Indexes, 1983-92 editions.
In 1991, U.S. production workers earned an average of $9.25 per hour, which is 37 percent more than the $6. 73, on average, received by production workers in the U.S. apparel industry overall. In addition, production workers in the fur apparel industry produced nearly twice as much value added in 1991 as those in the apparel industry overall-$43.69 versus $22.40 per production hour.
In tenns of value added per hour, labor productivity in the U.S. fur apparel industry has improved substantially throughout the past decade. Between 1983 and 1991, productivity rose by nearly 60 pen:ent (table 3). Some of the productivity improvement since 1983 can be attributed to new production technologies; however, a greater portion is probably due to intense industry competition and consolidation under which only the most efficient establishments have survived. Of the 3,400 employees, working in 504 fm goods manufacturing establishments in 1982, only about one-third remained in 1992 {table 1).
Profitability The reduction in size of the U.S. fur apparel
industry during the late 1980s was accompanied by a drop in profitability. The industry's median return on sales and assets peaked in 1986 and thereafter declined to sharply lower levers (table 4). This decline in profitability was due largely to price wars at the retail level, which precipitated lower wholesale prices during 1987-88, when material costs were highly inflated. This caused manufacturers to build up expensive inventories with what they could not sell or would not sell at such undervalued rates. During the late 1980s, manufacturers also had more difficulties obtaining import credit
Competitive Strategies Although the U.S. fur apparel industry has
experienced substantial difficulties in recent years,
many individual finns have survived and prospered by sttategically adapting their products and marketing methods to appeal to the changing needs and attitudes of consumers, while effectively competing with foreign imports.
During the early 1980s, fur apparel products were most often very expensive; luxurious coats,. sold- in elegant salons, were purchased by the wealthy and worn primarily by older women on fonnal occasions. The typical garment was a full-length black mink coat with a silky lining. By 1992, however, this classic mink coat was no longer the mainstay of the industry. The industry had diversified its product line to capture a more varied consumer base and to combat the mid-1980s import penettation and market saturation.16
The imports that penetrated the U.S. market in the mid-1980s consisted largely of inexpensive, lower quality, but traditional-looking mink coats originating in Hong Kong, the Republic of Korea (Korea), and Greece. These garments were called "bridge furs" because their low price created a larger pool of interested buyers and bridged two economic groups together into the same target market Whereas mink coats had before been reserved only for the wealthiest women, most of whom were older, bridge furs were pun:hased by younger, middle-class women who would be more apt to wear a mink coat for informal occasions or, perhaps, for work. Thus, imported bridge fms competed very successfully with domestic coats at the lower and medium ends of the fur-fashion market where orice, more than quality, has been the overriding factor.f1
16 As will be discussed later, between 1983 and 1987, the value of U.S. imports of all fur apparel, in constant terms, rose more than twofold; imports of mink apparel alone rose over threefold.
17 In 1983, 69 percent of all fur apparel consumed in the United States was produced-domestically, while the rest was imported. By 1987, however, that percentage had fallen to 42 percent (table 7).
s
Table 3 Fur apparel: U.S. value added and production worker hours, 1983-92
Year
1983 ............................ . 1984 .........•..•................ 1985 ............................ . 1986 ............................ . 1987 ............................ . 1988 .•........................... 1989 ......................•...... 1990 ....................•........ 1991 .....•...............•....... 1992 ........•.......•....•.......
Value added
Million 1983 dollars
156.4 124.5 106.1 103.4 109.2 111.6 121.7 105.0 69.6
155.3
1 Estimated by the Commission staff.
Production worker hours
Millions
5.7 3.6 3.4 3.2 2.7 2.6 2.6 2.5 1.6
11.1
Value added per production worker hour
1983 dollars
27.4 34.6 31.2 32.3 40.4 42.9 46.8 42.0 43.5
150.3
Source: Compiled from official statistics of the U.S. Bureau of the Census, Annual Survey of Manufactures, 1982-91 editions, except as noted.
Table4 Fur apparel: U.S. net sales and median return on sales and assets, for reponlng establishments, 1984-92
Year
Number of establishments Iii survey Net sales
Median return on-
Sales Assets
1984. .. . ... ... ... . ... .• . . .. . . . . . ... .. . . . . 57 1985........... •. . . . . . . . . . . . . . . . . . . . . . . . . 53 1986 ...........•..•................... .- .. 43 1987........... •. . . . • . . . . • . . . . . . . . . . . . . . . 61 1988 ....•..•...................... ·....... 37 1989 ••................................... 108 1990. .. . . . . .• .. .• . .. . .. . . .. . . .. . .. . .. . . . . 33 1991..................................... 27 1992........... .. . . . . . . . . .. . . . . . . . . . . . . . . 18
1,000 dollars
1,205.0 1,014.4 1,174.9 1,078.0 1,343.2 1,531.6 1,442.4
912.4 609.7
Pe1C8nt --
1.8 4.0 1.6 3.6 3.3 6.3 2.3 4.9 1.6 1.7 1.1 1.5 .8 1.7 .3 -.1 .3 .3
Source: Dun & Bradstreet Information Services, •/ndustry Norms & Key Business Ratios: Desk-Top Edition 1992-93"and selected back issues.
This price competition. induced by the imponed bridge fms. drove down prices significantly and catalp.ed regional retail price wars. Manufacturers. unsatisfied with the low prices they were receiving from wholesalers and retailers, began retailing through their own outlets or directly through their manufacturing facilities. at what were called "warehouse" sales, a practice which depressed prices even more. In the long run, as warehouse sales and price wars became more prevalent, the status of fur coats became a reflection of their discounted prices, and consumers began to perceive them more as commodity items than luxury items. In addition. manufacturers expressed concern over the marketing practices of their foreign and domestic competitors who were allegedly discounting too heavily, confusing consumers through misleading advertisements and, thus, damaging the image of fur apparel.
6
Given the above scenario, many domestic manufacturers began to import bridge furs, while diversifying their own production away from the image of the bridge fur. The strategies employed in this diversification process varied from oqe manufacrurer to another. Some manufacturers tried to recreate the consumer's perception of fur apparel as a luxury item by producing strictly for the higher end of the fur-fashion market. These higher end gannents were often custom made and required a degree of artistry impossible to duplicate using machinery, let alone using the mass-production methods employed in the Far EasL Many of these garments were made of Russian sables and other expensive pelts. Others were made of mink and beaver, the pelts of which were often sheared, dyed bright colors, and assembled into mosaic patterns. These garments targeted the extremely wealthy, highly fashion conscious groups, which are
less sensitive to price fluctuations and economic downturns in the market. The prices of these higher end garments ranged anywhere from about $5,000 to $100,000 each.
Other U.S. producers began to target the same consumer base, namely the younger, middle class, working women who had been successfully targeted before with the bridge furs, with a wider variety of products. To compete with the bridge furs for this market, domestic manufacturers produced more practical, casual, sporty, less expensive garments with greater utility and versatility. Casual looking fur coats and jackets, often designed with wider arm holes for comfort over suits, became popular, as did overcoats of wool, cashmere, poplin, silk, or water-repellent microfibers lined with sheared furs. These fur-lined, and often reversible, coats were especially popular as they provided the warmth and luxury of fur without appearing to flaunt opulence. This was important as the apparel designed for daytime wear by working women is generally more understated than that designed for eveningwear and formal occasions.
Another sttategy pursued by U.S. producers to increase sales was to create shorter, lighterweight outerwear suitable for a wider variety of climates and seasons. One of the most troublesome aspects of the fur apparel industry is that it has traditionally been a highly seasonal one; the profits earned in the fall and winter months sustained companies dwing the spring and summer. By producing multiseasonal outerwear, manufacturers sought to increase sales as well as spread their cashflow more evenly. This has become especially important in light of the recent mild winters in the Eastern and Centtal states.
In addition, fur services, like cleaning, storage, remodelling, and custom tailoring, were also an important pan of this multiseasonal strategy. By offering a complete line of services, fur apparel manufacturers sought to develop better, longer term customer relationships tO encourage additional fur garment sales. At the same time, such services as remodelling generally were recession resistant Moreover, U.S. producers were able to dominate the service market that grew during the recent recession because foreign manufacturers were, in most cases, unable to provide these services due to their distance from the U.S. marketlS
In response to animal rights activism, as well as to fashion trends, new technologies, and the high cost of materials, manufacturers developed another competitive strategy by producing coats with either less fur or less noticeable fur, such as fur-trimmed or fur-lined coats. Much of the remodelling business of fur manufacturers involves converting classic full-length mink coats into linings for coats made of leather or fabric.
lB Canadian fm apparel manufacturers, largely because of their proximity to the U.S. market, are some of the few foreign manufacturers able to provide customized sezvices to U.S. retailers, including quick response to last-minute ordeIS.
FOREIGN INDUSTRY PROFILE The production of fur apparel, in contrast with that
of textile-based garments, takes place on a limited scale worldwide. World production of fur apparel is concentrated in.Hong Kong, China, the United States, Canada, Korea, the Commonwealth of Independent States (CIS), 19 and the European Community (EC), especially Greece and Germany. While the United States and the CIS produce primarily for domestic consumption, Greece, Hong Kong, China, and Korea produce largely for export. United Nations ttade data indicate that Greece was the world's largest exporter of manufactured fur goods in 1991, followed by Hong Kong, China, and Germany (table 5).
All of the major wodd fur goods producers became increasingly involved in expon markets during the mid-1980s; their collective exports nearly doubled, in constant terms, between 1983 and 1987. This rise in exports was primarily due to steady growth in production for expon of fur apparel in Hong Kong, Greece, and Korea. Between 1987 and 1991, however, their collective exports fell by 28 percent, in constant terms. The only major producers that expanded their exports between 1987 and 1991 were the United States and China.
Foreign fur producers became increasingly competitive in the U.S. market, in terms of market share, between 1983 and 1987. Between 1987 and 1992, however, as U.S. consumption declined, foreign producers lost a disproportionately greater share of the U.S. market (table 6). The most critical competitive factor for Hong Kong, Korean, and Chinese firms has been lower production costs, particularly labor, whereas for European firms the most critical competitive factors have been high quality and manufactwing experience.
In 1987, average manufacturing labor costs in Korea were only 15 percent of those in the United States.2° Over the last 5 years, however, manpower shonages and active unions in Korea's manufacturing sector have forced emplo~ in the apparel industry to grant large wage increases.21 By 1991, labor costs in Korea had grown to represent 31 percent of U.S. labor costs. A similar situation occurred in Hong Kong in which apparel wages grew in the past 5 years from 27 to 38 percent of apparel wages in the United States. The decline in labor cost advantages, especially in Korea, contributed to the relocation of several Korean companies to China where labor is considerably less expensive than is labor in Korea.
19 Though data on fm apparel production in the CIS are lDl&vailable, reports in the mid-1970s indicated that at least two very large manufacturing operations existed in Kazan and Moscow, collectively employing about 15,000 people. Fm apparel exports from the fcmner Soviet Union have been negligible, however, because of high domestic demand and the historically high foreign tariff rates the CO\Dl~ faced.
20 U.S. Bmeau of Labor Statistics. lntemalional Comparisons of Hourly Compensalion Costs for Prodlu:tion Workers: Apparel and Other Textile PTO<blcls Manafacttuing, 1993.
21'1.J.s. Department of State, ''Ammal Labor Trends Report for Korea," telegram. message reference No. 08699, from U.S. Embassy in Seoul, Aug. 14, 1992.
7
Tables Fur goods: World expons, by principal sources and markets, 1983, 1987, 1990, and 1991
Exports Percent of Major 1991 total1991
Source 1983 1987 1990 1991 markets exports
Million dollars
Greece .......................... 103 362 219 244 Germany 37 United States 15
Hong Kong ••••••••••••••••••••••• 185 454 257 219 Japan 60 United States 17
China1 ........................... 45 123 183 178 Hong Kong 38 CIS 23
Germany ......................... 115 193 129 121 lta(Y. 25 Switzerland 20
Korea ............................ 142 262 133 93 Japan 51 United States 24
United States .••••••••••••••••••••• 39 59 57 63 Japan 19 Dominican Republic 14
Canada .......................... 82 175 63 63 United States 69
1 China's exports are based on world imports from China as reported to the United Nations (UN), plus Chinese exports as estimated by the UN to the CIS, since the CIS does not report import data to the UN.
Source: U.S. data are compiled from official statistics of the U.S~ Department of Commerce; all other data from the United Nations Trade Data System, for SITC 84201 (furskin clothing and products).
Table& Fur apparel: U.S. producers' shipments, expons of domestic merchandise, lmpons for consumption, and apparent consumption, 1983-92
Ratio of Product Apparent Imports to
Year shipments Exports Imports consumption consumption
Million 1983 dollars Percent
1983 ......•.......... 425 36 176 565 31 1984 ................. 380 31 307 656 47 1985 ................. 371 30 395 736 54 1986 ................. 346 36 396 706 56 1987 ................. 332 46 397 683 58 1988 •................ 327 51 341 617 55 1989 ................. 364 56 328 636 52 1990 ...........•..... 364 153 231 542 43 1991 ................. 239 154 150 335 45 1992 ................. 1195 145 118 1259 144
1 Estimated by the Commission staff.
Source: Compiled from official statistics of the U.S. Department of Commerce, except as noted.
Hong Kong. Korean. and Chinese manufacturers were also able to produce the less expensive bridge furs on account of various low-cost production methods, including 1) using fewer of the larger, but less prestigious, pelts of male minks, 2) designing shorter, narrower coats and jackets, 3) using machines to perfonn the "letting out" process,22 and 4) mass
22 Because the elongated pelts produced by these machines are of lesser quality than those let out by hand, the better garments are still let out by hand.
8
producing the coats, instead of custom tailoring, which is often the practice in the United States.
Another factor that contributed to the competitiveness of Korea. Hong Kong. and Taiwan, at least in the U.S. market, was the duty-free treaunent these countries enjoyed prior to 1989 under the Genemlized System of Preferences (GSP). At that time, Korea, Hong Kong, and Taiwan were all beneficiary developing countries under the GSP program, and their fur goods exports, generally mink
gannents, entered the United States duty free. On January 1, 1989, all three lost their GSP status, and their exports became subject to the 5.8-percent U.S. tariff on fur apparel. The loss of GSP eligibility exacerbated the already declining competitiveness of Korea, Hong Kong, and Taiwan, all of whose exports began their decline in 1988.
Greece's competitive advantage grew from its five centuries of experience in fm manufactlD'ing. Kastoria, Greece, is one of-the world's oldest and largest fur centers. The city's youth often receive school training in the art of fur manufactwing, and, of its 25,000 residents±J about 90 percent are involved in the fur industry. This concentrated pool of skilled labor has promoted significant production efficiencies. Overall, Greece also enjoys fairly low labor costs, less than half that in the United States.
Gennany, on the other hand, suffers a labor cost disadvantage relative to the United States. In 1991, average manufacturing labor costs were 43 percent greater in Gennany than in the United States. Despite these high costs, however, Gennan fur apparel remains competitive because of its high quality. Similarly, high-quality Canadian and high-fashion Italian fur apparel also remains competitive, despite the fact that labor costs in Canada and Italy were respectively 6 percent and 52 percent greater than in the United States in 1991.24
Another feature lhat has . contributed to the competitiveness of German, Canadian, arid Italian manufacturers is their ability ao sell and ~vide cusaomized services in their domestic markets.25 As explained previously, custom tailoring, storage, cleaning, and remodelling are important elements of domestic manufacturers' product lines, which most foreign manufacturers are unable to provide effectively. This competitive factor is lacking among many of the world's major P!Qducers of fur apparel, such as Korea26 and China, 27 that lack significant
23 Sandy Parker and Bernie· Groger, eds., "Kastorians at Home in the Fur Business," Fw World, Dec. 14, 1992, p. 15.
24 U.S. Bureau of Labor Statistics, International Comparisons of Howly Compensazion Costs for Production Workers: Apparel and Other Textile Producss Manufactwing, 1993. Most Canadian fur apparel production workers are unionized, and their wages are significantly higher than in the United States. Canadian manufacturers attain lower labor costs by contracting gannents lo be made by non-union labor outside of their ~uction facilities. ·-
25 As noted previously. Canadian manufactums are able to provide customized services to U.S. retailers as well as Canadian retailers.
26 Korea has a IO-percent value added tax (VAT) on domestic consumption of fur apparel, in addition, lo a
· 60-percent excise tax and a 30-percent "eClucation" tax (according to the U.S. Department of Commerce and the Fur Council of Canada, Quebec). These taxes discourage the domestic sale of fur apparel in Korea. In addition, under Korea's Act for the Protection of Birds, Beasts and Hunting, ••imports of furs from wild animals are restricted unless such imports are to be processed and re-exported" (from U.S. Department of State, "Fur Import Regulations," telegram, message reference No. 01332, from U.S. Embassy in Seoul, Feb. 10, 1993).
domestic markets for their goods and are wholly dependent upon foreign markets.
INTERNATIONAL TRADE MEASURES
U.S. Tariffs Fur goods are classified for tariff purposes under
two subheadings of the Hannonized Tariff Schedule of the United States (HTS), as follows:
Subheading Descrjption
4303.10.00 Articles of apparel and clothing accessories
4303.90.00 Other articles
The column l, or most-favored-nation (MFN),28 rate of duty is 5.8 percent ad valorem for apparel and apparel accessory products and 3.4 percent for other articles. Imports under both subheadings are eligible for duty-free treatment under the Generalized System of Preferences (GSP), the Caribbean Basin Economic Recovery Act (CBERA), the Andean Trade Preference Act (A1PA), and· the United States-Israel Free-Trade Area Implementation Act of 1985.29 These programs are presented in appendix A. Duty-free treatment is also granted to fur goods from Canada under the United States-Canada Free-Trade Agreement (CFI'A).
In 1992, 26 percent of an fur apparel imports . entered duty free under the CFI'A, and 5 percent entered under the GSP. By contrast, in the same year, 63 percent of all nonapparel fur articles en~ duty free under the GSP, and 6 percent entered under the CFI'A.30 The GSP-eligible apparel comprised mostly sheepskin gannents from Uruguay and Argentina, and the articles comprised mostly sheepskin car seat covers and parts from Uruguay, Argentina, and Brazil.
U.S. Government Trade-Related Investigations
During the past decade, the U.S. International Trade Commission conducted one investigation involving the fur apparel industry. The Commission determined in 1987 that numerous Hong Kong, Chinese, Greek, and Hungarian fur apparel manufacturers had violated section 337 of the Tariff Act of 1930 by unlawfully exporting to and
'D Demand for fur is growing. however, in China's coastal regions and in special economic mnes where incomes are rising.
28 As of December 1992, all of the major fur apparel producing countries maintained MFN status or a reduced tariff status with the United States. Though the former Soviet Union had faced a SO-percent col. 2 rate of duty in prior years, as of June 1992, certain Republics of the Commonwealth of Independent States (CIS) have gained MFN status and observe the col. 1 rate of duty.
29 Since all of the countries included in the CBERA and the ATPA have been able to expon fur goods to the United States duty free under the GSP, few U.S. imports of fur goods have enteied under the CBERA or the ATPA.
30 Imports of fur goods originating in Israel were negligible.
9
selling in the United States certain feath.ered fur coats and furskin pelts that infringed a U.S. patent.31 The Commission issued an order excluding such coats (infringing U.S. Letters Patent 3,760,424) from unlicensed entry into the United States.
Foreign Tariffs In general, foreign tariffs applying to U.S. expons
are significandy higher than U.S. tariffs (table 7).
NontarifT Trade Measures The two principal types of nontariff measures that
influence trade in fur goods are conservation laws and laws pertaining to animal trapping. The U.S. EndanJered Species Act32 is a conservation law prohibiting commercial activities involving all wildlife species listed as endangered and most species listed as threatened in the United States, including the Spanish lynx; most large cats and wolves; and certain river otters, bobcats, foxes, bears, and seals. 33 The Convention on International Trade in Endangered Species of Wild Fauna and Flora34 is an international conservation treaty prohibiting world trade in all internationally endangered species and most species internationally threatened. As not all species endangered or threatened within the United States are so considered worldwide, the U.S. law protects many species unprotected under OTES. Similarly, foreign wildlife protection laws (for instance, Japan's Law Concerning Wildlife Protection and Hunting) are often stricter than OTES. Under U.S. law, international conventions, and the laws of countries to which the United States expons fur apparel, however, the animals whose fur is most commonly used by the U.S. fur goods industry-such as farmed mink, fox, and sable and wild beaver, nutria, and raccoon-are not considered endangered or threatened. ·
Laws pertaining to animal trapping, however, do apply to animals whose fur is commonly used by the U.S. fur goods industry. In November 1991 the European Community (EC) adopted a regulation3S that provides for the EC to begin banning, on January 1, 1995, the use of leghold traps in the EC and the impons of 13 wild species of fur and fur products36 from colllltties where the leghold trap is used. The EC
31 USITC, Certain Fealhered Fur Coats and Pelis, and Process for the Manufacture Thereof. (investigation No. 337-TA-260). USITC publication 2085, May 1988. A feathered fur coat is composed of let-out pelts. usually of wild fur, created by inserting strips of leather between each fur strip such that hai:rs from one fur strip overlap another producing a shingle or unnatural striped effecL
32 Endangered Species Act of 1973 and amendments, codified at 16 U.S.C.A. §1531 et seq.
33 State conservation laws exist in addition to Federal law and may protect species not othe:rWise protected 1Ulder Federal law.
34 Convention on International Trade in Endangered Species of Wild Fawa and Flora (CITES), 27 UST 1087, TIAS 8249, 993 UNTS 243; 1979 amendment, TIAS 11079; 1987 amendment, not yet in force.
35 ColUlcil Regulation (EEC) No. 3254/91. 36 These 13 species include beaver, otter, coyote, wolf,
lynx, bobcat, sable. raccoon, muskrat, fisher, badger, marten, and ermine.
10
will allow imports of these products only if the originating country has .. adequate administrative or legislative provisions in force to prohibit the use of the leghold trap" or if .. the trapping methods used. .. meet internationally agreed humane trapping standards."37 A I-year extension may be granted if the EC Commission determines before July l, 1994, that "sufficient progress is being made in developing humane methods of trapping" in the originating country.38 As the leghold trap is widely used in the
·United States,-the ban could harm U.S. exports of fur goods to the EC.
Effons have been made in the EC to inCOiporate the leghold trap legislation into the new EC Council Regulation on trade in wild fauna and flora, 39 targeted for adoption in 1993. This new regulation aims to protect endangered and threatened species, as well as species in an "unfavorable conservation status" or ''undergoing a high level of trade." Initially, the draft regulation proposed to place the 13 species subject to the leghold trap ban in a category of species for which impon and re-export permits are required, even though the species are neither threatened nor endangered."° As of July 1992, however, the EC Commission agreed to exclude the 13 species from the regulation "until such time evidence is produced to show they have become endangered." The status of these species will first be reviewed in January 1995.41
U.S. MARKET During the past decade, the factors of greatest
influence upon the U.S. market for fur apparel have ·been foreign imports, economic recession, changing fashion preferences, and anim81 rights activism. U.S. fur apparel impons peaked in 1985-87, in constant tenns, and then fell swiftly. U.S. consumption peaked in 1985, but has since fallen significandy and, in 1992, was estimated at less than 40 percent of its 1985 level (table 6). Most of the decline in consumption took place after 1989, and had a greater initial impact on
n Council Regulation (EEC) No. 3254191 of Nov. 4, 1991, Off1eial Journal of the European Commanilies, No. L 308/1. "Internationally agreed lwmane trapping standards" do not currently exist; however. the International Stand8rds Organization has established two technical committees to develop standards that must be approved by the nine participating EC nations by a two-thirds vote. The U.S. Department of State states, "'unless an international standard for fur trapping is agreed upon by Janmuy 1, 1995... U.S. expons of these furbearing species will be bumed in the EC" (U.S. Department of State. "Demarche on Proposed EC Trade Restrictions on Fur Bearing Animals," telegram, message reference No. 275551, prepared in Washington, DC, Aug. 25, 1992).
381bid. 39 ''Proposal for a ColUlcil Regulation (EEC) Laying
Down Provisions with Regard to Possession of and Trade in Specimens of Species of Wild Fauna and Flora," DOC# COM(91) 448 Final - syn 370, Brussels, Dec. 6, 1991.
40 U.S. Department of State, "EC Trade Barriers Against U.S. Furs?," telegram, message reference No. 187264, prepared in Washington, DC, June 12, 1992.
41 U.S. Department of State, ''Proposed EC Trade Restrictions on Fur-Bearing Animals," telegram, message reference No. 18570, prepared by U.S. Embassy in London, Oct. 2, 1992.
Table7 Fur goods: Foreign tariff rates applying to U.S. exports, by selected markets1
Market
Tariff on articles of apparel, clothing accessories and other articles of furskln
Australia ••••••••••••••••••••••••••••••••••••••••••..•..•.•.••••••.• Austria •••••••••••.••••.•••••.•..•.•••••••.•••••.••••••••••••••••.••
~a:x~·::: : : : : : : : : : : : : : : : : : : : : : : : : : : : : : : ~ : : : : : : : : : : : : : : : : : : : : : : : : : : : CIS •••••••••••••••••••••••••••••••••.••••••.••...•..•.•••••••••••.• Finland •••••••••••••••••••••••••••••••••••••••••••.••••.•••••••••••• Saudi Arabia •••••••••••••••••••••••••••••••••••.•••••••••••••••••••. Korea •••••••••••••••••••••••••••••••••••••••••••••••••.•••••••••••• Sweden ••••••••••••••••••.•••.•••••••••••••••••••.••.•••.•••••••••• Norway ••••••••••••••••.••••••••••.••••••••••••.•.••••••.•••••••••• EC2 •••••••••••••••••••••••••••••.•.•••.••••••••••••••••••••••••••. Hong Kong •••••••••••. : •••••••••••••••••••••••.••.•••••••••••••••.• Canada •••••••••••••••••••••.••••••••••••••••••••.•••.••••••••••.••
(Percent ad valorem)
25 24 20 20 20 15 12 10 7 6 6 0 0
1 Canadian, Korean, and Mexican tariff rates as of 1993; CIS and EC rates as of 1992; Austrian, Japanese, Norwegian, and Swiss rates as of 1991; Saudi Arabian rates as of 1990; Australian rates as of 1988; and Finnish and Swedish rates as of 1987.
2 Countries of the EC include Belgium, Luxembourg, Denmark, France, Germany, United Kingdom, Greece, Ireland, Italy, Netherlands, Portugal, and Spain.
Source: CIS rates from Canadian Embassy, Moscow; Korean rates from Fur Council of Canada, Quebec; all other rates compiled from International Customs Journals, International Customs Tariffs Bureau.
imports than on U.S. producers• domestic shipments (figure 4).
Consumption During the early 1980s. the U.S. fur apparel market
grew rapidly on account of the aforementioned bridge fur imports. which attracted a whole new set of consumers. As these bridge fur imports more than
Figure 4
doubled between 1983 and 1985, consumption of fur apparel produced domestically declined steadily because the competitively priced imports partly displaced demand for· lower-priCed domestically produced furs (figure 4). In 1983, the ratio of iinports to total domestic consumption was 31 percenL Within 2 years. however, that ratio had risen to 54 percent (table 6).
Fur apparel: U.S. consumption, by sources, 1983-92 Million 1983 dollars 800.---------~---------------------------;::::================:::;----,
j l!m ~=tic shipments I 700
600
500
400
300
200
100
0 83 84 85 86 87 88 89
Note.-Domestic shipments for 1992 are estimated by Commission staff. Source: U.S. Department of Commerce.
90 91 92
11
Throughout the mid-1980s, heavy volumes of imports continued to penettate the U.S. market, supplying market segments for which fur had previously been too expensive. As fur apparel is considered a luxury item, not purchased frequently by the same consumer, this consumption reduced potential future demand. Soon the supply of fur garments in the U.S. marlcet eventually grew to surpass demand, causing retail fur apparel prices to fall during the midto late-1980s.
Deflation at the retail level was especially troublesome for retailers and manufacturers who held large, cosdy inventories ·due to the high pelt prices discussed earlier. To reduce inventories, retailers discounted their merchandise heavily and manufacturers began retailing. The great volume of garments sold at discounted prices, however, precipitated further market sawration and inventory buildup, which was exacerbated by the October 1987 stock marlcet crash that reduced demand for high-end fur apparel. In addition, the considerable price reductions reportedly banned the product's image in the eyes of many consumers. Other factors contributing to the consumption decline were mild winters, animal rights activism, changing fashion preferences, and the growth of substitute products, including lightweight down- and synthetic fiber-fJ.llcd coats.
During 1989-90, declining imports caused a modest, but temporary, rebound in the consumption of domestically produced fur apparel. Within the next few years, however, consumption of domestically produced fur apparel had fallen sharply as well, largely due to the economic recession. Some U.S. industry sources also attribute the decline to the IO-percent Federal sales tax that was imposed on expensive fur gannents and on other luxury goods on January 1, 1991 effective until January l, 1994.42 As the luxury tax applied only to the portion of the retail price of a fur exceeding $10,000, it reportedly affected only 3 to 5 percent of total U.S. fur apparel sales (although some U.S. industry sources estimate that it affected as much as 10 percent).43 Nevertheless, some retailers of fur apparel priced under $10,000 claimed that the luxury tax also hurt their sales as the tax .. spooked" many potential customers.
Retailers indicated that their sales of fur apparel increased somewhat during the latter pan of 1992, suggesting an end to the 7-year decline in sales. They painted to improved economic conditions as a possible factor for the sales improvement, to forecasts for a colder winter in the Midwestern and Eastern States, and to consumers' rising .. comfon level" with fur partly attributed to the promotion of fur in the media to collllter animal rights activism.
42 The luxury tax on fur apparel will be repealed on January l, 1994. Omnibus Budget Reconciliation Act of 1993, sec. 13161, Public Law 103-66, 107 Stat. 449, Aug. 10, 1993.
43 An official at the Fur Information Council of America (FICA) claims that sales of furs over $10,000 declined 41 percent in the first quarter of 1991 because of the luxury tax.
12
U.S. Fur Apparel Imports Korea, Hong Kong, and Canada generated most of
the growth in the U.S. fur apparel market during the early 1980s, when demand for imported fur apparel, especially bridge furs, pushed up sales to their highest levels ever. These suppliers also absorbed much of the decline in U.S. fur apparel consumption during the last 5 years. At the height of the U.S. import market in 1987, Korea, Hong Kong, and Canada supplied nearly 80 percent of total imports of fur apparel and approximately 53 percent of total domestic consumption. As demand weakened in 1988, imports ~m these three suppliers began to plummet. By 1992, unports from Hong Kong had fallen by 64 percent, in constant tenns, from their 1987 peak; imports from Canada had fallen by 69 percent; and those from Korea by a much greater 96 percent (table 8).
The decline in imports from Canada, Hong Kong, and Korea44 was primarily due to marlcet saturation and recession in the United States. Unfavorable exchange rates between the U.S. and Canada also contributed to declining imports from duit cowitry. Though the United States-Canada Free-Trade Agreement went into effect in 1989, it had little impact on imports because the U.S. tariff on Canadian fur apparel had only been 5.8 percent ad valorem.
Despite the declines, Hong Kong and Canada remained the largest suppliers of fur apparel in 1992, accounting for a combined 56 percent of total imports. Korea, on the other hand, fell to a distant fifth place, behind Greece, whose shipments to the United States fell at a much lower rate than the big suppliers, and China, which was one of the few somces to ship more to the United States in 1992 than in 1987 (table 8).
Korea is unlikely to return to its former status as the largest supplier of fur apparel because of a reduction in fur apparel manufacturing in Korea. During 1987-92, many Korean fur apparel producers either switched to the production of leather goods or higher technology products, or moved their manufacturing operations to China to access lower cost labor.45 The migration of Korean fur apparel firms to China precipitated a corresponding rise in imports from China. In 1987, China was a relatively insignificant source of imports, almost all of which· were of furs other than mink, largely rabbit fur. By 1992, however, imports from China had grown by 63 percent, in constant terms, and represented nearly 10 percent of all U.S. fur apparel imports. Unlike earlier imports from China, 77 percent of these imports were of mink, mostly bridge furs.
During the past 5 years, nearly all of the imports from Hong Kong and Korea consisted of bridge furs made of mink, while the majority of imports from Canada were of other furs. Canadian manufacturers concenttated on apparel of wild fur because of
44 Imports from Hong Kong and Korea also fell to some extent because, as mentioned previously, they lost their GSP status on January l, 1989, and became subject to the 5.8-percent U.S. tariff on fur apparel.
4s Jindo Corp.-one of the world's largest fur apparel manufacturers, wholesalers, and retailers-moved much of its production from Korea to China after 1987.
Table& Fur apparel: U.S. lmpons for consumption, by principal sources, 1987·92
(1,000 doUars)
Source Hong Kong •••••••.••••.••••.•.••••••• Canada .••••.•.••.••••.••••.•••.••••• Greece ••••••••••..••••••••.•••..•.•. China •••••••••.•.•.••••••••..••.•••.• Korea ••••.•••••.••••••••••••.•••..•.• Italy ................................. . Finland .••••.••••••••••.•.•....••.•••• Uruguay •••..••.•..•.••••.•••.••.••..• Argentina •...•••••.•..•••.••••••..••.• Turkey •••••.•.•.•.•.•••••.•••••..•..• Dominican Republic •.•••••.••.••.•••.• All other •••••••••.••••••••••..•••.••.•
1987
117,095 118,696 41,145
8,385 139,322
9,206 4,821
244 2,791
8 3,309
32,268
Total •.••••••••••••••.••...••...•. 4n,29o
1988
88,844 102,188 35,672
7,978 112,358
8,708 3,746
685 4,137
453 9,110
20,982
394,861
1989
79,189 66,853 39,835 13,078 88,204 11,509 2,871 3,267 6,401 3,080
13,557 16,169
344,013
1990
57,132 35,846 32,555 11,713 50,382
9,476 1,930 5,051 3,967 4,305 6,735 8,729
227,821
1991
41,735 35,598 18,676 14,067 22,689
4,869 1,540 2,311 2,194
407 2,801 4,084
150,974
1992
36,262 31,648 18,998 11,755 5,241 5,184 2,081 1,8n 1,711
993 952
5,on 121.n9
Source: Compiled from official statisties of the U.S. Department of Commerce.
Table9 Nonapparel fur anlcles: U.S. lmpons for consumption, by principal sources, 1987·92
(1,000 doUars)
Source 1987 1988 1989 1990 1991 1992
Uruguay ••.•.•••••..••..•....•••..•... 10,538 8,375 5,904 6,511 7,060 5,146 Argentina •••.•••.•.•••.•..•••••....... 1,995 2,699 3,028 2,061 3,885 3,370 Brazil •.•••••.•••••••.•..••..•..••.... 3,068 2,090 3,366 2,717 2,116 1,843 China •.••.•••••••. ; •••••.•.••••.•.... 182 211 596 705 1,201 1,596 Korea ••••••••••••••••.•..••.••••.••.• 6,622 4,559 2,697 2,182 1,650 1,458 All other ••••••••••••••••••••.••.•....• 13,398 11,092 10,268 6,759 5,055 4,498
Total ••••••.••.••••••.•..•••.•.•.• 35,803 29,026 25,859 20,935 20,967 17,911
Source: Compiled from official statistics of the U.S. Department of Commerce.
Canada's abundant supply of wildlife and large fur trapping industry. Canadian fur apparel is esteemed in the United States for the quality of its pelts and workmanship.
In 1987. U.S. impons from Greece represented about 9 percent of all U.S. fur apparel impons. Between 1987 and 1992. however. impons from Greece declined at a somewhat lower rate (46 percent, in constant terms) than impons from other major sources. and represented about 16 percent of all U.S. fur apparel imports in 1992. During the past 5 years, most of these impons from Greece have been mediumto upper-range mink coats.
Though U.S. impons of fur apparel from the Dominican Republic represented less than 4 percent of total impons throughout 1987-92. they jumped in 1989 after several U.S. fur apparel manufacturers set up plants there for the manufacture of mink coats for sale in the United States. These manufacturers benefited from the low cost of Dominican labor, duty-free trealment under the Generalized System of Preferences {GSP). and foreign inveslment incentives provided by the Dominican govemmenL The plants were short-lived, however, largely because of reported low labor productivity and management difficulties, and all shut down within a few years.
During the past 5 years, mink garments originating in Italy have been the highest priced fur garments entering the United States, followed by Canadian and F'mnish mink garments and Italian nonmink garments. The most inexpensive impons have been nonmink garments originating in . Taiwan, China, Brazil, Uruguay. and Argentina. Many of the inexpensive imports from China have been children •s clothing lined with rabbit fur. Imports from the three South American countries were largely garments or clothing pans of sheepskin with the fur on the outside. Some of the imports from Argentina also included coat linings of nuttia or other soft. sheared furs. Many of the imports from Taiwan were ear muffs of sheepskin fur.
U.S. Fur Article Imports
In 1987. 7 percent of all U.S. impons of fur goods were composed of nonapparel articles. Uruguay was the largest source of these impons, Korea second. and Brazil third. By 1992, article imports had declined by 42 percent. in constant terms. but represented a laiger share, 13 percent, of all U.S. imports of fut goods. as total fur good imports were declining more rapidly. Uruguay remained the largest import source, followed by Argentina and Brazil.
13
In 1992, nearly all of the articles imported from South America were either finished sheepskin car seat covers or sheepskins sewn together into "fur plates" and imported by U.S. car seat cover manufacturers, most of which are located in Florida and California. A large portion of the fur articles from Korea and China were also sheepskin car seat covers manufactured from Australian and New Zealand skins.
FOREIGN MARKETS
The major world markets for fur apparel are industrialized countties with cool climates, especially the European Community, the United States, the Commonwealth of Independent States (CIS), Japan, and Scandinavia. United Nations trade data indicate that in 1991 Japan was the world's largest importer of manufactured fur goods, followed by the United States and Germany (table 10). As Japan's production of fur goods is minimal, its imports approximate consumption. For countties with substantial fur goods production, such as the United States, Gennany and the CIS, however, import data alone are not necessarily indicative of market size.
The collective imports of the major world consumers more than doubled, in constant terms, between 1983 and 1987. The single most important reason for this import growth was the growth of manufacturers, predominantly in East Asia and Greece, who were able to produce fur garments affordable to middle-class, worldng women worldwide.46 Between 1987 and 1991, however, collective imports of the major world consumers fell by about one third, largely on account of significant decreases in Japanese, U.S., and German consumption which occwred in response to economic recession, market saturation, and animal rights activism.
The broad trend of declining imports masks significant regional consiimption patterns. For instance, the decline in Italian imports during 1987-91 resulted from import substitution made possible by stepped-up domestic production. Contrary to its declining imports, Italian fur apparel consumption has risen over the past 5 years to the point where Italy had in 1991 the world's highest per capita fur apparel consumption Iate.47 Spanish fur apparel consumption, as well as imports, have also increased, however, the increase is hidden in the collective import data by declining imports in the larger fur apparel consuming countries.
46 Gennan impons grew during this period for other reasons. During 1980-85, German impons had been falling dramatically-by over 70 percent, in constant terms-because of both economic recession and an intense animal rights movement, which reporredly gained momentum earlier in Germany than in any other fur consuming C01Dltry. Between 1985 and 1987, however, because of economic improvement, weakening influence of the animal rights movement on German fur apparel consumption. and the growth of low-cost import sources, imports had grown again by nearly 80 percent, in constant terms.
47 Reported by officials at the Fur Council of Canada.
14
Increases in CIS and Hong Kong imports are similarly overshadowed. These increases have resulted from the expansion of fur apparel manufacturing in China. Because of China's unique commercial relationship with the CIS, Chinese producers had had ttade opponunities in the CIS not available to the Western fur producing countries until certain states of the CIS received MFN status in June 1992. Additionally, Chinese fur apparel is often shipped to Hong Kong where established apparel distribution
··channels exist. These exports to Hong Kong are often reexported to the United States and Japan. Japanese consumption of fur apparel remained relatively more stable than U.S. and German consumption, at least until 1990, because of the later onset of the recession in Japan and the less influential animal rights movement there.
U.S. Fur Apparel Exports
U.S. exports of fur apparel are small by international standards, with Hong Kong, Greece, and Korea each exporting about five times as much as the United States during the past decade (table 5).48 U.S. exports of fur apparel have grown, however, and represented about 23 percent of U.S. production (table 6) in 1992. Their composition and destinations have also changed significantly.
In 1983, U.s: exports were valued at $36 million, in constant terms. Almost all were finished garments; most of which were coats, and half of which were mink. Japan was the largest export market, followed by Switzerland, Germany, and Canada. During 1983-89, U.S. exports of fur apparel grew steadily and peaked in 1989 at $56 million, in constant terms. By 1992, however, exports had declined somewhat ro $45 million, in constant terms. Only about a quarter of these exports were of mink, and many were not finished garments but garment parts-collars, lapels, cuffs, and other trims-imported by coat manufacturers, primarily in the Dominican Republic and Panama, to be attached to their garments as trim. In fact, this export market for fur trim had grow so rapidly that the Dominican Republic became the largest U.S. export market for fur apparel/apparel parts, followed by Japan, Canada, and Saudi Arabia (table 11).
48 U.S. fur apparel manufacturers claim that foreign tariffs and consumption taxes, i.e., value-added taxes (VAT), which are generally higher than taxes in the United States, have discouraged them from selling their product abroad. Currently, the VAT in Spain is 28 percent, in Demnark 25 percent, Austria 20 percent, Belgium 19.5 percent, France 18.6 percent, the Netherlands 18.5 percent, Greece 18 percent, the United Kingdom 17.5 percent, Germany 14 percent, and Italy 19 percenL Italy's VAT, however, was reduced by decree from 38 percent in December 1992 (U.S. Department of State, "Italian Economic and Financial Developments: December 31 -January 7 ," telegram, message reference No. 00257, prepared at American Embassy in Rome, Jan. 8, 1992). VAT rates from the U.S. Department of Commerce.
Table10 Fur goods: World Imports, by prlnclpal markets and sources, 19831 1987,1990, and 1991
Percent of total Major 1991
Market 1983 1987 1990 1991 sources Imports
Million dollars
Japan •••.•• .' •••••.•••.•.•• , •••••• 185 428 357 268 Hong Kong 50 Korea 18
United States .•••••.•.•.••.••••••• 202 513 249 172 Hong Kong 24 Canada 21
Germany .••••••••••.....••••.•••. 313 361 151 152 Greece 63
Hong Kong ••••••.•.•.•.•••.•.••.• 8 65 9 75 China 91
CIS •.•••.•••••••.•••••••....••... 25 34 106 63 China 64
Switzerland ••••.•.•••.•...•••••••. 56 105 69 (2) Germa~1 123 Greece 120
Italy ............................. 32 86 55 62 Greece 18 Germany 17
Spain •.•.•••••••.••....•..•••.... 1 5 22 62 Greece 23 Germany 17
1 The major import sources for Switzerland and their share of Swiss imports are for 1990 data. 2 Not available.
Source: U.S. data compiled from official statistics of the U.S. Department of Commerce; all other data from the United Nations Trade Data System, for SITC 84201 (furskin clothing and products).
·Table 11. Fur apparel: U.S. exports, by prlnclpal markets, 1987-92
(1,000 dollars)
Market 1987 1988 1989 1990 1991 1992
Dominican Rep. • ••••.••.••.••••.••.••• 1,459 1,844 7,920 10,555 8,483 7,576 Japan •..•••••••.••.•.•.•••••••.••.••• 17,437 19,470 14,089 10,358 9,684 5,766 Canada .••••.••.•••..•..•••••.••..••• 3,942 7,683 12,955 19,093 15,571 14,360 Saudi Arabia •.•...••..•.••..•.•.•..•.• 624 2,614 3,193 3,070 5,031 3,301 Mexico •...•..•.•••......•.•........•. 1n 349 461 531 972 3,202 Switzerland ••••.•...•....•.•........•. 7,508 5,728 3,794 2,304 2,032 2,201 Spain •..•.••.•••.••••...•...•........ 116 380 388 1,986 3,989 2,108 Austria ..••••.•.•••..••..•...••....•.. 2,608 2,236 1,568 959 936 1,441 Germany .•••••••••••••••••.•••.••.... 5,950 3,725 2,240 1,056 1,785 1,438 Hong Kong ••••.•••••••.••••.••.•...•• 1,616 2,210 2,722 4,301 1,592 1,114 All other ••••••••.••...••.•••••..••.••. 13,531 12,964 9,263 7,749 14,092 13,488
Total ••.••••••..•.•..•.••.•••••••. 54,968 59,203 58,593 151,962 154,167 145,995
1 Total U.S. fur apparel exports to Canada during 1990-92 are estimated by the Commission staff as data on U.S. mink apparel exports to Canada during 1990-92 are unavailable. Source: Compiled from official statistics of the U.S. Department of Commerce.
Trade in fur apparel between the United States and the Dominican Republic began with U.S. imports of mink coats produced by U.S. manufacturers operating in the Dominican Republic. Followirfg the close of these operations, manufacturers of wool, leather, and man-made fiber coats, who operated assembly plants under the 807 tariff provision, increased their presence in the Dominican Republic and began imponing fur trim that was subsequently attached to gannents. Between 1987 and 1992, U.S. exports of fur trim to the Dominican Republic increased more than fivefold, in constant terms, and represented 16 percent of all U.S.
fm apparel exports in 1992.49 These fur trim exports were almost entirely of furs other than mink-usually fox, raccoon, and beaver-and were valued, on average, at $21 apiece.
49 Between 1987 and 1991, while U.S. exports of fur lrim to the Dominican Republic were climbing, U.S. imports of leather apparel from the Dominican Republic grew sixfold, imports of women's wool coats grew almost sevenfold, and imports of women's manmade fiber coats grew almost fivefold.
15
U.S. exports of finished fur apparel to Canada grew during this period also. In 1987, 7 percent of all U.S. fur apparel exports were destined for Canada. By 1992, exports to Canada had increased by 29 percent, in constant terms, and represented 9 percent of all U.S. fur apparel exports. Much of the increase in U.S. exports to Canada resulted from the January 1, 1989 elimination of Canadian tariffs on fur apparel under the CFI'A. U.S. exports of fur apparel to Canada increased by 69 percent between 1988 and 1989. Prior to the CFI'A, Canadian tariffs on most U.S. exports of fur apparel and articles had been 12.3 and 15.8 percent, respectively.
Other growing markets for U.S. fur apparel during this period have been Saudi Arabia, Kuwait, and the United Arab Emirates. In 1987, U.S. exports of fur apparel to Saudi Arabia were insignificant By 1992, however, they had grown to represent 7 percent of all U.S. fur aJ)parel exports. Since these exports were reportedly of furs other than mink and valued at the very low range, they were likely clothing accessories or garments of less expensive fm, for instance, sheepskin, raccoon, rabbit, or muskrat.
Though U.S. fur apparel exports to both Mexico and Spain were insignificant in 1987, by 1992 they had grown to represent 12 percent of all U.S. fur apparel exports. Most of these exports were of mink. Growing demand for fur apparel in the Mexican and Spanish markets is largely a result of the recent economic prosperity in both countries and of the growth of discretionary income that has offered inc~ opportUnities for sales of luxury goods.so Additionally, the Spanish fashion market is heavily influenced by the Italian market in which, at present, high-fashion fur apparel is very popular.
U.S. exports of fur apparel to Gennany and Swit7.erland collectively represented a quaner of all U.S. fur apparel exports in 1987. By 1992, however,
SO As the proposed North American Free-Trade Agreement (NAFI'A) would eliminate Mexico's 20 percent tariff on fur goods, U.S. exparts to Mexico could increase if the NAFI'A is approved. Future exports to Mexico under the NAFI'A would most likely include fur trim used in the production of coats in Mexico for sale in the United States.
Table 12
after a 68-percent decline, in constant terms, exports to these two countries represented only 8 percent of all U.S. fm apparel exports. This significant decline can be attributed, in part, to declining consumption in the German and Swiss markets. However, heavy competition from Italian and Greek manufacturers also played a large role (table 10).
U.S. exports to Japan represented nearly a third of all U.S. fur apparel exports in 1987, but fell by 61 percent, in constant tenns, to represent 13 percent of all exports in 1992. Although Japanese consumption of fur apparel has remained relatively stable, industry sources report that Japan has been a very diff'ICult market for them to penetrate on account of the relatively high-20 percent-Japanese tariff, high transportation fees, and the high cost of exhibiting their garments in Japanese trade shows.
U.S. Fur Article Exports During 1986-91, U.S. exports of nonapparel fur
articles represented less than 15 percent of all U.S. exports of fm goods and never exceeded $9 million (table 12). About a quarter of them were destined for Japan and consisted of industrial polishing equipment parts, painting tools, and sheepskin car seat covers imported by Japanese automobile accessory dealers. In 1992, U.S. exports of fur articles more than doubled to represent a third of all U.S. exports of fur goods. Nearly half of these growing exports consisted of the. above listed items destined for Japan.
U.S. TRADE BALANCE The U.S. trade deficit in fur goods has narrowed
considerably since 1988, shrinking by $288 million to $72 million in 1992 (table 13). The improvement in the ttade balance stemmed almost entirely· from a $284 million decline in imports during 1998-92. This decline was fairly widespread among supplying countries, although Korea, Hong Kong, Canada, and Greece absorbed most of the decrease, as discussed previously. By contrast, U.S. exports of fur goods fluctuated within a relatively narrow range during 1988-92, averaging slightly more than $60 million annually.
Nonapparel fur articles: U.S. exports, by principal markets, 1987-92
(1,000 dollars)
Market 1987 1988 1989 1990 1991 1992
Japan ••••••..••••.•.•..•.. , ......•... 1,147 1,212 1,008 860 2.247 10,327 All other .•••.•••..•...••......•....... 3,316 3,586 7,333 4,103 6,688 11,837
Total ••••.••.••••......••.••.••... 4,463 4,798 8,341 4,963 8,935 22,164
Source: Compiled from official statistics of the U.S. Department of Commerce.
16
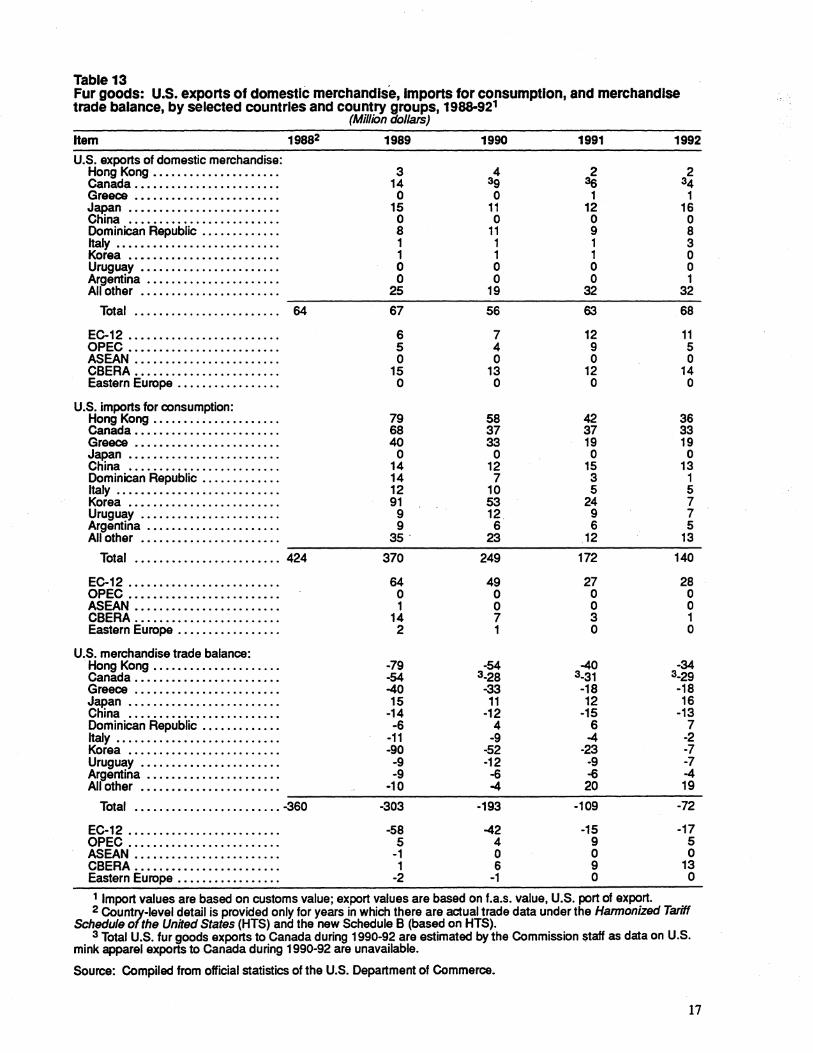
Table 13 Fur goods: U.S. expons of domestic merchandise, lmpons for consumption, and merchandise trade balance, by selected countries and country groups, 1988-921
(Million i:lo//ars)
Item 19882 1989 1990 1991 1992
U.S. exports of domestic merchandise: Hong Kong ••••.••....••••.•.... 3 4 2 2 Canada •••••••.....•..•••.••..• 14 39 36 34 Greece ························ 0 0 1 1 Japan •••••••••••.....•••••..•• 15 11 12 16 China ••••..•••••.•.••.•.••..•. 0 0 0 0 Dominican Republic •.•.•...•.... 8 11 9 8 Italy •••.••••.••.••.•..•••.•..•• 1 1 1 3 Korea ••••••..•....•..• · ••••...• 1 1 1 0 Uruguay ••••.••.••...•••.••..•. 0 0 0 0 Argentina .•••....••..•..•••.... 0 0 0 1 All other •.••.•••....•••..•..••• 25 19 32 32
Total ·········· .............. 64 67 56 63 68
EC-12 ......................... 6 7 12 11 OPEC ••••..••......•.•...••••. 5 4 9 5 ASEAN ........................ 0 0 0 0 CBERA •.•.••.••....••.•.•.•••. 15 13 12 14 Eastern Europe ...•••...•....... 0 0 0 0
U.S. imports for consumption: Hong Kong ••••.•.••.••••.••.••. 79 58 42 36 Canada ••••••.....•••....••.... 68 37 37 33 Greece ........................ 40 33 19 19 Japan ......................... 0 0 0 0 China ......................... 14 12 15 13 Dominican Republic ...•...•..... 14 7 3 1 Italy •.•.••••.••... , .•.....•.... 12 10 5 5 Korea ••••..•..•..•............ 91 53 24 7 Uruguay .••••...••.•...•...••.. 9 12. 9 7 Argentina ••.•..•••......•.••... 9 6 6 5 All other ••.••••••••.......•.... 35. 23 12 13
Total ........................ 424 370 249 172 140
EC-12 64 49 27 28 OPEC::::::::::::::::::::::::: 0 0 0 0 ASEAN 1 0 0 0 CBERA :::::::::::::::::::::::: 14 7 3 1 Eastern Europe .•••..••..•....•. 2 1 0 0
U.S. merchandise trade balance: Hong Kong..................... -79 -54 -40 -34 Canada . • • • • • • • . • • . . • • . • . . • • . . . -54 3-28 3.31 3-29 Greece • • . . • • . . • • • . . . • . . . . . • . . • -40 -33 -18 -18 Japan • • • • . • • • • • • . . . . • . . . . • . . . • 15 11 12 16 China • • • • . • • • . • • • . . • . . . . . • . . . • -14 -12 -15 -13 Dominican Republic . • . • . • . • • . . • . -6 4 6 7 Italy • • • • • • . • • . . • • • . • • • . • • . • . • • . -11 -9 -4 -2 Korea • • • • . . . . • • • . . . . • . . . . • . . • . -90 -52 -23 -7 Uruguay • • • . • • • . • • . • • . . . . . • • . • • -9 -12 -9 -7 Argentina • • . • • • • . • . . • . . • . . • • . . . -9 -6 -6 -4 All other •• • . ••••• •• • . • .•. • • •. •• -10 -4 20 19
Total ••......•••.•.•.....•... -360 -303 -193 -109 -72
EC-12 • . . . . • • • . . • . . . • • . • . . . . . • . -58 -42 -15 -17 OPEC......................... 5 4 9 5 ASEAN . . . • • • • • • . • . . • . • • . . • . . • • -1 0 0 0 CBERA • • . • . • • • • . . • • . • • • . . . . . • . 1 6 9 13 Eastern Europe . • • • . . . . . . . . . . . • . -2 -1 0 0
1 Import values are based on customs value; export values are based on f.a.s. value, U.S. port of export. 2 Country-level detail is provided only for years in which there are actual trade data under the Harmonized Tariff
Schedule of the United States (HTS) and the new Schedule B (based on HTS). 3 Total U.S. fur goods· exports to Canada during 1990-92 are estimated by the Commission staff as data on U.S.
mink apparel exports to Canada during 1990-92 are unavailable.
Source: Compiled from official statistics of the U.S. Department of Commerce.
17

APPENDIX A EXPLANATION OF TARIFF AND TRADE AGREEMENT TERMS
TARIFF AND TRADE AGREEMENT TERMS
The Harmonized Tari.ff Schedule of the. United States (IITS) replaced the Tariff Schedules of the United States (TSUS) effective January I, I989. Chapters I through 97 are based upon the internationally adopted Harmonized Commodity Description and Coding System through the 6-digit level of product description, with additional U.S. product subdivisions at the 8-digit level. Chapters 98 and 99 contain special U.S. classification provisions and temporary rate provisions, respectively.
Rates of duty in the general subcolmnn of HTS column I are most-favored-nation (MFN) rates; for the most part, they represent the final concession rate from the Tokyo Round of Multilateral Trade Negotiations. Column I-general duty rates are applicable to imported goods from all countries except those enmnerated in general note 3(b) to the HTS, whose products are dutied at the rates set forth in column 2. Goods from Albania, Armenia, Belarus, Bulgaria, the People's Republic of China, the Czech Republic, Estonia, Georgia, Hungary, Kazakhstan, Kyrgyzstan, Latvia, Lithuania, Moldova, Mongolia, Poland, Russia, Slovakia, and the Ukraine are currently eligible for MFN treatment. Among articles dutiable at colmnn I-general rates, particular products of enumerated countries may be eligible for reduced rates of duty or for duty-free entry under one or more preferential tariff programs. . Such tariff treatment is set forth in the special subcolmnn of HTS column I. Where eligibility for special tariff treatment is not claimed or established, goods are dutiable at colmnn I-general rates.
The Generalized System of Preferences (GSP) affords nonreciprocal tariff preferences to developing countries to aid their economic development and to diversify and expand their production and exports. The U.S. GSP, enacted in title V of the Trade Act of 1974 and renewed in the Trade and Tariff Act of 1984, applies to merchandise imported on or after January l, I976 and before July 4, 1993. Indicated by the symbol "A" or "A*" in the special subcolumn of column 1, the GSP provides duty-free entry to eligible articles the product of and imported directly from designated beneficiary developing countries, as set forth in general note 3(c)(ii) to the HTS.
The Caribbean Basin Economic Recovery Act (CBERA) affords nonreciprocal tariff preferences
A-2
to developing countries in the Caribbean Basin area to aid their economic development and to diversify and expand their production and exports. The CBERA, enacted in title Il of Public Law 98-67, implemented by Presidential Proclamation 5133 of November 30, 1983, and amended by the Customs and Trade Act of I990, applies to merchandise entered, or withdrawn from warehouse for consumption, on or after January l, 1984; this tariff preference program has no expiration date. Indicated by the symbol "E" or "E*" in the special subcolumn of column 1, the CBERA provides duty-free entry to eligible articles, and reducedduty treatment to cenain other articles, which are the product of and imported directly from designated countries, as set forth in general note 3(c)(v) to the HTS.
Preferential rates of duty in the special subcolumn of column I followed by the symbol "IL" are applicable to products of Israel under the United States-Israel Free Trade Area Implementation Act of 1985 (IFrA), as provided in general note 3(c)(vi) of the HTS. Where no· rate of duty is provided for products of Israel in the special subcolumn for a particular provision, the rate of duty in the general subcolumn of column 1 applies.
Preferential rates of duty in the special subcolumn of column 1 followed by the symbol "CA" are applicable to eligible goods originating in the territory of Canada under the United States-Canada Free-Trade Agreement (CFTA), as provided in general note 3(c)(vii) to the HTS.
Preferential nonreciprocal duty-free or reducedduty treatment in the special subcolumn of column 1 followed by the symbol "J'' or "J*" in parentheses is afforded to eligible articles the product of designated beneficiary countries under the Andean Trade Preference Act (ATPA), enacted in title Il of Public Law 102-182 and implemented by Presidential Proclamation 6455 of July 2, 1992 (effective July 22, 1992), as set forth in general note 3(c)(ix) to the HTS.
Other special tariff treatment applies to particular products of insular possessions (general note 3(a)(iv)), goods covered by the Automotive Products Trade Act (API'A) (general note 3(c)(iii)) and the Agreement on Trade in Civil Aircraft (ATCA) (general note 3(c)(iv)), and anicles imported from freely associated states (general note 3(c)(viii)).
The General Agreement on Tariffs and Trade (GATI) (61 Stat (pt 5) ASS; 8 UST (pt 2) 1786) is the multilateral agreement setting forth basic principles governing international trade among its 111 signatories. The GAIT's main obligations relate to most-favored-nation treatment, the maintenance of scheduled concession rates of duty, and national (nondiscriminatory) treatment for imported products; the GAIT also provides the legal framework for customs valuation standards, .. escape clause" (emergency) actions, antidumping and countervailing duties, and other measures. Results of GAIT-sponsored multilateral tariff negotiations are set forth by way of separate schedules of concessions for each participating contracting party, with the U.S. schedule designated as Schedule XX.
Officially known as .. 'The Arrangement Regarding International Trade in Textiles," the Multifiber A"angement (MFA) provides a framework for the negotiation of bilateral agreements between importing and producing countries, or for unilateral action by importing countries in the absence of an agreement. These bilateral agreements establish quantitative limits on imports of textiles and apparel, of cotton and other vegetable fibers, wool, man-made fibers and silk blends, in order to prevent market disruption in the importing countries-restrictions that would otherwise be a departure from GAIT provisions. The United States has bilateral agreements with many supplying countries, including the four largest suppliers: China, Hong Kong, the Republic of Korea, and Taiwan.
A-3