Embed Size (px)
Citation preview
36
Industriousness: On the Sources of Cross-Industry Variation in Foreign Direct Investment Restrictions
Sonal S. Pandya PhD Candidate
Harvard University [email protected]
October 2006
Abstract Amid a growing interest in the political economy of foreign direct investment (FDI) an important fact has been overlooked: countries restrict FDI inflows. Countries have long placed limits on the entry and operation of foreign-owned firms yet we lack explanations for why these restrictions exist. This paper develops and tests a political economy explanation for FDI policies; FDI inflows alter returns to local factor groups creating incentives to lobby for specific policies regulating these inflows. These tests make use of a new data set of industry-level foreign ownership restrictions covering 119 countries and 58 industries. I find that governments are more likely to restrict FDI intended to compete in local markets than FDI that exploits cost advantages. Additionally, I find that the probability of restrictions decreases dramatically with electoral competition - governments with multi-party competition are half as likely to restrict foreign ownership as those governments dominated by a single party. These findings are robust to controls for nationalist and national security concerns.
1
Introduction
It is difficult to overstate the importance of foreign direct investment (FDI) to the
contemporary international economy. FDI, which entails firms establishing overseas
subsidiaries, is the single largest source of international capital flows (World Bank 2003).
Additionally, FDI notably shapes other key features of the global economy. Amid
anxieties that economic integration subjects countries to greater risk and volatility FDI
flows are exceptionally stable. Figure 1 depicts FDI’s steady increase over the past thirty
years in contrast to frequent shifts to portfolio capital flows. The late 1990s are
particularly illustrative; despite multiple major financial and currency crises FDI flows
markedly increased while portfolio flows plummeted. FDI also generates approximately
twenty percent of world trade flows through intrafirm trade, the movement of production
inputs and final products within firms and across national borders (Hummels et al 2001).
Despite this crucial importance to the world economy we know little about how
and why countries regulate FDI. In particular, we lack an account of how and why
countries restrict FDI flows into their countries. There are three distinct patterns of
variation in FDI regulation: a cross-industry trend of greater restrictions in service
industries than in manufacturing; a cross-national trend of fewer restrictions in more
developed countries as compared to developing countries, and a trend over time of
declining restrictions. Existing research on the politics of FDI do not address the causes
of restrictions. Countries themselves often justify their limits on FDI with concerns about
national security or the integrity of national identity. To be sure, these concerns are
relevant to understanding FDI restrictions but they are not sufficient to explain the range
of observed variation. Current research on the politics of FDI considers how political
2
institutions influence the total amount of FDI that countries receive.1 An earlier
generation of scholars examined why governments expropriated foreign investments.2
Juxtaposing these existing accounts reveals both that existing work relies on assumptions
about governments’ preferences for FDI flows and that over these assumptions have
changed over time. This shift indicates the need for a more robust account of FDI’s
politics, one that gives purchase on the multiple dimensions along which FDI restrictions
vary.
In this paper I develop and test a model of FDI regulation. I base this model on
FDI’s distributional effects, how FDI redistributes income within recipient countries. I
make extensive use of existing economic models of FDI determinants to motivate the
model. In particular, I argue that FDI’s distributional effects depend on firms’ motive for
investment, either to reduce production costs or enter new markets. Vertical FDI, or FDI
to reduce production costs, increase’s labor income but may decrease returns to capital.
FDI to compete in local markets, horizontal FDI, reduce both labor and capital income
while increasing returns to consumers. From these distinct types of FDI arise different
political alignments and the relevant features of policy-making also differ. My main
theoretical finding is the horizontal FDI is more likely to be restricted than vertical FDI
due to the relative severity of its distributional effects.
I empirically test this theoretical claim with a dataset that I collected of industry-
level foreign ownership restrictions, a specific type of FDI regulation. I use a cross-
section of these data, restrictions in the 1990s, for 119 countries and 57 industries, to test
my hypothesis for why restrictions vary across countries and industries. I find that
1 For example, Jensen 2003, Li and Resnick 2003 2 For example, Jodice 1980, Kobrin 1987
3
governments are more likely to restrict foreign ownership when it results in increased
market competition. Additionally, I find that countries with electoral competition are half
as likely to have foreign ownership restrictions than those countries without such
competition.
In the next section of this paper I derive FDI’s distributional effects. I discuss
some of the fundamentals of FDI that motivate my assumptions and building on these
assumptions, I derive a model of FDI’s distributional effects. Next, I build hypotheses
for the cause of foreign ownership regulation based on FDI’s predicted distributional
effects and the resulting political cleavages. The following section describes my
empirical tests including the measurement of key variables, the choice of statistical model,
and, of course, empirical findings. In the concluding section, I return to the larger issue
with which I began: FDI’s role in the global economy. In light of the empirical findings
presented here I revisit stylized facts about the politics of economic globalization and
suggest additional avenues of research.
II. Distributional Effects of FDI Inflows
The defining feature of FDI is the firm-specificity of capital assets. FDI is the
cross-border flow of firm-specific capital assets like proprietary production technologies,
managerial and organizational practices, and trademarked brands. Firms engage in FDI
to overcome the multiple inefficiencies of market-mediated licensing of assets including
the incompleteness of contracts, misaligned incentives of contracting firms, and
difficulties in monitoring licensees. For example, if firms license their technologies to
partner firms abroad they run the risk of having these technologies stolen and losing the
4
future income that these assets generate (Horstmann and Markusen 1987, Either and
Markusen 1996). FDI keeps assets internal to the firm and instead expands the firm itself
in order to enter new markets and realize firm-level scale economies (Hymer 1976,
Antràs 2003).3
The high costs of FDI ensure that only the most productive firms in the world
undertake it. The establishment, coordination, and monitoring of multiple production
facilities in geographically distant locations is a costly endeavor. 4 Additionally, foreign-
owned firms typically have less information about the local market than their domestic
counterparts, placing them at a relative disadvantage. MNCs are firms whose capital
assets confer a sufficiently large competitive advantage so as to offset these costs.
Helpman, Melitz and Yeaple (2004) confirm this logic concluding that multinational
exporting firms are, on average, fifteen percent more productive than their wholly
domestic exporting counterparts.5 Firms that become multinationals not only tend to
have more productive capital assets but after becoming multinational they register
additional productivity gains owing greater firm-level scale economies. Barba-Navaretti
and Falzoni (2004) document these two sources of productivity for a sample of Italian
firms. Based on this reasoning, I assume that MNCs are more productive than local firms
in host countries in which they invest.6
3 Firms resolve the incomplete contracting problem by allocating residual rights of control, those rights which cannot specified ex ante in a contract, to the parent firm (Grossman and Hart 1986). 4 Firms engage in FDI by establishing new production facilities or acquiring existing firms in the host country. For simplicities sake, I assume all FDI is of the former variety. Most of the same conclusions apply to FDI through mergers and acquisitions but the predictions regard capital’s preferences are somewhat complicated by the presence of a local capital beneficiary of FDI. 5 For similar empirical results based on a model of monopolistic competition see Melitz 2003. 6 In a few, mostly advanced host economies MNCs will face local firms who are themselves MNCs in which case the productivity gap will be narrower.
5
Before moving on the politics that follow from these effects the widely-touted
benefits of FDI inflows merit a brief discussion in the present context. FDI is often
considered a powerful engine of economic development by creating jobs; facilitating
technology transfer and skill upgrading; and balancing national accounts by increasing
export activity.7 Indeed, these effects are cited as the rationale for the generous
incentives that countries sometimes use to entice foreign investors. There are prominent
examples of economic development with extensive FDI including Ireland and China.
The growth rates witnessed in these countries are sufficiently high so raise questions
about what role these aggregate welfare effects play in shaping individuals’ preferences.
It also possibly casts doubt on a distributional explanation for FDI policies; politicians
may be willing to disregard distributive concerns to obtain unusually high levels of
growth associated with FDI flows. What role, then, do possible aggregate welfare gains
play? It helps to first put FDI’s aggregate effects into perspective. Analyses of FDI’s
influence on aggregate growth indicate no significant effect of FDI on growth (Carkovic
and Levine 2005); or necessary preconditions for FDI to spur growth including sufficient
levels of human capital, financial development, or international trade.8 A growing body
of research utilizes firm-level data to identify productivity spillovers from foreign-owned
firms to their local counterparts and linked industries.9 To be sure, there is evidence of
positive productivity spillovers but these findings show that spillovers depend
overwhelmingly on a variety of firm- and location-specific variables, precluding
7 See Romer 1993 for a discussion of FDI and technology transfer. 8 See Borzenstein, de Gregorio, Lee 1998, Alfaro, Chanda, Kalemli- Ozcan, Saye 2004, Balasubramaniam, Salisu, and Sapsford 1996. 9 Productivity spillovers, an increase in productivity in local firms, occurs through formal partnerships between local suppliers and investing firms, competition-induced innovation, mimicry, and technology diffusion through the movement of local labor out of foreign-owned firms into local firms. See Javorik and Spatareanu 2005 for review of the existing empirical findings on FDI-induced productivity spillovers.
6
generalized conclusions. Similarly, macroeconomic benefits like improved balances of
payment are possible but do not systematically obtain. How, then, should these potential
aggregate welfare gains be weighed against FDI’s more pointed distributional effects?
The expected gains in improved productivity and growth are unlikely to make a
difference in FDI’s net income effects for an individual, or any such effects would only
be evident in the long run. The model does capture more pointed gains like job creation
that are prominent justifications for FDI incentives.
Multinational Organization of Production
Firms organize their multinational production based on one of two goals: reducing
production costs or entering new markets. Like all forms of international capital flows
FDI is ultimately a strategy by which capital owners exploit potential returns to their
assets. The mechanisms by which FDI generates returns, however, are quite different
from those of more liquid forms of capital. In the presence of capital mobility, flows of
financial capital follow the logic of factor price equalization: capital owners in capital-
rich economies transfer their assets to capital-poor economies where, due to the relative
scarcity of capital, a higher rental rate for capital prevails. The distributional implications
of these capital flows all obtain from a single effect, a change in the price of financial
capital. By contrast, owners of firm-specific capital, vulnerable to the incomplete
contracting problems described above, do not seek returns to their assets in arms-length
market transactions. Instead, FDI yields returns to firm-specific capital assets in foreign
product markets. Specifically, MNCs use FDI to either lower production costs by
exploiting differences in factor prices, vertical FDI, or enter new product markets,
7
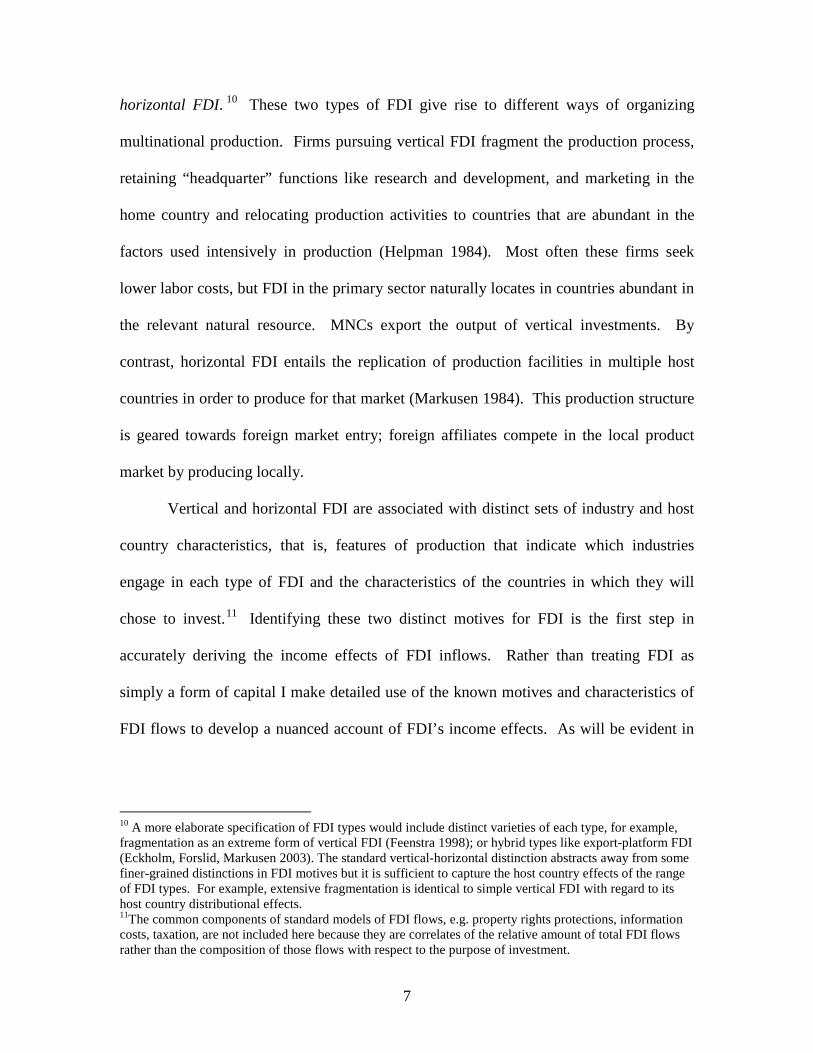
horizontal FDI. 10 These two types of FDI give rise to different ways of organizing
multinational production. Firms pursuing vertical FDI fragment the production process,
retaining “headquarter” functions like research and development, and marketing in the
home country and relocating production activities to countries that are abundant in the
factors used intensively in production (Helpman 1984). Most often these firms seek
lower labor costs, but FDI in the primary sector naturally locates in countries abundant in
the relevant natural resource. MNCs export the output of vertical investments. By
contrast, horizontal FDI entails the replication of production facilities in multiple host
countries in order to produce for that market (Markusen 1984). This production structure
is geared towards foreign market entry; foreign affiliates compete in the local product
market by producing locally.
Vertical and horizontal FDI are associated with distinct sets of industry and host
country characteristics, that is, features of production that indicate which industries
engage in each type of FDI and the characteristics of the countries in which they will
chose to invest.11 Identifying these two distinct motives for FDI is the first step in
accurately deriving the income effects of FDI inflows. Rather than treating FDI as
simply a form of capital I make detailed use of the known motives and characteristics of
FDI flows to develop a nuanced account of FDI’s income effects. As will be evident in
10 A more elaborate specification of FDI types would include distinct varieties of each type, for example, fragmentation as an extreme form of vertical FDI (Feenstra 1998); or hybrid types like export-platform FDI (Eckholm, Forslid, Markusen 2003). The standard vertical-horizontal distinction abstracts away from some finer-grained distinctions in FDI motives but it is sufficient to capture the host country effects of the range of FDI types. For example, extensive fragmentation is identical to simple vertical FDI with regard to its host country distributional effects. 11The common components of standard models of FDI flows, e.g. property rights protections, information costs, taxation, are not included here because they are correlates of the relative amount of total FDI flows rather than the composition of those flows with respect to the purpose of investment.
8
the following section, the underlying distributional consequences of vertical and
horizontal FDI differ dramatically.
FDI’s income effects vary with the type of FDI, making this distinction crucial to
correctly specifying FDI’s implications for host countries. Many salient characteristics
vary with the type of FDI including the specific activities of foreign-owned firms, their
factor demands, and their relationship to other firms in the market. As a result the
welfare and distributional effects of FDI vary and so to do the salient political dynamics
like the cleavages between groups. In order to explain variation across industries in FDI
restrictions I make use of this distinction in types of FDI. The key to explaining industry-
level restrictions on FDI is in identifying the income effect of FDI in a given industry.
This, in turn, is an exercise in correctly identifying whether FDI into an industry will be
vertical or horizontal.
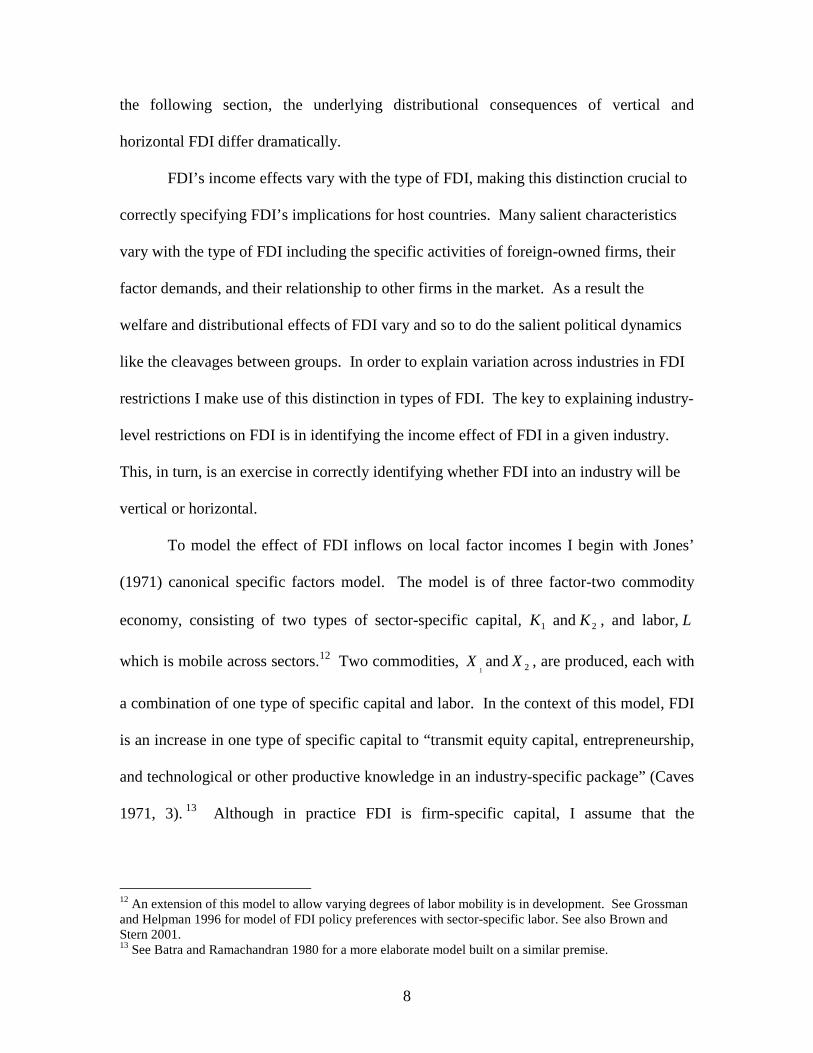
To model the effect of FDI inflows on local factor incomes I begin with Jones’
(1971) canonical specific factors model. The model is of three factor-two commodity
economy, consisting of two types of sector-specific capital, 1K and 2K , and labor,L
which is mobile across sectors.12 Two commodities, 1
X and 2X , are produced, each with
a combination of one type of specific capital and labor. In the context of this model, FDI
is an increase in one type of specific capital to “transmit equity capital, entrepreneurship,
and technological or other productive knowledge in an industry-specific package” (Caves
1971, 3).13 Although in practice FDI is firm-specific capital, I assume that the
12 An extension of this model to allow varying degrees of labor mobility is in development. See Grossman and Helpman 1996 for model of FDI policy preferences with sector-specific labor. See also Brown and Stern 2001. 13 See Batra and Ramachandran 1980 for a more elaborate model built on a similar premise.
9
commodities produced with such capital are sold in a single, sector-wide commodity
market. 14
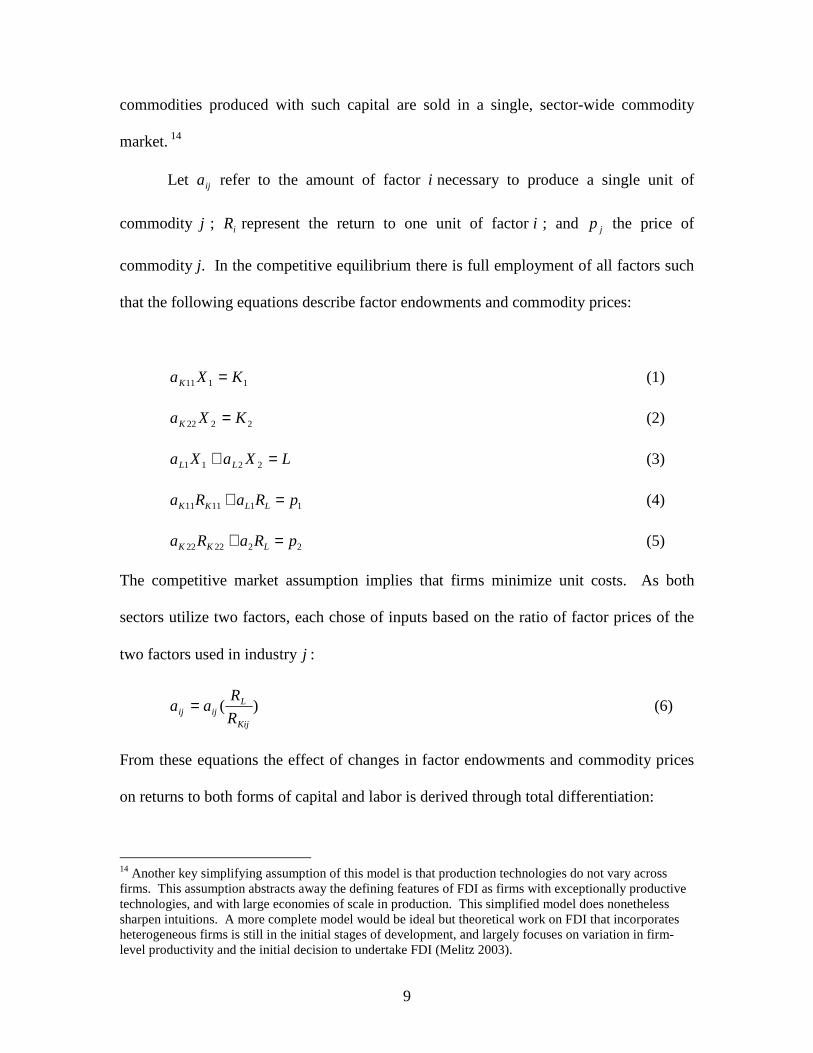
Let ija refer to the amount of factor i necessary to produce a single unit of
commodity j ; iR represent the return to one unit of factori ; and jp the price of
commodity j. In the competitive equilibrium there is full employment of all factors such
that the following equations describe factor endowments and commodity prices:
1111 KXaK = (1)
2222 KXaK = (2)
LXaXa LL =+ 2211 (3)
111111 pRaRa LLKK =+ (4)
222222 pRaRa LKK =+ (5)
The competitive market assumption implies that firms minimize unit costs. As both
sectors utilize two factors, each chose of inputs based on the ratio of factor prices of the
two factors used in industryj :
)(Kij
Lijij R
Raa = (6)
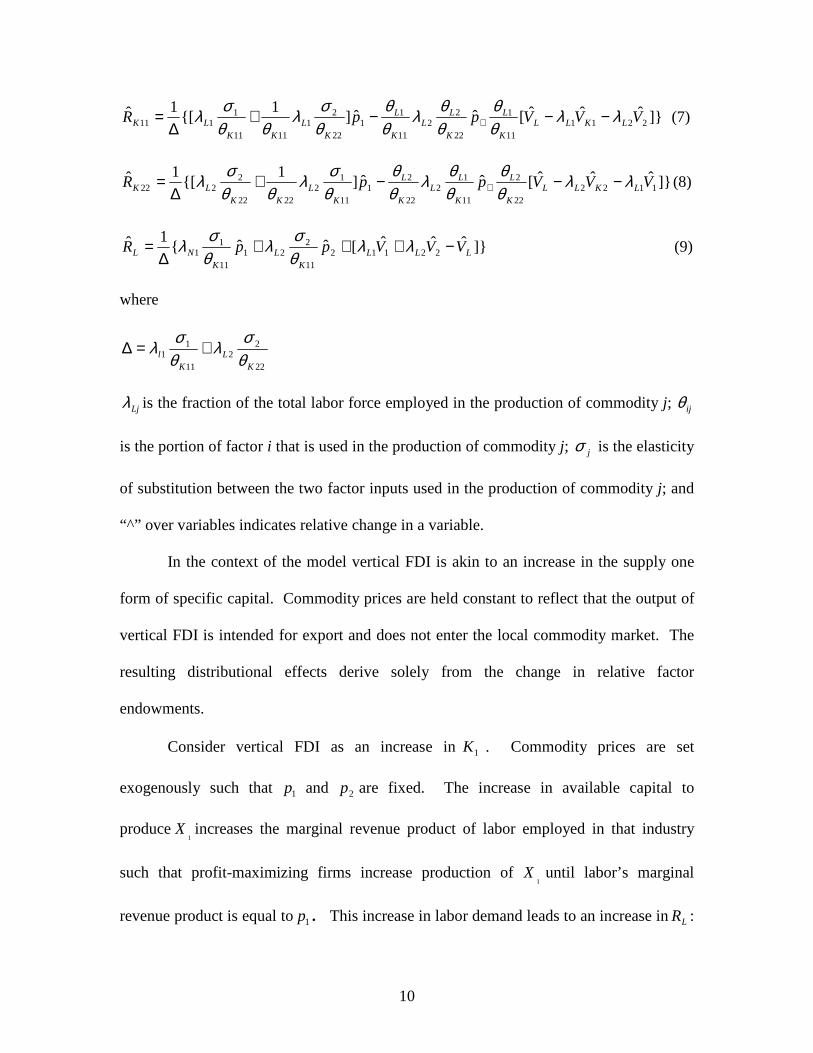
From these equations the effect of changes in factor endowments and commodity prices
on returns to both forms of capital and labor is derived through total differentiation:
14 Another key simplifying assumption of this model is that production technologies do not vary across firms. This assumption abstracts away the defining features of FDI as firms with exceptionally productive technologies, and with large economies of scale in production. This simplified model does nonetheless sharpen intuitions. A more complete model would be ideal but theoretical work on FDI that incorporates heterogeneous firms is still in the initial stages of development, and largely focuses on variation in firm-level productivity and the initial decision to undertake FDI (Melitz 2003).
10
]}ˆˆˆ[ˆˆ]1
{[1ˆ
221111
1
22
22
11
11
22
21
1111
1111 VVVppR LKLL
K
L
K
LL
K
L
KL
KKLK λλ
θθ
θθλ
θθ
θσλ
θθσλ −−−+
∆= + (7)
]}ˆˆˆ[ˆˆ]1
{[1ˆ
112222
2
11
12
22
21
11
12
2222
2222 VVVppR LKLL
K
L
K
LL
K
L
KL
KKLK λλ
θθ
θθλ
θθ
θσλ
θθσλ −−−+
∆= + (8)
]}ˆˆˆ[ˆˆ{1ˆ
2211211
221
11
11 LLL
KL
KNL VVVppR −+++
∆= λλ
θσλ
θσλ (9)
where
22
22
11
11
KL
Kl θ
σλθσλ +=∆
Ljλ is the fraction of the total labor force employed in the production of commodity j; ijθ
is the portion of factor i that is used in the production of commodity j; jσ is the elasticity
of substitution between the two factor inputs used in the production of commodity j; and
“^” over variables indicates relative change in a variable.
In the context of the model vertical FDI is akin to an increase in the supply one
form of specific capital. Commodity prices are held constant to reflect that the output of
vertical FDI is intended for export and does not enter the local commodity market. The
resulting distributional effects derive solely from the change in relative factor
endowments.
Consider vertical FDI as an increase in1K . Commodity prices are set
exogenously such that 1p and 2p are fixed. The increase in available capital to
produce1
X increases the marginal revenue product of labor employed in that industry
such that profit-maximizing firms increase production of 1
X until labor’s marginal
revenue product is equal to1p . This increase in labor demand leads to an increase in LR :
11
producers 1
X offer higher wages to attract workers into their sector, forcing producers of
2X match this higher wage in order to retain workers. Since prices remain constant an
increase in LR raises labor’s real wage. At this higher wage, output of 2X declines as
does 22KR . 11KR also declines as labor captures a larger share of returns to the industry as
a whole. While returns to both types of capital decline, the magnitude of this change
hinges on the relative labor intensity of production, Kijλ , such that returns to local capital
owners are a declining function of Kijλ . Vertical FDI, thus, triggers a reallocation of
income from labor to capital by increasing labor demand. These are real income effects
given that commodity prices are held constant.
A wealth of empirical findings supports these claims. There is evidence of
general equilibrium wage effects in Ireland (Barry 2004) and Mexico (Feenstra and
Hanson 1997), cases in which FDI inflows were sufficiently large relative to the host
economy’s size. 15 Görg and Greenway (2001) find that local firms increase wages after
the entry of foreign-owned firms despite their constant or even decreasing total factor
productivity, further indicating a broader wage effect.16 In one of the few studies of
FDI’s localized wage impact, Blonigen and Figlio (2000) examine the effects of FDI on
wages in South Carolina. They conclude that the entry of a single, average-sized foreign-
owned plant, employing about 190 workers, increases by 2.3 percent the real wage of all
15 Feenstra and Hanson make the additional assumption that FDI entails shifting the least-skilled activities in the home country to a host country where that same activity is a skilled labor-intensive activity. The authors conclude that under these conditions FDI can actually reduce unskilled wages in the host economies by raising the average skill-level of labor demanded. This is, to the best of my knowledge, the only model of FDI that predicts FDI inflows reduce the income of any segment of the labor market. See Feenstra and Hanson (1996) for a detailed discussion of this model. Empirical findings of reduced unskilled labor demand, however, should be treated with some caution as this result is observationally consistent with skill-biased technological change. 16 These results also demonstrate that increased returns to labor are not due to the propensity of foreign investors to acquire firms that were more productive ex ante.
12
workers employed in the same industry and county as the foreign-owned plant. This
wage increase, they argue, is simply too large not to reflect an overall increase in labor
demand. There is less empirical evidence regarding vertical FDI’s effects on capital
income however Hiscox (2004) argues that US manufacturing industries that are not
active in FDI are more likely to engage in political lobbying and file grievances with the
International Trade Commission. This finding suggests that these capital owners have a
greater incentive to lobby for protection due to the effect on factor incomes of FDI into
other industries.
Horizontal FDI entails an increase in1K . For the sake of clarity now assume that
1X is a nontraded commodity whose price is determined solely by local production, such
that 1p is set locally; 2p remains fixed. As above, an increase in 1K leads to expanded
output of1
X . With an increase in the supply of 1
X , 1p declines. Recall that firms
minimize unit costs in selecting their production inputs. Jones (1971, 7) notes that “the
change in the market price of 1
X must be positively weighted average of (and therefore
trapped between) the changes in individual factor prices.” With a reduction in 1p the
marginal revenue products of both factors employed in 1
X decline but 11KR falls by a
greater percentage than does1p while LR declines but by less than1p . This can be easily
seen by solving Equation 4 for11KR . Changes in capital income are more pronounced
than labor due to sector specificity of capital. Unlike the vertical FDI case, returns to the
two types of capital owners diverge. Although 11KR falls, 22KR increases with the decline
in 1p and 2p remaining fixed. By contrast, wages are determined by the weighted sum
of labor use in both sectors which cushions wages against the drop in1p . The net income
13
effect for labor is ambiguous with the precise effect depending on labor’s consumption
preferences.17 Unlike the vertical case, horizontal FDI reduces the income of capital
owners in the industry of investment, thus dividing capital owners on the issue of
horizontal FDI. The ultimate effects of labor require some further theorizing.
Although this model captures the general effects of price competition its spare
assumptions obscure politically salient distributional effects. In order to discuss these
effects I relax the assumption of perfectly competitive commodity markets and introduce
sector-specific rents. As noted above, horizontal FDI indicates the existence of other
market entry barriers; these entry barriers give rise to rents.18 With the protection of
entry barriers local firms enjoy market power which allows them to set prices above their
marginal cost. I assume that rents are specific to sectors because they originate from
firms’ ability to set the local price for their commodity. The income effects of horizontal
FDI operate through a change in relative factor endowments and additionally, through a
change in commodity prices. This effect on local commodity prices reflects the market
access motive of horizontal FDI. Firms make horizontal investments when other, less
costly, forms of market entry are unavailable. Often these investments are designed to
circumvent trade restrictions and contest nontradables markets. Given these motives of
horizontal FDI it is reasonable to infer that it occurs in commodity markets in which there
is a wedge between world and local prices.
17Relaxing the assumption of uniform production technologies to allow for investing firms to be more productive creates the possibility that horizontal FDI would reduce overall labor demand. This is a possibility only when demand is sufficiently price inelastic such that there is not a compensating increase in demand with a reduction in price. In the case of vertical FDI this result would only obtain if MNCs systematically underinvested. 18 Specific rents can also arise from product differentiation but these rents are generally less likely to be threatened by FDI because product varieties are not perfect substitutes. See Schmalansee 1989.
14
Sector-specific rents supplement the income of capital and labor employed in that
sector. Empirical findings indicate that labor commands a larger share of rents than
capital. Katz and Summers (1989) document a high correlation between product market
and labor rents. They also find large interindustry wage differentials that are robust to
controls for unobserved worker quality, non-wage compensation, and unionization, a
result that the authors attribute to labor’s share of product market rents.19 The standard
explanation for these results is that labor rents amount to an efficiency wage designed to
illicit a high level of effort (Krueger and Summers 1988, Dickens and Katz 1987).20
Thus, even though labor is mobile, sector-specific rents tie local subsets of labor to their
current sector. In the presence of rents price competition induced by horizontal FDI
reduces returns to labor, aligning sector-specific labor with local capital against
horizontal FDI into their sector.21 For example labor opposition to FDI in connection
with privatization is associated with being a public sector employee (Branstetter and
Feenstra 2002).
A growing body of empirical research documents how FDI reduces returns to
local firms. The market competition introduced by FDI reduces returns to existing local
firms. Sembenelli and Siotis (2002) find that the profit margins of non-R&D intensive
Spanish firms declined with FDI inflows into their industry. Blonigen, Tomlin, and
Wilson (2004) show that US firms register, on average, a three percent increase in their
stock market value after filing an anti-dumping petition. FDI into the firms’ US market
reduces these abnormal returns by fifty percent, and lose statistical significance. Chari
19 For similar results see Chrisofides and Oswald 1992, Blanchflower, Oswald, Sanfey 1996 20 Lindbeck and Snower 1988 offer a variation on the efficiency wage mechanism that points to labor’s role in pre-empting outsiders from underbidding them. 21 This assumes that labor’s share in sector-specific rents are sufficiently high to exceed any real wage
effects with the reduction in1p .
15
and Gupta (2005) examine the effects of India’s partial FDI liberalization in 1991 on firm
profitability, finding that all liberalized sectors local firms saw a decline in market share
with the entry of foreign-owned firms.
In summary, FDI’s distributional effects depend on the purpose of the investment
as this determines the activities of specific foreign affiliates. Vertical investments create
divisions along factor lines while horizontal investments’ effects are felt along sectoral
lines. I derive FDI policy preferences based on FDI’s expected effects on factor incomes.
Preferences over vertical FDI inflows are straightforward: local capital owners are
expected to oppose liberalization of vertical FDI whereas local labor will support vertical
FDI inflows. The salient cleavage is between factors and therefore we expect to observe
broad political coalitions of labor versus capital to arise with regard to vertical FDI
policies. Coalition patterns regarding horizontal FDI depend on the existence of sector-
specific rents. Where there are sector-specific rents we should observe industry-
organized special interest groups in which labor and capital employed in the same
industries are allied against horizontal FDI liberalization in their sector.
III. The Politics of FDI Regulation
Vertical FDI pits the interests of capital against those of labor. The politics of
vertical FDI feature broad factor groups. Free-rider problems are likely to be acute
because factor groups are large and diffuse. Political parties introduce factor preferences
into the policy-making process. Political parties organize voters and politicians
according to a stable set of policy orientations. I consider the distinction between left and
right parties that represent the interests of labor and capital, respectively. Partisanship
16
informs how politicians resolve the tradeoff between capital and labor’s preferred
policies; politicians will support their constituents’ preferred policies because they weight
the welfare of their corresponding factor group more than that of the other factor.
Accordingly, I hypothesize that countries led by left parties are more likely to liberalize
FDI inflows, in accordance with labor’s preferences, while right parties are, all else equal,
likely to restrict FDI inflows. Dutt and Mitra (2005) present systematic evidence for this
relationship in the trade policy context They find that tariff levels vary systematically
with relative factor endowments and the party in control of government; left governments
in capital-abundant countries are more protectionist than right governments of capital-
rich countries or left governments of labor-abundant economies. These results
demonstrate how political parties respond directly to their constituents’ policy
preferences. Unlike this result, however, the distributional effects of FDI are not
contingent on the relative factor endowments of host countries. Hiscox (2002) identifies
a partisan cast to US trade policy but he clarifies that partisanship is salient only when
distributional effects are felt along factor lines. When sector-type exercises a larger
influence on factor incomes trade policy is only weakly related to partisanship. This is
why partisanship is only relevant to explaining vertical FDI policies; the distributional
effects of horizontal FDI do not neatly coincide with partisan ideology. Pinto (2003)
provides one of the few direct tests of partisanship and FDI. He finds that countries with
left governments, all else equal, receive more FDI inflows, a result he attributes to the
left’s preference for FDI inflows.
By contrast, the politics of horizontal FDI is defined by the tradeoff between
preserving a large portion of income for a small group by protecting rents versus
17
marginally increasing the income of many, all consumers, by lowering commodity prices.
The Stigler (1971)-Peltzman (1976) model of regulation describes politicians’
calculations in this type of situation. The reelection-minded politician views this tradeoff
as one between campaign contributions from sectoral interests and votes from consumers;
contributions are useful for earning additional votes. This politician jointly maximizes
contributions and votes such that marginal increase in contributions, or more precisely
the votes that can be secured with that marginal increment, is equal to the loss in votes
due to the deadweight efficiency loss. This same basic logic underlies the influential
Grossman and Helpman (1994) model of trade policy formation. The overall level of
democracy, in particular electoral competition, relates this tradeoff to FDI regulation.
Democracy informs the consumer side of the model. Underpinning this model is
the assumption that politicians are ultimately accountable to voters to stay in office. This
assumption ensures that politicians are responsive to the policy preferences of the
electorate. In many countries, however, this is not a tenable assumption; politicians
assume leadership roles with the support of small subset of people who assist in political
repression or aid forceful ascents to office. For politicians in these countries the welfare
effects of horizontal FDI policies are of little relevance, they weight the interest of their
small group of supports more heavily because their support is necessary to remain in
office. Democracy’s effect is to increase the relative weight of consumer interests thus,
the likelihood that countries restrict horizontal FDI is decreasing in its level of democracy.
Once again evidence on trade policy supports this hypothesis. Mitra, Thomakos, and
Ulubaşoălu (2002) empirically test the predictions of the Grossman-Helpman model for
Turkey and find that politicians’ weighed consumer welfare more as Turkey
18
democratized. Milner and Kubota (2005) conclude that democratization contributed to a
pattern of trade liberalization in their sample of seventy-five developing countries.
This account of the political process through which FDI policy is made highlights
how FDI’s distributional effects interact with precise features of the domestic political
environment. It further demonstrates the importance of disaggregating FDI inflow; the
different income effects of vertical and horizontal FDI alter the identity of the winners
and losers, their numbers, and the sources of variation in policy outcomes. For example,
an observable implication of this explanation is that that within a host country the politics
of FDI will vary and, to some extent, are orthogonal.
Alternate Explanations
National security concerns are among the most common justifications that
countries offer for their FDI restrictions. Hosts’ primary concern is that foreign-owned
firms provide a conduit through which home governments can exert influence within the
host country. In the context of a military conflict between the home and host countries a
host country affiliate of a home country-based firm could undermine its host’s defense
capabilities by limiting access to war materials and infrastructure, or by funneling
intelligence to their home government. In peacetime foreign affiliates may engage in
espionage or inadvertently leak sensitive information to their home country governments.
These arguments primarily implicate defense industries but are also made with regard to
basic manufacturing and infrastructure. These arguments assume that firms are allied
with or subject to the will of their home countries, a debatable assumption in a world
where multinationals’ profit motives can easily diverge from their home country’s
foreign policy goals.
19
The historical record is mixed on the national security implications of FDI. In
their survey of the literature on multinational corporations during WWII Graham and
Krugman (1995) find examples both of affiliates allied with home countries and those
who sided with their host governments. They also note that host countries retain the
option of seizing foreign assets on the onset of hostilities, and that by encouraging FDI in
defense-related industries countries may actually expand their defense capabilities in
those countries which have the requisite technological capacity to make use of these
assets. With regard to the efficiency costs of restricting FDI, Graham and Krugman also
describe the numerous provisions in place in the US to mitigate national security
implications of foreign ownership including screening for defense contractors that have
any foreign equity participation and technology transfer limits; suggesting that FDI bans
are not necessary. Graham and Marchick (2006, Chapter 5) document several instance of
US firms politicizing the US’ investment review process to block the entry of foreign
competitors or hostile takeovers by foreign firms. In many of these cases domestic firms
pressed members of Congress to directly intervene in the screening of specific foreign
investment proposals.
Observable implications of a national security rationale for FDI restriction include:
cross-national variation in restrictions such that countries facing higher national security
threats, infrastructure industries and natural resources like petroleum, more frequently
restrict FDI; industries with greater national security implications should be more often
and heavily protected from foreign involvement; and changes in national FDI restrictions
20
in response to external changes in security threats, for example at the end of the Cold
War countries should have dismantled their restrictions.22
Nationalist explanations for FDI restrictions posit that states are opposed to
foreign ownership because citizens resent foreign economic control, particularly with
regard to exploitation of resources perceived to be part of a common national heritage
like mineral resources. Other forms of the argument emphasize anti-colonial ideology as
the motive to restrict foreign ownership (Chua 1995). It is typically the case that
nationalist opposition is aimed at a specific foreign country and rather than formal
legislation barring investment from those countries informal barriers are used to deter and
block such investments. For example, Fayerweather (1982) finds the perceptions of
foreign-owned firms vary with the nationality of the firm. This suggests that countries
are more likely to use informal barriers to deter specific investors rather than across the
board limits on all FDI. An underlying distributional motivation may be couched in
terms of national security in order to appeal to a broader audience. Breton’s (1965)
account of Quebecois nationalism suggests how nationalist claims are used
instrumentally to reallocate wealth to particular groups. There are multiple types of
economic activity which are amenable to nationalist claims including the entire primary
sector, viewed as part a nation’s right; and culture and media-related industries for the
role they can play in preserving and perpetuating cultural knowledge and practices. If
nationalist sentiments fuel FDI restrictions they are most likely to appear in these
industries. I also consider the general sway of nationalist arguments as measured by the
existence of nationalist political parties. My analysis of Mexican public opinion data
22 Given the range of industries that countries indicate as salient to national security identifying cross-national variation is not feasible.
21
shows that nationalism does influence attitudes on FDI inflows but that distributional
concerns have a larger influence on attitudes (Pandya 2005).
IV. Empirical Tests: Sources of Foreign Ownership Restrictions
In this section I describe my empirical tests of the hypotheses. I first examine
measurement of the dependent and explanatory variables and then discuss my empirical
findings. The centerpiece of this analysis is a new measure of FDI regulation. To date,
the single largest barrier to large-n empirical research on the political economy of FDI
regulation is the absence of data on regulation. This absence reflected both conceptual
ambiguity about what constitutes FDI regulation and a paucity of data sources. In this
paper I utilize an original dataset of country-industry foreign ownership restrictions. Only
data at this low level of aggregation can provide insights into cross-industry variation.
To the best of my knowledge, these are the only such data in existence that are
disaggregated by country and industry.
Dependent Variable
I operationalize FDI regulation using data on foreign ownership restrictions, one
particular type of FDI regulation. Foreign ownership restrictions place limits on the
amount of equity a foreigner can own in a single firm. Observations are at the country-
industry level; for example Indonesia – telecommunications or Mexico – motor vehicles.
Ownership Restrictions takes the value “1” if in a given country-industry there is any
limit on foreign equity ownership, and “0” when there is not.23 The dataset includes 119
countries and 58 industries. See the appendix for a complete list of industries and
countries and further discussion of how the data are organized. The data is a sample of 23 Below I consider finer-grained specifications of this variable.
22
country-industry restrictions pooled across the 1990s. Data are pooled at the decade level
due to the absence of annual data for each country-industry.
Explanatory Variables
The key economic variables to be measured are the propensity of a country-
industry to receive vertical and horizontal FDI. In measuring these concepts I draw on
general equilibrium models of FDI flows. General equilibrium models of FDI inflows
seek to explain the volume of FDI flows and the distribution of horizontal and vertical
FDI across host countries and industries (Brainard 1997, Carr, Markusen, and Maskus
2001; Blonigen, Davies, and Head 2003; Yeaple 2003). The measures of vertical FDI
used in these models capture the factor-cost-seeking motive that drives it.
Following Yeaple (2003), I measure vertical FDI as the interaction of host
country skilled labor endowment and industry skilled labor demand. Skilled labor
endowment is the average years of schooling in the total population above fifteen years of
age in 1999 (Barro and Lee 2000). This is a measure of host country skill endowments
with higher levels indicating an abundance of skilled labor.24 Skilled labor demand is the
per worker value-added of US-headquartered MNC parent companies and their majority-
owned foreign affiliates.25 In this context data for US-based MNCs is taken as
representative of the skill intensity of multinational firms more generally. These data are
taken from the 1999 Benchmark Survey of US Investment Abroad, a census of US-based
24 The use of average skill level reflects the fact that multinational investors typically demand skilled labor in host countries even though vertical FDI represents the relocation of their relatively less skilled activities abroad (Feenstra and Hanson 1997). 25 A more common measure is value-added per non-production worker but these data were not available. The use of aggregate employment data likely underestimates true skill intensity. It might be argued that a skill intensity measure utilizing foreign affiliate data may be endogenous to FDI restrictions. This is possible but it would have to be true that ownership restrictions influence the skill intensity of affiliate activities which seems implausible. Any bias should be averaged away with the use of a global industry average.
23
MNCs conducted by the Bureau of Economic Analysis (BEA) and are organized at the
two-digit ISIC level.26
The underlying logic of this specification is that vertical FDI is more likely when
MNC skill demand and host country labor supply are matched. This logic informs the
creation of the interaction term. For each component variable I calculate a binary variable
that indicates whether a given value of the variable is below the twenty-fifth percentile of
the observed values. I calculate a second binary variable that indicates whether a value is
in the seventy-fifth percentile. I then interact these indicator variables to measure the
alignment of industry skill demand and host country skill supply. This creates two
variants of the propensity to vertical FDI measure, propensity to get low (Low Skill) and
high-skilled (High Skill) FDI into a given country-industry. Based on the theory outlined
above, the propensity to receive vertical FDI enters the empirical model with the
partisanship but I expect that the marginal effect of propensity to vertical FDI is
negatively related to incidences of foreign ownership restrictions.
Measures of horizontal FDI derive from the market-seeking motives that drive
such investments. These measures reflect the trade-off between fragmentation, which
facilitates market access in the presence of trade restrictions, and concentration of
production that facilitates plant-level economies of scale. I use two separate measures of
horizontal FDI which both independently increase the probability of a country receiving
horizontal FDI - Market Size and Trade Restriction. The likelihood of receiving
horizontal FDI is increasing in both the size of markets, as economies of scale are more
26 The data are reported according to a BEA industry classification roughly similar to the ISIC. Foreign affiliate data were more disaggregated than parent data. In some instances the parent average value-added per worker, at the one-digit level, was substituted for a constituent two-digit category when parent data for that category were unavailable. This concordance is available upon request.
24
easily achieved in larger markets, and in the trade costs, such that exports are less
efficient means of contesting the market.27 Following the literature on FDI determinants
I measure MarketSize as logged host country GDP. I measure TradeBarrier as a country-
level gravity model estimate of the percent reduction in host country imports due to trade
restrictions (Hiscox and Kastner 2002).28 I expect that both of these variables will be
positively associated with FDI restrictions owing to the costs that horizontal FDI imposes
on local producers. This is a predicted marginal effect as these terms enter the empirical
model interactively with level of democracy.
I operationalize both partisanship and level of democracy using data from the
World Bank’s Database on Political Institutions (DPI) (Beck et al 2001). I measure
partisanship with three variables, each indicating the presence of a right, left, or center
party as the largest party in government.29 For each of these variables, a “0” value
indicates that the leading party in government does not align itself with the given partisan
ideology or that the party does not define itself along the left-right dimension.
In the DPI scheme partisanship refers to “preferences regarding greater or less
state control of the economy, the standard-left right scale.” (Beck et al 2001, 166). I
interpret left parties as having an allegiance to labor and right parties as aligned with
capital. The marginal effect of having the largest party in the government be leftist (Left)
is predicted as negative because FDI increases returns to labor. Similarly, I expect that
27 The ideal measure of trade costs would summarize industry-specific trade frictions including trade barriers and transport costs, and the ideal measure of market size would be industry-specific as well. In an earlier version of this paper I calculated 28 This is the “pctbcfe” variable from the Hiscox-Kastner dataset. 29 This is the “1GOVLRC” variable. Results are comparable with a measure of the executive’s party (EXECRLC).
25
the marginal effect of a right party (Right) as the largest party on ownership restrictions
will be positive.
I measure democracy using the DPI’s Index of Executive Competitiveness, which
measures the extent of party competition in executive elections.30 The index varies from
1= “no executive/legislature” to 7 = “the largest party received less than 75 percent of the
seats.” Executive competition captures the precise dimension of democracy suggested by
theory; executives most directly face the tradeoff between concentrated costs to
producers and diffuse benefits to producers. The marginal effect of Democracy on
foreign ownership restrictions should be negative because competition for the executive
increases so too does the executives incentives to privilege the interests of consumers
over producers.
Alternate Explanations
I test the importance of two alternative explanations for foreign ownership
restrictions, nationalism and national security concerns. In the absence of clear theories
that link country-industry characteristics to nationalist and national security concerns to
FDI regulations I approach these relationships in different ways. First, I include industry
fixed-effects into the regression to ascertain whether some industries are more likely to
face foreign ownership restrictions. To the extent that we have priors about which
industries are more likely to implicate nationalism and national security concerns, we can
interpret industry fixed-effect coefficients as suggestive. In particular I expect that
infrastructure industries (ISIC 40, 41, 60-64) and natural resources industries (ISIC 1-15)
are more likely to face restrictions. It is unclear, however, which of the two alternate
explanations this finding would support; it is consistent with both national security and 30 This is the “EIEC” variable in the World Bank DPI.

26
nationalist concerns. Defense and weapons industries (ISIC 29) provide a more precise
test of national security concerns, while media (ISIC 92, 22) captures nationalist concerns.
My second approach to measuring these issues is to capture nationalist and national
security preferences among politicians; assuming that there is some latent salience, how
likely are politicians to decide FDI regulation on these bases rather then distributional
ones? From the World Bank’s DPI I measure whether the executive is a member of the
military and whether the leading party in government is nationalist.31 In light of the
discussion of these factors above, I expect both of these variables to be positively
associated with foreign ownership restrictions.
Empirical Analysis As I am looking for empirical support for a new set of theoretical propositions I
examine sets of explanations in isolation, building up to a full model. I look at first the
economic and political effects alone to see how much of the variation they explain. Then
I compare those results to those of the combined political model to see how much of an
additional effect the political variables have. Then I introduce a full set of controls for
nationalism and national security. The dichotomous nature of the dependent variable
suggests that a logistic regression model is most appropriate. Tables 1 and 2 summarize
regression results.
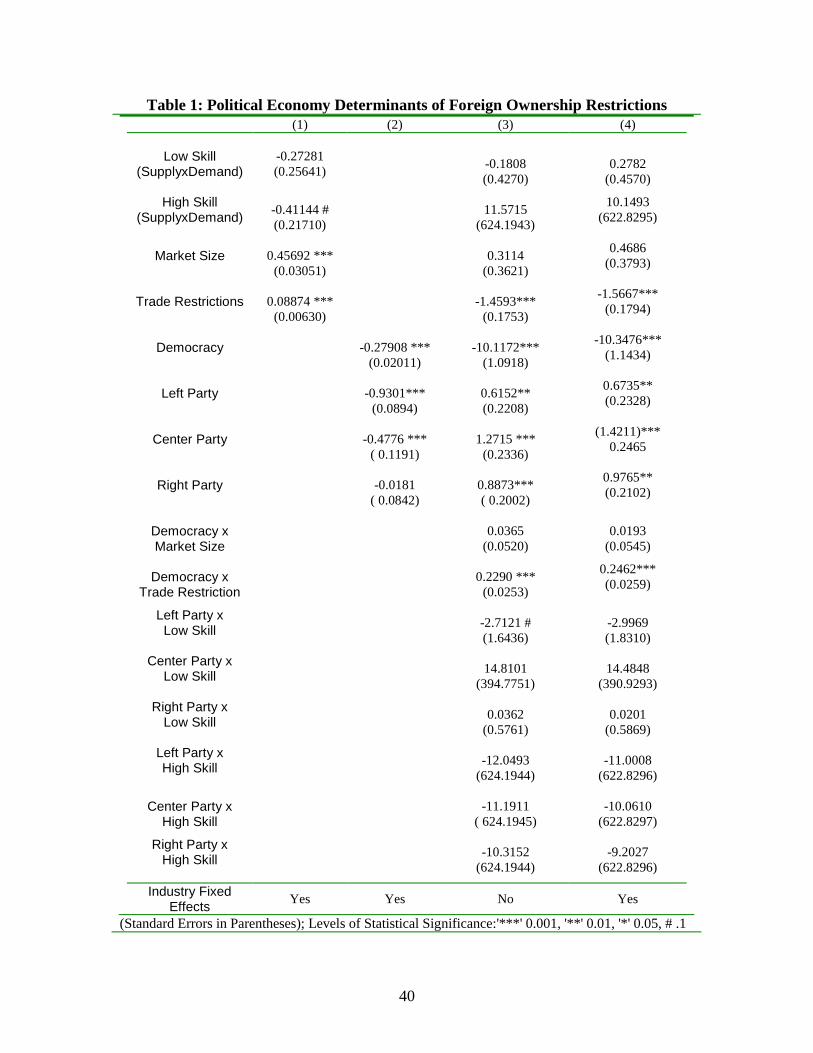
The economic components of the model, Model 1, yield the predicted results.
The two measures of vertical FDI are both negative, indicating the probability of a
foreign ownership restriction in a given industry is less when industry skill demand and
host country skill supply are matched at either a low or high skill level. The positive sign
31 These are “MILITARY” and “1GOVNAT” respectively.
27
on the high skill suggest that governments are, at the margin, less likely to restrict FDI
into high skilled industries. There are a number of explanations for this finding including
a greater incentive for skilled labor to lobby against FDI limits due to higher expected
returns to FDI than lower skilled labor; a systematic difference in the lobbying abilities of
high and low skilled labor, or a preference among politicians for vertical FDI into high
skilled industries due to greater expected productivity spillovers. The measures of
horizontal FDI are statistically significant predictors of foreign ownership restrictions.
Countries with larger markets are more likely to restrict FDI, reflecting the greater
leverage of their governments vis-à-vis foreign investors. To the extent that ownership
restrictions are not absolute, governments of larger economies can impose restrictions to
attenuate FDI’s distributional effects but still remain attractive enough to attract FDI.
Similarly, those countries with trade restrictions are more likely to limit FDI, suggesting
that trade and FDI policies can act as complements, both serving to protect the local
market from competition.
The purely political model, Model 2, confirms both the role of partisanship and
democracy in explaining foreign ownership restrictions. Both democracy and the
presence of a leftist governing party are associated with a lower likelihood of imposing
foreign ownership restrictions. The theoretical model does not have any predictions over
the other segments of the partisan spectrum but I included measures of right and center
governments in order to unclutter the implicit reference category, countries with a leading
party that does not define itself primarily along economic divisions. As I discuss below,
it is probably necessary to consider partisan ideology in a more complex manner.
28
Models 3 and 4 consider the complete political economy model. The effects
described in the previous two models are best thought of as baseline effects on the
likelihood of observing a foreign ownership restriction. The theoretical expectations,
however, are based on the combined presence of economic and political factors. The
complete model of vertical FDI regulation is confirmed for low skill intensive sectors,
that is, left governments are significantly less likely to restrict ownership into lower skill
industries. Results for higher-skilled sectors are not statistically significant but the very
high standard errors on these estimates point to inadequate variation to identify a
statistically meaningful effect. The results on the models of horizontal FDI point to a
very large role for democracy in explaining foreign ownership restrictions. Table 3
considers democracy’s role in greater depth. Table 3 provides expected probabilities of
foreign ownership restrictions at each of the seven levels of democracy in the measure
used here. The “1” values and the values approaching 1 indicate insufficient variation in
democracy within the sample to make predictions about very low levels of democracy.
The three highest values, however, demonstrate the substantive impact of democracy on
FDI policy – a shift from nominal multi-party competition (Democracy = 5) to actual
electoral competition (Democracy = 7) reduces the expected probability of imposing a
foreign ownership restriction by nearly fifty percentage points. This is a striking
empirical result given that it obtains with a relatively small change in the degree of
electoral competition. The result shows that politicians that face electoral competition
are more likely to enact policies that increase aggregate welfare rather than ones that
preserve rents accruing to producers.
29
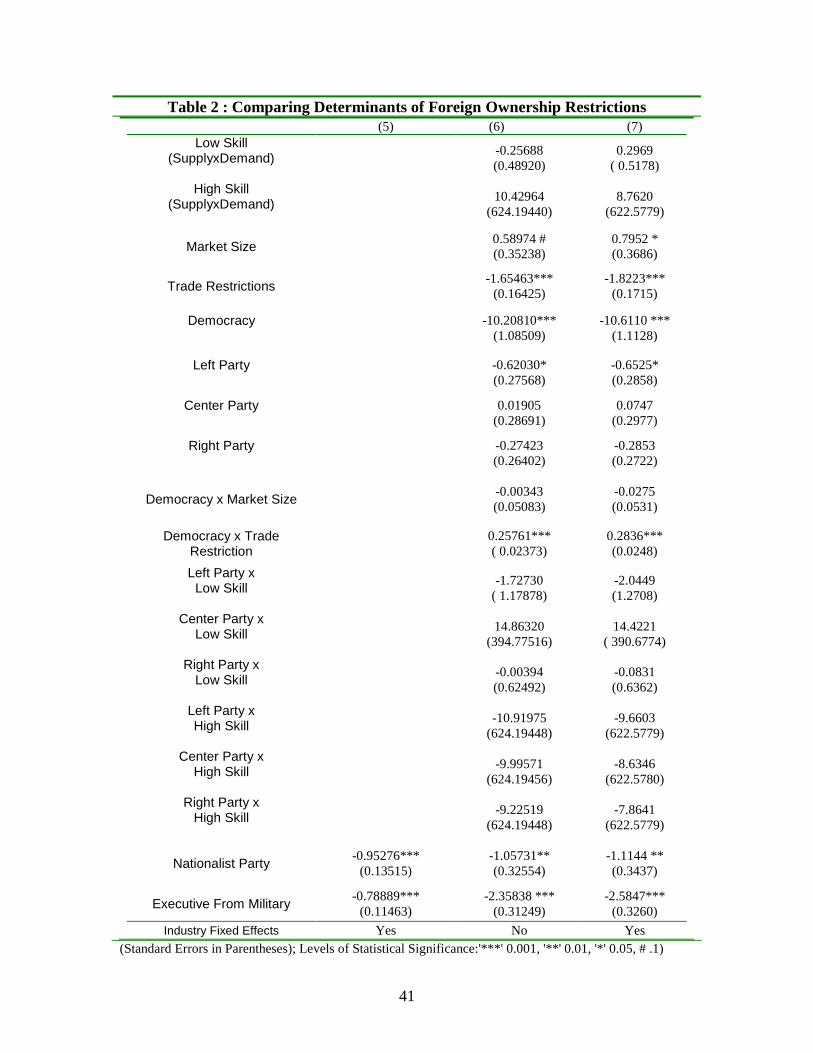
Finally, Models 5-7 examine the role of alternate, non-income-based explanations
for foreign ownership restrictions. The industry fixed effects (coefficients not reported)
comport with my expectations about which industries are salient. All of the above listed
industries are significantly more likely to have foreign ownership restrictions. Two
additional industries were also consistently positive and significant – ISIC 15
“Manufacture of food products and beverages” and ISIC 74 –“Other business activities.”
To the extent that these industries are ones into which horizontal FDI dominates, they
may be more likely to be restricted. There remains a larger question of how these fixed
effects results should be interpreted substantively. In the absence of larger theories that
explain cross-national variation in the nationalist sentiment and national security
implications, the results indicate the need for further research into the specific political
economy of these industries. The findings on nationalist and national security
preferences of governments yield unexpected results – both are significantly associated
with a lower probability of foreign ownership restrictions. Introducing a nationalist
party-led government reduces the expected probability of foreign ownership restrictions
by 24 percentage points. Similarly, the presence of an executive from the military
reduces the expected probability of a foreign ownership restriction by 52 percentage
points.32 These results rival democracy in their substantive effect but changes in other
coefficients in the model suggest a more circumspect conclusion. Specifically, the signs
on the coefficients of the partisanship variables and their associated interaction terms
fluctuate across the different model specifications, raising questions about what precise
information is contained in the party labels. To the extent that there is a systematic
32 These expected probabilities were calculated in the same manner as those described in Table 3. The standard errors on these estimates are 0.07 and 0.06 respectively.
30
relationship between nationalist preferences and concern for national security on one
hand, and affinity with a factor group on the other, it is unwise to put too much stock in
this finding.
V. Conclusion
FDI’s sheer importance to the world economy makes a theory of its politics
critical to any account of international economic integration. In this paper I present and
test a political economy theory of why governments restrict FDI. I find that governments
are more likely to restrict FDI that introduces market competition. Additionally, I find
that in political systems with true electoral competition the probability of imposing
foreign ownership restriction is half that in countries with nominal electoral competition.
This theory and these empirical findings broaden the study of FDI, allowing us to pose a
greater variety of questions about FDI as a form of international economic flow. It also
yields new insights into enduring questions about countries’ economic policy choices and
the effect of economic integration on individual countries.
One area that will gain particularly is in how we think about actors in the study of
international political economy (IPE). The theory in this paper highlights the role of
firms as political actors. While firms’ political presence is a widely-recognized
phenomenon that underscores theories of campaign contributions, this theory suggests the
rewards of opening up the black box of the firm. Different features of firms affect the
distributional effects of policies as well as their abilities to engage in political behavior.
These characteristics include the organization of firms across geographic space, the

31
various rules of corporate governance, and firm-level variation in productivity. At the
theoretical level, FDI is particularly suited to testing claims about the sources of
preferences, especially the role identity in the formation of economic policies.
We can also integrate the micro-processes of economic development to more
precisely define distributional effects. Much of the debate regarding FDI hinges on
whether FDI is good or bad for economic development. A complete treatment of this
issue requires an understanding of FDI’s costs and benefits. Typically, distributional
theories in IPE focus on the aggregate welfare as returns to consumers. We can also
integrate micro-processes through which FDI contributes to economic development
including technology diffusion, building human capital, product variety, and generally a
richer, more varied account of FDI’s distributional effects.
Finally, this model helps use develop better theories of macropolitical processes
that drive policy outcomes. This theory facilitates comparisons between the politics of
different foreign economic policies. By analyzing FDI in the same manner as theories of
other types of economic policies we can compare policy-making processes across issues
like international trade, immigration, and various forms of investment. Comparisons
across issues can highlight interesting nuances in the political process. For example, the
same group may mobilize differently depending on the specific policy issue. Such
studies would sharpen the political dimensions of foreign economic policy models.

32
33
Appendix: Measuring Foreign Ownership Restrictions
Foreign ownership data were coded from Overseas Business Reports, a US Commerce Department publication series that provides detailed summaries of individual countries’ economic policies and market profiles to assist Americans contemplating commercial activities abroad.33
Each observation is at the industry-country-year level. Industry designations are according to the International Standard Industrial Classification (ISIC) Revision 3.1.34 The raw data were collected at the most appropriate industrial classification, ranging from one to four-digit aggregations. For example, a ban on foreign ownership in transportation is coded as a ban on foreign ownership in three two-digit categories: land transport (ISIC 6000), water transport (ISIC 6100), and air transport (ISIC 6200). By contrast, a ban on foreign ownership in railroads is coded as a restriction in the three-digit subcategory of land transportation for railroads (ISIC 6010 – rail transport). This dataset encompasses fifty-seven two-digit ISIC categories and their associated subcategories.35 For analysis purposes in this paper I aggregated all industry-level data to the 2-digit level according to the rule that if a constituent sub-category has a restriction then the associated 2-digit category is restricted.
Foreign ownership restrictions refer to formal limits on equity ownership by non-citizens. Typically countries set these regulations by industry and set explicit limits on foreign equity participation. In some cases there are mandatory joint venture requirements that require the foreign investor to split ownership with a local partner firm.
33 After 1993 this publication was discontinued and replaced by US Country Commercial Guides, another US Commerce Department publication for which 1993-2000 data were obtained. These publications are quite comparable but there are some minor differences. The Commerce Department’s in-house country experts compiled Overseas Business Reports whereas US embassy staffs produce US Country Commercial Guides. The format of US Country Commercial Guides is standardized whereas Overseas Business Reports are somewhat less standardized and some, usually smaller, countries are treated infrequently. Due to the less frequent publication of Overseas Business Reports beginning in the early 1980s, the years 1985-2000 are supplemented with data coded from the annual National Trade Barrier Estimate Report, an annual reporting to the US Congress of foreign trade and investment barriers required under the 1983 US Trade Act. 34 Due to the ISIC scheme it is sometimes necessary to classify restrictions at a higher level of aggregation than would be preferred. For example, countries often subject investment in domestic air transport to a different set of regulations than international air transport. The air transportation category (ISIC 6200), however, is only divided into two sub-categories: “scheduled air transport” (ISIC 6210) and “non-scheduled air transport” (ISIC 6220). In this case, an FDI restriction in domestic air transport is coded at the more aggregate (ISIC 6200) level. 35 There are four additional two-digit categories in ISIC Rev. 3.1 that are not included in this dataset because, by definition, they cannot receive FDI. These include ISIC 95, 96, 97, all subsets of “Activities of private households as employers and undifferentiated production activities of private households” and ISIC 99 “Extraterritorial organizations and bodies.”

34
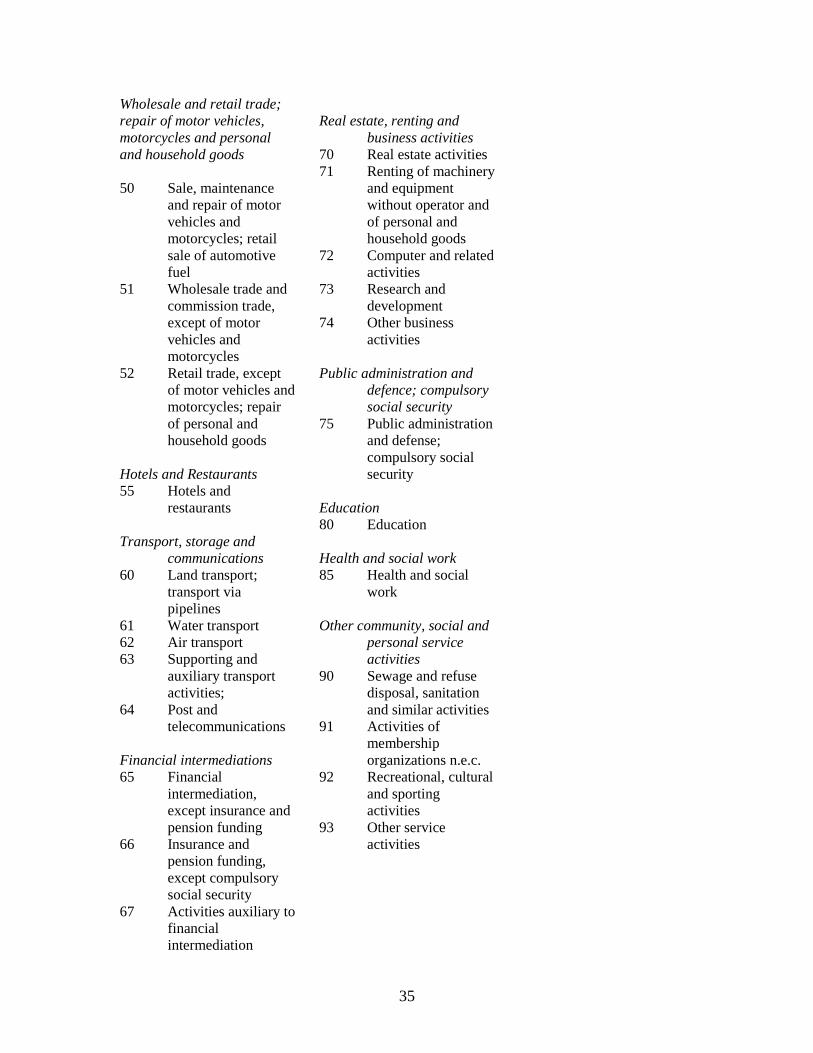
Industries Data were coded according to the most appropriate industry category of International Standard Industrial Classification (ISIC), Revision 3.1. Reported here is the two-digit level of industry classification. Each ISIC 2-digit category is further subdivided into more detailed three- and four-digit categories. The summary data used in this papers are two-digit industry aggregates. “n.e.c.” = “not elsewhere classified. Agriculture, hunting and forestry 01 Agriculture, hunting
and related service activities
02 Forestry, logging and related service activities
Fishing 05 Fishing, aquaculture
and service activities incidental to fishing
Mining and quarrying 10 Mining of coal and
lignite; extraction of peat
11 Extraction of crude petroleum and natural gas; service activities incidental to oil and gas extraction, excluding surveying
12 Mining of uranium and thorium ores
13 Mining of metal ores 14 Other mining and
quarrying Manufacturing 15 Manufacture of food
products and beverages
16 Manufacture of tobacco products
17 Manufacture of textiles
18 Manufacture of wearing apparel; dressing and dyeing of fur
19 Tanning and dressing of leather; manufacture of luggage, handbags, saddlery, harness and footwear
20 Manufacture of wood and of products of wood and cork, except furniture; manufacture of articles of straw and plaiting materials
21 Manufacture of paper and paper products
22 Publishing, printing and reproduction of recorded media
23 Manufacture of coke, refined petroleum products and nuclear fuel
24 Manufacture of chemicals and chemical products
25 Manufacture of rubber and plastics products
26 Manufacture of other non-metallic mineral products
27 Manufacture of basic metals
28 Manufacture of fabricated metal products, except machinery and equipment
29 Manufacture of machinery and equipment n.e.c.
30 Manufacture of office, accounting
and computing machinery
31 Manufacture of electrical machinery and apparatus n.e.c.
32 Manufacture of radio, television and communication equipment and apparatus
33 Manufacture of medical, precision and optical instruments, watches and clocks
34 Manufacture of motor vehicles, trailers and semi-trailers
35 Manufacture of other transport equipment
36 Manufacture of furniture; manufacturing n.e.c.
37 Recycling Electricity, gas and water
supply 40 Electricity, gas,
steam and hot water supply
41 Collection, purification and distribution of water
Construction 45 Construction
35
Wholesale and retail trade; repair of motor vehicles, motorcycles and personal and household goods 50 Sale, maintenance
and repair of motor vehicles and motorcycles; retail sale of automotive fuel
51 Wholesale trade and commission trade, except of motor vehicles and motorcycles
52 Retail trade, except of motor vehicles and motorcycles; repair of personal and household goods
Hotels and Restaurants 55 Hotels and
restaurants Transport, storage and
communications 60 Land transport;
transport via pipelines
61 Water transport 62 Air transport 63 Supporting and
auxiliary transport activities;
64 Post and telecommunications
Financial intermediations 65 Financial
intermediation, except insurance and pension funding
66 Insurance and pension funding, except compulsory social security
67 Activities auxiliary to financial intermediation
Real estate, renting and
business activities 70 Real estate activities 71 Renting of machinery
and equipment without operator and of personal and household goods
72 Computer and related activities
73 Research and development
74 Other business activities
Public administration and
defence; compulsory social security
75 Public administration and defense; compulsory social security
Education 80 Education Health and social work 85 Health and social
work Other community, social and
personal service activities
90 Sewage and refuse disposal, sanitation and similar activities
91 Activities of membership organizations n.e.c.
92 Recreational, cultural and sporting activities
93 Other service activities
36
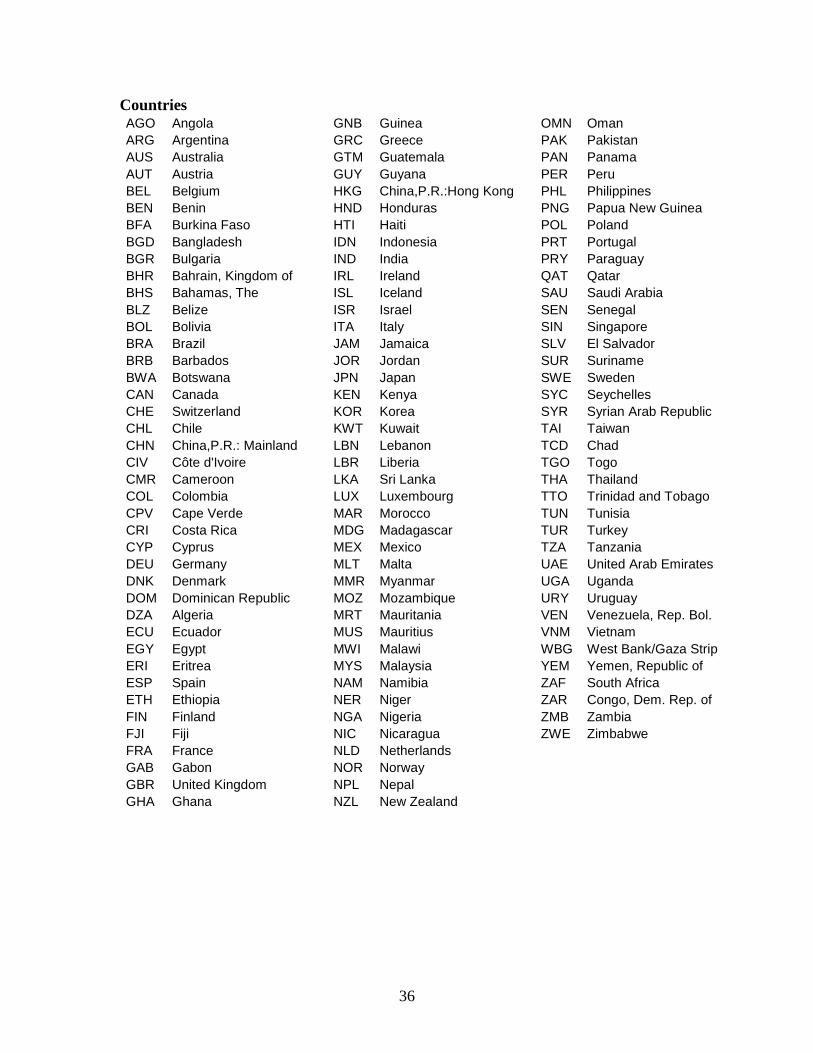
Countries AGO Angola ARG Argentina AUS Australia AUT Austria BEL Belgium BEN Benin BFA Burkina Faso BGD Bangladesh BGR Bulgaria BHR Bahrain, Kingdom of BHS Bahamas, The BLZ Belize BOL Bolivia BRA Brazil BRB Barbados BWA Botswana CAN Canada CHE Switzerland CHL Chile CHN China,P.R.: Mainland CIV Côte d'Ivoire CMR Cameroon COL Colombia CPV Cape Verde CRI Costa Rica CYP Cyprus DEU Germany DNK Denmark DOM Dominican Republic DZA Algeria ECU Ecuador EGY Egypt ERI Eritrea ESP Spain ETH Ethiopia FIN Finland FJI Fiji FRA France GAB Gabon GBR United Kingdom GHA Ghana
GNB Guinea GRC Greece GTM Guatemala GUY Guyana HKG China,P.R.:Hong Kong HND Honduras HTI Haiti IDN Indonesia IND India IRL Ireland ISL Iceland ISR Israel ITA Italy JAM Jamaica JOR Jordan JPN Japan KEN Kenya KOR Korea KWT Kuwait LBN Lebanon LBR Liberia LKA Sri Lanka LUX Luxembourg MAR Morocco MDG Madagascar MEX Mexico MLT Malta MMR Myanmar MOZ Mozambique MRT Mauritania MUS Mauritius MWI Malawi MYS Malaysia NAM Namibia NER Niger NGA Nigeria NIC Nicaragua NLD Netherlands NOR Norway NPL Nepal NZL New Zealand
OMN Oman PAK Pakistan PAN Panama PER Peru PHL Philippines PNG Papua New Guinea POL Poland PRT Portugal PRY Paraguay QAT Qatar SAU Saudi Arabia SEN Senegal SIN Singapore SLV El Salvador SUR Suriname SWE Sweden SYC Seychelles SYR Syrian Arab Republic TAI Taiwan TCD Chad TGO Togo THA Thailand TTO Trinidad and Tobago TUN Tunisia TUR Turkey TZA Tanzania UAE United Arab Emirates UGA Uganda URY Uruguay VEN Venezuela, Rep. Bol. VNM Vietnam WBG West Bank/Gaza Strip YEM Yemen, Republic of ZAF South Africa ZAR Congo, Dem. Rep. of ZMB Zambia ZWE Zimbabwe

39
Figure 1: Global Foreign Direct Investment and Portfolio Flows, 1970-2000
-100000
0
100000
200000
300000
400000
500000
600000
700000
1970
1971
1972
1973
1974
1975
1976
1977
1978
1979
1980
1981
1982
1983
1984
1985
1986
1987
1988
1989
1990
1991
1992
1993
1994
1995
1996
1997
1998
1999
2000
Mill
ions
of
Con
stan
t U
S D
olla
rs
FDI Inflows Portfolio Investment
Sources: FDI data from the United National Conference on Trade and Development Database of FDI Statistics, Portfolio data from the International Monetary Fund’s Balance of Payments Statistics.
40
Table 1: Political Economy Determinants of Foreign Ownership Restrictions (1) (2) (3) (4)
Low Skill
(SupplyxDemand)
-0.27281 (0.25641)
-0.1808 (0.4270)
0.2782 (0.4570)
High Skill (SupplyxDemand)
-0.41144 # (0.21710)
11.5715
(624.1943)
10.1493 (622.8295)
Market Size
0.45692 *** (0.03051)
0.3114
(0.3621)
0.4686 (0.3793)
Trade Restrictions
0.08874 *** (0.00630)
-1.4593***
(0.1753)
-1.5667*** (0.1794)
Democracy
-0.27908 ***
(0.02011) -10.1172***
(1.0918)
-10.3476*** (1.1434)
Left Party
-0.9301***
(0.0894) 0.6152** (0.2208)
0.6735** (0.2328)
Center Party
-0.4776 ***
( 0.1191) 1.2715 *** (0.2336)
(1.4211)*** 0.2465
Right Party
-0.0181
( 0.0842) 0.8873*** ( 0.2002)
0.9765** (0.2102)
Democracy x Market Size
0.0365
(0.0520) 0.0193
(0.0545)
Democracy x Trade Restriction
0.2290 *** (0.0253)
0.2462*** (0.0259)
Left Party x Low Skill
-2.7121 # (1.6436)
-2.9969 (1.8310)
Center Party x Low Skill
14.8101 (394.7751)
14.4848 (390.9293)
Right Party x Low Skill
0.0362 (0.5761)
0.0201 (0.5869)
Left Party x High Skill
-12.0493 (624.1944)
-11.0008 (622.8296)
Center Party x High Skill
-11.1911
( 624.1945) -10.0610
(622.8297)
Right Party x High Skill
-10.3152 (624.1944)
-9.2027 (622.8296)
Industry Fixed Effects
Yes Yes No Yes
(Standard Errors in Parentheses); Levels of Statistical Significance:'***' 0.001, '**' 0.01, '*' 0.05, # .1
41
Table 2 : Comparing Determinants of Foreign Ownership Restrictions (5) (6) (7)
Low Skill (SupplyxDemand)
-0.25688 (0.48920)
0.2969 ( 0.5178)
High Skill (SupplyxDemand)
10.42964 (624.19440)
8.7620 (622.5779)
Market Size 0.58974 # (0.35238)
0.7952 * (0.3686)
Trade Restrictions -1.65463***
(0.16425) -1.8223***
(0.1715)
Democracy
-10.20810***
(1.08509) -10.6110 ***
(1.1128)
Left Party
-0.62030* (0.27568)
-0.6525* (0.2858)
Center Party
0.01905
(0.28691) 0.0747
(0.2977)
Right Party
-0.27423 (0.26402)
-0.2853 (0.2722)
Democracy x Market Size -0.00343 (0.05083)
-0.0275 (0.0531)
Democracy x Trade Restriction
0.25761*** ( 0.02373)
0.2836*** (0.0248)
Left Party x Low Skill
-1.72730 ( 1.17878)
-2.0449 (1.2708)
Center Party x Low Skill
14.86320 (394.77516)
14.4221 ( 390.6774)
Right Party x Low Skill
-0.00394 (0.62492)
-0.0831 (0.6362)
Left Party x High Skill
-10.91975 (624.19448)
-9.6603 (622.5779)
Center Party x High Skill
-9.99571 (624.19456)
-8.6346 (622.5780)
Right Party x High Skill
-9.22519 (624.19448)
-7.8641 (622.5779)
Nationalist Party -0.95276***
(0.13515) -1.05731** (0.32554)
-1.1144 ** (0.3437)
Executive From Military -0.78889***
(0.11463) -2.35838 ***
(0.31249) -2.5847***
(0.3260)
Industry Fixed Effects Yes No Yes (Standard Errors in Parentheses); Levels of Statistical Significance:'***' 0.001, '**' 0.01, '*' 0.05, # .1)

42
(Standard errors of expected values in parentheses) This table presents the expected probability of foreign ownership restrictions at each level of democracy represented in the dataset. These expected values were calculated via simulation with Zelig (Imai, King, Lau 2006), using the parameters of Model 6 in Table 2 and holding all other variables at their mean or median value. These estimates indicate that the negative relationship between democracy and FDI restrictions only really obtains when there are multiple parties in government and is only noticeable at sufficiently high levels of political competition.
Table 3: Expected Probability of Foreign Ownership Restrictions at Varying Levels of Democracy Level of Democracy [value of variable]
E(Foreign Ownership Restriction | Level of Democracy)
No executive/legislature [1] 1 (1.055e-05)
Unelected executive/legislature [2]
1 (5.468e-05)
Elected, one candidate [3] 0.9997 (0.0002540)
One party, multiple candidates [4]
0.998 (0.001379)
Multiple parties legal but only one won seats [5]
0.985 (0.006663)
Multiple parties compete and won seats but one party holds more than 75% of seats [6]
0.8937 (0.02157)
Largest party received less than 75% of seats [7]
0.5033 (0.02783)
43
References Alfaro, Laura, Areendam Chanda, Sebnem Kalemli-Ozcan, and Selin Sayek. 2004. "FDI
and Economic Growth: The Role of Local Financial Markets." Journal of International Economics 64, no. 1: 89-112.
Antràs, Pol. 2003. "Firms, Contracts, and Trade Structure." Quarterly Journal of Economics 118, no. 4: 1375-418.
Barro, Robert J., and Jong-Wha Lee. 2000. "International Data on Educational Attainment: Updates and Implications." CID Working Paper, no. 42.
Barry, Frank G. 2004. "FDI and the Host Economy: A Case Study of Ireland." In Multinational Firms in the World Economy, edited by Giorgio Barba Navaretti and Anthony J. Venables. Princeton: Princeton University Press.
Batra, Raveendra N., and Rama Ramachandran. 1980. "Multinational Firms and the Theory of International Trade and Investment." American Economic Review 70, no. 3: 278-90.
Beck, Thorsten, George Clarke, Alberto Groff, Philip Keefer, and Patrick Walsh. 2001. "New Tools in Comparative Political Economy: The Database of Political Institutions." World Bank Economic Review 15, no. 1: 165-76.
Bernard, Andrew B., Jonathan Eaton, J. Bradford Jensen, and Samuel Kortum. 2003. "Plants and Productivity in International Trade." American Economic Review 93, no. 4: 1268-90.
Blanchflower, David G., Andrew J. Oswald, and Peter Sanfey. 1996. "Wage, Profits, and Rent-Sharing." Quarterly Journal of Economics 111, no. 1: 227-51.
Blonigen, Bruce A., Ronald B. Davies, and Keith Head. 2003. "Estimating the Knowledge-Capital Model of the Multinational Enterprise: Comment." American Economic Review 93, no. 3: 980-1001.
Blonigen, Bruce A., and David M. Figlio. 2000. "The Effects of Foreign Direct Investment on Local Communities." Journal of Urban Economics 48: 338-63.
Blonigen, Bruce A., KaSaundra Tomlin, and Wesley W. Wilson. 2004. "Tariff-Jumping FDI and Domestic Firms' Profits." Canadian Journal of Economics 37: 656-77.
Brainard, S. Lael. 1997. "An Empirical Assessment of the Proximity-Concentration Trade-Off between Multinational Sales and Trade." American Economic Review 87, no. 4: 520-44.
Branstetter, Lee G., and Robert C. Feenstra. 2002. "Trade and Foreign Direct Investment in China: A Political Economy Approach." Journal of International Economics 58: 335-58.
Breton, Albert. 1964. "The Economics of Nationalism." Journal of Political Economy 72, no. 4: 376-86.
Carr, David L., James R. Markusen, and Keith E. Maskus. 2001. "Estimating the Knowledge-Captial Model of the Multinational Enterprise." American Economic Review 91, no. 3: 693-708.
Caves, Richard E. 1971. "International Corporations: The Industrial Economics of Foreign Investment." Economica 38: 1-27.
Chari, Anusha, and Nandani Gupta. 2005. "The Political Economy of Foreign Entry Liberalization." Working Paper , November
44
Chua, Amy L. 1995. "The Privitization-Nationalization Cycle: The Link between Markets and Ethnicity in Developing Countries." Columbia Law Review 95, no. 2: 223-303.
Dutt, Pushan, and Devashish Mitra. 2005. "Political Ideology and Endogenous Trade Policy." Review of Economic Studies 87, no. 1: 59-72.
Eckholm, Karolina, Rikard Forslid, and James R. Markusen. 2003. "Export-Platform Foreign Direct Investment." NBER Working Paper, no. 9517.
Ethier, Wilfred, and James R. Markusen. 1996. "Multinationals, Technical Diffusion, and Trade." Journal of International Economics 41: 1-28.
Fayerweather, John. 1982. "Elite Attitudes About Multinational Firms." In Host National Attitudes toward Multinational Corporations, edited by John Fayerweather, 1-43. New York: Praeger.
Feenstra, Robert C., and Gordon H Hanson. 1997. "Foreign Direct Investment and Relative Wages: Evidence from Mexico's Maquiladoras." Journal of International Economics 42: 371-93.
———. 1996. "Foreign Investment, Outsourcing, and Relative Wages." In The Political Economy of Trade Policy: Papers in Honor of Jagdish Bhagwati, edited by Robert C. Feenstra, Gene M. Grossman and Douglas A. Irwin. Cambridge, MA: MIT Press.
Görg, Holger, and David Greenway. 2001. "Foreign Direct Investment and Intra-Industry Spillovers: A Review of the Literature." Globalisation and Labour Markets Programme, University of Nottingham 2001/37.
Graham, Edward M., and Paul R. Krugman. 1995. Foreign Direct Investment in the United States. third ed. Washington DC: Institute for International Economics.
Grossman, Gene M., and Elhanan Helpman. 1996. "Foreign Investment and Endogenous Protection." In The Political Economy of Trade Policy: Papers in Honor of Jagdish Bhagwati, edited by Robert C. Feenstra, Gene M. Grossman and Douglas A. Irwin. Cambridge, MA: MIT Press.
———. 1994. "Protection for Sale." American Economic Review 84, no. 4: 833-50. Helpman, Elhanan. 1984. "A Simple Theory of Multinational Corporations." Journal of
Political Economy 92: 451-71. Helpman, Elhanan, Marc J. Melitz, and Stephen R. Yeaple. 2004. "Export Versus FDI
with Heterogeneous Firms." American Economic Review 94: 300-16. Hiscox, Michael J. 2004. "International Capital Mobility and Trade Politics: Capital
Flows, Political Coalitions, and Lobbying." Economics and Politics 16, no. 3: 253-85.
Hiscox, Michael J., and Scott L. Kastner. 2002. "A General Measure of Trade Policy Orientations: Gravity-Model-Based Estimates for 82 Nations, 1960 to 1992." Working Paper.
Horstmann, Ignatius, and James R. Markusen. 1987. "Strategic Investments and the Development of Multinationals." International Economic Review 28: 109-21.
Hummels, David, Jun Ishii, and Kei-Mu Yi. 2001. "The Nature and Growth of Vertical Specialization in World Trade." Journal of International Economics 54: 75-96.
Hymer, Stephen. 1976. The International Operations of National Firms. Cambridge, MA: MIT Press.
45
Imai, Kosuke, Gary King, and Olivia C. Lau. 2006. "Zelig: Everyone's Statistical Software." http://gking.harvard.edu/zelig/
Jensen, Nathan M. 2003. "Democratic Governance and Multinational Corporations: Political Regimes and Inflows of Foreign Direct Investment." International Organization 57, no. 3: 587-616.
Jodice, David A. 1980. "Sources of Change in Third World Regimes for Foreign Direct Investment. 1968-1976." International Organization 34, no. 2: 177-206.
Jones, Ronald W. 1971. "A Three-Factor Model in Theory, Trade, and History." In Trade, Balance of Payments, and Growth, edited by Jagdish N. Bhagwati, Ronald W. Jones, Robert A. Mundell and Jaroslav Vanek. New York: American Elsevier Publishing Company.
Katz, Lawrence F., and Lawrence H. Summers. 1989. "Industry Rents: Evidence and Implications." Brookings Papers on Economic Activity: Microeconomics, no. 1.
Kobrin, Stephen J. 1987. "Testing the Bargaining Hypothesis in the Manufacturing Sector in Developing Countries." International Organization 41, no. 4: 609-38.
Li, Quan, and Adam Resnick. 2003. "Reversal of Fortunes: Democracy, Property Rights and Foreign Direct Investment Inflows to Developing Countries." International Organization 57, no. 1: 175-211.
Lindbeck, Assar , and Dennis J. Snower. 1988. "Cooperation, Harrassment, and Involuntary Unemployment: An Insider-Outsider Approach." American Economic Review 78, no. 1: 167-88.
Magee, Stephen P., William A. Brock, and Leslie Young. 1989. Black Hole Tariffs and Endogenous Political Theory. Cambridge: Cambridge UP.
Markusen, James R. 1984. "Mulitnationals, Multi-Plant Economies, and the Gains from Trade." Journal of International Economics 16: 205-26.
Melitz, Marc J. 2003. "The Impact of Trade on Intra-Industry Reallocations and Aggregate Industry Productivity." Econometrica 71: 1695-725.
Milner, Helen V., and Keiko Kubota. 2005. "Why the Move to Free Trade? Democracy and Trade Policy in the Developing Countries." International Organization 59, no. 1: 107-43.
Mitra, Devashish, Dimitrios D. Thomakos, and Mehmet A. Ulubasogflu. 2002. "'Protection for Sale' in a Developing Country: Democracy Versus Dictatorship." Review of Economics and Statistics 84, no. 3: 497-508.
Pandya, Sonal S. 2005. "Specificity, Productivity, and Tradability: Towards a Theory of Individual FDI Preferences." Working paper.
Pavcnik, Nina. 2002. "Trade Liberalization, Exit, and Productivity Improvements: Evidence from Chilean Plants." Review of Economic Studies 69: 245-76.
Peltzman, Sam. 1976. "Towards a More General Theory of Regulation." Journal of Law and Economics 19, no. 2: 211-40.
Pinto, Pablo Martin. 2003. "Tying Hands Vs. Exchanging Hostages: Domestic Coalitions, Political Constraints and FDI." Presented at the 2003 Annual Meeting of the American Political Science Association.
Romer, Paul. 1993. "Idea Gaps and Object Gaps in Economic Development." Journal of Monetary Economics 32: 543-73.
46
Schmalensee, Richard. 1989. "Inter-Industry Studies of Structure and Performance." In Handbook of Industrial Organization, Volume Ii, edited by Richard Schmalensee and Robert D. WIllig. Amsterdam: Elsevier.
Sembenelli, Alessandro, and Georges Siotis. 2002. "Foreign Direct Investment, Competitive Press and Spillovers: An Empirical Analysis on Spanish Firm Level Data." Working Paper, November
Stigler, George J. 1971. "The Theory of Economic Regulation." The Bell Journal of Economics and Management Science 2, no. 1: 3-21.
World Bank. 2003. Global Development Finance: Striving for Stability in Development Finance. Washington DC: World Bank.
Yeaple, Stephen R. 2003. "The Role of Skill Endowments in the Structure of Us Outward Foreign Direct Investment." Review of Economics and Statistics 85, no. 3: 726-34.


![The Effect of Monetary Reward on Creativity: The Role of ... · industriousness theory (LIT), respectively [14, 22]. With contradicting presumptions and logic, these two schools have](https://img.pdfslide.us/doc/110x75/60460e1a5c7a0e571615fceb/the-effect-of-monetary-reward-on-creativity-the-role-of-industriousness-theory.jpg)