Embed Size (px)
Citation preview
IndustrialsM&A Report
Q1 2013
HYDE PARK CAPITAL
Member FINRA/SIPC
Investment Banking | Mergers & Acquisitions | Capital Raising
Hyde Park Capital Advisors, LLC701 N. Franklin StreetTampa, FL 33602Tel: 813-383-0202www.hydeparkcapital.com
John Hill Senior Managing Director [email protected](813) 383-0205John McDonaldSenior Managing [email protected](813) 383-0206Keith HodgdonSenior Vice [email protected](813) 383-0208Jeffrey Bridge Vice President [email protected](813) 383-0204Michael [email protected](813) 597-2649Jennifer [email protected](813) 383-0203
HYDE PARK CAPITALInvestment Banking | Mergers & Acquisitions | Capital Raising
Capital Markets Overview
2
Public Market Performance (LTM)
Select Equity Offerings – Industrials (Q1 2013)
Public Company Market Performance by Sector
Source: S&P Capital IQ
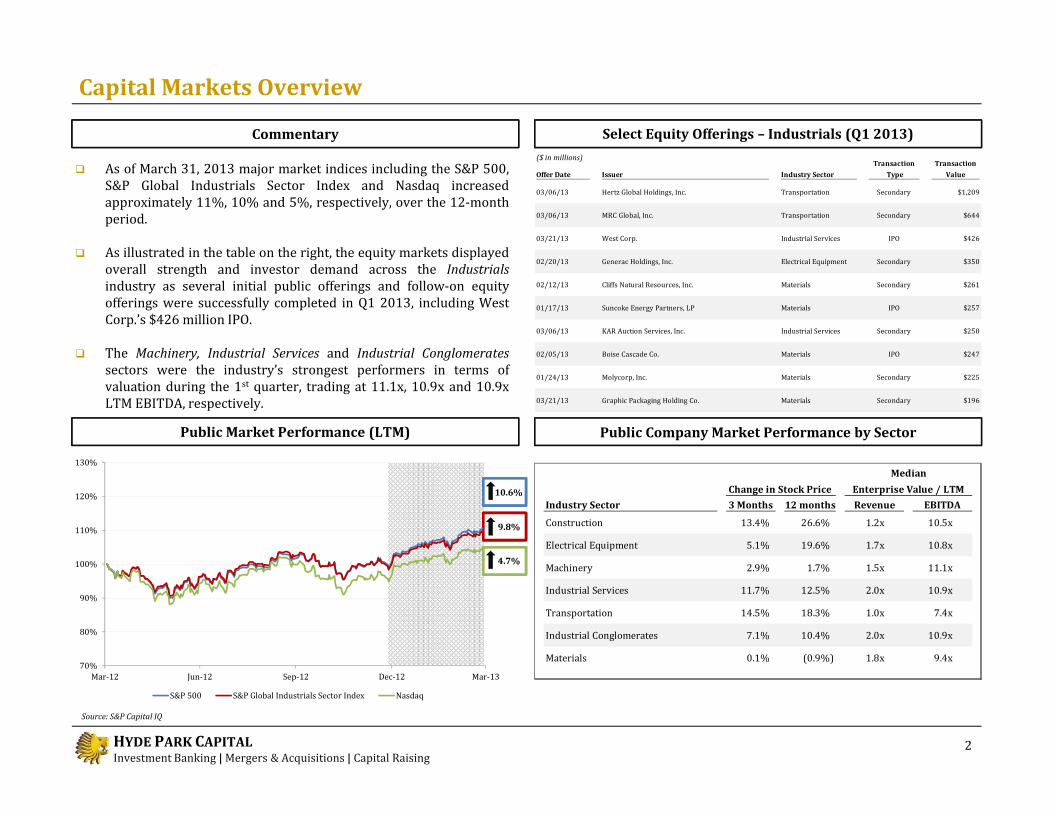
As of March 31, 2013 major market indices including the S&P 500,S&P Global Industrials Sector Index and Nasdaq increasedapproximately 11%, 10% and 5%, respectively, over the 12-monthperiod.As illustrated in the table on the right, the equity markets displayedoverall strength and investor demand across the Industrialsindustry as several initial public offerings and follow-on equityofferings were successfully completed in Q1 2013, including WestCorp.’s $426 million IPO.The Machinery, Industrial Services and Industrial Conglomeratessectors were the industry’s strongest performers in terms ofvaluation during the 1st quarter, trading at 11.1x, 10.9x and 10.9xLTM EBITDA, respectively.
Commentary($ in millions)
4.7%
9.8%
10.6%
70%80%90%
100%110%120%130%
Mar-12 Jun-12 Sep-12 Dec-12 Mar-13S&P 500 S&P Global Industrials Sector Index Nasdaq
Offer Date Issuer Industry SectorTransaction
Type Transaction
Value03/06/13 Hertz Global Holdings, Inc. Transportation Secondary $1,20903/06/13 MRC Global, Inc. Transportation Secondary $64403/21/13 West Corp. Industrial Services IPO $42602/20/13 Generac Holdings, Inc. Electrical Equipment Secondary $35002/12/13 Cliffs Natural Resources, Inc. Materials Secondary $26101/17/13 Suncoke Energy Partners, LP Materials IPO $25703/06/13 KAR Auction Services, Inc. Industrial Services Secondary $25002/05/13 Boise Cascade Co. Materials IPO $24701/24/13 Molycorp, Inc. Materials Secondary $22503/21/13 Graphic Packaging Holding Co. Materials Secondary $196
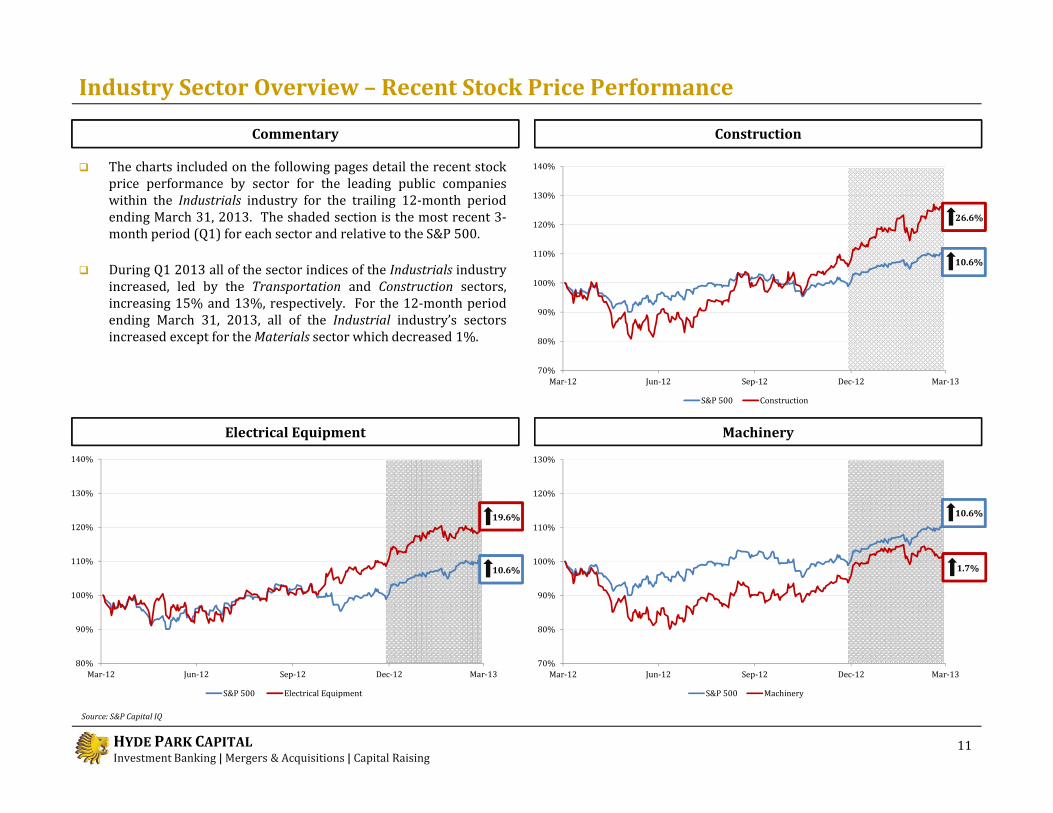
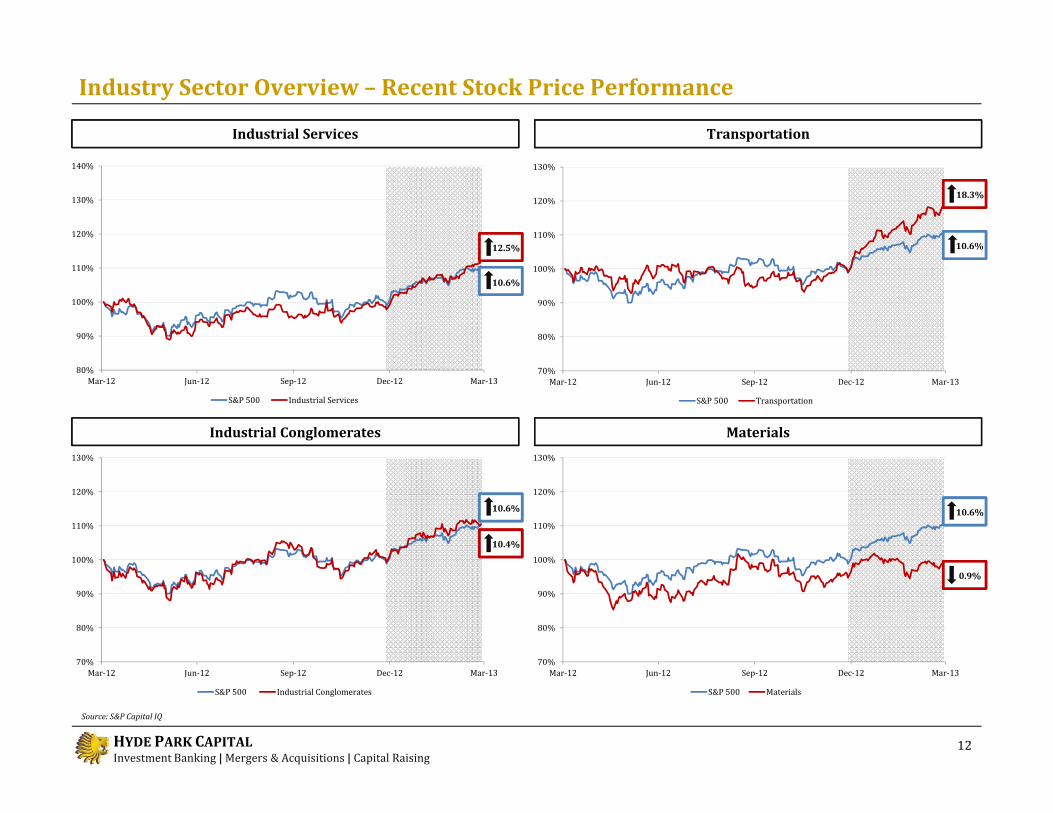
Industry Sector 3 Months 12 months Revenue EBITDAConstruction 13.4% 26.6% 1.2x 10.5xElectrical Equipment 5.1% 19.6% 1.7x 10.8xMachinery 2.9% 1.7% 1.5x 11.1xIndustrial Services 11.7% 12.5% 2.0x 10.9xTransportation 14.5% 18.3% 1.0x 7.4xIndustrial Conglomerates 7.1% 10.4% 2.0x 10.9xMaterials 0.1% (0.9%) 1.8x 9.4x
MedianChange in Stock Price Enterprise Value / LTM
HYDE PARK CAPITALInvestment Banking | Mergers & Acquisitions | Capital Raising
Middle Market M&A Transactions by Deal Size
U.S. Middle Market M&A Activity – Annual Trends: VOLUME U.S. Middle Market M&A Activity – Annual Trends: VALUE
Total Transac
tion Volume
Total Transac
tion Value ($ i
n bi
llion
s)
Annual Middle Market M&A Activity – Industrials
3
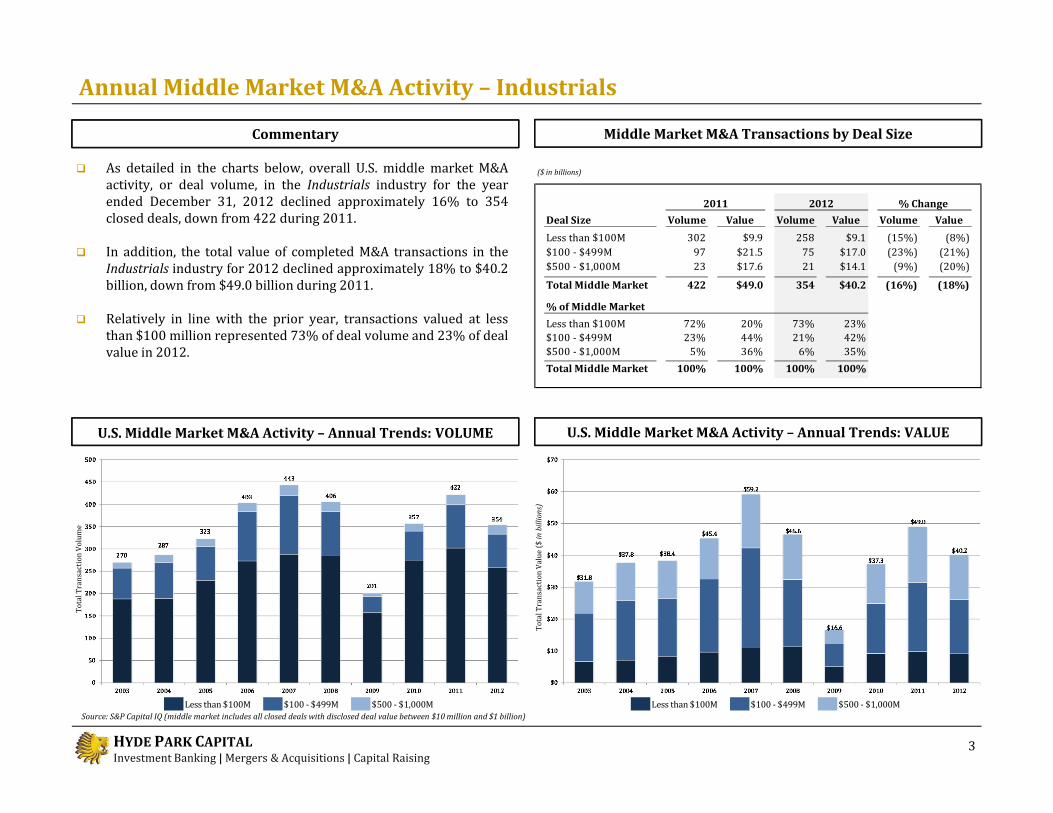
As detailed in the charts below, overall U.S. middle market M&Aactivity, or deal volume, in the Industrials industry for the yearended December 31, 2012 declined approximately 16% to 354closed deals, down from 422 during 2011.In addition, the total value of completed M&A transactions in theIndustrials industry for 2012 declined approximately 18% to $40.2billion, down from $49.0 billion during 2011.Relatively in line with the prior year, transactions valued at lessthan $100 million represented 73% of deal volume and 23% of dealvalue in 2012.
Commentary
Source: S&P Capital IQ (middle market includes all closed deals with disclosed deal value between $10 million and $1 billion)Less than $100M $100 - $499M $500 - $1,000M Less than $100M $100 - $499M $500 - $1,000M
Deal Size Volume Value Volume Value Volume Value Less than $100M 302 $9.9 258 $9.1 (15%) (8%)$100 - $499M 97 $21.5 75 $17.0 (23%) (21%)$500 - $1,000M 23 $17.6 21 $14.1 (9%) (20%)Total Middle Market 422 $49.0 354 $40.2 (16%) (18%)
% of Middle MarketLess than $100M 72% 20% 73% 23%$100 - $499M 23% 44% 21% 42%$500 - $1,000M 5% 36% 6% 35%Total Middle Market 100% 100% 100% 100%
2011 2012 % Change
($ in billions)
HYDE PARK CAPITALInvestment Banking | Mergers & Acquisitions | Capital Raising
Quarterly Middle Market M&A Activity – Industrials
U.S. Middle Market M&A Activity – Quarterly Trends: VALUEU.S. Middle Market M&A Activity – Quarterly Trends: VOLUME
Middle Market M&A Transactions by Deal Size
($ in billions)
Total Transac
tion Volume
Total Transac
tion Value ($ i
n bi
llion
s)
4
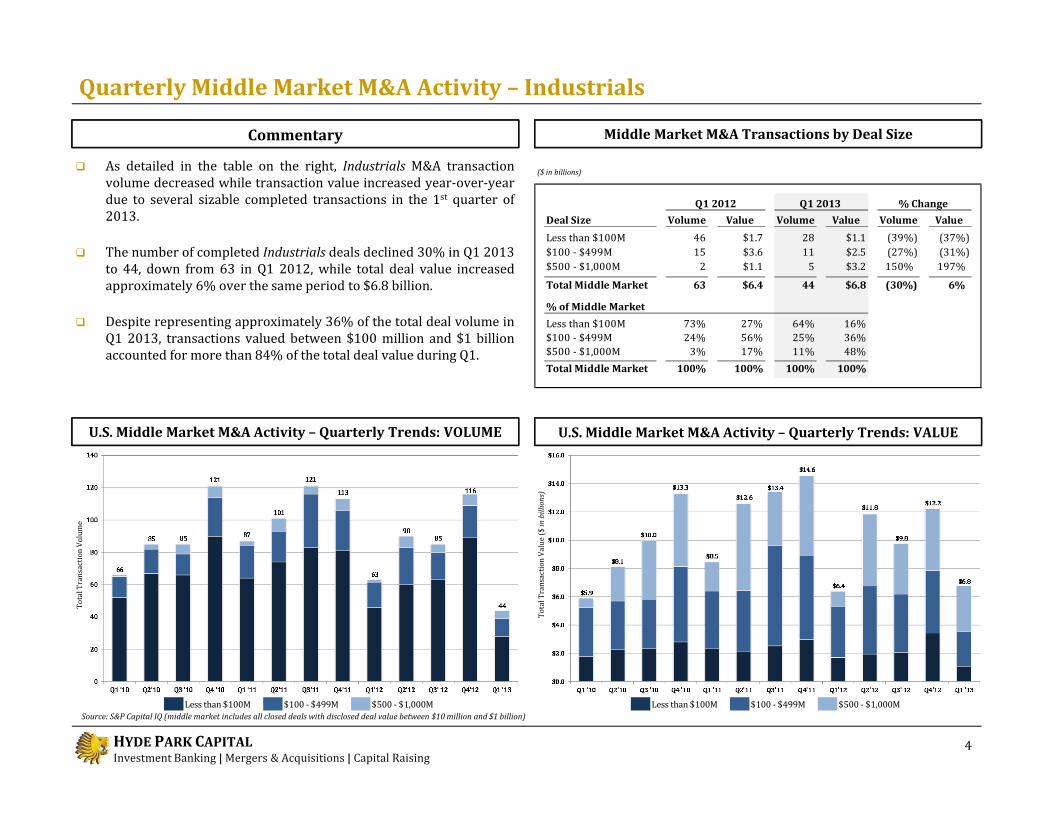
As detailed in the table on the right, Industrials M&A transactionvolume decreased while transaction value increased year-over-yeardue to several sizable completed transactions in the 1st quarter of2013.The number of completed Industrials deals declined 30% in Q1 2013to 44, down from 63 in Q1 2012, while total deal value increasedapproximately 6% over the same period to $6.8 billion.Despite representing approximately 36% of the total deal volume inQ1 2013, transactions valued between $100 million and $1 billionaccounted for more than 84% of the total deal value during Q1.
Commentary
Source: S&P Capital IQ (middle market includes all closed deals with disclosed deal value between $10 million and $1 billion)Less than $100M $100 - $499M $500 - $1,000MLess than $100M $100 - $499M $500 - $1,000M
Deal Size Volume Value Volume Value Volume Value Less than $100M 46 $1.7 28 $1.1 (39%) (37%)$100 - $499M 15 $3.6 11 $2.5 (27%) (31%)$500 - $1,000M 2 $1.1 5 $3.2 150% 197%Total Middle Market 63 $6.4 44 $6.8 (30%) 6%
% of Middle MarketLess than $100M 73% 27% 64% 16%$100 - $499M 24% 56% 25% 36%$500 - $1,000M 3% 17% 11% 48%Total Middle Market 100% 100% 100% 100%
Q1 2012 Q1 2013 % Change
HYDE PARK CAPITALInvestment Banking | Mergers & Acquisitions | Capital Raising
Recent M&A Activity – Industrials
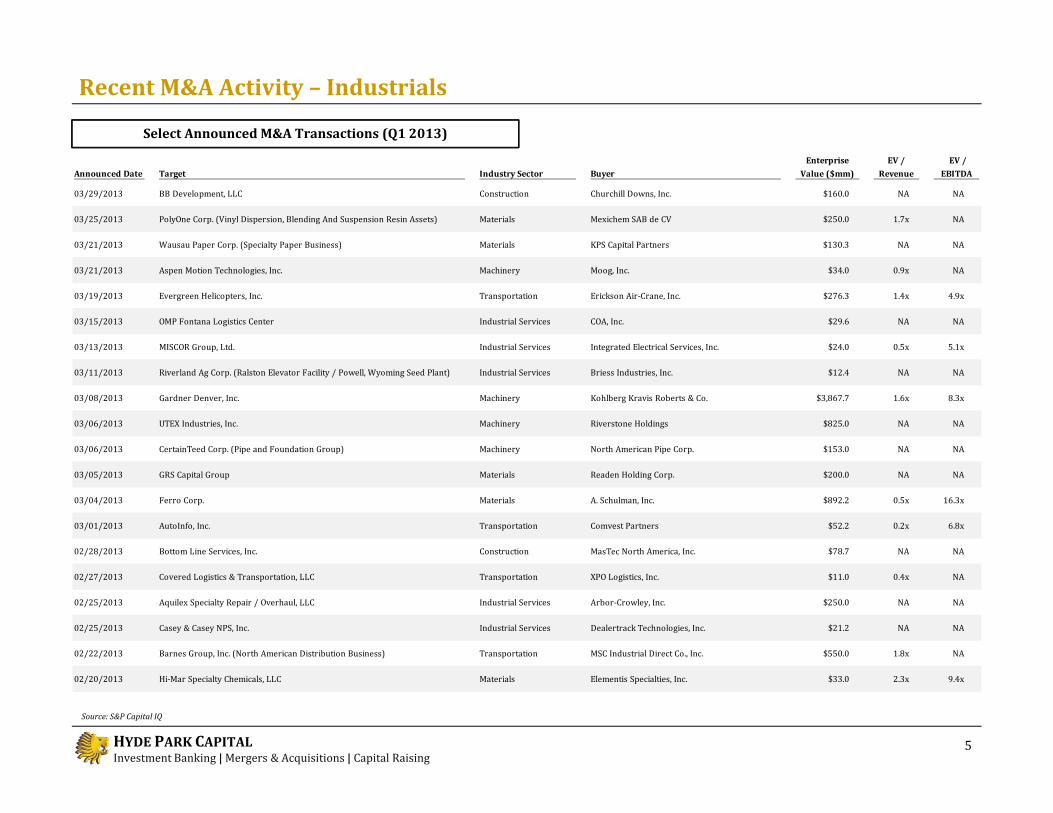
Select Announced M&A Transactions (Q1 2013)
5Source: S&P Capital IQ
Announced Date Target Industry Sector Buyer Enterprise
Value ($mm)EV /
Revenue EV /
EBITDA 03/29/2013 BB Development, LLC Construction Churchill Downs, Inc. $160.0 NA NA03/25/2013 PolyOne Corp. (Vinyl Dispersion, Blending And Suspension Resin Assets) Materials Mexichem SAB de CV $250.0 1.7x NA03/21/2013 Wausau Paper Corp. (Specialty Paper Business) Materials KPS Capital Partners $130.3 NA NA03/21/2013 Aspen Motion Technologies, Inc. Machinery Moog, Inc. $34.0 0.9x NA03/19/2013 Evergreen Helicopters, Inc. Transportation Erickson Air-Crane, Inc. $276.3 1.4x 4.9x03/15/2013 OMP Fontana Logistics Center Industrial Services COA, Inc. $29.6 NA NA03/13/2013 MISCOR Group, Ltd. Industrial Services Integrated Electrical Services, Inc. $24.0 0.5x 5.1x03/11/2013 Riverland Ag Corp. (Ralston Elevator Facility / Powell, Wyoming Seed Plant) Industrial Services Briess Industries, Inc. $12.4 NA NA03/08/2013 Gardner Denver, Inc. Machinery Kohlberg Kravis Roberts & Co. $3,867.7 1.6x 8.3x03/06/2013 UTEX Industries, Inc. Machinery Riverstone Holdings $825.0 NA NA03/06/2013 CertainTeed Corp. (Pipe and Foundation Group) Machinery North American Pipe Corp. $153.0 NA NA03/05/2013 GRS Capital Group Materials Readen Holding Corp. $200.0 NA NA03/04/2013 Ferro Corp. Materials A. Schulman, Inc. $892.2 0.5x 16.3x03/01/2013 AutoInfo, Inc. Transportation Comvest Partners $52.2 0.2x 6.8x02/28/2013 Bottom Line Services, Inc. Construction MasTec North America, Inc. $78.7 NA NA02/27/2013 Covered Logistics & Transportation, LLC Transportation XPO Logistics, Inc. $11.0 0.4x NA02/25/2013 Aquilex Specialty Repair / Overhaul, LLC Industrial Services Arbor-Crowley, Inc. $250.0 NA NA02/25/2013 Casey & Casey NPS, Inc. Industrial Services Dealertrack Technologies, Inc. $21.2 NA NA02/22/2013 Barnes Group, Inc. (North American Distribution Business) Transportation MSC Industrial Direct Co., Inc. $550.0 1.8x NA02/20/2013 Hi-Mar Specialty Chemicals, LLC Materials Elementis Specialties, Inc. $33.0 2.3x 9.4x
HYDE PARK CAPITALInvestment Banking | Mergers & Acquisitions | Capital Raising
Recent M&A Activity – Industrials
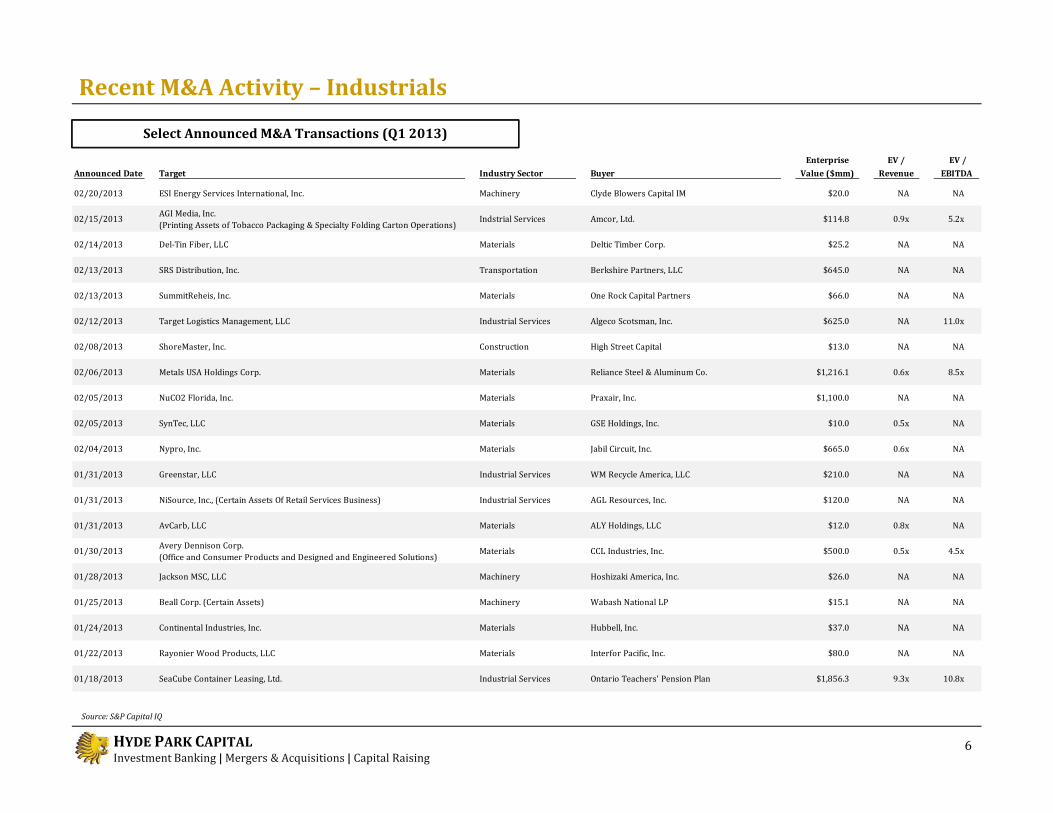
Select Announced M&A Transactions (Q1 2013)
6Source: S&P Capital IQ
Announced Date Target Industry Sector Buyer Enterprise
Value ($mm)EV /
Revenue EV /
EBITDA 02/20/2013 ESI Energy Services International, Inc. Machinery Clyde Blowers Capital IM $20.0 NA NA02/15/2013 AGI Media, Inc. (Printing Assets of Tobacco Packaging & Specialty Folding Carton Operations) Indstrial Services Amcor, Ltd. $114.8 0.9x 5.2x02/14/2013 Del-Tin Fiber, LLC Materials Deltic Timber Corp. $25.2 NA NA02/13/2013 SRS Distribution, Inc. Transportation Berkshire Partners, LLC $645.0 NA NA02/13/2013 SummitReheis, Inc. Materials One Rock Capital Partners $66.0 NA NA02/12/2013 Target Logistics Management, LLC Industrial Services Algeco Scotsman, Inc. $625.0 NA 11.0x02/08/2013 ShoreMaster, Inc. Construction High Street Capital $13.0 NA NA02/06/2013 Metals USA Holdings Corp. Materials Reliance Steel & Aluminum Co. $1,216.1 0.6x 8.5x02/05/2013 NuCO2 Florida, Inc. Materials Praxair, Inc. $1,100.0 NA NA02/05/2013 SynTec, LLC Materials GSE Holdings, Inc. $10.0 0.5x NA02/04/2013 Nypro, Inc. Materials Jabil Circuit, Inc. $665.0 0.6x NA01/31/2013 Greenstar, LLC Industrial Services WM Recycle America, LLC $210.0 NA NA01/31/2013 NiSource, Inc., (Certain Assets Of Retail Services Business) Industrial Services AGL Resources, Inc. $120.0 NA NA01/31/2013 AvCarb, LLC Materials ALY Holdings, LLC $12.0 0.8x NA01/30/2013 Avery Dennison Corp. (Office and Consumer Products and Designed and Engineered Solutions) Materials CCL Industries, Inc. $500.0 0.5x 4.5x01/28/2013 Jackson MSC, LLC Machinery Hoshizaki America, Inc. $26.0 NA NA01/25/2013 Beall Corp. (Certain Assets) Machinery Wabash National LP $15.1 NA NA01/24/2013 Continental Industries, Inc. Materials Hubbell, Inc. $37.0 NA NA01/22/2013 Rayonier Wood Products, LLC Materials Interfor Pacific, Inc. $80.0 NA NA01/18/2013 SeaCube Container Leasing, Ltd. Industrial Services Ontario Teachers' Pension Plan $1,856.3 9.3x 10.8x
HYDE PARK CAPITALInvestment Banking | Mergers & Acquisitions | Capital Raising
Recent M&A Activity – Industrials
Select Announced M&A Transactions (Q1 2013)
7Source: S&P Capital IQ
Announced Date Target Industry Sector Buyer Enterprise
Value ($mm)EV /
Revenue EV /
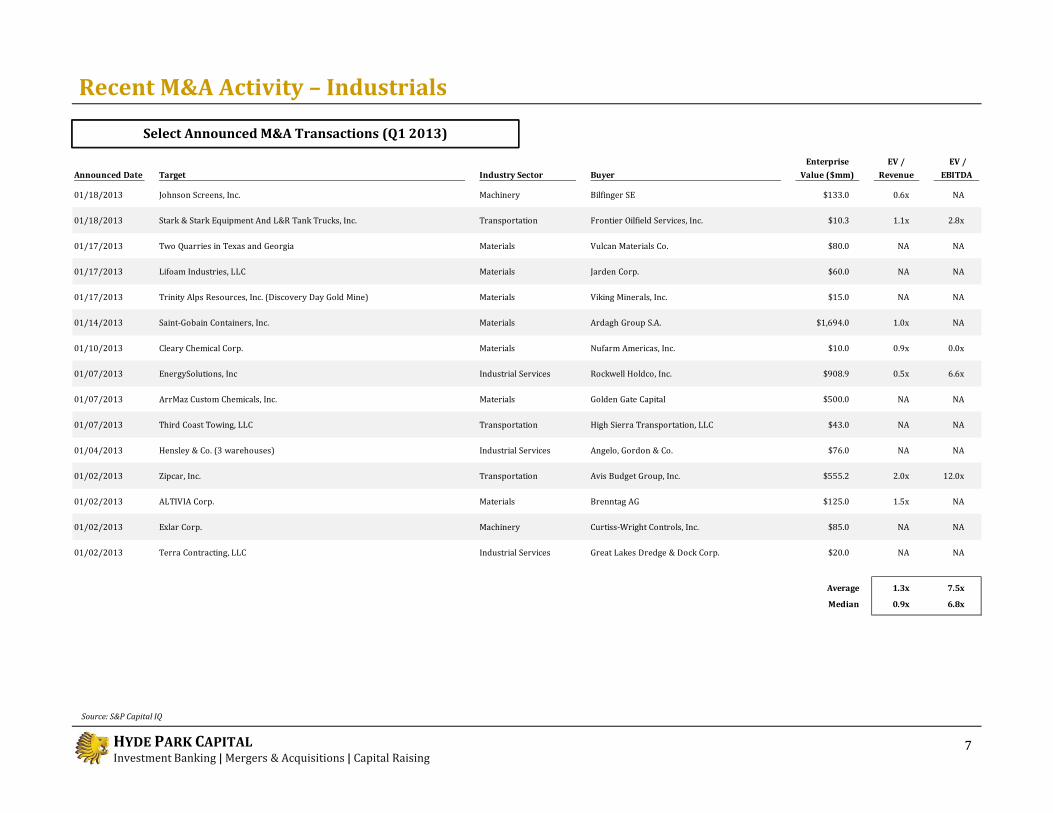
EBITDA 01/18/2013 Johnson Screens, Inc. Machinery Bilfinger SE $133.0 0.6x NA01/18/2013 Stark & Stark Equipment And L&R Tank Trucks, Inc. Transportation Frontier Oilfield Services, Inc. $10.3 1.1x 2.8x01/17/2013 Two Quarries in Texas and Georgia Materials Vulcan Materials Co. $80.0 NA NA01/17/2013 Lifoam Industries, LLC Materials Jarden Corp. $60.0 NA NA01/17/2013 Trinity Alps Resources, Inc. (Discovery Day Gold Mine) Materials Viking Minerals, Inc. $15.0 NA NA01/14/2013 Saint-Gobain Containers, Inc. Materials Ardagh Group S.A. $1,694.0 1.0x NA01/10/2013 Cleary Chemical Corp. Materials Nufarm Americas, Inc. $10.0 0.9x 0.0x01/07/2013 EnergySolutions, Inc Industrial Services Rockwell Holdco, Inc. $908.9 0.5x 6.6x01/07/2013 ArrMaz Custom Chemicals, Inc. Materials Golden Gate Capital $500.0 NA NA01/07/2013 Third Coast Towing, LLC Transportation High Sierra Transportation, LLC $43.0 NA NA01/04/2013 Hensley & Co. (3 warehouses) Industrial Services Angelo, Gordon & Co. $76.0 NA NA01/02/2013 Zipcar, Inc. Transportation Avis Budget Group, Inc. $555.2 2.0x 12.0x01/02/2013 ALTIVIA Corp. Materials Brenntag AG $125.0 1.5x NA01/02/2013 Exlar Corp. Machinery Curtiss-Wright Controls, Inc. $85.0 NA NA01/02/2013 Terra Contracting, LLC Industrial Services Great Lakes Dredge & Dock Corp. $20.0 NA NA
Average 1.3x 7.5x
Median 0.9x 6.8x
HYDE PARK CAPITALInvestment Banking | Mergers & Acquisitions | Capital Raising
Recent M&A Transactions Profiled – Industrials
Transaction DetailsMetals USA Holdings Corp. (NYSE:MUSA)
Transaction Details
8
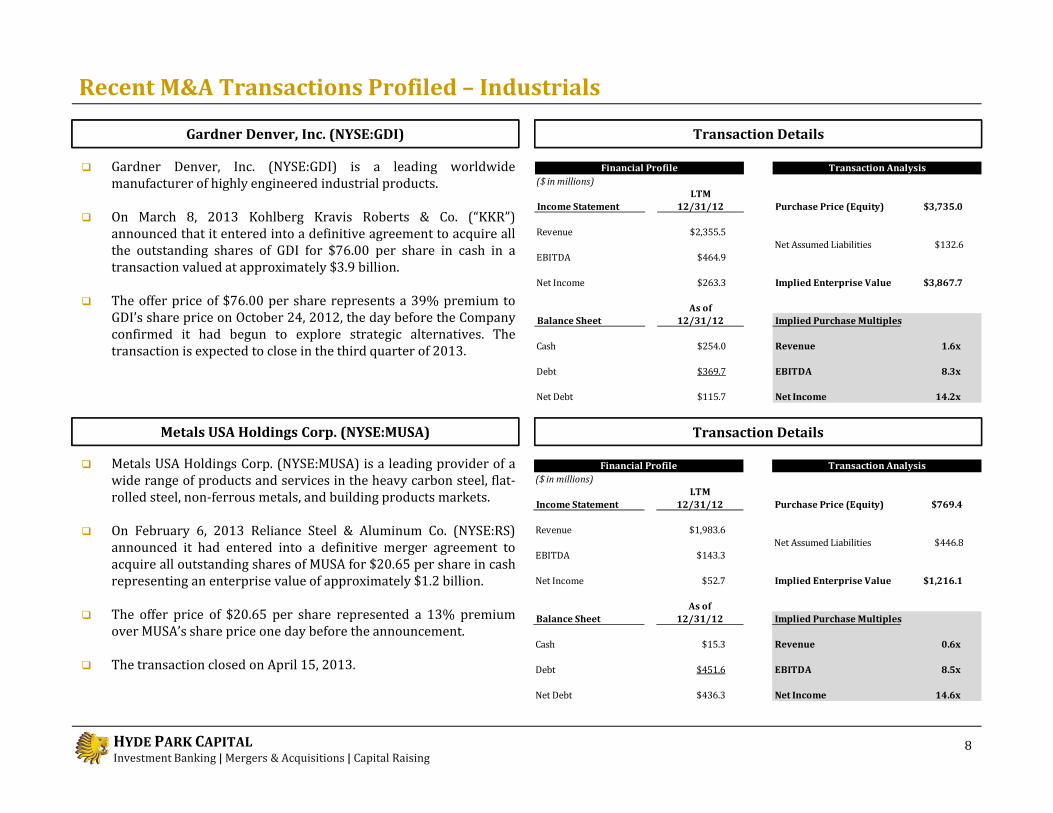
Gardner Denver, Inc. (NYSE:GDI)Gardner Denver, Inc. (NYSE:GDI) is a leading worldwidemanufacturer of highly engineered industrial products.On March 8, 2013 Kohlberg Kravis Roberts & Co. (“KKR”)announced that it entered into a definitive agreement to acquire allthe outstanding shares of GDI for $76.00 per share in cash in atransaction valued at approximately $3.9 billion.The offer price of $76.00 per share represents a 39% premium toGDI’s share price on October 24, 2012, the day before the Companyconfirmed it had begun to explore strategic alternatives. Thetransaction is expected to close in the third quarter of 2013.
Metals USA Holdings Corp. (NYSE:MUSA) is a leading provider of awide range of products and services in the heavy carbon steel, flat-rolled steel, non-ferrous metals, and building products markets.On February 6, 2013 Reliance Steel & Aluminum Co. (NYSE:RS)announced it had entered into a definitive merger agreement toacquire all outstanding shares of MUSA for $20.65 per share in cashrepresenting an enterprise value of approximately $1.2 billion.The offer price of $20.65 per share represented a 13% premiumover MUSA’s share price one day before the announcement.The transaction closed on April 15, 2013.
($ in millions)LTM
Income Statement 12/31/12 Purchase Price (Equity) $3,735.0Revenue $2,355.5 Net Assumed Liabilities $132.6EBITDA $464.9Net Income $263.3 Implied Enterprise Value $3,867.7
As ofBalance Sheet 12/31/12 Implied Purchase MultiplesCash $254.0 Revenue 1.6xDebt $369.7 EBITDA 8.3xNet Debt $115.7 Net Income 14.2x
Financial Profile Transaction Analysis
($ in millions)LTM
Income Statement 12/31/12 Purchase Price (Equity) $769.4Revenue $1,983.6 Net Assumed Liabilities $446.8EBITDA $143.3Net Income $52.7 Implied Enterprise Value $1,216.1
As ofBalance Sheet 12/31/12 Implied Purchase MultiplesCash $15.3 Revenue 0.6xDebt $451.6 EBITDA 8.5xNet Debt $436.3 Net Income 14.6x
Financial Profile Transaction Analysis
HYDE PARK CAPITALInvestment Banking | Mergers & Acquisitions | Capital Raising
9637
11358
2228
12341
12574
2237
0 20 40 60 80 100 120 140Materials
TransportationIndustrial Services
MachineryElectrical Equipment
Construction
M&A Activity by Industrial Sector
% Change
% Change
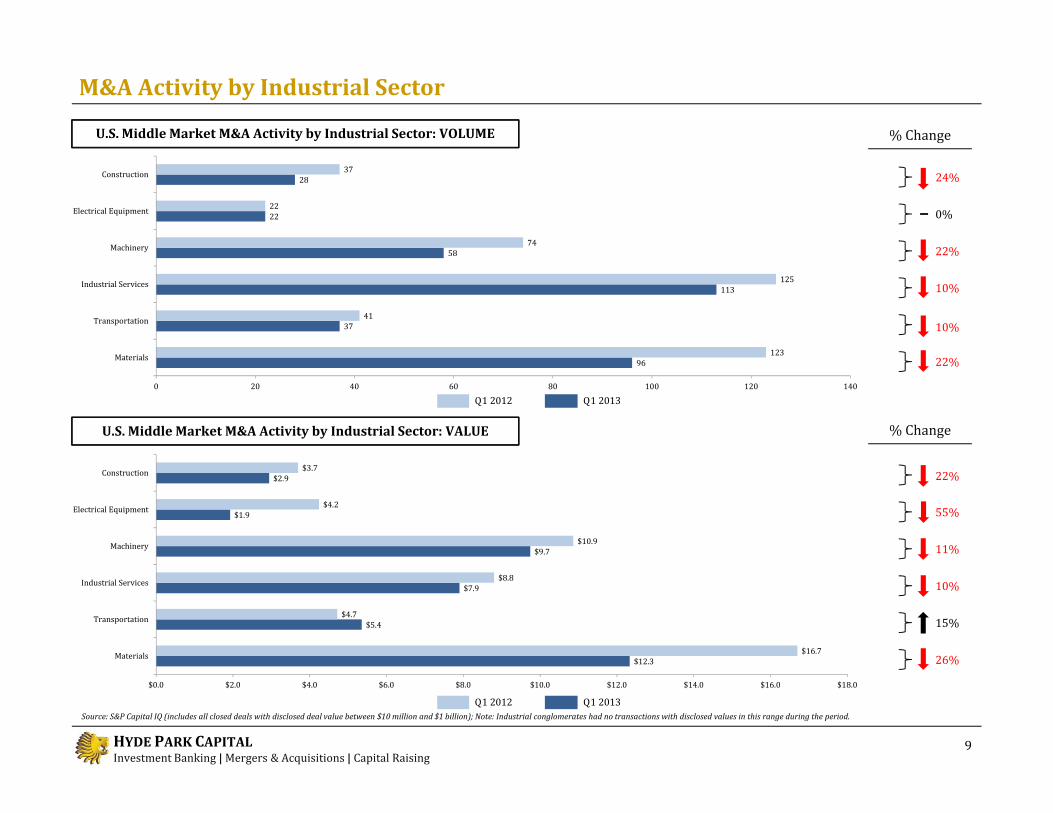
U.S. Middle Market M&A Activity by Industrial Sector: VOLUME
9Source: S&P Capital IQ (includes all closed deals with disclosed deal value between $10 million and $1 billion); Note: Industrial conglomerates had no transactions with disclosed values in this range during the period.
U.S. Middle Market M&A Activity by Industrial Sector: VALUE
0%22%
55%10%11%
24%
22%
10%10%22%
15%26%
($ in billions)
Q1 2012 Q1 2013
$12.3$5.4
$7.9$9.7
$1.9$2.9
$16.7$4.7
$8.8$10.9
$4.2$3.7
$0.0 $2.0 $4.0 $6.0 $8.0 $10.0 $12.0 $14.0 $16.0 $18.0Materials
TransportationIndustrial Services
MachineryElectrical Equipment
Construction
Q1 2012 Q1 2013
HYDE PARK CAPITALInvestment Banking | Mergers & Acquisitions | Capital Raising
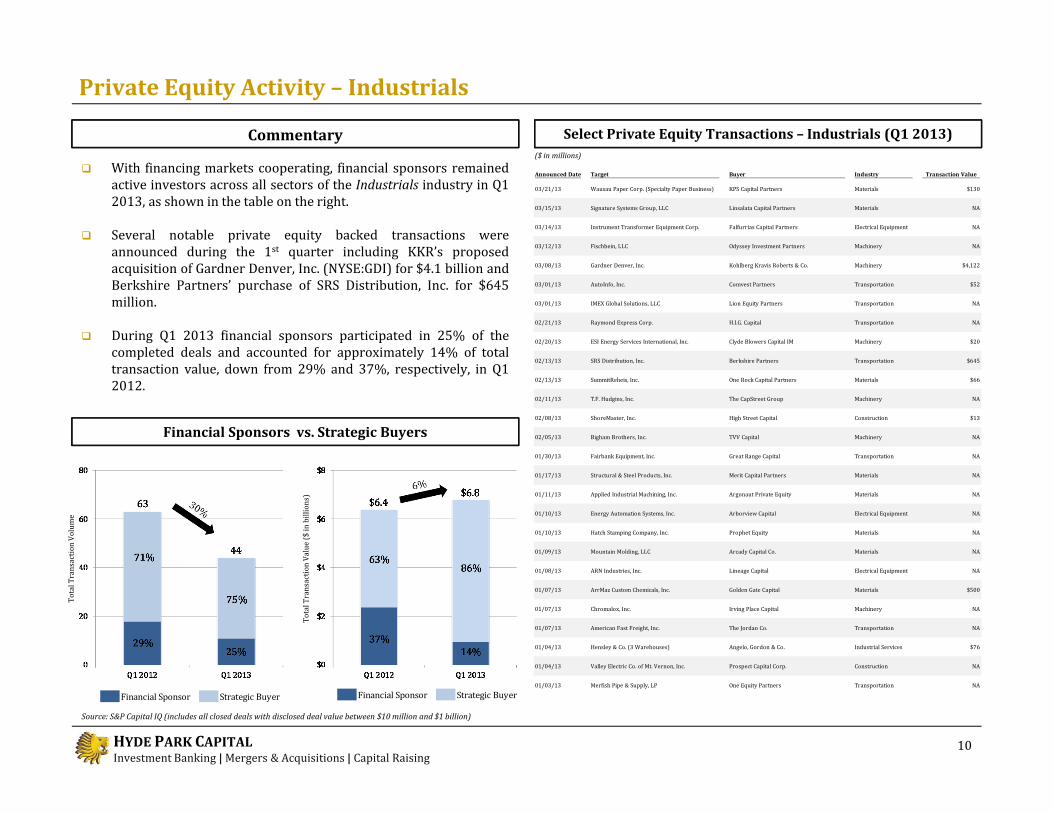
With financing markets cooperating, financial sponsors remainedactive investors across all sectors of the Industrials industry in Q12013, as shown in the table on the right.Several notable private equity backed transactions wereannounced during the 1st quarter including KKR’s proposedacquisition of Gardner Denver, Inc. (NYSE:GDI) for $4.1 billion andBerkshire Partners’ purchase of SRS Distribution, Inc. for $645million.During Q1 2013 financial sponsors participated in 25% of thecompleted deals and accounted for approximately 14% of totaltransaction value, down from 29% and 37%, respectively, in Q12012.
Select Private Equity Transactions – Industrials (Q1 2013)
Financial Sponsors vs. Strategic Buyers
Private Equity Activity – Industrials
Financial Sponsor Strategic Buyer Financial Sponsor Strategic Buyer
Total Transac
tion Value ($ i
n billions)
10
($ in millions)
Commentary
Source: S&P Capital IQ (includes all closed deals with disclosed deal value between $10 million and $1 billion)
Total Transac
tion Volume
Announced Date Target Buyer Industry Transaction Value 03/21/13 Wausau Paper Corp. (Specialty Paper Business) KPS Capital Partners Materials $13003/15/13 Signature Systems Group, LLC Linsalata Capital Partners Materials NA03/14/13 Instrument Transformer Equipment Corp. Falfurrias Capital Partners Electrical Equipment NA03/12/13 Fischbein, LLC Odyssey Investment Partners Machinery NA03/08/13 Gardner Denver, Inc. Kohlberg Kravis Roberts & Co. Machinery $4,12203/01/13 AutoInfo, Inc. Comvest Partners Transportation $5203/01/13 IMEX Global Solutions, LLC Lion Equity Partners Transportation NA02/21/13 Raymond Express Corp. H.I.G. Capital Transportation NA02/20/13 ESI Energy Services International, Inc. Clyde Blowers Capital IM Machinery $2002/13/13 SRS Distribution, Inc. Berkshire Partners Transportation $64502/13/13 SummitReheis, Inc. One Rock Capital Partners Materials $6602/11/13 T.F. Hudgins, Inc. The CapStreet Group Machinery NA02/08/13 ShoreMaster, Inc. High Street Capital Construction $1302/05/13 Bigham Brothers, Inc. TVV Capital Machinery NA01/30/13 Fairbank Equipment, Inc. Great Range Capital Transportation NA01/17/13 Structural & Steel Products, Inc. Merit Capital Partners Materials NA01/11/13 Applied Industrial Machining, Inc. Argonaut Private Equity Materials NA01/10/13 Energy Automation Systems, Inc. Arborview Capital Electrical Equipment NA01/10/13 Hatch Stamping Company, Inc. Prophet Equity Materials NA01/09/13 Mountain Molding, LLC Arcady Capital Co. Materials NA01/08/13 ARN Industries, Inc. Lineage Capital Electrical Equipment NA01/07/13 ArrMaz Custom Chemicals, Inc. Golden Gate Capital Materials $50001/07/13 Chromalox, Inc. Irving Place Capital Machinery NA01/07/13 American Fast Freight, Inc. The Jordan Co. Transportation NA01/04/13 Hensley & Co. (3 Warehouses) Angelo, Gordon & Co. Industrial Services $7601/04/13 Valley Electric Co. of Mt. Vernon, Inc. Prospect Capital Corp. Construction NA01/03/13 Merfish Pipe & Supply, LP One Equity Partners Transportation NA
HYDE PARK CAPITALInvestment Banking | Mergers & Acquisitions | Capital Raising
Industry Sector Overview – Recent Stock Price Performance
Electrical Equipment
Commentary
11
Construction
Machinery
Source: S&P Capital IQ
The charts included on the following pages detail the recent stockprice performance by sector for the leading public companieswithin the Industrials industry for the trailing 12-month periodending March 31, 2013. The shaded section is the most recent 3-month period (Q1) for each sector and relative to the S&P 500.During Q1 2013 all of the sector indices of the Industrials industryincreased, led by the Transportation and Construction sectors,increasing 15% and 13%, respectively. For the 12-month periodending March 31, 2013, all of the Industrial industry’s sectorsincreased except for the Materials sector which decreased 1%.70%80%90%
100%110%120%130%140%
Mar-12 Jun-12 Sep-12 Dec-12 Mar-13S&P 500 Construction
80%90%
100%110%120%130%140%
Mar-12 Jun-12 Sep-12 Dec-12 Mar-13S&P 500 Electrical Equipment70%80%90%
100%110%120%130%
Mar-12 Jun-12 Sep-12 Dec-12 Mar-13S&P 500 Machinery
1.7%
10.6%
26.6%
10.6%
19.6%
10.6%
HYDE PARK CAPITALInvestment Banking | Mergers & Acquisitions | Capital Raising
Industry Sector Overview – Recent Stock Price Performance
Industrial Conglomerates
Industrial Services
12
Transportation
Source: S&P Capital IQ
Materials
80%90%
100%110%120%130%140%
Mar-12 Jun-12 Sep-12 Dec-12 Mar-13S&P 500 Industrial Services70%80%90%
100%110%120%130%
Mar-12 Jun-12 Sep-12 Dec-12 Mar-13S&P 500 Transportation
70%80%90%
100%110%120%130%
Mar-12 Jun-12 Sep-12 Dec-12 Mar-13S&P 500 Industrial Conglomerates70%80%90%
100%110%120%130%
Mar-12 Jun-12 Sep-12 Dec-12 Mar-13S&P 500 Materials
18.3%
10.6%
10.4%
10.6%
10.6%
12.5%
10.6%
0.9%
HYDE PARK CAPITALInvestment Banking | Mergers & Acquisitions | Capital Raising
Industry Sector Overview – Public Company Analysis
Building Products
($ in millions, except per share)
13
Construction and Engineering
Construction
Source: S&P Capital IQ
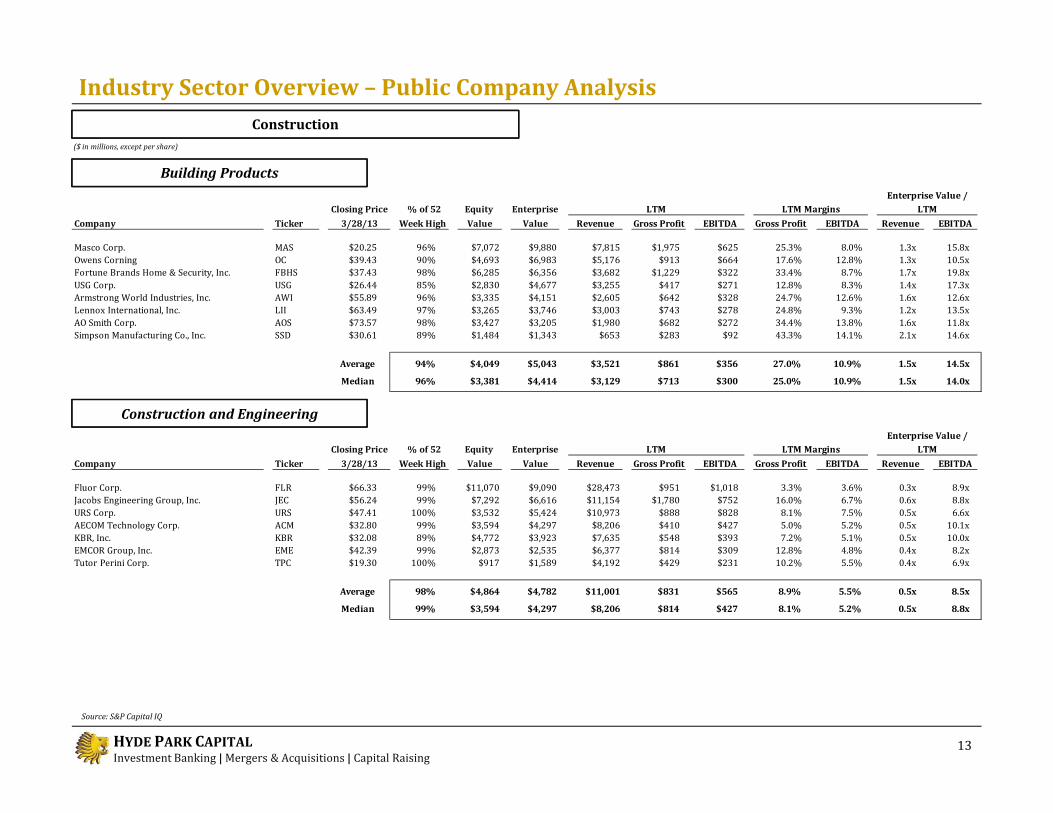
Closing Price % of 52 Equity EnterpriseCompany Ticker 3/28/13 Week High Value Value Revenue Gross Profit EBITDA Gross Profit EBITDA Revenue EBITDA Masco Corp. MAS $20.25 96% $7,072 $9,880 $7,815 $1,975 $625 25.3% 8.0% 1.3x 15.8xOwens Corning OC $39.43 90% $4,693 $6,983 $5,176 $913 $664 17.6% 12.8% 1.3x 10.5xFortune Brands Home & Security, Inc. FBHS $37.43 98% $6,285 $6,356 $3,682 $1,229 $322 33.4% 8.7% 1.7x 19.8xUSG Corp. USG $26.44 85% $2,830 $4,677 $3,255 $417 $271 12.8% 8.3% 1.4x 17.3xArmstrong World Industries, Inc. AWI $55.89 96% $3,335 $4,151 $2,605 $642 $328 24.7% 12.6% 1.6x 12.6xLennox International, Inc. LII $63.49 97% $3,265 $3,746 $3,003 $743 $278 24.8% 9.3% 1.2x 13.5xAO Smith Corp. AOS $73.57 98% $3,427 $3,205 $1,980 $682 $272 34.4% 13.8% 1.6x 11.8xSimpson Manufacturing Co., Inc. SSD $30.61 89% $1,484 $1,343 $653 $283 $92 43.3% 14.1% 2.1x 14.6x
Average 94% $4,049 $5,043 $3,521 $861 $356 27.0% 10.9% 1.5x 14.5x
Median 96% $3,381 $4,414 $3,129 $713 $300 25.0% 10.9% 1.5x 14.0x
LTM MarginsEnterprise Value /
LTM LTM
Closing Price % of 52 Equity EnterpriseCompany Ticker 3/28/13 Week High Value Value Revenue Gross Profit EBITDA Gross Profit EBITDA Revenue EBITDA Fluor Corp. FLR $66.33 99% $11,070 $9,090 $28,473 $951 $1,018 3.3% 3.6% 0.3x 8.9xJacobs Engineering Group, Inc. JEC $56.24 99% $7,292 $6,616 $11,154 $1,780 $752 16.0% 6.7% 0.6x 8.8xURS Corp. URS $47.41 100% $3,532 $5,424 $10,973 $888 $828 8.1% 7.5% 0.5x 6.6xAECOM Technology Corp. ACM $32.80 99% $3,594 $4,297 $8,206 $410 $427 5.0% 5.2% 0.5x 10.1xKBR, Inc. KBR $32.08 89% $4,772 $3,923 $7,635 $548 $393 7.2% 5.1% 0.5x 10.0xEMCOR Group, Inc. EME $42.39 99% $2,873 $2,535 $6,377 $814 $309 12.8% 4.8% 0.4x 8.2xTutor Perini Corp. TPC $19.30 100% $917 $1,589 $4,192 $429 $231 10.2% 5.5% 0.4x 6.9x
Average 98% $4,864 $4,782 $11,001 $831 $565 8.9% 5.5% 0.5x 8.5x
Median 99% $3,594 $4,297 $8,206 $814 $427 8.1% 5.2% 0.5x 8.8x
Enterprise Value /LTM LTM Margins LTM
HYDE PARK CAPITALInvestment Banking | Mergers & Acquisitions | Capital Raising
Industry Sector Overview – Public Company Analysis
14Source: S&P Capital IQ
Electrical Equipment($ in millions, except per share)
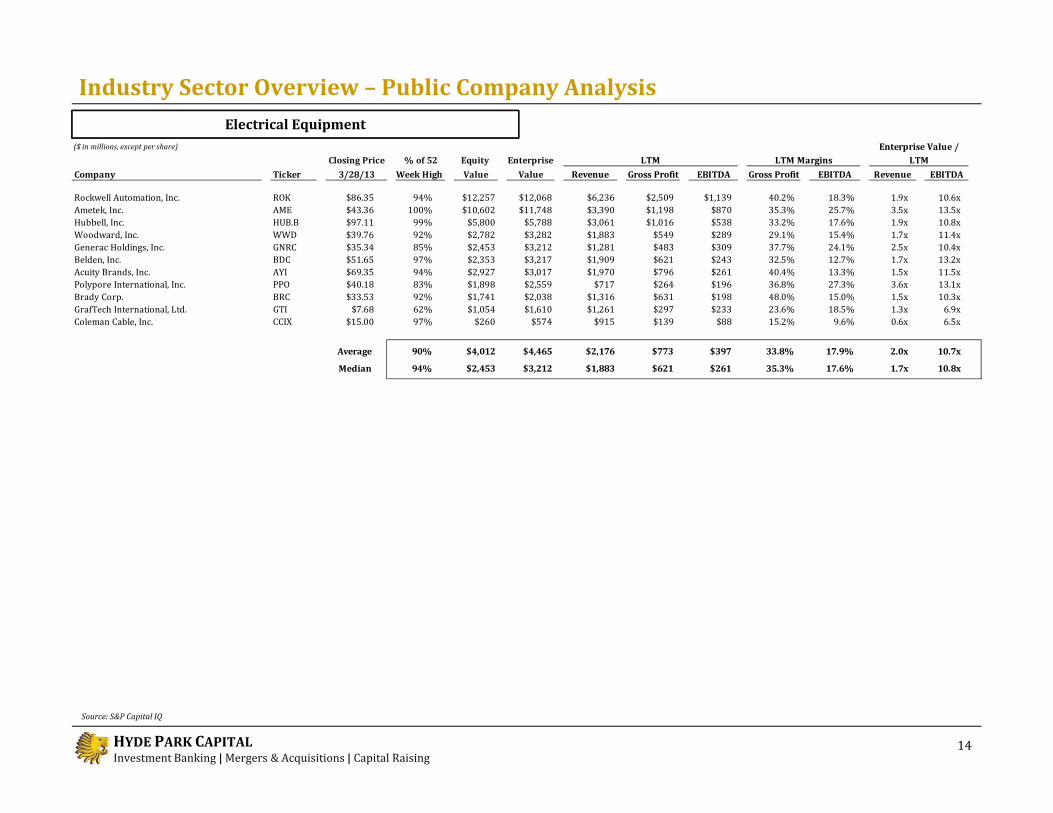
Closing Price % of 52 Equity EnterpriseCompany Ticker 3/28/13 Week High Value Value Revenue Gross Profit EBITDA Gross Profit EBITDA Revenue EBITDARockwell Automation, Inc. ROK $86.35 94% $12,257 $12,068 $6,236 $2,509 $1,139 40.2% 18.3% 1.9x 10.6xAmetek, Inc. AME $43.36 100% $10,602 $11,748 $3,390 $1,198 $870 35.3% 25.7% 3.5x 13.5xHubbell, Inc. HUB.B $97.11 99% $5,800 $5,788 $3,061 $1,016 $538 33.2% 17.6% 1.9x 10.8xWoodward, Inc. WWD $39.76 92% $2,782 $3,282 $1,883 $549 $289 29.1% 15.4% 1.7x 11.4xGenerac Holdings, Inc. GNRC $35.34 85% $2,453 $3,212 $1,281 $483 $309 37.7% 24.1% 2.5x 10.4xBelden, Inc. BDC $51.65 97% $2,353 $3,217 $1,909 $621 $243 32.5% 12.7% 1.7x 13.2xAcuity Brands, Inc. AYI $69.35 94% $2,927 $3,017 $1,970 $796 $261 40.4% 13.3% 1.5x 11.5xPolypore International, Inc. PPO $40.18 83% $1,898 $2,559 $717 $264 $196 36.8% 27.3% 3.6x 13.1xBrady Corp. BRC $33.53 92% $1,741 $2,038 $1,316 $631 $198 48.0% 15.0% 1.5x 10.3xGrafTech International, Ltd. GTI $7.68 62% $1,054 $1,610 $1,261 $297 $233 23.6% 18.5% 1.3x 6.9xColeman Cable, Inc. CCIX $15.00 97% $260 $574 $915 $139 $88 15.2% 9.6% 0.6x 6.5x
Average 90% $4,012 $4,465 $2,176 $773 $397 33.8% 17.9% 2.0x 10.7x
Median 94% $2,453 $3,212 $1,883 $621 $261 35.3% 17.6% 1.7x 10.8x
Enterprise Value /LTM LTM Margins LTM
HYDE PARK CAPITALInvestment Banking | Mergers & Acquisitions | Capital Raising
Industry Sector Overview – Public Company Analysis
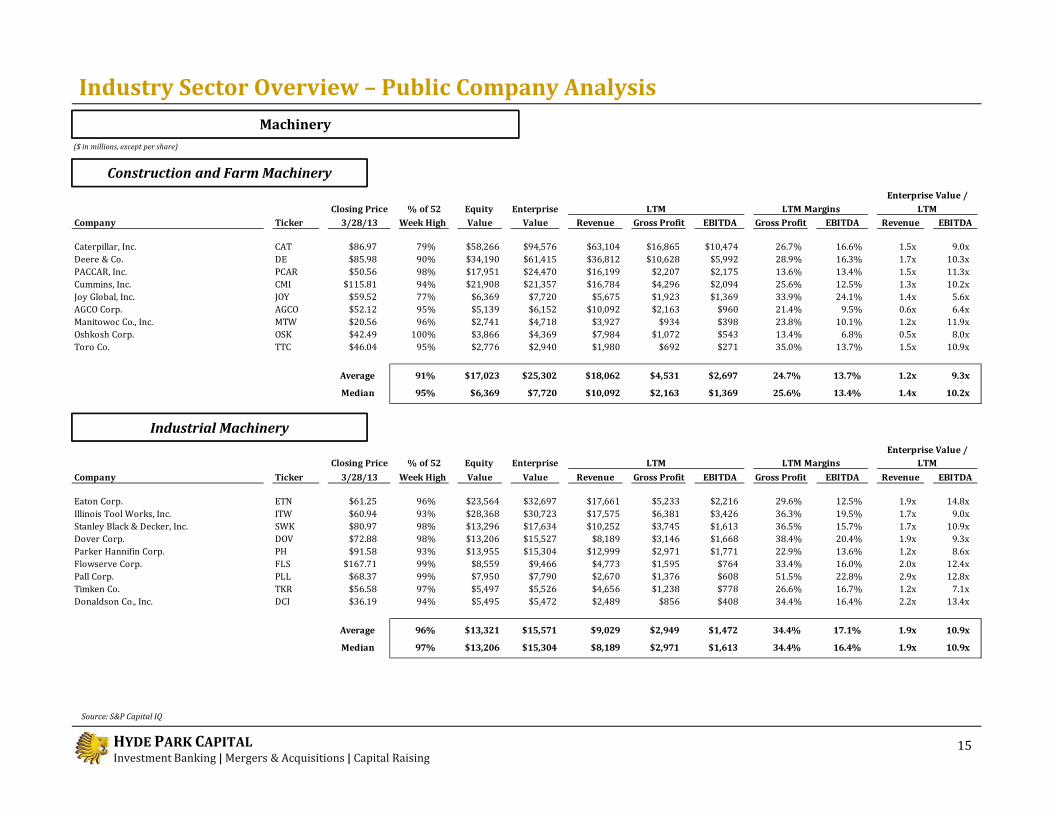
Construction and Farm Machinery
($ in millions, except per share)
15
Industrial Machinery
Machinery
Source: S&P Capital IQ
Closing Price % of 52 Equity EnterpriseCompany Ticker 3/28/13 Week High Value Value Revenue Gross Profit EBITDA Gross Profit EBITDA Revenue EBITDA Caterpillar, Inc. CAT $86.97 79% $58,266 $94,576 $63,104 $16,865 $10,474 26.7% 16.6% 1.5x 9.0xDeere & Co. DE $85.98 90% $34,190 $61,415 $36,812 $10,628 $5,992 28.9% 16.3% 1.7x 10.3xPACCAR, Inc. PCAR $50.56 98% $17,951 $24,470 $16,199 $2,207 $2,175 13.6% 13.4% 1.5x 11.3xCummins, Inc. CMI $115.81 94% $21,908 $21,357 $16,784 $4,296 $2,094 25.6% 12.5% 1.3x 10.2xJoy Global, Inc. JOY $59.52 77% $6,369 $7,720 $5,675 $1,923 $1,369 33.9% 24.1% 1.4x 5.6xAGCO Corp. AGCO $52.12 95% $5,139 $6,152 $10,092 $2,163 $960 21.4% 9.5% 0.6x 6.4xManitowoc Co., Inc. MTW $20.56 96% $2,741 $4,718 $3,927 $934 $398 23.8% 10.1% 1.2x 11.9xOshkosh Corp. OSK $42.49 100% $3,866 $4,369 $7,984 $1,072 $543 13.4% 6.8% 0.5x 8.0xToro Co. TTC $46.04 95% $2,776 $2,940 $1,980 $692 $271 35.0% 13.7% 1.5x 10.9x
Average 91% $17,023 $25,302 $18,062 $4,531 $2,697 24.7% 13.7% 1.2x 9.3x
Median 95% $6,369 $7,720 $10,092 $2,163 $1,369 25.6% 13.4% 1.4x 10.2x
Enterprise Value /LTM LTM Margins LTM
Closing Price % of 52 Equity EnterpriseCompany Ticker 3/28/13 Week High Value Value Revenue Gross Profit EBITDA Gross Profit EBITDA Revenue EBITDA Eaton Corp. ETN $61.25 96% $23,564 $32,697 $17,661 $5,233 $2,216 29.6% 12.5% 1.9x 14.8xIllinois Tool Works, Inc. ITW $60.94 93% $28,368 $30,723 $17,575 $6,381 $3,426 36.3% 19.5% 1.7x 9.0xStanley Black & Decker, Inc. SWK $80.97 98% $13,296 $17,634 $10,252 $3,745 $1,613 36.5% 15.7% 1.7x 10.9xDover Corp. DOV $72.88 98% $13,206 $15,527 $8,189 $3,146 $1,668 38.4% 20.4% 1.9x 9.3xParker Hannifin Corp. PH $91.58 93% $13,955 $15,304 $12,999 $2,971 $1,771 22.9% 13.6% 1.2x 8.6xFlowserve Corp. FLS $167.71 99% $8,559 $9,466 $4,773 $1,595 $764 33.4% 16.0% 2.0x 12.4xPall Corp. PLL $68.37 99% $7,950 $7,790 $2,670 $1,376 $608 51.5% 22.8% 2.9x 12.8xTimken Co. TKR $56.58 97% $5,497 $5,526 $4,656 $1,238 $778 26.6% 16.7% 1.2x 7.1xDonaldson Co., Inc. DCI $36.19 94% $5,495 $5,472 $2,489 $856 $408 34.4% 16.4% 2.2x 13.4x
Average 96% $13,321 $15,571 $9,029 $2,949 $1,472 34.4% 17.1% 1.9x 10.9x
Median 97% $13,206 $15,304 $8,189 $2,971 $1,613 34.4% 16.4% 1.9x 10.9x
Enterprise Value /LTM LTM Margins LTM
HYDE PARK CAPITALInvestment Banking | Mergers & Acquisitions | Capital Raising
Industry Sector Overview – Public Company Analysis
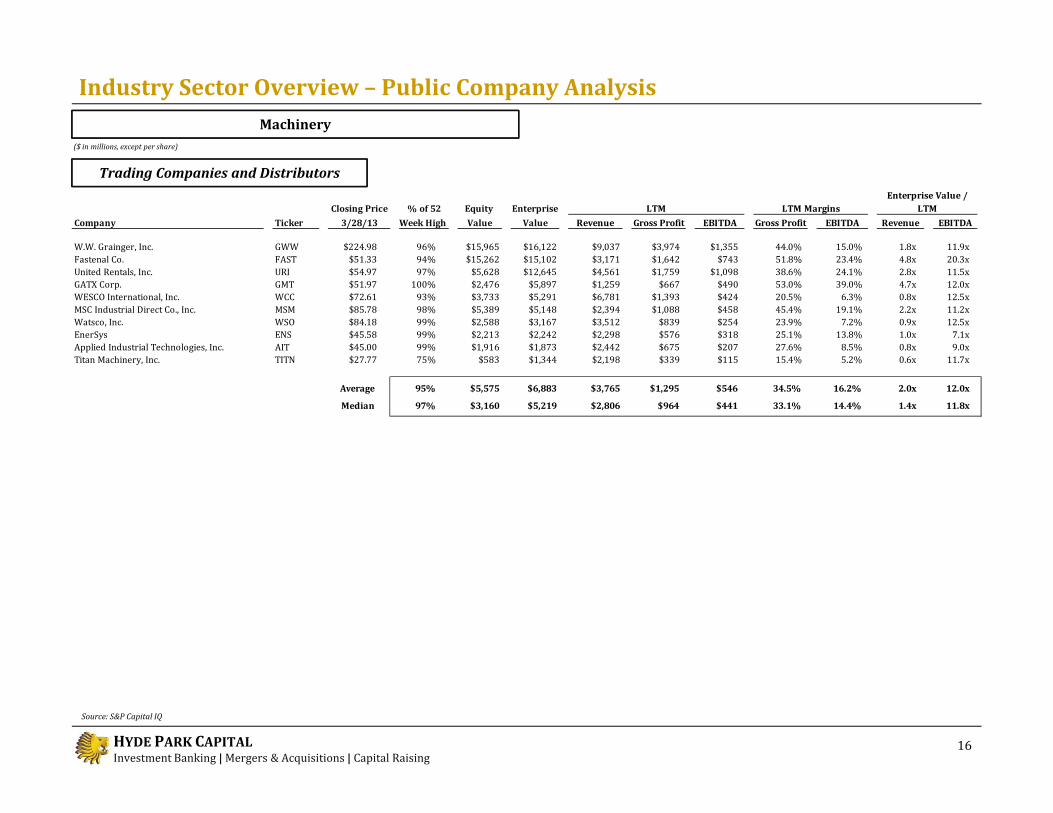
Trading Companies and Distributors
($ in millions, except per share)
16
Machinery
Source: S&P Capital IQ
Closing Price % of 52 Equity EnterpriseCompany Ticker 3/28/13 Week High Value Value Revenue Gross Profit EBITDA Gross Profit EBITDA Revenue EBITDA W.W. Grainger, Inc. GWW $224.98 96% $15,965 $16,122 $9,037 $3,974 $1,355 44.0% 15.0% 1.8x 11.9xFastenal Co. FAST $51.33 94% $15,262 $15,102 $3,171 $1,642 $743 51.8% 23.4% 4.8x 20.3xUnited Rentals, Inc. URI $54.97 97% $5,628 $12,645 $4,561 $1,759 $1,098 38.6% 24.1% 2.8x 11.5xGATX Corp. GMT $51.97 100% $2,476 $5,897 $1,259 $667 $490 53.0% 39.0% 4.7x 12.0xWESCO International, Inc. WCC $72.61 93% $3,733 $5,291 $6,781 $1,393 $424 20.5% 6.3% 0.8x 12.5xMSC Industrial Direct Co., Inc. MSM $85.78 98% $5,389 $5,148 $2,394 $1,088 $458 45.4% 19.1% 2.2x 11.2xWatsco, Inc. WSO $84.18 99% $2,588 $3,167 $3,512 $839 $254 23.9% 7.2% 0.9x 12.5xEnerSys ENS $45.58 99% $2,213 $2,242 $2,298 $576 $318 25.1% 13.8% 1.0x 7.1xApplied Industrial Technologies, Inc. AIT $45.00 99% $1,916 $1,873 $2,442 $675 $207 27.6% 8.5% 0.8x 9.0xTitan Machinery, Inc. TITN $27.77 75% $583 $1,344 $2,198 $339 $115 15.4% 5.2% 0.6x 11.7x
Average 95% $5,575 $6,883 $3,765 $1,295 $546 34.5% 16.2% 2.0x 12.0x
Median 97% $3,160 $5,219 $2,806 $964 $441 33.1% 14.4% 1.4x 11.8x
Enterprise Value /LTM LTM Margins LTM
HYDE PARK CAPITALInvestment Banking | Mergers & Acquisitions | Capital Raising
Industry Sector Overview – Public Company Analysis
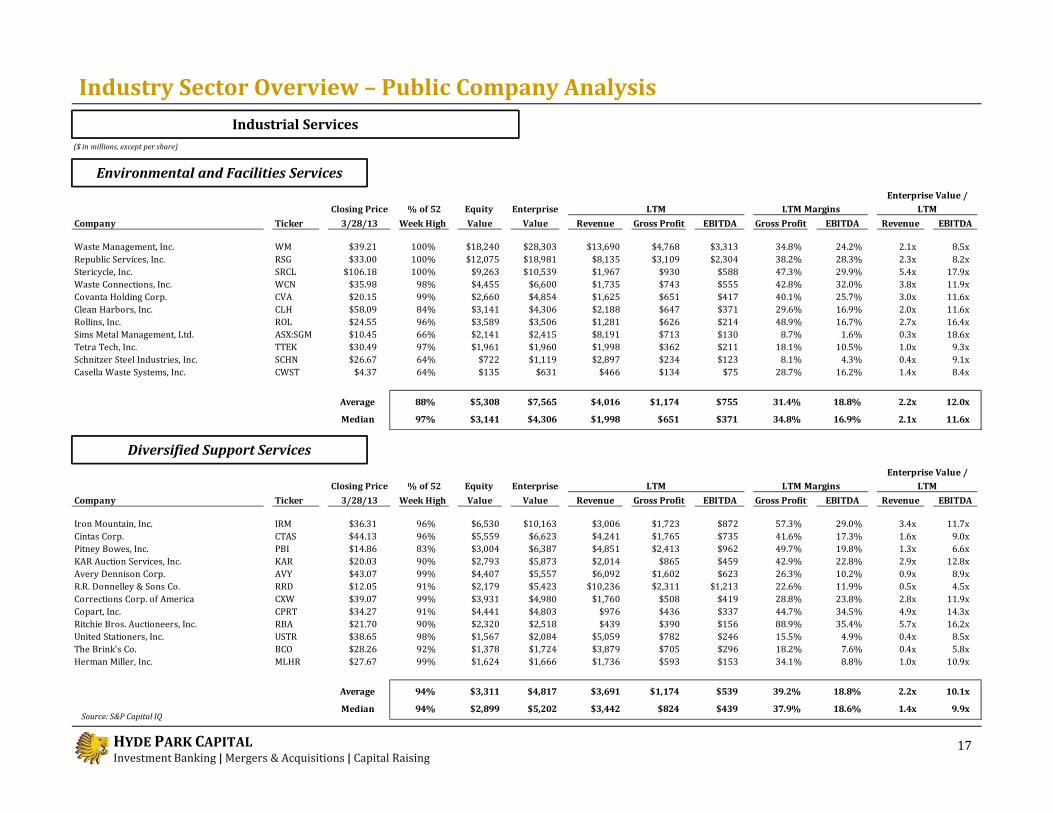
Environmental and Facilities Services
($ in millions, except per share)
17
Industrial Services
Source: S&P Capital IQ
Diversified Support Services
Closing Price % of 52 Equity EnterpriseCompany Ticker 3/28/13 Week High Value Value Revenue Gross Profit EBITDA Gross Profit EBITDA Revenue EBITDAWaste Management, Inc. WM $39.21 100% $18,240 $28,303 $13,690 $4,768 $3,313 34.8% 24.2% 2.1x 8.5xRepublic Services, Inc. RSG $33.00 100% $12,075 $18,981 $8,135 $3,109 $2,304 38.2% 28.3% 2.3x 8.2xStericycle, Inc. SRCL $106.18 100% $9,263 $10,539 $1,967 $930 $588 47.3% 29.9% 5.4x 17.9xWaste Connections, Inc. WCN $35.98 98% $4,455 $6,600 $1,735 $743 $555 42.8% 32.0% 3.8x 11.9xCovanta Holding Corp. CVA $20.15 99% $2,660 $4,854 $1,625 $651 $417 40.1% 25.7% 3.0x 11.6xClean Harbors, Inc. CLH $58.09 84% $3,141 $4,306 $2,188 $647 $371 29.6% 16.9% 2.0x 11.6xRollins, Inc. ROL $24.55 96% $3,589 $3,506 $1,281 $626 $214 48.9% 16.7% 2.7x 16.4xSims Metal Management, Ltd. ASX:SGM $10.45 66% $2,141 $2,415 $8,191 $713 $130 8.7% 1.6% 0.3x 18.6xTetra Tech, Inc. TTEK $30.49 97% $1,961 $1,960 $1,998 $362 $211 18.1% 10.5% 1.0x 9.3xSchnitzer Steel Industries, Inc. SCHN $26.67 64% $722 $1,119 $2,897 $234 $123 8.1% 4.3% 0.4x 9.1xCasella Waste Systems, Inc. CWST $4.37 64% $135 $631 $466 $134 $75 28.7% 16.2% 1.4x 8.4x
Average 88% $5,308 $7,565 $4,016 $1,174 $755 31.4% 18.8% 2.2x 12.0x
Median 97% $3,141 $4,306 $1,998 $651 $371 34.8% 16.9% 2.1x 11.6x
Enterprise Value /LTM LTM Margins LTM
Closing Price % of 52 Equity EnterpriseCompany Ticker 3/28/13 Week High Value Value Revenue Gross Profit EBITDA Gross Profit EBITDA Revenue EBITDAIron Mountain, Inc. IRM $36.31 96% $6,530 $10,163 $3,006 $1,723 $872 57.3% 29.0% 3.4x 11.7xCintas Corp. CTAS $44.13 96% $5,559 $6,623 $4,241 $1,765 $735 41.6% 17.3% 1.6x 9.0xPitney Bowes, Inc. PBI $14.86 83% $3,004 $6,387 $4,851 $2,413 $962 49.7% 19.8% 1.3x 6.6xKAR Auction Services, Inc. KAR $20.03 90% $2,793 $5,873 $2,014 $865 $459 42.9% 22.8% 2.9x 12.8xAvery Dennison Corp. AVY $43.07 99% $4,407 $5,557 $6,092 $1,602 $623 26.3% 10.2% 0.9x 8.9xR.R. Donnelley & Sons Co. RRD $12.05 91% $2,179 $5,423 $10,236 $2,311 $1,213 22.6% 11.9% 0.5x 4.5xCorrections Corp. of America CXW $39.07 99% $3,931 $4,980 $1,760 $508 $419 28.8% 23.8% 2.8x 11.9xCopart, Inc. CPRT $34.27 91% $4,441 $4,803 $976 $436 $337 44.7% 34.5% 4.9x 14.3xRitchie Bros. Auctioneers, Inc. RBA $21.70 90% $2,320 $2,518 $439 $390 $156 88.9% 35.4% 5.7x 16.2xUnited Stationers, Inc. USTR $38.65 98% $1,567 $2,084 $5,059 $782 $246 15.5% 4.9% 0.4x 8.5xThe Brink's Co. BCO $28.26 92% $1,378 $1,724 $3,879 $705 $296 18.2% 7.6% 0.4x 5.8xHerman Miller, Inc. MLHR $27.67 99% $1,624 $1,666 $1,736 $593 $153 34.1% 8.8% 1.0x 10.9x
Average 94% $3,311 $4,817 $3,691 $1,174 $539 39.2% 18.8% 2.2x 10.1x
Median 94% $2,899 $5,202 $3,442 $824 $439 37.9% 18.6% 1.4x 9.9x
Enterprise Value /LTM LTM Margins LTM
HYDE PARK CAPITALInvestment Banking | Mergers & Acquisitions | Capital Raising
Industry Sector Overview – Public Company Analysis
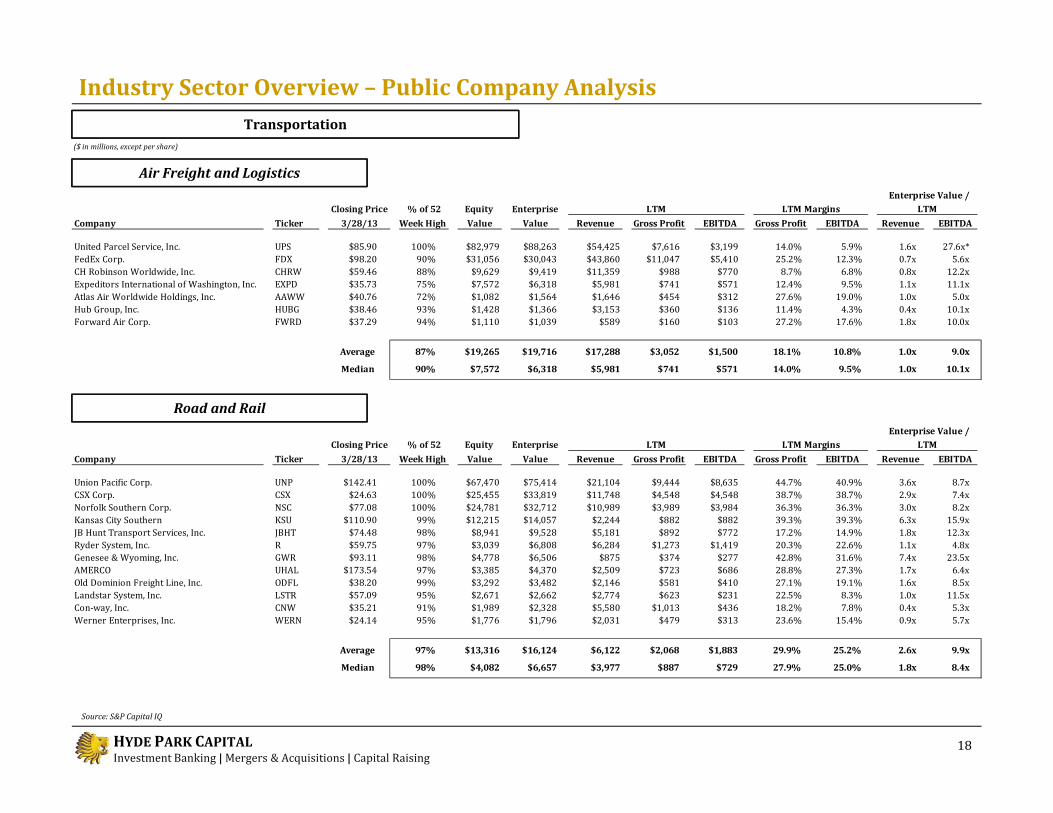
Air Freight and Logistics
($ in millions, except per share)
18
Transportation
Road and Rail
Source: S&P Capital IQ
Closing Price % of 52 Equity EnterpriseCompany Ticker 3/28/13 Week High Value Value Revenue Gross Profit EBITDA Gross Profit EBITDA Revenue EBITDAUnited Parcel Service, Inc. UPS $85.90 100% $82,979 $88,263 $54,425 $7,616 $3,199 14.0% 5.9% 1.6x 27.6x*FedEx Corp. FDX $98.20 90% $31,056 $30,043 $43,860 $11,047 $5,410 25.2% 12.3% 0.7x 5.6xCH Robinson Worldwide, Inc. CHRW $59.46 88% $9,629 $9,419 $11,359 $988 $770 8.7% 6.8% 0.8x 12.2xExpeditors International of Washington, Inc. EXPD $35.73 75% $7,572 $6,318 $5,981 $741 $571 12.4% 9.5% 1.1x 11.1xAtlas Air Worldwide Holdings, Inc. AAWW $40.76 72% $1,082 $1,564 $1,646 $454 $312 27.6% 19.0% 1.0x 5.0xHub Group, Inc. HUBG $38.46 93% $1,428 $1,366 $3,153 $360 $136 11.4% 4.3% 0.4x 10.1xForward Air Corp. FWRD $37.29 94% $1,110 $1,039 $589 $160 $103 27.2% 17.6% 1.8x 10.0x
Average 87% $19,265 $19,716 $17,288 $3,052 $1,500 18.1% 10.8% 1.0x 9.0x
Median 90% $7,572 $6,318 $5,981 $741 $571 14.0% 9.5% 1.0x 10.1x
LTMEnterprise Value /
LTM Margins LTM
Closing Price % of 52 Equity EnterpriseCompany Ticker 3/28/13 Week High Value Value Revenue Gross Profit EBITDA Gross Profit EBITDA Revenue EBITDAUnion Pacific Corp. UNP $142.41 100% $67,470 $75,414 $21,104 $9,444 $8,635 44.7% 40.9% 3.6x 8.7xCSX Corp. CSX $24.63 100% $25,455 $33,819 $11,748 $4,548 $4,548 38.7% 38.7% 2.9x 7.4xNorfolk Southern Corp. NSC $77.08 100% $24,781 $32,712 $10,989 $3,989 $3,984 36.3% 36.3% 3.0x 8.2xKansas City Southern KSU $110.90 99% $12,215 $14,057 $2,244 $882 $882 39.3% 39.3% 6.3x 15.9xJB Hunt Transport Services, Inc. JBHT $74.48 98% $8,941 $9,528 $5,181 $892 $772 17.2% 14.9% 1.8x 12.3xRyder System, Inc. R $59.75 97% $3,039 $6,808 $6,284 $1,273 $1,419 20.3% 22.6% 1.1x 4.8xGenesee & Wyoming, Inc. GWR $93.11 98% $4,778 $6,506 $875 $374 $277 42.8% 31.6% 7.4x 23.5xAMERCO UHAL $173.54 97% $3,385 $4,370 $2,509 $723 $686 28.8% 27.3% 1.7x 6.4xOld Dominion Freight Line, Inc. ODFL $38.20 99% $3,292 $3,482 $2,146 $581 $410 27.1% 19.1% 1.6x 8.5xLandstar System, Inc. LSTR $57.09 95% $2,671 $2,662 $2,774 $623 $231 22.5% 8.3% 1.0x 11.5xCon-way, Inc. CNW $35.21 91% $1,989 $2,328 $5,580 $1,013 $436 18.2% 7.8% 0.4x 5.3xWerner Enterprises, Inc. WERN $24.14 95% $1,776 $1,796 $2,031 $479 $313 23.6% 15.4% 0.9x 5.7x
Average 97% $13,316 $16,124 $6,122 $2,068 $1,883 29.9% 25.2% 2.6x 9.9x
Median 98% $4,082 $6,657 $3,977 $887 $729 27.9% 25.0% 1.8x 8.4x
LTMEnterprise Value /
LTM Margins LTM
HYDE PARK CAPITALInvestment Banking | Mergers & Acquisitions | Capital Raising
Industry Sector Overview – Public Company Analysis
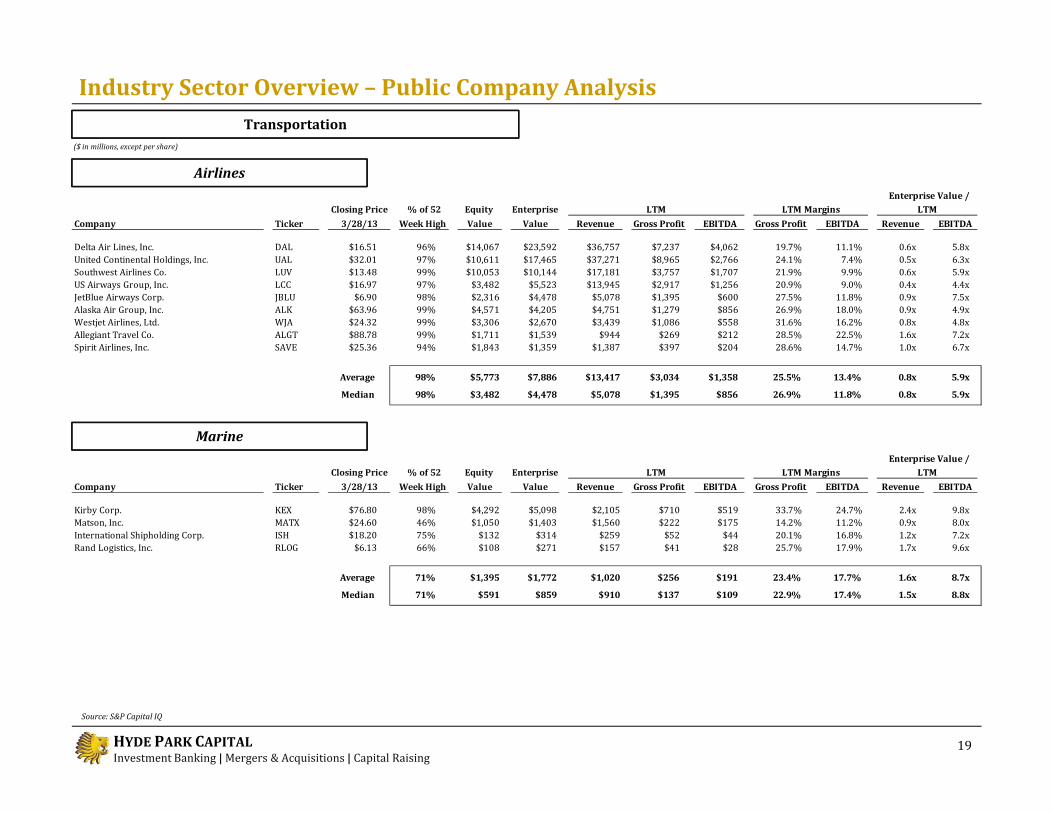
Airlines
($ in millions, except per share)
19
Transportation
Marine
Source: S&P Capital IQ
Closing Price % of 52 Equity EnterpriseCompany Ticker 3/28/13 Week High Value Value Revenue Gross Profit EBITDA Gross Profit EBITDA Revenue EBITDADelta Air Lines, Inc. DAL $16.51 96% $14,067 $23,592 $36,757 $7,237 $4,062 19.7% 11.1% 0.6x 5.8xUnited Continental Holdings, Inc. UAL $32.01 97% $10,611 $17,465 $37,271 $8,965 $2,766 24.1% 7.4% 0.5x 6.3xSouthwest Airlines Co. LUV $13.48 99% $10,053 $10,144 $17,181 $3,757 $1,707 21.9% 9.9% 0.6x 5.9xUS Airways Group, Inc. LCC $16.97 97% $3,482 $5,523 $13,945 $2,917 $1,256 20.9% 9.0% 0.4x 4.4xJetBlue Airways Corp. JBLU $6.90 98% $2,316 $4,478 $5,078 $1,395 $600 27.5% 11.8% 0.9x 7.5xAlaska Air Group, Inc. ALK $63.96 99% $4,571 $4,205 $4,751 $1,279 $856 26.9% 18.0% 0.9x 4.9xWestjet Airlines, Ltd. WJA $24.32 99% $3,306 $2,670 $3,439 $1,086 $558 31.6% 16.2% 0.8x 4.8xAllegiant Travel Co. ALGT $88.78 99% $1,711 $1,539 $944 $269 $212 28.5% 22.5% 1.6x 7.2xSpirit Airlines, Inc. SAVE $25.36 94% $1,843 $1,359 $1,387 $397 $204 28.6% 14.7% 1.0x 6.7x
Average 98% $5,773 $7,886 $13,417 $3,034 $1,358 25.5% 13.4% 0.8x 5.9x
Median 98% $3,482 $4,478 $5,078 $1,395 $856 26.9% 11.8% 0.8x 5.9x
Enterprise Value /LTM LTM Margins LTM
Closing Price % of 52 Equity EnterpriseCompany Ticker 3/28/13 Week High Value Value Revenue Gross Profit EBITDA Gross Profit EBITDA Revenue EBITDAKirby Corp. KEX $76.80 98% $4,292 $5,098 $2,105 $710 $519 33.7% 24.7% 2.4x 9.8xMatson, Inc. MATX $24.60 46% $1,050 $1,403 $1,560 $222 $175 14.2% 11.2% 0.9x 8.0xInternational Shipholding Corp. ISH $18.20 75% $132 $314 $259 $52 $44 20.1% 16.8% 1.2x 7.2xRand Logistics, Inc. RLOG $6.13 66% $108 $271 $157 $41 $28 25.7% 17.9% 1.7x 9.6x
Average 71% $1,395 $1,772 $1,020 $256 $191 23.4% 17.7% 1.6x 8.7x
Median 71% $591 $859 $910 $137 $109 22.9% 17.4% 1.5x 8.8x
Enterprise Value /LTM LTM Margins LTM
HYDE PARK CAPITALInvestment Banking | Mergers & Acquisitions | Capital Raising
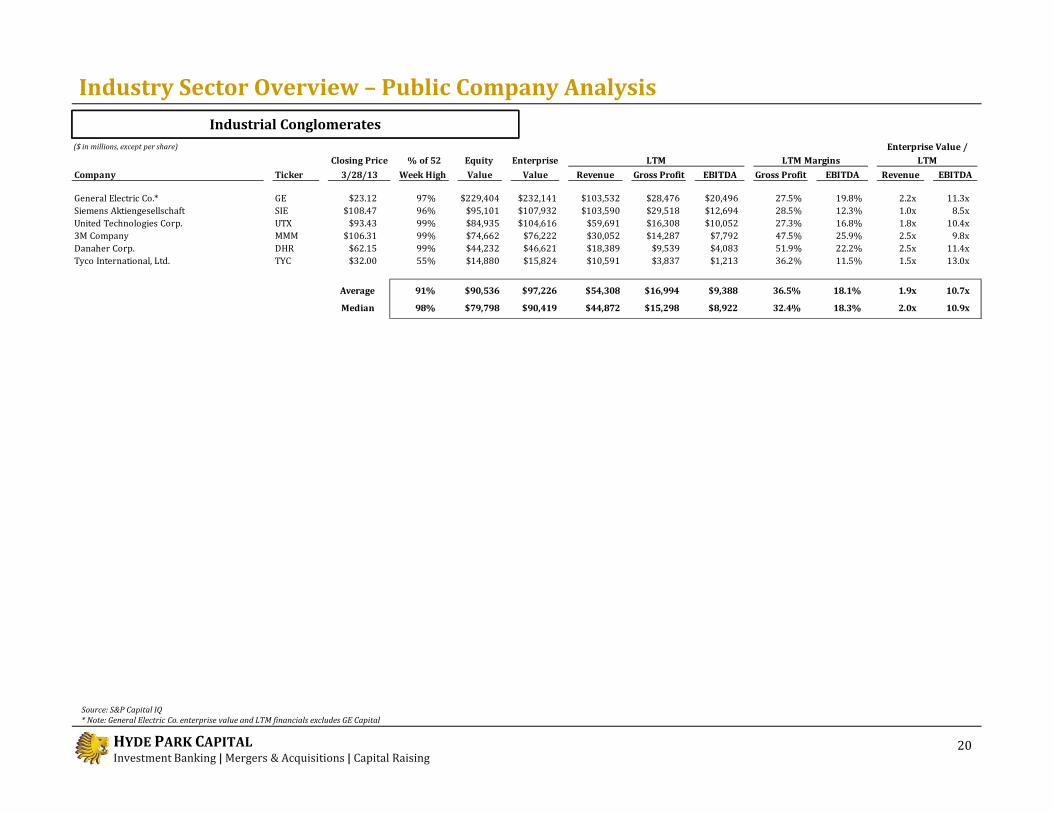
Industry Sector Overview – Public Company Analysis
($ in millions, except per share)
20
Industrial Conglomerates
Source: S&P Capital IQ* Note: General Electric Co. enterprise value and LTM financials excludes GE Capital
Closing Price % of 52 Equity EnterpriseCompany Ticker 3/28/13 Week High Value Value Revenue Gross Profit EBITDA Gross Profit EBITDA Revenue EBITDAGeneral Electric Co.* GE $23.12 97% $229,404 $232,141 $103,532 $28,476 $20,496 27.5% 19.8% 2.2x 11.3xSiemens Aktiengesellschaft SIE $108.47 96% $95,101 $107,932 $103,590 $29,518 $12,694 28.5% 12.3% 1.0x 8.5xUnited Technologies Corp. UTX $93.43 99% $84,935 $104,616 $59,691 $16,308 $10,052 27.3% 16.8% 1.8x 10.4x3M Company MMM $106.31 99% $74,662 $76,222 $30,052 $14,287 $7,792 47.5% 25.9% 2.5x 9.8xDanaher Corp. DHR $62.15 99% $44,232 $46,621 $18,389 $9,539 $4,083 51.9% 22.2% 2.5x 11.4xTyco International, Ltd. TYC $32.00 55% $14,880 $15,824 $10,591 $3,837 $1,213 36.2% 11.5% 1.5x 13.0x
Average 91% $90,536 $97,226 $54,308 $16,994 $9,388 36.5% 18.1% 1.9x 10.7x
Median 98% $79,798 $90,419 $44,872 $15,298 $8,922 32.4% 18.3% 2.0x 10.9x
Enterprise Value /LTM LTM Margins LTM
HYDE PARK CAPITALInvestment Banking | Mergers & Acquisitions | Capital Raising
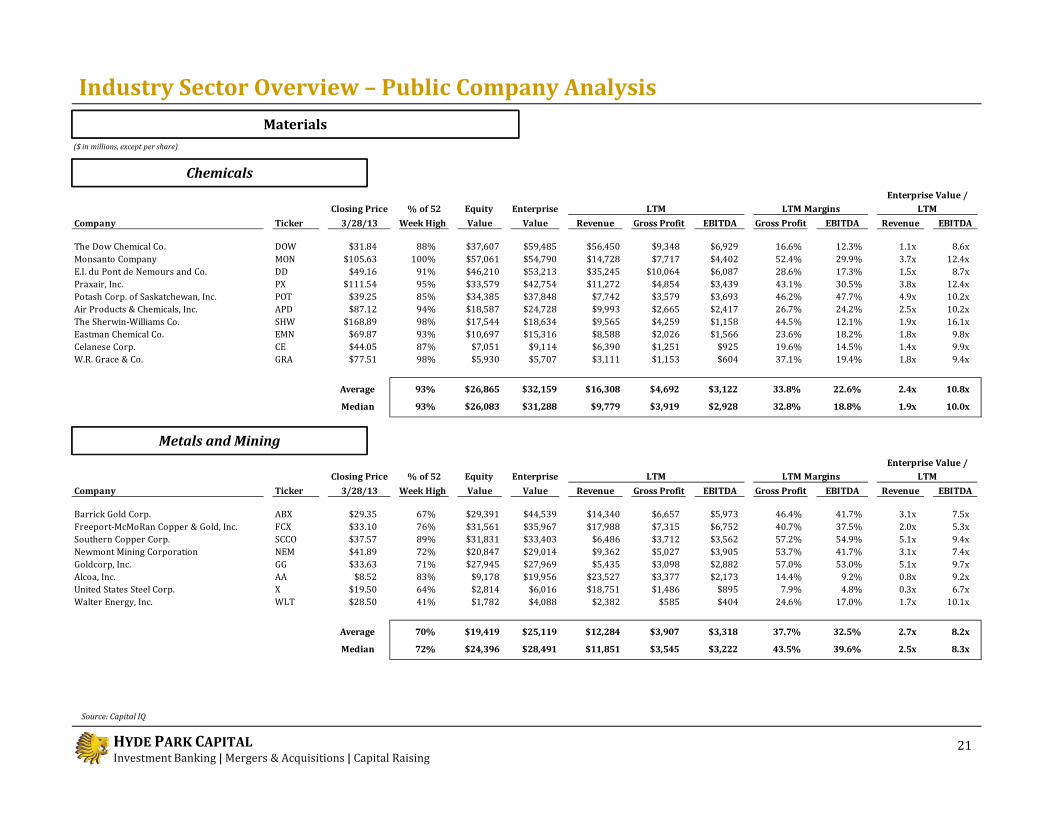
Industry Sector Overview – Public Company Analysis
21Source: Capital IQ
Materials($ in millions, except per share)
Chemicals
Metals and Mining
Closing Price % of 52 Equity EnterpriseCompany Ticker 3/28/13 Week High Value Value Revenue Gross Profit EBITDA Gross Profit EBITDA Revenue EBITDAThe Dow Chemical Co. DOW $31.84 88% $37,607 $59,485 $56,450 $9,348 $6,929 16.6% 12.3% 1.1x 8.6xMonsanto Company MON $105.63 100% $57,061 $54,790 $14,728 $7,717 $4,402 52.4% 29.9% 3.7x 12.4xE.I. du Pont de Nemours and Co. DD $49.16 91% $46,210 $53,213 $35,245 $10,064 $6,087 28.6% 17.3% 1.5x 8.7xPraxair, Inc. PX $111.54 95% $33,579 $42,754 $11,272 $4,854 $3,439 43.1% 30.5% 3.8x 12.4xPotash Corp. of Saskatchewan, Inc. POT $39.25 85% $34,385 $37,848 $7,742 $3,579 $3,693 46.2% 47.7% 4.9x 10.2xAir Products & Chemicals, Inc. APD $87.12 94% $18,587 $24,728 $9,993 $2,665 $2,417 26.7% 24.2% 2.5x 10.2xThe Sherwin-Williams Co. SHW $168.89 98% $17,544 $18,634 $9,565 $4,259 $1,158 44.5% 12.1% 1.9x 16.1xEastman Chemical Co. EMN $69.87 93% $10,697 $15,316 $8,588 $2,026 $1,566 23.6% 18.2% 1.8x 9.8xCelanese Corp. CE $44.05 87% $7,051 $9,114 $6,390 $1,251 $925 19.6% 14.5% 1.4x 9.9xW.R. Grace & Co. GRA $77.51 98% $5,930 $5,707 $3,111 $1,153 $604 37.1% 19.4% 1.8x 9.4x
Average 93% $26,865 $32,159 $16,308 $4,692 $3,122 33.8% 22.6% 2.4x 10.8x
Median 93% $26,083 $31,288 $9,779 $3,919 $2,928 32.8% 18.8% 1.9x 10.0x
Enterprise Value /LTM LTM Margins LTM
Closing Price % of 52 Equity EnterpriseCompany Ticker 3/28/13 Week High Value Value Revenue Gross Profit EBITDA Gross Profit EBITDA Revenue EBITDABarrick Gold Corp. ABX $29.35 67% $29,391 $44,539 $14,340 $6,657 $5,973 46.4% 41.7% 3.1x 7.5xFreeport-McMoRan Copper & Gold, Inc. FCX $33.10 76% $31,561 $35,967 $17,988 $7,315 $6,752 40.7% 37.5% 2.0x 5.3xSouthern Copper Corp. SCCO $37.57 89% $31,831 $33,403 $6,486 $3,712 $3,562 57.2% 54.9% 5.1x 9.4xNewmont Mining Corporation NEM $41.89 72% $20,847 $29,014 $9,362 $5,027 $3,905 53.7% 41.7% 3.1x 7.4xGoldcorp, Inc. GG $33.63 71% $27,945 $27,969 $5,435 $3,098 $2,882 57.0% 53.0% 5.1x 9.7xAlcoa, Inc. AA $8.52 83% $9,178 $19,956 $23,527 $3,377 $2,173 14.4% 9.2% 0.8x 9.2xUnited States Steel Corp. X $19.50 64% $2,814 $6,016 $18,751 $1,486 $895 7.9% 4.8% 0.3x 6.7xWalter Energy, Inc. WLT $28.50 41% $1,782 $4,088 $2,382 $585 $404 24.6% 17.0% 1.7x 10.1x
Average 70% $19,419 $25,119 $12,284 $3,907 $3,318 37.7% 32.5% 2.7x 8.2x
Median 72% $24,396 $28,491 $11,851 $3,545 $3,222 43.5% 39.6% 2.5x 8.3x
Enterprise Value /LTM LTM Margins LTM
HYDE PARK CAPITALInvestment Banking | Mergers & Acquisitions | Capital Raising
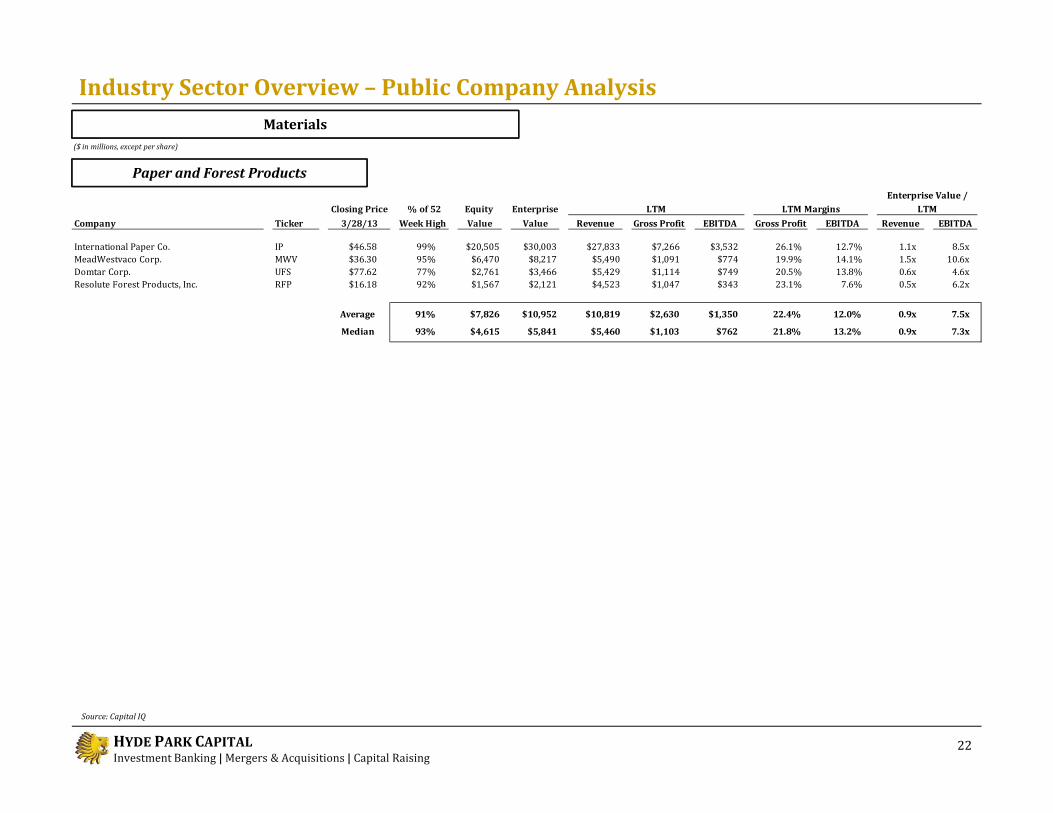
Industry Sector Overview – Public Company Analysis
22Source: Capital IQ
Materials($ in millions, except per share)
Paper and Forest Products
Closing Price % of 52 Equity EnterpriseCompany Ticker 3/28/13 Week High Value Value Revenue Gross Profit EBITDA Gross Profit EBITDA Revenue EBITDAInternational Paper Co. IP $46.58 99% $20,505 $30,003 $27,833 $7,266 $3,532 26.1% 12.7% 1.1x 8.5xMeadWestvaco Corp. MWV $36.30 95% $6,470 $8,217 $5,490 $1,091 $774 19.9% 14.1% 1.5x 10.6xDomtar Corp. UFS $77.62 77% $2,761 $3,466 $5,429 $1,114 $749 20.5% 13.8% 0.6x 4.6xResolute Forest Products, Inc. RFP $16.18 92% $1,567 $2,121 $4,523 $1,047 $343 23.1% 7.6% 0.5x 6.2x
Average 91% $7,826 $10,952 $10,819 $2,630 $1,350 22.4% 12.0% 0.9x 7.5x
Median 93% $4,615 $5,841 $5,460 $1,103 $762 21.8% 13.2% 0.9x 7.3x
Enterprise Value /LTM LTM Margins LTM
HYDE PARK CAPITALInvestment Banking | Mergers & Acquisitions | Capital RaisingMember FINRA/SIPC
Recent Transactions
HYDE PARK CAPITAL Investment Banking | Mergers & Acquisitions | Capital RaisingIntegrity | Expertise | Results
Hyde Park Capital Advisors, LLC701 N. Franklin StreetTampa, FL 33602Tel: 813-383-0202www.hydeparkcapital.com
John Hill Senior Managing Director [email protected](813) 383-0205John McDonaldSenior Managing [email protected](813) 383-0206Keith HodgdonSenior Vice [email protected](813) 383-0208Jeffrey Bridge Vice President [email protected](813) 383-0204Michael [email protected](813) 597-2649Jennifer [email protected](813) 383-0203