Embed Size (px)
Citation preview

Industrial Tariff Liberalization and the Doha Development Agenda
Marc Bacchetta* and Bijit Bora*
COUNSELLORS
DEVELOPMENT AND ECONOMIC RESEARCH DIVISION
World Trade Organization
Geneva, Switzerland
* We are grateful to seminar participants at the WTO Tariff Seminar and the World Bank Research Seminar for helpful comments and to Aki Kuwahara, Michael Finger, Daniel Morales, Jurgen Richtering and Zheng Wang for their assistance.

This paper is only available in English – Price CHF 20.-
To order, please contact:
WTO Publications Centre William Rappard 154 rue de Lausanne
CH-1211 Geneva Switzerland Tel: (41 22) 739 5208/5308
Fax (41 22) 739 57 92 Website: www.wto.org E-mail: [email protected]
ISSN 1726-9466 ISBN 92-870-1231-8
Printed by the WTO Secretariat II-2003, 1,000
© World Trade Organization, 2003. Reproduction of material contained in this document may be made only with written permission of the WTO Publications Manager.
With written permission of the WTO Publications Manager, reproduction and use of the material contained in this document for non-commercial educational and training purposes is encouraged. WTO Discussion Papers are presented by the authors in a personal capacity and should not in any way be interpreted as reflecting the views of the World Trade Organization or its Members.

ABSTRACT
The negotiating mandate for the Doha Development Agenda is both broad and comprehensive. This paper focuses on the basic mandate given to negotiators in the area of tariffs and trade in industrial products. With respect to developed country markets the key issue is how to tackle the residual protection arising from low overall levels of protection. We have identified a number of products at the 4-digit level of the HS system where issues of peaks and escalation need to be addressed. For developing countries there are two issues – their high levels of tariffs and the limited coverage of bindings for some Members. These, however, do not preclude problems of peaks and escalation such as those that we have identified in developed country markets. Finally, for LDCs the issues are the degree of effective non-reciprocal market access granted by developed countries, and the very high levels of protection they face in developing country markets, and the role that high levels of protection are playing as industry policy instruments in their own economies.


TABLE OF CONTENTS
I. INTRODUCTION..................................................................................................................................................... 1 II. THE PARTICIPATION OF DEVELOPING COUNTRIES IN THE CHANGING
STRUCTURE OF WORLD TRADE..................................................................................................................... 2
A. GROWTH OF IMPORT MARKETS AND MARKET SHARES ........................................................................... 2
B. DEVELOPING COUNTRIES' EXPORT GROWTH................................................................................................ 3
III. MARKET ACCESS: UNFINISHED BUSINESS............................................................................................... 5 IV. THE CURRENT SITUATION ............................................................................................................................... 6
A. GENERAL LANDSCAPE..................................................................................................................................... 6
B. SECTOR SPECIFIC LANDSCAPE........................................................................................................................ 8
1. Fish and fish products..................................................................................................................................8
2. Leather, rubber, footwear and travel goods ..........................................................................................8
3. Textiles and clothing ....................................................................................................................................8
4. Transport equipment...................................................................................................................................9
V. LEAST DEVELOPED COUNTRIES ................................................................................................................. 11 VI. CONCLUSIONS...................................................................................................................................................... 12 VII. REFERENCES......................................................................................................................................................... 13
ANNEX 1: CORRESPONDENCE BETWEEN MTN CATEGORIES CONSIDERED IN THIS PAPER AND THE HS96 NOMENCLATURE AT THE 4-DIGIT LEVEL AND DESCRIPTION OF HS96 4-DIGIT SUBGROUPS.......................................................................................... 38

LIST OF TABLES AND CHARTS
Table 1 Merchandise exports of developing countries by destination, 1990 - 2000 .................................................... 14 Table 2 Bound tariffs on industrial products. Scope of bindings, simple averages, standard deviations and tariff peaks ......................................................................................................................................................................... 15 Table 3 Bound tariffs on industrial products. Simple averages by country and MTN category................................ 16 Table 4 Bound tariffs on industrial products. Tariff peaks (share of tariff lines above 15% by country and MTN category) ................................................................................................................................................................. 17 Table 5 Bound tariffs on industrial products. Scope of bindings by country and MTN category............................. 18 Table 6 Distribution of binding coverage in Africa, Asia and Latin America .............................................................. 19 Table 7 Applied tariffs on industrial products. Simple averages by country and MTN category ............................. 20 Table 8 Applied tariffs on industrial products. Tariff peaks (share of tariff lines above 15% by country and MTN category) ................................................................................................................................................................. 21 Table 9 Applied tariffs on industrial products. Share of non ad valorem tariff lines with no ad valorem equivalent.................................................................................................................................................................................. 22 Table 10 Simple average applied tariffs of fish and fish products .................................................................................. 23 Table 11 Applied average tariffs on live, fresh, chilled or frozen crustaceans (0306) and prepared or preserved crustaceans (1605) ............................................................................................................................................ 24 Table 12 Leather, rubber and footwear: simple average of applied tariffs .................................................................... 25 Table 13 Tariffs on leather (4101), leather clothing accessories (4203) and leather footwear (6403) ..................... 26 Table 14 Tariff escalation on textile products: applied tariffs on textile and clothing products................................ 27 Table 15 Structure and Protection in Quad countries facing LDC exports, 1999 ........................................................ 28 Table 16 Value of duty-free non-oil and non-arm imports into developed countries originating from LDCs, 2000 ............................................................................................................................................................................... 29 Chart 1 Share of world exports by type of commodity, 1980-2000................................................................................ 29 Chart 2 Share of developing countries in merchandise imports of selected markets, 1990-2000 ............................. 30 Chart 3 Overview of Market Access.................................................................................................................................... 30 Chart 4 Fish and fish products: imports of Quad countries fro m developing countries, 2000 (million dollars)..... 31 Chart 5 Transport equipment: average applied tariffs in Canada, the European Union and the United States....... 32
Chart 6 Average applied tariffs on parts of bicycles (8714) and bicycles (8712) ........................................................ 32 Annex Table 1 Merchandise export expansion by region and level of technology, 1980-2000................................ 33 Annex Table 2 Merchandise import expansion by region and level of technology, 1980-2000................................ 33 Annex Chart 1 Share of primary products in Latin-American countries’ merchandise exports, 1968-70 and 1998-2000 .......................................................................................................................................................................... 34 Annex Chart 2 Share of primary products in African countries’ merchandise exports, 1968-70 and 1998-2000. 35 Annex Chart 3 Share of primary products in the Middle East countries’ merchandise exports, 1968-70 and 1998-2000 .......................................................................................................................................................................... 36 Annex Chart 4 Share of primary products in developing Asian economies’ merchandise exports, 1968-70 and 1998-2000 .......................................................................................................................................................... 37

1
I. INTRODUCTION
While WTO Members had made an explicit commitment to launch negotiations on trade in services and agricultural products before the year 2000, they had made no commitment regarding the continuation of negotiations in the area of market access for non-agricultural products. The Work Programme agreed upon at the Doha Ministerial Meeting changes the situation, by adding negotiations on non-agricultural market access.
The Doha Ministerial Declaration1 states that the negotiations should aim in particular at the reduction or elimination of tariff peaks, high tariffs, and tariff escalation, in particular on products of export interest to developing countries, that product coverage shall be comprehensive and without a priori exclusions. The Declaration also states that the agreed negotiation modalities will include appropriate studies and capacity building measures to assist least-developed countries to participate effectively in the negotiations.
Several recently published studies have provided a partial overview of the post-Uruguay Round non-industrial tariff landscape.2 They all reach the same general conclusions regarding the current market access situation. First, developed countries have bound all or most of their non-agricultural tariffs. Second, on average, their bindings are low but certain products, such as textiles and clothing, leather and footwear or fish and fish products, stand out as having higher tariffs than others, with a higher tariff dispersion, tariff escalation and tariff peaks. These peaks and high tariffs affect particularly developing and least developed countries as they protect products which are of
1 Paragraph 16 of the declaration states: “We agree to negotiations which shall aim, by modalities to be agreed, to reduce or as appropriate eliminate tariffs, including the reduction or elimination of tariff peaks, high tariffs, and tariff escalation, as well as non-tariff barriers, in particular on products of export interest to developing countries. Product coverage shall be comprehensive and without a priori exclusions. The negotiations shall take fully into account the special needs and interests of developing and least-developed country participants, including through less than full reciprocity in reduction commitments, in accordance with the relevant provisions of Article XXVIII bis of GATT 1994 and the provisions cited in paragraph 50 below. To this end, the modalities to be agreed will include appropriate studies and capacity-building measures to assist least-developed countries to participate effectively in the negotiations.” 2 See for instance Bacchetta and Bora (2001), Cernat, Laird and Turrini (2002), Finger, Ingco and Rheincke (1996), OECD (1999), Supper (2001), UNCTAD (1998), UNCTAD and WTO (2000) and WTO (2001).
particular export interest to developing countries. Third, most developing countries have either bound their tariffs at relatively high levels or they have bound only a limited number of tariff lines. Fourth, developing countries' applied tariff rates, however, are often far below their bound levels. Fifth, least developed countries (LDCs) benefit from preferences granted by developed countries. But developed countries also grant preferences to certain developing countries and to other developed countries as part of regional trade agreements.
This paper aims at further clarifying the current tariff landscape and in particular the situation regarding non-preferential tariffs. It builds upon past results and elaborates on three specific areas. 1. The residual protection in developed country markets in the form of peaks and escalation. 2. The high level of tariffs in developing countries and in some regions the limited coverage of tariff bindings. 3. The least developed countries and their need for more effective non-reciprocal market access. This, of course, is combined with the fact that as a group these countries have very low levels of bindings.
Section 2 analyzes the longer term developments of developing countries’ participation in the trading system. Section 3 focuses on the share of bound duty-free imports in total imports. Section 4 then looks at developed and emerging countries' tariffs, focusing on the four sectors where the higher tariffs are concentrated: textiles and clothing, leather, rubber and footwear, transport equipment and fish and fish products. Tariff and trade data at a fairly disaggregated level confirm that tariff peaks affect those sectors and that the level of tariffs increases with the level of processing of the products. Section 5 exa mines the situation of Least Developed Countries.

2
II. THE PARTICIPATION OF DEVELOPING COUNTRIES IN THE CHANGING STRUCTURE OF WORLD TRADE
The volume, value and structure of world merchandise trade have changed significantly over the past two decades. In this section these changes are examined, especially in the context of developing countries. For ease of analysis world trade has been divided into five categories. These are: primary products, resource-based products and low, medium and high technology products.3
In 1980 the largest components of world trade were primary products and medium technology manufactures (chart 1). By 2000, however, primary products were the smallest component of world trade, being superseded dramatically by exports of high technology products. The latter accounted for more than a quarter of world exports in 2000, compared to only 10% in 1980. An interesting feature of the growth of world exports is that they are correlated with the level of technology. The highest growth rates were recorded in the high technology category, whereas the lowest manufacturing growth rate was in resource based manufactures. The lowest overall growth rate was in primary products, recording only a 3.2% growth rate.
A. GROWTH OF IMPORT MARKETS AND MARKET SHARES
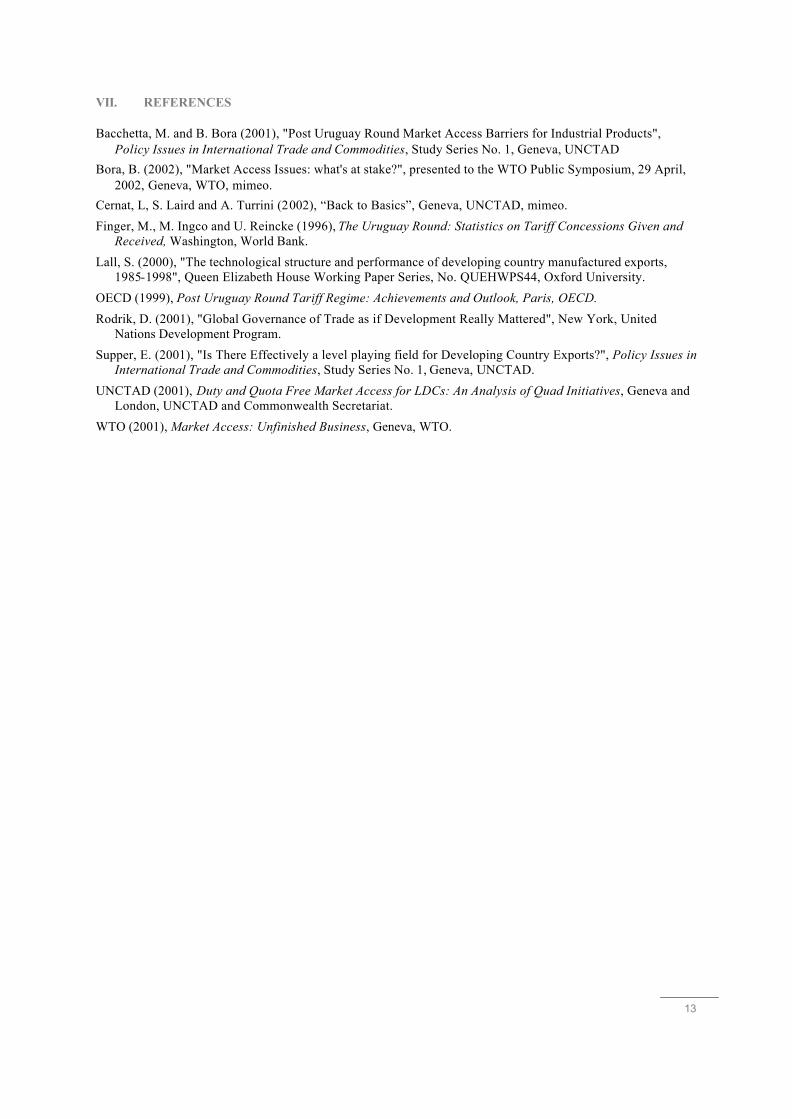
During the 1990s, the regions with above average import growth were Latin America, Developing Asia and North America, which recorded rates that range between 8.5% and 10.3%, or about two times faster than the expansion of imports into Western Europe or Japan. As regards market size, the North American and West European markets each accounted for slightly more than one quarter of developing country exports at the beginning of the 1990's. Japan’s imports from developing countries were slightly more than one half of those of the other two leading developed markets. Developing Asia accounted for 18.5% of developing country exports, whereas all other developing regions combined accounted for 9.4% of developing country exports (Table 1).
At the end of the decade differences in the regional import demand growth rates resulted in changes in, the relative share of regions in developing country exports. First, the share of Western Europe and Japan has decreased sharply (from a combined 39%
3 For product classification see Lall, S. (2000).
down to approximately 30% share) while there were corresponding increases of the shares of Developing Asia (8%), Latin America (1%) and North America (3%) over the 10 year period.
Developing country exports to Africa and the Middle East expanded less rapidly than the group's total exports, which eroded their importance as markets from slightly more than 5% in 1990 to slightly less than 5% in 2000. The increased share of Latin America and Developing Asia is due to deepening intra-regional integration. The contribution of dynamic intra-regional trade to market expansion was far more pronounced in Developing Asia than in Latin America. In the former region the share of intra-regional trade increased by 10 percentage points to nearly 38% while in Latin America intra-regional trade increased by only 2 percentage points. In both regions intra-regional trade growth became far less dynamic in the second half of the 1990s. In Latin America the share of intra-regional trade decreased significantly from its peak level in 1996, while for Developing Asia the intra-regional trade share stagnated between 1998 and 2000. Due to the repercussions of the Asian financial crisis the share of Developing Asia in developing country exports dropped temporarily to less than 25% in 1998, but recovered thereafter without reaching the 1995 peak level of 27.4%.
Turning to the market share of developing countries in merchandise imports of selected regions, there was a distinct upward trend in all markets between 1990 and 2000. In developed country markets, the share of developing countries in total merchandise imports was the highest in Japan, followed by North America and Western Europe. The rise in the share of developing countries was more pronounced in Japan and North America than in Western Europe. The marked dip in the upward trend of the developing countries' share in developed (but also in developing) markets in 1998 is largely due to the steep decline of petroleum prices and the contraction of imports of Developing Asia during the Asian financial crisis in that year. When the East Asian economies recovered and petroleum prices increased again in 1999 and 2000, the share of the developing countries returned to its rising trend line.
The share of developing countries in developing country imports at 41% exceeded that in the

3
developed regions (even if EU intra-trade is excluded) and reached a record peak in 2000 (Chart 2). While the share of developing countries increased in imports of all four developing regions, the share is particularly large in Developing Asia. Almost one half of the region's imports originated from other developing countries. As regards the imports of the Middle East and Africa, a marked increase in the share of developing countries could be observed. In 2000, the share of developing countries in these two regions exceeded the corresponding share in Latin America, which after an increase in the first half of the 1990's, eroded in the second half. The evolution of the developing country share in Latin America was affected by the predominant role of Mexico in the region's imports (47% in 2000) and its membership in NAFTA.
There is a clear increasing trend in the share of the developing countries in world trade and in all major developed and developing markets. The trend, however, masks wide disparities among the developing country regions and even more so among individual developing countries. These will now be investigated in more detail.
As indicated above, the expansion of developing country exports and imports rose in the 1990s much faster than world trade (9% versus 6% at annual rates). As a consequence the share of developing countries in 2000, at just over 30%, reached its highest level in more than two decades. Particularly buoyant trade expansion over the last decade can be observed for Developing Asia and Latin America. In the latter region, the strong overall growth can be largely attributed to Mexico. Excluding Mexico, the growth of Latin America's exports matches that of world trade, although imports remained more dynamic than world imports. Among the countries in Developing Asia, China and a group of the four4 more advanced developing economies accounted for a large part of the region's gains in the share of world merchandise trade.
Two salient features of this growth are the role that developing countries have played as drivers of the changing structure of exports, and their increase in importance as markets for their own exports. The only product category where the growth rate of developing country exports and imports from 1980 to 2000 did not exceed that of developed countries was exports of primary products. In most cases the growth rates for developing countries were double
4 The group comprises Hong Kong, China; Korea, Republic of; Singapore and Chinese Taipei.
those of developed countries. It should be noted that this experience was not shared across all developing countries (Annex Tables 1 and 2).
B. DEVELOPING COUNTRIES' EXPORT GROWTH
The strong performance of the Developing Asia region biases the interpretation of aggregated results because of their share in developing country exports to the world (59% in 2000) and to developing countries (67%). Therefore, it is important to examine the performance of countries, as opposed to regions. Data were extracted for a sample of 144 developing countries. Two country groups stand out. One group, the dynamic traders, comprises all developing countries which had an export growth rate of 10% or more. The second group of countries comprises all those economies for which exports in 2000 were less than ten years ago.
Thirty-one developing countries, regarded as dynamic traders, recorded an expansion of their merchandise exports by more than 10% annually. Developing Asia comprised the largest number of dynamic exporters (15), followed by Africa (8) and Latin America and the Middle East (4 each). A large majority of these dynamic traders are exporters of manufactures (17), seven are oil exporters (of which four have increased sharply their share in world production) and five are exporting primarily non-fuel commodities. Ten least-developed countries are among this group of dynamic traders. In at least seven countries the expansion of export processing zones played a crucial role in the rapid export growth.
This positive picture contrasts significantly with the experience of 32 developing countries which exported less in the year 2000 than they did ten years ago. The majority of these countries are in Africa (16), followed by Latin America (9) and the Asia/Pacific region (7). In the Middle East region all countries recorded a higher level of exports in 2000 than in 1990. All these countries export primarily non-fuel commodities.
Another way to review the developing country experiences is to distinguish between those countries which report above and those which record below global average export growth. Out of 144 developing countries, 54 countries recorded an export expansion in excess of the global average growth rate of 6.4%, while 90 developing countries recorded below average growth. Despite the very strong trade expansion of Developing Asia and dynamic intra-regional trade growth, only about half of developing countries in Asia and the Pacific

4
region recorded an export growth rate equal to or exceeding the average global rate (21 out of 40). In Latin America a slight majority could be observed for traders with below average growth (23 to 16). The corresponding ratio was 8 to 6 in the Middle East. In Africa the number of countries with below average growth (40) exceeded those with above average export growth (11) by a wide margin.
One of the main exp lanatory factors for sluggish export growth in many developing countries is the product structure of their exports. Global trade expansion over the last 50 years has shown sharply different growth rates for non-fuel commodities, fuels and manufactured goods. The growth rate of manufactures exceeded that of the other two groups over the last 50 years. This trend can be observed for both developed and developing country exports. Consequently, the countries/regions which remained largely dependent on prima ry products for their export earnings experienced a moderate expansion of their markets, well below that of world trade.
While the share of primary commodities in total exports has fallen for all four developing regions, it is only in Developing Asia where the share of primary products accounts for less than 20%. In Africa and the Middle East, primary products still accounted for more than 70% of total merchandise exports in the year 2000. In Latin America, the share has fallen to about 40%, but if one excludes Mexico, primary products still account for about 60% of the other Latin American countries' exports.
The strong link between export structure and trade growth can also be shown at the country level. In Africa, the Middle East and Latin America, the number of primary commodity exporting countries by far exceeds exporters of manufactured goods. The reverse is true only in Asia.
The dark bars in annex charts 1 through 4 indicate the share of primary products in the exports of
certain developing countries in the years 1998-2000. The white bar in the charts indicates the corresponding share in the years 1968-70. The data presented in these charts indicate a strong reduction in the share of primary products in most developing countries. Only a few oil exporters have increased their share of primary commodities in total merchandise exports. The charts show that Africa and the Middle East have only a limited number of manufactured goods exporters, while in Asia the latter outnumber the exporters of primary products. Latin America is in an intermediate position, although in this region the number of exporters specializing in manufactured goods is still smaller than the number specializing in primary products.
The review of individual country experiences over the 1990s indicates considerable diversity in the degree of participation of developing countries in world trade. The difference between the more positive aggregate developments and the less favourable situation at a country level is due to the strong trade performance of the largest exporters among the developing countries. China, Mexico and the four more -advanced developing economies in Asia accounted for more than one half of total developing countries' merchandise exports. The value of exports of four of these countries individually exceeds the combined value of exports of more than 50 African countries.
Separating five Asian countries and Mexico from the other developing countries provides a clearer picture. These six countries alone account for more than one half of developing countries' merchandise trade and more than 80% of their manufactured goods exports. China has become the fourth largest trader in the world (if the EU is counted as a single trader) and its export value alone already exceeds that of Africa, the Middle East and even Latin America if Mexico is excluded. Given this concentration of developing country trade, disaggregated data are of paramount importance in understanding the development of trade in the majority of developing countries.

5
III. MARKET ACCESS: UNFINISHED BUSINESS
There are a number of ways to view the issue of market access, and the question of to what degree it is unfinished business. For example, Bora (2002) estimates that the share of world imports that enter markets duty free is 55%. This estimate includes imports that enter under most favoured nation (MFN) tariffs, preferential tariffs, including non-reciprocal arrangements. Using this figure as a benchmark one could interpret the issue of market access as being either more than 50% complete, or for some perhaps, work that progressed well beyond its usefulness to developing countries (Rodrik, 2001).
An alternative view of market access issues would be to place them within the institutional context of the degree to which tariff lines are bound at zero within the WTO. In that respect Bora’s (2002) 55% estimate of duty free trade was obtained using applied tariffs, not bound tariff rates, which are the instruments that are negotiated within the WTO. The pattern, coverage and distribution of bound tariffs can vary quite significantly from that of applied tariffs for a given Member, (WTO, 2001). Therefore, market access in the context of bound rates could be interpreted as not only duty free lines with applied rates at zero, but also lines that are bound at zero. Since this paper examines the issues confronting negotiators the primary focus will be on the institutional view, or bound rates, although we do discuss applied rates.
The first question addressed here is where do WTO Members stand with regard to their objective of achieving a substantial reduction of tariffs and eliminating discriminatory treatment in the area of non-agricultural tariffs. Two indicators are used to respond to that question. The first is the total number of MFN bound duty-free tariff lines for a sample of Members divided by the corresponding total number of lines.5 The second indicator is the value of imports under MFN bound duty-free tariff items for a sample of Members divided by the corresponding value of total imports.6
5 Bound duty-free lines were here defined as all those 6-digit HS subheadings for which all bound rates were duty-free. 6 The shares were calculated for a sample of 71 WTO Members for which trade data and bound rates were available. These countries account for about 80% of total world imports. The calculations are done at 6digit level.
Our overall result is that approximately 6% of the total number of non-agricultural items in our sample of WTO Members' tariff schedules are bound duty-free. This small number of duty-free items, even though they account for one third of the value of world trade in industrial products, confirms that there is still a lot to be done in multilateral tariff negotiations7.
For the first indicator, we found significant differences between developed and developing countries on the one hand and between different regions of the world on the other. The Quad countries in our sample have between one quarter and one half of their tariff items bound duty-free, which accounts for between 30 and 40% of their imports. Developing countries, with the exception of Hong Kong, China; Macao; China; Singapore; and the Republic of Korea have generally bound between zero and 5% of their items at zero. This limited number of duty-free lines accounts for up to 30% of non-agricultural imports in some cases.
In the case of bound duty-free import shares for individual countries, important differences between Members in developing Asia and in Latin America can be identified. The share of imports of bound duty-free items in total imports is on average about one third for newly-industrialized Asian economies while it is close to zero for most Latin American economies. This difference is partly linked to the fact that most Asian economies participate in the Information Technology Agreement while only three Latin American countries have signed this Agreement.
Combining these two indicators shows that the issue of market access for industrial products is can be considered unfinished business. However, where are the pressure points in the context of the current negotiations? Do these differ across Members? These two questions are examined in the next section.
7 For the most recent years.

6
IV. THE CURRENT SITUATION
In this section we take up the issue of market access across three broad classifications of markets: developed, developing and least developed countries. In the context of the first two groups, given the difficulties in examining data across all developed and developing Members, and the concentration of world imports, the approach that we have taken is to examine in detail market access into leading importers' markets. In 2000, the largest import markets accounting for a total of 85% of world imports were the Quad countries, followed by China; Hong Kong, China; Mexico, the Republic of Korea; Chinese Taipei; Singapore, Switze rland; Malaysia; Australia; Thailand; Brazil; Turkey; India and Poland. The framework that we shall use is based on the mandate provided by paragraph 16. The focus is on areas, which will require significant negotiating effort such as the coverage of tariff bindings, peaks, escalation and products of interest to developing countries.
A. GENERAL LANDSCAPE
Before proceeding with this analysis it should be noted that there are other measures beyond tariffs and non-tariff measures that may impede market access. One of these is the complicated structure of import regimes employed by some Members. Market access can be improved if import regimes are simple and transparent. In this regard, table 2 provides basic tariff statistics for 15 largest importers except China and Chinese Taipei for which comparable information is not available. The first column of table 2 indicates the number of tariff lines in the tariff schedule of various Members. The variance in the figures is quite surprising. Most Members have tariff schedules in the range of 5,000-8,000 lines, which is already quite significant. However, a few Members, such as Turkey, Malaysia, Mexico and Brazil have more than 10,000 lines. Turkey has triple the number of tariff lines than India.
A second indicator of simplicity and transparency is the percentage of lines that are non- ad valorem. The problems caused by non ad valorem lines in the agriculture sector are well known. In industrial products the stand out cases are Thailand with 19.7% of its lines as non ad valorem, and Switzerland with 82.8%. Japan, Malaysia and the United States also have some non ad valorem lines.
In terms of bindings, column 2 of table 2 shows that while developed countries have bound most of their tariffs, Turkey has bound far less than half of its tariff lines and several Asian countries have
only bound between 60 and 70% of their tariff lines. Except for Hong Kong, China and Singapore, developing countries also have a higher simple average bound tariff and more dispersion as measured by the standard deviation than the developed countries.
Column 3 of table 2 presents data in the context of measuring the openness and predictability of the trading system, in the context of tariffs. It indicates that the Quad Members have the largest share of bound duty-free lines. Japan leads the way with 47.4% followed by the United States (39.4%), Canada (34.5) and the European Union (26.9). Although Singapore and Hong Kong, China have bound less lines as a percentage when compared to Members of the Quad, this can be explained by the fact that they have a higher share of lines that are duty free. Hong Kong, China has more than three quarters of its lines duty free, while the comparable figure for Singapore is about 50%.
There is also a wide variance in the structure of tariffs for Members in our sample. The simple average bound rate for the Quad Members; Hong Kong, China; Singapore and Switzerland is less than 5.2%, although it should be pointed out that the figure for Switzerland does not take into account non ad valorem lines. The highest averages are in India and Turkey, which also have the highest standard deviations. Furthermore, when comparing their tariff structure and taking 15% as a benchmark, Members with high national averages also have a high percentage of lines above that benchmark. On the other hand, the Quad Members have both low averages and low percentages of lines above 15%.
While table 2 provides useful information in a general context it also masks a number of key issues both in the context of industrial policy and in multilateral negotiations. Therefore, the level of bindings is now examined at a more disaggregated level. Table 3 shows the simple average of bindings at the MTN category level.8 Four categories of products stand out as having higher tariff averages than the others in both developed and developing countries.9 Those are: textiles and clothing; leather, rubber, footwear and travel goods; transport equipment and fish and fish products. In
8 See WTO (2001) for definitions of the product categories. 9 These four categories also turn out to have the highest standard deviation and the highest share of high tariffs in most of our sample countries. See WTO (2001).

7
eight out of our 15 sample countries, textiles and clothing has the highest tariff average of all categories, while in four others, the highest average is in the fish and fish products category. Table 4 shows that those sectors are also the ones with the largest share of lines with bindings above 15%.
Table 5 shows that in several of the sample countries, the four sectors identified as having the highest bindings have lower shares of unbound tariffs. Several countries have bound only a limited proportion of lines in the transport equipment category. Thailand for instance has bound less than a quarter of its transport equipment lines. Similarly, in the textiles and clothing category, Turkey has bound only 11% and India 26% of tariff lines, while Poland has bound only 13% of the tariff lines in fish and fish products.
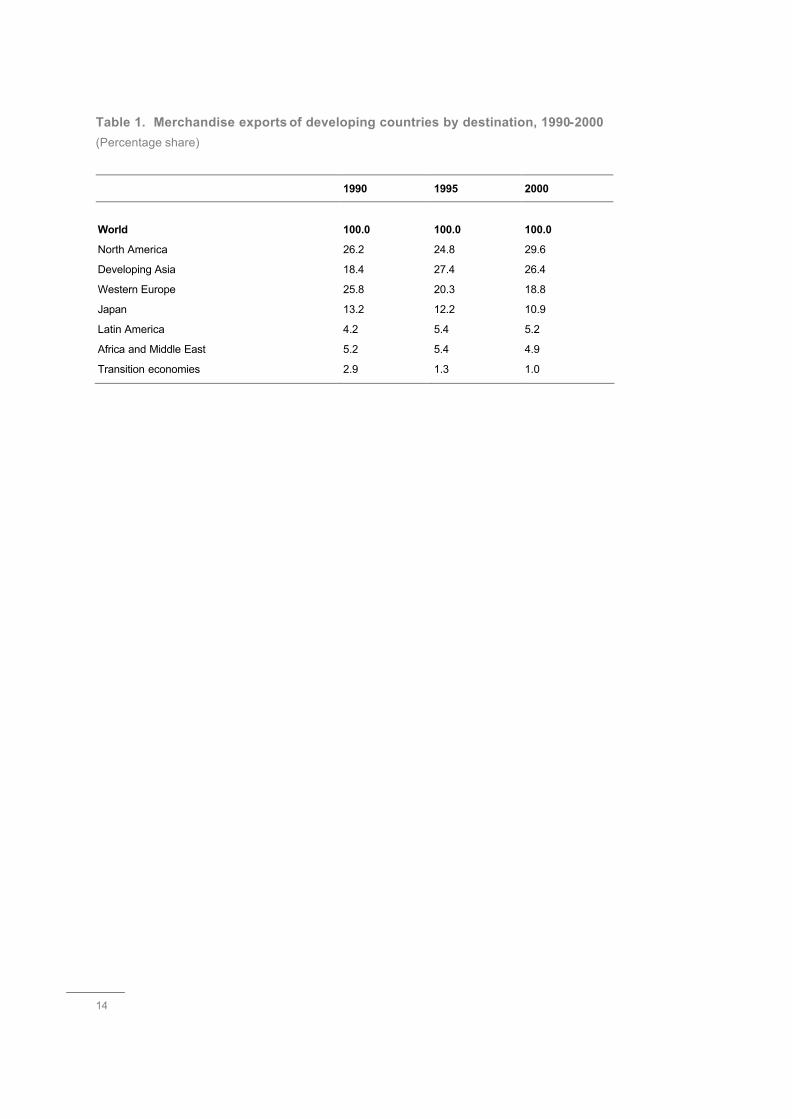
While developed countries, most transition economies and most Latin American countries have bound all, or almost all, of their industrial tariff lines, most African and Asian countries have bound only a limited number of tariff lines. Table 6 shows the distribution of binding coverage across countries respectively for Africa, Asia and Latin America. In Africa, the distribution of binding coverage is concentrated in the extremes. More than half the countries have bound less than half their tariff lines. As can be seen in column 1, 14 out of a total of 41 African countries have bound less than 10% of their industrial tariff lines. Of those, 11 have even bound less than 5% of their lines. At the same time, 11 countries have bound between 90 and 100%. In Asia, one third of the 21 countries in our sample have consolidated less than half their lines and only nine countries have consolidated more than 90% of their lines. In Latin America, the situation is strikingly diffe rent with only four out of 32 countries with a binding coverage of less than 90%.
Moreover, we know that applied tariffs in developing countries are often far below the level of bindings. For those two reasons, it is important to consider both the bound and the applied tariffs.10 Our investigation of the tariff structures of leading importers thus continues with an examination of their applied MFN tariffs. Simple applied tariff averages at the MTN category level are presented in Table 7 for 15 of the 18 leading importers.11 10 Further investigation of tariff bindings will be possible with the CTS database. 11 Data for Switzerland were not available and were dropped for Singapore and Hong Kong, China because their applied tariffs are all at zero. On the other hand, applied tariffs were available for China and Chinese Taipei, two Members for which information on bindings were missing.
Textiles and clothing have the highest or the second highest tariff average in all countries except Poland and Chinese Taipei where they rank third. More generally, for all countries in our sample, the two sectors with the highest applied tariff averages across categories are among the four sectors identified as the most protected based on their bindings. Moreover, as can be seen from Table 8, in about half the countries in our sample the sector with the largest proportion of lines with tariffs above 15% is textiles and clothing. In most of the other countries, including the European Union, the largest share of peaks is found in the fish and fish products category. For Japan, the largest share of peaks is in the leather, rubber, footwear, and travel goods category.
Generally speaking, non-ad valorem tariffs are much more frequent in the agricultural sector. However, it can be seen from Table 9 that non-ad valorem lines are present in certain countries and certain MTN categories. Thailand has the highest shares of non-ad valorem tariff lines with no ad valorem equivalent; over 30% in wood and furniture, textile and clothing and leather and travel goods. The shares of Chinese Taipei in fish and fish products, United States in not elsewhere specified articles, Thailand in chemicals and photographic supplies and in mineral products and precious stones and metals are over 15%.
To obtain a picture of how market access is affected by reciprocal and non-reciprocal preferences we have calculated the simple average applied tariff including preferences in seven geographic markets for five different exporters. The exporters are developed countries, LDCs, developing countries that are major exporters of manufactures, oil exporters and other developing countries.12 The tariff rates were calculated using the share of exports to total exports as weights. As a group the highest levels of protection faced by all exporters is in South Asia followed by Sub-Saharan Africa (chart 3). Furthermore, the developed countries as a group have the lowest overall levels of tariffs.
Another interesting feature of the chart is that weighting by exports has the effect of increasing the relative value of tariffs on products of interest to exporters. Therefore, LDC exporters face the highest levels of tariffs in the Quad countries since in some of these countries preferences are not granted on items of export interest to these countries. In contrast, low average tariff rates are obtained for developed country exporters since for
12 For more detail on the classifications see Bacchetta and Bora (2001).

8
the most part of the MFN duties, or as in the case of the North American Free Trade Agreement, preferential duties are already very low.
B. SECTOR SPECIFIC LANDSCAPE
Having identified the most protected sectors, we will now go one step further and examine the structure of tariffs in those sectors. We proceed in two steps. First, we identify which sectors, at the 4-digit level, have the highest tariffs, and then we examine the importance of these sectors for developing countries.
1. Fish and fish products
In the fish and fish products category, small subsets of 4-digit subgroups are clearly affected by higher tariffs, than other subgroups. As table 10 shows, European Union applies the highest tariffs to fish and fish products in all Quad countries. Two out of 13 products face tariff rates higher than 15%. Japan ranks the second highest tariffs in the fish and fish products category. Among each of the Quad countries, prepared or preserved fish, and prepare or preserved crustaceans and molluscs (1604 and 1605) clearly stand out as being affected by the highest tariffs in this category. Together with fish or crustaceans’ extracts and juices (1603), these products are also the most protected in most of the emerging economies in our sample. (Table 10)
Prepared or preserved fish (1604), the subgroup with the highest average tariff in all Quad countries except for Japan where it has the third highest level, is the second most important import product from developing countries in Quad countries. As chart 4 shows, by far the main import of Quad countries from developing countries in this category is crustaceans (0306). Tariffs on imports of crustaceans are relatively high in the European Union but they are not among the highest in other Quad countries.
Tariffs on fis h and fish products in Quad countries clearly exhibit escalation. This can be illustrated with the example of crustaceans. Comparing tariffs on live, fresh, frozen, or dried crustaceans with tariffs on prepared or preserved crustaceans shows that the latter are higher than the former in the Quad countries. This may contribute to discourage the processing of crustaceans in developing countries. It is interesting to note that in the case of crustaceans, escalation is far less important in emerging economies than in the Quad Table 11.
2. Leather, rubber, footwear and travel goods
This category includes rubber and rubber products from natural rubber in primary forms to tires and articles of hard rubber; leather and leather products and footwear in leather, plastics, textiles or rubber.
Three categories (6401, 6402 and 6404) out of 39 have tariff averages above 15% in three of the four Quad countries Table 12. All three correspond to specific types of footwear. The two other footwear subgroups (6403 and 6405) are also affected by higher tariffs in two Quad countries. Japan differs to some extent from the other Quad countries in that it also has peaks on different sorts of leather, furskins and articles of furskin, as well as on several other products. In most emerging countries in our sample, tariffs on footwear are among the highest in the category, even if they do not always stand out as much as in the Quad countries.
The bulk of Quad countries' imports from developing countries in this product category are footwear with uppers of rubber or plastics (6402), footwear with uppers of leather (6403) and footwear with uppers of textile (6404). As mentioned, those are the subgroups with the highest tariffs. Other products imported in large quantities include articles of apparel and clothing accessories of leather (4203), tyres (4011), natural rubber (4001), articles of vulcanized rubber (4015 and 4016) and bovine or equine leather (4104). While natural rubber is exempted in all Quad countries, articles of rubber have positive tariffs, which are in some cases even higher than average. Tariffs on bovine leather are relatively high, in particular in Japan, but, except in Japan, they are lower than tariffs on leather apparel and accessories and much lower than tariffs on footwear. As table 13 shows, tariffs on leather and leather products are also escalating in emerging economies. We see that tariffs on leather clothing accessories (4203) and leather footwear (6403) are higher than those on leather (4104) in most countries in the table.
3. Textiles and clothing
Trade in textiles and clothing products will continue to be subject to a special regime under the multilateral trade rules until January 1st 2005. Until that time a significant share of world trade in textiles and clothing is still distorted by the complex set of quantitative restrictions inherited from the MFA Agreement. The Uruguay Round Agreement on Textiles and Clothing sets out provisions to be applied by Members during the transition period. Only on the 1st of January 2005, will the textiles and clothing sector be completely

9
integrated into GATT 1994 and all quantitative restrictions eliminated.
The quantitative restrictions, however, should not conceal the high tariffs with which they cohabit. As was shown above, in most of the leading merchandise importers, the textiles and clothing sector is among the few categories with the highest bound and applied tariff averages, and the largest number of tariff peaks. The Agreement on Textiles and Clothing does not address the issue of tariff protection. The complete integration of the textiles sectors into GATT, by eliminating the quantitative restrictions, will only bring the tariffs to the front.
The textiles and clothing category includes more than 150 4-digit subgroups, which is considerably higher than the three other categories we are investigating. A detailed examination of the tariff structures of the countries in our sample is thus beyond the scope of this paper. The tariff structures of our sample countries, however, have a certain number of characteristics in common. First, with the notable exceptions of India and Turkey, all countries apply higher tariffs to clothing than to textile products. Some countries such as Poland, Brazil and Mexico apply the same higher tariff to all clothing products, while others impose higher but non-uniform tariffs on clothing products. Second, in most cases, the dispersion of tariffs across 4-digit subgroups in the textiles sector is significant. In absolute terms, inter-group dispersion is the highest in Malaysia, Thailand and Turkey. Among developed countries, it is the highest in Australia, Canada and the United States, where tariff averages range between zero and more than 15%.
Table 14 shows the pattern of tariff escalation of both Quad countries and emerging economies of textiles imports, eight of them are leading importers of textiles products.13 It lists tariffs for textile products; both the raw materials and the highly processed products. For example, the first pair of products is the tariff rate for garneted stock of wool or of fine or coarse animal hair (5104), which is lower than that for yarn of wool or fine animal hair, put up for retail sale (5109). Jute is a product of interest to least developed countries. Natural fibres of jute (5303) is among the very few products with zero applied tariffs in the four Quad countries. However, woven fabrics (5310) of jute 13 The leading importers of clothing also include Switzerland and the Russian Federation. Switzerland is excluded here because comparable data are not available. The Russian Federation is excluded here because it is not a Member of the WTO. Hong Kong, China, which pursues a free trade policy, figures among the leading importers of both textiles and clothing.
are only exempted in some of the Quad countries. Unprocessed synthetic textiles (5404, 5405) have lower tariffs in most countries than tariffs for more processed synthetic textiles such as 5606 and 5609. Synthetic staple fibres, not carded, combed or otherwise processed for spinning (5503) has lower tariffs than woven fabrics of synthetic staple fibres, containing 85% or more by weight of synthetic staple fibres (5512) in 14 of the countries listed here, the only exception is Poland. Furthermore, this escalation pattern is very clear in the last two examples. Garments (6210), made up of fabrics of heading (5903), applies higher tariffs than textile fabrics impregnated, coated, covered or laminated with plastics (5903). And garments (6113) displays higher protection levels than one of its raw materials, rubberized textile fabrics (5906).
The fact that tariffs on clothing are higher than tariffs on textile products offers sufficient evidence of the presence of tariff escalation.
Most imports of clothing products from developing countries in the four Quad countries are concentrated in a small number of 4-digit subgroups. Those include jerseys, pullovers, and similar articles, knitted or crocheted (6110); women's or girls' suits, ensembles, jackets, etc. (6204); T-shirts (6109) and men's or boys' suits (6203). These products do not stand out as having higher or lower tariffs than other clothing products in the Quad countries. Similarly, a small number of 4-digit subgroups account for the lion's share of imports of textiles products from developing countries into the four Quad countries. Those include trunks, suit-cases, cases, bags, etc. (4202), and bed linen, table linen, toilet linen and kitchen linen (6302).14 Tariffs affecting linen are significantly higher than those affecting trunks and bags.15
In summary, tariffs on clothing are higher than tariffs on textiles products but dispersion across subgroups is higher among textiles than among clothing.
4. Transport equipment
The last category of products which we consider here is transport equipment. Transport equipment includes not only cars, trucks and buses and their components. It also includes railways and
14 Subgroup 8708 which corresponds to parts and accessories of motor vehicles also accounts for a significant amount of imports from developing countries. Only one 6-digit subgroup of 8708 however, i.e. safety belts (8708.21), enters the definition of textiles products. 15 The data has not been presented, but is available upon request.

10
tramways, bicycles and boats. Except in Malaysia where it has the highest tariff average and largest share of peaks of all non-agricultural MTN categories, and in Japan where it is not protected by tariffs at all, transport equipment is generally less protected than textiles and clothing or leather but more than most other categories. One characteristic of tariff protection of transport equipment for the largest importers is that even if there is some overlap, they do not all have their tariff peaks on the same products (chart 5). The European Union imposes higher tariffs on bicycles (8712) and motor vehicles including buses, cars, and trucks (8702 8703 and 8704) as well as on chassis fitted with engines for motor vehicles (8706). The United States impose higher tariffs on railway and tramway passenger coaches and goods wagons (8605 and 8606), as well as on trucks (8704), and bicycles (8712). The other leading importers generally impose higher tariffs on buses, cars, and trucks. The difference between
developing countries in Asia is striking. While the highest tariff on transport equipment in Korea is 10% on buses, Thailand imposes tariffs of 120% and more on buses and cars, and Malaysia and China have peaks at respectively 100 and 80% on cars.
The most important product from developing countries for Canada, the European Union and the United States is by far cars. In the case of Japan, however, imports of bicycles exceed imports of cars. Trucks rank second for the United States but not for the European Union where they only come third after vessels for the transport of persons or goods (8901).
The degree of tariff escalation depends on the products and on the countries. In the case of bicycles (Chart 6), tariffs on parts are lower than tariffs on bicycles in Canada, the European Union and the United States as well as in four emerging countries.

11
V. LEAST DEVELOPED COUNTRIES
There are also explicit references to market access issues for LDCs in the Doha Ministerial Declaration. The language that is used builds on the commitments that were made at the Third United Nations Conference on Least Developed Countries. Of particular importance in this regard is the commitment to the “objective of duty-free, quota-free market access for LDCs”. Furthermore, market access issues have been given a specific mandate in the work program of the Sub-Committee on LDCs.16
The importance of market access to LDCs can be seen from table 15. The most open market to LDC exports in 1999 was the EU where 97% of imports originating from LDCs entered duty free. While this figure is impressive when compared to the figures for the other Quad countries, what is notable is the number of HS6 lines in which LDCs had non-zero exports to the Quad markets. The EU clearly imports the largest diversity of products from LDCs. Therefore, the table provides strong evidence that if a market is open, it allows countries to diversify their export structure.
16 In paragraph 42 of the Doha Ministerial Declaration, WTO Members committed themselves "to the objective of duty-free, quota-free market access for products originating from LDCs" and "to consider additional measures for progressive improvements in market access for LDCs." The Work Programme shall therefore include: • identification and examination of market access
barriers, including tariff and non-tariff barriers for the entry of LDCs' products into markets of interest to them;
• annual reviews in the Sub-Committee,16 of market access improvements, of any market access measures undertaken by Members, and including the identification of reported market access barriers to LDCs’ products in markets of interest to them. These reports will be on the basis of factual annual studies by the WTO Secretariat; and,
• examination of possible additional measures for progressive and predictable improvements in market access, in particular the elimination of tariff and non tariff barriers to export products from LDCs and further improvement of preferential access schemes such as the GSP schemes.
Reports on this work will be submitted annually to the Committee on Trade and Development. These reports will be designed to highlight LDC concerns in the context of negotiations taking place in other bodies of the WTO, but in full recognition of the integrity of the mandates of those bodies.
Several developed and transition economies including some of the major markets for LDC exports have adopted a policy of duty-free and quota-free market access for all or essentially all LDC exports. These export markets include Canada, Czech Republic, European Union, Hungary, New Zealand, Norway, Slovak Republic and Switzerland. Of the major developing country markets for LDC exports, Hong Kong, China and Singapore offer duty-free and quota-free access on an MFN basis. Some developing countries ranging from Mauritius, Egypt, and Republic of Korea, have also accorded preferential access to LDCs. However, the product coverage of these preferential schemes varies and is usually limited to duty-free treatment for LDC exports in a few tariff lines. Some other countries offer preferences in a regional or sub-regional context. For instance, India, through the South Asian Association for Regional Cooperation (SAARC) offers preferential access to LDC Members of SAARC. Morocco, gives preferential access to African LDCs, while the United States under the African Growth and Opportunity Act (AGOA) enhanced market access opportunities for 23 LDCs in Sub-Saharan Africa.
Tariff bindings are also an issue for LDCs As mentioned earlier Africa as a region has bound less tariff lines when compared to other regions. However, as a group, the story for the LDCs is mixed. In our sample of 26 LDCs, nine have bound 100% of their lines, while two more have bound 97% of their lines. At the same time, eight LDCs have bound less than 5% of their lines. For those Members that have bound their tariff lines there is also the parallel issue of the gap between the bound and applied rates.

12
VI. CONCLUSIONS
The negotiating mandate for the Doha Development Agenda is both broad and comprehensive. This paper has tried to focus on the basic mandate given to negotiators in the area of tariffs and trade in industrial products. Although there have been quite a few studies that have identified the general parameters for the negotiations, this paper has tried to extend the analysis a bit further by taking advantage of more detailed data on bound tariffs.
With respect to developed country markets the key issue is how to tackle the residual protection arising from low overall levels of protection. We have identified a number of products at the 4-digit level
where issues of peaks and escalation need to be addressed. For developing countries there are two issues – their high levels of tariffs and the limited coverage of bindings for some Members. These, however, do not preclude issues of peaks and escalation such as those that we have identified in developed country markets as problems. Finally, for LDCs the issues are the degree of effective non-reciprocal market access granted by developed countries, and the very high levels of protection they face in developing country markets, and the role that high levels of protection are playing as instruments of industry policy in their economies.
13
VII. REFERENCES
Bacchetta, M. and B. Bora (2001), "Post Uruguay Round Market Access Barriers for Industrial Products", Policy Issues in International Trade and Commodities, Study Series No. 1, Geneva, UNCTAD
Bora, B. (2002), "Market Access Issues: what's at stake?", presented to the WTO Public Symposium, 29 April, 2002, Geneva, WTO, mimeo.
Cernat, L, S. Laird and A. Turrini (2002), “Back to Basics”, Geneva, UNCTAD, mimeo.
Finger, M., M. Ingco and U. Reincke (1996), The Uruguay Round: Statistics on Tariff Concessions Given and Received, Washington, World Bank.
Lall, S. (2000), "The technological structure and performance of developing country manufactured exports, 1985-1998", Queen Elizabeth House Working Paper Series, No. QUEHWPS44, Oxford University.
OECD (1999), Post Uruguay Round Tariff Regime: Achievements and Outlook, Paris, OECD.
Rodrik, D. (2001), "Global Governance of Trade as if Development Really Mattered", New York, United Nations Development Program.
Supper, E. (2001), "Is There Effectively a level playing field for Developing Country Exports?", Policy Issues in International Trade and Commodities, Study Series No. 1, Geneva, UNCTAD.
UNCTAD (2001), Duty and Quota Free Market Access for LDCs: An Analysis of Quad Initiatives, Geneva and London, UNCTAD and Commonwealth Secretariat.
WTO (2001), Market Access: Unfinished Business, Geneva, WTO.
14
Table 1. Merchandise exports of developing countries by destination, 1990-2000
(Percentage share)
1990 1995 2000
World 100.0 100.0 100.0
North America 26.2 24.8 29.6
Developing Asia 18.4 27.4 26.4
Western Europe 25.8 20.3 18.8
Japan 13.2 12.2 10.9
Latin America 4.2 5.4 5.2
Africa and Middle East 5.2 5.4 4.9
Transition economies 2.9 1.3 1.0

Table 2. Bound tariffs on industrial products.a Scope of bindings, simple averages, standard deviations and tariff peaks
Import Markets
Total number of tariff lines
Share of bound tariff
linesb
Share of bound
duty-free tariff lines
Share of unbound duty-free tariff lines
Share of non-ad valorem
tariff lines
Simple average bound tariff
Standard deviation
Share of tariff lines with duties more than three times the average
Share of tariff lines
with duties above 15%
NORTH AMERICA Canada 6261 99.6 34.5 0.1 0.3 5.2 5.0 5.8 5.8
United States 7872 100.0 39.4 0.0 4.2 3.9 5.6 7.5 3.5
LATIN AMERICA
Brazil 10860 100.0 0.5 0.0 0.0 30.0 7.4 0.0 97.4
Mexico 11255 100.0 0.0 0.0 0.0 34.8 3.4 0.0 99.3
EUROPE
European Union 7635 100.0 26.9 0.0 0.5 4.1 4.0 2.6 1.5
Poland 4354 95.8 2.2 0.0 0.0 10.4 5.2 1.2 13.3
Turkey 15479 36.3 1.4 0.8 0.1 42.6 36.7 3.5 73.9
Switzerland 6217 98.9 17.2 0.0 82.8 1.8 4.6 8.7 0.3
ASIA
Australia 5520 95.9 17.7 0.2 0.8 14.2 14.7 6.3 25.3
Hong Kong, China 5110 23.5 23.5 76.5 0.0 0.0 0.0 0.0 0.0
India 4354 61.6 0.0 0.4 1.1 58.7 33.3 0.1 97.8
Japan 7339 99.2 47.4 0.4 3.5 3.5 6.0 5.2 1.8
Korea, Republic of 8882 90.4 11.6 0.0 0.2 11.7 9.6 1.4 19.1
Malaysia 10832 61.8 1.6 2.8 3.2 17.2 13.4 0.4 58.3
Singapore 4963 65.5 15.2 33.8 0.2 4.6 4.8 0.5 0.2
Thailand 5244 67.9 0.0 1.2 19.7 27.5 10.6 0.1 87.1
a Excluding petroleum, as defined in the technical notes at the end of this chapter. b All shares are expressed as a percentage of the total number of industrial tariff lines (column 1).
Source: WTO (2001)
15

Table 3. Bound tariffs on industrial products. Simple averages by country and MTN category
1 2 3 4 5 6 7 8 9 10 11
Import Markets Wood, pulp, paper and furniture
Textiles and
clothing
Leather, rubber,
footwear and travel
goods
Metals Chemicals and photographic
supplies
Transport equipment
Non-electric
machinery
Electric machinery
Mineral products
and precious
stones and precious metals
Manufactured articles not elsewhere specified
Fish and fish
products
NORTH AMERICA
Canada 1.3 12.4 7.6 2.8 4.5 6.8 3.6 5.2 3.1 4.2 1.8
United States 0.6 8.9 8.4 1.8 3.7 2.7 1.2 2.1 3.3 3.0 2.2
LATIN AMERICA
Brazil 27.7 34.9 34.7 33.4 22.7 33.6 32.6 31.9 33.5 33.5 33.4
Mexico 34.0 35.0 34.8 34.7 35.2 35.8 35.0 34.1 34.4 34.6 35.0
EUROPE European Union 0.7 7.9 4.8 1.6 4.8 4.7 1.8 3.3 2.4 2.7 11.8
Poland 8.0 13.1 11.9 9.9 8.7 16.1 8.9 9.7 6.9 11.6 16.3
Turkey 40.5 80.3 79.9 30.4 29.0 25.8 23.7 26.6 39.4 43.3 26.2
Switzerland 2.1 4.6 2.0 1.1 1.5 2.2 0.6 0.7 1.5 1.3 0.5
ASIA
Australia 7.0 28.8 17.5 4.5 9.2 15.1 9.1 13.3 7.0 7.0 0.8
Hong Kong, China 0.0 0.0 0.0 0.0 0.0 0.0 0.0 0.0 0.0 0.0 0.0
India 56.4 87.8 67.8 58.3 44.1 53.9 36.2 44.8 47.2 72.4 68.6
Japan 1.2 6.8 15.7 0.9 2.4 0.0 0.0 0.2 1.0 1.1 6.2
Korea, Republic of 4.8 18.2 16.7 7.7 6.7 24.6 11.1 16.1 10.4 11.4 19.1
Malaysia 19.8 20.7 19.1 14.2 15.4 29.8 10.9 14.1 14.7 12.6 14.5
Singapore 3.1 7.8 3.4 3.2 5.0 4.4 4.3 4.9 1.2 1.2 9.8
Thailand 21.3 29.2 34.1 25.6 29.3 38.5 23.4 30.5 25.9 29.5 12.5 Source: WTO (2001). Bold numbers are values above the national average
16

Table 4. Bound tariffs on industrial products. Tariff peaks (Share of tariff lines above 15% by country and MTN category) (percentage of total tariff lines in each category)
1 2 3 4 5 6 7 8 9 10 11
Import markets Wood, pulp, paper
and furniture
Textiles and
clothing
Leather, rubber,
footwear and travel
goods
Metals
Chemicals and
photographic supplies
Transport equipment
Non-electric
machinery
Electric machinery
Mineral products
and precious
stones and precious metals
Manufactured articles not elsewhere specified
Fish and fish
products
NORTH AMERICA Canada 0.5 30.6 17.1 0.0 0.0 7.9 0.0 0.0 1.1 1.6 0.0
United States 0.0 13.0 14.9 0.2 0.0 3.1 0.0 0.0 2.4 1.2 1.1
LATIN AMERICA
Brazil 91.1 100.0 100.0 98.5 96.8 99.3 82.8 97.5 93.6 99.2 97.2
Mexico 96.0 99.8 100.0 99.3 99.8 96.2 100.0 99.4 97.4 99.6 100.0
EUROPE
European Union 0.0 0.0 11.2 0.0 0.0 3.9 0.0 0.0 0.0 0.1 21.8
Poland 0.0 42.2 32.9 0.2 1.7 26.2 0.0 7.2 6.9 15.5 36.4
Turkey 81.6 94.5 88.5 78.5 50.6 77.1 68.1 62.7 72.5 72.5 99.0
Switzerland 0.0 0.7 0.0 0.1 0.8 0.5 0.0 0.0 0.3 0.0 0.0
ASIA/PACIFIC
Australia 1.0 73.3 37.2 4.2 0.2 14.8 8.4 20.2 5.7 4.4 0.0 Hong Kong, China 0.0 0.0 0.0 0.0 0.0 0.0 0.0 0.0 0.0 0.0 0.0
India 98.4 99.3 99.3 95.9 97.1 95.1 98.8 100.0 94.9 98.3 100.0
Japan 0.0 0.3 39.0 0.0 0.0 0.0 0.0 0.0 0.0 0.0 0.0
Korea, Rep. of 5.5 37.2 35.8 6.6 4.7 40.3 8.1 42.6 14.9 13.4 82.5
Malaysia 92.2 80.4 53.3 35.8 43.8 58.5 27.1 36.8 31.7 31.9 29.0
Singapore 0.0 0.0 0.0 0.0 0.0 8.0 0.0 0.0 0.0 0.0 0.0
Thailand 68.8 93.0 94.7 82.0 96.0 72.9 98.9 97.6 68.3 88.6 31.0
Source: WTO (2001)
17

Table 5. Bound tariffs on industrial products. Scope of bindings by country and MTN category
1 2 3 4 5 6 7 8 9 10 11
Import markets Wood, pulp, paper
and furniture
Textiles and
clothing
Leather, rubber,
footwear and travel
goods
Metals
Chemicals and
photographic supplies
Transport equipment
Non-electric
machinery
Electric machinery
Mineral products
and precious
stones and precious metals
Manufactured articles not elsewhere specified
Fish and fish
products
NORTH AMERICA Canada 100.0 100.0 100.0 100.0 100.0 93.7 100.0 100.0 98.2 100.0 100.0
United States 100.0 100.0 100.0 100.0 100.0 100.0 100.0 100.0 100.0 100.0 100.0
LATIN AMERICA
Brazil 100.0 100.0 100.0 100.0 100.0 100.0 100.0 100.0 100.0 100.0 100.0
Mexico 100.0 100.0 100.0 100.0 100.0 100.0 100.0 100.0 100.0 100.0 100.0
EUROPE
European Union 100.0 100.0 100.0 100.0 100.0 100.0 100.0 100.0 100.0 100.0 100.0
Poland 100.0 99.4 100.0 100.0 99.6 57.4 99.4 100.0 99.4 95.7 4.7
Switzerland 100.0 100.0 100.0 100.0 95.2 100.0 100.0 100.0 93.0 100.0 100.0
Turkey 33.7 11.3 29.8 18.5 56.1 61.2 60.2 57.6 24.3 41.1 13.1
ASIA/PACIFIC
Hong Kong, China 93.2 2.4 24.0 54.2 5.8 5.1 16.8 4.2 39.7 20.9 100.0
India 61.5 26.0 48.6 56.5 88.8 70.5 92.4 87.3 71.6 39.3 13.1
Japan 92.8 100.0 100.0 100.0 100.0 100.0 100.0 100.0 100.0 100.0 87.0
Korea, Rep. 92.2 99.7 82.3 99.3 95.5 62.7 94.6 64.4 92.0 95.3 35.8
Malaysia 20.0 94.8 87.0 49.8 72.9 39.5 89.0 77.5 65.1 84.0 43.0
Singapore 96.0 78.0 33.5 64.1 98.7 11.6 62.0 53.2 14.6 27.2 98.5
Thailand 85.9 94.4 45.6 54.3 54.6 24.3 88.2 57.0 43.8 68.7 92.3
Average 85.0 80.4 76.7 79.8 84.5 68.4 86.8 80.1 76.1 78.1 72.5
Source: WTO (2001).
18
Table 6. Distribution of binding coverage in Africa, Asia and Latin America
African countries (41) Asia countries (21) Latin America (32)
Binding coverage
Number % Number % Number %
≤ 5% 11 26.8 1 4.8 0 0.0
5% binding coverage ≤ 10% 3 7.3 1 4.8 0 0.0
10% binding coverage ≤ 20% 1 2.4 2 9.5 1 3.1
20% binding coverage≤ 30% 4 9.8 1 4.8 2 6.3
30% binding coverage≤ 40% 3 7.3 1 4.8 0 0.0
40% binding coverage≤ 50% 0 0.0 1 4.8 0 0.0
50% binding coverage≤ 90% 2 4.9 5 23.8 1 3.1
90% binding coverage<100% 11 26.8 8 38.1 8 25.0
=100% 6 14.6 1 4.8 20 62.5
Total 41 100.0 21 100.0 32 100.0
Source: WTO (2001).
19
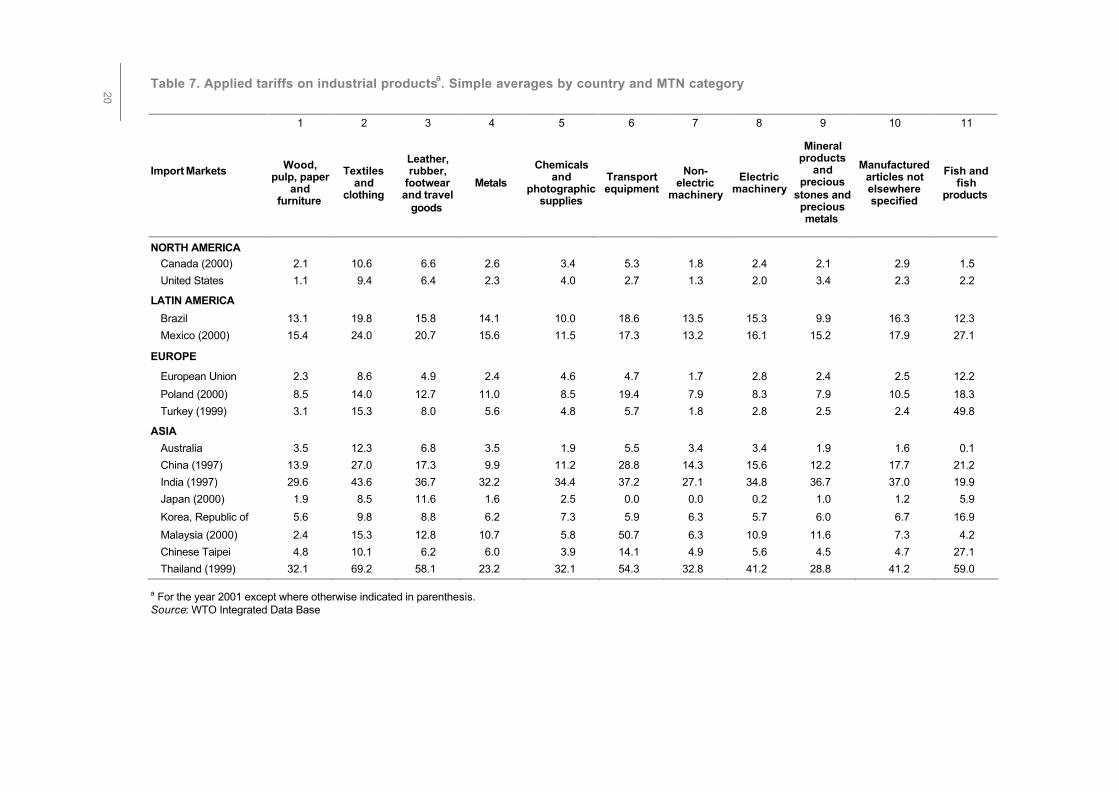
Table 7. Applied tariffs on industrial productsa. Simple averages by country and MTN category
1 2 3 4 5 6 7 8 9 10 11
Import Markets Wood, pulp, paper
and furniture
Textiles and
clothing
Leather, rubber,
footwear and travel
goods
Metals
Chemicals and
photographic supplies
Transport equipment
Non-electric
machinery
Electric machinery
Mineral products
and precious
stones and precious metals
Manufactured articles not elsewhere specified
Fish and fish
products
NORTH AMERICA Canada (2000) 2.1 10.6 6.6 2.6 3.4 5.3 1.8 2.4 2.1 2.9 1.5
United States 1.1 9.4 6.4 2.3 4.0 2.7 1.3 2.0 3.4 2.3 2.2
LATIN AMERICA
Brazil 13.1 19.8 15.8 14.1 10.0 18.6 13.5 15.3 9.9 16.3 12.3
Mexico (2000) 15.4 24.0 20.7 15.6 11.5 17.3 13.2 16.1 15.2 17.9 27.1
EUROPE European Union 2.3 8.6 4.9 2.4 4.6 4.7 1.7 2.8 2.4 2.5 12.2
Poland (2000) 8.5 14.0 12.7 11.0 8.5 19.4 7.9 8.3 7.9 10.5 18.3
Turkey (1999) 3.1 15.3 8.0 5.6 4.8 5.7 1.8 2.8 2.5 2.4 49.8
ASIA
Australia 3.5 12.3 6.8 3.5 1.9 5.5 3.4 3.4 1.9 1.6 0.1
China (1997) 13.9 27.0 17.3 9.9 11.2 28.8 14.3 15.6 12.2 17.7 21.2
India (1997) 29.6 43.6 36.7 32.2 34.4 37.2 27.1 34.8 36.7 37.0 19.9
Japan (2000) 1.9 8.5 11.6 1.6 2.5 0.0 0.0 0.2 1.0 1.2 5.9
Korea, Republic of 5.6 9.8 8.8 6.2 7.3 5.9 6.3 5.7 6.0 6.7 16.9
Malaysia (2000) 2.4 15.3 12.8 10.7 5.8 50.7 6.3 10.9 11.6 7.3 4.2
Chinese Taipei 4.8 10.1 6.2 6.0 3.9 14.1 4.9 5.6 4.5 4.7 27.1
Thailand (1999) 32.1 69.2 58.1 23.2 32.1 54.3 32.8 41.2 28.8 41.2 59.0 a For the year 2001 except where otherwise indicated in parenthesis. Source: WTO Integrated Data Base
20

Table 8. Applied tariffs on industrial productsa. Tariff peaks (Share of tariff lines above 15% by country and MTN category) (Percentage)
1 2 3 4 5 6 7 8 9 10 11
Import Markets Wood,
pulp, paper and
furniture
Textiles and
clothing
Leather, rubber,
footwear and travel
goods
Metals
Chemicals and
photographic supplies
Transport equipment
Non-electric
machinery
Electric machinery
Mineral products
and precious
stones and precious metals
Manufactured articles not elsewhere specified
Fish and fish
products
NORTH AMERICA Canada (2000) 0.6 41.9 18.8 0.0 0.0 6.3 0.0 0.0 0.8 1.6 0.0
United States 0.0 16.8 9.1 0.0 0.0 5.7 0.0 0.0 2.9 0.4 1.1
LATIN AMERICA
Brazil 36.2 92.8 60.0 48.1 26.6 54.2 23.2 60.1 21.0 65.8 16.3
Mexico (2000) 40.5 87.7 62.5 45.0 23.5 60.4 40.3 56.8 45.4 58.6 93.5
EUROPE European Union 0.0 0.0 10.4 0.0 0.0 6.2 0.0 0.0 0.0 0.0 23.4
Poland (2000) 0.4 44.6 33.9 0.2 1.5 28.0 0.1 10.6 7.3 13.7 35.7
Turkey (1999) 0.2 10.9 30.5 8.6 0.0 13.2 0.0 0.0 1.2 0.2 96.4
ASIA
Australia 0.0 24.2 2.4 0.0 0.1 0.0 0.0 0.0 0.0 0.0 0.0
China (1997) 36.1 87.4 50.0 12.8 18.0 53.1 33.7 34.5 28.3 52.5 71.6
India (1997) 83.9 99.9 82.9 91.3 96.2 84.4 98.3 96.5 88.4 99.1 16.8
Japan (2000) 0.0 2.2 30.8 0.0 0.0 0.0 0.0 0.0 0.0 0.0 0.0
Korea, Republic of 0.0 0.0 5.8 0.0 0.0 0.0 0.0 0.0 0.0 0.0 68.6
Malaysia (2000) 8.9 44.2 42.1 35.2 19.4 64.8 20.9 32.3 32.5 20.1 12.8
Chinese Taipei 2.2 11.3 1.1 0.0 0.2 37.3 2.3 1.2 0.6 1.5 60.7
Thailand (1999) 40.1 62.6 64.2 60.6 79.6 76.7 99.9 91.8 54.8 85.4 85.1
a For the year 2001 except where otherwise indicated in parenthesis.
Source: WTO IDB.
21

Table 9. Applied tariffs on industrial productsa. Share of non ad valorem tariff lines with no ad valorem equivalent
1 2 3 4 5 6 7 8 9 10 11
Import Markets Wood, pulp, paper and furniture
Textiles and clothing
Leather, rubber, footwear and travel
goods
Metals Chemicals and photographic
supplies
Transport equipment
Non-electric machinery
Electric machinery
Mineral products
and precious
stones and precious metals
Manufactured articles
not elsewhere specified
Fish and fish
products
Canada (2000) 0.0 1.2 0.0 0.0 0.1 0.0 0.0 0.0 0.0 0.0 0.0 United States 1.8 8.0 3.6 6.2 7.3 0.0 0.1 0.0 2.0 18.4 4.9
Brazil 0.0 0.0 0.0 0.0 0.0 0.0 0.0 0.0 0.0 0.0 0.0
Mexico (2000) 0.4 0.0 0.0 0.0 0.5 0.0 0.0 0.0 0.0 0.0 0.8
European Union 0.0 0.2 0.0 0.0 0.3 0.0 0.0 0.0 2.1 3.2 0.0
Poland (2000) 0.0 0.0 0.0 0.0 0.0 6.9 0.0 0.0 0.0 0.0 0.0
Turkey (1999) 0.0 0.1 0.0 0.0 0.1 0.0 0.0 0.0 3.7 2.3 0.0
Australia 0.0 0.0 0.0 0.0 0.0 0.0 0.0 0.0 0.0 0.0 0.0
China (1997) 0.3 0.0 0.0 0.0 2.6 0.0 0.0 0.5 0.0 0.3 0.0
India (1997) 0.0 0.0 0.0 0.0 0.0 0.0 1.5 0.0 0.0 0.0 0.0
Japan (2000) 0.0 10.4 8.6 2.0 0.7 0.0 0.0 0.0 0.2 0.3 0.3
Korea, Republic of 0.0 0.0 0.0 0.0 0.9 0.0 0.0 0.0 0.0 0.1 0.0
Malaysia (2000) 0.0 0.0 1.4 0.4 0.2 0.0 0.1 0.0 0.0 0.0 0.0
Chinese Taipei 0.3 0.0 0.0 4.0 1.5 0.0 0.0 0.0 0.4 0.1 23.7
Thailand (1999) 37.3 36.8 30.6 8.9 17.4 0.0 0.0 5.1 18.5 5.0 13.5
a For the year 2001 except where otherwise indicated in parenthesis.
22

Table 10. Simple average applied tariffs of fish and fish products
HS 4-digit European Union
Japan United States
Canada China Korea, Rep. of
Thailand Brazil
0301 Live fish 6.8 2.3 0.0 0.0 11.7 10.0 60.0 6.9 0302 Fish, fresh or chilled 12.9 4.9 0.8 0.1 17.9 20.0 60.0 11.9
0303 Fish, frozen 13.6 4.4 0.7 0.1 18.5 10.0 60.0 12.0
0304 Fish fillets and other fish meat 10.2 4.4 0.7 0.0 30.0 14.0 60.0 12.5
0305 Fish, fit for human consumption 13.3 10.4 1.7 0.3 27.6 20.0 60.0 8.9
0306 Crustaceans 11.0 3.8 1.3 2.7 23.9 19.4 60.0 12.5
0307 Molluscs 7.2 7.4 0.4 0.5 21.9 18.9 60.0 12.5
0509 Natural sponges of animal origin. 2.6 1.8 3.0 0.0 15 9.5 35.0 6.5
1504 Fats and oils and their fractions, of fish or marine mammals 3.9 2.3 0.8 3.2 21.7 3.5 10.1
1603 Extracts and juices of aquatic invertebrates. 6.4 10.8 4.3 4.5 25.0 30.9 18.5
1604 Prepared or preserved fish 18.4 9.2 5.2 5.4 25.0 20.0 18.5
1605 Aquatic invertebrates prepared or preserved. 17.6 7.9 2.6 3.2 24.4 20.0 60.0 18.5
2301 Aquatic invertebrates, unfit for human consumption 0.0 0.0 0.0 0.8 4.0 7.4 10.0 8.5
23

Table 11. Applied average tariffs on live, fresh, chilled or frozen crustaceans (0306) and prepared or preserved crustaceans (1605)
Applied average tariffs on 0306 and 1605
Import markets Live, fresh, chilled or frozen crustaceans (0306)
a
Prepared or preserved crustaceans (1605)
b
Tariff escalation
b – a
Escalation rate:
b aa−
(%)
DEVELOPED COUNTRIES
European Union 11.0 17.6 6.6 60.1
Japan 3.8 7.9 4.2 110.9
United States 1.3 2.6 1.4 109.6
Canada 2.7 3.2 0.5 18.3
EMERGING ECONOMIES
China 23.9 24.4 0.4 1.8
Korea, Rep. of 19.4 20.0 0.6 2.9
Poland 28.5 41.4 12.9 45.4
Brazil 12.5 18.5 6.0 48.0
Malaysia 5.4 2.9 -2.5 -46.8
Mexico 28.2 23.0 -5.2 -18.4
Turkey 55.0 57.1 2.1 3.8
Chinese Taipei 28.1 31.8 3.7 13.1
India 15.0 45.0 30.0 200.0
24

Table 12. Leather, rubber and footwear: simple average of applied tariffs
HS 4-digit European Union United States Japan Canada China Mexico Korea, Rep. of Brazil
4001 0.0 0.0 0.0 0.0 24.0 8.0 1.2 6.5 4002 0.2 0.0 0.0 0.0 9.2 13.0 7.4 10.7 4003 0.0 0.0 0.0 0.0 15.0 13.0 8.0 14.5 4004 0.0 0.0 0.0 0.0 10.0 18.0 3.0 14.5 4005 0.0 0.0 0.0 4.3 11.0 14.3 8.0 14.8 4006 0.0 1.9 0.0 4.3 13.0 18.0 8.0 16.5 4007 3.0 0.0 0.0 3.7 15.0 18.0 8.0 12.5 4008 2.5 1.7 0.0 5.0 11.5 16.8 8.0 16.5 4009 2.7 2.5 1.9 5.6 12.0 14.4 8.0 16.5 4010 6.5 4.4 1.3 5.9 10.0 18.0 8.0 16.5 4011 3.9 1.9 0.0 3.0 22.7 17.5 7.8 13.7 4012 3.0 1.0 0.0 3.3 27.1 21.6 7.1 18.5 4013 4.0 1.9 0.0 3.3 15.3 19.0 7.6 18.5 4014 0.0 1.4 0.0 4.3 9.0 18.8 8.0 16.5 4015 3.1 5.3 0.0 9.2 14.0 23.2 8.0 18.5 4016 2.0 2.6 0.0 5.7 15.6 18.5 7.4 17.1 4017 0.0 2.7 0.0 3.3 16.5 16.3 8.0 18.5 4104 5.1 3.1 21.8 2.4 8.8 11.0 5.0 9.7 4105 1.9 1.7 9.4 1.9 14.0 11.3 5.0 11.3 4106 1.9 2.3 9.4 1.1 14.0 11.3 5.0 11.6 4107 1.7 2.6 5.0 1.9 14.0 13.0 5.0 12.1 4108 2.5 3.2 25.0 3.0 14.0 13.0 5.0 12.5 4109 2.5 2.5 25.6 1.0 14.0 13.0 5.0 12.5 4110 0.0 0.0 3.2 0.0 14.0 13.0 3.0 12.5 4111 2.5 0.0 6.4 0.0 14.0 13.0 8.0 12.5 4201 2.7 2.6 5.6 6.0 25.0 35.0 8.0 22.5 4202 5.2 9.9 10.0 8.1 28.6 35.0 8.0 22.5 4203 6.6 7.5 13.9 10.8 25.0 27.7 13.0 22.5 4204 2.5 1.5 11.4 0.0 15.0 18.0 8.0 22.5 4205 2.5 1.7 10.6 0.0 25.0 35.0 8.0 22.5 4302 1.7 2.8 16.3 3.2 23.0 13.0 5.0 16.5 4303 3.7 2.0 20.0 11.9 21.7 35.0 16.0 22.5 4304 3.2 6.5 5.0 15.5 20.0 35.0 8.0 22.5 6401 17.0 24.1 13.4 18.1 25.0 35.0 8.0 22.5 6402 17.0 17.8 10.5 17.0 25.0 35.0 13.0 24.0 6403 7.7 5.7 25.6 14.2 25.0 34.8 13.0 23.0 6404 17.0 26.7 17.5 13.7 25.0 35.0 13.0 25.5 6405 5.6 8.2 17.7 13.3 25.0 35.0 13.0 23.4 6406 3.0 8.1 11.6 7.1 25.0 29.9 8.0 20.5 9605 3.7 8.1 6.6 6.5 25.0 30.0 8.0 20.5 Mean 3.7 4.4 7.6 5.4 17.9 21.3 7.8 17.2
25

Table 13. Tariffs on leather (4104), leather clothing accessories (4203) and leather footwear (6403)
HS 4-digit
Simple average tariffs 4104
a
4203
b b – a
b aa−
(%) 6403
c c – a
c aa−
(%)
Australia 2.5 11.7 9.2 366.8 11.7 9.2 366.8
Canada 2.4 10.8 8.4 355.3 14.2 11.9 500.0
European Union 5.1 6.6 1.5 29.6 7.7 2.7 52.5
Japan 21.8 13.9 -7.8 -36.0 25.6 3.9 17.7
Poland 6.6 23.0 16.4 248.5 12.0 5.4 81.8
Turkey 5.2 6.5 1.3 25.7 21.7 16.5 319.5
United States 3.1 7.5 4.4 141.1 5.7 2.6 83.2
Brazil 9.7 22.5 12.8 132.4 23.0 13.3 137.6
China 8.8 25.0 16.3 185.7 25.0 16.3 185.7
India 0.0 45.0 45.0 … 45.0 45.0 …
Korea, Rep. of 5.0 13.0 8.0 160.0 13.0 8.0 160.0
Malaysia 0.0 9.2 9.2 … 7.5 7.5 …
Mexico 11.0 27.7 16.7 151.5 34.8 23.8 216.2
Chinese Taipei 1.3 10.0 8.8 700.0 4.7 3.5 277.6
26
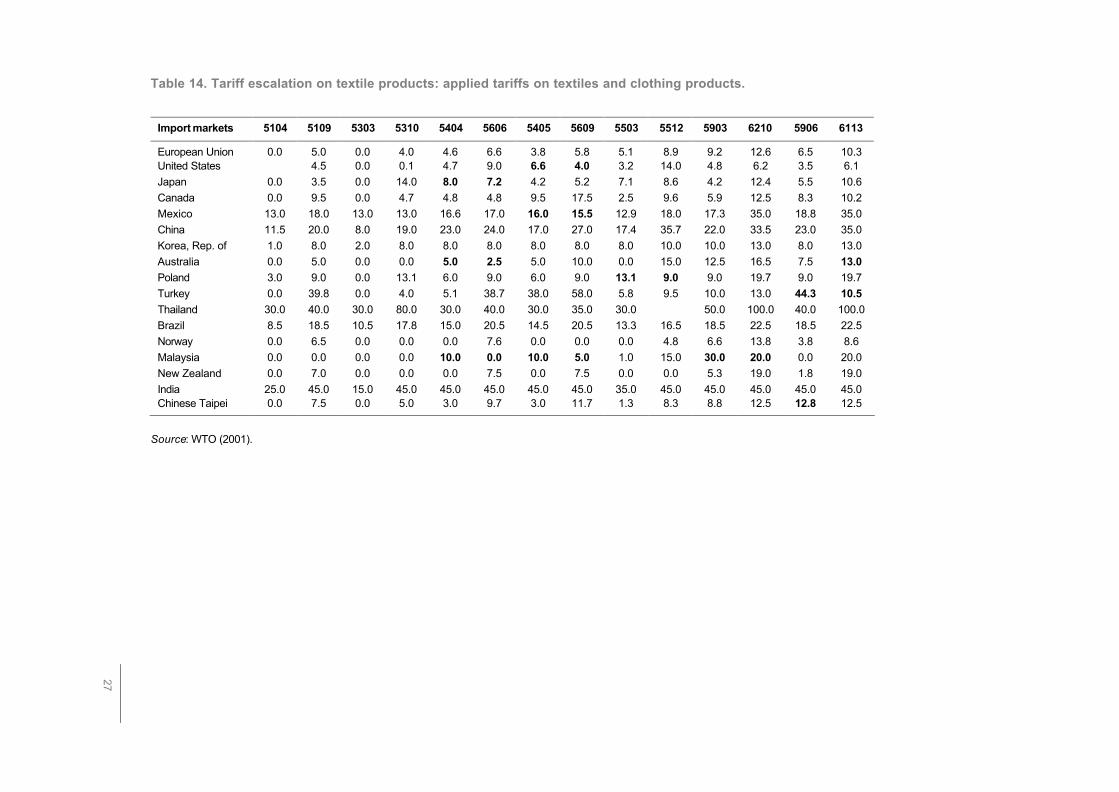
Table 14. Tariff escalation on textile products: applied tariffs on textiles and clothing products.
Import markets 5104 5109 5303 5310 5404 5606 5405 5609 5503 5512 5903 6210 5906 6113
European Union 0.0 5.0 0.0 4.0 4.6 6.6 3.8 5.8 5.1 8.9 9.2 12.6 6.5 10.3 United States 4.5 0.0 0.1 4.7 9.0 6.6 4.0 3.2 14.0 4.8 6.2 3.5 6.1 Japan 0.0 3.5 0.0 14.0 8.0 7.2 4.2 5.2 7.1 8.6 4.2 12.4 5.5 10.6 Canada 0.0 9.5 0.0 4.7 4.8 4.8 9.5 17.5 2.5 9.6 5.9 12.5 8.3 10.2 Mexico 13.0 18.0 13.0 13.0 16.6 17.0 16.0 15.5 12.9 18.0 17.3 35.0 18.8 35.0 China 11.5 20.0 8.0 19.0 23.0 24.0 17.0 27.0 17.4 35.7 22.0 33.5 23.0 35.0 Korea, Rep. of 1.0 8.0 2.0 8.0 8.0 8.0 8.0 8.0 8.0 10.0 10.0 13.0 8.0 13.0 Australia 0.0 5.0 0.0 0.0 5.0 2.5 5.0 10.0 0.0 15.0 12.5 16.5 7.5 13.0 Poland 3.0 9.0 0.0 13.1 6.0 9.0 6.0 9.0 13.1 9.0 9.0 19.7 9.0 19.7 Turkey 0.0 39.8 0.0 4.0 5.1 38.7 38.0 58.0 5.8 9.5 10.0 13.0 44.3 10.5 Thailand 30.0 40.0 30.0 80.0 30.0 40.0 30.0 35.0 30.0 50.0 100.0 40.0 100.0 Brazil 8.5 18.5 10.5 17.8 15.0 20.5 14.5 20.5 13.3 16.5 18.5 22.5 18.5 22.5 Norway 0.0 6.5 0.0 0.0 0.0 7.6 0.0 0.0 0.0 4.8 6.6 13.8 3.8 8.6 Malaysia 0.0 0.0 0.0 0.0 10.0 0.0 10.0 5.0 1.0 15.0 30.0 20.0 0.0 20.0 New Zealand 0.0 7.0 0.0 0.0 0.0 7.5 0.0 7.5 0.0 0.0 5.3 19.0 1.8 19.0 India 25.0 45.0 15.0 45.0 45.0 45.0 45.0 45.0 35.0 45.0 45.0 45.0 45.0 45.0 Chinese Taipei 0.0 7.5 0.0 5.0 3.0 9.7 3.0 11.7 1.3 8.3 8.8 12.5 12.8 12.5
Source: WTO (2001).
27

Table 15. Structure and Protection in Quad Countries facing LDC Exports, 1999
Japan USA Canada EU
Total LDC imports (1) 1019120 6962416 227677 9874807
Total imports in identical product lines (2) 126378101 528279235 83670842 637766105
Total imports (3) 305438116 1015143866 211085424 783684206
LDC share of competitive imports ( (1) / (2) ) 0.81% 1.32% 0.27% 1.55%
LDC share of total imports ( (1) / (3) ) 0.33% 0.69% 0.11% 1.26%
Total tariff lines 545 946 758 2222
in lines with protection 74 335 201 55
of which above 5% 36 282 181 51
LDC Exports entering duty free 498534 3596270 103260 9566647
LDC Exports dutiable 520586 3366146 124417 308160
LDC Exports dutiable above 5 % 226274 3272917 123827 308134
Share of LDC exports facing protection 51.10% 48.30% 54.60% 3.12%
Share of LDC exports facing tariff > 5% 22.20% 47.00% 54.40% 3.12%
Share of lines with tariff 12.10% 17.10% 18.50% 4.20%
Share of lines with tariff > 5% 7.60% 14.10% 12.80% 3.80%
Source: UNCTAD (2001).
28

29
Table 16. Value of duty-free non-oil and non-arm imports into Developed Countries originating from LDCs, 2000
Country Total Imports Duty Free Percent
Australia 124364 68399 55.0
Canada 259467 79296 30.6
European Union 10087639 9811970 97.3
Japan 929948 586430 63.1
New Zealand 11709 9846 84.1
Norway 241834 198071 81.9
Switzerland 98665 20691 20.9
United States 5651546 769033 13.6
Source: Bora (2002).
Chart 1. Share of world exports by type of commodity, 1980-2000
0
5
10
15
20
25
30
35
Primary products Resource basedmanufactures
Low technologymanufactures
Medium technologymanufactures
High technologymanufactures
Per
cent
of w
orld
exp
orts
19802000

30
Chart 2. Share of developing countries in merchandise imports of selected markets, 1990-2000
Chart 3. Overview of Market Access
Developed regions
20
30
40
50
60
1990 91 92 93 94 95 96 97 98 99 2000
Japan
Developing regions
20
30
40
50
60
1990 91 92 93 94 95 96 97 98 99 2000
Latin America
Africa
Developing Asia
Developing regions Developed regionsa
Western Europea
North America
Middle East
a Excluding EU intra-trade.
0
5
10
15
20
25
30
Developed South Asia Middle East Latin America Europe & C.Asia
East Asia & Sub-SaharanAfrica
World
Exp
ort w
eigh
ted
aver
age
tarif
f rat
e
LDC Major Manufacturers Major Petroleum Other Developing
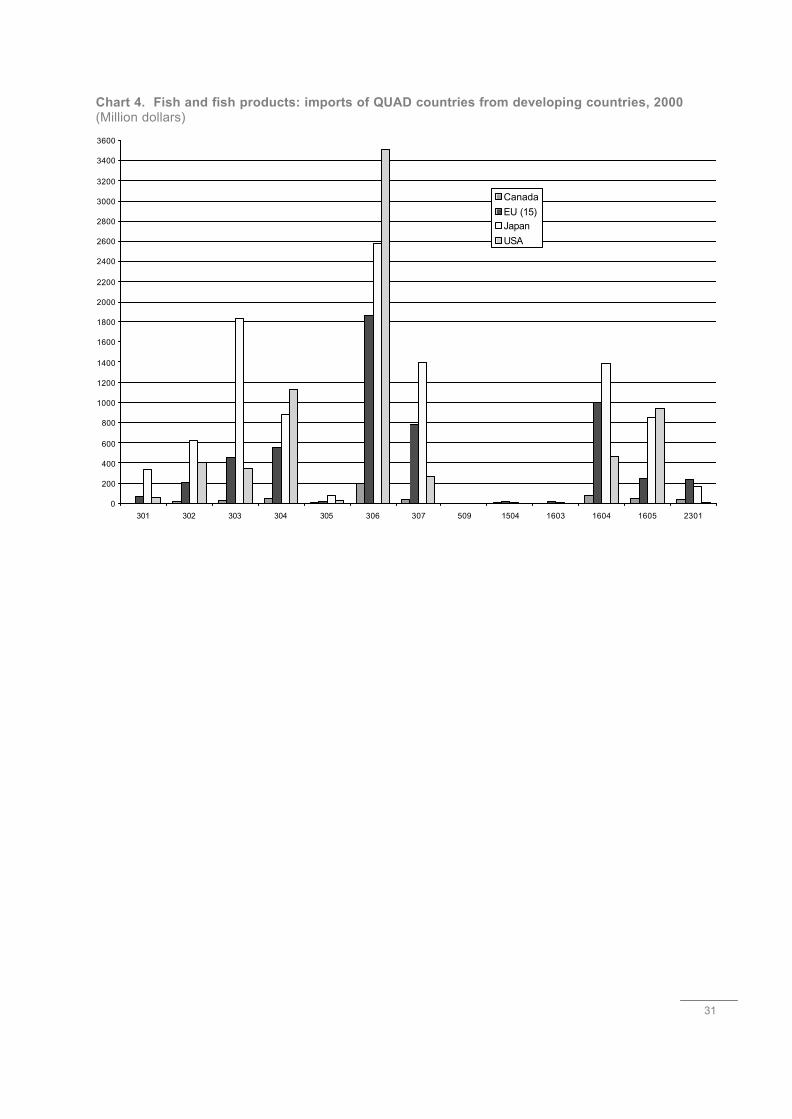
31
0
200
400
600
800
1000
1200
1400
1600
1800
2000
2200
2400
2600
2800
3000
3200
3400
3600
301 302 303 304 305 306 307 509 1504 1603 1604 1605 2301
CanadaEU (15)JapanUSA
Chart 4. Fish and fish products: imports of QUAD countries from developing countries, 2000 (Million dollars)
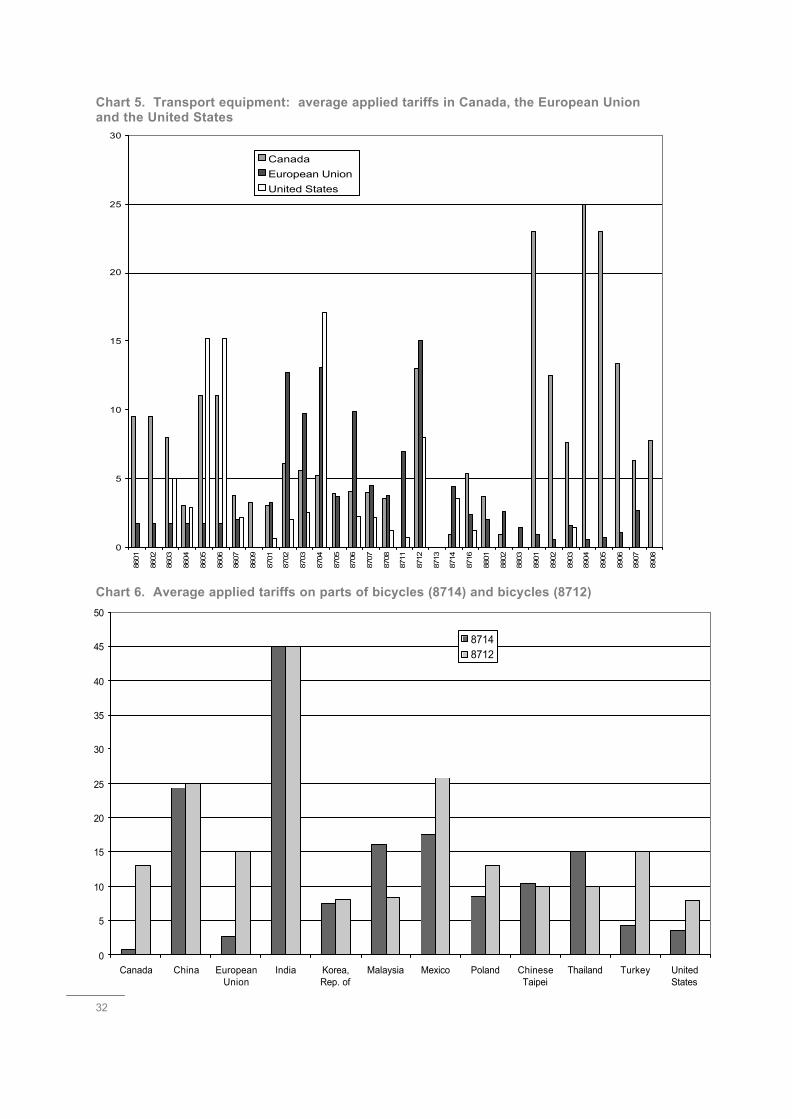
32
0
5
10
15
20
25
3086
01
8602
8603
8604
8605
8606
8607
8609
8701
8702
8703
8704
8705
8706
8707
8708
8711
8712
8713
8714
8716
8801
8802
8803
8901
8902
8903
8904
8905
8906
8907
8908
Canada
European Union
United States
Chart 5. Transport equipment: average applied tariffs in Canada, the European Union and the United States
Chart 6. Average applied tariffs on parts of bicycles (8714) and bicycles (8712)
0
5
10
15
20
25
30
35
40
45
50
Canada China EuropeanUnion
India Korea,Rep. of
Malaysia Mexico Poland ChineseTaipei
Thailand Turkey UnitedStates
87148712

33
Annex Table 1. Merchandise export expansion by region and level of technology, 1980-2000 (Average annual percentage change)
Resource Low Medium High
Primary Based Technology Technology Technology
Products Manufactures Manufactures Manufactures Manufactures
North America 2.2 5.1 8.4 7.0 9.1
Latin America 5.1 5.1 11.8 14.8 21.0
Western Europe 3.5 4.2 4.8 5.5 9.3
EU (15) 2.9 4.1 4.6 5.5 9.4
Transition economies 15.0 17.3 13.8 12.3 12.8
Africa 4.2 2.5 7.7 9.0 12.8
Middle East -0.2 9.3 13.6 13.9 n.a.
Asia 3.7 6.7 8.3 8.1 15.6
Developed countries 3.2 4.5 5.1 5.9 9.5
Developing countries 2.4 6.3 10.4 13.7 19.8
Developing Asia 3.2 7.3 10.2 13.6 19.6
NICs (6) 3.2 7.1 6.7 12.1 18.2
World 3.2 5.2 6.7 6.8 11.3
n.a. not applicable due to low base of 1980 figure.
Annex Table 2. Merchandise import expansion by region and level of technology, 1980-2000 (Average annual percentage change)
Resource Low Medium High
Primary Based Technology Technology Technology
Products Manufactures Manufactures Manufactures Manufactures
North America 3.0 6.5 10.2 9.1 13.7
Latin America 10.5 12.4 16.0 13.3 17.7
Western Europe 1.0 3.6 5.3 6.4 9.6
EU (15) 0.8 3.5 5.2 6.3 9.6
Transition economies 8.3 12.4 16.0 12.6 18.1
Africa 4.1 2.5 2.8 1.6 5.4
Middle East 6.2 6.1 2.3 4.2 8.1
Asia 3.8 6.0 11.0 9.6 15.9
Developed countries 1.6 4.3 7.0 7.3 11.1
Developing countries 6.7 7.9 10.1 9.0 15.6
Developing Asia 6.5 8.1 11.5 10.2 17.1
NICs (6) 6.1 7.8 11.4 9.7 16.7
World 2.7 5.1 7.7 7.9 12.3

34
Annex Chart 1. Share of Primary Products in Latin-American Countries' Merchandise Exports, 1968-70 and 1998-2000
0 10 20 30 40 50 60 70 80 90 100
Dominican Rep.
Mexico
Antigua and Barbuda
St.Kitts and Nevis
Costa Rica
Haiti
Brazil
Dominica
Barbados
El Salvador
Uruguay
Bolivia
Trinidad & Tobago
Grenada
Argentina
Guatemala
Colombia
Honduras
St.Lucia
Cuba
Montserrat
Jamaica
St.Vincent & Grenadines
Chile
Belize
Peru
Panama
Paraguay
Venezuela
Nicaragua
Suriname
Ecuador
Netherlands Antilles
1998-00 1968-70

35
Annex Chart 2. Share of primary products in African countries' merchandise exports, £1968-70 and 1998-2000
0 10 20 30 40 50 60 70 80 90 100
Tunisia
Mauritius
Madagascar
Morocco
South Africa
Senegal
Togo
Egypt
Rwanda
Zimbabwe
Niger
Kenya
Burkina Faso
Tanzania
Gambia
Côte d'Ivoire
Burundi
Sudan
Ghana
Malawi
Mozambique
Cameroon
Uganda
Mali
Benin
Chad
Congo, Dem. Rep.
Guinea Bissau
Congo
Gabon
Algeria
Nigeria
Angola
Liberia
Mauritania
Libya
Zambia
1998-00 1968-70

36
Annex Chart 3. Share of primary products in the Middle East countries' merchandise exports, 1968-70 and 1998-2000
0 10 20 30 40 50 60 70 80 90 100
Israel
Lebanon
Jordan
Cyprus
Bahrain
United Arab Emirates
Oman
Saudi Arabia
Qatar
Syria
Iran
Kuwait
Iraq
1998-00 1968-70

37
Annex Chart 4. Share of primary products in Developing Asian economies' merchandise exports, 1968-70 and 1998-2000
0 10 20 30 40 50 60 70 80 90 100
Macau
Chinese, Taipei
Hong Kong, China
Korea, Rep. of
Nepal
Bangladesh
China
Singapore
Pakistan
Malaysia
India
Thailand
Sri Lanka
Philippines
Cambodia
Indonesia
Lao PDR
Fiji
Myanmar
Vanuatu
Brunei
Tonga
Papua New Guinea
Samoa
1998-00 1968-70

38
ANNEX 1: CORRESPONDENCE BETWEEN MTN CATEGORIES CONSIDERED IN THIS PAPER AND THE HS96 NOMENCLATURE AT THE 4-DIGIT LEVEL AND DESCRIPTION OF HS96 4-DIGIT SUBGROUPS
Fish and fish products 0301 Live fish. 0302 Fish, fresh or chilled, excluding fish fillets and other fish meat of heading No. 03.04. 0303 Fish, frozen, excluding fish fillets and other fish meat of heading No. 03.04. 0304 Fish fillets and other fish meat (whether or not minced), fresh, chilled or frozen.
0305 Fish, dried, salted or in brine; smoked fish, whether or not cooked before or during the smoking process; flours, meals and pellets of fish, fit for human consumption.
0306
Crustaceans, whether in shell or not, live, fresh, chilled, frozen, dried, salted or in brine; crustaceans, in shell, cooked by steaming or by boiling in water, whether or not chilled, frozen, dried, salted or in brine; flours, meals and pellets of crusta
0307
Molluscs, whether in shell or not, live, fresh, chilled, frozen, dried, salted or in brine; aquatic invertebrates other than crustaceans and molluscs, live, fresh, chilled, frozen, dried, salted or in brine; flours, meals and pellets of aquatic invertebra
0509 Natural sponges of animal origin.
1504 Fats and oils and their fractions, of fish or marine mammals, whether or not refined, but not chemically modified.
1603 Extracts and juices of meat, fish or crustaceans, molluscs or other aquatic invertebrates. 1604 Prepared or preserved fish; caviar and caviar substitutes prepared from fish eggs . 1605 Crustaceans, molluscs and other aquatic invertebrates, prepared or preserved.
2301 Flours, meals and pellets, of meat or meat offal, of fish or of crustaceans, molluscs or other aquatic invertebrates, unfit for human consumption; greaves.
Textiles and clothing
3005
Wadding, gauze, bandages and similar articles (for example, dressings, adhesive plasters, poultices), impregnated or coated with pharmaceutical substances or put up in forms or packings for retail sale for medical, surgical, dental or veterinary purposes.
3306 Preparations for oral or dental hygiene, including denture fixative pastes and powders; yarn used to clean between the teeth (dental floss), in individual retail packages.
3921 Other plates, sheets, film, foil and strip, of plastics.
4202
Trunks, suit-cases, vanity-cases, executive-cases, brief-cases, school satchels, spectacle cases, binocular cases, camera cases, musical instrument cases, gun cases, holsters and similar containers; travelling-bags, toilet bags, rucksacks , handbags, shopp
5004 Silk yarn (other than yarn spun from silk waste) not put up for retail sale. 5005 Yarn spun from silk waste, not put up for retail sale. 5006 Silk yarn and yarn spun from silk waste, put up for retail sale; silk-worm gut. 5007 Woven fabrics of silk or of silk waste. 5104 Garnetted stock of wool or of fine or coarse animal hair. 5105 Wool and fine or coarse animal hair, carded or combed (including combed wool in fragments). 5106 Yarn of carded wool, not put up for retail sale. 5107 Yarn of combed wool, not put up for retail sale. 5108 Yarn of fine animal hair (carded or combed), not put up for retail sale. 5109 Yarn of wool or of fine animal hair, put up for retail sale.
5110 Yarn of coarse animal hair or of horsehair (including gimped horsehair yarn), whether or not put up for retail sale.
5111 Woven fabrics of carded wool or of carded fine animal hair. 5112 Woven fabrics of combed wool or of combed fine animal hair. 5113 Woven fabrics of coarse animal hair or of horsehair. 5203 Cotton, carded or combed. 5204 Cotton sewing thread, whether or not put up for retail sale.
5205 Cotton yarn (other than sewing thread), containing 85 % or more by weight of cotton, not put up for retail sale.
5206 Cotton yarn (other than sewing thread), containing less than 85 % by weight of cotton, not put up for retail sale.
5207 Cotton yarn (other than sewing thread) put up for retail sale.
5208 Woven fabrics of cotton, containing 85 % or more by weight of cotton, weighing not more than 200 g/m2.

39
5209 Woven fabrics of cotton, containing 85 % or more by weight of cotton, weighing more than 200 g/m2.
5210 Woven fabrics of cotton, containing less than 85 % by weight of cotton, mixed mainly or solely with man-made fibres, weighing not more than 200 g/m2.
5211 Woven fabrics of cotton, containing less than 85 % by weight of cotton, mixed mainly or solely with man-made fibres, weighing more than 200 g/m2.
5212 Other woven fabrics of cotton.
5303 Jute and other texti le bast fibres (excluding flax, true hemp and ramie), raw or processed but not spun; tow and waste of these fibres (including yarn waste and garnetted stock).
5304 Sisal and other textile fibres of the genus Agave, raw or processed but not spun; tow and waste of these fibres (including yarn waste and garnetted stock).
5305
Coconut, abaca (Manila hemp or Musa textilis Nee), ramie and other vegetable textile fibres, not elsewhere specified or included, raw or processed but not spun; tow, noils and waste of these fibres (including yarn waste and garnetted stock).
5306 Flax yarn. 5307 Yarn of jute or of other textile bast fibres of heading No. 53.03. 5308 Yarn of other vegetable textile fibres; paper yarn. 5309 Woven fabrics of flax. 5310 Woven fabrics of jute or of other textile bast fibres of heading No. 53.03. 5311 Woven fabrics of other vegetable textile fibres; woven fabrics of paper yarn. 5401 Sewing thread of man-made filaments, whether or not put up for retail sale.
5402 Synthetic filament yarn (other than sewing thread), not put up for retail sale, including synthetic monofilament of less than 67 decitex.
5403 Artificial filament yarn (other than sewing thread), not put up for retail sale, including artificial monofilament of less than 67 decitex.
5404
Synthetic monofilament of 67 decitex or more and of which no cross-sectional dimension exceeds 1 mm; strip and the like (for example, artificial straw) of synthetic textile materials of an apparent width not exceeding 5 mm.
5405
Artificial monofilament of 67 decitex or more and of which no cross-sectional dimension exceeds 1 mm; strip and the like (for example, artificial straw) of artificial textile materials of an apparent width not exceeding 5 mm.
5406 Man-made filament yarn (other than sewing thread), put up for retail sale.
5407 Woven fabrics of synthetic filament yarn, including woven fabrics obtained from materials of heading No. 54.04.
5408 Woven fabrics of artificial filament yarn, including woven fabrics obtained from materials of heading No. 54.05.
5501 Synthetic filament tow. 5502 Artificial filament tow. 5503 Synthetic staple fibres, not carded, combed or otherwise processed for spinning. 5504 Artificial staple fibres, not carded, combed or otherwise processed for spinning. 5505 Waste (including noils, yarn waste and garnetted stock) of man-made fibres. 5506 Synthetic staple fibres, carded, combed or otherwise processed for spinning. 5507 Artificial staple fibres, carded, combed or otherwise processed for spinning. 5508 Sewing thread of man-made staple fibres, whether or not put up for retail sale. 5509 Yarn (other than sewing thread) of synthetic staple fibres, not put up for retail sale. 5510 Yarn (other than sewing thread) of artificial staple fibres, not put up for retail sale. 5511 Yarn (other than sewing thread) of man-made staple fibres, put up for retail sale.
5512 Woven fabrics of synthetic staple fibres, containing 85 % or more by weight of synthetic staple fibres.
5513 Woven fabrics of synthetic staple fibres, containing less than 85 % by weight of such fibres, mixed mainly or solely with cotton, of a weight not exceeding 170 g/m2.
5514 Woven fabrics of synthetic staple fibres, containing less than 85 % by weight of such fibres, mixed mainly or solely with cotton, of a weight exceeding 170 g/m2.
5515 Other woven fabrics of synthetic staple fibres. 5516 Woven fabrics of artificial staple fibres.
5601 Wadding of textile materials and articles thereof; textile fibres, not exceeding 5 mm in length (flock), textile dust and mill neps.
5602 Felt, whether or not impregnated, coated, covered or laminated. 5603 Nonwovens, whether or not impregnated, coated, covered or laminated.

40
5604 Rubber thread and cord, textile covered; textile yarn, and strip and the like of heading No. 54.04 or 54.05, impregnated, coated, covered or sheathed with rubber or plastics.
5605 Metallised yarn, whether or not gimped, being textile yarn, or strip or the like of heading No. 54.04 or 54.05, combined with metal in the form of thread, strip or powder or covered with metal.
5606
Gimped yarn, and strip and the like of heading No. 54.04 or 54.05, gimped (other than those of heading No. 56.05 and gimped horsehair yarn); chenille yarn (including flock chenille yarn); loop wale-yarn.
5607 Twine, cordage, ropes and cables, whether or not plaited or braided and whether or not impregnated, coated, covered or sheathed with rubber or plastics.
5608 Knotted netting of twine, cordage or rope; made up fishing nets and other made up nets, of textile materials.
5609 Articles of yarn, strip or the like of heading No. 54.04 or 54.05, twine, cordage, rope or cables, not elsewhere specified or included.
5701 Carpets and other textile floor coverings, knotted, whether or not made up.
5702 Carpets and other textile floor coverings, woven, not tufted or flocked, whether or not made up, including "Kelem", "Schumacks", "Karamanie" and similar hand-woven rugs.
5703 Carpets and other textile floor coverings, tufted, whether or not made up. 5704 Carpets and other textile floor coverings, of felt, not tufted or flocked, whether or not made up. 5705 Other carpets and other textile floor coverings, whether or not made up. 5801 Woven pile fabrics and chenille fabrics , other than fabrics of heading No. 58.02 or 58.06.
5802 Terry towelling and similar woven terry fabrics, other than narrow fabrics of heading No. 58.06; tufted textile fabrics, other than products of heading No. 57.03.
5803 Gauze, other than narrow fabrics of heading No. 58.06.
5804 Tulles and other net fabrics, not including woven, knitted or crocheted fabrics; lace in the piece, in strips or in motifs, other than fabrics of heading No. 60.02.
5805 Hand-woven tapestries of the type Gobelins, Flanders, Aubusson, Beauvais and the like, and needle-worked tapestries (for example, petit point, cross stitch), whether or not made up.
5806 Narrow woven fabrics, other than goods of heading No. 58.07; narrow fabrics consisting of warp without weft assembled by means of an adhesive (bolducs).
5807 Labels, badges and similar articles of textile materials, in the piece, in strips or cut to shape or size, not embroidered.
5808 Braids in the piece; ornamental trimmings in the piece, without embroidery, other than knitted or crocheted; tassels, pompons and similar articles.
5809
Woven fabrics of metal thread and woven fabrics of metallised yarn of heading No. 56.05, of a kind used in apparel, as furnishing fabrics or for similar purposes, not elsewhere specified or included.
5810 Embroidery in the piece, in strips or in motifs.
5811 Quilted textile products in the piece, composed of one or more layers of textile materials assembled with padding by stitching or otherwise, other than embroidery of heading No. 58.10.
5901
Textile fabrics coated with gum or amylaceous substances, of a kind used for the outer covers of books or the like; tracing cloth; prepared painting canvas; buckram and similar stiffened textile fabrics of a kind used for hat foundations.
5902 Tyre cord fabric of high tenacity yarn of nylon or other polyamides, polyesters or viscose rayon.
5903 Textile fabrics impregnated, coated, covered or laminated with plastics, other than those of heading No. 59.02.
5904 Linoleum, whether or not cut to shape; floor coverings consisting of a coating or covering applied on a textile backing, whether or not cut to shape.
5905 Textile wall coverings. 5906 Rubberised textile fabrics, other than those of heading No. 59.02.
5907 Textile fabrics otherwise impregnated, coated or covered; painted canvas being theatrical scenery, studio back-cloths or the like.
5908
Textile wicks, woven, plaited or knitted, for lamps, stoves, lighters, candles or the like; incandescent gas mantles and tubular knitted gas mantle fabric therefor, whether or not impregnated.
5909 Textile hosepiping and similar textile tubing, with or without lining, armour or accessories of other materials.
5910 Transmission or conveyor belts or belting, of textile material, whether or not impregnated, coated, covered or laminated with plastics, or reinforced with metal or other material.
5911 Textile products and articles, for technical uses, specified in Note 7 to this Chapter. 6001 Pile fabrics, including "long pile" fabrics and terry fabrics, knitted or crocheted. 6002 Other knitted or crocheted fabrics.

41
6101
Men's or boys' overcoats, car-coats, capes, cloaks, anoraks (including ski-jackets), wind-cheaters, wind-jackets and similar articles, knitted or crocheted, other than those of heading No. 61.03.
6102
Women's or girls' overcoats, car-coats, capes, cloaks, anoraks (including ski-jackets), wind-cheaters, wind- jackets and similar articles, knitted or crocheted, other than those of heading No. 61.04.
6103 Men's or boys' suits, ensembles, jackets, blazers, trousers, bib and brace overalls, breeches and shorts (other than swimwear), knitted or crocheted.
6104 Women's or girls' suits, ensembles, jackets, blazers, dresses, skirts, divided skirts, trousers, bib and brace overalls, breeches and shorts (other than swimwear), knitted or crocheted.
6105 Men's or boys' shirts, knitted or crocheted. 6106 Women's or girls' blouses, shirts and shirt-blouses, knitted or crocheted.
6107 Men's or boys' underpants, briefs, night-shirts, pyjamas, bathrobes, dressing gowns and similar articles, knitted or crocheted.
6108 Women's or girls' slips, petticoats, briefs, panties, night-dresses, pyjamas, négligés, bathrobes, dressing gowns and similar articles, knitted or crocheted.
6109 T-shirts, singlets and other vests, knitted or crocheted. 6110 Jerseys, pullovers, cardigans, waist-coats and similar articles, knitted or crocheted. 6111 Babies' garments and clothing accessories, knitted or crocheted. 6112 Track suits, ski suits and swimwear, knitted or crocheted. 6113 Garments, made up of knitted or crocheted fabrics of heading No. 59.03, 59.06 or 59.07. 6114 Other garments, knitted or crocheted.
6115 Panty hose, tights, stockings, socks and other hosiery, including stockings for varicose veins and footwear without applied soles, knitted or crocheted.
6116 Gloves, mittens and mitts, knitted or crocheted.
6117 Other made up clothing accessories, knitted or crocheted; knitted or crocheted parts of garments or of clothing accessories.
6201 Men's or boys' overcoats, car-coats, capes, cloaks, anoraks (including ski-jackets), wind-cheaters, wind-jackets and similar articles, other than those of heading No. 62.03.
6202 Women's or girls' overcoats, car-coats, capes, cloaks, anoraks (including ski-jackets), wind-cheaters, wind-jackets and similar articles, other than those of heading No. 62.04.
6203 Men's or boys' suits, ensembles, jackets, blazers, trousers, bib and brace overalls, breeches and shorts (other than swimwear).
6204 Women's or girls' suits, ensembles, jackets, blazers, dresses, skirts, divided skirts, trousers, bib and brace overalls, breeches and shorts (other than swimwear).
6205 Men's or boys' shirts. 6206 Women's or girls' blouses, shirts and shirt-blouses.
6207 Men's or boys' singlets and other vests, underpants, briefs, night-shirts, pyjamas, bathrobes, dressing gowns and similar articles.
6208 Women's or girls' singlets and other vests, slips, petticoats, briefs, panties, night-dresses, pyjamas, négligés, bathrobes, dressing gowns and similar articles.
6209 Babies' garments and clothing accessories. 6210 Garments, made up of fabrics of heading No. 56.02, 56.03, 59.03, 59.06 or 59.07. 6211 Track suits, ski suits and swimwear; other garments.
6212 Brassières, girdles, corsets, braces, suspenders, garters and similar articles and parts thereof, whether or not knitted or crocheted.
6213 Handkerchiefs. 6214 Shawls, scarves, mufflers, mantillas, veils and the like. 6215 Ties, bow ties and cravats. 6216 Gloves, mittens and mitts.
6217 Other made up clothing accessories; parts of garments or of clothing accessories, other than those of heading No. 62.12.
6301 Blankets and travelling rugs. 6302 Bed linen, table linen, toilet linen and kitchen linen. 6303 Curtains (including drapes) and interior blinds; curtain or bed valances. 6304 Other furnishing articles, excluding those of heading No. 94.04. 6305 Sacks and bags, of a kind used for the packing of goods.
6306 Tarpaulins, awnings and sunblinds; tents; sails for boats, sailboards or landcraft; camping goods.
6307 Other made up articles, including dress patterns.

42
6308
Sets consisting of woven fabric and yarn, whether or not with accessories, for making up into rugs, tapestries, embroidered table cloths or serviettes, or similar textile articles, put up in packings for retail sale.
6309 Worn clothing and other worn articles.
6310 Used or new rags, scrap twine, cordage, rope and cables and worn out articles of twine, cordage, rope or cables, of textile materials.
6405 Other footwear.
6406
Parts of footwear (including uppers whether or not attached to soles other than outer soles); removable in-soles, heel cushions and similar articles; gaiters, leggings and similar articles , and parts thereof.
6501 Hat-forms, hat bodies and hoods of felt, neither blocked to shape nor with made brims; plateaux and manchons (including slit manchons), of felt.
6502 Hat-shapes, plaited or made by assembling strips of any material, neither blocked to shape, nor with made brims, nor lined, nor trimmed.
6503 Felt hats and other felt headgear, made from the hat bodies, hoods or plateaux of heading No. 65.01, whether or not lined or trimmed.
6504 Hats and other headgear, plaited or made by assembling strips of any material, whether or not lined or trimmed.
6505
Hats and other headgear, knitted or crocheted, or made up from lace, felt or other textile fabric, in the piece (but not in strips), whether or not lined or trimmed; hair-nets of any material, whether or not lined or trimmed.
6601 Umbrellas and sun umbrellas (including walking-stick umbrellas, garden umbrellas and similar umbrellas).
7019 Glass fibres (including glass wool) and articles thereof (for example, yarn, woven fabrics). 8708 Parts and accessories of the motor vehicles of headings Nos. 87.01 to 87.05.
8804 Parachutes (including dirigible parachutes and paragliders) and rotochutes; parts thereof and accessories thereto.
9113 Watch straps, watch bands and watch bracelets, and parts thereof. 9502 Dolls representing only human beings.
9612 Typewriter or similar ribbons, inked or otherwise prepared for giving impressions, whether or not on spools or in cartridges; ink-pads, whether or not inked, with or without boxes.
Leather, rubber, footwear and travel goods
4001 Natural rubber, balata, gutta-percha, guayule, chicle and similar natural gums, in primary forms or in plates, sheets or strip.
4002
Synthetic rubber and factice derived from oils, in primary forms or in plates, sheets or strip; mixtures of any product of heading No. 40.01 with any product of this heading, in primary forms or in plates, sheets or strip.
4003 Reclaimed rubber in primary forms or in plates, sheets or strip.
4004 Waste, parings and scrap of rubber (other than hard rubber) and powders and granules obtained therefrom.
4005 Compounded rubber, unvulcanised, in primary forms or in plates, sheets or strip.
4006 Other forms (for example, rods, tubes and profile shapes) and articles (for example, discs and rings), of unvulcanised rubber.
4007 Vulcanised rubber thread and cord. 4008 Plates, sheets, strip, rods and profile shapes, of vulcanised rubber other than hard rubber.
4009 Tubes, pipes and hoses, of vulcanised rubber other than hard rubber, with or without their fittings (for example, joints, elbows, flanges).
4010 Conveyor or transmission belts or belting, of vulcanised rubber. 4011 New pneumatic tyres, of rubber.
4012 Retreaded or used pneumatic tyres of rubber; solid or cushion tyres, interchangeable tyre treads and tyre flaps, of rubber.
4013 Inner tubes, of rubber.
4014 Hygienic or pharmaceutical articles (including teats), of vulcanised rubber other than hard rubber, with or without fittings of hard rubber.
4015 Articles of apparel and clothing accessories (including gloves), for all purposes, of vulcanised rubber other than hard rubber.
4016 Other articles of vulcanised rubber other than hard rubber.
4017 Hard rubber (for example, ebonite) in all forms, including waste and scrap; articles of hard rubber.

43
4104 Leather of bovine or equine animals, without hair on, other than leather of heading No. 41.08 or 41.09.
4105 Sheep or lamb skin leather, without wool on, other than leather of heading No. 41.08 or 41.09. 4106 Goat or kid skin leather, without hair on, other than leather of heading No. 41.08 or 41.09. 4107 Leather of other animals, without hair on, other than leather of heading No. 41.08 or 41.09. 4108 Chamois (including combination chamois) leather. 4109 Patent leather and patent laminated leather; metallised leather.
4110 Parings and other waste of leather or of composition leather, not suitable for the manufacture of leather articles; leather dust, powder and flour.
4111 Composition leather with a basis of leather or leather fibre, in slabs, sheets or strip, whether or not in rolls.
4201 Saddlery and harness for any animal (including traces, leads, knee pads, muzzles, saddle cloths, saddle bags, dog coats and the like), of any material.
4203 Articles of apparel and clothing accessories, of leather or of composition leather.
4204 Articles of leather or of composition leather, of a kind used in machinery or mechanical appliances or for other technical uses.
4205 Other articles of leather or of composition leather.
4302
Tanned or dressed furskins (including heads, tails, paws and other pieces or cuttings), unassembled, or assembled (without the addition of other materials) other than those of heading No. 43.03.
4303 Articles of apparel, clothing accessories and other articles of furskin. 4304 Artificial fur and articles thereof.
6401
Waterproof footwear with outer soles and uppers of rubber or of plastics, the uppers of which are neither fixed to the sole nor assembled by stitching, riveting, nailing, screwing, plugging or similar processes.
6402 Other footwear with outer soles and uppers of rubber or plastics.
6403 Footwear with outer soles of rubber, plastics, leather or composition leather and uppers of leather.
6404 Footwear with outer soles of rubber, plastics, leather or composition leather and uppers of textile materials.
6405 Other footwear.
6406
Parts of footwear (including uppers whether or not attached to soles other than outer soles); removable in-soles, heel cushions and similar articles; gaiters, leggings and similar articles, and parts thereof.
9605 Travel sets for personal toilet, sewing or shoe or clothes cleaning. Transport equipment 8601 Rail locomotives powered from an external source of electricity or by electric accumulators. 8602 Other rail locomotives; locomotive tenders.
8603 Self-propelled railway or tramway coaches, vans and trucks, other than those of heading No. 86.04.
8604 Railway or tramway maintenance or service vehicles, whether or not self-propelled (for example, workshops, cranes, ballast tampers, trackliners, testing coaches and track inspection vehicles).
8605
Railway or tramway passenger coaches, not self-propelled; luggage vans, post office coaches and other special purpose railway or tramway coaches, not self-propelled (excluding those of heading No. 86.04).
8606 Railway or tramway goods vans and wagons, not self-propelled. 8607 Parts of railway or tramway locomotives or rolling-stock.
8609 Containers (including containers for the transport of fluids) specially designed and equipped for carriage by one or more modes of transport.
8701 Tractors (other than tractors of heading No. 87.09). 8702 Motor vehicles for the transport of ten or more persons, including the driver.
8703 Motor cars and other motor vehicles principally designed for the transport of persons (other than those of heading No. 87.02), including station wagons and racing cars.
8704 Motor vehicles for the transport of goods.
8705
Special purpose motor vehicles, other than those principally designed for the transport of persons or goods (for example, breakdown lorries, crane lorries, fire fighting vehicles, concrete-mixer lorries, road sweeper lorries, spraying lorries, mobile work
8706 Chassis fitted with engines, for the motor vehicles of headings Nos. 87.01 to 87.05. 8707 Bodies (including cabs), for the motor vehicles of headings Nos. 87.01 to 87.05.

44
8711 Motorcycles (including mopeds) and cycles fitted with an auxiliary motor, with or without side-cars; side-cars.
8712 Bicycles and other cycles (including delivery tricycles), not motorised. 8713 Invalid carriages, whether or not motorised or otherwise mechanically propelled. 8714 Parts and accessories of vehicles of headings Nos. 87.11 to 87.13. 8716 Trailers and semi-trailers; other vehicles, not mechanically propelled; parts thereof. 8801 Balloons and dirigibles; gliders, hang gliders and other non-powered aircraft.
8802 Other aircraft (for example, helicopters, aeroplanes); spacecraft (including satellites) and suborbital and spacecraft launch vehicles.
8803 Parts of goods of heading No. 88.01 or 88.02.
8901 Cruise ships, excursion boats, ferry-boats, cargo ships, barges and similar vessels for the transport of persons or goods.
8902 Fishing vessels; factory ships and other vessels for processing or preserving fishery products. 8903 Yachts and other vessels for pleasure or sports; rowing boats and canoes. 8904 Tugs and pusher craft.
8905
Light-vessels, fire-floats, dredgers, floating cranes, and other vessels the navigability of which is subsidiary to their main function; floating docks; floating or submersible drilling or production platforms.
8906 Other vessels, including warships and lifeboats other than rowing boats.
8907 Other floating structures (for example, rafts, tanks, coffer-dams, landing-stages, buoys and beacons).
8908 Vessels and other floating structures for breaking up.

![External Tariff Liberalization in CARICOM: A Commodity-Level Analysis by Azim Sadikov [IMF Working Paper #WP/08/33 ]](https://img.pdfslide.us/doc/110x75/577cd7161a28ab9e789e06d1/external-tariff-liberalization-in-caricom-a-commodity-level-analysis-by-azim.jpg)