Embed Size (px)
Citation preview

Chapter 7
The New Competitors: IndustrialStrategies of Korea and Taiwan

CONTENTSPage
INTRODUCTION AND SUMMARY . ..*..,....,.,..,*.*****...*..............+.* 295The Role of Industrial Policies: The Debate . . . . . . . . . . . . . . . . . . . . . . . . . . . . . . . . . . . . . 295Summary of Findings . . . . . . . . . . . . . . . . . . . . . . . . . . . . . . . . . . . . . . . . . . . . . . . . . . . . . . . . . 296
KOREA AND TAIWAN: INTERNATIONAL COMPETITIVE POSITION ANDTRADING PATTERNS . . . . . . . . . . . . . . . . . . . . . . . . . . . . . . . . . . . . . . . . . . . . . . . . . . . . . . . . 297
THE ROLE OF GOVERNMENT POLICY: KOREA . . ,** . .* . . . . . . . . * .* . . . . * . . . . , . . 307Exchange Rate and Trade Policies . . . . . . . . . . . . . . . . . . . . . . . . . . . . . . . . . . . . . . . . . . . . . . . 307Development Financing and Foreign Direct Investment . . . . . . . . . . . . . . . . . . . . . . . . . . . 310Tecnology Policies . . . . . . . . . . . . . . . . . . . . . . . . . . . . . . . . . . . . . . . . . . . . . . . . . . . . . . . . . . . 311Case Study: Automobiles . . . . . . . . . . . . . . . . . . . . . . . . . . . . . . . . . . . . . . . . . . . . . . . . . . . . . . 314Case Study: Semiconductors . . . . . . . . . . . . . . . . . . . . . . . . . . . . . . . . . . . . . . . . . . . . . . . . . . . . 316
THE ROLE OF GOVERNMENT POLICY: TAIWAN ● . . . . . . . . . . . , . * . . * * . * . * . . . . * . . 321Exchange Rate and Trade Policies . . . . . . . . . . . . . . . . . . . . . . . . . . . . . . . . . . . . . . . . . . . . . . . 322Development Financing and Foreign Direct Investmemt . . . . . . . . . * * ., . . . * * .*...,... 323Technology Policies . . . . . . . . . . . . . . . . . . . . . . . . . . . . . . . . . . . . . . . . . . . . . . . . . . . . . . . . . . . 324Case Study: Automobiles . . . . . . . . . . . . . . . . . . . . . . . . . . . . . . . . . . . . . . . . . . . . . . . . . . . . . . 327case study: semiconductors . . . . . . . . . . . . . . . . . . . . . . . . . . . . . . . . . . . . . . . . . . . . . . . . . . . . 329
KOREA AND TAIWAN: SIMILARITIES AND DIFFERENCES ................... 332
F i g u r e sFigure Page7-1. Per Capita Gross Domestic Product in Korea 1960-88 . . . . . . . . . . . . . . . . . . . . . . . . . 2977-2. Korean Exports and Imports as Percent of GNP, 1960-90 . . . . ● . . ● . . . . ● .,........ 2977*3. Taiwanese Exports and_ as Percent of GNP, 1960-89 . . . . . . . . . . . . . . . . . . . . 2977-4. Major Korean Trading Partners, 1970-89 . . . . . . . . . . . . . . . . . . . . . . . . . . . . . . . . . . . . . . 3057.5. Major Taiwanese Trading Partners, 1970-89 . . . . . . . . . . . . . . . . * . . . . . , . **** , .**** , 306745. Korean Automobile Production . . . * . . . . . . . . . . . . . . . . . * . . . . , . * . . , * . * * , . * . * . * * * . 3147-7. Korean Computer Industry Exports and Production by Product . . . . . . . . . . . . . . . . . . 319
TablesTable Page
7-1. Korea and Taiwan:Basic Economic Indicators, 1956-88 ......., *.., ● ,... ● . . . ● 2 9 67-2. Korea and Taiwan: Changes in Industrial Structure, 1970-1988 . . . . . . . . . . . ,..., 2987-3, Korea:Revealed Comparative Advantage . . . . . . . . . . . . . . . . . . . . . . . . . . . . . . . . . . . . 2997-4 Taiwan:Revealed Comparative Advantage. i ● ● .+, ● ● ● ● ● * ● ● ● ● ● ● ● ● ● . ● . . ● ● . . ● . * . . . 3017-5. Country Destination of Korean Exports, 1970-89 Major Tradong Partners ....... 3037-6. Country Source of Korean Imports, l970-89 Major Trading Partners. ● ● ● . . . . ● . ,. 3037-7. Country Destination of Taiwanese Exports, 1970-89 Major Trading Partners ..,. 3047-8. Country Source of Taiwanese Imports, 197(3-89 Major Trading Partners . . . . . . . . 3047-9. Shares of U.S. Majority-owned Foreign Affiliates in Total Exports? Of
Manufactures, Selected Countries, 1977 and 1983 . . . . . . . . . . . . . . . . . . . . . . . . . . . . . 3077-10. Korea: Major Govrnment h Institutes in 1985 . . . . . . . . . . . . . . . . . . . . . . . . . 313 Researc7-11. Taiwan: Major Government Research Institues in 1990 . . . ● . ● . . . . . ● . . . . . . . ● , ● . 3247-12. Taiwan Auto Industry External Sources of Capital and Technology ............ 329

Chapter 7
The New Competitors: Industrial Strategies ofKorea and Taiwan
INTRODUCTION AND SUMMARYTen years ago, the debates about competitiveness,
industrial and trade policy, and America’s role in thePacific Basin centered almost exclusively on Japan.In the last decade, other East Asian countries havealso increased their exports of manufactured goods.Most prominent are the so-called ‘newly industrial-izing countries’ or NICs: the Republic of Korea, theRepublic of China, Hong Kong, and Singapore.From 1980 to 1988, the four NICs increased theirshare of U.S. manufactured imports from 13 to 18Percent. 1
This chapter is about the two larger East AsianNICs, the Republic of Korea and the Republic ofChina (hereafter Korea and Taiwan). In less than 30years they have risen far up the competitive hierar-chy of nations, becoming much more importantworld traders overall and contending in severalcapital- and technology-intensive industries. Taiwanbecame the world’s 10th biggest exporter of manu-factures in 1986, up from 28th in 1965. Korea was13th, up from 33rd. As suppliers of manufacturedgoods to the U.S. market, they ranked 4th and 5th in1989, up from 21st and 40th, respectively, in 1962.2
Korea and Taiwan remain relatively poor. Korea’sper-capita income is comparable to Portugal’s, andTaiwan has only recently crossed the World Bank’sthreshold for high-income countries.3 Their overallrole in the world economy must also be kept inperspective. Their combined gross domestic product(GDP) accounts for only 1.5 percent of world GDP,excluding the socialist countries, compared to Japan’s10.3 percent; their share of manufactured exportsaccounts for 4.9 percent of world manufacturedexports, compared to Japan’s 14.9 percent and 11.9percent for the United States.4
Nonetheless, the ability of both Korea and Taiwanto move from the export of light, labor-intensivemanufactures to competitive strength in highertechnology industries remains impressive. For ex-ample, Korea is now the third largest producer oflarge capacity (VLSI) memory chips, after Japan andthe United States. Taiwan is not far behind the worldleaders in some kinds of semiconductor design, and
has recently opened a state-of-the-art semiconductorfabrication facility for customized (ASIC) chips.Both have established important export niches incomputers, peripherals, and add-ens.
Several other capital- or technology-intensiveindustries in both countries are competitive, includ-ing specialty steel and petrochemicals. Taiwan is theI0th largest machine tool producer in the world, withparticular strength in numerically controlled ma-chine tools at the lower precision end of the range.Korea may become the first new producer since theJapanese to break into the oligopolistic world carindustry. Firms from both countries are enteringalliances with multinationals from North America,Japan, and Europe to develop products for bothworld and Asian markets.
The Role of Industrial Policies: The Debate
Much of the literature about the economic pros-perity of the East Asian NICs falls into one of severalschools of thought. One argues that the maincontributions of government in Japan, Korea, andTaiwan were to manage price incentives, particu-larly through the exchange rate and trade policy, toprovide infrastructure and a favorable environmentfor investment, and to maintain macroeconomicstability. Writers in this school may grant thatgovernments intervened to promote industrial devel-opment in Korea and Taiwan, but say these actionswere hardly more responsible for the successes thanthe rooster is responsible for the dawn. They notethat intervention in Korea and Taiwan was lesspervasive than in most other developing countries,yet the outcomes were better.5
The second school sees government actions asmore influential. In the strongest version, the state isthe primary cause of rapid growth.6 An alternativeline of “ thinking focuses on the role of government inovercoming the problems of technology acquisitionand adaptation.7 Another argues that specific indus-trial policies can help gain entry into oligopolisticmarkets with high entry barriers, imperfect competi-tion, and high returns.8
A more political view examines the way particu-lar institutional arrangements affect the efficacy of
–295–

296 . Competing Economies: America, Europe, and the Pacific Rim
any state intervention. For example, some argue thatpublic and private information-sharing in “policynetworks” account for the high quality of govern-ment actions in Japan; these arguments apply toKorea and Taiwan as well.9 Others concentrate onthe political conditions that made for flexiblemarkets in the NICs, such as weak labor movementsand leftist parties, and strong, authoritarian leader-ships.10
Summary of Findings
Korean and Taiwanese policies for industrialpromotion did influence market incentives andmarket outcomes in a growth-promoting direction. Ifthe measures these countries took were not alwaysefficient in a purely economic sense, they werehighly effective in promoting private sector growth.True, their effectiveness depends on price incentivesand an ample supply of well-educated workers andenergetic entrepreneurs. But these policies andconditions are a matter of industrial policy andgovernment intervention.
The industrial and trade policies of Korea andTaiwan are similar in many respects. Both share acommitment to long-term planning, constructingbroad visions of the direction that economic growthought to take and the specific industries to beencouraged. Both have tied themselves closely to
world markets, forcing their firms to compete in theworld arena while nurturing them at home.
But, there are significant differences in thepolicies of the two countries. For example, inTaiwan the economy has been more open than inKorea, industrial policy has been less directive andinterventionist, and the industrial structure lessconcentrated; at the same time, there is a greaterreliance on public enterprises. These differencesshow that there is more than one viable approach toindustrial promotion and more than one set ofconditions under which it can work.
Until recently, Korea had a relatively protectedhome market. But protection aimed at assistingprotected industries to become internationally com-petitive. Protection against selected imports wasoften coupled with offsetting incentives for exportsale. For example, exporters could get permissionand needed foreign exchange to import neededinputs (raw materials, components, and machinery),as could domestic suppliers who provided interme-diate inputs to exporters. In the mid-1960s the exportdrive became a top priority, second only to nationaldefense, with the President himself leading monthlygovernment/industry Export Promotion Meetings.Korean policy forced firms to set their competitivesights to the world standard, but provided a domesticsafe haven from the world’s premier companies.
Table 7-l—Korea and Taiwan: Basic Economic Indicators, 1956-88 (annual averages)
1956-60 1961-65 1966-70 1971-75 1976-80 1981-85 1986-88
Real GDPa growthKorea . . . . . . . . . . . . . . . . . . . . 3.3 6.5 12.7 9.0 7.6 7.6 10.5Taiwan . . . . . . . . . . . . . . . . . . . 6.7 10.1 10.0 7.8 10.7 6.7 10.3
Export growthKorea . . . . . . . . . . . . . . . . . . . . 12.9 39.6 32.0 32.5 15.3 12.6 18.0Taiwan . . . . . . . . . . . . . . . . . . . 27.9 25.8 27.2 29.2 29.3 11.6 12.6
Import growthKorea . . . . . . . . . . . . . . . . . . . . 1.4 6.3 33.8 10.8 14.9 9.2 12.5Taiwan . . . . . . . . . . . . . . . . . . . 23.7 16.2 22.7 33.8 25.9 2.7 21.2
Investment/GDPKorea . . . . . . . . . . . . . . . . . . . . 10.5 13.1 23.4 23.1 28.7 28.4 28.2Taiwan . . . . . . . . . . . . . . . . . . . 14.2 15,2 24.9 30.1 30.8 23.8 20.4
Exports/GDPKorea . . . . . . . . . . . . . . . . . . . . 7.4 6.0 10.4 23.8 39.3 39.9 40.3Taiwan . . . . . . . . . . . . . . . . . . . 10.2 16.9 25.0 41.7 50.9 53.9 59.0
lmports/GDPKorea . . . . . . . . . . . . . . . . . . . . 11.7 13.0 25.6 34.8 48.6 41.3 32.7Taiwan . . . . . . . . . . . . . . . . . . . 16.6 20.1 26.1 41.1 48.2 45.6 42.3
aGDP.gross domestic product
SOURCES: Taiwan Statistical Data Book; Directorate-General of Budget, Statistics and Accounting, QuarterlyNational Economic Trends; National Bureau of Statistics, Economic Planning Board, Korea StatisticalYearbook; Peter Petri, “Korea’s Export Niche,” llkvfdDeve/oprnent, vol. 16, No. 1, 1988, p. 48.

Chapter 7—The New Competitors: Industrial Strategies of Korea and Taiwan ● 297
Figure 7-l—Per Capita Gross Domestic Product inKorea, 1960-88
Current U.S. dollars (thousands)4 ~
Year
SOURCE: World Bank, Wodd Tables, 1989-90 (Washington, DC: WorkfBank, 1980) and International Monetary Fund, /nternafiona/t%anaal Statistics, various issues.
In the 1980s both countries liberalized theireconomies, moving away from directive industrialpolicies. This meant not an abandonment of indus-trial policy, but rather closer consultation andlinkages with the private sector, support for privatesector initiatives, and greater emphasis on econo-
mywide policies such as manpower, infrastructure,and R&D. Technology policies became particularlyimportant in the 1980s, as both countries sought todevelop an indigenous technological base.
KOREA AND TAIWAN:INTERNATIONAL COMPETITIVE
POSITION AND TRADINGPATTERNS
Korea and Taiwan have maintained high growthrates since their transition to an outward-oriented
strategy in the early 1960s (table 7-1 and figure 7-l).
This performance has been led both by high rates of
export growth, particularly in the 1960s and 1970s,
and by high rates of import growth (figures 7-2 and
7-3). The openness of the economy—i.e., its expo-
sure to international trade--can be measured by the
ratio of exports and imports to gross domestic
product (GDP). Both Korea and Taiwan have
become more open in this sense, even if their trade
policies have not always been fully liberal. Both
countries have had high levels of domestic invest-
ment, though Taiwan’s flagged somewhat in the
1980s.
Figure 7-2—Korean Exports and Importsas Percent of GNP, 1960-90
50% [ I
40% -
30% -
20% -
‘:~1 9 6 0 6 2 6 4 6 6 6 8 7 0 7 2 7 4 7 6 7 8 8 0 8 2 8 4 8 6 8 8 9 0
— E x p o r t s / G N P ~ imports/GNP
SOURCE: World Bank, Wotid Tables, 1989-90 (Washington, DC: WorldBank), July 1991; and International Monetary Fund, /nterna-tionalFinancial Statistics, (Washington, DC: International Mone-tary Fund, July 1991).
Figure 7-3—Taiwanese Exports and Imports asPercent of GDP, 1960-89
60% -
I
50% -
40%
30%
20%~1
10%Y Io% , 1 I 1 1 1 1 1 I ( I 1 1 1 1 1 1 1 I 1 1 1 1 1 1 1 1 i I196062 64 66 68 70 72 74 76 78 80 82 84 86 88
~ Imports / GDP ~ Exports / GDP
SOURCE: Republic of China, Council for Planning and Development,Taiwan Statistical Data Book, Taipei, Ta”hvan 1989.
Rapid growth accompanies impressive structuralchange (table 7-2). Taiwan had 30 percent of GDP
in manufacturing by 1970; Korea took another
decade to reach that level. Agriculture remained
larger in Korea than in Taiwan, despite a plunge in
agriculture’s share of output over the 1970s and
1980s. Table 7-2 shows that finance, insurance, real
estate and business services were more developed in
Taiwan until 1980, when Korea’s service sector took
off.
An analysis of the export performance of the twocountries falls under two topics: the product compo-

298 ● Competing Economies: America, Europe, and the Pacific Rim
Table 7-2—Korea and Taiwan: Changes in Industrial Structure, 1970-1988 (percentages of output by sector/GDP)
1970 1975 1980 1985 1988
Korea Taiwan Korea Taiwan Korea Taiwan Korea Taiwan Korea Taiwan
Gross domestic product . . . . . . . . . . . . 100.0 - - - --- - --- - -- “ - -- ‘ - - - --- “ - -- “ - --Agriculture, forestry, fishing . . . . . . . . . 26.8Mining and quarrying . . . . . . . . . . . . . . . 1.5Manufacturing . . . . . . . . . . . . . . . . . . . . . 20.8Electricity, gas, water . . . . . . . . . . . . . . . 1.6Construction . . . . . . . . . . . . . . . . . . . . . . 5.5Wholesale and retail trade,
restaurants, and hotels . . . . . . . . . . . 18.2Transport, storage, and
communication . . . . . . . . . . . . . . . . . . 6.8Finance, insurance, real estate,
business services . . . . . . . . . . . . . . . 3.0Community, personal, and social
services . . . . . . . . . . . . . . . . . . . . . . . . 7.5Producers of government services . . 5.0Producers of private non-profit
institutions serving households .,. 3.1Domestic services of households . . .Less imputed bank service charge . .Plus import duties . . . . . . . . . . . . . . . . . .
SOURCES: Directorate-General of Budget, Accounting and Statistics, Republic of China; Quarterly National Economic Trends, Taiwan Area, Republic ofChina; Bank of Korea, Economic Statistics Yearbook.
100.0 100.015.5 24.9
1.3 1.529.2 26.5
2.4 1.33.9 5.1
14.5 19.4
6.0 6.2
9.8 3.4
3.0 6.911.5 4.0
0.3 3.30.32.24.6
100.0 100.012.7 16.3
1.2 1.430.9 29.6
2.6 2.35.3 9.4
13.2 18.0
6.0 6.3
10.5 4.8
3.9 8.110.5 4.9
0.3 4.10.33.05.7
100.07.7
36.02.56.3
13.1
6.0
12.7
4.09.7
0.20.44.85.2
100.012.8
30.32.87.7
12.2
7.6
11.8
4.17.2
2.5
2.82.7
100.05.80.6
37.64.04.1
13.8
6.4
13.8
4.710.3
0.20.65.13.3
100.010.80.7
31.62.88.1
12.3
7.3
13.2
47
2.5
32.6
100.05.0
37.83.24.3
14.3
6.2
15.7
4.89.6
0.30.55.43.4
sition of exports, and the market or geographic
composition of exports. To analyze the productcomposition of exports, we have calculated meas-
ures of “revealed comparative advantage” (RCA)for all export product groups from 1980 through1986, the last year when data was available. TheRCA index shows each country’s share of worldexports in a given product relative to that country’sshare of world exports of all manufactured products(making the denominator constant in all calcula-
tions). If this ratio is less than 1, the country’s share
in the product is less than the country’s share of
world trade. On the other hand, if the country has anRCA higher than 1 in a given product category, itreflects a larger market share than would be pre-dicted on the basis of aggregate exports alone. TheRCA index is a rough gauge of competitiveness; thehigher the index, the larger the country’s share inthose markets.
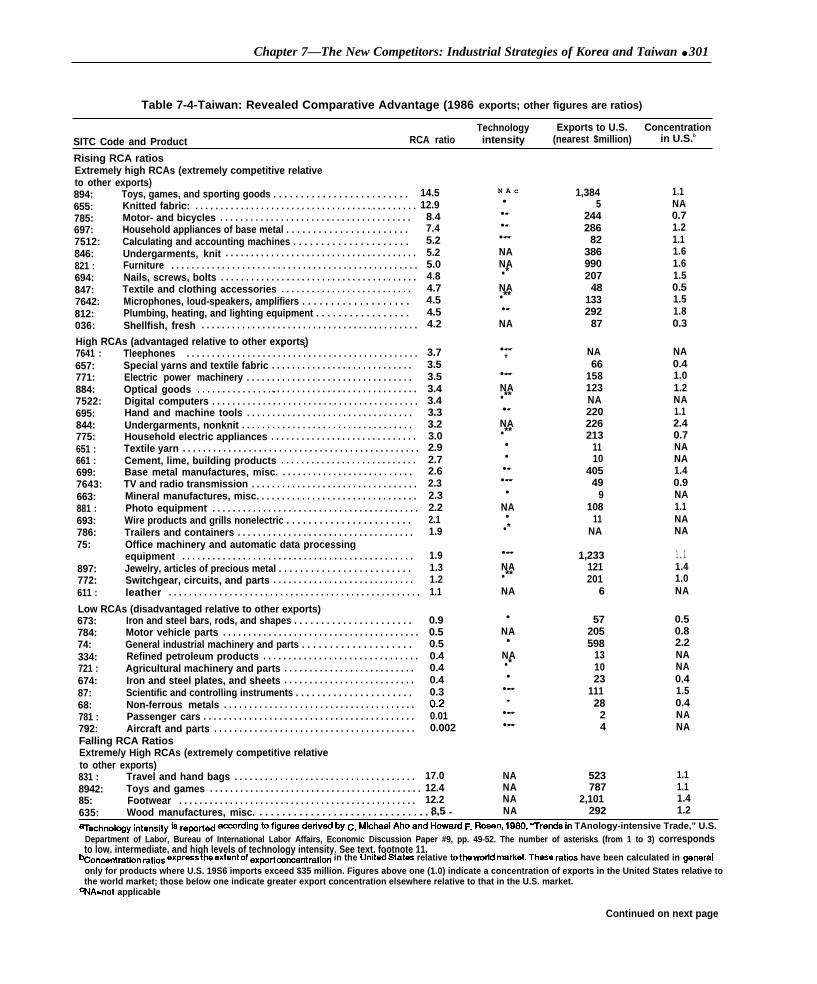
Tables 7-3 and 7-4 divide the exports of the twocountries into six groupings, first, on the basis ofwhether the RCA for the product is extremely high(over 4), high (1 to 4) or low (below 1); and, second,on the basis of whether it has risen or fallen between1980 and 1986. We have also examined the technol-ogy intensity of these sectors, using a measure
constructed on the basis of applied R&D expendi-
ture. Though the data on R&D expenditure is dated
and does not cover all sectors, it does provide
indications. We have divided the products into those
with high (***), intermediate (**), and low technol-ogy intensity (*). ll
The tables show two other figures relevant toassessing the performance of Korea and Taiwan inthe U.S. market. The first is aggregate exports indollars. The second is an index, similar to the RCA,that measures the extent to which exports areconcentrated on the U.S. market. A ranking of 1indicates that the share of exports to the UnitedStates in the given product is equal to the share of
exports to the United States in the country’s totalexports. A number higher than 1 indicates that Korea
and Taiwan export a larger share of that product to
the United States than they do of total exports,
reflecting a dependence on the U.S. market and/or a
competitive advantage vis-à-vis the United States.
The products with high and rising RCAs representleading export sectors. What is surprising is thediversity of sectors represented. Korea has devel-
oped strong international competitiveness in the
capital-intensive shipbuilding industry, a target of
industrial policy in the late 1970s. Korea also shows
strength in a range of consumer electronics products
that are technology intensive, excelling in the more
standardized segments. Yet Korea has also increased
competitiveness in toys, games, and sporting goods,
a low technology, tight-manufacturing sector that is
typically labor-intensive.

Chapter 7—The New Competitors: Industrial Strategies of Korea and Taiwan ● 299
Table 7-3-Korea: Revealed Comparative Advantage (1986 exports; other figures are ratios)
Technology Exports to U.S. ConcentrationSITC Code and Product RCA ratio intensity (nearest $million) in U.S.b
Rising RCA ratiosExtremely high RCAs (extremely competitive relativeto other exports)7528: Offline data processing equipment . . . . . . . . . . . . . . . . . . . . . . . . .793: Ships and boats . . . . . . . . . . . . . . . . . . . . . . . . . . . . . . . . . . . . . . . . . .894: Toys, games, and sporting goods . . . . . . . . . . . . . . . . . . . . . . . . .762: Radios . . . . . . . . . . . . . . . . . . . . . . . . . . . . . . . . . . . . . . . . . . . . . . . . . . .037: Preserved fish and shellfish . . . . . . . . . . . . . . . . . . . . . . . . . . . . . .
High RCAs (advantaged relative to other exports)898: Musical instruments, recorded discs and tapes . . . . . . . . . . . . .763: Sound recorders, VCRs . . . . . . . . . . . . . . . . . . . . . . . . . . . . . . . . . .775: Household electric appliances . . . . . . . . . . . . . . . . . . . . . . . . . . . . .7643: TV, radio transmittal . . . . . . . . . . . . . . . . . . . . . . . . . . . . . . . . . . . . . .7641 : Telephones . . . . . . . . . . . . . . . . . . . . . . . . . . . . . . . . . . . . . . . . . . . . . .764: Telecommunications . . . . . . . . . . . . . . . . . . . . . . . . . . . . . . . . . . . . .7781 : Batteries, etc. . . . . . . . . . . . . . . . . . . . . . . . . . . . . . . . . . . . . . . . . . . . .
Low RCAs (disadvantaged relative to other exports)75:
655:781 :334:792:582:056:785:.744:821 :881:611 :74:68:7783:784:
Office machinery, automatic data processing equipment(includes digital computers) . . . . . . . . . . . . . . . . . . . . . . . . . . . . . . .
Knitted fabric . . . . . . . . . . . . . . . . . . . . . . . . . . . . . . . . . . . . . . . . . . . .
Passenger oars . . . . . . . . . . . . . . . . . . . . . . . . . . . . . . . . . . . . . . . . . .Refined petroleum products . . . . . . . . . . . . . . . . . . . . . . . . . . . . . . .Aircraft and parts . . . . . . . . . . . . . . . . . . . . . . . . . . . . . . . . . . . . . . . .Plastics, condensed . . . . . . . . . . . . . . . . . . . . . . . . . . . . . . . . . . . . . .Vegetables, preserved . . . . . . . . . . . . . . . . . . . . . . . . . . . . . . . . . . . .Motorcycles and bicycles . . . . . . . . . . . . . . . . . . . . . . . . . . . . . . . . .Mechanical handling equipment and parts . . . . . . . . . . . . . . . . . .Furniture . . . . . . . . . . . . . . . . . . . . . . . . . . . . . . . . . . . . . . . . . . . . . . . . .Photo equipment . . . . . . . . . . . . . . . . . . . . . . . . . . . . . . . . . . . . . . . . .Leather . . . . . . . . . . . . . . . . . . . . . . . . . . . . . . . . . . . . . . . . . . . . . . . . . .General industrial machinery and parts . . . . . . . . . . . . . . . . . . . .Nonferrous metals . . . . . . . . . . . . . . . . . . . . . . . . . . . . . . . . . . . . . . . .Auto electronics . . . . . . . . . . . . . . . . . . . . . . . . . . . . . . . . . . . . . . . . . .Motor vehiclw parts . . . . . . . . . . . . . . . . . . . . . . . . . . . . . . . . . . . . . . .
Falling RCA ratiosExtremely high RCAs (extremely competitive relativeto other exports)831: Travel and hand bags . . . . . . . . . . . . . . . . . . . . . . . . . . . . . . . . . . . .85: Footwear . . . . . . . . . . . . . . . . . . . . . . . . . . . . . . . . . . . . . . . . . . . . . . .653: Woven synthetic fabric . . . . . . . . . . . . . . . . . . . . . . . . . . . . . . . . . . .761 : Televisions . . . . . . . . . . . . . . . . . . . . . . . . . . . . . . . . . . . . . . . . . . . . . . .786: Trailers and containers . . . . . . . . . . . . . . . . . . . . . . . . . . . . . . . . . . .696: Cutlery . . . . . . . . . . . . . . . . . . . . . . . . . . . . . . . . . . . . . . . . . . . . . . . . . . .84: Wearing apparel and accessories . . . . . . . . . . . . . . . . . . . . . . . . . .034: Fish, fresh . . . . . . . . . . . . . . . . . . . . . . . . . . . . . . . . . . . . . . . . . . . . . . . .6 9 3 Wire products, nonelectric . . . . . . . . . . . . . . . . . . . . . . . . . . . . . . . .697: Household appliances of base metal . . . . . . . . . . . . . . . . . . . . . . .7642: Microphones, loudspeakers, amplifiers . . . . . . . . . . . . . . . . . . . . .High RCAs (advantaged relative to other exports)625: Rubber tires and tubes . . . . . . . . . . . . . . . . . . . . . . . . . . . . . . . . . . . .776: Transistors, valves, diodes, cathode tubes, semiconductors . . .76: Telecommunications and sound recording and
reproducing equipment . . . . . . . . . . . . . . . . . . . . . . . . . . . . . . . . . . .661: Cement, lime, building products . . . . . . . . . . . . . . . . . . . . . . . . . . .036: Shellfish. fresh . . . . . . . . . . . . . . . . . . . . . . . . . . . . . . . . . . . . . . . . . . .
24.57.46.36.04.0
3.93.33.12.12.11.71.3
0.90.80.80.70.60.60.60.60.50.50.50.30.30.20.20.2
12.39.38.47.56.25.95.44.74.34.34.0
3.53.5
3.33.23.0
● ☛☛
● ☛
N Ac
● **
NA
NA- *
● **
● **
● W
● * *
● *
● * *
●
+ + *
NA● * *
● * *
NA● * *
NANANANA
●
*
● *
● *
NANA
●
● * *
NA● *
NANA
●
NA● **
NANA
* *●
NA
NA6
684214
41
241358339
44NA
12
5154
7993815
NA11165754182
182149
56
3311,489
197442NA66
2,52973739545
186647
1,5801224
NANANA0.80.4
1.01.21.51.3NA1.70.9
1.3NA1.50.2NANANANA1.41.2NANA1.5NA8.21.1
1.31.80.31.4NA1.11.20.41.21.02.3
0.91.0
1.3NANA
aTechnology intensity is reported according to figures derived by C. Michael Aho and Howard F. Rosen, 1980, “Trends in TII-inteneive Trade,” U.S.Department of Labor, Bureau of International Labor Affairs, Ec@nomic D&cueeion paper #9, pp. 4952. The number of aeterbks (from 1 to 3) correspondsto low, intermediate, and high levels of technology Mrwity. See text, foo?note 11.
bncentration tise~r-stheetiti ofex~mtimtti intheUnitedStatee relative totheworldmarket. Theeeratios have beencalcufated ingonerafonly for producte where U.S. 13SS imports exceed $35 million. Figur- above one(10) indicate a m~tti of e- ~ th ~~~ stat= r~ti~ tothe world market; thoee below one indicate greater export concentration elsewhere reJative to that in the U.S. market.
WA-not appticabte
Continued on next page

300 ● Competing Economies: America, Europe, and the Pacific Rim
Table 7-3-Korea: Revealed Comparative Advantage (1986 exports; other figures are ratios)-Continued
Technology Exports to U.S. ConcentrationSITC Code and Product RCA ratio intensity (nearest $million) in U.S.b
651,652,654,657: Various textiles . . . . . . . . . 2.9 to 2.1 ●. . . . . . . . . . . . . . . . . . . . . . . . . . . . . . . . . . 118 <1672: iron and steeL primary forms . . . . . . . . . . . . . . . . . . . . . . . . . . . . . . .666: Pottery . . . . . . . . . . . . . . . . . . . . . . . . . . . . . . . . . . . . . . . . . . . . . . . . .694: Nails, screws, bolts . . . . . . . . . . . . . . . . . . . . . . . . . . . . . . . . . . . . . . .673: iron and steeL bars, rods, and shapes . . . . . . . . . . . . . . . . . . . . . .771 : Electric power machinery. . . . . . . . . . . . . . . . . . . . . . . . . . . . . . . . .7782: Electric lamps, bulbs . . . . . . . . . . . . . . . . . . . . . . . . . . . . . . . . . . . . .674: Iron and steel plates and sheets . . . . . . . . . . . . . . . . . . . . . . . . . . .884: Optical goods . . . . . . . . .. . . . . . . . . . . . . . . . . . . . . . . . . . . . . . . . . . .678: iron and steel tubes and pipe . . . . . . . . . . . . . . . . . . . . . . . . . . . . . .885: Watches and clocks . . . . . . . . . . . . . . . . . . . . . . . . . . . . . . . . . . . . . .773: Electricity distribution equipment . . . . . . . . . . . . . . . . . . . . . . . . . . .897: Jewelry, articles of precious metal . . . . . . . . . . . . . . . . . . . . . . . . .893: Plastic articles, misc. . . . . . . . . . . . . . . . . . . . . . . . . . . . . . . . . . . . . .Low RCAs (disadvantaged relative to other exports)791 : Railway vehicles . . . . . . . . . . . . . . . . . . . . . . . . . . . . . . . . . . . . . . . . . .778: Electrical machinery, misc. . . . . . . . . . . . . . . . . . . . . . . . . . . . . . . .699: Base metal manufactures, misc. . . . . . . . . . . . . . . . . . . . . . . . . . .7512: Calculating and accounting machines . . . . . . . . . . . . . . . . . . . . .635: Wood manufactures, misc. . . . . . . . . . . . . . . . . . . . . . . . . . . . . . . . .634: Veneers, plywood . . . . . . . . . . . . . . . . . . . . . . . . . . . . . . . . . . . . . . . .663: Mineral manufactures, misc. . . . . . . . . . . . . . . . . . . . . . . . . . . . . . . .759: Parts and accessories for 752 . . . . . . . . . . . . . . . . . . . . . . . . . . . . .812: Plumbing, heating, and lighting equipment . . . . . . . . . . . . . . . . .751 : Office machines . . . . . . . . . . . . . . . . . . . . . . . . . . . . . . . . . . . . . . . . . .695: Hand and machine tools . . . . . . . . . . . . . . . . . . . . . . . . . . . . . . . . .64: Paper products . . . . . . . . . . . . . . . . . . . . . . . . . . . . . . . . . . . . . . . . . .772: Switchgear, circuits, and parts . . . . . . . . . . . . . . . . . . . . . . . . . . . .058: Fruit, preserved . . . . . . . . . . . . . . . . . . . . . . . . . . . . . . . . . . . . . . . . .71: Power generating machinery . . . . . . . . . . . . . . . . . . . . . . . . . . . . . .87: Scientific and controlling instruments . . . . . . . . . . . . . . . . . . . . . .724: Textile and leather machines and parts . . . . . . . . . . . . . . . . . . . .73: Metal working machinery . . . . . . . . . . . . . . . . . . . . . . . . . . . . . . . . . .721 : Agricultural machinery and parts. . . . . . . . . . . . . . . . . . . . . . . . . .
2.92.52.52.42.02.01.81.81.61.51.21.21.0
0.90.80.80.80.70.70.60.50.50.40.40.40.40.30.30.30.20.150.05
●
●
●
● ☛☛
● ☛
●
NANA● **● ☛☛
NA● *
● ☛
☛☛
● ☛
☛☛☛
NANA
****● ☛
● ☛☛
● ☛
NA● **
NA● **● ☛☛
● ☛
●
● ☛
956
111392946
26259
197564592
100
216410144
968
1061946243273
72756
617
2
NA1.51.90.2NA1.91.11,41.40.70.91.51.3
NA1.61.55.4NANANA1.2NA2.2NA0.41,7NA0.31.0NANANA
SOURCES: United Nations, International Trade Statistics Yearbook; National Bureau of Statistics, Economic Planning Board, Korea Statistical Yearbook.
Taiwan shows a contrasting pattern. First, therange of products in which the country improved its
competitiveness in the 1980s is greater, though with
a lower average dollar value of exports in each
category. This pattern reflects a‘ ‘niche’ strategy of
specialization in products that are less technology-
and capital-intensive than those in which Korea has
excelled. For example, Taiwan improved its compet-
itiveness in a number of apparel segments, while
moving into standardized electronics products such
as calculators and telephones that can be produced
by small firms.
The third cluster, sectors with low but rising
RCAs, represent those in which Korea and Taiwan
are developing comparative advantage. In Korea,
this list includes office machinery, computers,
automobiles, and refined petroleum products, capital-
intensive sectors targeted by the government in the
last 15 years. Taiwan is competitive in steel, a sector
dominated by a state-owned enterprise. Both coun-
tries show low but rising competitiveness in general
industrial machinery.
The change out of light, labor-intensive manufac-
tures is apparent in the next cluster of industries:
sectors in which competitiveness was strong in the
past, but is falling now. In Korea, decline in the
competitiveness of steel and textile and apparel
segments are noteworthy. Taiwan declined in some
textile and apparel sectors, with a greater concentra-
tion of losses in light electronics, for which assem-
bly operations were important for the country’s
development. The sources of this decline include
rising labor costs, technological changes, and im-
provements in productivity that have moved produc-
tion back to the advanced industrial states.
The final cell represents those sectors in which
Korea and Taiwan are primarily importers rather
Chapter 7—The New Competitors: Industrial Strategies of Korea and Taiwan ● 301
Table 7-4-Taiwan: Revealed Comparative Advantage (1986 exports; other figures are ratios)
Technology Exports to U.S. ConcentrationSITC Code and Product RCA ratio intensity (nearest $million) in U.S.b
Rising RCA ratiosExtremely high RCAs (extremely competitive relativeto other exports)894: Toys, games, and sporting goods . . . . . . . . . . . . . . . . . . . . . . . . .655: Knitted fabric: . . . . . . . . . . . . . . . . . . . . . . . . . . . . . . . . . . . . . . . . . . . .785: Motor- and bicycles . . . . . . . . . . . . . . . . . . . . . . . . . . . . . . . . . . . . . .697: Household appliances of base metal . . . . . . . . . . . . . . . . . . . . . . .7512: Calculating and accounting machines . . . . . . . . . . . . . . . . . . . . .846: Undergarments, knit . . . . . . . . . . . . . . . . . . . . . . . . . . . . . . . . . . . . . .821 : Furniture . . . . . . . . . . . . . . . . . . . . . . . . . . . . . . . . . . . . . . . . . . . . . . . . .694: Nails, screws, bolts . . . . . . . . . . . . . . . . . . . . . . . . . . . . . . . . . . . . . . .847: Textile and clothing accessories . . . . . . . . . . . . . . . . . . . . . . . . . .7642: Microphones, loud-speakers, amplifiers . . . . . . . . . . . . . . . . . . .812: Plumbing, heating, and lighting equipment . . . . . . . . . . . . . . . . .036: Shellfish, fresh . . . . . . . . . . . . . . . . . . . . . . . . . . . . . . . . . . . . . . . . . . .
N A c●
1,3845
244286
82386990207
48133292
87
1.1NA0.71.21.11.61.61.50.51.51.80.3
14.512.98.47.45.25.25.04.84.74.54.54.2
● ☛
● ☛
● ☛☛
NANA
● *
NA● **● ☛
NA
High RCAs (advantaged relative to other exports)7641 :657:771:884:7522:695:844:775:651 :661 :699:7643:663:881 :693:786:75:
. ,Tleephones . . . . . . . . . . . . . . . . . . . . . . . . . . . . . . . . . . . . . . . . . . . . . .Special yarns and textile fabric . . . . . . . . . . . . . . . . . . . . . . . . . . . .Electric power machinery . . . . . . . . . . . . . . . . . . . . . . . . . . . . . . . . .Optical goods . . . . . . . . . . . . . . . .. . . . . . . . . . . . . . . . . . . . . . . . . . . . .Digital computers . . . . . . . . . . . . . . . . . . . . . . . . . . . . . . . . . . . . . . . . .Hand and machine tools . . . . . . . . . . . . . . . . . . . . . . . . . . . . . . . . .Undergarments, nonknit . . . . . . . . . . . . . . . . . . . . . . . . . . . . . . . . . .Household electric appliances . . . . . . . . . . . . . . . . . . . . . . . . . . . . .Textile yarn . . . . . . . . . . . . . . . . . . . . . . . . . . . . . . . . . . . . . . . . . . . . . . .Cement, lime, building products . . . . . . . . . . . . . . . . . . . . . . . . . . .Base metal manufactures, misc. . . . . . . . . . . . . . . . . . . . . . . . . . .TV and radio transmission . . . . . . . . . . . . . . . . . . . . . . . . . . . . . . . . .Mineral manufactures, misc. . . . . . . . . . . . . . . . . . . . . . . . . . . . . . . .Photo equipment . . . . . . . . . . . . . . . . . . . . . . . . . . . . . . . . . . . . . . . . .Wire products and grills nonelectric . . . . . . . . . . . . . . . . . . . . . . .Trailers and containers . . . . . . . . . . . . . . . . . . . . . . . . . . . . . . . . . . .Office machinery and automatic data processingequipment . . . . . . . . . . . . . . . . . . . . . . . . . . . . . . . . . . . . . . . . . . . . . .Jewelry, articles of precious metal . . . . . . . . . . . . . . . . . . . . . . . . .Switchgear, circuits, and parts . . . . . . . . . . . . . . . . . . . . . . . . . . . .leather . . . . . . . . . . . . . . . . . . . . . . . . . . . . . . . . . . . . . . . . . . . . . . . . . .
3.73.53.53.43.43.33.23.02.92.72.62.32.32.22.11.9
● ☛☛ NA66
158123NA220226213
1110
40549
9108
11NA
NA0.41.01.2NA1.12.40.7NANA1.40.9NA1.1NANA
*● ☛☛
NA● **
● ☛
NA● **
●
●
● ☛
● ☛☛
●
NA●
● *
1.91.31.21.1
● ☛☛ 1,233121201
6
1.11.41.0NA
897:772:611 :
NA● **
NA
Low RCAs (disadvantaged relative to other exports)673: Iron and steel bars, rods, and shapes . . . . . . . . . . . . . . . . . . . . . .784: Motor vehicle parts . . . . . . . . . . . . . . . . . . . . . . . . . . . . . . . . . . . . . . .74: General industrial machinery and parts . . . . . . . . . . . . . . . . . . . .334: Refined petroleum products . . . . . . . . . . . . . . . . . . . . . . . . . . . . . . .721 : Agricultural machinery and parts . . . . . . . . . . . . . . . . . . . . . . . . . .674: Iron and steel plates, and sheets . . . . . . . . . . . . . . . . . . . . . . . . . .87: Scientific and controlling instruments . . . . . . . . . . . . . . . . . . . . . .68: Non-ferrous metals . . . . . . . . . . . . . . . . . . . . . . . . . . . . . . . . . . . . . .781 : Passenger cars . . . . . . . . . . . . . . . . . . . . . . . . . . . . . . . . . . . . . . . . . .792: Aircraft and parts . . . . . . . . . . . . . . . . . . . . . . . . . . . . . . . . . . . . . . . .Falling RCA RatiosExtreme/y High RCAs (extremely competitive relativeto other exports)831 : Travel and hand bags . . . . . . . . . . . . . . . . . . . . . . . . . . . . . . . . . . . .8942: Toys and games . . . . . . . . . . . . . . . . . . . . . . . . . . . . . . . . . . . . . . . . . .85: Footwear . . . . . . . . . . . . . . . . . . . . . . . . . . . . . . . . . . . . . . . . . . . . . . .635: Wood manufactures, misc. . . . . . . . . . . . . . . . . . . . . . . . . . . . . . . . . - -aTe~nOlogy intensity is ~ewfl~ ~-~ing t. figures derived by c. M~hael Aho and HoWa~ F. Rosen, 19~, “Trends in TAnology-intensive Trade,” U.S.
Department of Labor, Bureau of International Labor Affairs, Economic Discussion Paper #9, pp. 49-52. The number of asterisks (from 1 to 3) correspondsto low, intermediate, and high levels of technology intensity. See text, footnote 11.
bConWntration ratios expr=stheextentof exwrtmwentration in the United States relative tothewodd ma~et. These ratios have been calculated in generalonly for products where U.S. 19S6 imports exceed $35 million. Figures above one (1.0) indicate a concentration of exports in the United States relative tothe world market; those below one indicate greater export concentration elsewhere relative to that in the U.S. market.
cNA=not applicable
0.90.50.50.40.40.40.30,20.010.002
● 57205598
131023
11128
24
0.50.82.2NANA0.41.50.4NANA
NA●
NA● *●
● ☛☛
☛
● ☛☛
● ☛☛
17.0 NA 523 1.112.4 NA 787 1.112.2 NA 2,101 1.48.5 NA 292 1.2
Continued on next page

302 . Competing Economies: America, Europe, and the Pacific Rim
Table 7-4-Taiwan: Revealed Comparative Advantage (1966 exports; other figures are ratios)--Continued
Technology Exports to U.S. ConcentrationSITC Code and Product RCA ratio intensity a (nearest $million) in U.S.b
845: Other outerwear, knit . . . . . . . . . . . . . . . . . . . . . . . . . . . . . . . . . . . . . 6.8762: Radios . . . . . . . . . . . . . . . . . . . . . . . . . . . . . . . . . . . . . . . . . . . . . . . . . . . 6.7893: Plastic articles, misc . . . . . . . . . . . . . . . . . . . . . . . . . . . . . . . . . . . . . . 6.4761 : Televisions . . . . . . . . . . . . . . . . . . . . . . . . . . . . . . . . . . . . . . . . . . . . . . . 6.2056: Vegetables, preserved . . . . . . . . . . . . . . . . . . . . . . . . . . . . . . . . . . . . 5.3666: Pottery . . . . . . . . . . . . . . . . . . . . . . . . . . . . . . . . . . . . . . . . . . . . . . . . . 5.0842: Men’s outerwear, nonknit . . . . . . . . . . . . . . . . . . . . . . . . . . . . . . . . . 4.8
High RCAs (advantaged relative to other exports)653:696:84:634:034:037:76:
652:7647782:776:
724:773:778:058:625:685:751 :73:
Woven Synthetic fabric - -. . . . . . . . . . . . . . . . . . . . . . . . . . . . . . . . . . . 4.0cutlery . . . . . . . . . . . . . . . . . . . . . . . . . . . . . . . . . . . . . . . . . . . . . . . . . . . 3.9Waring apparel and accessories . . . . . . . . . . . . . . . . . . . . . . . . . . 3.8veneers, plywood- . . . . . . . . . . . . . . . . . . . . . . . . . . . . . . . . . . . . . . . . 3.7Fish, fresh . . . . . . . . . . . . . . . . . . . . . . . . . . . . . . . . . . . . . . . . . . . . . . . . 3.4Preserved fish and shellfish . . . . . . . . . . . . . . . . . . . . . . . . . . . . . . 3.3Telecommunications and sound recording andreproducing equipment . . . . . . . . . . . . . . . . . . . . . . . . . . . . . . . . . . . 3.0Woven cotton fabric . . . . . . . . . . . . . . . . . . . . . . . . . . . . . . . . . . . . . . . 2.8Telecommunications . . . . . . . . . . . . . . . . . . . . . . . . . . . . . . . . . . . . . 2.5Electric lamps, bulbs . . . . . . . . . . . . . . . . . . . . . . . . . . . . . . . . . . . . . 1.9Transistors, valves, diodes, cathodb tubes,semiconductors . . . . . . . . . . . . . . . . . . . . . . . . . . . . . . . . . . . . . . . . . . . 1.8Textile and leather machines and parts . . . . . . . . . . . . . . . . . . . . 1.5Electricity distribution equipment . . . . . . . . . . . . . . . . . . . . . . . . . . . 1.4Electrical machinery, Misc. . . . . . . . . . . . . . . . . . . . . . . . . . . . . . . . 1.3Fruit, preserved . . . . . . . . . . . . . . . . . . . . . . . . . . . . . . . . . . . . . . . . . 1.2Rubber tires and tubes . . . . . . . . . . . . . . . . . . . . . . . . . . . . . . . . . . . . 1.2Watches and clocks . . . . . . . . . . . . . . . . . . . . . . . . . . . . . . . . . . . . . . 1.2Office machines . . . . . . . . . . . . . . . . . . . . . . . . . . . . . . . . . . . . . . . . . . 1.2Metal working machinery . . . . . . . . . . . . . . . . . . . . . . . . . . . . . . . . . . 1.1
Low RCAs (disadvantaged relative other exports)898: Musical instruments, recorded discs and tapes . . . . . . . . . . . . .7781 : Batteries, etc. . . . . . . . . . . . . . . . . . . . . . . . . . . . . . . . . . . . . . . . . . . . .783: ships and boats . . . . . . . . . . . . . . . . . . . . . . . . . . . . . . . . . . . . . . . . . .7783: Auto electronics . . . . . . . . . . . . . . . . . . . . . . . . . . . . . . . . . . . . . . . . . .759: Parts and accessories for 752 . . . . . . . . . . . . . . . . . . . . . . . . . . . . .654: other woven textile fabric . . . . . . . . . . . . . . . . . . . . . . . . . . . . . . . .678: iron and steel tubes, and pipe . . . . . . . . . . . . . . . . . . . . . . . . . . . . .763: Sound recorders, VCRs . . . . . . . . . . . . . . . . . . . . . . . . . . . . . . . . . .744: and parts . . . . . . . . . . . . . . . . . .71: . . . . . . . . . . . . . . . . . . . . . . . . . . . . . .64: Paper products . . . . . . . . . . . . . . . . . . . . . . . . . . . . . . . . . . . . . . . . . .7518: Photocopy and thermocopy maOhbes . . . . . . . . . . . . . . . . . . . . .
0.90.80.70.70.70.60.60.50.40.30.30.07
NA 765 1.0● ** 264 0.6
● * 699 1.1W* 445 1.2NA 97 0.7
● 238 2.3NA 0.8
● 37 0.1● * 83 1.6NA 2,586 1.2NA 139 0.9NA 88 0.4NA 83 0.8
● ☛☛ 1,895 1.2● 104 0.9
● M 991 1.5● * 53 1.4
● ☛☛
● ☛
***● ☛
NANA● 9 9
● ☛☛
●
NA● *● ☛
NA●
●
● ☛☛
●
NA● **
31874
307367
13946499
154
11612
1379
4209
8918659645912
0.70.53.61.6NA1.00.71.20.9
1.61.11.41.62.9NA1.33.11.30.50.72.7
SOURCES: United Nations, Mamationai Trade Statkfica Yearbook,- Stat ist ics of lr~ _ of m.
than exporters. In line with~ their poorh resource The pace of industria l adjustment o u t o f d e c l i n i n gendowments, these sectors include a number of raw sectors has been gradual; rising and falling sectorsmaterials-based products, particularly petrochemi- coexist over long periods Of time. In a number ofcals, and, in Taiwan, a range of capital goods product categories RCA’s remain high While declin-
ing. Both countries continue to be competitive in
Both countries have developed and maintainedcompetitivess in a diverse array of productsranging from technologically simple to complex.Korea shows a greater concentration in productswith higher capital and technology intensity andgreater scale economies, while Taiwan Shows greaterproduct diversity. Korea’s industrial policy has ledto a handful of the largest firms dominating exports.Taiwan has, on average, smaller firms.
traditional export products, such as footwear, eventhough comparative advantage is ending. This re-flects their initial strong market positions in these
sectors, and the ability of their firms to enhance
productivity, increase investment, and adapt techno-
Iogically to help offset increasing labor and other
costs.
With technology transfer from industrialized na-
tions to the NICs and the accumulation of physical

Chapter 7—The New Competitors: Industrial Strategies of Korea and Taiwan .303
and human capital, the skill- and capital-intensity of 7-8 detail their exports and imports by major
NIC exports has increased. This places competitive markets; figures 7-4 and 7-5summarize the informa-
pressure on the advanced industrial states. On the tion graphically.
other hand, the NICs remain importers of a range of
capital-, skill-, and technology-intensive goods. In the 1960s, Korea and Taiwan relied heavily on
This suggests the likelihood of extensive two-way the U.S. market as the key to their export-oriented
trade in highly differentiated products, a pattern that growth strategy. Following the first and second oil
has characterized economic relations between Eu- shocks, however, Korea aggressively diversified its
rope and the United States.12 exports. Korean construction firms pushed into the
lucrative Middle East market, and exports of con-
Another area of concern is the geographic concen- struction materials followed. Europe’s share dou-
tration of the two countries’ exports. Tables 7-5 to bled between 1970 and 1975.
Table 7-5-Country Destination of Korean Exports, 1970-89 Major Trading Partners (US$ million)
1970 1975 1980 1985 1989
Asia:Australia . . . . . . . . . . . . . . . . . . . . .Hong Kong . . . . . . . . . . . . . . . . . .Japan . . . . . . . . . . . . . . . . . . . . . . .Singapore . . . . . . . . . . . . . . . . . . .Taiwan . . . . . . . . . . . . . . . . . . . . . .
Europe:France . . . . . . . . . . . . . . . . . . . . . .Germany . . . . . . . . . . . . . . . . . . . .Netherlands . . . . . . . . . . . . . . . . . .United Kingdom . . . . . . . . . . . . . .
Middle East:Kuwait . . . . . . . . . . . . . . . . . . . . . . .Saudi Arabia . . . . . . . . . . . . . . . .
North America:Canada . . . . . . . . . . . . . . . . . . . . .United States . . . . . . . . . . . . . . . .
World; countryexports asshare of world exports
2.927.5
234.311.07.2
1.527.313.513.0
1.50.1
19.5395.1835.1
—— -- #.- .-, -- -.. -- ---33.9%
004%3.3%
28.1%1 .3%0.9%6.6%0.2%3.3%1.6%1.6%0.2%0.2%
0.01%49.7%
2.3%47.37090.3%
63.0181.9
1,292.958.262.8
40.0312.2128.9161.7
33.991.1
197.31,536.25,081.0
32.7%1 .2%3.6%
25.5%1 .2%1 .2%
12.7%0.8%6.1% 2.5%3.2%2.5%0.7%1.8%
34.1%3.9%
30.2%81.9%
230.4823.3
3,039.4266.3216.3
291.2875.5349.5572.5
249.1946.1
343.44,606.6
17,504.9
26.1%1 .3%4.7%
17,4%1.5701 .2%
11.9Y01 .7%5.O%2.0%3.3%6.8%1.4705.4%
28.3%2.O%
26.3%73.2%
368.81,565.54,543.4
490.1196.1
315.8979.3345.4913.4
205.6968.7
1,228.710,754.130,283.1
2 3 . 7 %
1 .2%5.2%
15.O%1.6?400.7%8.4%1.0%3.2%1.1% 3.0%3.9%0.7%3.2%
39.6%4.1%
35.594075.5%
1,004.93,374.6
13,456.81,532.41,308.2
894.02,137.2
755.81,861.3
210.1814.8
1,882.320,639.062,377.1
33.2%1.6%5.4%
21.6%2.5%2.1%9.1%1 .4%3.4%1.2%3.0%1.6%0.3%1.370
36.1%3.O%
33.1%80.0%
SOURCES: Bank of Korea, Economic Statistics Yearbook; Bank of Korea, Monthly Economic Statist.ks.
Table 7-6-Country Source of Korean Imports, 1970-89 Major Trading Partners (US$ million)
1970 1975 1980 1985 1989
Asia:Australia . . . . . . . . . . . . . . . . . . . . . 13.7Hong Kong . . . . . . . . . . . . . . . . . . 19.7indonesia . . . . . . . . . . . . . . . . . . . . 19.8Japan . . . . . . . . . . . . . . . . . . . . . . . 809.2Malaysia . . . . . . . . . . . . . . . . . . . . . 57.7Singapore . . . . . . . . . . . . . . . . . . . 13.5Taiwan . . . . . . . . . . . . . . . . . . . . . . 34.0
Europe:France . . . . . . . . . . . . . . . . . . . . . . 52.2Germany . . . . . . . . . . . . . . . . . . . . 67.2United Kingdom . . . . . . . . . . . . . . 32.7
Middle East:Kuwait . . . . . . . . . . . . . . . . . . . . . . . 30.6Saudi Arabia . . . . . . . . . . . . . . . . 84.6
North America:Canada . . . . . . . . . . . . . . . . . . . . . 23.1United States . . . . . . . . . . . . . . . . 584.7
World; country 1,983.9exports asshare of total exports
48.8%0.7%1 .O%1 .0%
40.8%2.9%0.7%1.7707.7%2.6%3.4%1.6%5.8%1 .5%4.3%
30.6%1 .2%
29.5%92.9%
204.719.7
146.82,433.6
122.713.7
161.9
137.3192.6123.0
553.4605.3
150.11,881.17,274.3
42.7%2.8%0.3%2.0%
33.5%1 .7%2.2%2.2%6.2%1 .9%2.6%1.770
15.9%7.6%8.3%
27.9%2.I%
25.9%92.7%
680.098.2
484.55,857.8
471.6161.2313.3
190.8636.6303.6
1,753.23,288.4
378.44,890.2
22,291.7
36.2%3.1%0.4%2.2%
26.3%2.1%0.7%1 .4%5.1%0.9%2.9%1 .4%
22.6%7.9%
14.8%23.6%
1 .7%21 .9%87.5%
1,116.1492.5668.6
7,560.41,234.3
267.7333.4
442.3978.6565.8
523.2639.7
630.26,489.3
31,135.7
37.5%3.6%1.6%2.1 %
24.3%4.0%0.9%1 .1%6.4%1 .4%3.1%1.8%3.7%1 .7%2.1%
22.9%2.O%
20.8%70.5%
2,243.0581.7
1,135.217,448.6
1,503.4640.8
1,328.4
879.12,623.5
923.4
381.71,041.8
1,680.115,910.761,464.7
40.5%3.6%0.9%1.8%
28.4%2.4%1 .0%2.2%7.2%1 .4%4.3%1.5702.3%0.6%1.770
28.6%2.7%
25.9%78.6%
SOURCES: Bank of Korea, Economic Statistics Yearbook Bank of Kore~ Monthly Economic Statistics.

304 . Competing Economies: America, Europe, and the Pacific Rim
Table 7-7-Country Destination of Taiwanese Exports, 1970-89 Major Trading Partners (US$ million)
1970 1975 1980 1985 1989
Asia:Australia . . . . . . . . . . . . . . . . . . . . . 20.4Hong Kong . . . . . . . . . . . . . . . . . . 135.8Japan . . . . . . . . . . . . . . . . . . . . . . . 215.6Korea . . . . . . . . . . . . . . . . . . . . . . . 27.8Singapore . . . . . . . . . . . . . . . . . . . 35.9Thailand . . . . . . . . . . . . . . . . . . . . . 25.1
Europe:France . . . . . . . . . . . . . . . . . . . . . . 3.1Germany . . . . . . . . . . . . . . . . . . . . 71.0United Kingdom . . . . . . . . . . . . . . 14.2
North America:Canada . . . . . . . . . . . . . . . . . . . . . 50.8United States . . . . . . . . . . . . . . . . 564.1
World;country 1,481.4exports asshare of total exports
31.1%1.4%9.2%
14.6%1.9%2.4%1.7%6.0%0.2%4.8%1.O%
41.5%3.4%
38.1%78.6%
125.5363.0694.2119.5140.767.8
37.5316.2137.8
181.61,822.75,308.7
28.5%2.4%6.8%
13.1%2.3%2.7%1.3%9.3%0.7%6.O%2.6%
37.8%3.4%
34.3%75.5%
539.31,550.62,173.4
266.5545.1176.2
265.61,075.8
471.6
459.76,760.3
19,810.6
26.5%2.7%7.8%
11.0%1.4%2.8%0.9%9.2%.1.3%5.4%2.4%
36.5%2.3%
34.1%72.1%
747.32,539.73,460.9
253.8885.1236.2
227.6805.4650.0
944.814,773.330,725.6
26.4%2.4%8.3%
11.3%0.8%2.9%0.8%5.5%0.7%2.6%2.1%
51.2%3.1%
48.1%83.1%
1,531.97,013.99,058.01,131.31,970.01,103.2
1,084.92,558.22,095.8
1,755.823,943.466,102.4
33.0%2.3%
10.6%13.7%
1.7%3.O%1.7%8.7%1.6%3.9%3.2%
38.9%2.7%
36.2580.6%
SOURCE: Council for Ecxmomic Planning and Developmen~Taiwan Statistical Data Sook.
Table 7-8-Country Source of Taiwanese Imports, 1970-89 Major Trading Partners (US $ million)
1970 1975 1980 1985 1989
Asia:Australia . . . . . . . . . . . . . . . . . . . . . 47.9Hong Kong . . . . . . . . . . . . . . . . . . 27.2Japan . . . . . . . . . . . . . . . . . . . . . . . 652.7Korea . . . . . . . . . . . . . . . . . . . . . . . 15.1Singapore . . . . . . . . . . . . . . . . . . . 5.3
Europe:Germany . . . . . . . . . . . . . . . . . . . . 61.9United Kingdom . . . . . . . . . . . . . . 25.9
Middle East:Saudi Arabia . . . . . . . . . . . . . . . . 2.7
North America:Canada . . . . . . . . . . . . . . . . . . . . . 17.0United States . . . . . . . . . . . . . . . . 363.8
World; country 1,523.9exports asshare of total exports
49.1%3.1 %1.8%
42.8%1 .0%0.4%5.8%4.1 %1.7%0.2%0.2%
25.0%1 .1%
23.9%80.0%
159.574.7
1,812.259.235.7
371.4127.4
228.3
48.01,652.15,951.6
36.O%2.7%1 .3%
30.5%1 .O%0.6%8.4%6.20/o2.1%3.8%3.8%
28.6%0.8%
27.8%76.8%
512.2249.9
5,353.2208.5221.7
722.2288.6
1,418.9
248.94,673.4
19,733.1
33.2%2.6%1 .3%
27.1%1 .1%1 .1%5.1%3.7%1 .5%7.2%7.2%
24.9%1.370
23.7%70.4%
800.6319.6
5,548.8186.6275.8
846.1262.4
1,361.0
368.94,746.2
20,102.0
35.5%4.0%1.6%
27.6%0.9%1.4%5.5%4.2%1.3%6.8%6.8%
25.5%1.8%
23.6%73.2%
1.627.82,222.7
16,016.61,239.0
884.7
2,592.5926.5
1,378.7
997.911,984.152,215.3
42.1%3.1%4.3%
30.7%2.4%1 .7%6.7%5.O%1.8%2.6%2.6%
24.9%1 .9%
23.O%76.4%
SOURCE: Monthly Statistic of Imports, Republic of China.
In the 1980s, the dependence on the U.S. marketfluctuated with economic conditions and exchangerates. The U.S. share of Korea’s exports rose afterthe 1982 recession, and jumped dramatically, from
35 to 40 percent, after the sharp real depreciation of
the Korean won in 1985-1986. Thereafter, however,
the U.S. share declined as the won rose, and has not
approached its 1970 level. Korea’s strategy of
diversification holds true at the product level as well,
though footwear and automobiles still show amarked concentration on the American market.
In Taiwan, dependence on the American marketalso increased over the early 1980s, but the level wasmuch higher, approaching 50 percent in 1985 beforefalling to around 40 percent in 1989, roughly the
same as in 1970. Imports show a similar story, with
Korea diversifying away from the United States andTaiwan’s share of imports staying constant overtime.
The data suggest a somewhat contradictory pic-ture with regard to interdependence within EastAsia. The NICs increased their trade with oneanother, though from a low base that reflects theircompetition in some product lines. Hong Kong’s
share in Taiwan’s trade grew sharply over the late
1980s; an unknown portion of this trade is with the
People’s Republic of China. Both Korea and Taiwan
increased their exports to Japan in the late 1980s,
Korea more than Taiwan. Both countries have
historically run deficits with Japan, their main
source of imports. But Japan’s share has fallen
sharply since the peak in 1986 as a result of

Chapter 7—The New Competitors: Industrial Strategies of Korea and Taiwan .305
Figure 7-4-Major Korean Trading Partners, 1970-89
Major Korean Trading Partners, 1970
Australia
Asian NICs
Japan
Taiwan
Europe
Middle East
Canada
United States
(US$ billions)
t I ! I 1 1 I 1
- 1 -0.8 -0.6-0.4 -0.2 0 0.2 0.4 0.6Imports Exports
Major Korean Trading Partners, 1985(US$ billions)
Australia -
Asian NICs -
Japan -
Taiwan -
Europe -
Middle East -
Canada
United States1 I I
-10 -5 0 5 10 15Imports Exports
Major Korean Trading Partners, 1980
Australia
Asian NICs
Japan
Taiwan
Europe
Middle East
Canada
United States
(US$ billions)
4ZZ2
t 1 1 1 1 1 ,
-8 -6 -4 -2 0 2 4 6Imports Exports
Major Korean Trading Partners, 1989(US$ billions)
Australia -
Asian NICs -
Japan -
Taiwan -
Europe -
Middle East -
Canada
United States -
r I-20 -10 0 10 20 30
Imports Exports
NOTE: Europe includes Germany, France, United Kingdom, and the Netherlands. Asian NICs indude Singapore, Malaysia, Thailand, and Hong Kong. Midd!eEast includes Saudi Arabia and Kuwait.
SOURCE: Bank of Korea, Economic Statistics Yearbook; Bank of Korea, Monthly Economic Statistics.
exchange rate movements. Korea has been more region, however. Analysis of such investments goessuccessful in diversifying while Taiwan’s trading beyond the scope of this chapter, but it is importantpatterns with Japan show greater constancy. to note how they complicate the picture. First, some
The aggregate figures for Korea’s and Taiwan’sshare of exports from Taiwan and Korea is comingfrom American and Japanese subsidiaries, usually as
trade with Asia in the last two decades do not showany striking shift in shares going to or from Asia as intrafirm trade. Table 7-9 suggests that American
firms have played a relatively small and declininga whole. This suggests that while there are changesin the NICs’ trading patterns within Asia, there is no role in the exports of the two larger NICs. Japanese
long-term movement toward greater reliance on foreign direct investment, by contrast, increased
Asian markets or the creation of an intra-Asian dramatically in the mid-1980s following the appre-
trading bloc centered on Japan. ciation of the yen. Total foreign direct investment in1986 through 1988 was equal to the cumulative
This picture does not take into account the value of Japanese foreign investment from 1951growing networks of foreign investment in the through 1985. 13

306 ● Competing Economies: America, Europe, and the Pacific Rim
Figure 7-5-Major Taiwanese Trading Partners, 1970-89
Australia
Asian NICs
Japan
Korea
Europe
Middle East
Canada
United States
Major Taiwanese Partners, 1970(US$ billions)
, 1 1I 1 I 1
-0.8 -0.6 -0.4 -0.2 0 0.2 0.4 0.6 0.8Imports Exports
Major Taiwanese Partners, 1985(US$ billions)
Australia -
Asian NICs -
Japan -
Korea -
Europe -
Middle East -
Canada
United States - 1 1 I ,-10 -5 0 5 10 15 20
Imports Exports
Australia
Asian NICs
Japan
Korea
Europe
Middle East
Canada
United States
Major Taiwanese Partners, 1980(US$ billions)
-6 -4 -2 0 2 4 6 8Imports Exports
Major Taiwanese Partners, 1989(US$ billions)
Australia
Asian NICs
Japan
Korea
Europe
Middle East
Canada
United States
-20 -10 0 10 20 30Imports Exports
NOTE: Europe includes Germany, France, United Kingdom, and the Netherlands. Asian NICs include Singapore, Malaysia, Thailand, and Hong Kong. MiddleEast indudes Saudi Arabia and Kuwait.
SOURCE: Republic of China, Monthly Statistics of Imports; Council for Economic Planning and Development, Taiwan Statistical Data Book.
Data comparable to that cited for the United States east Asia. Taiwanese firms have been particularlyare not available on the trade behavior of Japanese aggressive; for example, in 1986, they made threeaffiliates, but information is available on the pattern investments in Thailand with a total value of $5.8of sales of all Japanese affiliates in the four East million and no investments in Malaysia. In 1989,Asian NICs. Fifty-six percent of affiliates’ sales of Taiwanese firms initiated 214 investments valued atmanufactures were to the local market, 15.1 percent $871 million in Thailand and 187 investmentswere to Japan, 11.2 percent were to the rest of Asia, valued at $785 million in Malaysia.14
and 9.3 percent were to the United States, with the Again, data are not available on the trade behaviorremainder split between Europe and other areas.This suggests that the primary purpose of Japanese of Korean and Taiwanese firms and their affiliates in
foreign investment in these counties is to sell in the Southeast Asia, but it is likely that some of it is
local markets. export-oriented. Overseas investment is often madein order to circumvent quantitative restrictions on
Another complication concerns outward invest- exports, and to compensate for rising labor costs thatment from Korea and Taiwan, particularly to South- reduces the profitability of traditional exports.

Chapter 7—The New Competitors: Industrial Strategies of Korea and Taiwan .307
Table 7-9-Shares of U.S. Majority-Owned ForeignAffiliates in Total Exports of Manufactures, Selected
Countries, 1977 and 1983 (percentages)
Host country 1977 1983
Korea . . . . . . . . . . . . . . . . . . . . . . . . . . . . . . . . . . . 1.4 1.3Taiwan . . . . . . . . . . . . . . . . . . . . . . . . . . . . . . . . . . 6.2 3.9Hong Kong . . . . . . . . . . . . . . . . . . . . . . . . . . . . . . . 8.1 5.6Singapore . 18.7. . . . . . . . . . . . . . . . . . . . . . . . . . . . . . . 17.4
SOURCE: M. Blomstrom, 1. Kravis, and R. Li~ey, “Multinational Firms’ andManufactured Reports from Developing Countries,” NBERMbrking Paper Series No. 2493, National Bureau of EconomicResearch, 19SS.
THE ROLE OF GOVERNMENTPOLICY: KOREA
Korea’s industrial strategy has moved throughseveral stages. From the end of the Korean War tothe early 1960s, the government emphasized recon-struction. Any industrial strategy was based onimport substitution in light manufacturing indus-tries. This effort involved extensive and frequentlycorrupt government intervention through importcontrols, multiple exchange rates, sale of state-owned enterprises, and influence over the allocationof crucial U.S. aid. Nonetheless, this was a time ofrapid growth for Korean manufacturing.
Following a military coup in 1961, the govern-ment began a series of dramatic economic reformsthat emphasized export expansion. It collapsed themultiple exchange rates into a single rate, devaluedthe won, and liberalized imports for exporters. Thegovernment provided additional subsidies throughthe financial and tax systems, while guiding invest-ment in priority import-substituting industries, insome cases through state-owned enterprises (as inthe steel industry).
Beginningin the late 1960s and accelerating after1973, the government emphasized the developmentof heavy industry, including steel and nonferrousmetals, chemicals and petrochemicals, machinery,automobiles, and shipbuilding. Exports werestressed as the ultimate criterion of success in thesenew industries, but greater weight was placed onimport substitution. During this phase, the govern-ment expanded its role in the allocation of resourcesand in using financial, tax, and trade instruments.The government sought to guarantee that no com-pany dominated any product market; key industriessuch as automobiles, shipbuilding, computers, andsemiconductors typically had four or five mainproducers who competed intensely. The effect of
this new heavy industry push was to encourageconcentration of the industrial structure. Very largebusiness groups, called chaebol, had priority accessto credit and market opportunities, and graduallycame to dominate the market.
In the early 1980s, the direction of policy changedagain, due to inflation, the increased sophisticationof the economy, crises generated by decliningindustries, and direct pressure from the United Statesto liberalize the economy. Critical to the change wasthe perception among influential technocrats that thegovernment’s extensive intervention in support ofheavy industrialization had been mistaken, resultingin misallocation of resources and structural prob-lems.
The new framework emphasized economywidemeasures, with the aim of reducing the govern-ment’s role and making markets function moreeffectively. Between 1980 and 1983, banks weredenationalized and targeted loans were cut back.Tariffs and quantitative restrictions, once formida-ble impediments to imports, have diminished since1984. Anew Industrial Development Law, approvedby the National Assembly at the end of 1985, focuseson improving industrial technology and productivityand building up Korea’s innovation capacity. How-ever, as a World Bank report notes:
The legislation provides policymakers with agreat deal of latitude with respect to policy imple-mentation. . . . Thus, the degree of real interventionwill be determined in pragmatic fashion as circum-stances warrant.15
As this review suggests, the importance of differ-ent industrial policies has varied over time, with aperiod of extensive government intervention in the1950s, followed by liberalization and more selectiveintervention in the 1960s. Government directionincreased again during the heavy industry drive inthe late 1970s. The more recent period has been oneof more substantial liberalization. A stronger senseof these trends can be gotten by reviewing threemajor areas of policy: exchange rate, trade, andforeign investment policies; the role of the govern-ment in the provision of finance; and policies towardtechnology and R&D.
Exchange Rate and Trade Policies
When comparing the export perforrnance ofKorea with that of other developing countries, thereis widespread agreement that exchange rate policy

308 ● Competing Economies: America, Europe, and the Pacific Rim
played a key role. A substantial devaluation was akey component in the transition to export-led growthin 1964-1965. Exchange rate policy thereafter wasrealistic, until an increase in domestic inflation ledto overvaluation during the late 1970s. Followingdevaluation in 1980, the government returned to astable, competitive exchange rate policy that peggedthe won to a weighted average of currencies. Whenthe dollar was rising strongly, the won depreciatedrelative to the dollar, as such a formula mightsuggest. After 1985, however, Korea experienced aperiod of significant real depreciation of the cur-rency, even while the dollar was falling.l6 Thischange was largely responsible for the emergence oflarge bilateral surpluses between Korea and theUnited States in the late 1980s. Beginning in 1987,under pressure from the United States and theInternational Monetary Fund (IMF), Korea began toboost the value of its currency, a factor in thereversal of Korea’s trade surpluses beginning in thesecond half of 1989 (by 1990, Korea had currentaccount and merchandise trade deficits).
Korea’s industrialization strategy has used bothexport incentives and import restrictions as policyinstruments. The trade regime has been outward-looking on the export side and restrictive on theimport side. Import restrictions have been aimed atdirecting the use of scarce foreign exchange andallowing infant industries to become internationallycompetitive. Although Korea ran a balance of tradedeficit every year during the post war era up to1986, 17 government controlled imports, giving ap-provals when a national interest test was met.18
Korea’s lack of raw materials and the limitedsupply capacity of its domestic capital goods indus-tries have constrained its industrial growth. Govern-ment policies emphasized export promotion in orderto provide the money for the imports of rawmaterials and capital goods needed for faster growth.Further, the government’s import restrictions fa-vored domestic industries that could convert importsinto exports, so as to permit still more imports ofindustrial inputs. Consumer goods were targeted forimport controls and high tariffs. This allowedproducers to charge higher prices on the domesticmarket and thereby absorb thinner export profitmargins. This constituted an implicit consumptiontax to promote exports, and accounts for periodiccharges of dumping against Korean firms. In short,up to the balance of payments surpluses in 1986,Korea exported in order to import, and vice versa.
Exports were a way to use unskilled labor insophisticated industries.19
How protected has the Korean economy been?The economy received substantial protection overthe 1960s, 1970s, and early 1980s, with protectionfalling markedly since then. Estimates of protectionare subject to many errors, and the fact that differentstudies use different operational measures makes fordifficulties in comparing results. The few studiesavailable for Korea yield a sizable range of answerseven for the same year. Moreover, the Korean tradesystem is complex; trade has been restricted in partthrough administrative and regulatory provisionsthat are neither transparent nor easily measured.
Studies suggest that patterns of protection fol-lowed the broad contours of industrial policy.20 In1968, the rate of effective protection for the econ-omy as a whole was in the range of 9 to 21 percent,with the low estimate resulting from procedures thatmay bias the result downwards.21 Transport, con-sumer durables, and machinery industries receivedrates of over 50 percent. Effective protection in-creased during the heavy industry drive of the 1970s,to the range of 24 to 34 percent by 1978. Formanufacturing alone, one estimate gives an averageof 49 percent.22 Petrochemicals, steel, machinery,and shipbuilding received above average protection.Effective protection increased through 1982. Oneestimate gives a rate of 38 percent,23 another studyby the Asian Development Bank shows an overalltariff average of 33 percent for “the early 1980s.”24
Although studies of effective protection rates areunavailable for the period since 1982, the liberaliz-ing trend can be discerned in the ratio of importitems that are classed as “automatically approved”(AA), as distinct from “restricted” or “prohibited.”In 1981,75 percent of items were classtified as AA,accounting for 65 percent of imports by value. By1984,85 percent of items, accounting for 72 percentof imports by value, were so classified. By 1986, theratio had increased to 92 percent of items; theproportion by value probably exceeds 80 percent.
The liberalization of quantitative restrictions inthe 1980s accompanied a phased reduction in legaltariffs, to an average of 20 percent for manufacturedgoods and 29 percent for agricultural goods (on anitems basis) by 1986. By 1989, the average (nontrade-weighted) tariff rate came down to 13 percent, andwas projected to fall further, to about 8 percent by1993, comparable to average tariffs in Europe and

Chapter 7—The New Competitors: Industrial Strategies of Korea and Taiwan ● 309
the United States.25 Tariffs remain high on manykinds of agricultural produce.
It is difficult to draw conclusions about importliberalization. For example, until recently classifica-tion of an import as AA was a necessary butincomplete condition for unimpeded importation.The government could impose short-term penaltytariffs if items on the AA list were judged to harmimportant domestic industries. This system wasdismantled only in the last 2 years. A recent WorldBank report estimated that in 1986 as many as 25percent of the AA import items were “potentiallycovered by one special law or another’ that allowedministries to regulate imports.26 The report goes onto say that: “It is not known, of course, to whatextent these administrative procedures lowered im-ports, e.g., when the relevant industry association orother body denied the importation of a commodityon the AA list. ’ ’27 On the other hand, the fact that anitem is classified as “restricted” does not mean thatit will be difficult to import.
Historically, the government has controlled for-eign exchange in Korea. Earners of foreign exchangehave been required to transfer it to one of severaldesignated agencies, which in turn transfer it to thecentral bank. Private companies or citizens mayretain only a small amount. The government formu-lates an annual Foreign Exchange Demand andSupply Plan. Little is known about how the plan iscompiled or how conflicting demands on foreignexchange are reconciled. It is clear, though, that thePlan has binding force. Data on projected and actualforeign exchange spending show a close correlationyear after year. Banks must limit the issue of foreignexchange for any import, even an AA import, whenforeign exchange use runs beyond the limits of thePlan.28 In effect, then, there have been two distincthurdles in the import process: one to get the importlicense, the other to get the necessary foreignexchange. Despite a substantial import liberaliza-tion, scheduled to allow domestic industries time toadjust, a variety of administrative procedures stillgrant room for Korean officials to restrict imports.
Although until recently Korea had a relativelyprotectionist trade regime, several features differen-tiated it from the protective trade regimes of otherdeveloping countries. First, it was coupled with arealistic exchange rate policy so that biases in tradepolicy were not compounded by overvaluation.Then, protection was subordinate to a wider indus-
trial strategy aimed at assisting protected industriesto become internationally competitive.
Protection against selected imports dovetails withoffsetting incentives for export sale. A crucialcomponent of the transition to export-led growth inthe mid-1960s was that all imports used as inputsinto exports would be exempt from quantitativeimport restrictions. Raw material imports used forexports were also exempt from tariffs.29 Capitalgoods used for export production were exempt fromtariffs until the early 1970s. These became subject totariffs as the government sought to deepen (diver-sify) the industrial structure into these products.Exports have also been exempt from indirect taxessuch as harbor charges.
Duty free import of inputs for use in exports wasavailable to ‘indirect exporters,’ domestically basedsuppliers that provided intermediate inputs to exportproducers or finished goods to a trading companythat then exported them. Additional incentives camethrough import-export links, by means of whichpermission to import (and therefore the ability toreap high profits on the protected domestic market),was given to those with good export performance.The import of some very popular products waslinked to export performance in closely relatedfields. Import rights for TV receivers, for example,were granted only to exporters of radios andelectronic equipment. This not only gave a directincentive to producers of electronic equipment toexport, it also allowed them to protect their domesticmarket share by pricing imported items in a way thatdid not threaten their own production.30
Free-trade export-processing zones were key inattracting export-oriented foreign direct investment(FDI). The first free trade zone opened in 1971, withanother eight added by 1985. But the zones haveaccounted for only around 10 percent of total FDI.They have probably been less important than the 218“bonded’ manufacturing plants (as of 1981), whichcan import without paying any duty but must exportall their production.
Import liberalization for exporters conforms roughlyto the market-oriented picture of Korea’s growth.Other measures do not. Korea began giving conces-sional credit to exporters in the 1950s, enhancing thedegree of concession and the ease of access to thecredit after the transition to an export-orientedstrategy in the mid- 1960s. Through the 1970s,automatic access to short-term export financing was

310 ● Competing Economies: America, Europe, and the Pacific Rim
available to exporters at 6 to 12 percentage pointsbelow the commercial bank loan rate, constituting alarge subsidy .31 Such loans ended in 1980. Medium-and long-term loans for investment in export produc-tion were also automatically available at conces-sional rates until 1980. Postshipment financing,export credit insurance, and export finance guaran-tees still exist.
The early incentives to export did not involveindustrial targeting; companies profited from theincentives regardless of the product they exported.Export incentives became more targeted in the late1970s with the heavy and chemical industry drive.Until 1973, tax incentives included a 50-percentreduction on business income tax on profits derivedfrom exports. Subsequently, special depreciationallowances for capital equipment used in exportproduction have been used instead. Various studiesreport that these direct export incentives have beenreduced since the early 1970s, especially during the1980s. In the early 1970s, the effective subsidy ratefor exports averaged about 20 percent of the value ofexports. It fell to about half that level by the end ofthe 1970s, and has declined further since.32
Overseas information and marketing serviceshave helped expand Korean exports. Since 1962,the Korea Trade Promotion Corp. (KOTRA) hasserved as a nonprofit trade promotion arm of theKorean Government.33 It was formed after carefulstudy of JETRO, its Japanese counterpart, whichprovides much technical assistance in the earlyyears. KOTRA maintains 77 offices around theworld that provide information about Korean export-ers and importers, the items they buy and sell, andthe services they need and provide in foreigninvestment and construction work. It also arrangestrade fairs and is a point of first call for foreignbuyers. About 70 percent of its budget comes fromgovernment grants. Another organization with over-lapping functions is the Korea Traders Association(KTA), a nonprofit private organization that in-cludes all licensed exporters and importers as itsmembers. There are also 30 or more industry-basedexporters’ associations.
To complement the work of KOTRA, the govern-ment launched a scheme to build up Korean generaltrading companies along the lines of their Japanesecounterparts. Beginning in the early 1970s, thosetrading companies that met the stringent perform-ance and size criteria for “general trading compa-
nies” received special privileges in terms of accessto credit, retention of foreign exchange, and otherassistance. They held the same leadership role on thetrade side as the big conglomerates (chaebol) held inthe heavy industry drive of the 1970s. By 1982, the10 licensed general trading companies accounted foralmost half of Korea’s exports.34
From the mid-1960s onwards, the governmentelevated the export drive to the nation’s number twopriority, second only to national defense.
Led by the president, and supported by the topeconomic ministers and the heads of the biggestfirms, much of the country was wrapped in the fervorand enthusiasm surrounding the drive to developthrough trade.35
The priority of exports was determined through asystem of export targets and high-level exportmeetings. These helped to unify the array of exportincentives and catalyze the reciprocal relationshipbetween government and business. From 1965 on,upwards of 100 senior political leaders, bureaucrats,and business people met each month to discuss theexport drive. The meetings were chaired by thePresident himself as a symbol of the government’scommitment to exporting.
In addition, prizes were awarded once a year onExport Day. The prizes conveyed not just prestige,but also economic rewards, such as easier bankcredit for nonexport projects.36 In 1980, Export Daywas renamed Trade Day, and prizes awarded forgood performance in both exporting and import-ing.37
Development Financing and ForeignDirect Investment
Financial policy was an important component ofexport-promotion efforts. The Korean Governmenthas used its control over the financial system forbroader industrial policy purposes, however, dis-couraging business speculation and encouraginginvestment in ‘‘strategic” industries.38
Until the early 1980s, the government owned thecommercial banks. The Ministry of Finance con-trolled the total supply of funds and interest ratesthrough its agent, the central bank. The commercialbanks allocated private funds under the guidance ofthe Ministry of Finance. The Minister of Finance,and sometimes even the President himself, ap-pointed the chairman of each bank. Interest rates
Chapter 7—The New Competitors: Industrial Strategies of Korea and Taiwan ● 311
were low for priority uses, including investment ingovernment-designated industries and export fi-nance. Subsidized loans, called “policy loans,”constituted about half of total bank loans over the1970s and carried nominal interest rates of around 10to 15 percent; given inflation, real interest rates wereclose to or less than zero. Ordinary bank loans, on theother hand, carried nominal rates of 18 to 22 percent.These rates for ordinary loans were much less thanrates on the unregulated and semi-legal curb market,which typically ranged from 30 to 40 percent a yearor even higher. Estimates of the size of the curbmarket vary widely, from 10 to 40 percent of thefinancial sector.39 Since denationalization, the vol-ume of confessional lending has been greatlyreduced, but remains important for a narrower set ofstrategic industries, including segments of electron-ics and computers.
Firms depended heavily on bank loans for theirinvestments. Corporate debt/equity ratios over the1970s were on the order of 310 to 380 percent, ascompared to 50 to 90 percent in the United Statesand the United Kingdom.40 This gave the govern-ment substantial leverage over individual compa-nies. Not only could the government tempt them toenter priority fields by offering low cost or easilyavailable credit; it could also cut off credit. Thisthreat was serious, given the cost of alternative curbmarket credit and firms’ inability to borrow interna-tionally without government approval.
The government’s direct influence over bankportfolios declined with the denationalization of thebanks in the 1980s. The government maintains a rolein financing its industrial policy objectives, how-ever, through the Korea Development Bank andother schemes. The Korean Technology Advance-ment Corp. has served as a source of investmentcapital for the development of new products andprocesses generated by the Korean Advanced Insti-tute of Science and Technology and other govern-ment research labs. The government also providesventure capital through the Korean TechnologyDevelopment Corp., which makes funds available tothe private sector for investment in specific R&D,technology acquisition, and other precommercialinvestment projects.
With domestic savings covering only 70 to 90percent of domestic investment, Korea has dependedon sizable inflows of foreign capital. This has takenthe form of foreign borrowing, while foreign direct
investment (FDI) has been kept low. As a proportionof total foreign loans and investment, total FDI flowsamounted to only 3.2 percent in 1980. FDI flowshave also been low as a proportion of gross fixedinvestment, lower than in Taiwan and much lowerthan in Indonesia, Malaysia, Singapore, the Philip-pines, and Thailand.41 This reliance on foreigncapital provided the government with an importanttool Of industrial policy.
In 1983, however, the government revised theForeign Capital Inducement Law to attract moreFDI. 42 It anticipated that more FDI would bringmore foreign technology. The new law is designedto reduce the number of restrictions on foreigninvestment, to accelerate the approval process, andto strengthen patent and copyright laws. Followingthese changes, the share of FDI in total capitalinflows rose to 13.8 percent by 1988.43 Meanwhile,the need for foreign borrowing declined as Koreamoved from being a capital importing country to acapital exporter.
Technology Policies
Korea’s technology policies fall into two stages ofdevelopment. The frost stage covers the period fromthe mid-1960s to about 1980; the second stagecovers the 1980s. The primary thrust of the froststage was to obtain foreign technology and to masterits use, while the secondary thrust was to developKorea’s own R&D capacity. In the second stage, thepriorities were reversed.
The Korean Government paid careful attention tothe way foreign technology was obtained. It discour-aged FDI while encouraging licensing both as amore effective means of transfer and as involvingless dilution of national control of production. Thegovernment screened licenses. It established advi-sory committees with representatives from industry,universities, and state laboratories, and it bargainedwith technology suppliers as a sole buyer, obtainingbetter deals than the firms could have negotiating ontheir own.
Almost 80 percent of licensing agreements arewith Japanese or American firms. From 1962 to1985, Japan was the source of 55 percent of theagreements, the United States, 23 percent. But theUnited States received a much larger share of totalroyalty payments, 42 percent against Japan’s 30percent, reflecting Korea’s purchase of more sophis-

312 . Competing Economies: America, Europe, and the Pacific Rim
ticated and larger scale technology from the UnitedStates.44
Licensing agreements and FDI became moreimportant in the 1980s as the government liberalizedboth. Efforts were made to tighten intellectualproperty protection, largely in response to persistentexternal pressure. The laws on patents and copy-rights were comprehensively revised in 1987, andKorea has signed most international intellectualproperty rights treaties in recent years. This effort toliberalize transfers and tighten protection probablycontributed to the increase in licensing agreementsfrom 1982 to 1985. Most U.S. Government andbusiness concerns with the laws themselves havebeen resolved, and the emphasis is now on enforce-ment, which many U.S. companies, especially inpharmaceuticals, claim is lax.45
During the first phase of technology policy, thedevelopment of Korea’s own R&D capacity was asecondary goal. Nonetheless, early on the govern-ment began a long-term effort to increase Korea’sR&D capacity. In 1966, the government created amajor public industrial R&D laboratory, the KoreaInstitute for Science and Technology (KIST), fol-lowed by the Ministry of Science and Technology(MOST) in 1967.
As Korea moved closer to the technologicalfrontier, it reversed earlier priorities by emphasizingthe generation of new technological capabilities. Inthis second stage of technology policy, begun in the1980s, the government intensified efforts to build a“national innovation system. ” A much higherproportion of R&D was carried out in private firmsor consortia; government research organizationsfocused on generic technologies and/or on providinga bridge between university research labs andbusinesses. Previous restrictions governing technol-ogy transfer from abroad, such as limits on royalties,were liberalized.
Korea’s centralized system for planning andimplementing R&D policies is similar to those ofJapan, Taiwan, France, and Germany, as opposed tothe United States and the United Kingdom. Thecentralized system permits a clear-cut and long-termstrategy for the development and commercializationof specific technologies and products. The system isdominated by MOST, which orchestrates a series ofplanning exercises with participation from otherministries and representatives of industries andresearch institutions. Science and technology plans
are drawn up annually, with 5-year plans as well. In1969 and 1986, 15-year plans attempted to deter-mine key technologies over the long term andidentify the potential for strengthening Korea’scapability in them. The 1986 plan, published underthe title “The Long Term Technology Forecast forthe Year 2000,” resulted from 2 years of discussionamong some 500 experts in 8 subgroups.46
An important component of the institutionalarrangements governing technology are nine gov-ernment research institutes covering, among otherfields, basic science, electronics, energy, and ma-chinery (table 7-10). Over the 1980s, as privatecompanies began to establish their own R&D labs,the national labs moved away from applied researchand commercialization toward more basic technolo-gies, often in collaboration with private firms.
The year 1980 marked the beginning of NationalTechnology Promotion Conferences, held quarterlyand presided over by the President. The conferencebrings together cabinet ministers, officials, represen-tatives of industry, and members of research insti-tutes, perhaps 250 in all.47 This discussion forumrepresents a continuation of the approach appliedearlier to exports through the Export PromotionMeetings, which were replaced by the NationalTechnology Promotion Conference, indicating ashift in policy emphasis.48
Based on information and opinion expressedthrough these networks and fora, the “Year 2000”study set 25 activities as priority areas, within whichprojects should be chosen by government andbusiness. Some of the 25 were leading sectors, whileothers were selected because they support thegrowth of leading sectors. The frost set includescomputers, software, semiconductors, telecommuni-cations, bioengineering, and fine chemistry; thesecond set includes design engineering, spare partsand materials, machine automation, and standardsand measurements.
To implement such plans, the government hasused a variety of policies, including manpowerdevelopment, financial and tax incentives, andtechnology transfer. The government has sponsoreda huge expansion of science and engineering placesin schools and colleges. Enrollments in third-levelengineering and science courses increased from303,202 in 1980 to 494,925 in 1986, or 1.6 times.49
Several hundred students in public research insti-tutes, mainly in the Korean Advanced Institute of

Chapter 7—The New Competitors: Industrial Strategies of Korea and Taiwan ● 313
Table 7-10-Korea: Major Government Research Institutes in 1985n
ExpenditureName Research fields ($millions) Staff
Korea Advanced Institute of Science & Multidisciplinary $102 1,628Technology (KAIST)
Electronics and Telecommunications Semiconductors computers, $40 1,210Research Institute (ETRI) telecommunications
Korea Advanced Energy Research Atomic energy $31 934Institute (KAERI)
Korea Institute of Machinery and Machinery, metals, shipbuilding $21 745Metals (KIMM)
aMilitary labs are excluded.NOTE: In 1968, KAIST had 1,429 people, of whom 293 had Ph.D.s and 636 had MA.s; KETRI had 1,258 people, of
whom 47 had Ph.D.s and 840 had M.A.s.SOURCE: Ministry of Science and Technology, Introduction to Science and Technology, Repub/ic of Korea (Seoul:
Ministry of Science and Technology, 1966); Yong-chan Park, ‘The National System of Innovation in Korea,With an Introduction to the Semiconductor Industry” (University of Sussex, MSC thesis, 1987).
Science and Technology, have scholarships pro-vided by private companies. These students nor-mally move to the R&D laboratories of theirsponsoring firms on graduation, providing the basisfor continuing dialogue between researchers ofprivate firms and the public institutions.
The government also sponsors an overseas studyprogram, mostly for post-doctoral students. Between1981 and 1985, 2,222 scientists and engineers weredispatched to the United States, Japan, and Europefor further study or work experience; the rate ofdispatches scheduled to increase.50Another programcreates a network among Korean scientists andengineers working abroad. Until recently the phe-nomenon of foreign-educated Koreans remainingabroad was seen as a “brain drain, ” with negativeconsequences for Korea’s development. Now it isseen as constituting a “brain bank” of high-levelhuman capital. Korean companies and governmentresearch organizations can target individuals withneeded skills, either inducing them to return toKorea or leaving them in situ to do work of interestto those companies or organizations.
.
Further, the government has undertaken moretargeted financial policy actions, providing directsupport for R&D in the fields of electronics,mechanical engineering, chemistry, energy, andbioengineering. In 1986, 660 projects received directsupport amounting to $56 million, with another $21million in cofinancing from private fins. Severalearmarked funds make loans for electronics, ma-chinery, and textiles to support R&D investmentstotalling $100 million between 1981 and 1985.
More important is the “policy” loan window, orsubsidized credit facility, of the commercial banks,described earlier. The Korea Industrial Bank and theKorean Bank for Small and Medium Enterpriseschannel money specifically for start-ups and forinvestment in R&D facilities, $130 million in 1985.Another mechanism is venture capital. By 1986, thegovernment had sponsored four venture capitalfins, with public or mixed public/private owner-ship.51
Through the 1970s and more intensively since thetax reform of 1981, the government has used taxcredits and deductions to stimulate R&D. Some ofthe more important include:52
1.
2.
3.
Tax deductions for technology developmentand manpower development; 10 percent ofcost can be deducted from income tax.Funds earmarked for R&D can be set aside ina reserve and deducted from taxable income,up to 1 percent of turnover or 20 percent ofincome. In high-technology industries, theseceilings are 1.5 percent of turnover or 30percent of income.Tax deduction or accelerated depreciation oninvestment cost of commercialization, either6 percent of investment cost or 50 percentdepreciation in frost year; or for locally madeequipment, 10 percent of investment cost.
R&D expenditures increased rapidly, at an aver-age annual rate of over 40 percent between 1980 and1985 (in current won), rising from 0.58 percent ofgross national product (GNP) in 1980 to 1.59 percentin 1985. A quarter of the total went to electronics in1985. Two-thirds was spent by private industry,
292-889 0 - 91 - 11 QL:3
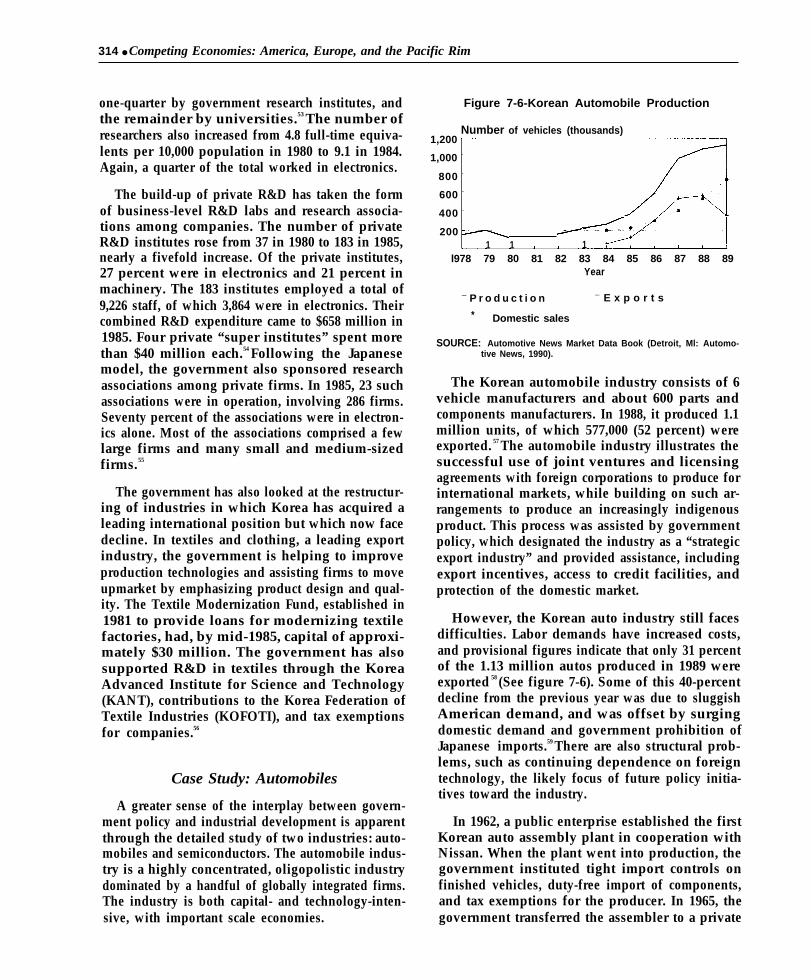
314 ● Competing Economies: America, Europe, and the Pacific Rim
one-quarter by government research institutes, andthe remainder by universities.53 The number ofresearchers also increased from 4.8 full-time equiva-lents per 10,000 population in 1980 to 9.1 in 1984.Again, a quarter of the total worked in electronics.
The build-up of private R&D has taken the formof business-level R&D labs and research associa-tions among companies. The number of privateR&D institutes rose from 37 in 1980 to 183 in 1985,nearly a fivefold increase. Of the private institutes,27 percent were in electronics and 21 percent inmachinery. The 183 institutes employed a total of9,226 staff, of which 3,864 were in electronics. Theircombined R&D expenditure came to $658 million in1985. Four private “super institutes” spent morethan $40 million each.54 Following the Japanesemodel, the government also sponsored researchassociations among private firms. In 1985, 23 suchassociations were in operation, involving 286 firms.Seventy percent of the associations were in electron-ics alone. Most of the associations comprised a fewlarge firms and many small and medium-sizedfirms.55
The government has also looked at the restructur-ing of industries in which Korea has acquired aleading international position but which now facedecline. In textiles and clothing, a leading exportindustry, the government is helping to improveproduction technologies and assisting firms to moveupmarket by emphasizing product design and qual-ity. The Textile Modernization Fund, established in1981 to provide loans for modernizing textilefactories, had, by mid-1985, capital of approxi-mately $30 million. The government has alsosupported R&D in textiles through the KoreaAdvanced Institute for Science and Technology(KANT), contributions to the Korea Federation ofTextile Industries (KOFOTI), and tax exemptionsfor companies.56
Case Study: Automobiles
A greater sense of the interplay between govern-ment policy and industrial development is apparentthrough the detailed study of two industries: auto-mobiles and semiconductors. The automobile indus-try is a highly concentrated, oligopolistic industrydominated by a handful of globally integrated firms.The industry is both capital- and technology-inten-sive, with important scale economies.
Figure 7-6-Korean Automobile Production
Number of vehicles (thousands)1,200
1,000 -
800 -
600 -
400 -
200 -~1 1 1 I 1
l978 79 80 81 82 83 84 85 86 87 88 89Year
— P r o d u c t i o n — E x p o r t s
* Domestic sales
SOURCE: Automotive News Market Data Book (Detroit, Ml: Automo-tive News, 1990).
The Korean automobile industry consists of 6vehicle manufacturers and about 600 parts andcomponents manufacturers. In 1988, it produced 1.1million units, of which 577,000 (52 percent) wereexported. 57 The automobile industry illustrates thesuccessful use of joint ventures and licensingagreements with foreign corporations to produce forinternational markets, while building on such ar-rangements to produce an increasingly indigenousproduct. This process was assisted by governmentpolicy, which designated the industry as a “strategicexport industry” and provided assistance, includingexport incentives, access to credit facilities, andprotection of the domestic market.
However, the Korean auto industry still facesdifficulties. Labor demands have increased costs,and provisional figures indicate that only 31 percentof the 1.13 million autos produced in 1989 wereexported 58 (See figure 7-6). Some of this 40-percentdecline from the previous year was due to sluggishAmerican demand, and was offset by surgingdomestic demand and government prohibition ofJapanese imports.59 There are also structural prob-lems, such as continuing dependence on foreigntechnology, the likely focus of future policy initia-tives toward the industry.
In 1962, a public enterprise established the firstKorean auto assembly plant in cooperation withNissan. When the plant went into production, thegovernment instituted tight import controls onfinished vehicles, duty-free import of components,and tax exemptions for the producer. In 1965, thegovernment transferred the assembler to a private

Chapter 7—The New Competitors: Industrial Strategies of Korea and Taiwan ● 315
firm and approved a new technology agreement withToyota. The government set a target of 50 percentdomestic content in 5 years, rigorously enforcedthrough control of access to foreign exchange. Withheavy protection plus domestic content require-ments in place, and with domestic componentsproduction growing fast, three more private firmswere allowed to enter between 1965 and 1969 tofight for a market of less than 20,000 units a year.
The Heavy and Chemical Industry Plan of 1973identified autos as a priority industry. In 1974, anindustry-specific plan for automobiles was pub-lished covering the next 10 years. The objectiveswere to achieve a 90 percent domestic content forsmall passenger cars by the end of the 1970s and toturn the industry into a major exporter by the early1980s. 60 The government stipulated the three pri-mary producers, all chaebol, the minimum size ofeach producer, and the maximum size of car engines.It also required approval of all plans and precludedcompanies from changing their model within a settime.
Later requirements had the three producers setexport targets for different markets, frost in South-east Asia, then Latin America and the Middle East,peripheral Europe, Canada, and finally the UnitedStates. Companies were encouraged to set the exportprices low, receiving various forms of compensa-tion. The Hyundai Pony cost $3,700 to produce in1979, sold domestically for $5,000, and sold abroad(free on board) at $2,200.61 Firms received heavyexport subsidies, particularly through access tocredit, and were allowed to import a limited numberof top-of-the-range models in kit form for lucrativedomestic elite sale. The number of these imports wastied to export performance. Under these circum-stances, the Korean producers invested heavily inanticipation of the export drive.62
In 1974, the government launched a complemen-tary promotion plan for the parts and componentsindustry. The plan required the three primary pro-ducers to meet a domestic content schedule andcooperate in the production of standardized parts andcomponents. It further empowered the Ministry ofTrade and Industry to select certain items and theirassigned producers for special promotion, with acomplete import ban once the item met the govern-ment’s price and quality standards.
In 1980, following the second oil crisis and therapid deterioration of domestic and world economic
conditions, Chun Doo Hwan’s government under-took a comprehensive rationalization of heavy andchemical industry sectors, including autos. The newregime decided that there was to be only one mainauto producer, forcing one of the three ‘‘majors’ toleave the business, a decision not reversed until1984, It informed the other two that their rivalry incars and power equipment was counterproductive,and asked them to concentrate on one line ofbusiness each. The Hyundai group got cars. Thegovernment reduced the automobile excise tax tostimulate domestic demand, halved the export tar-gets, and greatly increased the volume of conces-sional credit. The investment drive resumed in 1982as the economy recovered, with Hyundai Motor’sdebt to equity ratio soaring to 5:1. By 1986, theHyundai Excel had become the best-selling new carimport in U.S. history, following its earlier successin Canada. In 1988, Hyundai produced 650,000 cars,of which 63 percent were exported.
In 1987, Kia and Daewoo were allowed to reenterthe passenger car business.63 They will soon bejoined by Ssang Yong Motors, a subsidiary of theSsangyong chaebol. 64 Unlike Hyundai, which sellsunder its own name, Kia and Daewoo both sell theirautos through foreign companies: Kia makes theFestiva for Ford Motors, and Daewoo the Lemansmodel for Pontiac. Similarly, Ssang Yong plans totransfer its present expertise in truck and jeepassembly to auto exports through a tie-up withVolvo.65
The automobile industry illustrates the range andmultiplicity of arrangements between Korean andforeign producers. Hyundai is 10-percent owned byMitsubishi and remains dependent on the Japanesecompany for its engines and designs. Its first exportsuccess, the Pony, was planned in Italy by a formerdesigner for British Leyland. The Excel is a near-clone of the Mitsubishi Mirage, with Mitsubishi-made engine and transmission. Daewoo is in a 50-50joint venture with General Motors to make a‘‘world-class’ subcompact car. Kia Motors, after aperiod of assembling Fiats and Peugeots in the late1970s, has turned to Mazda of Japan for technicalguidance and through Mazda (which is 24-percentFord-owned) to Ford Motors for overseas salesnetworks and brand recognition. Mazda has aminority equity stake in Kia, and has supplied Kiawith designs for two mid-sized cars. However,Mazda has grown reluctant to transfer key compo-

316 ● Competing Economies: America, Europe, and the Pacific Rim
nent designs or grant the right to sell in Europe to itsown future competitor.66
Korean automakers are reaching the limits ofthese partnerships. Foreign automakers are morereluctant to part with proprietary technology simplyfor a fee, and, for their part, hope to gain entry to theKorean market through their local partners. Conse-quently, the Koreans are turning to in-house R&Dwith the goal of bringing a wholly Korean-made carto market within the next few years. The Ministry ofTrade and Industry estimates auto industry invest-ment for 1990 alone to exceed $1.7 billion. Hyundaihas announced plans to invest over $2.5 billionthrough 1992.67 Because government plans call fordoubling plant capacity by 1995,& however, thepercentage of new investment funds going towardR&D is not clear. Kia is planning to market asub-compact model for 1992 with an engine de-signed in-house. Hyundai has similar plans, but hasconceded that its engine designs cannot match theperformance of the Mitsubishi engines. Governmentpolicy towards auto production should thereforereduce the development costs of new, indigenousproducts through publicly funded or collaborativeresearch programs and continued concessional credit.
Socializing the cost of investment will not spareKorea’s automakers from labor demands. Followingthe announcement of a liberalization of politics in1987, Korea’s auto exporters have experiencedproduction slow-downs and higher wage settle-ments. Relatively smooth labor relations at Kiashow in productivity statistics: its employees pro-duced 17.4 automobiles per person in 1989, a steadygrowth from 13.1 per person in 1983. But whileHyundai’s productivity reached a peak of 21.8 unitsper person in 1987, the number fell to 19.8 in 1988and 16.7 in 1989. Daewoo marked the lowestproductivity with 10.0 units per person in 1989.69
Ssang Yong has avoided most of these difficulties byoffering competitive wage settlements (a 20-percentincrease in 1988) and by being located away fromthe others’ labor disputes.
70 Those disputes resultedin industry average wage increases of 21.8 percent in1988 and 23.3 percent in 1989. Increases in 1990 aremore moderate: 10 percent for Hyundai, 7 percentfor Daewoo, and 7.3 percent for Kia.71 Governmentplans to foster improved labor-management rela-tions may include avoiding discussion above thecompany level, while resisting any attempts atcross-company organization.
Despite the booming domestic demand for autos,the Korean auto market is still highly protected. Inresponse to intense U.S. pressure for general tradeliberalization, the government announced an autoliberalization schedule in 1985, which permittedsmall car imports to begin in 1988 for the first timein over 25 years, but with a duty of 200 percent, tobe lowered to 100 percent after 2 years. Japanesecompact models remain the most heavily restricted.Imports of cars above 2,000 cc were liberalized inmid-1987, but by year end only 44 had beenimported. In 1988, 396 foreign cars were imported,and 501 were sold in the first half of 1989.72 Thesefigures differ sharply from those of Taiwan, whereautomobile imports account for nearly 40 percent ofdomestic sales in a market less than half the size ofKorea’s. Korean dealers claim that bureaucraticdelays and tariffs are not the primary deterrent toincreased imports. Instead, they blame the NationalTax Administration, whose investigations of foreigncar buyers’ finances have heightened social pressurenot to flaunt wealth.73 In any case, the government’sability to restrict imports despite the trend towardliberalization is obvious.
The government’s ability to limit entry of newproducers at home, and thereby protect economies ofscale, is a key reason for the success of the Koreanautomobile industry in world export markets. Thiswas a crucial component of the 1974 auto plan, andeven when some opening of the market occurred inthe 1980s, there was an effort to limit the number ofentrants. Because companies in Korea must seekgovernment approval for technology imports fromforeign companies, they can be easily barred fromtechnology-intensive sectors like automobile manu-facture. 74 Samsung has tried to line up with Chrysler,but the government refused to allow Samsung tostart an export-oriented car plant. More recently, theMinistry of Trade and Industry rejected a plan bySamsung to join with Nissan Diesel to produce largetrucks, a possible prelude to Samsung’s expansioninto auto exports.
75 The Taiwanese Government wasmuch less successful in restricting entry, and partlyas a result the industry remains undeveloped there.
Case Study: Semiconductors
While Korea’s electronics production is gearedlargely to exports, the domestic market also hasexpanded as per capita incomes have risen. In 1988,approximately 60 percent of electronics productionwas exported, 40 percent sold domestically.76
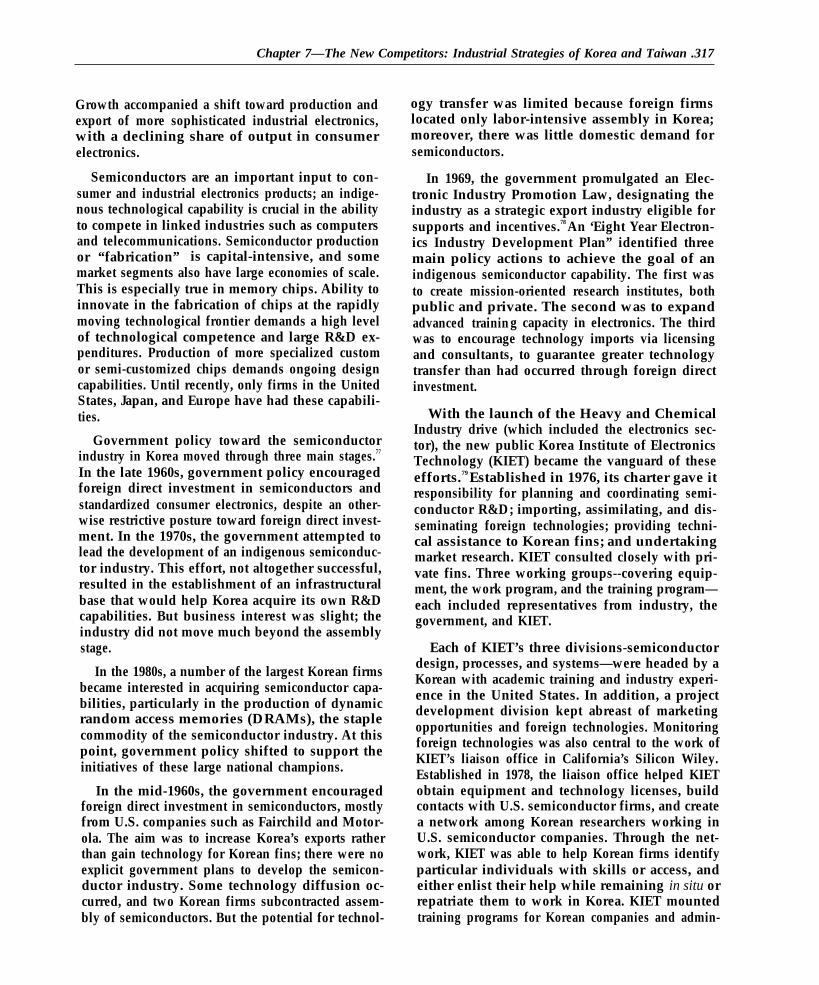
Chapter 7—The New Competitors: Industrial Strategies of Korea and Taiwan .317
Growth accompanied a shift toward production andexport of more sophisticated industrial electronics,with a declining share of output in consumerelectronics.
Semiconductors are an important input to con-sumer and industrial electronics products; an indige-nous technological capability is crucial in the abilityto compete in linked industries such as computersand telecommunications. Semiconductor productionor “fabrication” is capital-intensive, and somemarket segments also have large economies of scale.This is especially true in memory chips. Ability toinnovate in the fabrication of chips at the rapidlymoving technological frontier demands a high levelof technological competence and large R&D ex-penditures. Production of more specialized customor semi-customized chips demands ongoing designcapabilities. Until recently, only firms in the UnitedStates, Japan, and Europe have had these capabili-ties.
Government policy toward the semiconductorindustry in Korea moved through three main stages.77
In the late 1960s, government policy encouragedforeign direct investment in semiconductors andstandardized consumer electronics, despite an other-wise restrictive posture toward foreign direct invest-ment. In the 1970s, the government attempted tolead the development of an indigenous semiconduc-tor industry. This effort, not altogether successful,resulted in the establishment of an infrastructuralbase that would help Korea acquire its own R&Dcapabilities. But business interest was slight; theindustry did not move much beyond the assemblystage.
In the 1980s, a number of the largest Korean firmsbecame interested in acquiring semiconductor capa-bilities, particularly in the production of dynamicrandom access memories (DRAMs), the staplecommodity of the semiconductor industry. At thispoint, government policy shifted to support theinitiatives of these large national champions.
In the mid-1960s, the government encouragedforeign direct investment in semiconductors, mostlyfrom U.S. companies such as Fairchild and Motor-ola. The aim was to increase Korea’s exports ratherthan gain technology for Korean fins; there were noexplicit government plans to develop the semicon-ductor industry. Some technology diffusion oc-curred, and two Korean firms subcontracted assem-bly of semiconductors. But the potential for technol-
ogy transfer was limited because foreign firmslocated only labor-intensive assembly in Korea;moreover, there was little domestic demand forsemiconductors.
In 1969, the government promulgated an Elec-tronic Industry Promotion Law, designating theindustry as a strategic export industry eligible forsupports and incentives.78 An ‘Eight Year Electron-ics Industry Development Plan” identified threemain policy actions to achieve the goal of anindigenous semiconductor capability. The first wasto create mission-oriented research institutes, bothpublic and private. The second was to expandadvanced training capacity in electronics. The thirdwas to encourage technology imports via licensingand consultants, to guarantee greater technologytransfer than had occurred through foreign directinvestment.
With the launch of the Heavy and ChemicalIndustry drive (which included the electronics sec-tor), the new public Korea Institute of ElectronicsTechnology (KIET) became the vanguard of theseefforts.79 Established in 1976, its charter gave itresponsibility for planning and coordinating semi-conductor R&D; importing, assimilating, and dis-seminating foreign technologies; providing techni-cal assistance to Korean fins; and undertakingmarket research. KIET consulted closely with pri-vate fins. Three working groups--covering equip-ment, the work program, and the training program—each included representatives from industry, thegovernment, and KIET.
Each of KIET’s three divisions-semiconductordesign, processes, and systems—were headed by aKorean with academic training and industry experi-ence in the United States. In addition, a projectdevelopment division kept abreast of marketingopportunities and foreign technologies. Monitoringforeign technologies was also central to the work ofKIET’s liaison office in California’s Silicon Wiley.Established in 1978, the liaison office helped KIETobtain equipment and technology licenses, buildcontacts with U.S. semiconductor firms, and createa network among Korean researchers working inU.S. semiconductor companies. Through the net-work, KIET was able to help Korean firms identifyparticular individuals with skills or access, andeither enlist their help while remaining in situ orrepatriate them to work in Korea. KIET mountedtraining programs for Korean companies and admin-

318 ● Competing Economies: America, Europe, and the Pacific Rim
istered a program to send Korean engineers andscientists abroad for experience in research institutesor companies. KIET took part in all technologytransfer negotiations between Korean and foreignfirms; in these negotiations, its Silicon Valleyoutpost and its project development division wereespecially important.
KIET opened Korea’s first pilot wafer fabricationfacility in a 1978 joint venture with a leading U.S.semiconductor firm, VLSI Technology. A year laterit began building Korea’s first full-scale commercialwafer fabrication facility to produce 16K DRAMs.
But most of the semiconductor industry in Koreawas still concentrated at the assembly, packagingand testing stages, with little development of themore demanding segments of the industry. The fewlocal firms that established fabrication facilitieswere dedicated to semiconductors at the commodityend of the market, mainly for use in consumerelectronics. These companies were too small toundertake the huge investments needed to makestandardized large-capacity chips, and lacked thedesign capability to produce customized chips.
Meanwhile, however, Korea’s largest consumerelectronics firms became interested in advancedsemiconductor production because of their bigin-house demand for semiconductors and a sense ofvulnerability to manipulation by foreign semicon-ductor suppliers, particularly the Japanese. Between1980 and 1990, five companies achieved the capa-bility to fabricate state-of-the-art semiconductordevices, and three--samsung Electronics, HyundaiElectronic Industries, and Goldstar Electron-wereinvolved in DRAM production. All three had linksto large groups with substantial financial power, andwere the national champions in the more sophisti-cated segments of the semiconductor industry in the1980s.
The question was how to overcome the massiveentry barriers to the more technology intensivesegments of the market. The 1981 Basic Plan forPromotion of the Electronics Industry covered theperiod 1982-1986; in 1983, the Ministry of Com-merce and Industry issued a report calling foraccelerated development of semiconductors.80 De-spite the general move away from targeted policies,this plan included a wide range of fiscal andfinancial investment incentives for the main semi-conductor firms.81 The plan established an Electron-ics Support Fund, financed by public and private
sector contributions to lend at preferential rates tofirms engaged in priority activities. One of these wasthe establishment of R&D subsidiaries abroad.Infant-industry protection was also used. In 1984,the import of 185 electrical and electronics productswas restricted, accounting for 37 percent of allelectronic product categories. While direct financialsubsidies and import protection were phased outover the decades, these measures still lowered thecost of entry into an extremely risky field.
The government also sought to restructure theindustry using government procurement. A goal ofthe plan was to integrate upstream and downstreamsegments, maximizing economies of scale andtechnological spillovers. This was a consciousimitation of Japan, where semiconductor companieswere divisions of larger electronics companies,which were, in turn, parts of conglomerates.
An important step was to use the government’stight control of telecommunications to aid the bigKorean firms’ entry into advanced semiconductors;indeed, the Korean Telecommunication Authoritywas one of the sponsors of large-scale integration inthe early to mid- 1980s. The restructured telecommu-nications industry forced out some firms, with othersassigned government-selected monopoly segments.Meanwhile, the government announced a multibil-lion dollar expansion and modernization of thecountry’s telecommunications infrastructure, mostof which would be guaranteed to the semiconductorchampions. The three industry leaders entered jointventures with multinational firms (ITT, AT&T,Northern Telecom), offering lucrative and risk-freetelecommunications business in return for the trans-fer of specified telecommunications and semicon-ductor technology.
Computer policy also affected the development ofsemiconductors. The government first relied onobligatory public procurement of Korean-mademachines. Then, in line with the Computer IndustryPromotion Master Plan of 1984, it intensified therole of the national research labs, especially theElectronics and Telecommunications Research In-stitute (ETRI), in the acquisition of computertechnology. It also imposed, until 1988, a completeban on imports of microcomputers and gave soft-ware firms low interest loans for up to 90 percent oftheir R&D spending. The public sector expanded itsuse of microcomputers, and in 1986, the governmentannounced domestic content guidelines for all mi-

Chapter 7—The New Competitors: Industrial Strategies of Korea and Taiwan .319
crocomputers and peripherals, whether they weresold to the government or not.82 Figure 7-7 summa-rizes the growth of the Korean computer productionand exports.
It appears, though, that the driving force inKorea’s push into semiconductors was industry.Firms drew on both government support and theirown substantial financial capabilities to jump di-rectly into the high-volume memory market. In1983, Samsung, the early leader in the field,acquired DRAM production technology from Mi-cron Co. of the United States.83 The company wentfrom greenfield sites to operating plants for 64KDRAM chips in only 8 months in 1984, half the timeit took in the United States and two-thirds of the timein Japan.84
This strategy had substantial risks, however, sincecommodity memory chips are subject to notoriousprice fluctuations; just as Samsung entered the 64KDRAM market, prices fell dramatically and thecompany was forced to absorb large losses. None-theless, because of its size and diversified structure,the company persevered, moving quickly from 64KDRAMs to 256K DRAMs to the mass manufactur-ing of the 1M DRAM by the late 1980s. Thecompany introduced engineering samples of 4 meg-abit DRAMs in late 1988, only 6 to 9 months behindthe Japanese leaders.85
The investment needed for this achievement, andthe attendant risk, show in the high debt/equity ratioof the firm that manages Samsung Group’s semicon-ductor interests: nearly 7 to 1 in mid-1987. Sincemuch of the debt was in the form of bank loans, andsince the government still influenced the bankingsystem after denationalization, this figure suggestsgovernment support for Samsung’s strategy. Thefinancing terms were generous, and Samsung cross-subsidized from other profitable parts of the group.In 1985, Samsung Semiconductor contributed 2.5percent to the group’s sales and made one-third ofthe group’s investment.86 Samsung’s in-house R&Dinstitute had more than 600 researchers and a budgetof over $40 million in 1986. Its Silicon Wileyoutpost had a staff of 213 employees.
The strategies of the other two major producersdiffered from Samsung in their precise product mix.Nonetheless, the three companies’ strategies hadseveral factors in common:
●
●
●
secure technology through licensing or joint-venture arrangements;make massive investments in commodity chipproduction; andestablish an American presence in SiliconValley both for the acquisition of technologyand to facilitate marketing.
Figure 7-7—Korean Computer Industry Exports and Production by Product
1985I f I I
600 500 400 300 200 100 0 1 0 0 2 0 0 3 0 0 4 0 0 5 0 0 6 0 0
Exports (US $ millions) Production (US $ millions)m Mini computers U Micro computers
m P C s m Peripherals
SOURCE: Stephan Haggard, David Lane, Robert Wade; and Robert Neff and Laoemi Nakarmi, “In Korea, All Circuitsare Go,” Business Week, No. 3168, July 9, 1990, pp. 69, 71.

320 ● Competing Economies: America, Europe, and the Pacific Rim
Hyundai got its initial production technology fromVitalec, an American firm. In early 1983, Hyundaiannounced an ambitious development plan thatincluded a $450 million, 5-year investment programand the establishment of a subsidiary in SiliconValley capitalized at $5 million. In 1985, the firmbegan making 256K DRAMs, bypassing productionof 64K DRAMs altogether.87
Goldstar had a longer-established presence inelectronics and technology agreements with West-ern Electric and Honeywell. Goldstar devoted moreattention to diversifying its production among anumber of semiconductor devices. Nonetheless, italso tried to jump ahead of Samsung by securingtechnology for the 256K DRAM from AT&T and in1989 concluded a highly publicized deal withHitachi that gave it the technology for the 1MDRAM.88
The scale of South Korean investment in semi-conductors was huge. The national championscommitted more than $1.2 billion to semiconductorsfor 1983 to 1986, five times more than the combinedinvestment of Taiwan’s four major semiconductorprojects for 1984 to 1987-1988.
As business took the lead, the role of governmentpolicy changed. KIET, having pioneered medium-scale semiconductor technology, found that by 1984the chaebol had superior fabrication facilities andwere rapidly expanding their in-house R&D capac-ity. Rather than attempt to guide the entry intosuccessive stages of DRAM fabrication, KIET leftthis to the fins. It sold most of its fabricationfacilities to one of the chaebol, changed its name tothe Electronics and Telecommunications ResearchInstitute (ETRI), and initiated parallel basic researchefforts in semiconductors, computers, and telecom-munications. This is not to say that ETRI, as thenational R&D laboratory, has been eclipsed. Its staffnumbered 1,200 in 1985, with a budget of over $40million.89
By the time the 64K DRAMs were produced, theproduct cycle had already passed the phase of highscarcity. World demand for semiconductorsslumped; aggressive pricing by the Japanese low-ered the price still further. From 1985 to 1987,Korea’s VLSI facilities operated at only 30 percentof capacity or less much of the time, with the pricewell below cost of production. Yet the governmentdid not pour in fresh money. It was reluctant tocommit itself to assisting another high-risk, capital-
intensive industry in difficulty, having just finishedthe restructuring of the heavy and chemical indus-tries in the 1970s. The popular impression thatKorean firms have made it to the world semiconduc-tor frontier without government help probably is dueto this refusal to help the troubled fins, combinedwith anxiety to conceal government help for fear ofretaliation from the United States and Japan ongrounds of “unfair competition.”
By 1986, the government decided to get moreinvolved again. As Korea’s capacity to innovate inthe production of standard chips became manifest, itbecame increasingly difficult for companies toaccess foreign technologies. The government wasconcerned about the royalties that Korean firms werepaying. Moreover, the government was planning anational computer network costing several hundredsof millions, for which most contracts would besteered to Korean companies. Joint development ofadvanced chips would be a giant step in thatdirection, especially because large-capacity memorychips are considered the ‘‘technology driver” forseveral kinds of advanced semiconductors integralto such a system.
In conjunction with ETRI, the government coor-dinated the leading firms to form a Japanese-styleR&D consortium to develop the 4 megabit memorychip. A board of ETRI-sponsored experts allocatedmoney from a joint government-business researchfund to support projects proposed by research teamsfrom member firms. Those teams whose engineeringsamples met govemment-specified standards had torepay much less on government loans than thosewhose samples failed. This performance-based co-operation resulted in increased R&D competitionamong member firms. By 1990, 18 collaborativeresearch projects were underway through the con-sortium arrangement, with total R&D expensesestimated at $250 million.90
When world prices of memory chips started to risein 1988, the conglomerates, which had been pre-pared to wait until the 1990s, began to earn bigprofits on semiconductors. By 1990, Korea was theworld’s third largest fabricator of DRAMs after ‘Japan and the United States.
Several conclusions can be drawn from thisanalysis of the development of the Korean semicon-ductor industry. Direct government efforts to leadthe industry in the absence of strong private sectorinterest do not appear to have been effective in the

Chapter 7—The New Competitors: Industrial Strategies of Korea and Taiwan ● 321
short run, but they probably did have long-termeffects.
The industry took off with the entry of the largechaebol. A variety of market forces made such amove imperative, including their own internal de-mand for chips. Their entry had extensive govern-ment backing and followed closely a new govern-ment plan that included both direct financial supportand fiscal incentives to investment in R&D andtraining. The growth of the chaebol was partly anoutgrowth of government policy during the heavyand chemical industry drive of the 1970s, when theelectronics sector was targeted for support. The threetechnological leaders in the 1980s benefited fromthe incentive policies of the 1970s, and through theirentry into consumer and industrial electronics devel-oped their appetite for in-house production of chips.
Korea’s industrial strategy and structure in semi-conductors has some limitations. While the chaebolhave made large investments in the production ofcommodity chips, policy has neglected the develop-ment of the small and medium-sized firms thatplayed an important role in technological innovationin the United States and Taiwan. Moreover, byconcentrating on standardized chip production, theKorean industry is vulnerable to price fluctuationsand low profitability, though it is perhaps better ableto withstand them, compared with most semicon-ductor firms in the United States, due to theintegration of the largest Korean producers. Wereturn to some of these issues when discussingTaiwan’s strategy toward the industry.
THE ROLE OF GOVERNMENTPOLICY: TAIWAN
Taiwan’s industrial strategy has moved throughstages similar to Korea’s.9l From 1945 until the late1950s, the emphasis was on import substitution todevelop light manufacturing industries. Around1960, some of the import-substitution controls weredismantled, and export promotion measures intensi-fied, resulting in a rapid expansion of manufacturedexports. In the early 1970s, the government intensi-fied efforts to upgrade the industrial sector anddevelop heavy industries, and in the 1980s, theemphasis shifted to technological improvement.
Despite these similarities, there are importantdifferences between the two countries in bothindustrial strategy and structure. First, Taiwan’s
state-owned enterprises spearheaded the move intoheavy industries such as steel, cement, aluminum,and petrochemicals. Averaged over the 1970s,public enterprise’s share of industrial productionwas 22.5 percent, and 30 to 35 percent of gross fixedcapital formation was undertaken by public enter-prises. 92 (By 1988, public enterprise’s share ofindustrial production had fallen to 18.1 percent.)These figures put Taiwan in the top decile ofnoncommunist countries in terms of the size of theirstate-owned enterprise sector. This is an interestingparadox, given that Taiwan is generally viewed ashaving a market-oriented economy. The Kuomin-tang (KNIT), arriving at the end of World War II,brought with them a strong socialist element thatpervaded the Taiwanese Government for manyyears. The more numerous native Taiwanese areresponsible for much of the country’s recent busi-ness growth. The two factions have not always seeneye-to-eye.
A second difference is that the government has notexplicitly promoted the concentration of the indus-trial structure as a component of its developmentstrategy. Small and medium-sized firms have playeda much greater role in Taiwan than in Korea. Forexample, in 1981 Korea had 10 firms listed inFortune’s 500 biggest industrial firms outside theUnited States, while Taiwan had only 2. Hyundai,Korea’s largest private business group, had annualsales of $8 billion in 1983 and employed 137,000people; Formosa Plastics Group, Taiwan’s biggestprivate group, had annual sales of $1.6 billion and31,200 employees.93
The small size of Taiwan’s firms should not beexaggerated; over time, industrial concentration hasincreased. Almost half of manufacturing productionin 1971 and 1981 came from firma with more than500 employees, and firms with less than 20 employ-ees accounted for only 12 percent of manufacturedoutput in 1971 and 9 percent in 1981.94 Nonetheless,there is a notable difference in industrial structurebetween the two counties that had importantimplications for business strategy. Small firms aremore likely to seek out quick-entry niches in exportmarkets rather than attempt to produce standardized,high-volume items with high scale economies.
The role of foreign capital was also different inKorea and Taiwan. Taiwan has been more open toforeign direct investment than Korea. Foreign directinvestment has played a larger role in both capital

322 ● Competing Economies: America, Europe, and the Pacific Rim
formation and investment, and has been an explicitcomponent of the country’s technology strategy .95Meanwhile, savings in Taiwan have consistentlyoutstripped investment.
A final difference has to do with the range ofinstruments of industrial policy. Taiwan has had amore market-oriented strategy than Korea, with thegovernment playing a less directive role in theeconomy. For example, protection has been lowerand targeted credit policies have played a smallerrole in Taiwan than in Korea. The government hasdevoted more attention to the provision of infra-structure and to arms-length incentives, such asfiscal incentives, that are less discretionary.
The government recently gave up some of themore direct techniques it employed in the past. Thecountry is going through a period of substantialeconomic liberalization. Nonetheless, the govern-ment has by no means relinquished its role inguiding the evolution of the industrial structurethrough supportive policies, and in the 1980saccelerated its interest in enhancing the country’sindigenous technological capabilities.
Exchange Rate and Trade Policies
Trade has played an even larger role in Taiwan’seconomy than in Korea’s. Imports plus exports havebeen over half of GNP since 1970, and over 80percent of GNP since 1976. Moreover, Taiwan hasrun balance of payments surpluses in every yearsince 1970, with only three exceptions—1974, 1975,and 1980-when imports surged in connection withthe two oil shocks. Taiwan now has the secondlargest foreign exchange reserves in the world afterJapan, and by far the biggest per capita.
These surpluses are largely attributable to ex-change rate policy. The unification and devaluationof the exchange rate in the late 1950s was a keycomponent of the country’s export-oriented growthstrategy. Unlike Korea, where macroeconomic pol-icy has undergone several inflationary cycles, fiscaland monetary policy in Taiwan has been extremelyconservative, allowing the government to hold to afixed exchange rate policy. Because of its exportsuccess, and perhaps because of political pressurefrom the large export sector, the government wasreluctant to allow the exchange rate to appreciate inthe first half of the 1980s. Another reason for thecountry’s pursuit of surpluses is more political. Thegovernment is preoccupied with Taiwan’s vulnera-
bility to pressure from mainland China, and consid-ers large foreign exchange reserves a hedge againstdisruption of the island’s normal trade flows.
The Central Bank intervened continually bybuying foreign exchange, thus keeping the NewTaiwan dollar ($NT) undervalued. In 1986, how-ever, the government recognized the problemsassociated with the strong $NT, including inflation-ary pressures at home, and has slowly allowed thecurrency to appreciate. In 1989, the country under-took a major liberalization of its foreign exchangemarket, including floating the New Taiwan dollar.These actions reduced the bilateral surplus with theUnited States.
While less protectionist than Korea, the govern-ment has restricted imports. One reason was thattariff charges remained the single most importantitem of government revenue until the early 1980s.Ministry of Finance officials, worried about reve-nue, have resisted lowering tariffs. Even in themid-1980s, customs duty accounted for 17 percentof tax revenue, second only to income tax at 19percent. 96 Yet industrial policy was a motivation forprotection as well, suggested by the fact that theserestrictions were maintained even as foreign ex-change reserves ballooned in the early 1980s. Legaltariffs, which averaged over 60 percent in 1969,remained as high as 30 percent in 1986, with largedifferentials across sectors.97
Total tariff revenue as a percent of total imports,however, was only 9 percent in 1984, the differencebeing accounted for by exemptions on imports usedas inputs to exports. This drawback system was oneof the most power-lid export incentives at thegovernment’s disposal. Exporters enjoyed a free-trade regime; nonexporters, including consumers,paid higher prices for restrictive trade policies.
In terms of quantitative restrictions on imports, 80percent of items on the import schedule had norestrictions as of 1984, which appeared to reflect afairly liberal regime. However, the 20 percent ofitems with restrictions accounted for over half ofTaiwan’s imports that year. Twenty-nine percent byvalue had to be approved by a domestic agent,whether the producer of a domestic substitute (e.g.,steel, cement), or from a government bureau, such asthe Industrial Development Bureau of the Ministryof Economic Affairs. Another 21 percent werelimited by who could import them; some could beimported only by publicly owned trading compa-

Chapter 7—The New Competitors: Industrial Strategies of Korea and Taiwan ● 323
nies, others only by the end-user. Only 4 percentwere limited by origin in 1984; origin restrictions,especially from Japan and Korea, were much moreimportant in the past.98
Since the mid- 1980s, however, a dramatic liberal-ization of imports has occurred, matching an earlierrun-down of export promotion assistance. Theaverage tariff in 1986 was 28.2 percent. In August1987, tariffs were lowered on several thousanditems, reducing the average tariff level to just over20 percent. The level dropped further in 1988 to 13percent and in 1989 to 10.3 percent, with a target for1992 of of only 7 percent, equivalent to or even lowerthan in the advanced industrial states.99 Protection ofagricultural goods remains high; indeed, if it werenot for higher agricultural tariffs, Taiwan’s traderegime would approach complete free trade. Tariffson agricultural products in 1989 were 24.2 percent,scheduled to decline to 20 percent by 1992. As inKorea, liberalization of agricultural imports hasbeen a heated political issue.
Taiwan also revamped its system of nontariffcontrols. By March 1989, 98 percent of all productcategories were freely importable, with restrictionsremaining on articles related to national security andhealth. While tariffs have come down and quantita-tive restrictions have been reduced, the duty-drawback scheme, which allowed exporters toimport inputs for export products at duty-free prices,is being dismantled. Other restrictive measures, suchas harbor fees, have been dropped as well.
Development Financing and ForeignDirect Investment
Until the second half of the 1980s, Taiwan had aneven higher investment ratio than Korea. Grossinvestment averaged 28.4 percent of GNP between1965 and 1980, compared with Korea’s 26.5 percent.And in contrast to Korea, Taiwan’s investment hasbeen financed with domestic savings. Between 1965and 1980, the share of domestic savings in GNP was28.7 percent, slightly more than the share ofinvestment. Over the 1980s, the gap between domes-tic savings and investment widened; Taiwan becamea net creditor.
The government controls Taiwan’s formal finan-cial markets. But whereas Korea denationalized thecommercial banks between 1980 and 1983, theyremain largely government-owned in Taiwan.l00
The government closely regulates lending and
borrowing, and appoints senior staff. The banks, inturn, have historically dominated the financial sys-tem, with nonbank financial institutions accountingfor only 5 percent of the assets of Taiwan’s majorfinancial institutions in 1980.101 The curb market hassupplied some 30 percent of the total volume ofloans processed through the financial system overthe 1970s, at rates 50 to 100 percent higher than bankloan rates.102 Taiwan’s firms depend on credit morethan equity for financing. The ratio of corporatesector debt to equity was between 160 to 180 percentbetween 1971 and 1980, less than Korea’s but in thesame order of magnitude.
With companies dependent on bank loans andgovernment controlling the banks, the governmentcoordinated industrial investment by means of creditallocation. In the 1960s, the Ministry of Financegave each bank lists of 6 to 12 industries for priorityattention. During the 1970s, the banks themselvesparticipated in drawing up the lists. The banks havetaken pride in achieving compliance with the lists.103
Nevertheless, the government has relied on dis-cretionary credit allocation less than the KoreanGovernment, the difference perhaps reflecting Tai-wan’s greater use of public enterprises. Since themid-1970s, government direction of commercialbanks’ credit allocation has declined. The govern-ment instead has relied more heavily on specialindustrial policy banks, notably the Bank of Com-munications.
The Bank of Communications was the lead bankfor infrastructure financing until 1979, when it wasdesignated a development bank. Its functions wereto extend confessional loans and credit guarantees tocapital-intensive industries, take equity positions innew firms in high-technology industries, and advisecustomers on how to improve management andinnovation. Following a 1982 ruling, 40 percent ofnew deposits in the postal savings scheme are to beredeposited with the Bank of Communications, thusopening a major new source of funds.
Foreign direct investment accounted for only 8percent of total investment in manufacturing duringthe 1970s. In electronics and machinery during the1970s, foreign direct investment accounted forroughly 50 percent and 25 percent of investment,respectively. But over the 1970s and 1980s, theTaiwanese Government imposed export require-ments and/or domestic content requirements onmost foreign investors. Local content requirements

324 ● Competing Economies: America, Europe, and the Pacific Rim
have helped build linkages between foreign ownedand domestically’ owned plants, and have aidedtechnology transfer as Taiwanese employees offoreign firms move to locally owned firms or starttheir own companies.
As for outward investment, prior to the mid-1980sthe government carefully screened such investmentfor its consistency with national development objec-tives. Since the mid-1980s, however, under thepressure of huge foreign exchange reserves andrising domestic wages, restraints have been cutsharply. Outflow has begun to cheaper labor sites,such as Thailand and the Chinese mainland, whileoutflow to North America continues.l04
Technology Policies
The Government of Taiwan has taken a directresponsibility for accelerating technology develop-ment and application in industry.105 Instead of onepreeminent coordinator, such as Korea’s MOST, thisfunction is dispersed among artly competing agen-cies in Taiwan. This may reflect the problems posedto technology policy by the country’s decentralizedindustrial structure and the preponderance of smallfirms in the economy.
The nearest counterpart to Korea’s MOST is theNational Science Council, which reports directly tothe cabinet (Executive Yuan) but does not haveministerial status. It publishes a series of NationalScience and Technology Development Plans. Itstasks include guiding, coordinating, and evaluatingall government R&D efforts, including specificresearch projects and manpower development. In-side the government, the National Science Council
is not preeminent in matters of science and technol-ogy, however; several other organizations vie forinfluence over science and technology policy, in-cluding the Council for Economic Planning andDevelopment, the Industrial Development Bureau ofthe Ministry of Economic Affairs, and the IndustrialTechnology Research Institute (ITRI). Establishedin 1973, ITRI is divided into six institutes, one eachfor electronics, machinery, chemical engineering,energy and mining, industrial materials, and stand-ards and measurement. By 1990, ITRI had a budgetof $270 million and a staff of over 5,000. ITRI isconcerned only with civilian technologies; anotheragency with a much bigger staff covers militarytechnologies. (See also table 7-11 summarizing thefour largest Taiwanese Government research insti-tutes.)
The single most influential body on technologypolicy as a whole is probably the Science andTechnology Advisory Group (STAG). With only asmall administrative budget, it was until recentlyheaded by K. T. Li, a man of immense personalinfluence resulting from several decades of experi-ence in government. As Minister Without Portfoliowith special responsibility for science and technol-ogy, he created STAG in 1979 to coordinate thevarious science and technology initiatives under-taken by these other organizations.
106 Backed by asmall secretariat, he worked with a council of about10 foreign advisors, all of them experts in some areaof science and technology and all experienced inbusiness or administration. Almost all were Ameri-can citizens. STAG assesses the relevance of worldtechnology developments for Taiwan and evaluatesproposals for technology initiatives from Taiwan.
Table 7-n-Taiwan: Major Government Research Institutes in 1990a
ExpenditureName Research fields ($millions) Staff
Industrial Technology Research Institute Electronics, machinery, $270 5,087Chemical engineering, stand-ards & measures, industrialmaterials, energy & mining,
Institute for Information Industry Software technology, products, $50 730marketing, training
Development Center for Biotechnology Biotechnology, applied ohem- $25 328istry, biochemistry, immunology
Food Industry Research and Food technology, products, $12 302Development Institute processing equipment, training
aSee table 10 for Korean Major Government Research Institutes.
SOURCE: Coordination Council for North American Affairs, Office in U. S.A., Science Division, Republic of China,personal communication, Aug. 12, 1991.

Chapter 7—The New Competitors: Industrial Strategies of Korea and Taiwan ● 325
Taiwan lacks an equivalent of Korea’s high-levelNational Technology Promotion Conference. Korea’s“Long Term Technology Forecast for the Year2000” (1986) resulted from 2 years of discussionsamong some 500 experts in 8 working groups.Taiwan’s National Science and Technology Devel-opment Plan for 1986 to 1995 was preceded by weeklong conferences in 1982 and 1986, and wasattended by some 400 participants, of whom onlyabout 15 percent were from private firms. Moreover,they came as individuals rather than as representa-tives of industrial associations.
The government has long emphasized education.Universal primary enrollment (98 percent) wasachieved in 1970 and secondary enrollment reached80 percent of the age group in 1980. The enrollmentratio is much lower at the tertiary level, only 14percent for men and 12 percent for women in1985.107 Above the junior high school level, institu-tions are divided into those that are academically orvocationally oriented. Since the mid-1960s a dra-matic change in enrollments has occurred in favor ofthe vocational. Forty percent of secondary schoolenrollments were vocational in 1963, 66 in 1980,and 69 in 1986. This preponderance in favor ofvocationally oriented institutions is exceptionalcompared to most other countries. At the tertiarylevel, 55 percent of students are in vocationallyoriented colleges, 45 percent in academic universi-ties.108
Taiwan’s junior colleges (ages 18 to 20 or 21)have graduated over 20,000 engineering students ayear through the 1980s, while its universities havegraduated over 10,000 bachelor-level engineers ayear. The figure for bachelor-level engineers is 70percent more than the corresponding per capitafigure for the United States, and is close to Korea’s(per capita).109 The presence of a large stock ofengineers has been important for allowing nationalcontrol over decisions about foreign technologiesand for mastering the use of those technologies.Great care is taken to ensure the practical orientationof engineering training, especially from the voca-tional schools, and each school has arrangementswith local firms to take students as part-time workersthroughout the school year.
These shifts in enrollments reflect demand, thefact that engineers are paid on average 20 percentmore than arts graduates of the same age, and the factthat an engineering qualification is a fast track to
management positions.110 However, these changes
also reflect direct controls. From 1966 onwards, aseries of Manpower Development Plans have guidedTaiwan’s education expansion, and the results havecorresponded closely to targets in terms of expan-sion of different subjects, the balance betweenpublic and private schooling, and overall rates ofexpansion.
Some targets went strongly against social de-mand. For example, the government lowered theallowable rate of expansion of places in tertiaryinstitutions from 5 percent in the Fourth ManpowerDevelopment Plan (1972-1976) to 3 percent in theFifth (1977-198 1). The slowdown was effected bothby spending controls and by reducing the pass ratein the national tertiary level entrance examination.Intended to avoid unemployment among the highlyeducated, the result has been to exacerbate shortagesof scientific and engineering manpower. The con-straint on the expansion of academic secondaryschools and universities also runs against socialdemand, because academic secondary schools arethe principal route to universities and universitydegrees (including engineering) that yield higherrates of return and prestige.
In 1975, there were 2,301 students studyingabroad, most under government auspices. By 1986,this number had risen to 7,016, over 90 percent ofwhom were in the United States. But a majority ofstudents who study abroad do not return to Taiwan.Of the one in five of Taiwan’s graduates inengineering, science, medicine and agriculture whogo abroad for further study, only about 20 percentreturned during 1976 to 1986. In 1983, the govern-ment launched a program to encourage students andothers with technical skills to return. The programincluded keeping in touch with thousands of poten-tial recruits. Many returnees work initially at ITRI.The National Science Council also administers aprogram to bring Taiwanese and other Chineseengineers and scientists in the West to Taiwan forshort assignments. Some 3,200 people came underthis program between 1970 and 1980.
The government has also developed a series oftargeted incentives, including special funds to lendeither for technologically advanced machinery orR&D activities. The most important of these is theStrategic Industry Fund. Established in 1982, it hada capitalization of $500 million by 1983 and couldbe used for:

326 ● Competing Economies: America, Europe, and the Pacific Rim
1.
2.
3.
Purchase of domestically produced machinery,with an interest rate 2 points less than theaverage of the minimum and maximum long-term rates for commercial bank loans (thisaverage was 10 percent in 1983).Purchase of new machinery, from any source,by producers of specified products within the
“strategic’ industries of machinery, automo-bile parts, electrical machinery, and electron-ics and information. The list of eligible prod-ucts contains 135 items. The interest rate is two
points less than the minimum of the long-termrates.Special cases to be decided by the planningagency, especially for the introduction oflabor-saving equipment in any sector. Again,loans are at preferential rates. The existence ofspecial cases indicates that the governmentretains significant discretion to decide what is
strategic.
The pay-back period is a maximum of 8 years,with a 2-year grace period. The collateral is the value
of the machinery itself. Compared with the normal
terms of Taiwan banks, loans from the StrategicIndustry Fund are highly confessional. Other special-purpose funds include the Sine-American Fund forEconomic and Social Development, established in1965, and The Development Fund; both are avail-able for discretionary channeling of funds intotargeted sectors.
The Statute for Encouragement of Investment,first promulgated in 1960 and revised many timessince, gives tax incentives for technological upgrad-ing and R&D activities. It combines two approachesto industrial promotion. One is to make the incen-
tives available to many industries but stipulatestringent performance criteria so that only a fewfirms in each industry will be eligible. The otherapproach is to target the incentives on a narrow range
of ‘‘strategic’ industries, and make them easilyavailable to firms within these industries. Thecompromise in Taiwan is to have a broad range ofindustries eligible, with a high proportion of itemseligible from the strategic industries of machineryand electronics and information, and relatively fewitems eligible from such well-established industriesas textiles.
The incentives include the tax holiday, acceler-ated depreciation, investment tax credit, duty-freeimport of capital goods, and reduced business tax
rate. Several other schemes bolster these incentives.
R&D spending is encouraged by a 20-percent tax
credit for firms with yearly R&D spending above
their maximum in the previous 5 years, provided this
brings their spending above a certain minimum.
Businesses in specified high-technology industries
can defer income taxes and face a maximum income
tax rate of 20 percent of annual taxable income,
provided they also meet the R&D minimum. These
same firms can retain profits of up to two times their
paid-in capital; they are eligible for up to 50-percent
government grants for R&D expenditures, and alsofor government purchase of equity.
Companies in machinery and electronics andinformation are eligible for government cost sharingof up to 50 percent for putting in approved manufac-
turing or financial systems, and, since 1984, for
loans at almost 3 percentage points less than the
average of the minimum and maximum long-term
rates. To encourage technology transfer from abroad,
the government allows technical know-how or
patent rights to be supplied as part of an equity share
(up to 25 percent), and exempts foreign enterprises
from taxes on income gained through furnishing
approved patents.
A particularly innovative scheme for promoting
local R&D was the development of the Hsinchu
Science-based Industry Park in 1980. Modeled on
the Stanford Science Park, it attracts foreign and
domestic high technology firms, mostly in infor-
matics, precision instruments, new materials, and
biotechnology. The object is to lift some of the risks
faced by participating firms, and thereby induce
enough companies to locate there to generate
positive spillovers (“externalities”) among them.
Investors are allowed 5 years of tax holiday within
the first 9 years, a 22-percent ceiling on corporate
income tax, below-market land rents, exemptions for
various import and export fees, and low-cost loans
and government equity of up to 49 percent of total
investment. The companies also benefit from close
proximity to the ITRI institutes. One hundred firms
are now operating in the Park, near its capacity.
Other technology upgrading programs include:
●
●
●
●
an industrial extension service;
intensive quality control efforts;
the fostering of venture capital firms; and
initial steps to increase the protection accorded
to intellectual property rights. lll
Chapter 7—The New Competitors: Industrial Strategies of Korea and Taiwan ● 327
There is talk of making Taiwan the Switzerland ofAsia, with high-quality products from relativelysmall-scale firms.
What are the effects of this system of technologypolicy? Compared to their Korean counterparts,Taiwan’s public research and service organizationsare less closely connected to private firms, whichhave not made nearly as large an investment in their
own R&D facilities. Critics often say that the publiclabs have been unsuccessful in developing new
products, which is attributed to their poor communi-cations with private firms and problems of theincentives in public sector research. But public labs
carry out a major training function and encourage
their younger staff to spin off their own companies
to commercialize new products. This has been a
major incentive for luring back Taiwanese profes-
sionals living abroad. A Taiwanese researcher at
IBM, for example, may be offered the position as
chief of a research team at one of the public labs,
with more responsibility and command over budget
than at IBM, plus the prospect of developing his own
company to bring to market the products developed
in the lab. The popular charge of poor communica-
tions between labs and firms presumably relates to
well-established companies, rather than these
spinoffs. However, this incentive mechanism dis-
rupts the work in publicly funded technology
programs when key staff leave.
Indicators of R&D inputs must be used cau-
tiously, for different countries use different defini-
tions. By official figures, Taiwan spent 1.06 percent
of GNP on nonmilitary R&D in 1985, less than
Korea’s 1.59 percent. About hal f o f Taiwan’s
spending is classed as coming from the public sector,
but when government grants to certain nonprofit
organizations are included, the figure rises to 60
percent. Private domestic and foreign firms account
for the rest. This is perhaps three times more than the
public sector’s share in Korea, attributable to the
presence of larger firms in Korea. In terms of
numbers of researchers per 10,000 people, on ahead
count rather than full-time equivalency basis, Tai-
wan has about 14, compared with Korea’s 11.
Case Study: Automobiles
Taiwan’s automobile industry is far from break-ing into the world market.112 Like Korea, Taiwandesignated the automobile industry as a strategicsector, But in 1988, in contrast to Korea’s output of
over 1 million units, Taiwan produced only 275,725motor vehicles. 113 A case study of the industry
therefore illuminates differences between Korean
and Taiwanese industrial policies and structures.
The Taiwanese Government was more reluctant to
push into heavy, capital-intensive sectors and sup-
port the development of large national champions.
This reticence was partly the result of the inability of
the Taiwanese Government to restrict the entrance of
new producers, policy incoherence derived from
bureaucratic wrangling, and more fragmented business-
government relations than in Korea.
In the absence of larger firms capable of achieving
the required scale economies and with a smaller
domestic market, the prospects for automobile
exports appeared dim. Taiwan thus turned to state-
owned enterprise to promote auto exports. When this
effort failed, they sought an industrial strategy that
relied on trade liberalization, encouragement of
foreign direct investment, and the development of an
export-oriented parts industry. This strategy appears
to be yielding better results.
At the end of the 1960s, the automotive industries
of Taiwan and Korea looked much alike. Starting in
1958 with an assembly plant in cooperation with
Nissan (the joint venture partner in Korea’s first
plant 4 years later), by the late 1960s Taiwan had
four assemblers struggling for a share of less than
20,000 units a year. Each had Japanese participation.
Industry complaints about the inadequacy of Japa-
nese technology transfer were never quite taken to
heart, however, and government promotional meas-
ures were limited to domestic content requirements
and import controls.114 Over the 1970s, Taiwan’s
auto policy drifted. The state’s organizational and
financial capabilities were heavily committed to
other projects aimed at boosting the competitiveness
of existing export sectors. The 1974 oil crisis made
matters worse by dampening expectations about the
industry.
The government split on policy for the automobile
industry. Some officials saw it as a future major
exporter, some accorded it a central role in Taiwan’s
defense strategy, others doubted that domestic
demand could ever be sufficient—given a popula-
tion half the size of Korea’s—to provide the base for
an export drive. The latter group thought the
emphasis should be on development of an automo-
bile parts industry, which might later support
internationally competitive assemblers.

328 . Competing Economies: America, Europe, and the Pacific Rim
Another reason for policy drift was that domestic
car prices above international levels did not harm the
economy’s overall international competitiveness as
high prices on intermediate goods would have. This
predisposed the government to the development of
intermediate inputs. As a result of these drifting
policies, auto production became less efficient. The
government did nothing to stop new entrants, and in
1979 the six assemblers each produced an average of
only 18,000 compacts, sedans, and light trucks. The
resulting rattletraps were sold on the domestic
market only.
In 1978, spurred by news of Korea’s big push into
automobiles, the government announced a proposal
to encourage the establishment of a large-scale
automobile plant with an annual capacity of 200,000
compact cars, mainly for export. The strategy was to
induce a foreign car maker of world standing to enter
a joint venture with a domestic enterprise, and
thereby obtain technology not only for assembling
but also for upgrading the capability of the auto
components suppliers. Only Toyota and Nissan
submitted investment applications.
To underscore that the Big Auto Plant was aimed
at the world rather than the local market, the
Ministry of Economic Affairs stipulated that the
foreign joint venture partner could not hold more
than 45 percent of the equity and would have to
export 50 percent of production. Several months
later, after receiving the Japanese applications, the
government stated its intention to retain control over
the enterprise by announcing that the state-owned
China Steel Corp., rather than any existing auto-
maker, would be the foreign partner’s working
counterpart. Ch ina S t e e l ’ s cha i rman , ZhaoYaodong, was appointed head of a “Big Auto Plant
preparatory committee,” and Taiwan’s automotive
industry association played no role in the formula-
tion of policy. Seven domestic private ths, none in
automobiles, split a 30-percent equity share in the
venture. Other local firms would subcontract to the
plant.
In 1982, Toyota was chosen as joint-venture
partner. In July 1983, however, disagreements emerged
between Toyota and the Ministry of Economic
Affairs (MEA). The government now insisted on a
90-percent local content, and substantial transfer of
production technology, despite Toyota’s protesta-
tions that these should be goals rather than fixed
targets. It planned to prevent Toyota from taking
profits from the venture if it failed to meet a stricttimetable for achieving these conditions. Toyota
argued that the conditions would be impossible to
meet.
A 1984 cabinet reshuffling brought to the fore
officials who had been wary of the Big Auto Plant
plan. Zhao Yaodong was removed as Minister of
Economic Affairs. The new government favored the
development of Taiwan’s auto parts industry into an
integrated production system. K. H. Yu, a powerful
man with easy access to the president, was inclined
to retain domestic industry protection and provide
greater support for private domestic and foreign
firms. The new Minister of Economic Affairs first
announced that the joint venture would remain
contingent on Toyota’s compliance with the condi-
tions already laid down, but then the government
signaled that should the joint venture fail, Taiwan
would proceed with an alternate plan to develop the
parts industry. In September 1984, when no conver-
gence between Toyota and the MEA was evident,
the Toyota-China Steel joint venture was canceled.
Other Japanese automakers showed an interest in
Taiwan. Glad to seize at a second chance, the Taiwan
Government acted to restructure the domestic indus-
try. Chastened by the Big Auto Plant failure, the new
Automobile Industry Development Plan of 1985
reversed several basic policies. It proposed to lower
tariffs and domestic content requirements on fin-
ished cars, limiting import bans to small Japanese
cars and quotas to Korean cars. The new plan
removed the 45-percent foreign equity ceiling,
allowing 100-percent foreign ownership in export-
only car and components production. It imposed
export ratios and technology transfer requirements
case by case. To ease pressure from Washington
over Taiwan’s perennial trade surplus with the
United States, the plan also included gradual tariff
reductions from 65 to 30 percent and the market’s
opening to all car imports by 1993.115 Hence, the
government gave up its earlier emphasis on domes-
tic content and national control in order to maximize
an export orientation. While it favored a consolida-
tion of the industry by means of mergers or exits, it
did not try to force this consolidation.
The domestic assemblers began to show signs of
life. They planned export-oriented expansion, estab-
lished a joint design engineering center to develop
the island’s first domestically designed model, and,
in the case of a joint venture with Ford, announced

Chapter 7—The New Competitors: Industrial Strategies of Korea and Taiwan ● 329
that the Taiwan subsidiary would be integrated intoits global supply network. The firms chose tostrengthen their links with Japanese companies andexplore new relationships with other foreign produc-ers (table 7-12). Honda, Nissan, Mitsubishi, andToyota now have large equity stakes in Taiwanesecompanies. All plan to make Taiwan a major site for
parts and components in the 1990s. Toyota and
Nissan may export compact models, partly in hope
that Taiwan will provide a fast track into the China
market.
Foreign automakers also see a new market in
Taiwan. Rising consumer income and the apprecia-
tion of the New Taiwan dollar since 1985 has
spurred domestic demand for foreign automobiles.
Growth in demand has aided domestic car makers
too, but they face difficulties given the high scale
economies required to be profitable and the currency
appreciation. Foreign-made car sales rose to 136,000
in 1988 (38 percent of the market) from 33,000 (13
percent) in 1986. In May 1989, imports passed local
car sales for the first time.116 With 9 car companies
and their foreign tie-ups saturating a market of 20
million people, a major shake-out should occur in
the next several years.
This case illustrates some of the difficulties in
devising and applying industrial policy. Protection
alone did not foster the development of a competi-
tive industry, and in fact encouraged a proliferation
of inefficient entrants. The state-led joint venture
with a foreign producer also failed, but the reasons
appear to have been political as well as economic;
this strategy attempted to bypass domestic auto-
makers altogether. The current strategy centers on
the use of market liberalization to force a restructur-
ing of the industry through foreign participation,
with the expectation that the parts industry will
provide a number of niches independent of final
assembly. Two things should be noted about this
strategy, however. First, no less than the state-led
strategy, it rests on independence from domestic
producers. Second, it is likely to result in an industry
restructuring that could probably demand further
government intervention.
Case Study: Semiconductors
Electronics became Taiwan’s biggest export cate-gory in 1983, surpassing textiles and apparel. In1988, it accounted for 21.5 percent of exports.117 Theindustry is dominated by foreign fins, mostly from
Table 7-1 2—Taiwan Auto Industry External Sources ofCapital and Technology
Taiwan automaker Foreign tie-ups Nature of linkage
China Auto Corp . . .CitroenMitsubishi
Ford Liu Ho . . . . . . .FordMazda
Kuo Zui . . . . . . . . . . .HinoToyota
Prince Motor . . . . . . .SuzukiSan Yang . . . . . . . . .Honda
San Fu . . . . . . . . . . . .Fuji HeavyIndustry (Subaru)a
RenaultTa Ching . . . . . . . . . .Fuji Heavy
Industry (Subaru)a
Nissan
Yu Tian . . . . . . . . . . .DaihatsuPeugeot
Yue Loong . . . . . . . .Nissan
TechnologyTechnology70% equity-ownershipTechnology
Technology22% equity-ownership
Technology13.5%equity-ownershipTechnology
Technology
Technology
TechnologyTechnology
25%. equityTechnology
aln late IggCI, Nissan acquired a substantial share of Subaru from FujiHeavy Industries.
SOURCE: Jonathan Moore, “TrafficJam,” FarEastern Economic Review,June 21,1990, pp. 76-78; Walter Arnold, “Bureaucratic Politics,State Capacity, and Taiwan’s Automobile Industrial Policy,”Modem China, vol. 15, No. 2, April 1989, p. 209.
the United States, which account for more than
two-thirds of production. About two-thirds of total
production is exported, primarily to the United
States. Over a quarter of electronics imports come
from the United States, and over half come from
Japan. 118 In consumer electronics, Taiwan’s domes-
tically owned firms adopted the strategy of moving
into the price-sensitive low end of the consumer
market left behind as the Japanese moved into more
highly differentiated consumer and industrial elec-
tronics. In component production, Taiwan special-
ized in production of standardized components and
the assembly of semiconductors. Firms began to
differentiate their products and attempted to enter
the more advanced end of the consumer, industrial,
and component markets.
However, the small Taiwanese firms have been
handicapped in reaping economies of scale. The
contrast is with the Korean chaebol, whose size anddiversity gives them advantages in input purchase,international marketing, and the ability to cross-subsidize. Therefore, in Taiwan, the role of thegovernment has been more important in building up
technological mastery of microelectronics. And
whereas the chaebol moved into large volume

330 ● Competing Economies: America, Europe, and the Pacific Rim
production of standardized chips, Taiwan concen-trated on small runs of specialized chips.
The original stage of Taiwan’s involvement insemiconductors was based on offshore assemblyoperations; if anything, Taiwan was even moreliberal in encouraging the entry of these fins. Yetthis strategy was initially motivated by interest inexporting rather than in developing an indigenouselectronics base. The foreign firms constituted arelatively insulated enclave, with many initiallylocated in export-processing zones.
In 1974, Taiwanese Government officials madeserious plans to acquire semiconductor design andproduction capability.119 They established the pub-licly owned Electronic Research and Service Organ-ization (ERSO), under the Industrial TechnologyResearch Institute (ITRI). ERSO was, first, to verifythe possibility of “leapfrogging” directly intointegrated circuit production, bypassing transistorfabrication, and, second, to be a catalyst in securingprivate sector interest. ERSO would then recruit aforeign partner to setup a demonstration plant, withthe aim of transferring the technology to a domesticprivate firm and commercializing it. In 1976, ERSOopened the country’s first model shop for waferfabrication, and a year later it signed a technologytransfer agreement with RCA in integrated circuitdesign. By the second half of 1978, ERSO was inproduction, with competitive costs and acceleratingsales.
The aim of this venture was not simply produc-tion, however, but the development of an indigenoussemiconductor industry through internal technologytransfer, i.e., from ERSO to a local company.Finding no companies to take over the entireoperation, in 1979 the government established ajoint venture with a group of firms called UnitedMicroelectronics Corporation (UMC). UMC was asubsidiary of ERSO, with a 45-percent equity sharesplit among five private local fins. Drawing onRCA ties and ERSO manpower and technicalexpertise, UMC built a state-of-the-art productionfacility in 1982 to fabricate customized chips. UMCmade agreements with three Silicon Valley designfirms owned by Chinese-Americans, which openedbranches in the Hsinchu Science Park. These jointventures soon produced advanced chip designs.
ERSO also introduced critical technologies, suchas mass production capabilities. ERSO established aCommon Design Service Center, which spread
design technology to the private sector and provideconsulting and training in computers and designtools. A number of design houses profited from theeffective subsidy in ERSO’s generous Iicensingagreements.
By the late 1970s, government officials envisagedan integrated information industry linking semicon-ductors, computers, computer software, and tele-communications. An information industry task force,headed by two senior cabinet ministers, was respon-sible directly to the Premier himself, thus indicatingthe high priority attached to the industry. TheInformation Industry Development Plan for 1980 to1989 spelled out a comprehensive approach topromoting the information industry.
Industry leadership came from public researchorganizations and their public enterprise offshoots.ERSO was responsible for guiding the developmentof new core technologies and products, and fortraining microelectronics engineers, some of whomwould then move to private industry. After de-monstrating the capacity for integrated circuit (IC)production, ERSO emphasized capacity in application-specific integrated circuits (ASICs). Design strengthin custom-tailored chips was essential, ERSO ar-gued, both to provide a source of innovation acrossthe information industry, from data processing toconsumer electronics to telecommunications, andalso to differentiate Taiwan from Korea, which wasthen competing against U.S. and Japanese firms inhigh-volume memory chips. As the private sectordeveloped a commercial interest in semiconductors,ERSO altered its role, focusing greater attention onbasic research. In 1989, it established a laboratoryfor developing technology to produce submicronline widths on chips; in 1990, it split its operationsinto two parts, one devoted to further semiconductorresearch, the other emphasizing systems technol-—.ogy.120
By 1986, however, Taiwanese firms still lackedthe capacity to make VLSI chips in commercialquantities. Fearing that the time for collecting highreturns on advanced chip designs would soon runout, UMC and its partners sold the designs to oneKorean and two Japanese companies. This dismayedsenior government policymakers, concerned that thelack of a domestic integrated circuit industry couldhamper their efforts in linked industries. The gov-ernment thus redoubled its efforts to find a multina-

Chapter 7—The New Competitors: Industrial Strategies of Korea and Taiwan ● 331
tional company able to fabricate VLSI chips inTaiwan.
Philips, a Dutch company with many long-established factories in Taiwan, agreed to start afoundry in late 1986.121 The project was a jointventure of the government (48.3 percent), Philips(27.5 percent), and several domestic private firms.The government contributed almost half the $153million startup cost. The new company, TaiwanSemiconductor Manufacturing Corp., makes chipsto order rather than designing and marketing its own,reducing the risk that it will steal proprietaryknowledge.
The company claimed that its technology as ofmid-1988 was only 9 months behind that of themajor U.S. firms like Texas Instruments and Intel,whom it includes among its nine big U.S. customers.By mid-1988, it was making 10,000 6-inch wafers amonth. U.S. industry analysts consider it state-of-the-art, and its cost per wafer is estimated to be belowthat of the best U.S. merchant facilities. A second$220 million plant was scheduled for completion in1991, with a capacity of 30,000 6-inch wafers amonth and capable of 1 micron line widths.
But government leadership was not the wholestory. In 1988, the country saw the emergence of thefrost chip makers not funded by the government:Hualon, Winbond, and Advanced Microelectronic.122
Hualon and Winbond invested $360 million to buildtwo state-of-the-art fabrication facilities for DRAMs
and ASICs. Market imperatives drove the larger
Taiwanese end-users to form alliances in order t oguarantee needed output. In 1989, Texas Instru-ments announced a $250 million joint venture tomake advanced semiconductors, providing its part-ner, the Taiwanese computer company Acer, with anassured supply of chips. During the 1988 shortage ofone megabit memory chips, Acer was unable to meetdemand for its computers because of the scarcity ofchips, while several of its competitors were lessaffected because they made their own chips. Thenew plant came on stream in mid-1991, and makes4 megabit DRAMs.123
In addition to the chip foundries and the TexasInstruments-Acer joint venture, Taiwan’s smallersemiconductor firms design and produce largequantities of “yeoman” chips, of good quality, lowprice, and fast delivery, for consumer electronicsproducts. The island has the biggest pool of chipdesign talent in Asia outside of Japan. Many of the
design houses are staffed by ERSO-trained engi-neers.
The proliferation of smaller firms is visible inrelated segments of the electronics industry, includ-ing personal computers, peripherals and add-ens,accounting for nearly 7 percent of Taiwan’s exportsin 1987, up from near zero in 1980.124 125 Taiwan hasover 100 computer manufacturers, compared tofewer than 60 in Korea. They do everything fromclone-making to add-on graphics and communica-tion cards, Chinese-character computer systems,software packages, and the development of systemsintegration through multi-user workstations. Theimitation lag between introduction of a new personalcomputer product in the United States and the launchof a machine with similar functions by Taiwan’scomputer makers is down to 6 to 9 months,sometimes less.126
Acer, the leading firm, had 4,800 employees as of1987, 15 percent of them in R&D. In that year itspent $10 million, 3 percent of revenue, on R&D.127
It ships just over 3 percent of the world’s IBM-compatible personal computers, while its share ofthe more powerful machines based on Intel’s 386microprocessor is around 6 percent.128 Its clone ofIBM’s PS/2 30 model appeared in mid-1988, fol-lowed in early 1989 with two more products basedon models at the PS/2 range but with superiorperformance characteristics. For the latter espe-cially, a reputation for product reliability is crucialfor market success, because a malfunction in oneunit can put a whole network of users out of action.Acer and Mitac, Taiwan’s second main firm, took alicense under IBM’s personal computer patents on arunning royalties basis. IBM also obtained a sub-stantial up-front fee plus the right to license Acer andMitac patents on the same basis.
ERSO continues to take a leading role in comput-ers. For example, it has provided the domesticmakers with an IBM compatible basic input-outputsystem to strengthen their hand in warding off IBMlawsuits. Over the first half of the 1980s, it dedicatedmajor research projects to some 20 informationproducts, including a microcomputer local areanetwork system, a dot-matrix printer, and a 32-bitmicroprocessor. With the Industrial DevelopmentBureau, it identifies firms to commercialize theproducts once it has mastered the technology. In1987, ERSO had a staff of 1,700 and a budget of justunder $100 million.129

332 ● Competing Economies: America, Europe, and the Pacific Rim
In the software industry the state has a largepresence through both ERSO and the publiclyowned Information Industry Institute (III). The IIIhas evolved into a profit-making public enterprise,taking up nearly every major software project in thepublic sector instead of channeling demand to theprivate sector. Its competence is signaled by agree-ments with top U.S. computer firms to help commer-cialize in-house products for the Asian market. Twoexamples are a Chinese input-output system devel-oped by III and licensed to IBM, and a joint venturewith Hewlett Packard to develop software for theAsian market.130 Much of the other commercializa-tion sponsored by the institute has been undertakenby its own subsidiary.
In contrast to the automobile sector, Taiwan hasa successful industrial policy in semiconductors andelectronics that exploits its strength in low-costengineering capabilities.131 Initially, the govern-ment led production, and used its facilities to trainpersonnel and transfer technology. ERSO thenentered into joint ventures with local and foreignpartners to develop key segments of the industry,still using it facilities for internal technology transferwith the goal of close integration among thedifferent industry components. More recently, ERSOhas concentrated its efforts in new products andmore basic research. The policy aim was to move theindustry towards higher technology products and toreduce dependence on foreign sources for keycomponents and raw materials.
KOREA AND TAIWAN:SIMILARITIES AND
DIFFERENCESMany of the similarities between Korean and
Taiwanese industrial policies are striking, but thedifferences are also significant, showing that there ismore than one viable approach to industrial promo-tion.
Korean and Taiwanese Government leaders sharea presumption that the state should promote indus-trial development and national prosperity. Bothcountries have been committed to the developmentof a strong private sector and have used an array ofpolicy tools, including protection and financialincentives, to promote that goal.
Both countries issue detailed plans and quantita-tive targets for investment and output for particular
industries. Yet this East Asian planning style hastied itself closely to world markets; in this, it isfundamentally different from the import-substitut-ing strategy pursued by most Latin Americancountries and India, or the centralized planning ofthe Eastern European countries. The two countries’emphasis on exports forces firms to operate inenvironments outside government control, and actsas a check on policy.
Korea and Taiwan see no inconsistency in makinga commitment both to markets and to State assist-ance to industry. The State helps companies becomemore competitive internationally, not only by infra-structure investment and macroeconomic stability,but also by intervention at sectoral and even firmlevels. One of the driving themes of this interventionhas been to reduce the vulnerability of their indus-trial sectors to cut-offs from foreign, especiallyJapanese, suppliers. Recent efforts in semiconduc-tors were motivated partly by this concern, as wereearlier investments in industries such as steel andpetrochemicals.
Finally, both governments share a commitment tolong-term planning. This planning does not meandetailed quantitative targets for investment andoutput for particular industries. Rather, it meansbroad visions of the directions that economic growthought to take and the specific industries that oughtto be encouraged. It is striking that the currentsuccesses in semiconductors and computers, forexample, are the fruits of government promotionalprograms begun in the early to mid- 1970s.
Korea and Taiwan are also distinct from eachother in important ways. The Korean Governmentencouraged the growth of large private business .
groups to spearhead Korean industrialization. Par-
ticularly in the late 1970s, during the heavy and
chemical industry push, it guided their investmentsby means of subsidized credit through the state-owned banking system, controlling their access toforeign exchange, protecting the domestic market,
and offering investment tax incentives. This systemwas cemented by a strong government ‘ ‘persua-sion” and durable social ties between business andgovernment leaders. As the business groups havebecome more central in the economy, the govern-ment has constructed elaborate consultative mecha-nisms through which policy formation occurs.
Korea discouraged direct foreign investment ex-cept in electronics. Most technology came through

Chapter 7—The New Competitors: Industrial Strategies of Korea and Taiwan ● 333
either licensing or more informal means of transfer—e.g., returning students. Public R&D organizationscontributed to the build-up of an indigenous R&Dcapability, but over the 1980s private fins, encour-aged by the government, established their own R&Dfacilities.
This pattern of industrial policy accounts for bothstrengths and weaknesses of Korea’s industrialdevelopment strategy. The development of largenational champions has made the country particu-larly strong in the development of large-scale andcapital-intensive production; this is reflected in thecountry’s success in autos and DRAMs. Korea’sweaknesses have been in flexibility and design. Thepolicy challenge for the future, therefore, will lie inbuilding a more flexible industrial structure, proba-bly through the promotion of small and medium-sized firms.
The Taiwanese Government, on the other hand,has not encouraged the growth of large businessgroups. It has relied on public enterprises, oftenallied with multinational companies, to undertakebig pushes into new fields. The efficiency of theseinvestments is due to the unique nature of thepolitical system; in contrast to other developingcountries, state-owned enterprises have not enjoyedeasy or unlimited access to public finance. As thesemiconductor case shows, public enterpriseschange the distribution of profit opportunities in thedownstream sectors and induce new patterns ofinvestment. Taiwan also relies on public R&Dorganizations, partly because of the inability ofsmall firms to sustain their own R&D.
Consultative mechanisms of the Korean type arelacking, however. Relations between the govern-ment and private firms are characterized by distanceand even a certain degree of mutual suspicion,perhaps reflecting the ethnic split between mainlan-ders, who until recently have dominated top posi-tions in the ruling KMT, and native Taiwanese. Thisdistance was visible in the failed effort to center anauto strategy on a state-owned enterprise and thesubsequent government liberalization of the domes-tic market; the contrast with Korea in this regard isstriking.
The government has made it easy to start abusiness or enter a new industry and has been morewelcoming of direct foreign investment than Korea.Foreign investment is, however, under export and/ordomestic content requirements to check its domina-
tion of the domestic market and increase its links todomestic industries. Arms-length incentives and theease of doing business have encouraged a dynamicsmall and medium-sized industry sector, not only inlight, labor-intensive manufacturing, but also indynamic, high-technology segments; this can beseen in the semiconductor case.
This combination of strategy and structure ex-plains Taiwan’s pattern of competitiveness. Lessable to rely on direct government support andprotection than Korean fins, and unable to financeoperations of similar scale, Taiwanese firms aremore likely to adopt a niche strategy, relying onindigenous design capability and flexibility to entermore specialized product lines. This shows in boththe development of the custom and semi-custom endof the semiconductor market and in the rapiddevelopment of the automobile parts industry.
The differences in strategy between Korea andTaiwan also reflect the difference in industry struc-ture. A strategy of targeting resources at a few largefirms could be viable, although we have seen thatthis strategy also had some important costs. WithTaiwan’s many small and medium-sized firms, itsstrategy of creating opportunities for downstreamentry through publicly owned upstream industriesseems appropriate.
Differences in industry structure were partly theresult of government policy. Taiwan’s politicalleaders and senior officials were steeped in anofficial ideology that had strong socialist compo-nents. The native Taiwanese, who had been ruled bythe Japanese for 50 years up to 1945, were in a fourto one majority and played a large role in thedevelopment of the private sector; they regarded theKMT Government as something of an alien force.Hence both sides, government and business, tendedto view each other with suspicion. In Korea, bycontrast, technocrats and political leaders shared astrong nationalism. Indeed, the sense of woundedpride induced by Korea’s 45 years of Japanese rulein a previously unified kingdom with unchangedboundaries for 1,000 years helped to foster thenotion of the South Korean people as a single teamagainst the rest of the world. The perception of anunderlying fusion of interests helped sustain arelatively well-developed policy network betweenthe economic bureaucracy and private companies.Through these relations of reciprocity, the businessgroups emerged as Korea’s national champions.

334 ● Competing Economies: America, Europe, and the Pacific Rim
Korea’s strategy is much closer to the Japanesethan is the Taiwanese. Korea’s chaebol were builtwith the Japanese keiretsu as the prototype, althoughthe chaebol were barred from owning banks. Korea’sindustrial structure resembles Japan’s more thandoes Taiwan’s. The government’s instruments ofindustrial steerage were similar too, particularly theuse of selective credit, protection, foreign directinvestment controls, and export promotion. ButJapan relied on public ownership less than Korea.
Industrial policy in the two countries now facestwo major challenges. The first is political liberaliza-tion. In the past, strategy in both countries has beenformulated with little input from interest groupsother than business, and in Taiwan, even businessinput was limited. Democratization will now openup new channels for a host of other actors, includinglabor and the legislature. This will put new pressureon the coherence of industrial policy initiatives.
The second challenge is economic liberalization.In response to past failures, external pressures, andthe need to be closely integrated with rapidlychanging technology markets, both countries havebegun to open their markets to foreign competitionand reduced the government’s directive role. As wehave argued, however, this is not likely to mean arepositioning of the government’s role rather than itsdemise, with greater attention focused on technol-ogy policy and collaborative ventures with theprivate sector.
1 U.S. Department of Commerce, International Trade Adrnuus“ “ tra-tioIL Office of Trade and Investment Analysis, U.S. Foreign TradeHighlights, July 1989, table V1OB, pp. 126-128.
2 World Br@ World Development Report 1988 (New York, NY:Oxford University Press, 1988); Council for Economic Planning andDevelopmen~ Taiwan Statistical Data Book 1987 (Taipei Taiwan:Executive Yuaq 1987); United Nations Statistical Offlce, Departmentof Economic Affairs, Commodity Trade Statistics (New York, NY:United Nations, 1987); U.S. Department of Commerce, InternationalTrade Administration ibid.
3 See World Bardq World Development Report 1990 (New YorlqNY: Oxford University Press, 1990), table 1, pp. 178-179.
4 Figures are for 1986, from World Banlq WorZd DevelopmentReport 1988 (New York NY: Oxford University Press, 1988); Councilfor Economicalarming and Developmen~ op. cit. Japan’s share of worldgross domestic product (GDP) is for 1985, horn The World in Figures(&mdon: Hodder and Stoughton, 1987).
5 See, for example, Anne Krueger, The Development of theForeign Sector and Aid (Cambridge, MA: Harvard University Press,1979) and the contributions to WorMDeve/opment vol. 16, No. 1, 1988,a special issue on Korea.
6 See Alice Amsde~ Asia’s Next Giant (New Yorlq NY:Cambridge University Press, 1989).
7 The most coherent statements of the case for selective industrialpolicies are Howard Pack and Larry E. Westphal, “Industrial Strategy
and lkehnological Change: Theory vs. Reality,” Journal of DeveZop-mentEconomics vol. 22, 1986, pp. 87-128; Larry Westph@ “IndustrialPolicy in an Export-Propelled Economy: hssons from South Korea’sExperience,” Journal of Econom”c Perspectives vol. 4, No. 3, summer1990, pp. 41-59.
8 See Paul Krugmaq “Targeted Industrial Policies: Theory andEvidence,’ in Industrial Change and Public Policy (Kansas City:Federal Reserve Bank of Kansas City, 1983).
9 Forareviewofthe debate onJapaneseindustrial policy, see GregNoble, “The Japanese Industrial Policy Debate,” in Stephan Haggardand Chung-in Mooq Pacific Dynandcs: The International Politics ofZndustna2 Change (Boulder, CO: Westview Press, 1989).
10 See Stephan Haggard, Pathways from the Periphery: ThePolitics of Growth in the Newly Industn”alizing Counm”es (Ithaca, NY:Cornell University Press, 1990).
11 lkchnology intensity is based on the ratio of applied R&Dexpenditures as a share of shipments, as calculated by C. Michael Ahoand Howard F. Rosen using data from the mid 1970s. This ratio rangedffom 0.22 for special textile fabrics and related products to 13.4 fortelecommunications apparatus, with an average of 2.19. We divided theindustries into three categories. High-technology products are those thatare above the sample average. Intermediate-technology products haveratios from 1 to 2; low-technology products have ratios below 1. For afull discussion of the methodology, see Aho and Rose% Department ofLabor, Bureau of International Labor Affairs, Trends in Technology-Intensive Trade, Economic Discussion Paper 9, October 1980.
12 See H. Doq B. H. Gunasekeq “Intraindustry SpeeializationinProduction and Trade in Newly Industrializing Countries: A ConceptualFramework and Some Empirical Evidence from East Asi&” WorldDevelopment vol. 17, no. 8, 1989, pp. 1279-1287.
13 Shujim Ura@ “The Rapid Globrdisation of Japanese Firms inthe 1980s: An Analysis of Activities of Japanese Firms in Asia,” paperprepared for OECD Meeting of Experts on Globalisation and Regional-isation of the World Economy, June 20-21, 1990. The following data onthe export behavior of Japanese fiis is also from Urata.
14 Jonathan Moore, “The Upstart Taipam,” Far Eastern Eco-nonu”c ReviewVol. 148, No. 16, Apr. 19, 1990, p. 84.
15 Danny Leipziger, Korea: Managing the Industrial Transition,vol. 1 (Washington DC: World BanlG 1986), p. 106.
16 l%emajor study of Korca’srecent exchange rate policy is BelaBalassa and John Williamson Adjusting to Success: Balance ofPayments Policy in the East Asian NICS, 2d ed. (Washington DC:Institute for International Economics, April 1990).
17 Bank of Korq “Balance of Payments, Foreign Trade andForeign Exchange,” Ecorwnu”c Statistics Yearbook 1987 (Seoul, Korea:Bank of Kore& 1987); and Bank of Korea, “Summary of ExpOltS andImports,” Econow”c Statitistics Yearbook 1982 (See@ Korea: Bank ofKore% 1982).
18 Leipziger, op. cit., vol. 1, op. cit.
19 Richard Luedde-Neura@Import Controls andExport On”entedDevelopment: A Reassessment of the South Korean Case (Boulder, CO:Westview Press, 1986).
20 The following data is reported in “Trade Liberalization”chapter three in Leipziger, op. cit., vol. 1. See also LueddeNeuratiibid.; Robert Wade, “The Rise of East Asian Trading Nations-HowThey Managed Their Trade” (mhneo, World Bank Trade PolicyDivisiow Country Economics Department, 1988); and Robert Wade,Governing the Market: Econonu”c Theo~ and the Role of Governmentin EastAsianlndusm”aZization (Lmvrenceville, NJ: Princeton UniversityPress, 1990).
21 The low e&iruate comes from Larry Westphal and K. S. K@“Industrial Policy and Developmen~” World Bank Staff WorkingPaper No. 263 (Washington DC: World Bank, 1977). The high estimatecomes from K. S. K@ “Long-term Variation of Nominal and Effective

Chapter 7—The New Competitors: Industrial Strategies of Korea and Taiwan .335
Rates of Protection” (Seoul: Korea Development Institute, 1982). Onthe question of possible calculation.al bias, see Robert Wade, Governingthe Market, ibid., Chapter lkn.
22 Young Soogil, “Trade Policy Reform in Korea: Backgroundand Prospect,” mimeo (Seoul Korea Development Institute, 1984).
23 Young Soogil and Yoo Jungho, “The Basic Role of IndustrialPolicy and a Reform Proposal for the Protection Regime in Korea,”(Seoul: Korea Development Institute, 1982).
24 See Balassa and WiWarnsoU op. cit., p. 46.
25 Office of the United States Trade Representative, NationalTrade Estimate Report on Foreign Trade Barriers (Washington DC:Office of the U. S.TR., 1989), p. 115; and ibid., 1986, p. 165.
26 Leipziger, op. cit., vol. 1, p. 65.
27 Ibid., p. 65.
28 See Luedde-Neura@ op. cit.
29 Since 1975 the tariff has had to be paid and then claimed backagainst evidence of quantities used for exports.
30 See Luedde-Neurath, and Yung Whee Rhee, ‘A Framework forExport Policy and A&mm“ “stration: The East Asian Experience,” WorldBank Industry and Finance Series No. 10 (Washington DC: WorldBardG no date).
31 Leroy Jones and 11 SaKong, Government, Business, andEntrepreneurship in Econonu”cDevelopment: The Korean Case (Cambr-idge, MA: Harvard University Press for Harvard University Council onEast Asian Studies, 1980); David C. Cole and Yung CM ParlqFinancialDevelopment in Korea, 1945-1978 (Cambridge, MA: HarvardUniversity Press for Hruvard University Council on East Asian Studies,1983).
32 Leipziger, vol. 1, p. 75.
33 Robert Wade, “The Rise of East Asian Trading Nations,” op.cit.
34 Yung Whee Rhee, Bruce Ross-Larsou and Garry Pursell,Korea’s Competitive Edge: Managing the Entry into World Markets(Baltimore, MD: Johns Hopkins University Press for the World Bar.dq1984), table B-8.
35 Ibid., p. 16.
36 Jones and SaKong, op. cit.; R. Wade, Irrigation and Agricul-tuu;18PfZiiies in South Korea (Boulder, CO: Westview Press, 1982), pp.
9.
37 Phone interview with Hee-Boum Lee, Korean Science Attache,Aug. 2, 1989.
38 Jones and SaKong, op. cit.
39 Tibor Scitovskygivesthehighestimate in’’ EconomicDevelop-ment in Taiwan and Soutb Korea,” Food Research Institute Studies vol.19, No. 3,1985, p. 253; Korea Exchange Bar& MonthZy Review vol. 16,No. 7, July 1982, gives “miscellaneous” loans (which include curbmarket loans) as 17 percent in 1979, 23 percent in 1980, and 8 percentin 1981. See also Cole and Park op. cit., chapter 4; and Robert Wade,“East Asian Financial Systems as a Challenge to Economics: Issonsfrom TaiwQ” California Management Review, vol. 27, No. 4, summer1985, pp. 106-127.
40 Scitovs@, ibid. The Korean figure is probably biased upwardsby inflation and by certain features of the rules of accounting fordepreciation. One estimate of the “real” Korean figure puts it at morelike 160 to 180. See World B@ Korea’s Development in a GlobalContext (Washington, DC: World Banlq 1984), p. 238, note 8.
41 Thomas G. Parry, “The Role of Foreign Capital in East AsianIndustridizatio~ Growth and Development” in Helen Hughes (cd.),Achieving Industn”alization in East Asia (New Yorlq NY: CambridgeUniversity Press, 1988). Parry shows that capital flow information isstatistically we~ with different statistical organizations such as theOECD and the IMF giving very different figures for the same vmiable.
42 Luedde-Neura@ op. cit.
43 Korean Embassy, Financial Attache, from Ministry of Financeannouncement.
44 Ministry of Science and ‘Ikchnology, Annual Statistics onScience and Technology, Republic of Korea (Seoul: Ministry of Scienceand ~hnology, 1986).
45 R.M. Gadbow and T Richards (eds.), ZntellectuaZ PropertyRights: Global Consensus, Global Competition (Boulder, CO:Westview Press, 1988), p. 298; Far Eastern Economic Review, “Patentdrugs abuse,“FarEasternEconom”cR eview, vol. 140, No. 25, June 30,1988, pp. 48-49. The U.S. Trade Representative announced theformation of a task force to look into Korea’s patent syste~ explaining,“I am concerned that there is a lack of patent enforcement in Korea,”International Trade Reporter, June 15, 1988, p. 883.
46 Ministry of Science and lkchnology, ‘Umg-term Science andlkchnology Forecast for the Year 2000,’ in Korean (Seoul: Ministry ofScience and ‘Ikchuology, 1986).
47 Yong-chanPark, “TheNationalSystem of Innovation inKo~with an Introduction to the Semiconductor Industry,” (University ofSusseL MSC thesis, 1987).
48 Phone interview with Hee-Boum Lee, Science Attache KoreanEmbassy, interview with OTA staff, Aug. 2, 1989.
49 UNESCO, Statistical Yearbook (Paris: 1988), pp. 3-325. Seealso Ministry of Educatio~ Statistical Yearbook of Education (Seoul:1985).
50 Ministry of Science and lkchnology, Introduction to Scienceand Technology (Seoul: 1986).
51 Yung-chan Park op. cit.
52 Ministry of Science and lkchnology, Annual Statistics onScience and Technology, op. cit.
53 Ministry of Science and ‘lkchnology, Introduction to Scienceand Technology, op. cit.
54 Ibid.
55 Korea Industrial Research Institute, Industrz”al TechnologyWhite Paper, 1986, in Korew cited in Yong-chan Park, “The NationalSystem of hmovatio~” op. cit.
56 Leipziger, op. cit., vol. 2, pp. 33-36.
57 beByung-Jong, “HomewardBound,’ ’BusinessKorea,F ebru-my 1989, p. 34.
58 Mark Clifford, “The Engine Is Straining,” Far EasternEconom”c Review, Jan. 18, 1990, p. 35.
59 Ibid., p. 36.
60 Nam Choong Woo, director of the Korean Ministry of Tradeand Industry’s transportation-machine~ division claimed that thoughthe official rate is 90 percent localization, the real rate is closer to 50percent. The gap is ascribed to skew in the measurement of localizationsuccess. Mark Clifford, “The Engine Is Straining,” op. cit., p. 38.
6 1 Chll Yun-han, “Authoritarian Regimes Under Stress: ThePolitical Economy of Adjustment in the East Asian NICS,’ (Universityof Minnesota, PhD. thesis, 1987), p. 205.
62 Automotive News, Feb. 22, 1988.
63 Mark Clifford, “Local Anesthetic,” Far Eastern EconomicReview, vol. 45, No, 33, Aug. 17, 1989, p. 63.
64 “Ssang Yong Motors Takes on (Korea’s) Big Three,” BusinessAsia, Sept. 18, 1989, p. 308.
65 Ibid., p. 309.
66 Sohn Jie-Ae, ‘TxXting It All Ride on the Automobile,”Business Korea, July 1990, pp. 25-27; Clifford, “The Engine IsStraining,” op. cit., p. 36.
67 Clifford, “The Engine Is Strain@,” op. cit., p. 35.

336 . Competing Economies: America, Europe, and the Pacific Rim
68 Clifford, “The Engine Is Strain@,” op. cit.
69 Sohn Jie-Ae, op. cit., p. 28.
70 “SsangYong Motors Takes On (Korea’s) Big Three,” op. cit.,p. 309.
71 Sohu Jie-Ae, op. cit., p. 28.
72 Clifford, “JmcalAnesthetic,” op. cit., p. 63.
73 Ron McMil@ “Still Stuck in Neutral.. .,” Asian Business,July 1988, pp. 59-60.
74 Therefore, it is not clear tbat the plan was not rejected simplyto preserve the economic rents gained by KAMA members fromrestricted entry. Grego~ Noble (in a 1988 Harvard dissertation“Between Competition and Cooperation: Collective Action in theIndustrial Policy of Japan and Taiwu”) has shown how dominantproducers in Japan’s steel minimdl industry were able to persuadegovernment to shutdown (unsuccessfully, as it turned out) “maverick”mills.
75 “South Korea Rejects Samsung‘s Plan To Make Large Truckswith Nisssuq” Asian Wall Street Journal, Aug. 17-18, 1990, p. 3.
76 Electronics Industries Association of Korea, Electronic Zndus-try of Korea 1989, table 2B.
77 For an overview of the industry, see Byung-Moon Byun andByung-Hun A@ “Growth of the Korean Semiconductor Industry andIts Competitive Strategy in the World Marke4° Technovation Septem-ber 1989, pp. 635-656; Yong-chan Park op. cit.
78 See bipziger, op. cit., vol. 2; and Selected Topics and CaseStudies (Washington, DC: The World Br@ 1987), pp. 202 ff.
79 Chu Yun-@ op. cit.
80 Anthony Rowley, “The Birth of a Multi-Natio@” FarEastern Econom”c Rew”ew, vol. 120, No. 14, Apr. 7, 1983, p. 56.
81 Fordetailsofthis arrangement seekipziger,op .cit.,vol. 2, pp.203-204.
82 Chu, op. cit.
83 Fora corporate profile, see Electronic Business June 25, 1990,pp. 34-38.
84 Andrew Tanzer, “Korea Chips Away,” Forbes, vol. 135, Feb.25, 1985, p. 44.
85 Electronics Weekly, “Korea Hot on Tails of haders in ChipRace”, June 1, 1988, p. 3.
86 Samsung Semiconductor and lklecommunicatiom Retrospectfor thetist i%n Years of SamSung Semiconductors and Telecommunica-tion, in Koreaq 1987.
87 Electronic Business Feb. 6, 1990, pp. 25-32.
88 Forcorporatepro fdes, seeFar Eastern Economa”cReview, Nov.19,1987, pp. 80-82; Electronic Bu.n”ness Aug. 20,1990, pp. 67-9. On thetie-up with Hitachi, see “Thanks for the Memories,” Far EasternEconomic Review, vol. 145 No. 34, Aug. 24, 1989, pp. 50-51.
89 Ministry of Science and lkchnology, Annual Statistics onScience and Technology, 1986.
90 Byun and A@ op. cit., p. 647.
91 For overviews of Taiwan’s industrial policy, see Robert Wade,Governing the Market, op. cit.; Thomas Gold, The Taiwan Miracle(Armonk, NY: M.E. Sharpe, 1987); Walter Galensou ed. Econonu”cGrowth and Structural Change in Taiwan (Ithaca, NY: CornellUniversity Press, 1979).
92 Council for Economic Planning and Development, TaiwanStatistical Data Book 1988 (’lhipei, ‘Ihiwan: Executive Yuaq 1988).
93 R. Myers, 1986, “The economic development of the Republicof China on TaiwatL 1965-1981”, in L. Lau, op. cit.
94 Directorate-GeneraJ of Budge4 Accounting and Statistics(DGBAS), Republic of U Fourth and Sixth Censuses of Commerce
and Industry.
95 Chi Schive, The Foreign Factor: The Multinational Corpora-tion’s Contribution to the Economic Modernization of the Republic ofChina (Stadord, CA: Hoovtx Institution Press, 1990).
96 Taiwan StatisticalData Book1986, op. cit., table 8-6. ‘lbtaltaxrevenue includes revenue from the wine and tobacco monopoly.
97 ‘l@ C. H. and Wang, W. ‘E, “Trade Liberahza“ tion in theRepublic of China on lltiwan, and the Economic Effects of ‘lMiffReductions”, paper to the Joint Conference on the Industrial Policies ofthe ROC and the RO~ (Seoul: Korea Development Institute, 1988).
98 S. C. Tsiang and Wen Lang Cheq “Developments towardsTrade Libemlization in TaiwarL” paper to the 1984 Joint Conference onthe Industrial Policies of the ROC and the ROK (’Ih@i: Chung-huaInstitute for Economic Research 1985).
99 Board of Foreign Trade, “Tariff Reduction of the Republic ofChina on ‘lMwan”, (Taipei: Ministry of Economic Affairs, 1988);Balassa and WilIiamsorL Mjusting to Success, op. cit., p. 83.
100 Of the 15 commercial banks, 4 are private. But the biggest(International Commercial Bank of China) is only nominally private,having beenprivatized in the wake of UN derecognitionto allow ‘lhiwanto have a bank with overseas branches while avoiding the diplomaticproblems of govemment-owned banks. The other tbree private banks aretiny.
101 Ching-ing Hou Liang and Michael T. Skully, “FinancialInstitutions and Markets in ‘Ihiwan,” in Michael T. Skully, cd.,Financial Institutions and Markets in the Far East (New Yorlq NY: St.Martin’s Press, 1982), p. 174.
102 Sam P. S. Ho, “Small-scale Enterprises in Korea andThiwarL” World Bank Staff Working Paper #384, (Wwd@torL DC:World B@ 1980). The image of a sdeet market is misleading, for mostcurb market credit takes the form of supplier’s credits from big f- tosmall fhms.
103 NicholasRiegg, “TheRole of Fiscal and Monetary Policies inlhiwan’s Economic Development” PhD thesis, University of Connecti-cut 1978; also ‘lMwan’s Bank of Communications, AnnuaZ Report,various years. Riegg, citing a Bank of Thiwan source, says tbat “up to75 percent of loans flowed to the targeted industries” (1978:95). TheBank of Communications reporta comment proudly on the bank’ssuccess in f~cing its designated target industries. The 1973 repofi totake just one example, gives figures to show that over haJf of the bank’stotal loans went to its six target industries.
104 In 1988, for example, Formosa Plastics undertook a $150million expansion at one of its four U.S. petrochemical plants.
105 Itbegantodo soquiteearly. In 1959, atatimewhen76percentof Taiwan’s exports were still agricultural or processed agriculturalproducts (mostly rice and sugar), the government promulgated the“National Guidelines for Long Range Scientific Development” andformed the “Council on Long Range Scientific Development”, sincerenamed the National Science Council.
106 Phone interview with George Li~ North American Coordina-tion Council Science Attache, June 30, 1989.
107 Jennie Hay Woo, “Education and Industrial Growth in‘lhiwan: A Case of PlSnning,” Harvard Institute of InternationalDevelopment EEF?A Discussion Paper #18, 1988.
108 Specifically, theproportion of tertiary students in engineeringexpanded from 24.6 percent in 1955-56 to 30.3 percent in 1975-76 to32.8 percent in 1985-86. Natural sciences and medicine rose from 10.1percent in 1955-56 to 14.6 percent in 1985-86. So as of 1985-86, a littleless than half of Thiwan’s tertiary students were studying engineering,natural sciences or medicine. Hurnam“ties and fine arts fell from 15.8percent in 1955-56 to 9.1 percent in 1985-86. Law fe13 from 6.8 percentto 1.2 percent.
109 Ministry of Science and llxhnology, Science and TechnologyAnnual, 1984, p. 227.

Chapter 7—The New Competitors: Industrial Strategies of Korea and Taiwan ● 337
110 National Youtb Commis sion positioq cited in Woo, “Educa-tion and Industrial Growth in ‘11.tiwm” op. cit., table 8.
111 ‘lMwan has a reputation as a producer of pirated products._ the 1980s, however, the government committed itaelfto incr~the level of intellectual property protection. Since 1985, the governmenthas overhauled its intellectual property laws, creating strong domesticpressure for retrenchment. Partly as a consequence, implementation ofthe new laws has been lax, and pirating activity continues. There is,however, a trend towards tighter enforcement. R.M. Gadbaw and T.Richards (eds.), 1988, Intellectual Property Rights: Global Consensus,Global Conflict? (Boulder, CO: Westview Press), ch. 10.
112 For an overview, see Walter Arnold, “Bureaucratic Politics,State Capacity, and Taiwan’s Automobile Industrial Policy,” ModernChina vol. 15, No. 2, April 1989, pp. 178-214, from which this sectiondraws extensively.
113 Council for Economic Planning and Development, TaiwanStatistical Data Book 1989 (Taipei, Taiwan: Executive Yum 1989), p.94.
114 A 1971 report on the state of the industry characterizedtechnology transferred from several Japanese companies and GeneralMotors as “inadequate,” aud proposed a more purposeful import-substitution role for policy. The government’s response was a higherauto import tariff and a superficial package of fiscal measures aimed atstimulating domestic demand. Walter Arnold, “Bureaucratic Politics,State Capacity, and Taiwan’s Automobile Industrial Policy,” ModernChina vol. 15, No., April 1989, pp. 185-186.
115 “Taiwan’s Auto Industry Faces Hard Times Amid BoomingSales,” Business Asia, Jan. 30, 1989, p. 35.
116 “Foreign Automakers Capitalize on Taiwan’s Relaxed ImportCode,” Business Asia, Sept. 11, 1989, p. 300.
117 Ministry of Economic Affairs, Taiwan Board of ForeignTrade, Foreign Trade Development of the Republic of China, 1989, p.2.
118 “Country report: lliwu” AEU: Journal of the Asia Elec-tronics Union, April and May 1986.
119 Foranoverviewof tbeindustry, see Se-HwaWw “TheCourse
of Taiwan’s Integrated Circuit Industry Development” paper presentedat the conference on lhiwan Enterprises in Global Pempective,Columbia University, New Yorlq NY, Sept. 15, 1990.
120 Far Eastern Econonu”c Retiew Aug. 2, 1990, p. 54.
121 Electronic Business, Jan. 15, 1988, pp. 85-7.
122 Electronic Business, Sept. 4, 1989, p. 79.
123 Bob Johnstone, “Chipping In: ‘lhiwan Computer Firm inTie-up witb US Chipmaker,” Far Eastern Econonu”c Review, May 25,1989, p. 82. No information is given on help tbat Acer may have gottenhorn the ‘Ihiwan Government.
124 Electronics Research and Service Organization% “ROC andROK Comparative Development of the Information Industry” (Taipei,‘Ihiwan: Electronics Research and Service Organization 1987).
125 Note that these exports are quite import intensive; imports ofinputs for personal computer components account for as much as half ofthe value of component exports. Chi Schive, forthcoming, “The nextstage of industrkdization in lhiwan and Ko~” in G. Gereftl and D.W= Manufactured Miracles: Patterns of Indu.rtn”alization in LutinAmerica and East Asia (Lawrenceville, NJ: Princeton University Press).
126 K. T Li, “lkchnology Development and Cooperation amongNICS in the Western Paci.tic,” industry of Free China, vol. 68, No. 3,September 1987, pp. 1-12.
127 IBM official, personal communication, July 1989.
128 Johnstone, “Chipping m“ op. cit., p. 82.
129 Science and lkchnolo~ Advisory Group, personal communica-tion. Eighteen percent of the staff were engaged in administrativesupport.
130 ChuYun-han, “AuthontarianRegimesu nderStress,” op. cit.,p. 2,27.
131 In addition to the efforts of the public research and serviceorganiza tions described above, other forms of state assistance areavailable to makers of electronics products. Tax incentives, loans onconcessionary terms, and other privileges have been targeted onelectronics; protection, however, has not.