Embed Size (px)
Citation preview

Industrial Sectors Market Characterization Chemicals Industry Prepared for Pacific Gas & Electric Company and Southern California Edison Company
Oakland, California, February 2012


Table of Contents
KEMA, Inc. January 2012 i
Acronyms and Abbreviations ........................................................................................................ 1 Summary of Key Research Findings ............................................................................................ 1
Industry Description ............................................................................................................... 1 Business Models and Cost Structure ..................................................................................... 1 Technology and Energy Consumption ................................................................................... 2 Market Barriers and Opportunities for Energy Efficiency ....................................................... 3 Overall Findings ..................................................................................................................... 4
1. Introduction and Summary ..................................................................................................... 6 2. Trends in Industrial Energy Efficiency .................................................................................... 8
2.1 Energy Consumption Trends ........................................................................................ 8 2.2 Economic Downturn Effects on Industrial Production ................................................. 10 2.3 Climate Change and Energy Legislation .................................................................... 11 2.4 National Programs ...................................................................................................... 12 2.5 Rise of Continual Energy Improvement ...................................................................... 14 2.6 Additional States Adopt Industrial Energy Efficiency .................................................. 17
3. Industry Characterization ..................................................................................................... 21 3.1 Industry Definition ....................................................................................................... 21 3.2 Industry Leaders ......................................................................................................... 26
3.2.1 Global Titans ................................................................................................... 27 3.2.2 Domestic Leaders ........................................................................................... 28 3.2.3 Important Local Players .................................................................................. 29
3.3 Competitive Issues ..................................................................................................... 30 3.3.1 Business Models ............................................................................................. 31 3.3.2 Cost Structure ................................................................................................. 33 3.3.3 Technology Development ............................................................................... 34 3.3.4 Supply Chain Management ............................................................................ 36 3.3.5 Product Development and Roll-out ................................................................. 37 3.3.6 Pricing ............................................................................................................. 39
3.4 Economic Factors ....................................................................................................... 40 3.4.1 Business Cycles ............................................................................................. 40 3.4.2 Availability of Capital and Credit ..................................................................... 41
3.5 Regulatory Issues ....................................................................................................... 42 3.5.1 Environmental ................................................................................................. 42
Table of Contents
KEMA, Inc. January 2012 ii
3.5.2 Climate ............................................................................................................ 44 3.5.3 Federal Food, Drug and Cosmetic Act ........................................................... 46
3.6 Industry Network ......................................................................................................... 47 4. Target Technologies / Processes and Energy Efficiency ..................................................... 49
4.1 Energy Use ................................................................................................................. 50 4.2 Energy Consumption by End Use and Energy Efficiency Potential ............................ 55 4.3 Production Processes ................................................................................................. 59
4.3.1 Separations ..................................................................................................... 61 4.3.2 Chemical Synthesis ........................................................................................ 62 4.3.3 Process Heaters ............................................................................................. 63
4.4 Current Practices ........................................................................................................ 64 4.4.1 Efficiency Improvements ................................................................................. 67 4.4.2 Capital Expenditures for Energy Efficiency ..................................................... 72
5. Market Intervention .............................................................................................................. 74 5.1 Effective Utility Programming ..................................................................................... 74 5.2 Drivers of Energy Decision-Making ............................................................................ 74
5.2.1 Energy Efficiency Planning ............................................................................. 75 5.2.2 Investment Priorities ....................................................................................... 77 5.2.3 Project Financing ............................................................................................ 77 5.2.4 Barriers to Energy Efficiency Investment ........................................................ 77
5.3 Cycles of Innovation ................................................................................................... 79 5.4 Customer Assessment ............................................................................................... 80
5.4.1 Utility Program Awareness ............................................................................. 80 5.4.2 Customers’ Experience ................................................................................... 80
6. Next Steps and Recommendations ..................................................................................... 82 6.1 Next Steps—Pharmaceuticals .................................................................................... 83 6.2 Next Steps—Other Chemicals .................................................................................... 84
7. References ........................................................................................................................... 86 A. ATTACHMENTS ................................................................................................................ A-1

Table of Contents
KEMA, Inc. January 2012 iii
List of Figures
Figure 1: Graphic Overview of the Report .................................................................................... 7 Figure 2: U.S. Trends in Industrial Energy Intensity Delivered Energy, 1985-2004 ...................... 9 Figure 3: U.S. Energy-Related CO2 Emissions by End-Use Sector, 1990-2007 ........................ 12 Figure 4: Industrial Technologies Program Funding, 1998-2010 ................................................ 14 Figure 5: Examples of National and Regional Continual Energy Improvement Programs .......... 15 Figure 6: Utility Energy Efficiency Policies and Programs, 2006 vs. 2007+ ................................ 18 Figure 7: CHP as a Percentage of U.S. Annual Electricity Generation ....................................... 20 Figure 8: Chemical Manufacturing Subsector Electricity Purchases from PG&E in 2006 ........... 24 Figure 9: Chemical Manufacturing Subsector Electricity Purchases from SCE in 2008 ............. 25 Figure 10: Chemical Manufacturing Subsector Gas Purchases from PG&E in 2006 ................. 26 Figure 11: Chemical Industry Energy Footprint .......................................................................... 51 Figure 12: Chemical Industry Energy Footprint—Usage in Specific Equipment ......................... 53 Figure 13: Electric Consumption, Chemicals Industry ................................................................ 55 Figure 14: Electric Consumption by End Use, Chemicals Industry ............................................. 56 Figure 15: Electric Energy Efficiency Potential by End-Use ....................................................... 57 Figure 16: Gas Consumption by End-Use .................................................................................. 58 Figure 17: Gas Energy Efficiency Potential ................................................................................ 59 Figure 18: Simplified Chemical Synthesis Diagram .................................................................... 63 Figure 19: Energy Intensity Trends Related to Heat and Power in the U.S. Chemical Industry,
1974–1997 ........................................................................................................................... 65 Figure 20: U.S. Pharmaceutical Industry Electricity Consumption 1987-2002 ........................... 66 Figure 21: U.S. Pharmaceutical Industry Energy Intensity 1987-2002 ....................................... 67

Table of Contents
KEMA, Inc. January 2012 iv
List of Tables
Table 1: Industrial Energy Consumption, California ...................................................................... 9 Table 2: Percent Change in CO2 Emissions among Largest Calif. Industrial Sectors, 2008-2010
............................................................................................................................................. 10 Table 3: 2020 Cumulative Electricity Savings Targets, by State ................................................ 19 Table 4: California Chemical Manufacturing Industry Value and Growth ................................... 22 Table 5: Pharmaceutical Industry Energy Use ............................................................................ 54 Table 6: Chemical Industry Specific Technologies ..................................................................... 60 Table 7: Self-Reported Manufacturer's Ability to Undertake Energy Efficiency Investments,
Using Scale 1–5 ................................................................................................................... 76

KEMA, Inc. January 2012 1
Acronyms and Abbreviations
°C Celsius
°F Fahrenheit
AB 32 Assembly Bill 32 the Global Warming Solutions Act
ACEEE American Council for an Energy Efficient Economy
AMO Advanced Manufacturing Office
ANSI American National Standards Institute
ARB California Air Resources Board
Btu British thermal unit
CAA Clean Air Act
CAV constant air volume
CDER Center for Drug Evaluation and Research
CEI continual energy improvement
CERCLA Comprehensive Environmental Response, Compensation and Liability Act
CHP combined heat and power
CO2 carbon dioxide
CO2e carbon-dioxide equivalent
CWA Clean Water Act
DNA deoxyribonucleic acid
EEPS Energy Efficiency Portfolio Standard
ESA Endangered Species Act
FDA Food and Drug Administration
GHG greenhouse gas
GMP good manufacturing practice
GWh gigawatt-hour(s)
HEPA high-efficiency particulate air
HMO health maintenance organization
HVAC heating, ventilation and air conditioning
IAC Industrial Assessment Center
IOU investor-owned utility
KEMA, Inc. January 2012 2
ISO International Standards Organization
kWh kilowatt-hour
LBNL Lawrence Berkeley National Laboratory
MBtu million British thermal unit
MECS Manufacturing Energy Consumption Survey
MW megawatt
NAICS North American Industry Classification System
O&M operations and maintenance
PCB polychlorinated biphenyl
PG&E Pacific Gas and Electric Company
R&D research and development
RCRA Resource Conservation and Recovery Act
RPS renewable portfolio standard
SCE Southern California Edison Company
SEP superior energy performance
TBtu trillion British thermal unit
tpy tons per year
TSCA Toxic Substances Control Act
U.S. United States
U.S. DOE U.S. Department of Energy
U.S. EPA U.S. Environmental Protection Agency
U.S. FDA U.S. Food and Drug Administration
USGS U.S. Geological Survey
VSD Variable-speed drive

KEMA, Inc. January 2012 1
Summary of Key Research Findings
Industry Description
The chemical industry is based on the transformation of organic and inorganic raw materials by chemical processes to formulate products with wide-ranging uses. In 2008, the industry totaled $46 billion in sales in California alone, for diverse intermediary and final products such as medicines, cleaning agents, perfumes, paints, industrial gases, and fertilizers. The chemical industry in California, with the dominance of pharmaceuticals and industrial gases is very different from the industry in the southeastern United States (U.S.), which focuses on organic chemicals. While each of the subsectors within the North American Industry Classification System (NAICS) code 325, chemical manufacturing industry is unique, the businesses can be broadly categorized into the following three categories:
1. Basic chemicals (or commodity chemicals), which involve the transformation of raw materials, such as minerals, air and/or methane, for further industrial use. Industrial gas companies are among the most significant customers in this category. Some common industrial gases include air, nitrogen, oxygen, hydrogen, and compound gases such as ammonia, hydrogen chloride, and sulfur hexafluoride.
2. Specialty chemicals, which encompass high-value and niche products that are mostly associated with chemical subsectors such as pharmaceuticals, pesticides and fertilizers. Pharmaceuticals is the largest energy consuming industrial subsector in northern California. These products are generally categorized by high research and development (R&D) expenses, as well as use of biotechnology and other types of patented technologies.
3. Consumer products, which include direct product sales of chemicals such as soaps, detergents, paints and coatings. Products are manufactured using a wide range of feedstock, including intermediary chemicals such as chlorine, phosphoric acid, sulfuric acid, nitric acid and epoxy resin.
Business Models and Cost Structure
The business model for the large industry leaders relies on keeping products and production processes simple and focusing on economies-of-scale production, while small specialty producers tend to focus on niche products requiring more complex custom products. The more basic the product, the more sales depend purely on pricing. For instance, commodity products

KEMA, Inc. January 2012 2
compete almost purely on price, with the profitability of individual companies closely tied to efficient operations. For many products, the cost of energy can be 30 percent or more of the total manufacturing cost.
For chemical products which are not commodity products, companies compete to be first in the market and to benefit from patent protection. Patent protection is especially important for the pharmaceutical, pesticide and fertilizer industries. These types of specialty chemicals focus on niche products that rely heavily on large investments in R&D to capture market share through patented products. Not surprisingly, the highest expense for these companies is in product innovation, which includes long lead times and a high degree of risk. Energy costs typically only factor in at about 3 percent of total product cost. The pharmaceutical and pesticide/fertilizer industries are also highly regulated to protect public health and safety.
Consumer products compete on price for general consumables, such as laundry soap and bleach, but also on product differentiation where possible. The type and extent of competition also varies depending on whether the product serves the household or commercial market. Product differentiation and brand loyalty is more important in the household market, whereas competition in the commercial market is based on performance and price.
In general, demand for industrial chemicals is more volatile than for many other manufactured products. Within the chemical industry, however, pharmaceuticals tend to have relatively stable demand and supply patterns due to the nature of products supplied. Overall, the chemicals industry has seen a gradual move towards greater globalization within the industry, with efforts to unify operations globally as free trade expands.
Technology and Energy Consumption
With thousands of processes used to produce the more than 70,000 products of the chemical industry, it is not surprising that manufacturing energy use varies significantly among different segments of the industry. The chemical industry is also increasingly adopting industrial biotechnology because of its many potential technical, economic and environmental advantages. These benefits include the simplification of processes, cost savings, reduced consumption of fossil fuel and energy, potential reduction in the United States import of crude petroleum, development of rural economies, and beneficial environmental effects. Technology development related to innovation of new processes and materials has been most significant for specialty chemical companies.

KEMA, Inc. January 2012 3
Broadly speaking from an energy perspective, the main chemical manufacturing stages involve combining feedstocks to achieve specific chemical reactions, and then separating out the desired product. Large amounts of energy for heating and cooling is used to transform raw materials into usable chemical products. For mature industries such as commodity chemicals, the most significant technological development has been the automation of manufacturing plants and increased utilization of computer systems.
The industry has made significant improvements in energy efficiency, as shown by decreasing fuel consumed per unit of output over the last few decades. Improvements in process and equipment design in the past few decades have also contributed to gains in energy efficiency (e.g., more efficient designs for distillation, absorption, and other separation processes). The increased adoption of energy-efficient practices such as cogeneration and on-site recovery of waste heat and energy, including heat recovery from chemical reactions that release heat, have also helped to reduce overall energy intensity.
Market Barriers and Opportunities for Energy Efficiency
The increasing complexities of environmental compliance, changing product configurations, and growing competition from resource-rich developing countries are all challenges to the industry. These challenges can be met in part through improved efficiency, the use of innovative processing, and decreased dependence on petroleum-based feedstocks. The basic chemicals subsectors operate with very thin margins, and it is expected that they would be motivated to adopt energy efficiency measures that lower operating costs.
Barriers to energy efficiency include limited capital, production priorities, limited staff time, and severe cost effectiveness criteria. In some subsectors, regulatory concerns are a major barrier to making any changes. For example, pharmaceutical industry is regulated by the U.S. Food and Drug Administration (FDA); the production for each process must be validated. Once validated, changes to the process are controlled, discouraging equipment retrofits. The chemicals sector often has proprietary technology and processes, which may limit sharing of energy efficient opportunities.
Energy efficiency potential in this sector begins with optimizing current technologies, equipment and processes and continues with maintenance and upgrade opportunities. Energy management programs can be an effective tool to systematically identify energy performance improvements across large and potentially complex equipment and processes.

KEMA, Inc. January 2012 4
The key energy efficiency opportunities include improvement of compressed air systems through minimizing use and proper maintenance, improving heating and cooling system maintenance, and for pharmaceuticals, optimization of air changes in process areas,. Additionally, process heat improvements through heat recovery and efficient operating practices (e.g., operating equipment at full load or design load capacity) can be a significant opportunity. Since chemical plants are complex and involve proprietary technologies, applicable opportunities will vary from plant to plant.
Knowledge gaps identified in program understanding appear to inhibit broader participation among customers interviewed. Vendors play a big role in dissemination of information and identification of possible projects. However, customers indicated a slight inherent mistrust in vendors’ sales pitches. Utilities have an opportunity to provide a highly technical and trustworthy perspective to customers.
Overall Findings
The following findings regarding improving the adoption of energy efficiency measures in the chemicals industry are based on the primary and secondary research presented in this report.
Management support of energy efficiency is key to achieving significant energy savings. The largest savings accrue to companies with a strong corporate wide energy management program, which is essential for managing energy performance. Management programs can address all aspects of energy savings, capital projects, retrofits, operational optimization, effective measurement of energy use, maintenance practices, and behavioral improvements. For example, Dupont established a 2008 plan targeting a 5 percent annual decrease in energy use. After one year, they generated 338 projects to meet their goal, with 79 percent of the projects requiring little or no spending.1
Industrial chemical plants are highly automated and capital-intensive. Therefore, return on investments need to be relatively high to justify expenditures for large capital improvements. Major efficiency improvements are most cost-effective when industrial facilities are already making a large investment such as a plant upgrade. These industry investments coincide with plant operational cycles. This is especially true in the pharmaceutical industry, where energy
1 Improving Energy Efficiency and Profitability with DuPont. http://www2.dupont.com/DuPont_Sustainable_Solutions/en_US/assets/downloads/DuPont_Energy_Efficiency_Case_Study.PDF

KEMA, Inc. January 2012 5
efficiency must be built into the master specifications of a new plant or in the introduction of a new product line.
Looking forward, significant reductions in energy use may not be based on large technology changes, but rather incremental improvement to existing equipment and technologies. California should look towards developing industrial energy management programs that include company commitments to energy saving targets, energy audits, energy action plans, and implementation of strategies followed by measurement and verification of energy savings achieved. Programs can be designed to meet the needs of a range of customers, engaging the most sophisticated in continual energy improvement (CEI), and the less engaged customers in shorter term energy action plans and end-use measurement to identify opportunities. Utilities should pay close attention to the specialized nature of their service territories, particularly for the highly regulated industry of pharmaceutical manufacturing, to better address the needs of their customers and collaborate towards energy savings.

KEMA, Inc. January 2012 6
1. Introduction and Summary
The industrial sector consumes over 30 percent of the nation’s energy,2 presenting enormous opportunities for energy efficiency.3 Many market forces beyond simple energy cost drive industrial customer decision making. Attaining a better understanding of the customer’s world will assist Pacific Gas and Electric Company (PG&E) and Southern California Edison Company (SCE) in their design and implementation of industrial energy efficiency programs. Following upon a potential study developed in 2009 for PG&E, PG&E and SCE engaged energy-consulting firm KEMA, Inc. for the next phase to prepare market intelligence on seven key energy-intensive sub-segments.
The research objective is give PG&E and SCE staff study results to facilitate improved marketing of energy efficiency products and support face-to-face engagement of customers with those products. To address the objective of this study, the work was organized into key elements. These include:
• Perspectives about broad trends affecting California and the nation’s industrial sectors (section 2)
• Detailed in-depth, industry-specific analysis of business and process drivers developed from secondary research (section 3)
• Energy usage, target technologies and process, and energy efficiency opportunities (section 4)
• Real-time perspectives and intelligence gained from key industry insiders through interviews and Webinar/Forum group discussions (section 5)
• Recommendations (section 6) • Utility-specific appendices containing proprietary data and customer information
(Appendices).
In practice, these report elements are built stepwise—broad national trends inform industry-specific secondary research and industry-specific analysis informs the primary interviews and roundtable discussions. The outcome is a thorough research report intended to provide PG&E 2 Quinn, Jim. 2009. Introduction to the Industrial Technologies Program. Save Energy Now Series Webinar. January 15. http://www1.eere.energy.gov/industry/pdfs/webcast_2009-0115_introtoitp.PDF 3 U.S. Census Bureau, 2008. http://www.census.gov/compendia/statab/2010/tables/10s0892.xls

KEMA, Inc. January 2012 7
and SCE staff members the breadth necessary to position their industrial energy efficiency products optimally and the depth necessary to knowledgeably engage their customers.
Figure 1: Graphic Overview of the Report

KEMA, Inc. January 2012 8
2. Trends in Industrial Energy Efficiency
The industrial sector consumes an immense amount of energy, nearly 32 percent of total U.S. consumption in 2008,4 to produce goods and materials for wholesale and retail sales. In the past three decades, the overall energy efficiency of the industrial sector in the United States has increased dramatically. Energy efficiency potential savings have been estimated at 20 percent or more by 2020, both nationally5 and in California.6 It has thus been an attractive target sector for utilities and government looking to reach new levels of energy savings through efficiency.
Changing energy markets and climate change policies are driving greater interest in energy efficiency technologies. Key trends discussed are energy consumption patterns; effect of the economic downturn on manufacturing; climate change and energy legislation; the rise of continual energy improvement; and energy efficiency adoption outside California and national energy efficiency programs. These trends are discussed in more detail below.
2.1 Energy Consumption Trends
California ranked first in the nation in gross domestic product, at $1891.4 billion in 2009. Table 1 shows the industrial energy consumption. California ranks only third in the nation for energy use, reflecting higher efficiency levels in the industrial sector.7
Figure 2 shows U.S trends in industrial energy intensity over time. This figure shows that there has been a general trend since 1993 toward stable or slightly decreasing energy use, even while the economy prospered. More significantly, the energy intensity, or energy per unit of production, has been steadily increasing. Thus, the industrial sector has shown consistent improvement in reducing the amount of energy required to produce manufactured goods.
4 U.S. Census Bureau, 2008. Energy Consumption, by End-Use Sector. http://www.census.gov/compendia/statab/2010/tables/10s0892.xls 5 McKinsey & Co. 2009. Unlocking Energy Efficiency in the U.S. Economy. July. http://www.mckinsey.com/clientservice/electricpowernaturalgas/downloads/_energy_efficiency_exc_summary.PDF 6 KEMA. 2008. Strategic Industrial Report for PG&E. 7 U.S. Department of Energy, Energy Efficiency and Renewable Energy, State and Regional Partnerships. 2011. http://www1.eere.energy.gov/industry/states/state_activities/map_new.asp?stid=CA

KEMA, Inc. January 2012 9
Table 1: Industrial Energy Consumption, California
Year California Industrial Energy Consumption (Trillion Btu)
2009 1,770 2008 1,955 2007 1,958 2006 1,979 2005 2,001 2004 2,053 2003 1,986 2002 1,999 2001 2,137 2000 2,132
Source: Energy Information Administration8
Figure 2: U.S. Trends in Industrial Energy Intensity Delivered Energy, 1985-2004
Source: National Academy of Sciences9
8 U.S.Department of Energy. 2011. State Energy Consumption Estimates 1960 through 2009. DOE/EIA-0214(2009). June 2011. http://205.254.135.7/state/seds/sep_use/notes/use_print2009.PDF

KEMA, Inc. January 2012 10
2.2 Economic Downturn Effects on Industrial Production
Most U.S. industries experienced a sharp drop in production as demand for manufactured goods declined, starting in the last quarter of 2008. The chemicals industry experienced a reduction in demand for their products during the downturn.10
A method of observing the economic downturn’s effect in California is to consider trends in carbon emissions. Although multiple factors affect emissions, including energy efficiency and carbon reduction, dramatic short-term changes do indicate likely reductions in production. According to analysis by research firm Thomson Reuters Point Carbon, an overall reduction of carbon emissions of 11 percent from 2008 to 2010 was observed among the 343 California facilities that must comply with California’s cap-and-trade program. Table 2 displays the CO2 emission changes by industrial sector. Facility closures was the major driver for cement, glass, pulp and paper industries’ decline while chemicals sector emissions increased largely from a new hydrogen plant in SCE territory.
Table 2: Percent Change in CO2 Emissions among Largest Calif. Industrial Sectors, 2008-2010
CO2 Emissions 2008 vs. 2010
California Industrial Sector
Notes
+21% Chemicals Driven by new $80MM hydrogen facility in SCE territory +5% Metals Increase in production -34% Cement, lime and glass Driven by facility closures -35% Pulp, paper and wood Driven by facility closures
Source: Thomson Reuters Point Carbon11
The economic recession is forcing businesses and governments to take a close look at initiatives that save money and do not require capital investments, such as the best practices developed by the U.S. Department of Energy’s (DOE) Advanced Manufacturing Office (AMO),
9 National Academy of Sciences. 2010. Real Prospects for Energy Efficiency in the United States. National Academies Press. 10 High Beam Business. Chemicals and Allied Products, NEC SIC 5169, Industry Report. http://business.highbeam.com/industry-reports/wholesale/chemicals-allied-products-not-elsewhere-classified 11 Thomson Reuters Point Carbon. 2011. California Emissions in 2010 Down by 11%. August http://www.pointcarbon.com/aboutus/pressroom/1.1564622

KEMA, Inc. January 2012 11
formerly the Industrial Technologies Program (ITP), and through increased energy management systems, as discussed in the following sections.
2.3 Climate Change and Energy Legislation
Industry’s energy-related carbon-dioxide emissions have decreased in the last decade, while rising more dramatically in other sectors, as shown in Figure 3. This reduction is largely attributable to U.S. industry’s net decrease in energy consumption, according to the American Council for an Energy Efficient Economy12 that resulted from a decrease in manufacturing activity as well as energy efficiency gains. Still, industry accounts for approximately 27.4 percent of total energy-related carbon dioxide emissions in the United States.
Greater energy efficiency will almost certainly be an important component in comprehensive national—and global—strategies for managing energy resources and climate change in the future. Energy efficiency is generally acknowledged to be the lowest cost and fastest-to-deploy resource to slow the growth of carbon dioxide emissions, and it also results in positive economic impacts. Congress is not expected to approve any policy mechanisms to reduce CO2 emissions in the short term although legislation encouraging greater energy efficiency in the U.S. manufacturing sector is possible.
12Chittum, A., R. Elliott, and N. Kaufman. 2009. Trends in Industrial Energy Efficiency Programs: Today’s Leaders and Directions for the Future. American Council for an Energy Efficient Economy, Report IE091. September 2009.

KEMA, Inc. January 2012 12
Figure 3: U.S. Energy-Related CO2 Emissions by End-Use Sector, 1990-2007
Source: ACEEE13
2.4 National Programs
Typical utility programs address only a subset of the energy efficiency improvement opportunities, focusing primarily on retrofits and capital improvements. Less attention is given to behavior or maintenance. Federal, regional, and state government agencies, utilities, and others have developed a range of programs to improve industrial energy efficiency. These include providing incentives, audits and technical assistance, and continual improvement programs.
Many of PG&E and SCE’s customers participate in these programs which can yield insights and best practices to inform utility programs, such as energy assessments offered by the U.S. DOE’s AMO. In California, 49 assessments were completed for small and medium facilities in 2009 through 2011 and 38 assessments for large facilities between 2006 and 2011.14 For example, Neville Chemical in Anaheim, California is presented as a case study for their projects
13 Chittum, A., R. Elliott, and N. Kaufman. 2009. Trends in Industrial Energy Efficiency Programs: Today’s Leaders and Directions for the Future. American Council for an Energy Efficient Economy, Report IE091. September 2009. 14U.S. Department of Energy, Energy Efficiency and Renewable Energy, State and Regional Partnerships. 2011. http://www1.eere.energy.gov/industry/states/state_activities/map_new.asp?stid=CA

KEMA, Inc. January 2012 13
undertaken following a plant-wide energy efficiency assessment.15 Facilities of J.R. Simplot in Lathrop and 3M Corporation in Corona also participated in audits.
The U.S. DOE’s AMO has been the primary federal entity supporting manufacturing R&D in partnership with industrial stakeholders. The AMO R&D program has been recognized as one of the most successful federal R&D efforts operating today. However, in recent years support for the program’s R&D funding has faltered, particularly for the industry-specific R&D funding. This has been the most effectual initiative, considering its track record of commercializing products useful to industry. A U.S. DOE peer review report called the manufacturing R&D pipeline “largely empty.”16 This is challenging for the transformation of manufacturing because even though AMO's industry-specific R&D reaches commercialization faster than most other federal R&D, it can still take seven to ten years for results from R&D to reach a plant floor.
In addition to R&D activities (both the industry specific mentioned above and cross cutting), AMO has two technology and best practices programs: Better Plants (formerly Save Energy Now) and the Industrial Assessment Centers.
15 U.S. Department of Energy, Energy Efficiency and Renewable Energy, Industrial Technologies Program. 2003. “Neville Chemical Company: Management Pursues Five Projects Following Plant-Wide Energy-Efficiency Assessment.” Chemicals: Best Practices Plant-Wide Assessment Case Study. DOE/GO-102003-1666. July 2003. http://www1.eere.energy.gov/industry/bestpractices/pdfs/ch_cs_neville_chemical_company.PDF 16 Savitz, et al.2009. DOE Industrial Technologies Program 2008 Peer Review. http://www1.eere.energy.gov/industry/about/pdfs/itp_peerreview_report2008.PDF

KEMA, Inc. January 2012 14
Figure 4: Industrial Technologies Program Funding, 1998-2010
Source: ACEEE17
Better Plants works with large industrial energy consumers to help reduce their energy intensity using audits, software tools, and best practices. The other program, Industrial Assessment Center (IAC), serves a similar function for small- and mid-sized industrial facilities, and also trains the next generation of industrial energy engineers. Twenty-six centers at U.S. engineering universities train students to identify energy savings opportunities and perform no-cost assessments for small and medium industrial customers. In California, San Francisco State University and San Diego State University run IAC programs. The IAC program has a public database of recommendations dating back to 1981, a resource for customers on industrial energy efficiency improvements.
2.5 Rise of Continual Energy Improvement
Utilities, and private organizations, and governments around the world have developed programs in the last few years that focus on setting goals and targets to achieve continual
17 American Council for an Energy Efficient Economy. 2009. Barriers to energy efficiency investments and energy management in the U.S. industrial sector. October 20, 2009.

KEMA, Inc. January 2012 15
energy improvement (CEI) in industry. National programs in the United States have been developed by the DOE (Better Plants and Superior Energy Performance) and EPA (ENERGY STAR). Figure 5 displays some examples of national and regional continual energy programs. From a business perspective, interest in energy management is increasing, as shown by the increasing number of participants in these programs.
Figure 5: Examples of National and Regional Continual Energy Improvement Programs
Two important developments in 2011 are expected to heighten interest and activity around energy management: the release of ISO 50001, a global energy management standard, and the launch of superior energy performance, a national program to support energy intensity reductions for industrial plants and commercial buildings.18
The recent work on U.S. and international energy management standards can have a significant impact on how energy is used in the industrial sector. The International Standards Organization (ISO) released an international energy management standard, ISO-50001 in June 2011.
18 McKane, Aimee, Lawrence Berkeley Laboratory, 2011. Presentation at the ACEEE Market Transformation Conference, Piloting Energy Management Standards for the U.S and the Globe. http://www.aceee.org/conferences/2011/mt/program

KEMA, Inc. January 2012 16
The U.S. DOE is in the process of launching the Superior Energy Performance (SEP) program to promote industrial energy management and increased energy efficiency. This voluntary program will focus on fostering an organizational culture of energy efficiency improvement in U.S. manufacturing facilities, targeting mid- to large-size plants.
Participants establish an energy management system that complies with ISO 50001 and meets other SEP program requirements, including robust measurement and verification of energy savings. Pilot programs have been launched in Texas and the Pacific Northwest, and the full SEP program is expected to begin in 2013. A California pilot is also planned within the next two years. The American National Standards Institute (ANSI) is developing companion standards to support SEP. ANSI MSE 50021 will provide the additional energy performance and management system requirements for SEP certification that goes beyond basic conformance with ISO 5000; and ANSI 50028 will provide the requirements for verification bodies for use in accreditation or other forms of recognition.19
Regional CEI programs have been developed under the Northwest Energy Efficiency Alliance,20 working with the Bonneville Power Administration and the Energy Trust of Oregon. Puget Sound Energy has a Resource Conservation Program that focuses on continual improvement, particularly behavioral changes.21 California has identified CEI as an important aspect of its strategic plan22. PG&E is developing a pilot CEI program; upcoming evaluations will inform the future development of CEI in California. Similarly, Wisconsin’s Focus on Energy employs an internally developed tool called Practical Energy Management©.23 CEI is still in its infancy, with few CEI programs beyond the pilot stage.
19 U. S. Council for Energy-Efficient Manufacturing. 2010. Superior Energy Performance. http://www.superiorenergyperformance.net/pdfs/SEP_Cert_Framework.PDF 20 Northwest Energy Efficiency Alliance. Continuous Improvement for Industry website. http://www.energyimprovement.org/index.html 21 Puget Sound Energy, Business Energy Management, Resource Conservation Program. http://www.pse.com/savingsandenergycenter/ForBusinesses/Documents/3462_RCM.PDF 22 California Energy Commission 2011. Long Term Energy Efficiency Strategic Plan, Jan 2011 update. http://www.cpuc.ca.gov/NR/rdonlyres/A54B59C2-D571-440D-9477-3363726F573A/0/CAEnergyEfficiencyStrategicPlan_Jan2011.PDF 23 Wisconsin Focus on Energy, Industrial Program. Practical Energy Management tool. http://www.wifocusonenergy.com/page.jsp?pageId=368

KEMA, Inc. January 2012 17
2.6 Additional States Adopt Industrial Energy Efficiency
California has long been perceived as a leader in energy efficiency programs. Historically, energy efficiency trends and best practices tended to spread from California to other states involved in industrial energy efficiency. More recently, a sizable contingent of states have made significant commitments to energy efficiency programming as shown in Figure 6. The flow of information is changing as energy efficiency programs spread to locations in the Midwest and South that typically had provided modest or little ratepayer funding for energy efficiency. Program development efforts in many of the aforementioned states are in their early stages compared to California.
These states have signaled their commitment to energy efficiency by adopting aggressive Energy Efficiency Portfolio Standards24 (EEPS) policies25 that exceed those in California. As shown in Table 3, California ranks number 14 for cumulative electricity savings targets by 2020, below states primarily in the Northeast and Midwest.
24 Covers all sectors including residential, commercial and industrial efficiency. 25 These include: Illinois, Maryland, Michigan, New Mexico, Ohio, Pennsylvania, and Virginia (provisionally).

KEMA, Inc. January 2012 18
Figure 6: Utility Energy Efficiency Policies and Programs, 2006 vs. 2007+
Source: ACEEE26
The electric EEPS targets in most of these states rise from 1–2 percent of retail sales per year within the first 5–10 years of the standard, rivaling the annual savings levels currently being achieved in only a handful of leading states. For example, North Carolina has until recently been relatively inactive in energy efficiency, but has enacted a renewable portfolio standard (RPS). Under this RPS, energy efficiency can meet up to 40 percent of the total requirements of the state’s investor-owned utilities (IOUs) and an unlimited amount of the publicly owned utilities’ requirements.
The rise of energy efficiency policies and programs indicates that California utilities can increasingly draw on program experience in other states to inform their own experiences.
26 Nadel, Steven. 2011. Program Introduction. (Presentation, ACEEE 2011 National Symposium on Market Transformation, Washington DC, April 10–12, Conference 2011). http://www.aceee.org/files/pdf/conferences/mt/2011/Introduction%20-%20Steve%20Nadel.PDF

KEMA, Inc. January 2012 19
Table 3: 2020 Cumulative Electricity Savings Targets, by State27
State 2020 EE Target State 2020 EE Target Vermont 30% Indiana 14% New York 26% Rhode Island 14% Massachusetts 26% Hawaii 14% Maryland 25% California 13% Delaware 25% Ohio 12% Illinois 18% Colorado 12% Connecticut 18% Utah 11% Minnesota 17% Michigan 11% Iowa 16% Pennsylvania 10% Arizona 15% Washington 10%
Source: ACEEE28
Fuel Switching and Cogeneration/Combined Heat and Power (CHP). Combined heat and power, or cogeneration, is a significant and growing share of U.S. generation (see Figure 7). CHP is the concurrent production of electricity or mechanical power and useful thermal energy (heating and/or cooling) from a single source of energy. This technology is first and foremost an energy efficiency resource that allows users to produce needed electricity, heat, and mechanical energy while using as little fuel as possible.
Natural gas continues to be the preferred fuel for CHP systems, representing 50–80 percent of annual CHP capacity additions since 1990. This is primarily because natural gas is readily available at most industrial sites, is clean burning, and has historically been relatively plentiful and affordable. Since 2001, natural gas prices have been consistently volatile and relatively high. While natural gas remains an important CHP fuel, installers and technology developers are increasingly looking to opportunity fuels for CHP systems. Opportunity fuels are nontraditional fuels that are frequently considered waste or by-products and provide lower fuel costs.
CHP is particularly applicable to the chemical industry. Nationwide, California ranked second in largest total available CHP capacity in 2006, at 9,220 megawatts (MW) compared to Texas at
27 Includes extensions to 2020 at savings rates that have been established. 28 Nadel, Steven. 2011. Program Introduction. (Presentation, ACEEE 2011 National Symposium on Market Transformation, Washington DC, April 10–12, 2011). http://www.aceee.org/files/pdf/conferences/mt/2011/Introduction%20-%20Steve%20Nadel.PDF

KEMA, Inc. January 2012 20
17,240 MW. The capacity reflects large industrial demands, stringent air quality requirements, and effective policies that encourage adoption of CHP.
Figure 7: CHP as a Percentage of U.S. Annual Electricity Generation
Source: U.S. DOE29
29 U.S. DOE. 2008. Combined Heat and Power: Effective Solutions for a Sustainable Future. Prepared by Oak Ridge National Laboratory, ORNL/TM-2008/224, December 2008.

KEMA, Inc. January 2012 21
3. Industry Characterization
The following sections describe the chemicals industry, including industry definition (section 3.1), description of primary energy uses (section 3.2), industry landscape in California (section 3.3), competitive issues (section 3.4), economic issues (section 3.5), regulatory issues (section 3.6), and the industry network (section 3.7).
3.1 Industry Definition
The chemical industry, as defined by the 3-digit NAICS 325, is based on the transformation of organic and inorganic raw materials by a chemical process and the formulation of products.30
The chemical industry operations described in this document provides a wide range of products, such as medicines, cleaning agents, perfumes, paints, industrial gases, and fertilizers. The most recently published U.S. Census Bureau Annual Survey of Manufacturers, using 2008 data, shows that U.S. chemical manufacturers had total sales of $751 billion, with a value-add of $355 billion.31 The pervasiveness of chemicals in people's lives has made this industry very important to the California economy. Based on sales of final products (i.e., value of shipments), California is the fourth largest chemical producing state in the nation, behind Texas, Louisiana and North Carolina.
Because of its wide range of products, the chemical industry is divided into seven broad categories under NAICS 325. Table 4 shows the total sales of final products (i.e., value of shipments) for each of the seven broad categories in California. The value of shipments in chemical manufacturing from California has nearly doubled in the past decade.
In California, Pharmaceutical and Medical Manufacturing (NAICS 3254) alone make up approximately 66 percent of the value of shipments in the California's chemical manufacturing industry, with values of over $30 billion dollars in 2008.32 This is in marked contrast to the make-up of the chemical industry in other parts of the country, such as the Texas and Louisiana where petroleum-based organic chemical production is the major focus.
30 This sector excludes chemical processing that occurs during mining operations and the refining of petroleum. 31 U.S. Census Bureau, American FactFinder. 2010. 2008 Annual Survey of Manufacturers. March 30, 2010. http://factfinder.census.gov/servlet/IBQTable?_bm=y&-ds_name=AM0831GS101 32 Ibid.

KEMA, Inc. January 2012 22
Production of most chemicals is inherently energy intensive. In California, this sector’s energy consumption accounts for approximately 8 percent and 5 percent of California's manufacturing sector electrical and gas consumption respectively.
Table 4: California Chemical Manufacturing Industry Value and Growth
California Chemical Manufacturing (In $1000s)
NAICS Description 2007 2008 3251 Basic chemical mfg 3,189,874 3,346,961
3252 Resin, synthetic rubber, & artificial & synthetic fibers mfg
1,754,535 1,738,478
3253 Pesticide, fertilizer, & other agricultural chemical mfg
1,155,834 1,129,120
3254 Pharmaceutical & medicine mfg 26,900,167 30,747,600 3255 Paint, coating, & adhesive mfg 2,363,724 2,150,961
3256 Soap, cleaning, compound & toilet preparation mfg
4,386,829 4,212,881
3259 Other chemical product mfg 2,899,707 2,678,978 Total 42,650,670 46,004,979
Source: U.S. Census Bureau33
For the PG&E and SCE service territories, the subsectors of particular interest include the following 4-digit NAICS codes:
• 3251 Basic Chemical Manufacturing. This industry group comprises establishments primarily engaged in manufacturing chemicals using diverse basic processes, such as distillation and gas separation. Of particular interest to California are manufacturers of industrial organic and inorganic gases in compressed, liquid and solid forms.
• 3252 Resin, Synthetic Rubber and Artificial Synthetic Fibers and Filaments Manufacturing. This industry group comprises establishments primarily engaged in one or more of the following manufacturing activities: resins and synthetic rubber and artificial and synthetic fibers and filaments. Key product groups include thermosetting resins, thermoplastic resins and synthetic rubber. Of particular interest to SCE are manufacturers of plastics materials and resins.
33 Ibid.

KEMA, Inc. January 2012 23
• 3253 Pesticide, Fertilizer, & Other Agricultural Chemical Manufacturing. This industry group comprises establishments primarily engaged in one or more of the following manufacturing activities: fertilizers and/or pesticides and other agricultural chemicals.
• 3254 Pharmaceutical & Medicine Manufacturing. This industry group comprises establishments primarily engaged in one or more of the following manufacturing activities: (1) biological and medicinal products; (2) processing (i.e., grading, grinding, and milling) botanical drugs and herbs; (3) isolating active medicinal principals from botanical drugs and herbs; and (4) pharmaceutical products intended for internal and external consumption in such forms as ampoules, tablets, capsules, vials, ointments, powders, solutions, and suspensions.
• 3255 Paint, Coating and Adhesive Manufacturing. This industry group comprises establishments primarily engaged in the manufacture of liquid- and powder-based paints, varnishes and related products used for protective, decorative, industrial, automotive, specialty or other purposes. This subsector excludes inks, thinners and raw materials such as pigments and solvents.
• 3256 Soap, Cleaning, Compound & Toilet Preparation Manufacturing. This industry group comprises establishments primarily engaged in one or more of the following manufacturing activities: soap and cleaning compounds and/or toilet preparations.
Figure 8: Chemical Manufacturing Subsector Electricity Purchases from PG&E in 2006 and Figure 9 below show the 6-digit NAIC sub-sector breakdown of electricity in PG&E and SCE territory, respectively. The largest sales for PG&E by far come from pharmaceutical related manufacturing activities, approximately half of total sales for chemicals costumers.34 Industrial gas manufacturing is also a significant consumer of electricity in the PG&E territory. Within SCE territory, industrial gas manufacturing is the primary consumer of electricity, with pharmaceutical activities following a relatively close second. The top five subsectors represented here in each
34 325412 Pharmaceutical Preparation Manufacturing comprises establishments primarily engaged in manufacturing in-vivo diagnostic substances and pharmaceutical preparations (except biological) intended for internal and external consumption in dose forms, such as ampoules, tablets, capsules, vials, ointments, powders, solutions, and suspensions. 325410 Pharmaceutical and Medicine Manufacturing comprises establishments primarily engaged in one or more of the following: (1) manufacturing biological and medicinal products; (2) processing (i.e., grading, grinding, and milling) botanical drugs and herbs; (3) isolating active medicinal principals from botanical drugs and herbs; and (4) manufacturing pharmaceutical products intended for internal and external consumption in such forms as ampoules, tablets, capsules, vials, ointments, powders, solutions, and suspensions.

KEMA, Inc. January 2012 24
figure comprise approximately 90 percent of all purchases from PG&E and SCE chemicals customers.
Figure 8: Chemical Manufacturing Subsector Electricity Purchases from PG&E in 2006
0 50 100 150 200 250 300 350 400 450 500
All Others
325311 NitrogenousFertilizer
325414 Biological Product(except Diagnostic)
325410 Pharmaceuticaland Medicine
325120 Industrial Gas
325412 PharmaceuticalPreparation
Subs
ecto
r
Electricity Use (million kWh)
Source: KEMA, Inc. using PG&E data
KEMA, Inc. January 2012 25
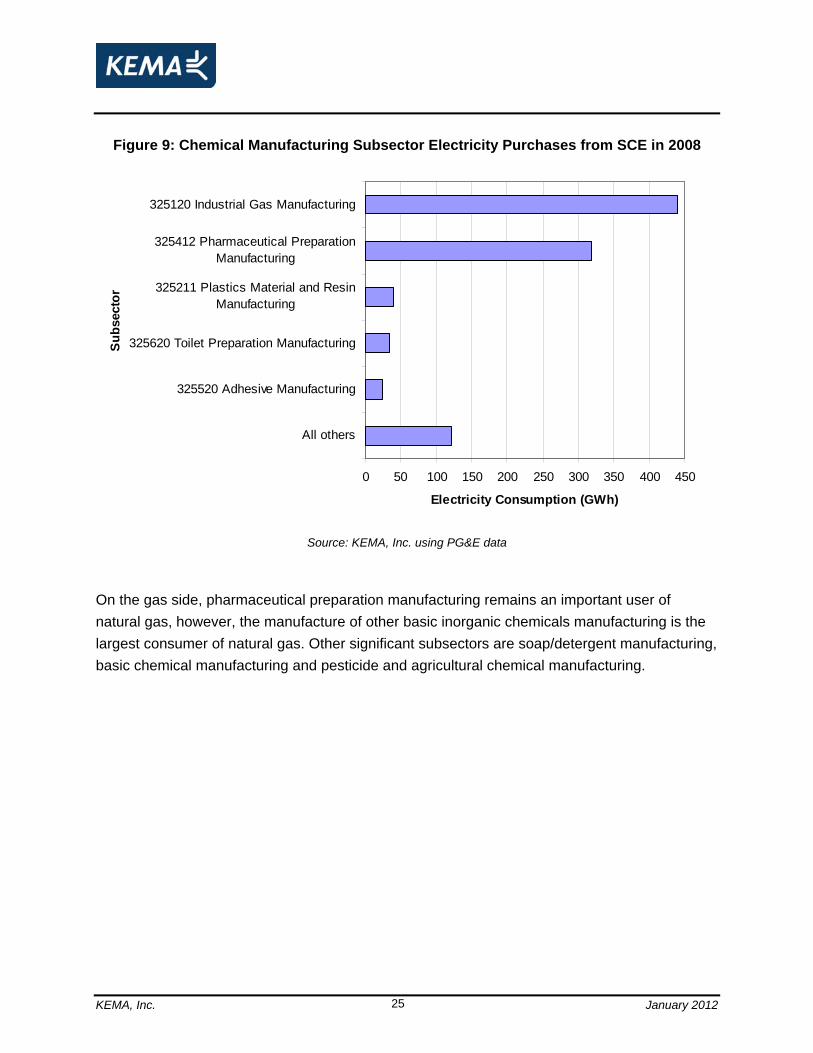
Figure 9: Chemical Manufacturing Subsector Electricity Purchases from SCE in 2008
0 50 100 150 200 250 300 350 400 450
All others
325520 Adhesive Manufacturing
325620 Toilet Preparation Manufacturing
325211 Plastics Material and ResinManufacturing
325412 Pharmaceutical PreparationManufacturing
325120 Industrial Gas Manufacturing
Subs
ecto
r
Electricity Consumption (GWh)
Source: KEMA, Inc. using PG&E data
On the gas side, pharmaceutical preparation manufacturing remains an important user of natural gas, however, the manufacture of other basic inorganic chemicals manufacturing is the largest consumer of natural gas. Other significant subsectors are soap/detergent manufacturing, basic chemical manufacturing and pesticide and agricultural chemical manufacturing.

KEMA, Inc. January 2012 26
Figure 10: Chemical Manufacturing Subsector Gas Purchases from PG&E in 2006
0 5 10 15 20 25 30
All Others
325320 Pesticide and OtherAgricultural Chemical
325100 Industry Group:Basic Chemical
325611 Soap and OtherDetergent
325412 PharmaceuticalPreparation
325188 All Other BasicInorganic Chemical
Subs
ecto
r
Gas Use (million therms)
Source: KEMA, Inc. using SCE data
3.2 Industry Leaders
The chemical industry has a long history in the United States and worldwide. The U.S. chemical industry began exporting goods in the 18th century, when it established a limited export trade in potash and naval stores with the United Kingdom. Since then, the chemical industry has become an integral component of the U.S. economy, converting various raw materials into more than 70,000 diverse products.
By contributing to multiple value-added products, chemical manufacturers serve as an essential support industry for the entire state of California. Industries in California that are heavily dependent on the business of chemistry include trade, business services, manufacturing, agriculture and transportation. For example, many of the top 25 chemicals produced in California are used in agricultural production, helping to make California farmland the most productive in the world. Electronic chemicals and high-performance plastics also support California's prominent computer and electronics industry.35
35 California Energy Commission website. http://www.energy.ca.gov/research/iaw/index.html

KEMA, Inc. January 2012 27
The industry leaders can be considered in three categories: 1) Global Titans, which have worldwide reach, billions in revenue, and tens of thousands of employees, but may not have a presence in California; 2) Domestic Leaders, which have over $1 billion in annual revenue and serve markets throughout the country and often have a California presences; and 3) Important Local Players, which have a very strong presence in California, dominate regional markets, and may or may not have a wider geographic presence. The source of the following information is the company websites of these organizations.
3.2.1 Global Titans
• Air Liquide is a French company that supplies industrial gases, such as oxygen, nitrogen, argon, and hydrogen, to various industries including medical, chemical and electronic manufacturers. The company operates in 75 countries with over 42,000 employees.
• BASF is a German chemical company and one of the largest chemical companies in the world. The BASF Group comprises subsidiaries and joint ventures in more than 80 countries, supplying a wide range of products to customers in over 200 countries. The company’s portfolio ranges from oil and gas to chemicals, plastics, performance products, agricultural products and fine chemicals.
• Dow Chemical Company is an American multinational corporation headquartered in Midland, Michigan. It is the second largest chemical manufacturer in the world by revenue (after BASF). Dow Chemical provides a range of products including plastics, chemicals and agricultural products with a presence in more than 175 countries and employs 46,000 people worldwide.
• DuPont operates in over 70 countries, and is headquartered in Wilmington, Delaware. The company is the fourth largest chemical company in terms of revenue (behind BASF, Dow Chemical and Ineos). DuPont offers a wide range of products and services for markets including agriculture, nutrition, electronics, communications, home and construction.
• Ineos is a privately owned British company, and one of the world’s largest chemical companies, comprising 17 businesses and a production network that spans 64 manufacturing facilities in 14 countries throughout the world. The company is a global manufacturer of petrochemicals, specialty chemicals and oil products. Ineos was formed in 1997 as a management buyout of the former British Petroleum (BP) petrochemical assets. Since then, it has expanded by purchasing divisions that have been divested by other companies such as BASF and Dow Chemical.

KEMA, Inc. January 2012 28
• Proctor & Gamble (P&G) is a Fortune 500 American multinational corporation headquartered in Cincinnati, Ohio. In 2009, the company had over $70 billion in sales across its three global business units: Beauty Care, Household Care, and Health and Well-Being. P&G’s products include the following billion-dollar brands: Head & Shoulders, Gillette, Crest, Oral-B, Iams, Pringles, Downy, Tide, Bounty and Pampers. These brands have more than a billion dollars each in annual sales.
3.2.2 Domestic Leaders
• Air Products & Chemicals, Inc. is an international corporation whose principal business is selling gases and chemicals for industrial uses. Headquartered in Allentown, Pennsylvania, Air Products serves customers in technology, products, energy, healthcare, food and industrial markets worldwide with a portfolio of products and services to provide atmospheric gases, process and specialty gases, and chemical intermediaries.
• Amgen is an international biotechnology company headquartered in Thousand Oaks, California. As of November 20, 2009, Amgen had 10 approved drugs for 15 conditions, with an additional 23 pharmacologic agents in drug discovery phase for 28 conditions.
• Bayer Group is a German chemical and pharmaceutical company, with sales over $37 billion in 2009. The company is organized into three business operations: Healthcare, Crop Science and Material Science. The Healthcare unit focuses on pharmaceutical and medical products. The Crop Science unit focuses on crop protection and non-agricultural pest control. The Material Science unit supplies high-performance materials, such as polycarbonates and polyurethanes.
• Novartis International is a multinational pharmaceutical company based in Switzerland, with total revenues over $40 billion in 2009. The company offers a wide range of healthcare products through four divisions: Pharmaceuticals, Vaccines and Diagnostics, Animal Health and Consumer Health Divisions. The Vaccines and Diagnostics Division provides more than 20 products to prevent viral and bacterial diseases. It also creates instruments, assays and software to test blood donations for infections.
• Praxair, Inc. is a global, Fortune 300 company that supplies atmospheric, process and specialty gases, high-performance coatings, and related services and technologies to a wide diversity of customers. Based in Danbury, Connecticut, Praxair serves industries such as aerospace, food and beverages, healthcare, semiconductors, chemicals, refining, oil and gas production, primary metals and metal fabrication, as well as other areas of general industry. Praxair's primary products are atmospheric gases (e.g.,

KEMA, Inc. January 2012 29
oxygen, nitrogen, argon) and process/specialty gases (e.g., helium, hydrogen, semiconductor process gases and acetylene).
• Roche is a Swiss global healthcare company that operates worldwide under two divisions: Pharmaceuticals and Diagnostics. With revenues over $40 billion in 2008, Roche owns the U.S. biotechnology company Genentech, which produces multiple products on the market for serious or life-threatening medical conditions and more than 100 projects in the pipeline. In 2009, Roche and Genentech combined their pharmaceutical operations in the United States. The Genentech office in South San Francisco serves as the headquarters for Roche pharmaceutical operations in the United States.
3.2.3 Important Local Players
• Matheson Tri-Gas is wholly owned by Japanese company Taiyo Nippon Sanso and has been producing specialty gases for commercial supply for over 80 years. The company manufactures gases used in laboratories, wafer fabrication plants, and other processes. Products include specialty gases, gas-handling equipment, and semiconductor gases.
• Searles Valley Minerals provides customers worldwide with soda ash, sodium sulfate, and boron minerals from the desert of the western United States. The company utilizes advanced solution mining and crystallization techniques to yield approximately two million tons of these minerals each year. These minerals are used in the manufacture of a wide variety of goods, including glass, ceramics, carbonated beverages, animal feed, paper products, and detergents.
• Pharmavite LLC is a global leader in dietary supplements, with headquarters in Mission Hills, California. Pharmavite operates as the parent company of NatureMade and SoyJoy products. The company makes and distributes high-quality vitamins, minerals, herbs and other nutritional supplements.
• SICOR Pharmaceuticals (now Teva USA) is a subsidiary of Teva Pharmaceutical Industries, an Israeli-based company. Teva USA makes generic pharmaceutical products, as well as active pharmaceutical ingredients, with a strong focus on injectable generics. The company offers products for a wide range of therapeutic areas including cardiovascular, anti-infective, anti-diabetic, dermatology, respiratory and women’s health.
• Watson Laboratories, is a subsidiary of Watson Pharmaceuticals Inc., which develops, manufactures and sells both proprietary (brand-name) and off-patent (generic), pharmaceutical products. Watson Pharmaceuticals is the fifth-largest pharmaceutical

KEMA, Inc. January 2012 30
company in the United States, based on the number of prescriptions dispensed. Based in Corona, California, Watson’s Generics division markets more than 150 pharmaceutical product families, including one of the largest lines of oral contraceptives in the industry. The company also offers 30 branded products marketed through three divisions: General Products, Nephrology36 and Women’s Health.
3.3 Competitive Issues
Chemical companies sell their products to a large variety of customers across the industrial, agricultural, construction, textile, healthcare, and consumer products sectors. Since the chemical industry in California covers a large number of diverse subsectors, the basis of competition also varies substantially depending on the product. For example, commodity products (such as basic chemicals) generally compete purely on price, whereas niche and specialty products (such as pharmaceuticals) can compete on the basis of other characteristics including quality and ability to serve specific needs.
For the basic chemical manufacturing sector (NAICS 3251), industrial gases and chemicals represent commodity products that compete almost purely on the basis of price. Therefore, the profitability of individual companies is closely tied to efficient operations, providing an incentive for improving energy efficiency. Big companies have economies of scale in production. Small companies can compete effectively by producing specialty products, of which there are a large number, or by operating a single plant highly efficiently.
In the pharmaceutical and pesticide manufacturing sectors (NAICS 3254 and 3253), patented technologies play a critical role in the competitive nature of these sectors. The basis of competition depends in part on whether the product is still in patent, out of patent or is a generic equivalent. For pharmaceuticals, it will also depend on whether the product is a new innovative pharmaceutical for which there is "no reasonable alternative," or is a "me-too" pharmaceutical for which there is a therapeutic alternative. The basis of competition will also vary between over-the-counter products and complementary or alternative therapeutic products including herbal/botanical products.
Generic pesticide products are becoming a more important source of competition as the 30- to 40-year-old patents on earlier discoveries expire. Where a product is still patented, competition
36 Nephrology is a branch of medicine related to kidneys, especially their functions and/or diseases.

KEMA, Inc. January 2012 31
is mainly based on product innovation/development. For the pesticide manufacturing sector, companies are moving to take advantage of new technological innovations as the boundaries between crop protection and crop production become increasingly blurred. The use of biotechnologies has also become a basis of competitive differentiation for both pharmaceuticals and pesticides.
For the soap and cleaning compound manufacturing sector (NAICS 3256), one of the major factors determining the basis of competition is price. Firms often compete on price for general categories and consumables, such as laundry soap, bleach and natural glycerin products as consumers regularly demand cheaper generic items in these categories. The brand strength and breadth of their product lines is another key competitive basis. Existing and established companies that offer a wide range of products gain greater market presence and product acceptance. Industry players involved in the production of branded products have also had to face increased competitive pressures from private label products and/or supermarket's/mass merchandisers own label products. The type and extent of competition will to some degree vary depending on whether the industry participant in question services the household market or the commercial market. For example in the household market, competition is based primarily on product differentiation and brand loyalty established through extensive advertising. The importance of price varies across sub-markets. On the other hand, competition in the commercial market is based on performance and price.
Overall, for chemical products which are not commodity products, companies compete on new product development to be first in the market and benefit from patent protection. In particular, the ability to continuously introduce new products or extend product lines in an otherwise saturated market has increased in importance in recent years. In recent years, the chemicals industry has seen a gradual move towards greater globalization within the industry. One of the key variables underlying this move has been market saturation in traditional markets forcing players to look elsewhere for growth including the developing markets in Asia and South America.
3.3.1 Business Models
California is the fourth-largest chemical producing state, with profit margins averaging 8 to 9 percent. These margins allow the industry to aggressively pursue research and development (R&D), enabling California companies to remain globally competitive. This trend extends nationwide and has resulted in the United States leading the world in state-of-the-art production of organic chemicals and pharmaceutical products. The business model for the large industry

KEMA, Inc. January 2012 32
leaders tends to rely on keeping products and production processes simple and focusing on economies-of-scale production; while small specialty producers tend to focus on niche products requiring more complex custom products.
In many product segments, companies may do most of their business with just a few large customers, or with customers all in the same industry. For companies like Praxair, the major customers for industrial chemicals are other chemical and manufacturing companies that use industrial gases in their own manufacturing processes. Other major customers also include consumer products companies that use them directly to formulate products like detergents and toothpaste, and wholesale dealers that resell them in smaller quantities to a variety of small customers. Companies often have large, long-term contracts with a few large customers. In some cases, a producer with a long-term contract will build a plant next to the manufacturing facility of a major customer.
The degree of geographic concentration for chemical companies varies between product segments. Pesticide and fertilizer manufacturers operating on a global basis may operate a few manufacturing plants for the production of active substances. They may then operate a greater number of formulation and packaging plants around the world which are geared towards local or regional markets. For instance, California is estimated to account for over half of all fungicides consumed in the United States, reflecting its importance as a grape growing region.
For the soap and cleaning-compound manufacturing sector (NAICS 3256), the largest product segments are related to the manufacture of soap, dishwashing and laundry detergent preparations, disinfectants, shoe and furniture polishes and other industrial and household cleaning agents. The U.S. soap and cleaning compound manufacturing industry is characterized by a relatively large number of companies dispersed throughout the country. While there are a number of small players in the industry specializing in a few product lines to serve niche markets, major players in the industry are continuing to acquire smaller companies with fewer resources in order to expand and gain greater market control.
In the chemicals industry, small players survive by finding a dedicated niche and responding directly to the needs of their customers. Price can be a differentiator, but most critical is the expertise and production capacity to meet a specific design need. Profit margins are higher, but production volume is much lower than for the large manufacturers. Reputation and loyalty help maintain sales, and network marketing can help manufacturers grow into similar niches.

KEMA, Inc. January 2012 33
3.3.2 Cost Structure
Although cost structure varies across the industry, purchases of feedstock are generally the largest variable cost to most chemical manufacturers. Upfront fixed costs are also significant, with industrial chemical plants being highly automated and capital intensive. Individual pieces of equipment can be very expensive. With high fixed costs, changes in production volume quickly affect profits. Maintenance costs are often high. New plants with the latest technology routinely cost more than $100 million, a primary reason why most companies in the industry are large.
Unlike advanced chemicals that are manufactured through complicated chemical reactions, the manufacture of basic industrial chemicals consists of extraction and purification from natural substances, including minerals, natural gas, petroleum, plants, air, and water. Many companies either own their raw material supply or acquire it under long-term leases to manage costs. For many products, the cost of energy can also be 30 percent or more of the total manufacturing cost.
Similar to basic industrial chemicals, raw materials for the plastic materials and resin industry comprise the largest cost (approximately 65 percent of total sales). Key raw materials include propylene, ethylene, phenol, acetone, chlorine, benzene and naphtha. In recent years, the cost of many of these raw materials has been highly volatile reflecting the volatile nature of crude oil and natural gas. They also tend to be cyclical, due to fluctuating economic conditions, so that industry participants who have the ability to utilize a wide range of raw materials tend to have lower variable costs. Also included within this category are the high transport costs associated with the use of these feedstocks in those instances where industry participants are not part of an integrated refinery/petrochemical complex. Profit margins tend to be around 4 percent.
For both the pharmaceutical and pesticide industries, the highest expense is in its product innovation or R&D process. The R&D process includes long lead times and a high degree of risk. In the pharmaceutical industry, only one in 5,000 new chemicals discovered actually results in a medical product. In addition, just three out of 10 approved products recover their R&D costs, while it generally takes around 10 to 15 years and $1.3 billion to develop a new product.
For the pesticide industry, the development of individual molecules into pesticide products is time-consuming and risking, with only one of every 140,000 molecules tested becoming a pesticide product.37 The current cost of developing a new crop protection product is
37 Purdue University. Undated. The Pesticide Marketplace. http://www.ppp.purdue.edu/Pubs/ppp-71.PDF

KEMA, Inc. January 2012 34
approximately $200 to $250 million and involves a timeframe of between 8 and 10 years. Furthermore, there have been no blockbuster products developed since Monsanto created Roundup in the 1970s.
For the soap and cleaning compound manufacturers, purchases of feedstock are by far the largest expense item, accounting for an estimated 51 percent of sales. This means that a company’s ability to manage its cost structure can be adversely affected by significant movements in raw material prices, many of which have been on the increase since 2005. The next largest expense item is wages which represented roughly 5 percent of sales in 2009. Wages have gradually fallen in terms of percentage of sales in recent years. This decline is in line with efforts to achieve higher operating efficiencies and moves to further automate the manufacturing process.
For the chemical industry as a whole, the escalating raw-material costs and increasingly competitive market industry are forcing companies to look closely at manufacturing processes, including opportunities to find alternatives to input materials. For example, recent reports state that Procter & Gamble is seeking to find alternatives to crude-oil-based surfactants (a key ingredient) for a range of products.38,39 It hopes to cut its reliance on crude oil based surfactants by up to 20 percent. By reducing reliance on crude-oil-based surfactants, the company hopes to not only diversify its supply base, but also give it some control over the price of such commodities and hence reduce its exposure to future energy price volatility.
3.3.3 Technology Development
Technology development related to innovation of new processes and materials has been most significant for specific subsectors, such as the pharmaceutical and pesticides manufacturing industries. Other industries such as the basic chemicals, and soap and cleaning products generally involve relatively straightforward processes of mixing various raw materials and adding heat to produce a series of chemical reactions, and then using physical techniques to isolate the finished product. For mature products, the most significant technological development has been the automation of manufacturing plants and increased utilization of computer systems. Furthermore, these industries have not experienced substantial innovation
38 Farm & Ranch Guide. 2005. “Cuphea: New crop designed to replace imported oils.” FarmandRanchGuide.com. Posted October 13, 2005. 2005. http://www.farmandranchguide.com/news/regional/cuphea-new-crop-designed-to-replace-imported-oils/article_7d22d5e4-81ab-561e-be88-95acfccfc970.html 39 Staff Reporter. 2005. “P&G to make more use of palm oil.” Cosmetics design-europe.com. Posted October 5, 2005. http://www.cosmeticsdesign-europe.com/Business-Financial/P-G-to-make-more-use-of-palm-oil

KEMA, Inc. January 2012 35
or technology development that would enable significant new products or changes to the industries, with a few notable exceptions.
Of all the chemical subsectors, the pharmaceutical and pesticides industries have been most affected by technological change. In the pharmaceutical industry, recent advances in biology and medicine are expected to lead to a large number of new drugs. Technological developments in recent years have also seen a switch in focus away from the use of traditional chemical methods to control disease in favor of biotechnology which utilizes living organisms to create new products and processes. Key areas in biotechnology include genomics, genetic engineering, combinatorial chemistry, bio-informatics, robotics and deoxyribonucleic acid (DNA) research and enzyme engineering.
By 2007, the growth rate in the sale of global biotech drugs had doubled that of traditional pharmaceutical products, reaching $75 billion.40 California is well positioned to benefit from the growth in the biotechnology industry. Nearly 40 percent of all public biotech companies in the nation are in California, with nearly half of all R&D spending in the sector also occurring within the state.41
For the pesticides/fertilizer industry, technological development has led to little growth in actual pesticide usage despite significant increases in crop production. This is partly a result of the increasing adoption of integrated pest management strategies and organic farming. The other significant driver has been the development of more selective pesticides, which reduce usage. The use of bio-control methods and the development of genetically modified plants, which are weed and pest resistant, are serving to lower the demand for pesticides. The use of genetically modified crops is expected to reduce the usage of pesticides and herbicides, to the detriment of traditional pesticide manufacturers. These developments also mean, however, that the technologies developed by pesticide manufacturers and crop seed manufacturers are increasingly intertwined. Overall, the industry is growing, with the largest increases from the developing world.
40 RNCOS, Industry Research Solutions. 2008. “Global Biotech Drugs Sales Grew Double Pharma Sales.” Posted August 07, 2008 http://www.rncos.com/Blog/report_list.php?year=http://www.rncos.com/Blog/blog_report.php&month=08&blog_pagename=Global-Biotech-Drugs-Sales-Grew-Double-than-Pharma-Sales 41 Zhang, J. and N. Patel. The Dynamics of California’s Biotechnology Industry. (San Francisco: Public Policy Institute of California, 2005).

KEMA, Inc. January 2012 36
For specific segments of the chemical industry, biotechnology has resulted in new processes to develop new and innovative products. From pharmaceuticals to pesticides, from ethanol to biodiesel, the U.S. chemical industry is expanding its use of biotechnology. Some biotechnology approaches of using cells or components of cells (e.g., enzymes) are well established and commercialized, while others are still emerging. The chemical industry is increasingly adopting industrial biotechnology because of its many potential technical, economic and environmental advantages, such as simplification of processes, cost savings, reduced consumption of fossil fuel and energy, potential reduction in the U.S. import of crude petroleum, development of rural economies, and beneficial environmental effects.
The plastics materials and resin industry has also been influenced by technological advancements in recent years. For example, technological advancements within the polypropylene segment have seen manufacturers switch from high-performance engineering plastic resins to special polypropylene plastic resins and compounds that offer easier processing abilities and which can also meet recycling requirements. Some companies have sought to continuously develop and reinvent polypropylene's properties and applications, often displacing traditional materials (including other plastics) in the process. These new technologies are enabling the development of differentiating products.
In general, the development of new industry practices, the use of techniques adapted to other industries, and the emergence of new modeling and simulation technologies specific to the chemical industry will allow companies to shorten product and process development time. These advancements are integral to maintaining global competitiveness. The chemical industry increasingly uses new, more productive computational approaches for product design and development. Advances in simulation, modeling, hardware, and software are enabling this change and will accelerate the pace at which technological change will take place.
3.3.4 Supply Chain Management
As the chemical industry becomes increasingly global, issues related to the supply chain are increasingly critical to industrial competitiveness. Chemical companies are aggressively seeking to vertically integrate the upstream supply chain to control operations from feedstocks and raw materials to downstream chemical and plastics manufacture. Since the early 1990s, Dow Chemical has been seeking to vertically integrate its supply chain, and most recently acquired Rohm and Hass in 2008 to improve access to raw materials.
Customers for chemical materials are also aggressively expanding and unifying their operations globally, particularly as free trade expands. As the chemical industry is looking to structure its

KEMA, Inc. January 2012 37
marketing, manufacturing and distribution operations from a global perspective, this has led to a number of acquisitions and divestures of businesses. For example, Air Products & Chemicals sought to harmonize manufacturing and distribution operations through the acquisition of Sanwa Chemical of Japan, San Fu Gas Company in Taiwan and Messer Griesheim’s Mexican gas operations.
In some instances, chemical companies are vertically integrating the supply chain, where the chemicals are on-sold to other business units within the same company to be used in the manufacture of intermediate and/or final chemical and plastic products. For example half of the output of the Goodyear Chemical unit (which is involved in the production of synthetic rubber as well as adhesive resins, antioxidants and latex) is directed towards its sister company, Goodyear Tire and Rubber.
Chemical companies are continually seeking to make their supply chain operations more cost-effective and requiring less investment. Through improved data management and information technology, inventories could be reduced by as much as 50 percent and storage and handling costs reduced by as much as 20 percent of what they were in the 1990s.
3.3.5 Product Development and Roll-out
While product development is not a major business factor for most basic chemical manufacturing companies, it is a significant expansion strategy for other chemical companies, particularly the pharmaceutical, pesticide and many soap and cleaning product subsectors. For these subsectors, product development is driven primarily by technological developments to reduce consumer costs, improve product quality, reduce side effects (i.e., both health and environmental impacts) and penetrate new market niches.
For commodity chemicals, such as industrial gases, resins and synthetic rubber, and paints and coatings, the development of new products has not been a significant focus compared with efforts to improve the efficiency of production processes. In general, chemical manufacturers that serve intermediate markets (i.e., used in the manufacture of final chemical products) are responding to customer requests and needs in the development of new products, rather than acting proactively to develop new products.
In contrast, the pharmaceutical segment is constantly seeking to develop new products to address unmet needs. While the pharmaceutical industry is continuing to rely on advances in medical technology to develop new products, the recent pace of this development has slowed considerably while the cost has risen dramatically. With a number of key drugs due to lose

KEMA, Inc. January 2012 38
patent protection over the period to 2012, the pressure for new products will escalate as the major players face the consequences of patent expirations of some of the most profitable drugs in the industry's history. The high costs of research and development pose a substantial obstacle, since the cost of developing new pharmaceutical products has doubled in the past two decades. In the United States, pharmaceutical manufacturers invest a higher percentage of sales in R&D than virtually any other industry, including high-tech industries such as electronics, aerospace and automobiles.
In order to roll out products to end users, pharmaceutical manufacturers leverage large drug wholesalers as the largest channel for product distribution. In the case of prescription pharmaceuticals, roughly three-quarters of pharmaceutical products for people are distributed via wholesalers. Wholesalers then distribute the relevant products to various downstream health care users including hospitals, clinics, health management organizations, retail pharmacies, chain stores and mail-order companies. According to data produced by IMS Health, retail channels (including pharmacies and other stores involved in the dispensation of prescription products) accounted for 55 percent of all dispensed prescription sales in terms of dollar sales in 2008, compared with 16 percent for mail-order pharmacies, 10 percent for non-federal hospitals, 12 percent for clinics, 5 percent for long-term care pharmacies and 1 percent each for home health-care institutions, federal facilities and staff-model health management organizations. However in some instances, manufacturers may bypass the wholesaler and deal directly with downstream end users including pharmacies, health food chain stores and mail-order companies.
Similar to the pharmaceutical industry, the pesticides and fertilizer industry is developing agricultural biotechnology products that focus on improvements to plant and animal traits through genetic pathways. Since patent protections for a number of agricultural chemicals are expiring, pesticide and fertilizer companies may soon face competition for its existing products. In order to roll out new products to end users, the industry is investing more in R&D, along with an increased reliance on expensive technology.
The soap and cleaning product manufacturers are also constantly seeking to adjust or extend their product lines to new customers with unique preferences and needs. One area of focus for the soap and cleaning industry has been the incorporation of fragrances and pleasant0smelling botanical oils to promote healthful living. For example, some soap manufacturers are adding tea tree oil to 100 percent vegetable glycerin bar products. This expansion of product lines has seen rapid growth in the number of specialty products available, usually sold at a higher price point. Within the detergent product segment there has been the move away from powder detergents in

KEMA, Inc. January 2012 39
favor of liquid and tablet detergents. In fact, one of the largest innovations in recent years for this segment has been the introduction of tablets for both dishwashing and clothes washing.
3.3.6 Pricing
Price differentiation is a major competitive advantage for the basic industrial chemicals and the soap and cleaning compound manufacturers. Because of excess manufacturing capacity, pricing of most industrial chemicals has remained at commodity levels, only slightly higher than costs. During much of the 1990s, overall industrial chemical prices were flat. Prices increased in recent years as the cost of energy increased. Since producers generally use the same well-known manufacturing technology, few products can command a premium price. The more basic the product, the more sales depend purely on pricing. For bulky products, like soda ash or phosphates, transportation costs to a customer's location can be a significant factor. Prices for many products are linked to the cost of energy. Since the basic chemicals and soap/cleaning sectors operate with very thin margins, it is expected that they would be motivated to adopt energy efficiency measures that lower operating costs.
For plastics and resin manufacturers, their products compete in a global commodity market where response to demand and supply largely determines prices (e.g., the introduction of new capacity may have an adverse impact on plastics and resin prices). Other variables influencing price include raw material prices, the degree of integration and scale of production, and the level and source of competition.
For pharmaceutical manufacturers, recent years have seen drug manufacturers come under pressure from government and health care organizations to curb escalating health-care costs. With half of the U.S. population participating in some form of managed care program, the downward pricing pressure exerted by managed care organizations (which have significant purchasing power) has had a substantial impact on the revenue earned by various industry participants.
For the pesticide and fertilizer manufacturers, pricing relies heavily on the level of agricultural output and income. In periods of high agricultural income, the demand for agricultural chemicals tends to rise, given that more crops need to be protected. Spot market prices for certain fertilizers reached decade highs in April 2008, due to a combination of strong farmer demand

KEMA, Inc. January 2012 40
and supply constraints.42 Prices have fallen since then, and producers have responded with production cuts. In 2011, prices climbed again, although generally are still below the 2008 peak.43
For soap and cleaning compound manufacturers, pricing is affected by over capacity, increased competition (on both a domestic and global scale), sluggish demand and changes in the product value chain and increasing downstream pressures from major retailers. The existence of a price conscious consumer in recent years, combined with the shift to mass-market distribution has served to keep margins and profits down in recent years. Moreover, the increasing power of dominant retail groups, including the mass merchandisers such as Walmart, has not only served to push down soap and detergent prices via aggressive purchasing tactics, but they have also constrained product price increases through their provision of private label products in competition to those brands produced by industry participants.44
3.4 Economic Factors
3.4.1 Business Cycles
In general, the demand for chemical products depends on the overall strength of the U.S. economy, because most industrial chemicals are used in the manufacture of more-complicated products like fibers, plastics, paints, and paper. Demand for industrial chemicals is more volatile than for many other manufactured products.45 The profitability of individual companies is closely linked to efficient operations, because most products are commodities. Specialty chemicals such as pharmaceuticals, pesticides and soap/cleaning compounds are generally more profitable than basic commodity industrial chemicals.
In contrast to other chemical subsectors, pharmaceuticals have stable demand and supply patterns due to the nature of products supplied, resulting in business cycles with very low volatility. On a general basis, the demand for pharmaceutical products is determined by a
42 U.S. Department of Agriculture, Economic Research Service. 2011. Fertilizer Use and Price, Table 7–Average U.S. Farm Prices of Selected Fertilizers, 1960–2011. Updated May 6, 2011. http://www.ers.usda.gov/Data/FertilizerUse/ 43 Ibid. 44 IBISWorld. 2009. IBISWorld Industry Report, Soap & Cleaning Compound Manufacturing in the US: 32561. August 14, 2009. 45 For example, during the recession of the late 2000s, when total U.S. industrial production was down 2.2 percent, organic chemical production was down nearly 12 percent.

KEMA, Inc. January 2012 41
number of socioeconomic and demographic factors including general levels of disease rates, government health policies, the price of pharmaceutical products, doctors' prescribing patterns and utilization rates. General economic conditions also play a role in that the demand for non-essential drugs, such as herbal/botanical products, is partly determined by household disposable income. It is also interesting to note that in view of the current recessionary economic conditions, growth in the number of prescriptions dispensed during 2008 is expected to be slower relative to the strong growth of recent years as some consumers seek to cutback medical expenses. Pharmaceutical companies are also expected to benefit from the recent federal healthcare reform bill, as an increased number of people will have health insurance.
The pesticide and fertilizer manufacturing sector is particularly subject to seasonal demand patterns with the strongest demand usually occurring during the spring planting season, with a second period of demand then occurring after the fall harvest. The market for various industry products also tends to be cyclical with significant variations in both demand levels and in prices. For instance, demand may increase when the previous year’s crop prices were high, as farmers look to replace soil nutrients after the previous year’s bountiful harvest.
In recent years, a number of industry participants have reported more pronounced levels of seasonality as a result of rising raw material prices. Other factors influencing the performance of the industry include the perception of the community towards agricultural chemicals and their effect on the environment, and changes in agricultural conditions such as weather conditions. For example, in periods of dry weather or drought, crops tend to weaken due to lack of water, so using pesticides can do more harm than good.
For the soap and cleaning compounds industry, changes in economic conditions also influence purchasing patterns. Although soap and cleaning products are regarded as essential items that are purchased on a needs basis, during economic downturns households reduce the range of products they purchase, trade down the value chain and/or also use them more economically.
3.4.2 Availability of Capital and Credit
Most chemical companies have large capital investments in production facilities and spend heavily for maintenance and R&D. The increasing reliance on new technologies and the need for higher levels of investment in research and development has been one of the underlying reasons for the recent spate of mergers and acquisition activity on the global level. This high level of capital intensity also reflects the level of capital resources tied up in chemical manufacturing plants; the cost of building a new world-class facility can often be hundreds of

KEMA, Inc. January 2012 42
millions of dollars. Financial executives negotiate long-term credit agreements, capital placements, and corporate bonds to meet capital investment requirements.
For both the pharmaceutical and pesticide industries, the past two decades saw a steady rise in the level of capital resources required to develop and manufacture increasingly complex products as manufacturers increasingly produce high-cost and high-technology products, such as biological products. Therefore, any move to expand production capacity required significant capital expenditure.
3.5 Regulatory Issues
The chemical industry is subject to a significant number of environmental regulations at federal, state, and local levels. The following sections describe the key regulatory issues facing the chemical industry.
3.5.1 Environmental
The chemical industry must comply with the following environmental laws:
• The Clean Air Act (CAA) regulates air emissions from stationary and mobile sources. The pollutants are defined as particle pollution (often referred to as particulate matter), ground-level ozone, carbon monoxide, sulfur oxides, nitrogen oxides, and lead. Regulated sources are stationary sources or group of stationary sources that emit or have the potential to emit 10 tons per year or more of a hazardous air pollutant or 25 tons per year or more of a combination of hazardous air pollutants. As a group, chemical manufacturers have made significant reductions in their overall air emissions during the last decade. Much of the improvement was due to sizeable investments prompted by a tightening of the rules. Currently, the EPA is preparing to move forward with regulation of greenhouse gases (GHG) under the Clean Air Act, as discussed in Section 3.5.2.
• The Clean Water Act (CWA) establishes the basic structure for regulating discharges of pollutants into the waters of the United States and regulating quality standards for surface waters. Under the CWA, the U.S. EPA has implemented pollution control programs such as setting wastewater standards for industry. The CWA made it unlawful to discharge any pollutant from a point source into navigable waters, unless a permit was obtained.

KEMA, Inc. January 2012 43
• The Resource Conservation and Recovery Act (RCRA) gives the U.S. EPA the authority to control hazardous waste from the cradle-to-grave. This includes the generation, transportation, treatment, storage, and disposal of hazardous waste. RCRA also set forth a framework for the management of non-hazardous solid wastes. The 1986 amendments to RCRA enabled EPA to address environmental problems that could result from underground tanks storing petroleum and other hazardous substances. HSWA—the Federal Hazardous and Solid Waste Amendments—are the 1984 amendments to RCRA that focused on waste minimization and phasing out land disposal of hazardous waste as well as corrective action for releases.
• The Comprehensive Environmental Response, Compensation and Liability Act (CERCLA), also known as Superfund, created a tax on the chemical and petroleum industries and provided broad federal authority to respond directly to releases or threatened releases of hazardous substances that may endanger public health or the environment. CERCLA established prohibitions and requirements concerning closed and abandoned hazardous waste sites and provided for liability of persons responsible for releases of hazardous waste at these sites. The law also established a trust fund to provide for cleanup when no responsible party could be identified.
• The Toxic Substances Control Act (TSCA) provides the EPA with authority to require reporting, record-keeping and testing requirements, and restrictions relating to chemical substances and/or mixtures. Certain substances are generally excluded from TSCA, including, among others, food, drugs, cosmetics and pesticides. TSCA addresses the production, importation, use, and disposal of specific chemicals including polychlorinated biphenyls (PCB), asbestos, radon and lead-based paint. Recently, the EPA has announced principles to strengthen U.S. chemical management laws and is actively working with Congress to reauthorize and modernize TSCA. EPA has also initiated enhancements to their chemical management program, and increased public access to information. The EPA announced in May 2010 the addition of 6,300 chemicals and 3,800 chemical facilities to their publicly accessible database.
• Federal Insecticide, Fungicide and Rodenticide Act (FIFRA) provides EPA with authority to register and assess the risks of all agricultural chemicals. The EPA evaluates the toxicity of the pesticide and its residues, the ecological effects of its use, and assesses the effects of continuous exposure. The information is gathered to determine whether use of the product will create any significant risk to the environment and people. If the risks are too great, the EPA will not approve the registration of the agricultural chemical.

KEMA, Inc. January 2012 44
Responsibility for enforcing environmental laws is distributed between the federal government (usually the U.S. EPA), state agencies, counties and municipalities. In California, regional air districts are charged with developing and enforcing air quality regulations that are more stringent than federal standards. In general, facilities in the chemical industry are long accustomed to complying with existing environmental regulations as part of their normal course of business.
3.5.2 Climate
California Global Warming Solutions Act In 2006, Assembly Bill 32, the Global Warming Solutions Act (AB 32) became the first legislation signed into law in the United States to establish mandatory limits on greenhouse gas emissions. The California Air Resources Board (ARB) was designated as the lead agency tasked with developing the regulatory structure to achieve emissions reductions targets for carbon dioxide (CO2) and other greenhouse gases.46 California facilities that emit more than 25,000 metric tons of CO2 equivalents must report their emissions to the ARB. Chemical facilities which use a large amount of energy are required to report verified GHG emissions.
In January 2009, ARB adopted a Scoping Plan that provides the blueprint for achieving the reductions through a mix of incentives, direct regulatory measures, and market-based compliance mechanisms.
Key elements of the Scoping Plan include:
• Expanding and strengthening existing energy efficiency programs, as well as building and appliance standards
• Developing a California cap-and-trade program that links with other Western Climate Initiative partner programs to create a regional market system
• Establishing targets for transportation-related emissions for regions throughout California, and pursuing policies and incentives to achieve those targets.
46These gasses include methane (CH4), nitrous oxide (N2O), hydrofluorocarbons (HFCs), perfluorocarbons (PFCs), and sulfur hexafluoride (SF6). Since each of these gases’ unique physical properties causes them to have varying heat trapping effects, they are normalized into carbon dioxide equivalents. For example, one metric ton of methane is equivalent to 21 metric tons of CO2 equivalents (CO2e).

KEMA, Inc. January 2012 45
Energy-intensive facilities in the chemical industry in California are likely to be affected by the cap-and-trade program, which was adopted by ARB in 2011.47 After collecting three years of data from the largest emitting industries, the ARB will establish emissions caps. For each business sector, an emissions benchmark will be established, and business will be allowed emissions up to 90 percent of the benchmark (cap) in 2013. Cap and trade requires large emission sources to surrender emissions permits equal to their actual emissions in any given year. The amount of total available permits declines over time, thereby making it more and more expensive to emit greenhouse gas emissions. Emissions permits are tradable among market actors and emissions reductions from non-capped sectors, known as offsets, can also be used for low-cost compliance purposes As California implements AB 32, affected chemicals manufacturers can expect to be treated as capped sources. The implementation of the cap-and-trade under AB 32 has been delayed to 2013, although the state plans to develop the regulatory framework in 2012.
Starting in the first compliance period of 2013, all large industrial facilities that emit over 25,000 metric tons CO2e per year will be required to acquire and hold emissions permits. Starting in the second compliance period of 2015, industrial fuel combustion at facilities with emissions at or below 25,000 metric tons CO2e per year will be included.
For some energy-intensive industrial sources, stringent requirements in California, either through inclusion in a cap-and-trade program or through source specific regulation, have the potential to create a disadvantage for California facilities relative to out-of-state competitors unless those locations have similar requirements. Recent analysis by the California Legislative Analyst suggests that this effect will not be significant for the overall economy. Sectors most affected are likely those with high-energy intensity and significant trade-related activities where increased costs may not be able to be reflected in higher prices.48 Chemicals is one of the identified sectors, although mitigating factors apply in many segments. For example, the industrial gas industry’s largest customers are the petroleum industry, which is likely able to pass along price increases.
47 Cart, Julie. 2011. “California becomes first state to adopt cap-and-trade program,”. Los Angeles Times. October 21, 2011. http://articles.latimes.com/2011/oct/21/local/la-me-cap-trade-20111021 48 Taylor, Mac. 2011. Letter to Honorable Dan Hogue., California Legislative Analyst’s Office. May 13, 2011. http://www.lao.ca.gov/reports/2010/rsrc/ab32_logue/ab32_logue_051310.PDF

KEMA, Inc. January 2012 46
EPA Mandatory Reporting The U.S. EPA issued a rule for mandatory GHG reporting from large emissions sources in the United States. In general, the rule calls for facilities that emit 25,000 metric tons or more of GHG emissions per year to submit annual reports to the EPA. From 85–90 percent of total national U.S. GHG emissions, from approximately 13,000 facilities, are covered by the proposed rule. Large chemical manufacturing plants have sizable emissions, and are required to monitor and report them to the EPA.
EPA Regulation under the Clean Air Act Greenhouse gas emissions are now regulated in the United States under the Clean Air Act. According to the Tailoring Rule,49 GHG permitting requirements will cover for the first time new construction projects that emit GHG emissions of at least 100,000 tons per year (tpy). Modifications at existing facilities that increase GHG emissions by at least 75,000 tpy will be subject to permitting requirements, even if they do not significantly increase emissions of any other pollutant. By 2016, the EPA may lower the threshold to 50,000 tpy.
Under the EPA rulemaking for New Source Review, proposed emissions sources will be required to install best-available control technology. Typically, this means installing energy efficiency equipment. Large sources permitted through the Title V program may have emissions limits on GHG emissions in the future.
3.5.3 Federal Food, Drug and Cosmetic Act
The Food and Drugs Act of 1906 was the first of more than 200 federal laws to protect public health and promote consumer safety. The Federal Food, Drug and Cosmetic Act of 1938 completely overhauled the regulatory provisions for protecting public health, including authorizing the FDA to require proof of safety before the release of new drugs, issue standards for food, and conduct factory inspections.
Today, the FDA is an agency within the U.S. Department of Health and Human Services. The FDA is responsible for assuring the safety and efficacy of veterinary drugs, biological products, medical devices, as well as the safety and security of the nation’s food supply. Within the FDA, the Center for Drug Evaluation and Research (CDER) regulates over-the-counter and prescription drugs, including biological therapeutics and generic drugs. 49 Federal Register. 2010. Environmental Protection Agency: Prevention of Significant Deterioration and Title V Greenhouse Gas Tailoring Rule. Vol. 75, No. 106, June 3, 2010. http://www.gpo.gov/fdsys/pkg/FR-2010-06-03/pdf/2010-11974.pdf#page=1

KEMA, Inc. January 2012 47
3.6 Industry Network
The industry network for this sector provides a list of potential partners for energy efficiency. No single industry group could represent all the various interests across different segments of the chemical industry. Major industry associations promote standards, lobby, market, and provide education and networking opportunities. Companies participate in industry initiatives and groups primarily to promote common interests to the government and the community, which is furthered by creating standards, centralizing common reference materials, training and networking. Below is a brief summary of key industry organizations that California utilities should seek to partner with to get members to adopt more energy efficiency.
• The Chemical Industry Vision2020 Technology Partnership (Vision2020, http://www.chemicalvision2020.org) is an industry-led collaboration in the chemical and allied industries to leverage financial resources and technical expertise. The goal is to accelerate innovation and technology development. Vision2020 identifies R&D priorities and creates a unified voice, which influences federal and corporate R&D investment. Federal R&D funding agencies regularly request and use guidance from Vision2020. Participating companies learn from each other, guest speakers (e.g., utility energy efficiency representatives), and Vision2020's publications as well as at special events.
• American Chemistry Council (ACC, http://www.americanchemistry.com/), formerly known as the Chemical Manufacturers Association, is an industry trade association for American chemical companies. The ACC is in charge of improving the public image of the chemical industry and implemented the Responsible Care program in 1988 to improve the environmental, health, and safety performance of participating companies.
• Green Chemistry Alliance (www.greenchemistryalliance.org), formed because of the passage of California’s Green Chemistry legislation (AB 1879 and SB 509), seeks to work with the state’s Department of Toxics Substances Control in the implementation of these measures. Members include a wide range of industry and trade associations, including the American Chemistry Council, California Paint Council, and the Western States Petroleum Association.
• Society of Chemical Manufacturers and Affiliates (SOCMA, http://www.socma.com/) is an international trade association serving the small- and mid-sized batch chemical manufacturers as an advocacy group. SOCMA also supports its members with programs to maximize commercial and networking opportunities, increase public confidence and influence the passage of appropriate laws and regulations.
• The Pharmaceutical Research and Manufacturers of America (PhRMA, http://www.phrma.org) represents the country’s leading pharmaceutical research and

KEMA, Inc. January 2012 48
biotechnology companies in the United States. PhRMA's mission is to conduct effective advocacy for public policies that encourage discovery of important new medicines for patients by pharmaceutical/biotechnology research companies. PhRMA publishes fact sheets, policy papers, newsletters and yearly industry reports to share with the public news about industry innovations, new medicines and new discoveries.
• The Soap and Detergent Association (SDA) represents the U.S. cleaning products industry and includes the formulators of soaps, detergents, and general cleaning products, companies that supply ingredients and finished packaging for these products and producers of chemicals that are derived from plant and animal fats (oleochemicals). SDA supports programs for research, and participates at the federal, state and local levels in legislative and regulatory activities that may affect the formulation, distribution and disposal of industry products.
• CropLife America is the largest trade organization that represents developers, manufacturers, formulators, and distributors of products for agriculture and pest management in the United States. The member companies produce, sell and distribute crop protection and biotechnology products for safe and affordable food and fiber production. CropLife America was established in 1933, and was originally known as the Agricultural Insecticide and Fungicide Association.
• Compressed Gas Association (www.cganet.com) is dedicated to promoting and developing safe practices and standards in the industrial gas industry. Established in 1913, CGA develops standards and technical information, and provides recommendations for responsible practices in the industry.

KEMA, Inc. January 2012 49
4. Target Technologies / Processes and Energy Efficiency
In this section, we provide an overview of chemical processes and the largest potential points for efficiency improvements in California. Chemical manufacturing is a large industry encompassing a myriad of different production processes, each with its own end-use profile. Broadly speaking from an energy perspective, the main chemical manufacturing stages involve combining feedstocks to achieve specific chemical reactions, and then separating out the desired product. Pharmaceutical and pesticides manufacturing typically includes a primary processing step to produce the active ingredient and then secondary processing to turn the active drugs into products suitable for administration. Improving the conversion, separation and purification processes will have significant impacts on reducing energy use in chemical plants.
Manufacturing and operations will require continual infusion of the newest information and process control technologies to remain competitive in a global market. Engineers are continually developing advanced process control technology to handle the full operating range of a plant, from start-up to shutdown. Computer-based controls can run continuously to handle complex process units and ensure the facility meets product specifications, while eliminating as many process disturbances as possible. Opportunities exist to further optimize the controls for energy efficiency.
The largest efficiency improvements may require large investment in capital and therefore, depend on the lifecycles of plants for upgrades to major equipment. Some chemical plants are at the forefront of plant automation, research and development and new process implementation, but smaller operations especially are likely to have made little or no investment in energy efficiency.
Within the chemical industry, energy efficiency begins with optimizing plant design, and continues with upgrade, retrofit, and maintenance opportunities. Designs and retrofits may include new or more efficient processing, such as recycling process waste heat, non-thermal separation processes and process intensification50 techniques. Typical mechanical improvements such as improved steam generation through energy efficient boilers, more
50 Process intensification is defined as a reduction in the size of equipment or plants through providing chemical processes with the precise environment needed to enhance throughputs, reaction rates, and heat and mass transfer.

KEMA, Inc. January 2012 50
efficient air compressor operation, and adding adjustable speed drives to a plant’s electric motors can certainly reap dividends in this industry.
4.1 Energy Use
With thousands of processes used to produce the more than 70,000 products of the chemical industry, it is not surprising that manufacturing energy use varies significantly among different segments of the industry. Within individual industry segments, energy use is closely tied to product configurations and whether fuels are used as a raw material (feedstock).
The basic chemical industry includes both organic and inorganic chemicals. Organic chemicals begin with raw materials that contain hydrocarbons, such as crude-oil derivatives, natural gas, and coal. These plants are often located near petroleum refineries to ensure an adequate supply of these materials. Although the manufacture of organic chemicals is an important and large industry in the United States, California’s basic chemicals industry is dominated by the production of inorganic products. Inorganic chemicals are produced from a variety of feedstocks, including methane for the fertilizer industry, air for the production of many industrial gases, and minerals for the production of acids and bases.
Pharmaceutical products are mostly based on organic feedstocks, but some inorganic materials may be used. Intermediate chemical products (such as glycerol, proteins and polypeptides) are the primary feedstock used to manufacture pharmaceuticals. Pharmaceutical substances are produced via chemical synthesis, extraction, fermentation or a combination of these products. Soap manufacturers use fats and oils as a principal feedstock, while industrial cleaning products may utilize chemicals such as chlorine, phosphoric acid, sulfuric acid, and nitric acid. Both continuous and batch processes are common, with spray drying used to convert soap into pellets for shaping and for powder detergents.
Figure 11 summarizes the energy flows associated with the U.S. chemical industry, which includes both electricity and fuels used for plant operations, as well as petroleum-based feedstocks.51 The purchased fuels are used by chemical plants to generate steam, generate electricity and as a direct fuel for boilers and heaters. Electricity also is generated onsite at many chemical facilities, typically with gas-fueled combined heat and power, also called
51. U.S. DOE, Industrial Technologies Program. 2010. Manufacturing Energy and Carbon Footprint, Sector: Chemicals. http://www1.eere.energy.gov/industry/pdfs/chemicals_footprint.PDF

KEMA, Inc. January 2012 51
cogeneration.52 The energy is then distributed around the plant and used in process heating/cooling, electrochemical and motor applications. The energy footprints represent the national chemical industry, and not the California-specific distribution of chemical manufacturing plants. (For instance, organic chemical manufacturing is a significant industry nationally using natural gas as a feedstock and distillation processes, but does not have a large presence in California.)
Figure 11: Chemical Industry Energy Footprint
Source: U.S. DOE53
52 Cogeneration is the simultaneous production and electricity and heat, typically through the combustion of natural gas. 53 U.S. DOE, Industrial Technologies Program. 2010. Manufacturing Energy and Carbon Footprint, Sector: Chemicals.

KEMA, Inc. January 2012 52
Nationwide, chemical plants consume 1,489 trillion British thermal units (Btu) to generate electricity and are second only to pulp and paper mills as the largest industrial cogenerators in the manufacturing sector. Electricity produced by cogeneration often provides a competitive advantage to purchased electricity, since efficient cogeneration systems can operate at greater than 90 percent thermal efficiency compared to 30–35 percent efficiency for direct electricity generation. If pertinent regulations allow, any excess electricity can be sold back to the utility, providing additional cost benefits to the chemical plants. Most cogenerating capacity is found in four segments: plastics materials and resins, organic chemicals, inorganic chemicals, and fertilizers. In California, cogeneration is most prevalent at petrochemical plants and less common at other types of chemical plants.
More detail is provided below in Figure 12, which shows typical equipment end uses where the energy is ultimately utilized. The purchased fuels are mostly used in boilers, combined heat and power, heating and some process cooling. The purchased electricity primarily drives motor driven equipment, including pumps, fans, air compressors, materials handling and refrigeration.

KEMA, Inc. January 2012 53
Figure 12: Chemical Industry Energy Footprint—Usage in Specific Equipment
Source: U.S. DOE54
For pharmaceutical plants, heating, ventilation and air conditioning (HVAC) is typically the most important energy end use. Research and development and bulk manufacturing are the largest energy consuming activities in the pharmaceutical industry. Table 5 provides an estimated energy consumption breakdown for the U.S. pharmaceutical industry as a whole, categorized by major activity area (listed in rows) and end use (listed in columns).
54 Ibid.

KEMA, Inc. January 2012 54
Table 5: Pharmaceutical Industry Energy Use
Source: Lawrence Berkeley National Laboratory55
* Percentages for water heating, space heating, cooling, refrigeration and ventilation are derived from U.S. DOE’s 1999 Commercial Building Energy Consumption Survey (CBECS).
55 Lawrence Berkeley National Laboratory. 2005. Energy Efficiency Improvement and Cost Saving Opportunities for the Pharmaceutical Industry: An ENERGY STAR® Guide for Energy and Plant Managers. LBNL-57260. September 2005

KEMA, Inc. January 2012 55
4.2 Energy Consumption by End Use and Energy Efficiency Potential
Figure 13 and Figure 14 display electricity consumption for the chemical industry (NAIC 325) and are based on national industry data from the 2006 Manufacturing Energy Consumption Survey (MECS).
Figure 13: Electric Consumption, Chemicals Industry
Source: 2006 Manufacturing Energy Consumption Survey56
Figure 13 highlights the fact that the overwhelming majority of electric consumption (85 percent) by the chemical industry is directly related to the chemical product process. Non-process energy use, like facility lighting and HVAC, accounts for a small fraction (15 percent) of the industry’s electricity consumption.
56 U.S. Energy Information Administration. 2009. 2006 Energy Consumption by Manufacturers. June 2009. http://www.eia.gov/emeu/mecs/mecs2006/2006tables.html

KEMA, Inc. January 2012 56
Figure 14: Electric Consumption by End Use, Chemicals Industry
Source: 2006 Manufacturing Energy Consumption Survey57
Figure 14 expands on the high-level consumption information presented in Figure 13 and shows electric consumption by end use for the chemical industry. Over 60 percent of total electric consumption in the chemical industry can be attributed to machine drives as defined by MECS. Using information from prior research,58,59 machine-drive consumption can be divided into motors (23 percent), pumps (29 percent), fans (7 percent), and compressed air (3 percent). Facility lighting (4 percent) and HVAC (7 percent) constitute the majority of non-process electric consumption in the chemical industry.
57 Ibid. 58KEMA and Lawrence Berkeley National Laboratory, 2005. California Statewide Industrial Sector Energy Efficiency Potential Study. Prepared for Pacific Gas and Electric Company. 59 XENERGY. 1998. United States Industrial Electric Motor Systems Market Opportunities Assessment. Prepared for Oak Ridge National Laboratory and DOE’s Office of Industrial Technologies. December 1998.

KEMA, Inc. January 2012 57
Figure 15: Electric Energy Efficiency Potential by End-Use
Source: 2006 Manufacturing Energy Consumption Survey60
Figure 15 presents the electric energy efficiency potential by end use for the chemical industry (NAICS 325). The largest potential for electric energy savings lies in pumps, HVAC, and motors, accounting for 44 percent, 21 percent, and 20 percent, respectively, of the total energy savings potential in the chemical industry. Given that pumps and motors are also the two largest electric end uses within the chemicals industry, exploring related efficiency measures presents the greatest opportunity for large-scale energy and utility bill savings.
Figure 16 breaks down the end-use consumption of natural gas for the chemical industry. The majority of natural gas usage within the chemical industry is dedicated to indirect boiler fuel (59 percent) and process heating (28 percent).
60 U.S. Energy Information Administration. 2009. 2006 Energy Consumption by Manufacturers. June 2009.

KEMA, Inc. January 2012 58
Figure 16: Gas Consumption by End-Use
Source: 2006 Manufacturing Energy Consumption Survey61
61 Ibid.

KEMA, Inc. January 2012 59
Figure 17: Gas Energy Efficiency Potential
Source: 2006 Manufacturing Energy Consumption Survey62
Figure 17 displays the energy efficiency potential related to natural gas use within the chemical industry (NAICS 325). Energy efficiency measures associated with improving the boiler and heat-transfer processes make up the overwhelming majority (81 percent) of the potential to save natural gas in the chemical industry.
4.3 Production Processes
Transforming raw materials into usable chemical products requires chemical, physical, and biological separation and synthesis processes that consume large amounts of energy for heating, cooling, or electrical power. For the U.S. chemical industry, separations play a critical role and account for 40 to 70 percent of both capital and operation costs across the country. The most widely used separation process is distillation, which accounts for as much as 40 percent of the industry's energy use.63 These percentages are heavily skewed by the intensive
62 Ibid. 63U.S. Energy Information Administration. 2008. Chemicals Industry Analysis Brief, Technologies and Equipment. Updated January 7, 2008. http://www.eia.gov/emeu/mecs/iab98/chemicals/tech.html

KEMA, Inc. January 2012 60
organic chemicals industry in the United States, mostly located in the South. In California, chemical synthesis is a more common process, especially for the basic inorganic chemical and pharmaceutical sector. Throughout the state and nationally, however, process heat is integral and supports nearly all chemical operations.64 Table 6 summarizes the different chemical industry processes, including purpose and specific examples of technologies.
The efficiency of any individual process used in chemicals manufacture is dependent on optimizing a number of process variables (e.g., temperature, pressure, flowrate) that may be constrained by basic physical and chemical limitations. Chemical processing is further complicated by the fact that a series of unit operations is often required to reach the final end product. For example, ammonia is produced by the Haber process, which converts air and methane to ammonia and carbon dioxide. In this process, methane and air must first be passed through a steam reformer to yield hydrogen and nitrogen gas along with carbon dioxide. These gases must then be passed through a separator to remove the carbon dioxide.
Once this is accomplished, the hydrogen and nitrogen gases are sent to a catalytic reactor where they require about four passes over a catalyst to attain a yield of about 88 percent ammonia. The energy efficiency of this process depends on the combined efficiency of all these operations, as well as the operating conditions within individual plant sites.
Table 6: Chemical Industry Specific Technologies
Unit Operation Purpose Major Technologies
Separations Separate products, remove contaminants, dry solids
Distillation, extraction, absorption, crystallization, evaporation, drying, steam stripping or cracking, membranes
Chemical Synthesis
Synthesize chemicals, polymers, and resins
Catalytic reactions (oxidation, hydrogenation, alkylation) and polymerization (addition or suspension), hydration, hydrolysis, electrolysis
Process Heating Drive chemical reactions and separations; can be direct or indirect
Direct heating: furnaces, kilns, dryers Indirect heating: boilers, heat exchangersHeat transfer fluids: steam, boiling water, organic vapors, water, oils, and air
Electrolysis Electrolytic production of chemicals
Electrolytic cells (diaphragm, mercury, membrane)
64 Ibid.

KEMA, Inc. January 2012 61
One of the chemical industry’s biggest—and most misunderstood—business opportunities is the recovery of income lost to energy waste. One estimate suggests that 37 percent of fuel and electricity delivered to chemical industry facilities was lost in combustion, distribution, and energy conversion activities.65 The energy and carbon footprint diagrams (Figure 11 and Figure 12) identify specific losses from generation of steam, electricity, process and non-process losses. Waste-process heat alone is responsible for 7 percent of the energy delivered.
4.3.1 Separations
Separation processes are an important and fundamental activity for the chemical industry and involve the separation of a mixture of substances into two or more distinct components, which differ in chemical or physical properties. These differences are utilized in the actual separation processes and can be broadly grouped into the following types of separations:
• Solubility-based. Solubility is the property of a solid, liquid or gaseous chemical substance to dissolve in a liquid solvent to form a homogenous solution. Some chemicals may dissolve, while others will precipitate out in a given solvent. Crystallization, extraction, decanting and precipitation are separation processes that are based on differences in solubility.
• Boiling-point based. Liquids will boil and turn into vapor at different temperatures. For instance, water will boil at 100°C, while wood alcohol (methanol) will boil at 65°C. Distillation is a common separation process that uses this property, Drying is also based on the removal of liquid from a solid by vaporization.
• Density-based. Density is the mass per unit volume of a given substance. Each element and compound has a unique density and this property can be utilized to separate substances through sedimentation (e.g., gravity separation) and centrifugal forcing (e.g., centrifugation).
• Particle-size. Substances, particularly in the solid state, can differ in physical size of the particles. Filtration is a separation process that retains solids and allows fluids to pass through a physical barrier. Membranes can be used to separate substances at the molecular level.
65 Russell, C. “Use it or Lose it: Chemical Industry Energy Consumption.” ChemicalProcessing.com. 2005 http://www.chemicalprocessing.com/articles/2005/501.html

KEMA, Inc. January 2012 62
Other properties may be exploited for separation, including magnetic, electric, and melting point characteristics. Several separation processes may be utilized to isolate the desired final products. Separation processes often require heating and/or cooling, as well as mechanical energy (e.g., motors, pumps) to physically move products from one area to another.
4.3.2 Chemical Synthesis
Chemical synthesis may be used throughout the chemical industry, and is particularly critical for the pharmaceutical industry. For instance, antihistamines, central nervous system stimulants and hormones are produced by chemical synthesis. As shown in Figure 18, there are five primary stages in chemical synthesis: (1) reaction, (2) separation, (3) crystallization, (4) purification and (5) drying. These series of reactions require heating and cooling at various stages.
In the chemical reaction process, raw materials are fed into a series of reactor vessels, in which temperature and pressure are carefully controlled. Following the chemical reaction, the desired products are separated from the by-products through one or more separation processes, including crystallization.
Purification follows separation and continues to purify the desired substance to a specific concentration level. Drying is the final step in chemical synthesis to evaporate solvents from solids; the solvents may then be condensed for reuse or disposal. The pharmaceutical industry, specifically, uses several different types of dryers including spray dryer, tray dryers, rotary dryers, drum or tumble dryers, or pressure filter dryers. The dryer type is selected based on the process requirements.

KEMA, Inc. January 2012 63
Figure 18: Simplified Chemical Synthesis Diagram
Source: Lawrence Berkeley National Laboratory66
4.3.3 Process Heaters
Process heat from direct-fired heaters and boiler steam is necessary for nearly every process in the chemical plant. In California, natural gas is typically the heating source, although electric boilers and heaters may be used. Most of the energy consumed in chemicals manufacture is used in heaters and boilers that produce steam.
In direct contact operations, steam is used as a process fluid or a stripping medium, for example, removing more volatile components from a liquid. In some applications steam may be used in vacuum ejectors to produce a vacuum. Steam is also used for drying, evaporation, and other processes where indirect heating is required. For example, spray dryers use a hot vapor to turn liquids into dehydrated powders for substances ranging from antibiotics to powdered detergents to paint pigments.
Process heaters are used extensively to supply heat to raise the temperature of feed streams to a level necessary for chemical reaction or separation. Maximum fluid temperatures reached by process heaters are about 950oF (510oC). Air pre-heaters are heat exchangers that recover heat in the flue gas by heating up combustion air.
66 Lawrence Berkeley National Laboratory. 2005. Energy Efficiency Improvement and Cost Saving Opportunities for the Pharmaceutical Industry: An ENERGY STAR® Guide for Energy and Plant Managers. LBNL-57260. September 2005

KEMA, Inc. January 2012 64
Furnaces are used in some cases for the incineration of effluent streams containing air pollutants, toxic chemicals, or hazardous wastes. In these specialized waste-destruction furnaces, temperatures can be much higher than in typical boilers. Excess heat from these systems may be recovered by heat exchange.
The importance of process heat to chemical manufacturing is the reason for the prevalence of combined heat and power (cogeneration) systems in the industry. Cogeneration plants are significantly more efficient than standard power plants because chemical plants can utilize the waste heat for chemical processes. In addition, transmission losses are minimized when cogeneration systems are located at or near the chemical plant.
4.4 Current Practices
The U.S. chemical industry has made significant improvements in energy efficiency over the last few decades. As shown in Figure 19, energy consumed for heat and power per unit of output declined by more than 39 percent between 1974 and 1995, a trend that was precipitated by the oil crises of 1973. Improvements in efficiency remained relatively flat from the late 1980s to 1995, primarily because of the availability of inexpensive energy for heat, power, and feedstocks. The figures reflect trends in fuels purchased for heat and power, and do not reflect trends in feedstock consumption. Data recently released by the U.S. DOE from the 2006 manufacturing energy consumption survey shows a trend towards reduced consumption. Most recently, from 2002 to 2006, U.S. chemical industry fuel consumption decreased from 3,769 to 3,195 trillion Btu.

KEMA, Inc. January 2012 65
Figure 19: Energy Intensity Trends Related to Heat and Power in the U.S. Chemical Industry, 1974–1997
Source: U.S. DOE 67
Much of the improved efficiency achieved over the 1980s and 1990s resulted from aggressive energy management and housekeeping programs instituted during the early 1970s, which are now an integral and established part of operations management at many firms. Many of these housekeeping improvements were focused on steam generation and distribution and operating practices for fueled reactors and fired heaters.
Figure 20 shows how the pharmaceutical industry and its electricity consumption has grown in the United States since the late 1980s.68 Data recently released by the DOE from the 2006
67 U.S. Department of Energy, Office of Industrial Technologies. 2000. Energy and Environmental Profile of the U.S. Chemical Industry. Prepared by Energetics, Inc. May 2000. 68Lawrence Berkeley National Laboratory. 2005. Energy Efficiency Improvement and Cost Saving Opportunities for the Pharmaceutical Industry: An ENERGY STAR® Guide for Energy and Plant Managers. LBNL-57260. September 2005
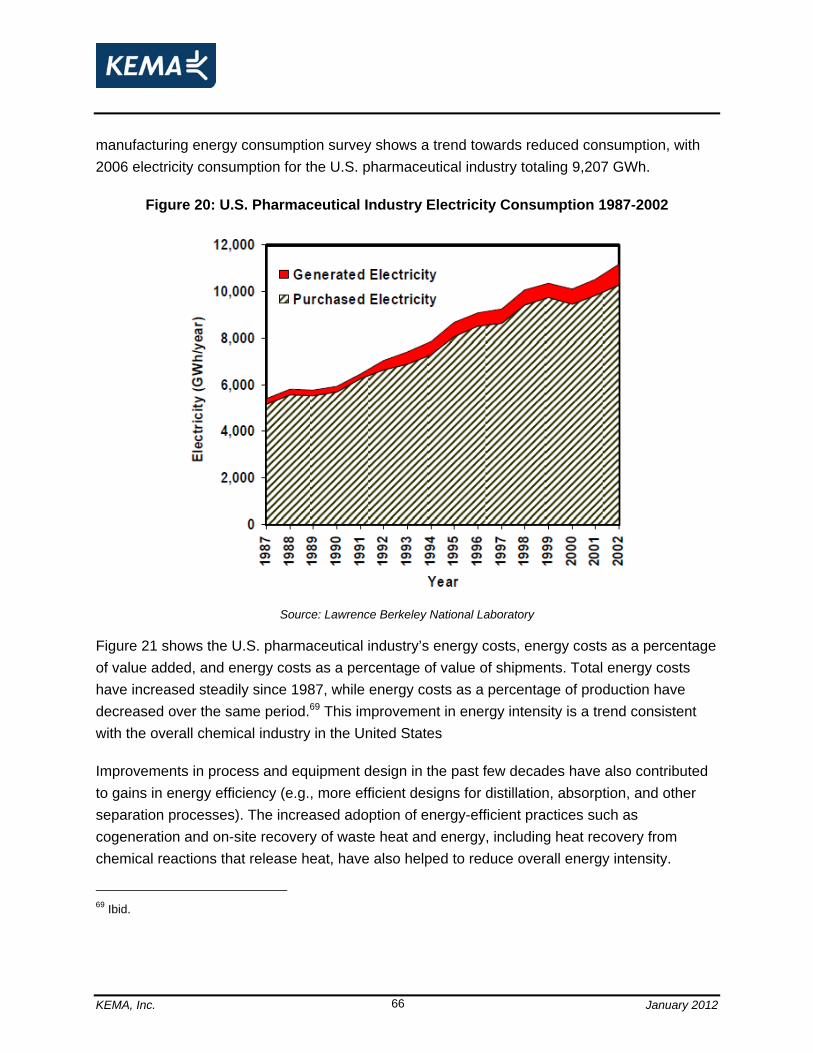
KEMA, Inc. January 2012 66
manufacturing energy consumption survey shows a trend towards reduced consumption, with 2006 electricity consumption for the U.S. pharmaceutical industry totaling 9,207 GWh.
Figure 20: U.S. Pharmaceutical Industry Electricity Consumption 1987-2002
Source: Lawrence Berkeley National Laboratory
Figure 21 shows the U.S. pharmaceutical industry’s energy costs, energy costs as a percentage of value added, and energy costs as a percentage of value of shipments. Total energy costs have increased steadily since 1987, while energy costs as a percentage of production have decreased over the same period.69 This improvement in energy intensity is a trend consistent with the overall chemical industry in the United States
Improvements in process and equipment design in the past few decades have also contributed to gains in energy efficiency (e.g., more efficient designs for distillation, absorption, and other separation processes). The increased adoption of energy-efficient practices such as cogeneration and on-site recovery of waste heat and energy, including heat recovery from chemical reactions that release heat, have also helped to reduce overall energy intensity.
69 Ibid.

KEMA, Inc. January 2012 67
The increasing complexities of environmental compliance, changing product configurations, and growing competition from resource-rich developing countries are all challenges to the industry. These challenges can be met in part through improved efficiency, the use of innovative processing routes, and decreased dependence on petroleum-based feedstocks.
Figure 21: U.S. Pharmaceutical Industry Energy Intensity 1987-2002
Source: Lawrence Berkeley National Laboratory70
4.4.1 Efficiency Improvements
A number of general technologies can contribute to increased efficiency and productivity in manufacturing. These include advanced control systems, process optimization, heat recovery, and specific equipment improvements, particularly improving pump systems, compressed air
70 Ibid.

KEMA, Inc. January 2012 68
systems, and motor drives. Historically, the most frequently cited in the chemical industry is the use of adjustable-speed motors (roughly 41 percent of the industry).71
A comprehensive energy management program can systematically identify cost-effective energy efficiency opportunities. As described in section 5, manufacturers may conduct a number of energy management activities to improve the efficiency or reduce the cost of energy use. Executive leadership controls capital expenditures, and those businesses that are organized to take advantage of energy efficiency opportunities will be most likely to adopt them.72 For example, DuPont established an Energy Center of Competency to inform their energy efficiency efforts. The leader of the center stated that DuPont has decreased their energy use by 18 percent since 1990 while increasing production by 47 percent. They established a Bold Energy Plan in 2008 to target a 5 percent annual decrease in energy use. After one year, they generated 338 projects to meet their goal, with 79 percent of the projects requiring little or no spending.73 An aggressive goal such as 5 percent annual improvement must allow a full range of projects, including capital, retrofit, behavior, process optimization, and maintenance.
Below are energy efficiency improvement opportunities applicable to the chemical industry in California, and particularly to the pharmaceutical industry, the largest energy user.
Compressed air systems. Compressed air is required in many applications in the chemical industry, both as a feedstock and for manufacturing processes, such as vacuum cleaning systems and spray systems for pharmaceuticals. In pharmaceutical facilities, compressed air often comes in contact with products, such as when products are coated or packaged for consumption. Compressed air generally represents one of the most inefficient uses of energy in a plant because of poor system efficiency. Typically, the efficiency of a compressed air system is only around 10 percent (from compressed air generation to end use). Because of this inefficiency, the use of compressed air should be minimized, optimizing use through proper sizing, design, controls and operation.
71 U.S. Energy Information Administration. 2008. Chemicals Industry Analysis Brief, Technologies and Equipment, Generic Technologies. Updated January 7, 2008. http://www.eia.gov/emeu/mecs/iab98/chemicals/generic.html 72 California Institute for Energy and Environment. 2009. Behavioral Assumptions Underlying Energy Efficiency Programs for Businesses. January 2009. http://uc-ciee.org/downloads/ba_ee_prog_bus_wp.PDF 73 DuPont. 2010. Improving Energy Efficiency & Profitability with DuPont. Informational Brochure. http://www2.dupont.com/DuPont_Sustainable_Solutions/en_US/assets/downloads/DuPont_Energy_Efficiency_Case_Study.PDF

KEMA, Inc. January 2012 69
• System efficiency improvements: Adding additional compressors should be considered only after a complete system evaluation. In many cases, compressed air system efficiency can be managed and reconfigured to operate more efficiently without purchasing additional compressors. Compressed air system service providers offer integrated services both for system assessments and for ongoing system maintenance needs, alleviating the need to contact several separate firms. The Compressed Air Challenge® (http://www.compressedairchallenge.org) offers free web-based guidance for selecting the right integrated service provider, as well as guidelines defining walk-through evaluations, system assessments, and fully instrumented system audits.
• Proper maintenance and retrocommissioning. Inadequate maintenance can lower compression efficiency and increase air leakage or pressure variability, as well as lead to increased operating temperatures, poor moisture control, and excessive contamination. Fixing leaks is one of the most frequently recommended measures from industrial audits. Ongoing retrocommissioning can assess the need for compressed air and optimize the system.
Fume hoods. Fume hoods are commonly installed in R&D laboratory facilities, to capture, contain and exhaust hazardous gases generated by laboratory activities and industrial processes. The energy required to heat and cool make-up air for laboratory fume hoods can account for a significant fraction of laboratory HVAC energy consumption. Fume hoods are often operated at high air-exchange rates in an effort to guarantee the safety of occupants in the facility. However, significant energy savings can often be realized by using low-flow fume hoods where appropriate and variable flow exhaust systems.
Other opportunities include restricting the fume hood sash openings to reduce the volumetric flow rate and facilitate lower energy consumption in variable flow hoods. A fume hood’s sash opening can be limited either by restricting the vertical sash movement or by using a horizontal sash to block the hood’s entrance. Furthermore, sashes on unattended fume hoods should remain closed whenever possible. Variable-air-volume hoods can offer considerable energy savings compared to constant air volume (CAV) hoods.74
Clean rooms. A clean room can be defined as an enclosed area in which ambient conditions—including airborne particles, temperature, noise, humidity, air pressure, air motion, vibration, and
74 For more information, refer to Lawrence Berkeley National Laboratory’s report Energy Efficiency Improvement and Cost Saving Opportunities for the Pharmaceutical Industry: An ENERGY STAR® Guide for Energy and Plant Managers, report number LBNL-57260.

KEMA, Inc. January 2012 70
lighting—are strictly controlled. A significant portion of floor space in pharmaceutical and biotechnology facilities can be occupied by clean rooms. In general, the largest consumers of energy in clean rooms are the HVAC system (e.g., systems for chilled water, hot water, and steam) and process machinery. In the U.S. pharmaceutical industry, proper clean-room filtration and pressure differentials have to be maintained to meet strict U.S. FDA requirements.
• Reduced recirculation air change rates. The rate of clean room air recirculation can sometimes be reduced while still meeting quality control and regulatory standards.
• Improved air filtration quality and efficiency. High-efficiency particulate air (HEPA) filters and ultra-low penetration air (ULPA) filters are commonly used in the pharmaceutical industry to filter make-up and re-circulated air. The adoption of alternative filter technologies might allow for lower energy consumption.
• Declassification. Occasionally, a clean room is classified at a higher cleanliness level than is necessary, either due to conservative design or to a change in production characteristics over time. A simple efficiency measure would be to declassify them from a higher class of cleanliness to a lower class of cleanliness, when possible.
Heating, ventilation and cooling (HVAC). Different spaces and building uses require different HVAC applications. For manufacturing facilities and some laboratory facilities, HVAC components may be closely supervised by state and federal agencies, including the U.S. FDA. As a result of such regulation, energy efficiency measures that affect the work environment must undergo a review to ensure that proposed modifications do not affect regulatory compliance.
• Energy efficiency system design. The greatest opportunities for energy efficient HVAC systems exist at the design stage for new industrial facilities. By sizing equipment properly and including an energy efficient building envelope and HVAC equipment, a chemical manufacturer can minimize the energy consumption and operational costs of its plant’s HVAC systems.
• Retrocommissioning. Before replacing HVAC system components to improve energy efficiency, facility managers should consider retrocommissioning to verify that existing HVAC systems are operating as originally intended. Retrocommissioning involves a detailed assessment of existing equipment performance and maintenance procedures.
Motors and pumps. Motors and pumps are used throughout the chemical industry to operate HVAC systems, drive laboratory and/or bulk manufacturing equipment, and for transport of materials in the formulation and packaging stages. The pumping of coolants, such as glycol or

KEMA, Inc. January 2012 71
chilled water, is common in chemical manufacturing facilities and is a significant source of energy consumption. It is important to note that initial costs for motors and pumps are only a fraction of the life cycle costs of the systems. Energy costs (and sometimes operations and maintenance costs) are much more important in the lifetime costs of the motor and pump systems.
One of the largest opportunities to reduce energy usage in an existing system is to identify motors and pumps that do not need to operate at constant load. Variable-speed drives (VSD) better match motor and pump speed to fluctuating load requirements, and may be appropriate in a large array of applications.
Unit Operations. As described above, the chemical industry employs a range of processes to separate, heat, crystallize, and dry products. Each unit operation can be optimized to use less energy for the specific task. For example, dryer temperature at each stage of the operation can may be optimized to minimize steam requirements.
Lighting. Lighting in the chemical sector is mostly for overall ambient lighting throughout manufacturing, storage and office spaces, and as low-bay and task lighting for specific areas. High-intensity discharge lighting, such as metal halide, high-pressure sodium and mercury vapor lamps, is commonly used for ambient lighting applications. Fluorescent, compact fluorescent and incandescent lights are typically used for task lighting in offices.
The most effective strategy to reduce energy usage associated with lighting is a systems approach toward meeting lighting needs, such as combining energy efficient fixtures and lamps with motion sensors, daylighting sensors and a programmable lighting control system. Other opportunities include turning off lights in unoccupied spaces, and high-efficiency exit sign lamps (e.g., light-emitting diode).
Process heat. Given the importance of process heat to the chemical industry, new technologies and operating practices can offer significant savings opportunities. These may include:
• Efficient operating practices. This includes operating heating equipment at close to full load or design load capacity, avoiding delays between cycles, and minimizing the weight of load supports, such as fixtures, trays and baskets.
• Maintenance. Clean heat-transfer surfaces frequently to maintain high heat transfer efficiency in heat exchangers and other systems that use electrical heating elements, coils, radiant tubes, and so on.

KEMA, Inc. January 2012 72
• Equipment. Ensure that furnace, oven walls and doors are insulated to minimize heat losses and help keep temperatures low outside the equipment. Reduce or eliminate water-cooled parts inside a furnace or oven.
• Pressure reduction. Steam pressure reduction is the lowering of the steam pressure at the boiler plant by means of the pressure setting on the boiler plant master control. Most of the energy savings benefits occur in the high-pressure section of the steam system.
For heaters and boilers that are fueled by natural gas, there are additional opportunities to recover heat from exhaust or flue gasses for use in heating air, water and oils, or in preheating charge material going into a furnace or oven. Combustion air may also be pre-heated by using a recuperator or a regenerator to recover the heat of exhaust gases from a furnace or oven.
Process optimization. Chemical plant engineers and research chemists have numerous other ideas about ways to improve efficiency and save money in the chemical industry. Since chemical plants are complex, and involve proprietary technologies, applicable opportunities will vary significant from plant to plant. Individual facilities should pursue further research on the economics and technological feasibility of measures for their own unique production processes.
4.4.2 Capital Expenditures for Energy Efficiency
In general, the chemical industry is not building many new plants in the United States. According to the American Chemical Council (ACC), “Of the 125 world-scale chemical plants now under construction around the world, 50 are being built in China, but only one in the U.S.” Most respondents (almost one-third of the total) to a recent chemical processing survey, on costs that most threaten the competitiveness of plants, put energy first; feedstock/raw material costs came in a relatively close second, with other factors far behind. The ACC also noted that U.S. natural gas prices are some of the highest in the world, which obviously impacts operating costs at existing plants within an industry that is the nation’s largest consumer of natural gas.75
According to the American Council for an Energy Efficient Economy (ACEEE),76 energy efficiency improvements are most cost-effective when industrial facilities are already making a large investment in a new plant or plant upgrade. These industry investments coincide with plant operational cycles. Operational cycles reflect needs for maintenance due to heavy wear, 75 Spear, M. “Chemical makers play the power game.” ChemicalProcessing.com. 2005 http://www.chemicalprocessing.com/articles/2005/533.html 76 American Council for an Energy-Efficient Economy. 2008. Trends in Industrial Investment Decision Making. Report Number IE081. September 2008.

KEMA, Inc. January 2012 73
changes in product mix, and incorporation of modernization a facility. Routine outages for maintenance often occur between cycles. These brief outages focus on system reliability, problems and seldom involve major equipment change outs. The cycles can vary in length, determined by rates of technology and product changes and the need for major systems maintenance. For instance, a basic chemical manufacturing plant interval can run a decade or more, while a high-tech facility (e.g., pharmaceutical) facility may have an interval of only a few years.
Returns on investments, however, need to be relatively high to justify expenditures for large capital improvements. Other critical drivers for investment in new equipment include capital availability, production effects, market conditions and innovation. Additional considerations include lost production time, reliability and environmental issues.

KEMA, Inc. January 2012 74
5. Market Intervention
This section presents the results from primary research conducted in two phases: an industry leader meeting via Webinar and one-on-one interviews conducted with stakeholders in the chemicals industries, particularly pharmaceuticals and plastics. Industry leader meeting attendees included energy managers from various manufacturers and representatives from KEMA, ACEEE, SCE, and PG&E. KEMA also conducted three one-on-one interviews with major energy users in California to solicit input from those unable to attend the industry leader meeting and confirm feedback from the meeting. Interviewees included corporate energy managers and plant operations staff. KEMA focused primarily on the largest customers in this sector; many of the top California users were interested in participating in the research. This response rate is higher than KEMA observed in other sectors. Our insights and conclusions are presented below.
5.1 Effective Utility Programming
Generally, respondents were not familiar with utility-sponsored energy efficiency programs and services. However, they expressed support for and had good experiences with utility programs in the past. In particular, they appreciated the expertise provided by vendors. The following provides more details on these findings.
• Vendors. Interviewed customers cited satisfaction with vendors, who they were often approached to install energy efficiency equipment. They appreciate the flexibility to outsource rebate paperwork, calculations and other administrative details and the reduced burden on staff time.
• Existing Utility Programs. Many respondents participated in incentive programs as well as demand response and enthusiastically supported the utility’s efforts to assist in energy efficiency. While utility programs will not be the primary factor in the decision for large capital projects, continuing to offer rebate programs will help overcome barriers to small- to medium-sized projects.
5.2 Drivers of Energy Decision-Making
The following sections describe chemicals manufacturers’ approach to energy efficiency projects, including planning, financing and decision-making criteria.

KEMA, Inc. January 2012 75
5.2.1 Energy Efficiency Planning
Cost savings is the single largest driver of energy efficiency projects among customers interviewed. However, with energy costs making a minimal impact on product costs, it is often difficult for manufacturers to justify spending money on energy efficiency projects. In the pharmaceutical industry in particular, energy costs consistently make up merely 1–3 percent of total cost. Furthermore, due to the nature of the industry, pharmaceutical companies must run validated facilities which are subject to inspection by the FDA. Processes are often proprietary, and any changes to the equipment are subject to intense scrutiny. Several companies participating in the research, especially larger multinational pharmaceuticals, indicated that corporate sustainability goals, such as Roche’s Directive K18, and government partnership programs, such as the EPA’s Energy Star and Climate Leaders Program, are large drivers for energy efficiency changes. In subsectors where energy is a relatively minimal overall cost, corporate green and efficiency initiatives take precedence over cost as motivation for efficiency.
Utility representatives initiate many energy efficiency projects by engaging customers, particularly smaller or less-energy-efficiency savvy companies with fewer resources and staff, into investigating opportunities. Larger and/or more sophisticated energy users are more likely to enact corporate sustainability goals, which may be essential to moving projects forward. These users tend to develop projects internally, and then investigate utility program incentives. One national fertilizer manufacturer interviewed indicated that they employed a national corporate energy manager who regularly held internal calls between plants to discuss issues and cases as well as an annual best practices symposium. Another medical supply manufacturer responded that they perform internal audits to identify areas. They then collaborate with their utility to put a business case together to present to the capital projects committee.
Table 7 displays manufacturers’ self-reported ability to undertake energy efficiency practices or investments. Most companies rated themselves highly, meaning they have already implemented many energy savings retrofits and practices. One manufacturer in the plastics industry declined to rate his company, but indicated that it was not a high priority.
Even in companies that pursue energy efficiency, the resources are often spread thin. Many facilities have energy managers, but they are often concerned with the amount of dedicated manpower needed to enact energy efficiency. A plastic-bottle manufacturer indicated that because they were focused on opening a new facility at the moment, there was no time or

KEMA, Inc. January 2012 76
manpower to focus on energy projects. The utilities can identify these opportunities to provide support for customers.
Table 7: Self-Reported Manufacturer's Ability to Undertake Energy Efficiency Investments, Using Scale 1–577
Manufacturer Type Self-Reported Rating Notes
Biological Product (except Diagnostic) Manufacturing
1 We are always looking for ways to reduce kWh; kW reduction is less important.
Nitrogenous Fertilizer Manufacturing
2.5 We are always looking for ways to reduce costs but EE is not the primary determinant for equipment decisions.
Plastic Bottles Not Stated Low for now. We are trying to get a new facility up and running and we are not really thinking about energy conservation.
Customers are very interested in technical help that utilities can provide. One fertilizer manufacturer was extremely happy about their participation in a special utility program which allowed them to have an energy engineer on staff from the utility. This was a great help, as they had limited resources.
Timing must be taken into account when working with companies to enact energy efficiency projects. Budget cycles typically go out two or three years in advance, so planning ahead and collaborating with energy managers is especially important.
Pharmaceutical manufacturing is by nature a highly regulated industry. It is guided by the principles of “good manufacturing practice (GMP),” which outline specifically the aspects of production and testing of pharmaceutical products. As such, manufacturing processes are clearly defined and controlled, which limits opportunities for innovation. All critical processes are validated to ensure consistency and compliance with specifications. Due to these considerations, it is easiest to enact energy efficiency and sustainability into the master specifications when designing a new facility rather than retrofitting. There is ample opportunity for utilities to collaborate with facility managers and vendors to ensure energy efficiency in the initial design of a facility.
77 Scale: 1 = invests heavily in energy efficiency. 5= energy efficiency is a low priority

KEMA, Inc. January 2012 77
5.2.2 Investment Priorities
The most important investment priority criteria reported are impact on operations and project payback period. Because many pharmaceutical and medical product manufacturers run validated facilities that are strictly regulated by the FDA, facility retrofits are often a laborious process. As such, plant managers are often interested in smaller retrofits such as lighting and VSD projects.
Customers reported that the standard two to three year payback period has generally been maintained during this economic downturn, although one plastics manufacturer indicated that it had decreased to 18 months. One manufacturer also qualified a return on investment of 14 percent or better for capital projects.
Other important criteria are: staff availability to pursue projects, particularly at manufacturers that lack dedicated energy management staff, and corporate energy policy. In the fertilizer manufacturing industry, a customer indicated that their corporate energy plan dictated selectively replacing pumps with premium efficiency pumps.
5.2.3 Project Financing
Easier access to capital depends on project cost and a shorter payback period. The shorter the payback period, the fewer barriers a company will have in place towards accessing project financing. Companies that have formally named energy as a priority have typically provided more access to capital. One pharmaceutical company we spoke to has developed a corporate calculator for return on investment and net present value that takes into account energy rates and escalation over time. This increases the accuracy of the energy accounting, and demonstrates the firm’s awareness of energy investments.
Many energy efficiency equipment improvements in the industrial sector involve large capital investments, and limited capital availability is a key factor limiting increases in energy efficiency. Many targeted projects cost many millions of dollars, so even facilities with assigned capital budgets are severely constrained. One facility manager responded that once an energy goal is met, there is much less incentive and capital available to do other projects.
5.2.4 Barriers to Energy Efficiency Investment
One of the most significant barriers to energy efficiency is related to the complexity of chemical manufacturing facilities. In companies without a clear program in place, opportunities for

KEMA, Inc. January 2012 78
improvement may be known but may not be promoted or implemented because of organizational and market barriers. Below are some key barriers that arose in the interviews and forum:
• Good Manufacturing Practices: Pharmaceutical manufacturing is bound by the principles of “good manufacturing practice (GMP)” guidelines, which clearly define and control manufacturing processes in order to ensure the quality of pharmaceutical products. Due to FDA regulations that require facilities to maintain validated status, it is difficult for manufacturers to renovate those portions of their facilities and processes that are validated. Opportunities may exist outside those validated processes, such as repair of compressor air leaks.
• Production concerns: For most facility and plant managers, keeping equipment and systems operational while meeting quality requirements and avoiding production disruptions is the highest priority. Since energy costs are typically a small portion of total production cost for many California chemical manufacturers, other cost considerations related to production take precedent.
• Limited staff time and hassle factor: Staffing limitations were another key barrier to increased energy efficiency. Very few facilities we interviewed had a dedicated energy manager on staff, and all respondents indicated that their staff was spread thin. While most facility managers want to stay as efficient as possible, staff’s number one priority is to keep the facility operational.
• Information: While industrial customers typically have access to the information they need to make energy efficiency improvements, customer knowledge is mostly directed towards the big-ticket equipment that are the primary energy users. Customers indicated that they did not feel like they were familiar with the utilities’ program offerings.
• Cost effectiveness: Most industrial customers have severe cost-effectiveness criteria. The recent economic recession has had a significant impact on acceptable payback period for projects that are designed to save costs. Industrial customers generally have payback cutoffs of less than four years, with some as low as one to two years.
• Environmental costs and concerns: Many industrial facilities must comply with stringent environmental regulations; energy efficiency projects must conform with these system requirements. Requirements to minimize air and waste emissions can require additional process energy use.
• Proprietary technology: For certain industrial segments, proprietary technology and processes can hamper information sharing of energy efficient opportunities. This is especially true within the pesticides and pharmaceutical manufacturing sectors.
KEMA, Inc. January 2012 79
5.3 Cycles of Innovation
Companies that set goals for sustainability or carbon reduction are more open to innovate with technology or energy management systems. Many of the companies with these goals are based in Europe or other countries outside the United States. A prime example is Swiss-based Roche Pharmaceutical’s corporate directive K18, an aggressive policy designed to ensure that efficient use of energy within its site is given a high priority and is guided by its social and environmental commitment as well as regulatory and financial requirements. It includes the consideration of life-cycle cost with any investment opportunity. Companies with sustainability or energy efficiency goals are also more likely to participate in government and utility forums that focus in these areas. Roche, which has facilities with subsidiaries and affiliates within throughout California, also participates in the EPA’s Climate Leaders Program. In addition to energy goals, many facilities also commit to achieve ISO 14000 compliance or certification. These are a set of standards that guide the design and implementation of an effective environmental management system.
The nature of the chemicals industry dictates that much of the production is proprietary and must meet tight quality standards. This has restricted innovation in process technologies for existing products. To retrofit and reduce, for example, the number of air changes in a clean room per hour at a pharmaceutical facility, the facility must go through the whole process with the FDA to prove that the facility can still meet the same standards. This discourages facilities from performing revisions that are not absolutely necessary, including energy upgrades. The sheer number of requirements to become re-validated makes it extremely unlikely that these renovations will occur.
In California, the rate of innovation seems to be the greatest in the pharmaceutical industry, likely due to the relative newness of the industry and its inherent amount of R&D. These customers indicated that they were adopting innovative technologies such as fuel cells and condensation recovery. One customer had started using disposable bag bioreactors, which are convenient and reduce energy consumption by avoiding the need to clean huge steel tanks. Though the motivation was convenience, it was ultimately energy efficient.
Facilities managers pointed out that in the equipment procurement or replacement process, vendors must be specifically told to incorporate energy efficient technologies, which may pose issues later when the facilities are forced to retrofit it themselves. There is room for utilities to work with the large vendors, especially the controls and automation companies, to incorporate levels of energy efficiency in equipment.

KEMA, Inc. January 2012 80
In addition to word of mouth from other facilities managers within their company, customers reported that industry trade groups play a big role in the dissemination of information. Talking and networking at trade conferences provide invaluable opportunities for understanding key issues and standard practices. Specific groups include: Industrial Environmental Association; Association of Energy Engineers; E-Source; and Facility Management Organization.
5.4 Customer Assessment
The following sections describe customers’ rating of utility program awareness, experience, and satisfaction.
5.4.1 Utility Program Awareness
One-on-one customer responses when asked about utility program familiarity ranged from “not very much” to “yes.” This sentiment was also echoed in the industry leaders’ forum, where respondents said that they only heard about utility programs through being approached by vendors or from other facilities managers. They also expressed difficulty navigating utilities’ websites to find information about their programs.
Direct contact with utility account representatives ranged from talking once every few months to only talking when there is a power problem or new rebates available. Each respondent indicated that they were satisfied with the amount of communication.
Overall, customers indicated that they were not very aware of their utility’s program offerings. In particular, for the large companies with multiple facilities and central energy managers, keeping up with specific offerings from any given utility is challenging. One customer said that only 10 percent of his knowledge of programs came directly from their account representative, the other 90 percent came from past experience, meaning it was likely outdated. Other customers also agreed that they only found information from the utility representatives when they went after it themselves. Their primary sources of program information were vendors and colleagues. There is ample opportunity for the utilities to be more proactive and responsive in disseminating program information.
5.4.2 Customers’ Experience
Though they expressed a lack of knowledge about current utility programs, customers were uniformly satisfied with the ones with which they did participate. The utility programs met expectations in terms of cost and energy savings. Participants especially praised third-party

KEMA, Inc. January 2012 81
help with rebate applications and savings estimations as well as audits and project identification. Vendors play a big role in dissemination of information and identification of possible projects, and they alleviate the strain on facility managers of filling out paperwork. However, customers indicated a slight inherent mistrust in vendors’ sales pitches. Utilities have an opportunity to provide a highly technical and trustworthy perspective to customers, as well as to engage customers and vendors in future discussions.
Customers cited recent energy efficiency projects: upgrading/replacing lighting systems to light-emitting diode lighting or other efficient lighting; installing variable-speed drives on centrifugal chillers and pumps; combined heat and power; and replacing worn or outdated process equipment. These recent projects indicate that companies have not addressed all short payback projects, and new energy efficiency projects can be found.
One customer participated in a utility program through which they had a utility staff engineer on site to identify opportunities for energy efficient upgrades. The customer felt that the engineer did not necessarily always make the right recommendations because he did not factor in some facility-specific criteria, but overall was grateful to have this program because resources were spread too thin otherwise.
Though customers were generally satisfied with the utilities’ programs, they addressed what they thought were a few gaps in the offerings. They would like the utilities to offer steam efficiency assessments and help on gas measures. They would also like sub-meters to verify savings and performance, and they felt that there is also not much money available for air compressors of 100 horsepower or less.

KEMA, Inc. January 2012 82
6. Next Steps and Recommendations
This investigation has revealed that chemicals customers are willing to consider new approaches, including a comprehensive approach to addressing their energy needs, beyond simply retrofitting equipment. Some suggested elements of that approach are presented below, and additional research focused on the feasibility of each of these recommendations would be prudent. Two key components of a successful effort are the participation of regulatory staff in the development of the options and CPUC recognition of the utilities' role in changes to a customer's policies and procedures regarding energy.
Our research suggests a number of opportunities for both program implementation and program evaluation. Because the chemicals industry is so broad, the most important takeaway is that the utilities must gain a better understanding of the highly specialized markets in which their customers operate. The difference between the manufacture of commodity chemicals and specialty chemicals is especially important. Different forms of pharmaceutical and medical manufacturing make up the majority of the customers in California, and their highly regulated operations define their priorities and decisions. This is followed closely by industrial gas manufacturers, which fall under the umbrella of commodity chemicals, who make up another significant portion of chemicals customers in California but which operate in an inherently different type of market.
Of the chemicals manufacturers, pharmaceutical and medical manufacturers are the largest energy consuming industrial subsector in California, as well as the most specialized and regulated. Along with pesticides and fertilizers, the manufacture of these high-value niche specialty chemicals are generally categorized by high R&D expenses, as well as use of biotechnology and other types of patented technologies. Separate recommendations are developed for the pharmaceutical industry as a reflection of both their significance in California and their distinctive needs.
Pharmaceuticals are restricted by GMP guidelines which outline specifically the aspects of production and testing of pharmaceutical products. As such, manufacturing processes are clearly defined and controlled, which limits opportunities for innovation. All critical processes, including building standards, are validated by the FDA to ensure consistency and compliance with specifications. Therefore, the current opportunities for energy efficiency lie not in facility upgrades, necessarily, but in changes to management, measurement, maintenance, and optimization approaches. For example, a facility may elect to install an energy management

KEMA, Inc. January 2012 83
system or tweak their equipment maintenance schedule—building optimization changes that will not affect the manufacturing processes but will lower energy use.
6.1 Next Steps—Pharmaceuticals
1. Build on Customer’s Corporate Goals and Programs. The most sophisticated customers have established strong internal energy efficiency programs and publicly proclaimed corporate energy goals. With energy a small portion of overall cost, the appeal to corporate image and requirements can be a big driver. Utility offerings that further enable the energy-savvy customers to achieve savings have low market barriers. For example, utilities could offer technical and management assistance for companies seeking to achieve ISO certification.
2. Identify Planned Upgrades and Facility Openings and Document Associated Efficiency Opportunities. The simplest way to enact energy efficiency is to make sure it is built into the master specifications of a plant. This is especially true for pharmaceutical manufacturers, for which, once the process is validated by the FDA, it is extremely difficult to make changes to their processes. Utilities should work with corporations to identify opportunities and timing to provide the necessary support.
3. Develop Innovative Pilots to Suit Differing Customer Needs. Highly sophisticated customers are potential candidates for programs leading to certification under ISO 140001/50001 or the DOE’s Superior Energy Performance. One customer indicated satisfaction with their utility’s program that installed an engineer at their facility. This benefits the facility and allows the utility to better understand energy use in these specific industries.
4. Integrate Energy Efficiency with Regulatory Requirements. As part of large-scale projects, utilities should consider bringing in permitting specialists to help move energy efficiency projects forward, if budget and cost-effectiveness will allow such service. In particular for pharmaceutical manufacturers, regulatory requirements and validation can be a significant barrier for retrofits or capital projects that even slightly change plant operations. Utility support to help to overcome this barrier would be well received.
5. Encourage Non-Process Building Improvements. For pharmaceutical companies that must run facilities validated by the FDA, utilities should encourage improvements that do not directly involve process technologies but rather will decrease overall building energy use. Improvements in controls, automation and operations can be made to systems outside the process, such as compressed air, chillers, and steam boilers. Facility managers can also focus on optimizing equipment maintenance practices or

KEMA, Inc. January 2012 84
implementing an energy management system, or enacting other management and optimization changes.
6.2 Next Steps—Other Chemicals
1. Build on Customer’s Corporate Goals and Programs. The most sophisticated customers, have established strong internal energy efficiency programs and publicly proclaimed corporate energy goals. Utility offerings that further enable the energy-savvy customers to achieve savings have low market barriers. For example, utilities could offer technical and management assistance for companies seeking to achieve ISO certification.
2. Build on Existing Support. In general, customers interviewed praised California utilities’ energy programs and are interested in continuing the conversation. These customers recognized the benefits of energy and cost savings, and access to information about new programs. Companies also appreciate when utilities reach out to trade associations and speak at their meetings.
3. Support Coordination among Vendors, Companies and Utilities. Facility staff can be encouraged to specifically instruct vendors to incorporate energy efficiency into the design of new or replacement equipment. Companies and utilities may work with vendors to encourage the use of innovative technologies such as disposable bag bioreactors.
4. Encourage Low-cost/No-cost Improvements. In this economic climate, companies producing commodity products are most receptive to projects with the shortest possible payback. Programs that focus on low- and no-cost items can engage customers with limited financial options. Programs that focus on behavioral changes can foster culture changes that lead to continual improvement. This is especially important for smaller companies who may not have a dedicated energy team on staff.
5. Create Forums for Discussion and Knowledge Sharing. Customers interviewed would appreciate forums and workshops for sharing success stories and best practices. Customers are wary of sales pitches and would like utilities to provide unbiased and highly technical assistance. Utilities may engage trade organizations to do this and to help customers understand new technologies. Specific trade associations include: Industrial Environmental Association; Association of Energy Engineers; E-Source; and Facility Management Association.
6. Engage the Uninterested in Measurement. One of the biggest challenges in the industrial sector is getting participation. One opportunity for engaging the less interested

KEMA, Inc. January 2012 85
customers is to focus on the measurement of their electricity, and assist them in breaking down their bill to specific processes or unit operations. Then the company can seek opportunities specific to those operations.

KEMA, Inc. January 2012 86
7. References
American Council for an Energy Efficient Economy. 2009. Barriers to energy efficiency investments and energy management in the U.S. industrial sector. October 20, 2009.
American Council for an Energy Efficient Economy. 2009. Trends in Industrial Energy Efficiency Programs: Today’s Leaders and Directions for the Future. September.
American Council for an Energy Efficient Economy. 2011 National Symposium on Market Transformation. http://www.aceee.org/conferences/2011/mt/program
American Council for an Energy-Efficient Economy. 2008. Trends in Industrial Investment Decision Making. Report Number IE081. September 2008.
California Institute for Energy and Environment. 2009. Behavioral Assumptions Underlying Energy Efficiency Programs for Businesses. January 2009. http://uc-ciee.org/downloads/ba_ee_prog_bus_wp.PDF
California Public Utilities Commission. 2011. CA Energy Efficiency Strategic Plan, January 2011 Update. h ttp://www.cpuc.ca.gov/NR/rdonlyres/A54B59C2-D571-440D-9477-3363726F573A/0/CAEnergyEfficiencyStrategicPlan_Jan2011.PDF
Cart, Julie. 2011. “California becomes first state to adopt cap-and-trade program,” Los Angeles Times. October 21, 2011. http://articles.latimes.com/2011/oct/21/local/la-me-cap-trade-20111021
Chittum, A., R. Elliott, and N. Kaufman. 2009. Trends in Industrial Energy Efficiency Programs: Today’s Leaders and Directions for the Future. American Council for an Energy Efficient Economy, Report IE091. September 2009.
Datamonitor. 2009. Global Commodity Chemicals, Industry Profile. Reference Code 0199-2023. April 2009
DuPont. 2010. Improving Energy Efficiency & Profitability with DuPont. Informational Brochure. http://www2.dupont.com/DuPont_Sustainable_Solutions/en_US/assets/downloads/DuPont_Energy_Efficiency_Case_Study.PDF
Farm & Ranch Guide. 2005. “Cuphea: New crop designed to replace imported oils.” FarmandRanchGuide.com. Posted October 13, 2005. 2005. http://www.farmandranchguide.com/news/regional/cuphea-new-crop-designed-to-replace-imported-oils/article_7d22d5e4-81ab-561e-be88-95acfccfc970.html
Federal Register. 2010. Environmental Protection Agency: Prevention of Significant Deterioration and Title V Greenhouse Gas Tailoring Rule. Vol. 75, No. 106, June 3, 2010. http://www.gpo.gov/fdsys/pkg/FR-2010-06-03/pdf/2010-11974.pdf#page=1

KEMA, Inc. January 2012 87
Galitsky, C., Chang S., Worrell E. and E. Masanet. “Energy Efficiency Improvement and Cost Saving Opportunities for the Pharmaceutical Industry: An ENERGY STAR® Guide for Energy and Plant Managers.” Lawrence Berkeley National Laboratory, sponsored by the U.S. Environmental Protection Agency. September 2005.
High Beam Business. Chemicals and Allied Products, NEC SIC 5169, Industry Report. http://business.highbeam.com/industry-reports/wholesale/chemicals-allied-products-not-elsewhere-classified
IBISWorld. 2009. IBISWorld Industry Report, Soap & Cleaning Compound Manufacturing in the US: 32561. August 14, 2009.
IBISWorld. IBISWorld Industry Report, Paint Manufacturing in the US: 32551. March 31, 2009.
IBISWorld. IBISWorld Industry Report, Pesticide Manufacturing in the US: 32532. May 27, 2009.
IBISWorld. IBISWorld Industry Report, Pharmaceutical & Medicine Manufacturing in the US: 32541. November 2, 2009.
IBISWorld. IBISWorld Industry Report, Plastic, Resin & Rubber Manufacturing in the US: 32521. April 27, 2009.
KEMA and Lawrence Berkeley National Laboratory, 2005. California Statewide Industrial Sector Energy Efficiency Potential Study - Draft Report. Prepared for Pacific Gas and Electric Company.
KEMA. 2008. Strategic Industrial Report for PG&E.
Lawrence Berkeley National Laboratory. 2005. Energy Efficiency Improvement and Cost Saving Opportunities for the Pharmaceutical Industry: An ENERGY STAR® Guide for Energy and Plant Managers. LBNL-57260. September 2005
Lawrence Berkeley National Laboratory. 2010. Evaluation of Efficiency Activities in the Industrial Sector Undertaken in Response to Greenhouse Gas Emission Reduction Targets. Report Number LBNL-3551E. April 2010.
McKane, Aimee, Lawrence Berkeley Laboratory, 2011. Presentation at the ACEEE Market Transformation Conference, Piloting Energy Management Standards for the U.S and the Globe. http://www.aceee.org/conferences/2011/mt/program
McKinsey & Co. 2009. Unlocking Energy Efficiency in the U.S. Economy. July. http://www.mckinsey.com/clientservice/electricpowernaturalgas/downloads/US_energy_efficiency_exc_summary.PDF
Mergent. 2008. North America Chemicals Sectors: A Company and Industry Analysis. December 2008.

KEMA, Inc. January 2012 88
Mergent. 2009. North America Pharmaceuticals Sectors: A Company and Industry Analysis. June 2009.
Nadel, Steven. 2011. Program Introduction. (Presentation, ACEEE 2011 National Symposium on Market Transformation, Washington DC, April 10–12, 2011). http://www.aceee.org/files/pdf/conferences/mt/2011/Introduction%20-%20Steve%20Nadel.PDF
National Academy of Sciences. 2010. Real Prospects for Energy Efficiency in the United States. (National Academies Press: Washington, D.C.)
Navigant. 2010. Kaizen Blitz Pilot, Report One. Prepared for Energy Trust of Oregon. October 2010 http://www.affiliatedrecon.com/studies/OR/Energy_Trust/General/ETO-Kaizen-Blitz-Pilot.PDF
Northwest Energy Efficiency Alliance. Continuous Improvement for Industry website. http://www.energyimprovement.org/index.html
Puget Sound Energy. 2010 Business Energy Management, Resource Conservation Manager Program. February 2010. http://www.pse.com/savingsandenergycenter/ForBusinesses/Documents/3462_RCM.PDF
Purdue University. Undated. The Pesticide Marketplace. http://www.ppp.purdue.edu/Pubs/ppp-71.pdf
Quinn, Jim. 2009. Introduction to the Industrial Technologies Program. Save Energy Now Series Webinar. January 15. http://www1.eere.energy.gov/industry/pdfs/webcast_2009-0115_introtoitp.PDF
RNCOS, Industry Research Solutions. 2008. “Global Biotech Drugs Sales Grew Double Pharma Sales.” Posted August 07, 2008 http://www.rncos.com/Blog/report_list.php?year=http://www.rncos.com/Blog/blog_report.php&month=08&blog_pagename=Global-Biotech-Drugs-Sales-Grew-Double-than-Pharma-Sales
Russell, C. “Use it or Lose it: Chemical Industry Energy Consumption.” ChemicalProcessing.com. 2005 http://www.chemicalprocessing.com/articles/2005/501.html
Russell, C. 2008. The Industrial Energy Harvest: Managing Energy from the Top Down. Publisher: Energy Pathfinder, LLC. May 26, 2008.
Russell, C. 2010. North American Energy Audit Program Best Practices, Lessons, Challenges and Recommendations. Baltimore, MD: Energy Pathfinder Management Consulting, LLC., July 19, 2010.

KEMA, Inc. January 2012 89
Savitz, et al.2009. DOE Industrial Technologies Program 2008 Peer Review. http://www1.eere.energy.gov/industry/about/pdfs/itp_peerreview_report2008.PDF
Spear, M. “Chemical makers play the power game.” ChemicalProcessing.com. 2005 http://www.chemicalprocessing.com/articles/2005/533.html
Staff Reporter. 2005. “P&G to make more use of palm oil.” Cosmetics design-europe.com. Posted October 5, 2005. http://www.cosmeticsdesign-europe.com/Business-Financial/P-G-to-make-more-use-of-palm-oil
Taylor, Mac. 2011. Letter to Honorable Dan Hogue. California Legislative Analyst’s Office. May 13, 2011. http://www.lao.ca.gov/reports/2010/rsrc/ab32_logue/ab32_logue_051310.PDF
The World Bank. “Pharmaceuticals Manufacturing.” Chap. III, Project Guidelines, Industry Sector Guidelines. Pollution Prevention and Abatement Handbook 1998, Toward Cleaner Production. Report Number 19128. April 1999.
Thomson Reuters Point Carbon. 2011. California Emissions in 2010 Down by 11%. August http://www.pointcarbon.com/aboutus/pressroom/1.1564622
U. S. Council for Energy-Efficient Manufacturing. 2010. Superior Energy Performance. http://www.superiorenergyperformance.net/pdfs/SEP_Cert_Framework.PDF
U.S. Census Bureau, 2008. Energy Consumption, by End-Use Sector. http://www.census.gov/compendia/statab/2010/tables/10s0892.xls
U.S. Census Bureau, American FactFinder. 2010. 2008 Annual Survey of Manufacturers. March 30, 2010. http://factfinder.census.gov/servlet/IBQTable?_bm=y&-ds_name=AM0831GS101
U.S. Department of Agriculture, Economic Research Service. 2011. Fertilizer Use and Price, Table 7–Average U.S. Farm Prices of Selected Fertilizers, 1960–2011. Updated May 6, 2011. http://www.ers.usda.gov/Data/FertilizerUse/
U.S. Department of Energy, Energy Efficiency and Renewable Energy. 2010. Energy Technology Solutions, Public-Private Partnerships Transforming Industry. December 2010. http://www1.eere.energy.gov/industry/pdfs/itp_successes.PDF
U.S. Department of Energy, Energy Efficiency and Renewable Energy, Industrial Technologies Program. 2007. Reduce Natural Gas Use in Your Industrial Process Heating Systems. Informational Brochure, DOE/GO-102007-2413. September 2007
U.S. Department of Energy, Energy Efficiency and Renewable Energy, State and Regional Partnerships. 2011. http://www1.eere.energy.gov/industry/states/state_activities/map_new.asp?stid=CA

KEMA, Inc. January 2012 90
U.S. Department of Energy, Energy Efficiency and Renewable Energy, Industrial Technologies Program. 2003. “Neville Chemical Company: Management Pursues Five Projects Following Plant-Wide Energy-Efficiency Assessment.” Chemicals: Best Practices Plant-Wide Assessment Case Study. DOE/GO-102003-1666. July 2003. http://www1.eere.energy.gov/industry/bestpractices/pdfs/ch_cs_neville_chemical_company.PDF
U.S. Department of Energy, Energy Efficiency and Renewable Energy, Industrial Technologies Program. 2002. Combined Heat & Power: Cost Reduction Strategies. Factsheet, January 2002. http://www1.eere.energy.gov/industry/glass/pdfs/chp.PDF
U.S. Department of Energy, Industrial Technologies Program. 2010. Manufacturing Energy and Carbon Footprint, Sector: Chemicals. http://www1.eere.energy.gov/industry/pdfs/chemicals_footprint.PDF
U.S. Department of Energy, Office of Industrial Technologies. 2000. Energy and Environmental Profile of the U.S. Chemical Industry. Prepared by Energetics, Inc. May 2000.
U.S. Department of Energy. 2008. Combined Heat and Power: Effective Solutions for a Sustainable Future. Prepared by Oak Ridge National Laboratory, ORNL/TM-2008/224, December 2008.
U.S. Department of Energy. 2011. State Energy Consumption Estimates 1960 through 2009. DOE/EIA-0214(2009). June 2011. http://205.254.135.7/state/seds/sep_use/notes/use_print2009.PDF
U.S. Energy Information Administration. 2001. 1998 Energy Consumption by Manufacturers. http://www.eia.gov/emeu/mecs/mecs98/datatables/contents.html
U.S. Energy Information Administration. 2008. Chemicals Industry Analysis Brief, Technologies and Equipment, Generic Technologies. Updated January 7, 2008. http://www.eia.gov/emeu/mecs/iab98/chemicals/generic.html
U.S. Energy Information Administration. 2009. 2006 Energy Consumption by Manufacturers. June 2009.
Wisconsin Focus on Energy, Industrial Program. Practical Energy Management tool. http://www.wifocusonenergy.com/page.jsp?pageId=368
XENERGY. 1998. United States Industrial Electric Motor Systems Market Opportunities Assessment. Prepared for Oak Ridge National Laboratory and DOE’s Office of Industrial Technologies. December 1998.
Zhang, J. and N. Patel. The Dynamics of California’s Biotechnology Industry. (San Francisco: Public Policy Institute of California, 2005).

KEMA, Inc. January 2012 A-1
A. ATTACHMENTS
Draft Chemicals and Plastics Industrial Research Forums: Question Set Interview Guide

KEMA, Inc. January 2012 A-2
Draft Chemicals and Plastics Industrial Research Forums: Question Set Introduction:
• Introduce KEMA • Go over the project and the objectives • Go around the room or make introductions via telephone.: Tell us about your job. How
do you contribute to the decisions around energy in your organization? Section 1: What drives decision-making for energy? Who initiates ideas for projects? How does energy fit in with key priorities in your industry? (For KEMA forum leader: list priorities identified in each report here and prompt discussion as required. Typically, priorities are safety, quality, meeting regulations, cost, competition.
1. Where does energy rank in the management and operations of your business? Would your executive management agree with this ranking of importance?
a. In your knowledge of the industry, is energy efficiency an integral part of strategic planning and risk assessment? Why or why not? If yes, in what ways? If not, what are other factors that are more important?
b. Generally speaking, what proportion are energy costs relative to your operating costs? Do you see this proportion increasing in the future? By how much?
2. How have energy use patterns changed over the past 10 years? What drives the growth of energy use?
3. What drives investment in energy efficiency in the chemical industry in general? In the plastics industry?
4. What are the main opportunities for your organizations to save energy?
a. Behavioral, operations? (i.e., Management systems, preventative/predictive maintenance, Smart Mfr. – use of sensors, controls, , EMS, process optimization including EE)
b. Retrofits and equipment upgrades? (Heat recovery, minimizing loss at generation, improving transmission at contact to electrodes, and minimizing heat loss in the furnace due to conductivity of the electrodes, and water jackets to keep contact heads cool.)
c. Process upgrades? (major changes, such as new melters, major equipment conversion)

KEMA, Inc. January 2012 A-3
5. What are the primary barriers to adoption of these opportunities?
6. Regarding capital and maintenance investments at your organization (i.e. major capital projects of any type, including mid-sized retrofits):
a. How is energy efficiency financed? Operating budget vs. capital budget. b. How difficult is it to acquire capital for investment? Does the industry have
alternative or innovative ways of raising capital? (i.e., private partnerships) c. How aware are you of IOU programs to help you manage your energy? Their
technical support? Their incentives?
7. Would you say it is typical or not for firms to solicit input from employees at various levels and departments into investment decision making? If not typical, does it happen at all? If so, in what way(s)?
8. For major investment decisions, what is the typical process and timing from idea to start
of implementation?
9. How are investment priorities determined?
a. What are your investment criteria? What is the typical and shortest payback period needed to make an efficiency upgrade that requires capital investment attractive?
b. How do you determine which project to invest in? How does management determine a project is worthwhile? What are the key deciding criteria to move forward on a project? (e.g. regulatory, safety, cost, increased production capacity, improved quality, new products, etc). How would you rank these criteria in terms of influencing how projects are prioritized?
c. If the project could include energy efficiency improvements, do you involve your utility?
10. How has the recession/recovery affected your energy use? More, less or about the same? Any shift in types of fuels used?
Section 2: Cycle of innovation. What kinds of changes or innovations would cause you to retool or rebuild? Examples? (KEMA: list factors of innovation in chemicals and plastics: Changes in induction melting technology, new products, heat recovery, regulations).

KEMA, Inc. January 2012 A-4
11. How mature is the industry infrastructure in regards to age of equipment and systems? Do you foresee a need for substantial upgrades in the future? About how long? Near-term? Long-term?
12. What types of efficiency investments have been popular in the past ten years?
a. Energy Management Systems and process control optimization
b. Process and product optimization – feeds, rates, heat input, combustion process, etc
c. New products or processes
d. Steam projects- efficient boilers, dryers, kilns, leak repairs
e. Electric loads: VFDs, efficient motors
f. Heat recovery
g. Air compressor optimization
13. What do you foresee the trend will be (regarding efficiency investments) in the future?
14. What organizations would you point to as particularly innovative? Why do you see these organizations as innovative, what are they doing that makes them innovative? (i.e. vendors? Utility engineers, consultants?)
15. What internal needs are shaping innovation? a. New products, Product improvements, b. New processes, c. Quality, cost, reliability, safety
16. What external factors drive innovation that effect energy use? a. Fuel prices b. Carbon trading c. Regulations and legal issues
17. (for companies operating in California) Do you foresee the implementation of AB-32 or other upcoming regulations will make a difference in your operations? Do you see that this will change how you manage energy?
18. How do your organizations access the latest information on energy efficiency
technology?
19. If not mentioned, probe for comments on the following:
a. Do you foresee more efforts to increase self-generation to service your own electricity demand?

KEMA, Inc. January 2012 A-5
b. Validate the trends in innovation in operations such as; storage to facilitate load-shifting; plant optimization; improvements in optimization technology beyond SCADA
Section 3: Experience with Utility Programs and Networks of Expertise
20. What roles do others (e.g. contractors, consultant, etc.) play in moving EE projects forward?
21. Do you partner with the utility? Do you see the utility as a partner? What kind of
resources and assistance do you look for from the utility? Is there more they could be doing to help you manage your energy use? What else should they be doing?
22. Have you participated in any energy efficiency or management programs offered by either the Department of Energy or your utility? Why or why not? Did the program address your needs? Would you participate again? Why or why not?
23. What would encourage your company’s management to sign up for energy efficiency or demand response programs? Any past examples of either participation or non-participation and why?

KEMA, Inc. January 2012 A-6
Interview Guide Section 1: Introduction
Hello. My name is [Interviewer Name] calling from KEMA Inc., an energy consulting firm. Your utility [Pacific Gas & Electric or Southern California Edison] has hired KEMA to conduct research to improve their industrial energy efficiency programs in the cement sector. You have been identified as someone knowledgeable at your company about energy efficiency decisions and participation in utility energy efficiency programs. Is this correct? [If no, ask for a colleague referral. If yes, start the interview questions below.]
First, I’d like to ask you about what drives decision-making in energy efficiency first, then ask about your thoughts on your utility’s energy efficiency programs. Your responses are confidential. This interview will take approximately 30 minutes.
Section 2: What Drives Energy Efficiency Decision-Making?
1. What does energy efficiency mean at your company? 2. On a scale of one to ten, with 1 being the highest and 5 being the lowest, How would
you describe your company’s commitment to implementing energy efficiency practices or investments? (where 1 = invests heavily in energy efficiency or your company has taken all or nearly all cost-effective actions to reduce energy costs, 5 = only replace equipment on burnout)
3. Where does energy rank in terms of your business operation decisions? (Not a priority * low priority * medium priority * high priority * very high priority)
a. What factors drive that ranking? i.e., need energy reliability for production/will pay any costs; energy costs in top 10 operating costs/huge impact on variable costs; or both?
4. What are the primary energy efficiency improvements that your company plans to make over the next…
a. 2-5 years? b. 5-10 years?
5. How short of a payback does your company require to invest in energy efficiency measures?
6. How does your company typically pay for energy efficiency investments? a. What are the challenges involved with access to capital? b. How can the utility help with those barriers?

KEMA, Inc. January 2012 A-7
7. What other barriers are there to investment in energy efficiency in this industry?
Section 3: Utility Programs Communications
1. Please describe the typical process at your organization, from how you hear about energy efficiency programs offered by your utility to the final decision to participate or not.
a. Who is involved? b. Who needs to participate in the decision-making process?
2. Are you familiar with the energy efficiency programs offered by your utility? a. How do you hear about utility sponsored programs? e.g. vendors, utility rep,
colleagues, other? 3. Do you feel you have enough knowledge about the energy efficiency programs your
utility offers? If no, a. Why not? b. How do you gather information to make an informed decision?
4. How often do you speak or meet with your utility representative? a. Would you prefer to meet: more/less or the same? b. How would you prefer to meet? 1-on-1, group, seminar?
Section 4: Utility Programs Experience
1. What are the major factors your company considers when deciding whether to participate in a utility-sponsored program?
2. 2. What type of utility sponsored program(s) are you most likely to participate? Least likely? Has this shifted over time? If so, why?
3. Does your utility offer energy efficiency and/or energy management programs that address your important energy concerns?
a. If not, what is missing? 4. Has your company participated in any utility sponsored energy efficiency program
recently (e.g. past 2-3 years)?

KEMA, Inc. January 2012 A-8
If NO,
a. What factors have contributed the most to your decision not to participate in an energy efficiency program?
b. What would encourage you to participate? i.e. different type of program offerings; better/more communication about program opportunities; business need; other?
If YES,
a. What is the most effective and beneficial energy efficiency program you have participated in? Please explain what you found beneficial.
b. What led to your company’s decision to participate i.e., how did you learn about the program, who at your company spearheaded the decision to participate?
c. Did participating meet your expectations? i. If yes, how? ii. If not, why not?
d. Would you participate in this program again? Why or why not?
Would you mind if I contacted you again as needed?
Thank you for your participation.