Embed Size (px)
Citation preview
Industrial Real Estate Market TrendsA Bearcat Perspective
Kristian Bjorson, SIORInternational DirectorRetail/e-commerce Distribution Practice+1 312 282 [email protected] March, 2014
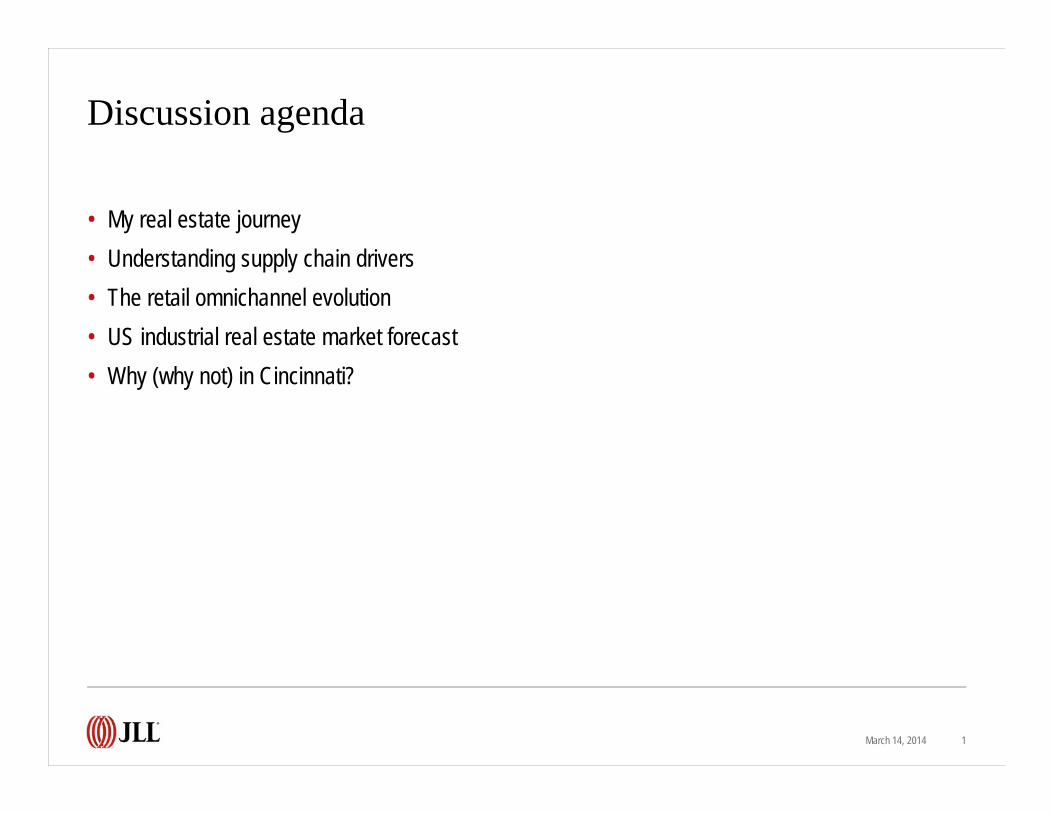
Discussion agenda
March 14, 2014 1
• My real estate journey• Understanding supply chain drivers• The retail omnichannel evolution• US industrial real estate market forecast• Why (why not) in Cincinnati?
Month 00, 2014 2
CLEVELAND
CINCINNATI
CHICAGO
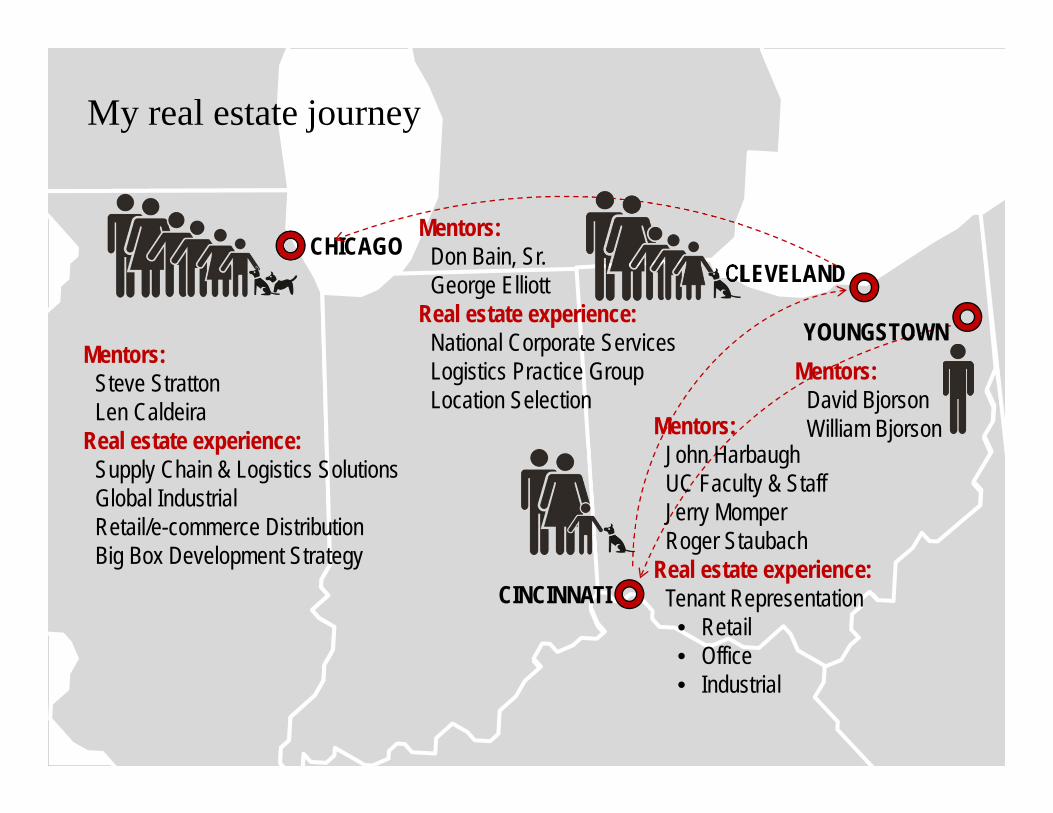
YOUNGSTOWNMentors:
David BjorsonWilliam BjorsonMentors:
John HarbaughUC Faculty & StaffJerry MomperRoger Staubach
Real estate experience:Tenant Representation• Retail• Office• Industrial
Mentors:Don Bain, Sr.George Elliott
Real estate experience:National Corporate ServicesLogistics Practice GroupLocation Selection
Mentors:Steve StrattonLen Caldeira
Real estate experience:Supply Chain & Logistics SolutionsGlobal IndustrialRetail/e-commerce DistributionBig Box Development Strategy
My real estate journey
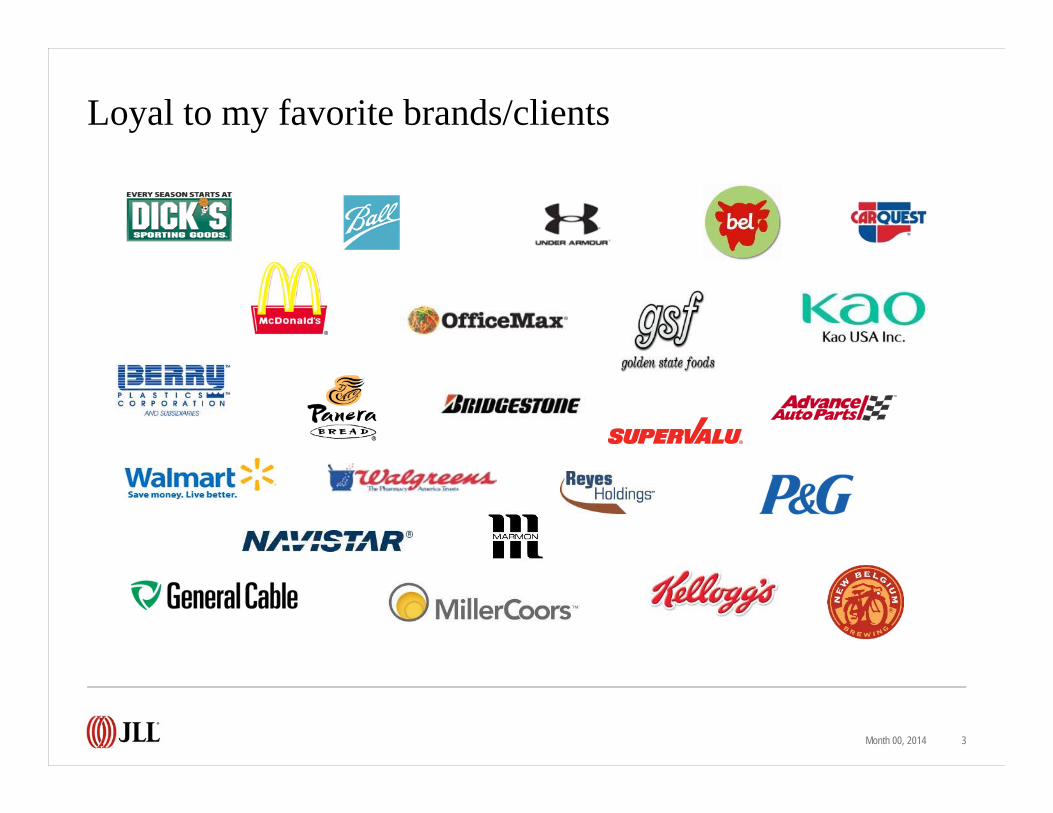
Loyal to my favorite brands/clients
Month 00, 2014 3
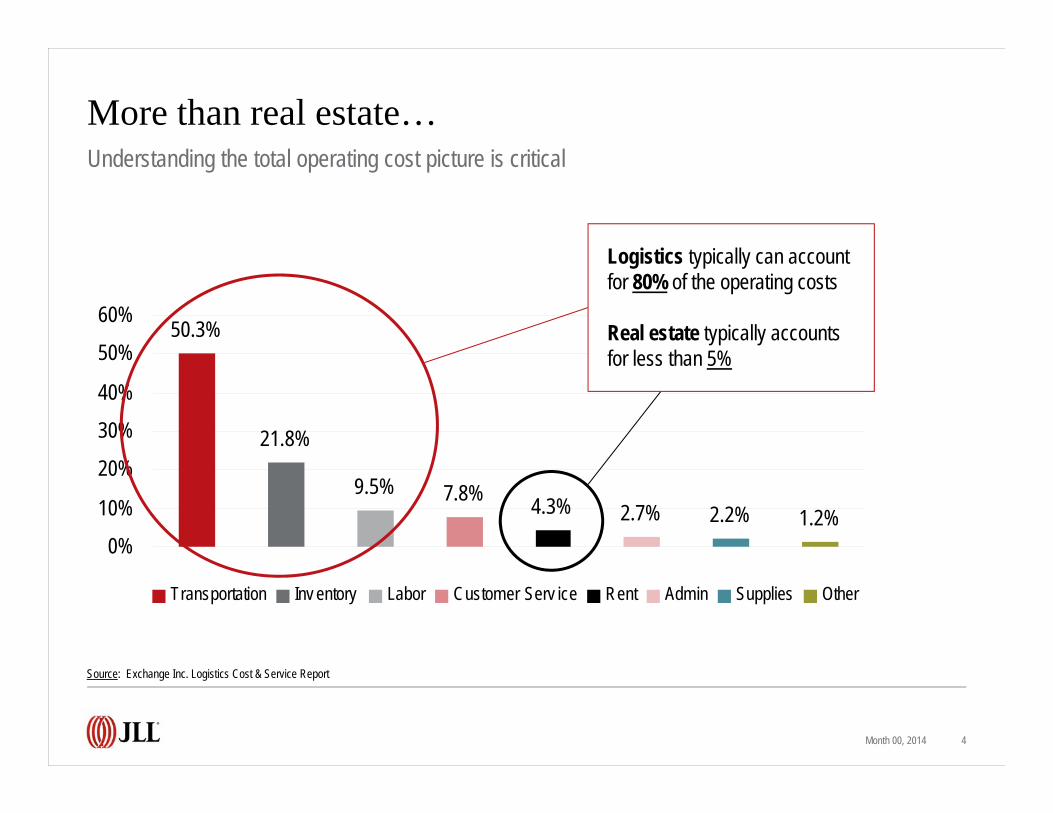
More than real estate…
Month 00, 2014 4
Understanding the total operating cost picture is critical
Source: Exchange Inc. Logistics Cost & Service Report
50.3%
21.8%
9.5% 7.8% 4.3% 2.7% 2.2% 1.2%0%
10%
20%
30%
40%
50%
60%
Transportation Inv entory Labor Customer Serv ice Rent Admin Supplies Other
Logistics typically can account for 80% of the operating costs
Real estate typically accounts for less than 5%
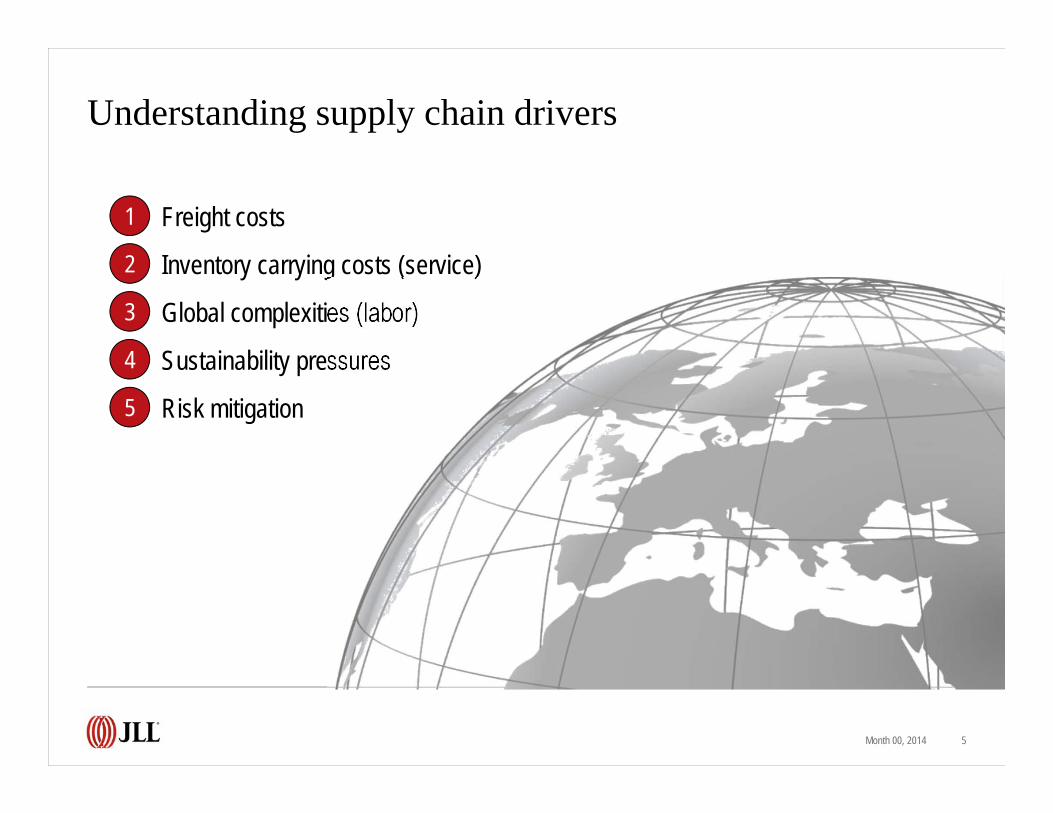
Understanding supply chain drivers
Month 00, 2014 5
Freight costs
Inventory carrying costs (service)
Global complexities (labor)
Sustainability pressures
Risk mitigation
1
2
3
4
5
Freight costs
Month 00, 2014 6
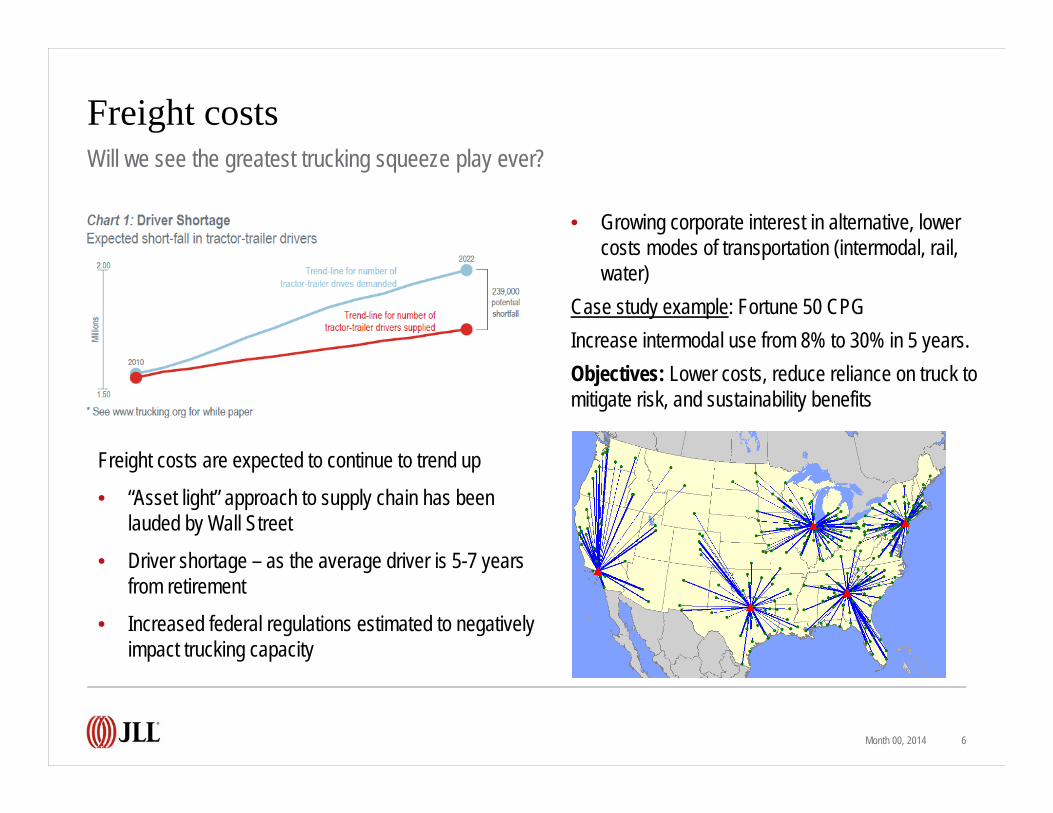
Will we see the greatest trucking squeeze play ever?
Freight costs are expected to continue to trend up
• “Asset light” approach to supply chain has been lauded by Wall Street
• Driver shortage – as the average driver is 5-7 years from retirement
• Increased federal regulations estimated to negatively impact trucking capacity
• Growing corporate interest in alternative, lower costs modes of transportation (intermodal, rail, water)
Case study example: Fortune 50 CPGIncrease intermodal use from 8% to 30% in 5 years.Objectives: Lower costs, reduce reliance on truck to mitigate risk, and sustainability benefits
Inventory carrying costs (service)
• Continued effort for corporations to “lean out” inventories
• A faster recovering economy will likely result in rising interest rates
• Customers now requiring more strategic positioning of inventories for same-day service
March 14, 2014 7
Can interest rates go any lower than zero?
Global complexities (labor)
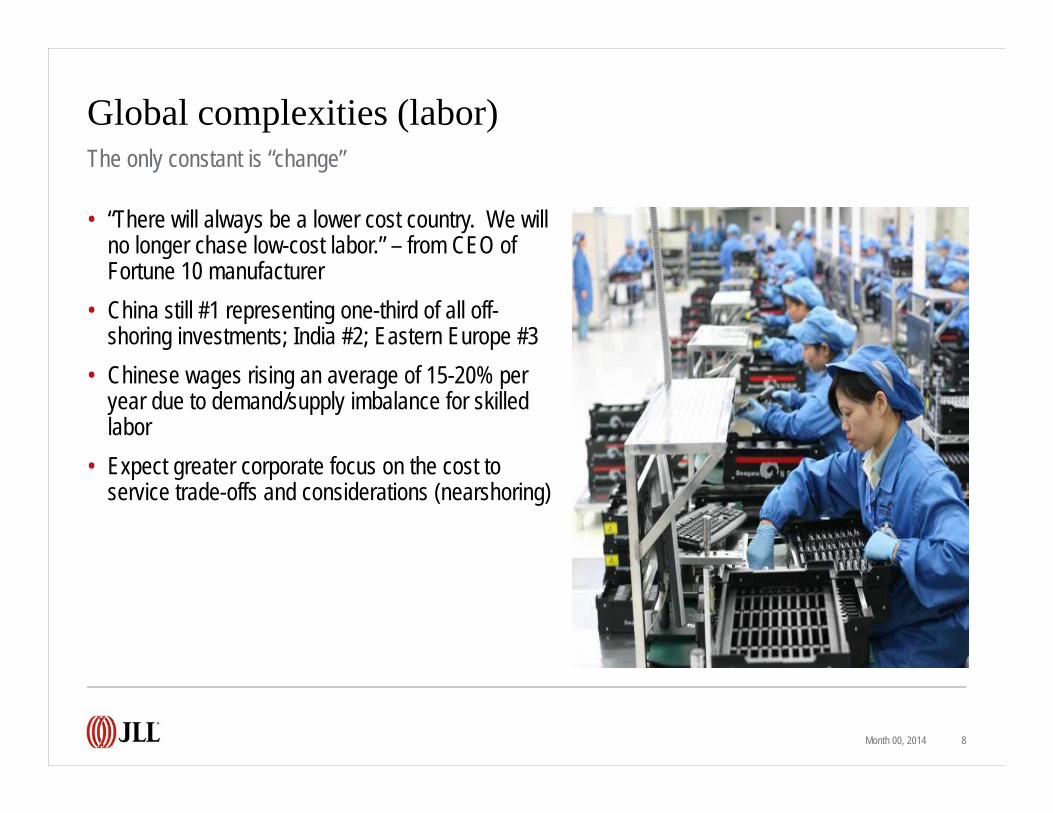
• “There will always be a lower cost country. We will no longer chase low-cost labor.” – from CEO of Fortune 10 manufacturer
• China still #1 representing one-third of all off-shoring investments; India #2; Eastern Europe #3
• Chinese wages rising an average of 15-20% per year due to demand/supply imbalance for skilled labor
• Expect greater corporate focus on the cost to service trade-offs and considerations (nearshoring)
Month 00, 2014 8
The only constant is “change”
Sustainability pressures
• Increasingly important, but not yet impacting strategic decisions
• Will drive increased focus on supply chain network redesign (reduce miles)
• Case study example: Fortune 20 retailer
A 5% reduction in packaging equates to:
213,000 trucks removed from road 66.7 million gallons of diesel fuel
saved $3.4 billion in savings for entire
supply chain
Month 00, 2014 9
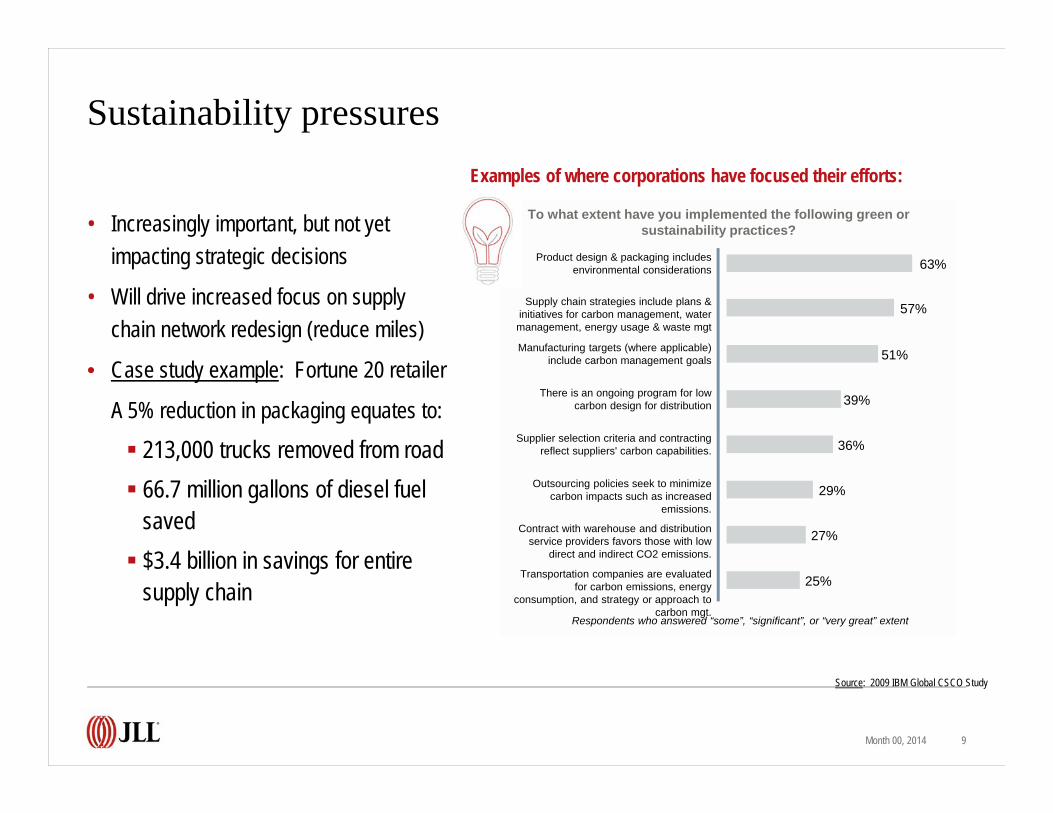
To what extent have you implemented the following green or sustainability practices?
Transportation companies are evaluated for carbon emissions, energy
consumption, and strategy or approach to carbon mgt.
Contract with warehouse and distribution service providers favors those with low
direct and indirect CO2 emissions.
Outsourcing policies seek to minimize carbon impacts such as increased
emissions.
Supplier selection criteria and contracting reflect suppliers' carbon capabilities.
There is an ongoing program for low carbon design for distribution
Manufacturing targets (where applicable) include carbon management goals
Supply chain strategies include plans & initiatives for carbon management, water management, energy usage & waste mgt
Product design & packaging includes environmental considerations
Respondents who answered “some”, “significant”, or “very great” extent
25%
27%
29%
36%
39%
51%
57%
63%
Source: 2009 IBM Global CSCO Study
Examples of where corporations have focused their efforts:
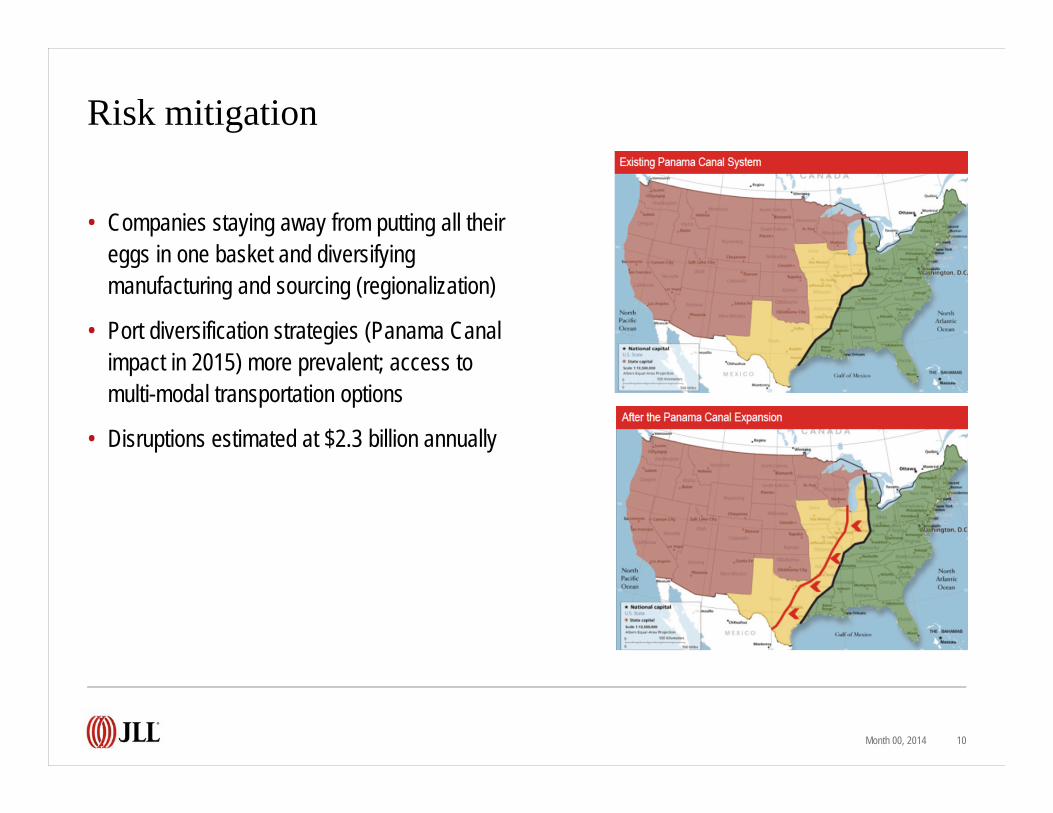
Risk mitigation
Month 00, 2014 10
• Companies staying away from putting all their eggs in one basket and diversifying manufacturing and sourcing (regionalization)
• Port diversification strategies (Panama Canal impact in 2015) more prevalent; access to multi-modal transportation options
• Disruptions estimated at $2.3 billion annually
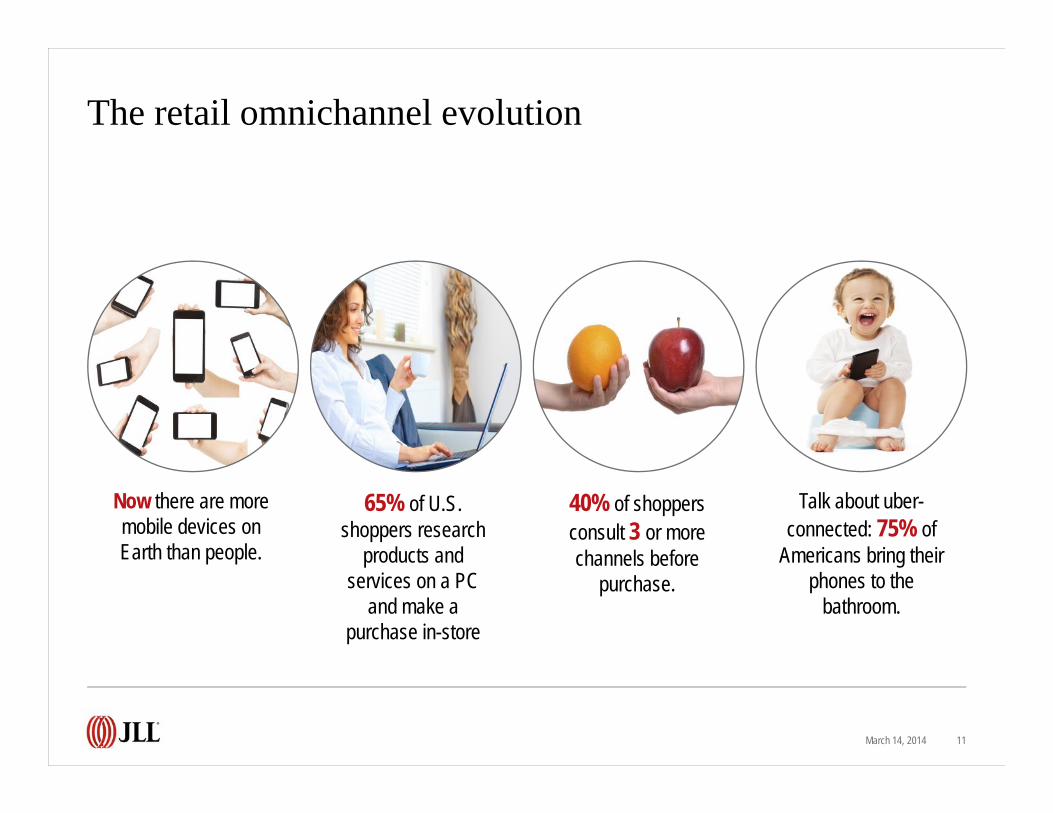
The retail omnichannel evolution
March 14, 2014 11
Now there are more mobile devices on Earth than people.
65% of U.S. shoppers research
products and services on a PC
and make a purchase in-store
40% of shoppers consult 3 or more channels before
purchase.
Talk about uber-connected: 75% of
Americans bring their phones to the
bathroom.
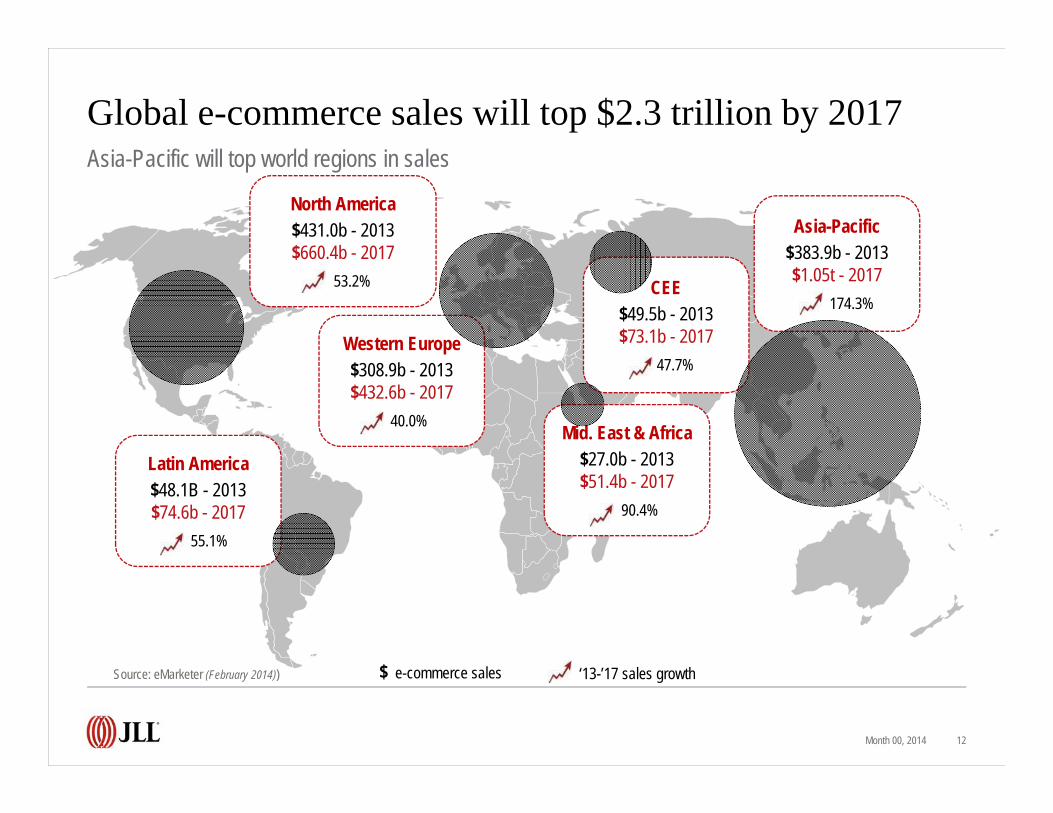
Global e-commerce sales will top $2.3 trillion by 2017
Month 00, 2014 12
Asia-Pacific will top world regions in sales
Western Europe$308.9b - 2013$432.6b - 2017
40.0% Mid. East & Africa$27.0b - 2013$51.4b - 2017
90.4%
Asia-Pacific$383.9b - 2013$1.05t - 2017
174.3%CEE
$49.5b - 2013$73.1b - 2017
47.7%
Latin America$48.1B - 2013$74.6b - 2017
55.1%
North America$431.0b - 2013$660.4b - 2017
53.2%
Source: eMarketer (February 2014)) $ e-commerce sales ‘13-’17 sales growth
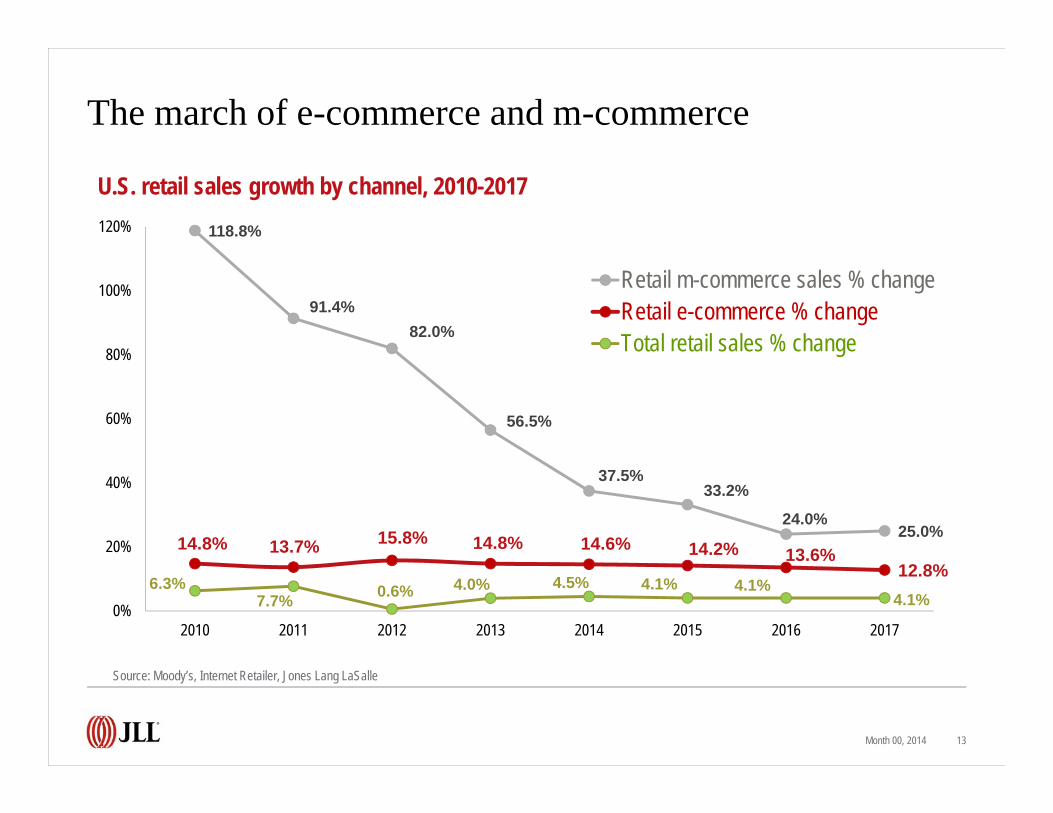
The march of e-commerce and m-commerce
Month 00, 2014 13
118.8%
91.4%82.0%
56.5%
37.5%33.2%
24.0%25.0%
14.8% 13.7% 15.8% 14.8% 14.6% 14.2% 13.6%12.8%
6.3%7.7% 0.6% 4.0% 4.5% 4.1% 4.1%
4.1%0%
20%
40%
60%
80%
100%
120%
2010 2011 2012 2013 2014 2015 2016 2017
Retail m-commerce sales % changeRetail e-commerce % changeTotal retail sales % change
U.S. retail sales growth by channel, 2010-2017
Source: Moody’s, Internet Retailer, Jones Lang LaSalle
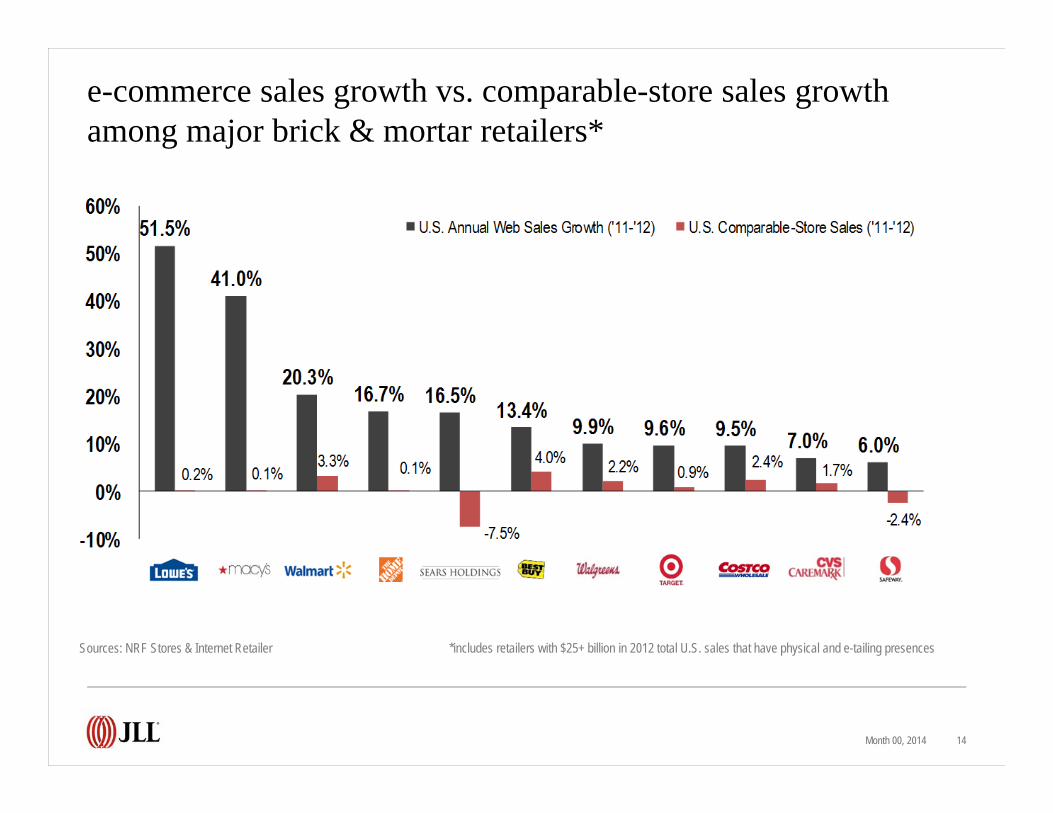
e-commerce sales growth vs. comparable-store sales growthamong major brick & mortar retailers*
Month 00, 2014 14
*includes retailers with $25+ billion in 2012 total U.S. sales that have physical and e-tailing presencesSources: NRF Stores & Internet Retailer
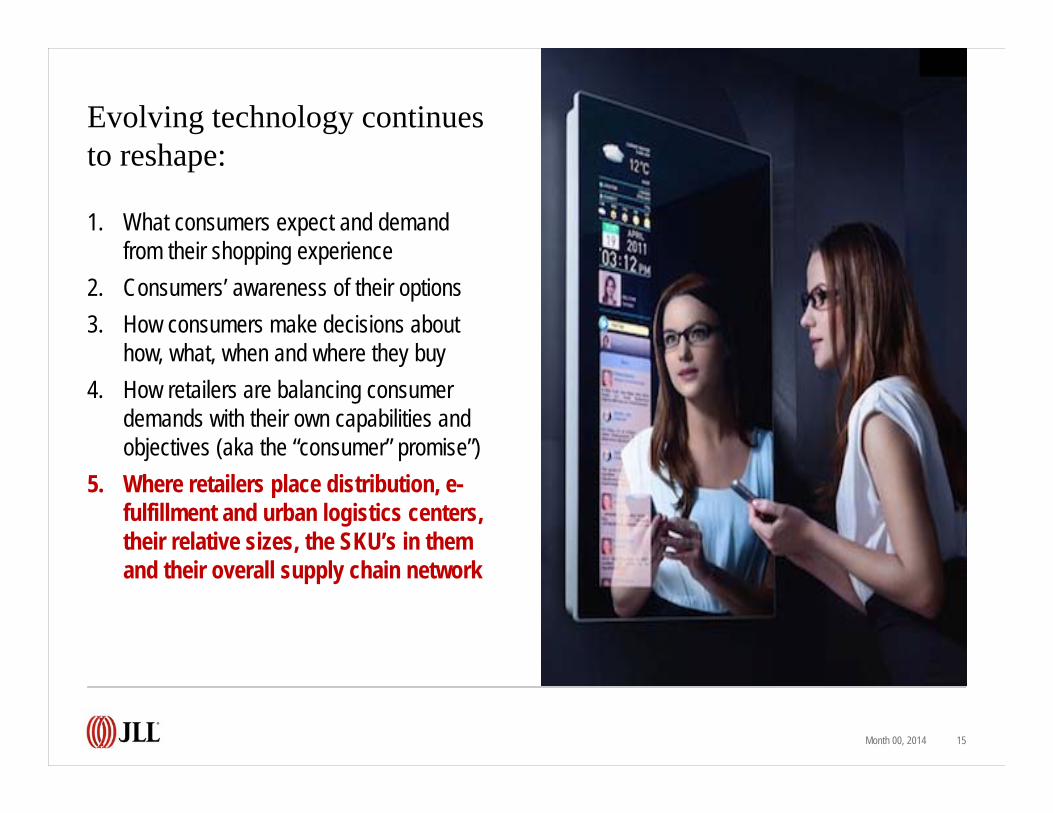
Evolving technology continues to reshape:
1. What consumers expect and demand from their shopping experience
2. Consumers’ awareness of their options3. How consumers make decisions about
how, what, when and where they buy4. How retailers are balancing consumer
demands with their own capabilities and objectives (aka the “consumer” promise”)
5. Where retailers place distribution, e-fulfillment and urban logistics centers, their relative sizes, the SKU’s in them and their overall supply chain network
Month 00, 2014 15
Month 00, 2014 16
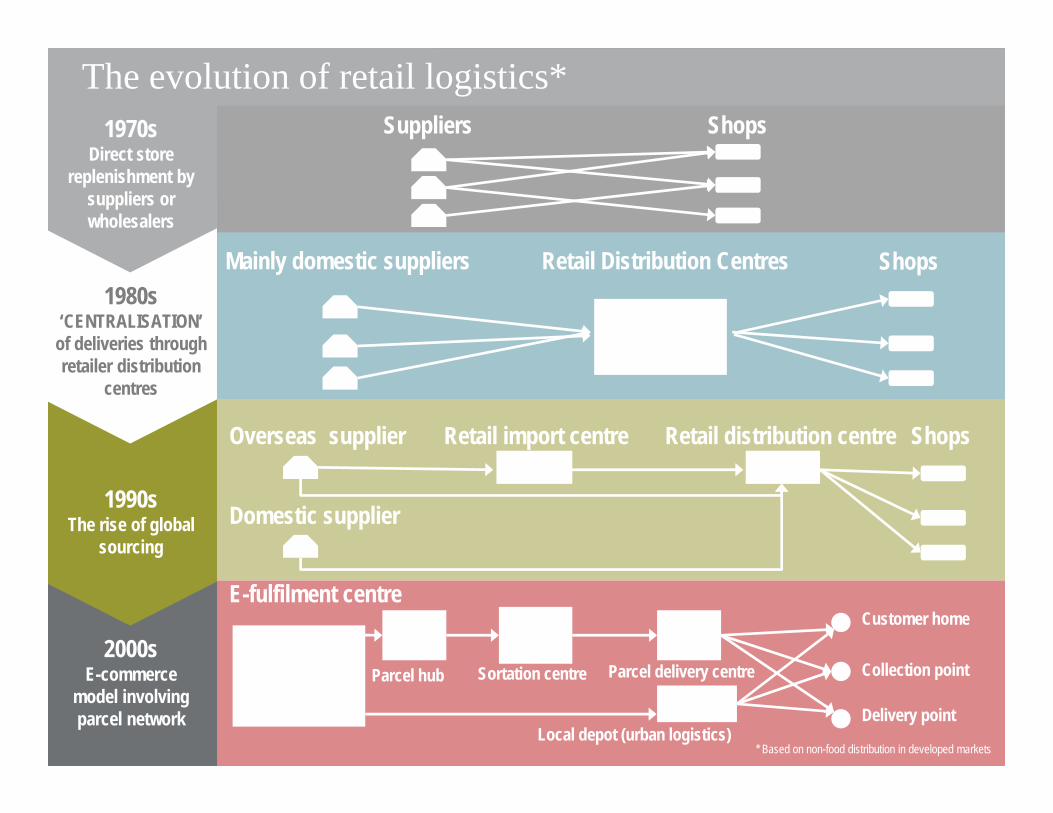
2000sE-commerce
model involving parcel network
1990sThe rise of global
sourcing
The evolution of retail logistics*
1980s‘CENTRALISATION’of deliveries through retailer distribution
centres
1970sDirect store
replenishment by suppliers or wholesalers
Suppliers Shops
Mainly domestic suppliers
Overseas supplier
Retail Distribution Centres
Domestic supplier
Retail import centre
Shops
ShopsRetail distribution centre
E-fulfilment centre
Parcel hub Parcel delivery centreSortation centre
Customer home
Collection point
Delivery point
* Based on non-food distribution in developed marketsLocal depot (urban logistics)
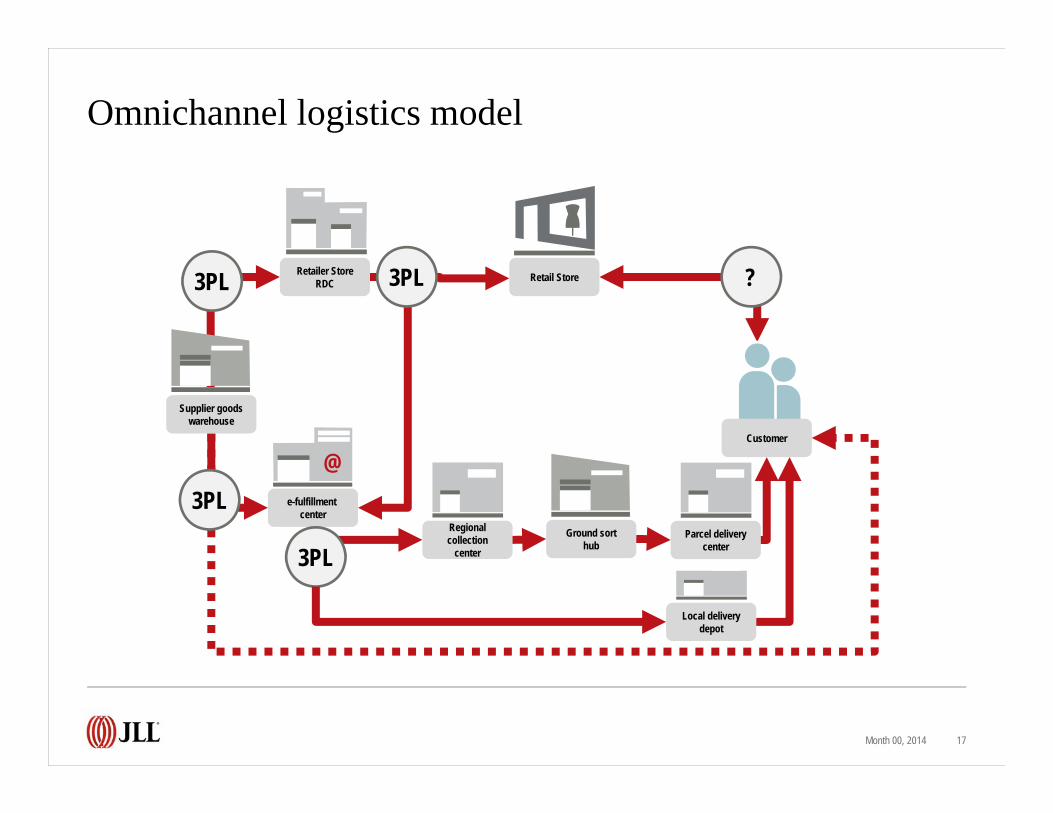
Omnichannel logistics model
Month 00, 2014 17
Parcel delivery center
Ground sort hub
Regional collection
center
Retailer Store RDC Retail Store
@e-fulfillment
center
Supplier goods warehouse
3PL
3PL
3PL 3PL ?
Customer
Local delivery depot
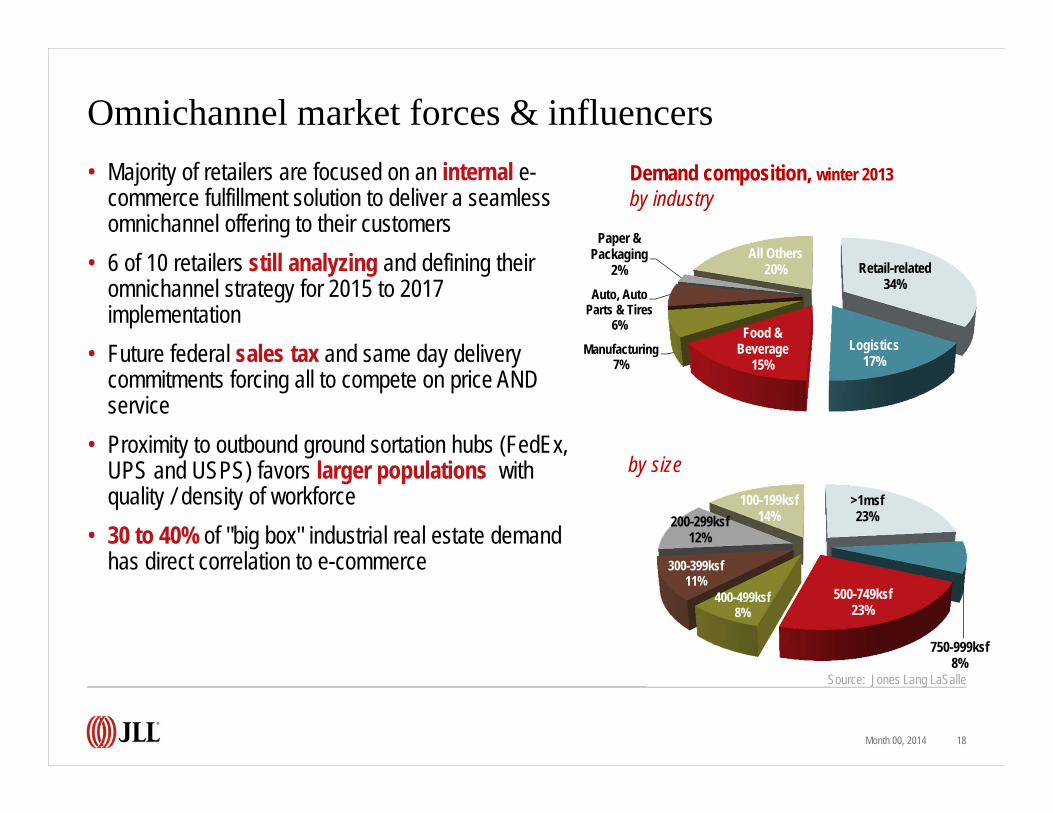
Omnichannel market forces & influencers• Majority of retailers are focused on an internal e-
commerce fulfillment solution to deliver a seamless omnichannel offering to their customers
• 6 of 10 retailers still analyzing and defining their omnichannel strategy for 2015 to 2017 implementation
• Future federal sales tax and same day delivery commitments forcing all to compete on price AND service
• Proximity to outbound ground sortation hubs (FedEx, UPS and USPS) favors larger populations with quality / density of workforce
• 30 to 40% of "big box" industrial real estate demand has direct correlation to e-commerce
Month 00, 2014 18
Retail-related34%
Logistics17%
Food & Beverage
15%Manufacturing
7%
Auto, Auto Parts & Tires
6%
Paper & Packaging
2%All Others
20%
>1msf23%
750-999ksf8%
500-749ksf23%
400-499ksf8%
300-399ksf11%
200-299ksf12%
100-199ksf14%
Demand composition, winter 2013by industry
by size
Source: Jones Lang LaSalle
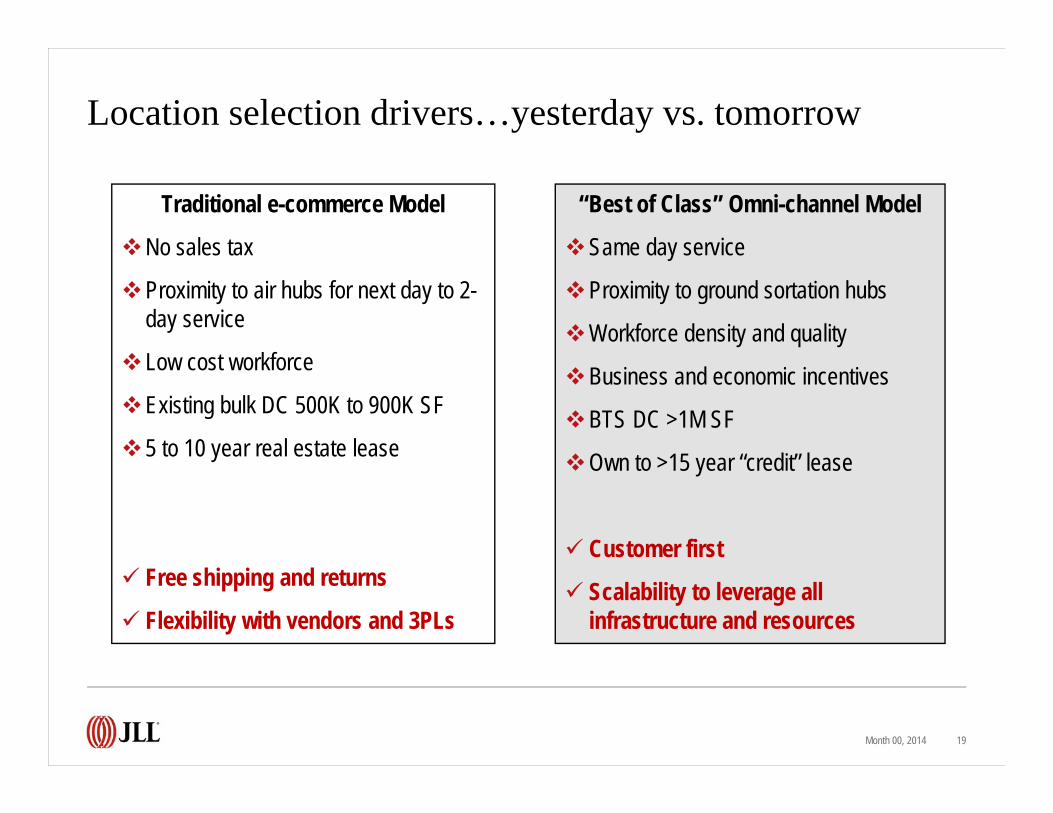
Location selection drivers…yesterday vs. tomorrow
Month 00, 2014 19
Traditional e-commerce Model
No sales tax
Proximity to air hubs for next day to 2-day service
Low cost workforce
Existing bulk DC 500K to 900K SF
5 to 10 year real estate lease
Free shipping and returns
Flexibility with vendors and 3PLs
“Best of Class” Omni-channel Model
Same day service
Proximity to ground sortation hubs
Workforce density and quality
Business and economic incentives
BTS DC >1M SF
Own to >15 year “credit” lease
Customer first
Scalability to leverage all infrastructure and resources
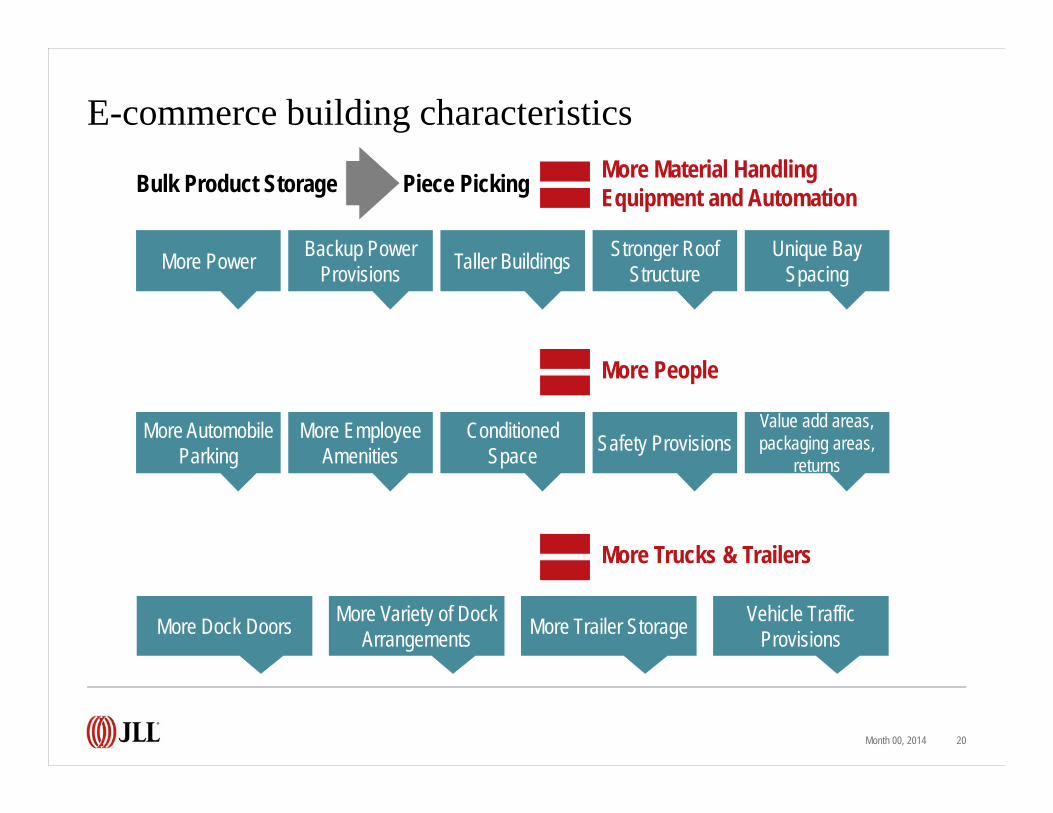
E-commerce building characteristics
Month 00, 2014 20
Bulk Product Storage Piece Picking More Material Handling Equipment and Automation
More People
More Trucks & Trailers
More Power Backup Power Provisions Taller Buildings Stronger Roof
StructureUnique Bay
Spacing
More Automobile Parking
More Employee Amenities
Conditioned Space Safety Provisions
Value add areas, packaging areas,
returns
More Dock Doors More Variety of Dock Arrangements More Trailer Storage Vehicle Traffic
Provisions
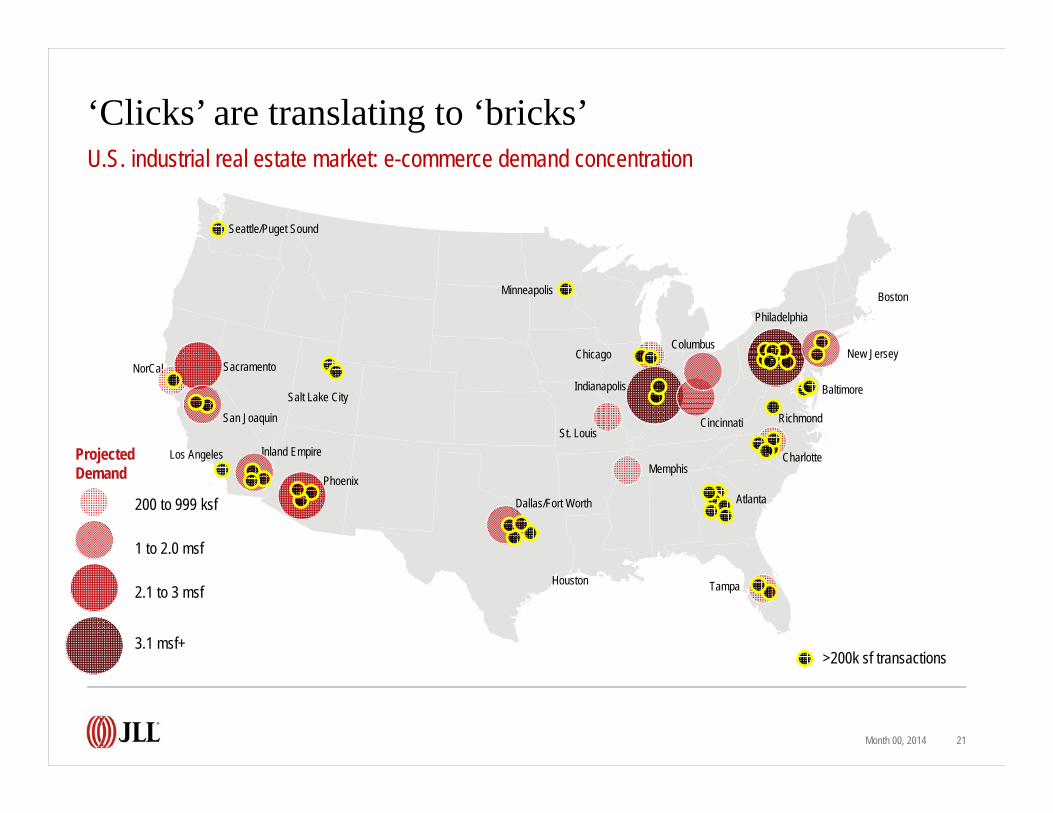
‘Clicks’ are translating to ‘bricks’
Month 00, 2014 21
U.S. industrial real estate market: e-commerce demand concentration
Baltimore
New Jersey
Philadelphia
St. Louis
NorCal
Phoenix
Dallas/Fort Worth
Memphis
ColumbusChicago
Indianapolis
Tampa
Seattle/Puget Sound
Cincinnati
Salt Lake City
Sacramento
San Joaquin
Inland Empire
Houston
Atlanta
Los Angeles
Minneapolis
>200k sf transactions
Charlotte
Richmond
Boston
2.1 to 3 msf
200 to 999 ksf
1 to 2.0 msf
3.1 msf+
Projected Demand
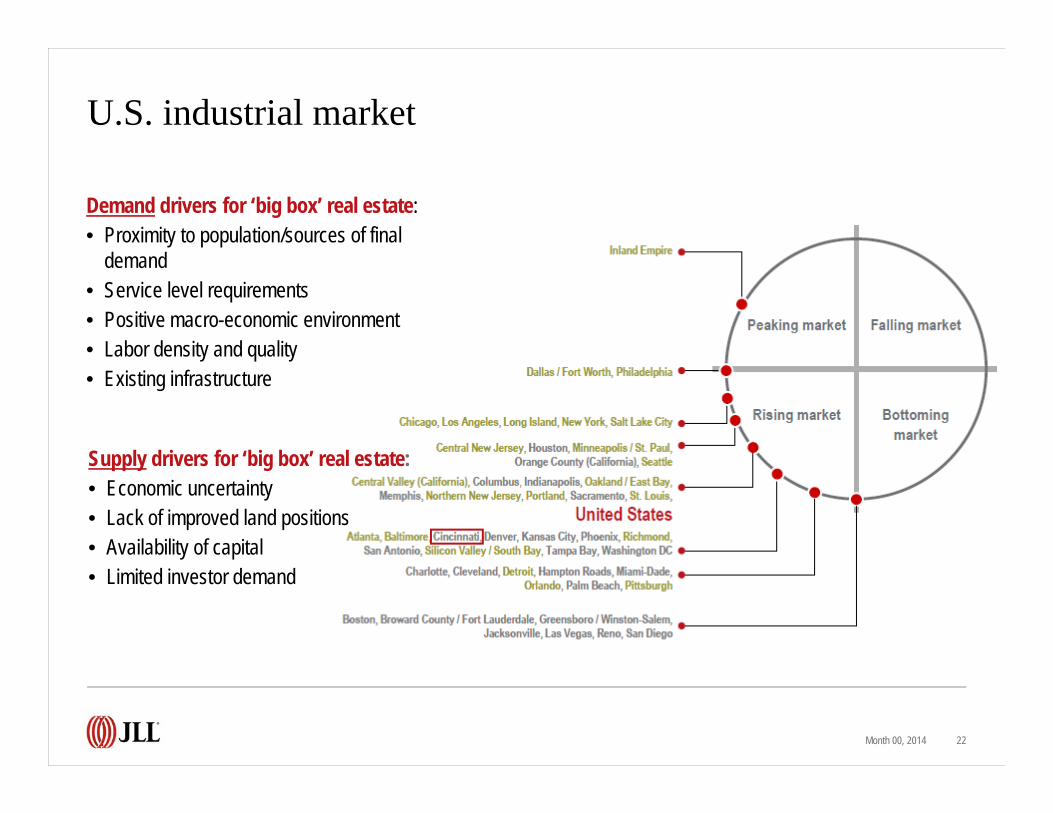
U.S. industrial market
Month 00, 2014 22
Demand drivers for ‘big box’ real estate:• Proximity to population/sources of final
demand• Service level requirements• Positive macro-economic environment• Labor density and quality• Existing infrastructure
Supply drivers for ‘big box’ real estate:• Economic uncertainty• Lack of improved land positions• Availability of capital• Limited investor demand
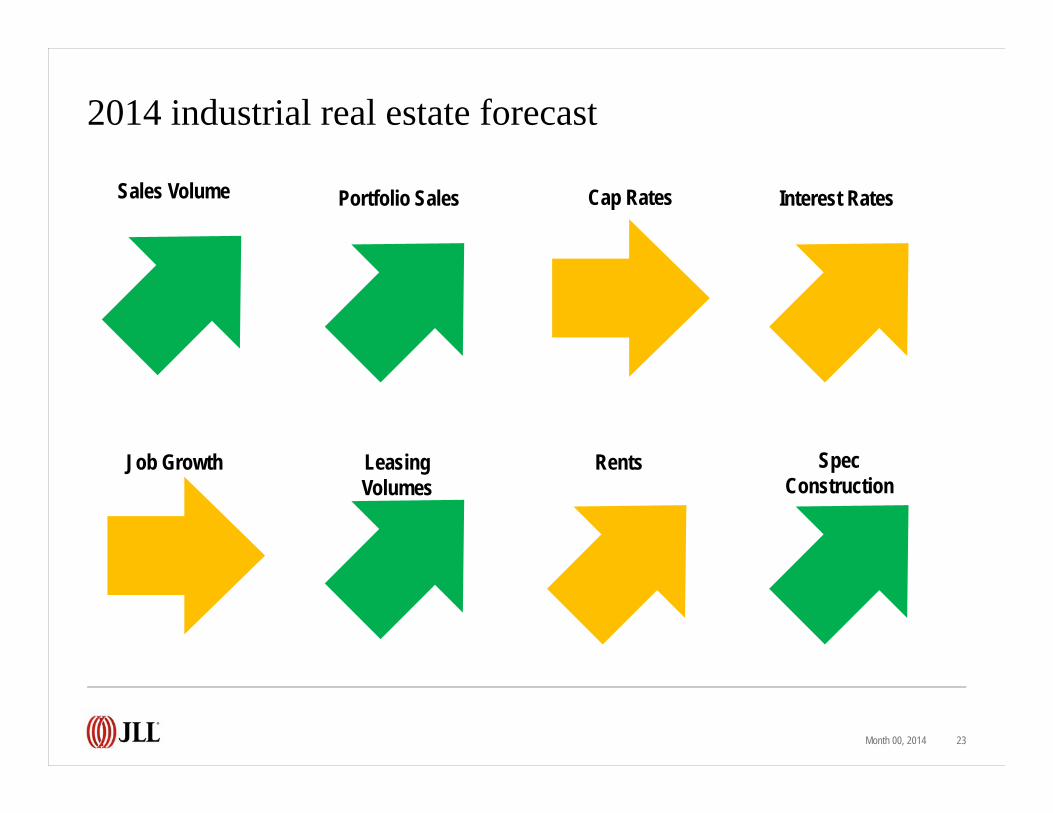
2014 industrial real estate forecast
Month 00, 2014 23
Sales Volume Portfolio Sales Cap Rates Interest Rates
Spec Construction
Job Growth Leasing Volumes
Rents
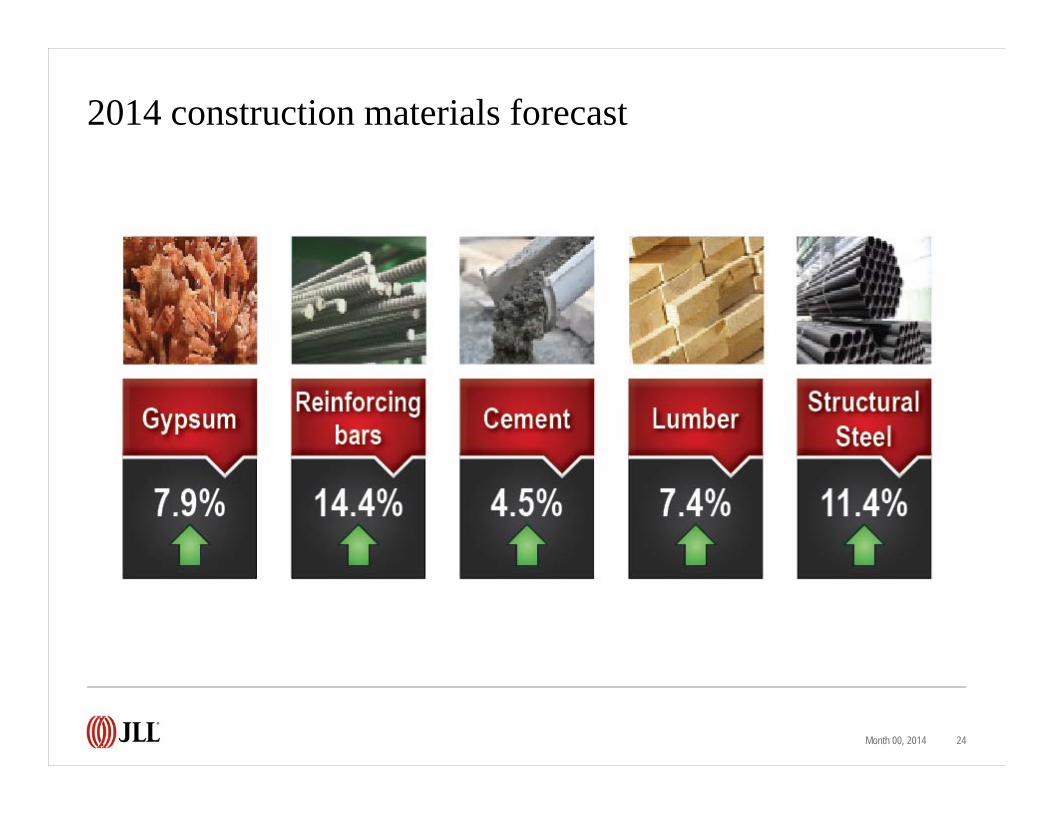
2014 construction materials forecast
Month 00, 2014 24
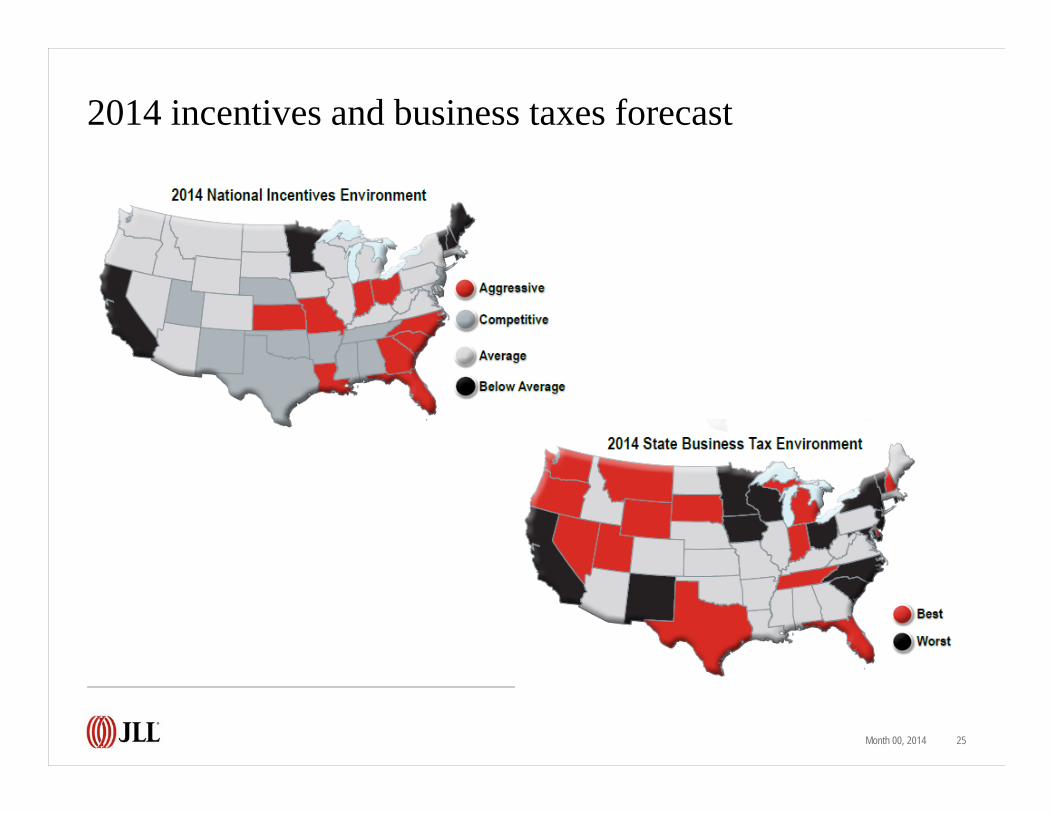
2014 incentives and business taxes forecast
Month 00, 2014 25
Why (why not) in Cincinnati?
March 14, 2014 26
Q & A
Thank you!