Embed Size (px)
Citation preview

Presentation to the Economic Policy Dialogue Forum By Saul Levin
TIPS 31 July 2014
Industrial Policy Successes and Challenges
– A Case Study of the Aluminium Sector

How do we understand Industrial Policy in South Africa
• Using the levers of the state to support the growth of industries that are going to drive significant economic growth, job creation and greater levels of equality in South Africa.
• A key issue is does this go beyond manufacturing into other sectors ?
Assumptions • Strong role of the state in facilitating economic development
• Strategic engagement with the private sector for developmental outcomes
• We need to make choices: – pick winners
– growth sectors / industries
– sectors / industries with high growth potential
– sectors with linkages to the rest of the economy
– enable growth firms (i.e. they pick themselves)
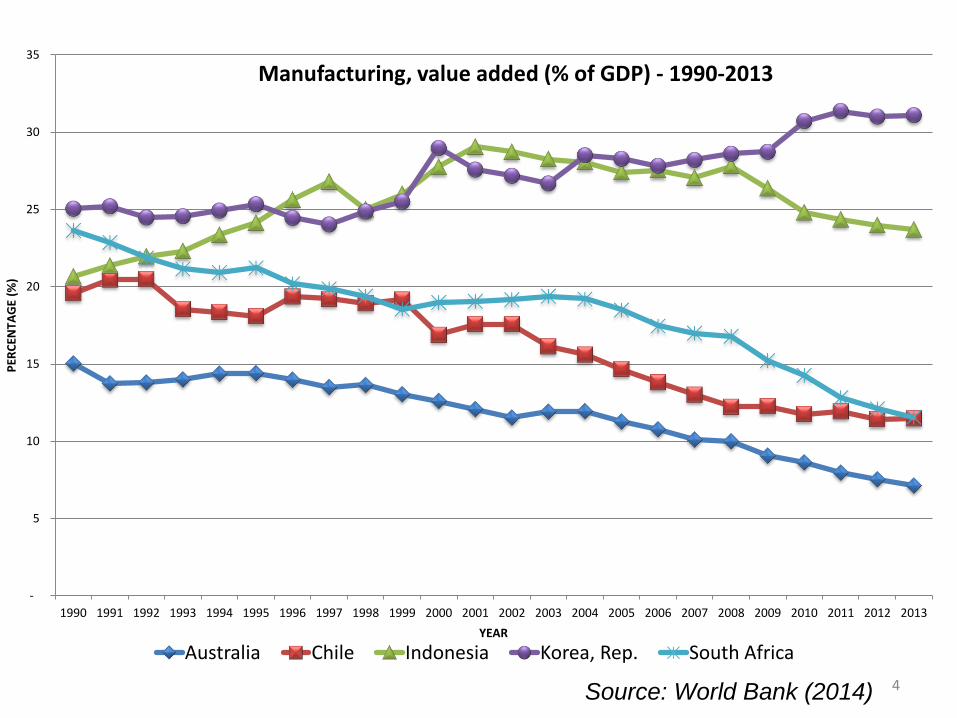
• Importance of the manufacturing sector and its linkages to the rest of the economy
• But manufacturing is facing challenges
4
-
5
10
15
20
25
30
35
1990 1991 1992 1993 1994 1995 1996 1997 1998 1999 2000 2001 2002 2003 2004 2005 2006 2007 2008 2009 2010 2011 2012 2013
PER
CEN
TAG
E (%
)
YEAR
Manufacturing, value added (% of GDP) - 1990-2013
Australia Chile Indonesia Korea, Rep. South Africa
Source: World Bank (2014)

5
200
400
600
800
1,000
1,200
1,400
1,600
1,800
2,000
tho
usa
nd
sManufacturing employment
Formal
Informal

Policy coherence needed for successful industrial policy
NIPF 2007
Industrial Policy is not the domain of a single government department but requires co-ordination across a range of government departments. It can only be implemented successfully if it is aligned with four associated and supporting sets of policies.
– First, a stable and supportive macro-economic and regulatory environment.
– Second, appropriate skills development and education systems which are increasingly integrated with the needs of the industrial economy.
– Third, sufficient, reliable and competitively priced traditional and modern infrastructure.
– Fourth, adequate support for various forms of technological effort within the economy.

Levers of Industrial Policy • Infant industry protection
• Partnering and collaborating with the private sector
• Partnering and collaborating with labour
• Industrial finance (DFIs)
• Utilisation of SOEs, SETA’s, and other institutions and agencies of government
• Preferential procurement and localisation
• Addressing competition issues (and the role of Competition Authorities)
• Role of sector regulators – are they regulating to support industrial policy
• Tariffs
• Strengthening technical regulations
• Technology transfer support
• Research and development assistance / new product development
• Skills training /education
• Supporting productivity improvements
• Sector specific incentive / customised incentives
• General incentives: EMIA, SMEDP, etc.
• Supporting export growth and market penetration
• Trade agreements
• Cluster support
• Supply chain development
• ETC…
Some levers are
explicit and
transparent, while
some implicit & it is
difficult to calculate
the costs

What do we want to use these levers for?
• Attracting FDI
• Reinvestment by existing industry
• Expanding the industrial base
• Increasing the sophistication of industry (less reliant on minerals and low value adding activities)
• Growing exports
• More and better types of jobs
A sector focus is an essential element of industrial policy

But we need to be cautious… • Getting industrial policy wrong can result in rent
seeking & focus on rents rather than the objectives of government (e.g. deepening industrial development; being competitive, etc)
• There are information asymmetries by those implementing industrial policy
• The advantages of certain levers change over time (i.e. electricity capacity and price)
• How we implement industrial policy is critical
Rodrick points to the need for government to have both carrot and stick in its
implementation of industrial policy

Case Study - Aluminium
• The development of the aluminium sector was “in no small part attributable to government involvement, through encouraging Eskom to offer cheap electricity or supporting IDC taking a major stake” Hirsch (2005:250)
• Feedback loop to strengthen the tools of industrial policy by reviewing where / how industrial policy levers have been used and their impact
• How to restructure the use of the tools / levers in partnership between govt. and private sector
Asking the question: Support to this industry has taken place at massive cost to the country; Was it worth it? and What do we do better next time?

Industrial Policy and Aluminium
- According to BHP Billiton, its investment in the smelters was made in direct response to incentives and encouragement by the government of South Africa.
- SA government through Eskom entered into the Special/Negotiated Pricing Agreement (S/NPAs) with Alusaf / BHP in the 1990s.
- The contracts resulted in low-priced (below production cost) electricity to BHP Billiton [only in some periods].
- Eskom had significant excess electricity capacity: currently BHP uses about 5.5% of Eskom’s electricity supply.
- The electricity price BHP pays in SA is directly linked to the LME Aluminium price (lowers the risk for BHP – investment incentive)
- Long term contracts in place
- Significant investment in the smelters (R60billion – BHP Billiton)

Aluminium- Key Facts Total capacity 1.4mill tonnes
Employment 15 000 direct
Export Value (BHP only) R8.4 billion
Contribution to BoP (BHP only) R4.4 billion
Key Players Primary producers: BHP Billiton (over 70%); Imports (6%); Secondary producers: smelters -Zimalco, Metalite Alloys etc. (2%), Foundries: Hayes Lemmerz (Maxion), Borbet, Autocast; Semifabricator/fabricators: Wispeco, Hulamin
Demand Drivers Electrical; architecture and building; automotive; packaging etc.
Electricity usage and pricing ~ 2300 MW, 5.5% of Eskom’s nominal capacity Pricing to BHP accordance to long term N/SPA
Industry Challenges BHP: Interruptibility of electricity; Secondary smelters and foundries: Municipality electricity and scrap availability and pricing

Figure 3: Trade position of Aluminium and articles thereof
0
2,000,000,000
4,000,000,000
6,000,000,000
8,000,000,000
10,000,000,000
12,000,000,000
14,000,000,000
16,000,000,000
18,000,000,000
2002 2003 2004 2005 2006 2007 2008 2009 2010 2011 2012
Ran
ds
Exports: Aluminium and articles thereof Imports: Aluminium and articles thereof Balance of payments
Benefits of the South African Aluminium
Industry
Exports have increased since 2002, peaking in 2007-08 and 2011. Imports have increased significantly, peaking in 2012. In recent years, the BOP has started to reflect the increase in aluminium imports. Econometrix 2012 report: aluminium operations have a R4.4bn
positive impact on the current account BoP made up of R8.4bn
exports less R4bn imports of alumina, petroleum, coke and pitch.

Benefits of the South African Aluminium
Industry (cont.)
Direct
employment
Primary
Hillside and Bayside3000 (including
contractors)
Mozal 98
Secondary and recyclers/merchants
Zimalco 150
Others 150
Aluminium scrap industry 8800
TOTAL UPSTREAM 12,198
Upstream
Aluminium industry employment, ~ 15,000 (direct), 29,000 (direct, indirect and induced)
Direct
employment
Fabricators and semi fabricators
Hulamin 2100
Wispeco 1000
Others Unknown
TOTAL DOWNSTREAM ~ 4,800
Aluminium foundry industry 1700
Intermediate/midstream
Econometrix report (2012): Bayside and Hillside smelters jointly created 7 000 jobs (direct and
indirect) in KwaZulu-Natal (KZN), primarily in the Richards Bay area; impacting on the livelihood
of more than 33 000 people in northern KZN. Using a dependency ratio of 4.0, it is estimated
that the livelihood of approximately 28 000 people could be dependent on the operations

Aluminium value chain

Costs… • Eskom estimates the liability of the contracts to be R11.5bn (for
2013). Where the liability can be taken as the opportunity cost of supplying BHP on the special price vs. supplying at Megaflex rates i.e. the PV of what Eskom projects BHP would pay for electricity against projections around what similar electricity users would pay. [R9bn – 2009; R4.5bn – 2010, etc]
• Cost of power generation was much cheaper in the past.
• The pricing arrangement was profitable for Eskom in the early /mid 2000s (est. R26bn over the period)
• TIPS research: to compare social costs and benefits of smelters with and without electricity subsidy: Assess the impact of two scenarios, projected until 2020 • Scenario 1: Maintain the status quo;
• Scenario 2: Increase the tariffs to Megaflex levels (i.e. no subsidy)

Overview of the Electricity Contracts for the
Aluminium Industry (cont.)
0.00
0.20
0.40
0.60
0.80
1.00
1.20
Jan
-02
Ma
y-0
2
Se
p-0
2
Jan
-03
Ma
y-0
3
Se
p-0
3
Jan
-04
Ma
y-0
4
Se
p-0
4
Jan
-05
Ma
y-0
5
Se
p-0
5
Jan
-06
Ma
y-0
6
Se
p-0
6
Jan
-07
Ma
y-0
7
Se
p-0
7
Jan
-08
Ma
y-0
8
Se
p-0
8
Jan
-09
Ma
y-0
9
Se
p-0
9
Jan
-10
Ma
y-1
0
Se
p-1
0
Jan
-11
Ma
y-1
1
Se
p-1
1
Jan
-12
Ma
y-1
2
Se
p-1
2
Jan
-13
Ma
y-1
3
R/kW
h
Average Megaflex Hillside Potline 3 Hillside Potline 1&2
Figure 4: Difference between BHP prices
and comparable average Megaflex tariff Year
Megaflex tariff
over Hillside 1 & 2,
% difference
2002 -10%
2003 15%
2004 -12%
2005 -3%
2006 -31%
2007 -32%
2008 -26%
Average 2002-2008 -14%
2009 80%
2010 115%
2011 146%
2012 210%
2013 (till June) 166%
Average 2009 till
June 2013 143%

Cost Benefit Analysis – Results (cont.) Figure 5: Costs of Production - R000s
R 7
,60
5,9
59
R 1
1,1
17
,59
9
R 1
1,0
27
,08
6
R 1
1,9
50
,42
4
R 8
,16
0,3
33
R 8
,76
7,0
45
R 9
,52
6,2
58
R 9
,16
7,2
32
R 1
4,2
05
,86
3
R 1
6,0
86
,55
8
R 1
7,5
18
,47
0
R 1
7,3
77
,45
5
R 1
6,8
83
,19
9
R 1
6,8
33
,62
1
R 1
6,1
32
,26
9
R 1
6,1
11
,07
5
R 7
,46
7,5
56
R 1
0,3
90
,73
8
R 1
0,0
96
,79
0
R 1
1,3
05
,51
5
R 9
,53
5,3
55
R 5
,59
5,0
99
R 6
,50
0,3
76
R 7
,89
1,9
10
R 1
0,0
97
,40
7
R 1
1,5
77
,38
7
R 6
,50
1,9
70
R 6
,95
4,8
38
R 0
R 0
R 0
R 0
20
05
20
06
20
07
20
08
20
09
20
10
20
11
20
12
20
13
20
14
20
15
20
16
20
17
20
18
20
19
20
20
Costs of Production - Scen 1 Costs of Production - Scen 2
-R 2,000,000
-R 1,000,000
R 0
R 1,000,000
R 2,000,000
R 3,000,000
R 4,000,000
R 5,000,000
R 6,000,000
R 7,000,000
20
05
20
06
20
07
20
08
20
09
20
10
20
11
20
12
20
13
20
14
20
15
20
16
20
17
20
18
20
19
20
20
Net Profits - Scen 1 Net Profits - Scen 2
Figure 6: Net Profits

Cost Benefit Analysis – Results (cont.)
Figure 11: Electricity Costs of Production: Variance between
Current Preferential Rates and Megaflex Rates - R000s
-R 1
01
,14
3,6
94
-R 1
94
,25
7,0
17
-R 3
99
,22
6,2
45
R 3
58
,35
2,0
03
R 7
42
,58
5,6
10
R 5
15
,41
5,7
85
NPV TOTAL: 2005 Base year (2005-2020)
NPV TOTAL: 2013 Base year (2005-2020)
NPV TOTAL: 2013 Base year (2013-2020)
Scenario 1: Status Quo Scenario 2: No Subsidy
The CBA shows that Scenario 1 (the status quo) results in a loss of NPV of in the region of R101billion per annum. This suggests that increasing prices to Megaflex rates in Scenario 2 that the smelters would find it financially unviable to continue operations and thus shut down. This has a positive impact on the economy as there is extra electricity capacity which can filter through to the rest of the economy will less adverse effects on the rest of the economy. However, any conclusion based on these figures alone would be partial. This CBA has not taken into account how this compares to the loss to the economy as a result of the carbon footprint.

Costs/Benefit: Modelling Results • According to the CBA:
– Direct effects: NPV of Scenario 1 (Status Quo) is estimated to be R 34,2 billion (employment, profits, taxes, CSI, etc)
– Indirect effects: NPV for Scenario 1 is –R135,6 billion (multipliers, UIF, downstream, tax, electricity capacity, BoP)
– Cumulative effects: Total NPV for Scenario 1 is –R101,1 billion. – Direct effects: NPV for Scenario 2 – No Subsidy is R18,6 billion. – Indirect effects: NPV for Scenario 2 is R339,8 billion (mainly electricity).
– Cumulative effects: Total NPV for Scenario 2 is R358 billion. Scenario 1 is better for BHP and the smelters but detrimental to the rest of the economy in terms of the second round effects stemming from the impact of electricity capacity on the rest of the economy. Scenario 2 has adverse direct effects on the smelter and its employees and their dependents, but has far-reaching second and indirect benefits to the rest of the economy due to the spare capacity of electricity.

Is South Africa reaping the benefits: BHP’s pricing of primary aluminium products

Downstream use of Aluminium
• Consolidation of the pot-lines in 2006
• Automotive: mainly scrap-castings; imported
• Electrical cables: Bayside no longer sells rod used to make cables, likely to be imported
• Canning particularly for beverages : would use scrap aluminium and is potential downstream user but imports of aluminium likely
• Building and construction: use local and imports
• Beyond the S/NPA incentive the smelters will likely close down (although dependent on global price of aluminium)

Key findings
BHP
• Smelters , despite the preferential electricity rates, have allegedly shown successive losses in the last few years
• Dominant in local market; significant market power- may cut back production, or pass on costs depending on pricing
• Price taker in export markets; unlikely to pass on costs
Secondary smelters • No direct impact, use scrap mainly (small
amounts of virgin aluminium) • Indirect impact- less virgin material,
increases demand for scrap (particularly high grade), increases price of scrap
• Main concern: Municipality electricity mark-ups and scrap pricing, availability and quality
- ITAC policy directive • Limited ability to pass on cost increases
Foundries
• no direct impact, same concerns as secondary smelters
• raised major concerns about non-standard and high electricity rates by municipalities; availability and pricing of scrap
• competition from imported castings, esp. automotive industry
• limited ability to pass on cost increases
• many have shut down, lost business to imports
Semi-fabricators and fabricators
• Company X - not much, do their own re-melting of scrap, only buy small volumes of basic ingots from BHP
– In the event of non-supply from BHP, move more to scrap, and import balance of needs, ingots are at IPP anyway; already importing billets
• Company Y- big impact. Large volumes of slab from BHP
• Importing slab is much more expensive than buying locally (unlike importing basic ingots)
• Players have market power, but threat of imports of finished fully fabricated products is a constraint

Lessons?
• The carrot was there!
• High costs but did we get the benefits? Opportunity costs of subsiding this industry over other industries.
• Is there space to extricate if we get it wrong? Is there a subsidy forever or over very long periods?
• Could there have been more impact on downstream?
• Collaboration and more strategic engagement to draw out the benefits, especially for downstream
• Did we need to use the stick? Did we build a stick into the support measures?

Going forward…
• The electricity capacity constraints are only temporary; more capacity is being built – over capacity or under capacity does not necessarily last forever
Time
Electricity Demand
Electricity
availability
Infrastructure investment
Overcapacity
Under-capacity
Timing for next round of power stations
BUT
- Costs higher
- Carbon
footprint of
coal

Choices going forward
• Do we keep the smelting capacity?
• What incentives are offered?
• How are they structured so that they contribute to deepening industrial development? Export Parity Pricing; downstream industry development; clustering… active support for growing the downstream industry.
• We know the circumstances around electricity availability will change, how do we ensure that all parties are protected and that the industrial policy lever is used effectively.
• Policy coherence across departments in the choices going forward – including price, coal power, carbon footprint, capacity

Thank you
27