Embed Size (px)
Citation preview

1
1
Phone: +61 2 9292 7400
Fax: +61 2 9292 7404
Address: Level 14, 347 Kent Street Sydney NSW 2000
Email: [email protected]
Follow us: Visit www.prpsydney.com.au
© Copyright Preston Rowe Paterson NSW Pty Limited
INSIDE THIS ISSUE:
North Shore Region 2
North Western Region 3
Central Western Region 4
Outer Western Region 4
South Sydney Region 5
South West Region 6
NSW Land Sales 7
NAB Commercial Property Survey 8
Economic Fundamentals 9
About Preston Rowe Paterson 12
Contact Us 13
SYDNEY METROPOLITAN
Industrial Market Report
First Half 2017 HIGHLIGHTS
Over the first half of 2017, Sydney’s industrial market continues to experience strong demand amidst an
environment of low supply and strong residential growth taking up existing industrial stock.
Increasing land prices combined with a decline in quality industrial land prompts for a need the increase
the construction of industrial space in order to cater for future demand.
The incoming arrival of online retailer Amazon have further spurred further demand for industrial space in
Sydney, as reports continue to circulate of the retailer scouting out for purpose built fulfilment centres of
approximately 100,000 square metre in both Sydney and Melbourne.
Strong conditions continue to drive up rents in industrial properties around Sydney, with low vacancy and
tight supply the driving force of this growth.
Historically, any major construction of infrastructure around the industrial areas in Outer-Sydney would
result in higher growth rates of the surrounding industrial land values as it provides access to Sydney’s
metropolitan areas. Construction of Sydney’s second airport at Badgerys Creek, as well as the recently
announced allocation of $1 billion of investments in roads as part of the Western Sydney Growth Roads
Program will both provide important foundations.

2
Phone: +61 2 9292 7400
Fax: +61 2 9292 7404
Address: Level 14, 347 Kent Street Sydney NSW 2000
Email: [email protected]
Follow us: Visit www.prpsydney.com.au
© Copyright Preston Rowe Paterson NSW Pty Limited
2
Industrial Property
North Shore Region
Preston Rowe Paterson Research classifies the North Shore region of Sydney’s industrial market to include suburbs of:
Artarmon, Balgowlah, Belrose, Brookvale, Chatswood, Frenchs Forest, Hornsby, Lane Cove, Manly Vale, Mona Vale, Mount Ku-ring-gai, St Leonards, Turramurra, Warringah and Willoughby.
Building/Investment Sales
The following table displays reported investment sales transactions over $5 million that occurred in the North Shore Region over the first half of 2017:
Rentals
Preston Rowe Paterson recorded the following major leasing transactions in the North Shore industrial market over the first half of 2017:
ADDRESS SALE PRICE SALE DATEREPORTED
YIELDVENDOR PURCHASER AREA (SQM)
258-264 Pennant Hills Road, Thornleigh, NSW 2120 $9,500,000 Mar-17 N/A Pwg Holdings Pty Ltd Bellevue Point Pty Ltd 1,510
11-13 Rodborough Road, Frenchs Forest, NSW
2086$6,800,000 Apr-17 6.07% Undisclosed Abacus Property Group 2,320
ADDRESS RATE /SQM RENT P.A AREA (SQM) LESSOR LESSEE TERM DATE
76 Reserve Road, Artarmon, NSW 2064 $300 $76,500 255 Undisclosed Fullcrum 3D 3 Feb-17
33-35 Alleyne Street, Chatswood, NSW 2067 $175 $252,000 1,440 P & O Investments Powermove 3+3 Feb-17
76 Reserve Road, Artarmon, NSW 2064 $298 $65,858 221 DNP Pty Ltd Fotenic Pty Ltd 3+3 Mar-17
7 Gibbes Street, Chatswood, NSW 2067 $210 $124,950 595 Undisclosed Spatial Property Sty ling 3 Apr-17
Table 1—North Shore Building/Investment Sales—Source Preston Rowe Paterson Research/CPM
N/A = not currently available
Table 2—North Shore Industrial leases—Source Preston Rowe Paterson Research/CPM

3
Phone: +61 2 9292 7400
Fax: +61 2 9292 7404
Address: Level 14, 347 Kent Street Sydney NSW 2000
Email: [email protected]
Follow us: Visit www.prpsydney.com.au
© Copyright Preston Rowe Paterson NSW Pty Limited
3
North Western Region
Preston Rowe Paterson Research classifies the NSW North Western region of Sydney’s industrial market to include suburbs of:
Baulkham Hills, Bella Vista, Castle Hill, Epping, Kings Park, Macquarie Park, Meadow Bank, North Rocks, North Ryde, Seven Hills and Thornleigh.
Building/Investment Sales
The following table displays reported investment sales transactions over $5 million that occurred in the North Western Region over the first half of 2017:
Rentals
Preston Rowe Paterson recorded the following major leasing transactions in the North Western industrial market over the first half of 2017:
Central Western Region
Preston Rowe Paterson Research classifies the NSW North Western region of Sydney’s industrial market to include suburbs of:
Auburn, Croydon, Ermington, Granville, Homebush, Lidcombe, Melrose Park, Parramatta, Regents Park, Rhodes, Rosehill, Rydalmere, Silverwater, Strathfield.
Building/Investment Sales
The following table displays reported investment sales transactions over $5 million that occurred in the Central Western Region over the first half of 2017:
ADDRESS SALE PRICE SALE DATEREPORTED
YIELDVENDOR PURCHASER AREA (SQM)
7 Tollis Place, Seven Hills, NSW 2147 $5,275,000 Feb-17 N/A Pacreations Pty Ltd 7 Tollis Place Pty Ltd 2,990
ADDRESS RATE /SQM RENT P.A AREA (SQM) LESSOR LESSEE TERM DATE
47 Epping Road, Macquarie Park, NSW 2113 $231 $95,865 415PS1875 Property Holdings
Pty LtdIdeal Bathroom Centre 3+3 Apr-17
ADDRESS SALE PRICE SALE DATEREPORTED
YIELDVENDOR PURCHASER
AREA
(SQM)
59-61 Derby Street, Silverwater, NSW 2128 $5,500,000 Feb-17 N/A Undisclosed Undisclosed 2,400
3 George Young Street, Auburn, NSW 2144 $10,300,000 Feb-17 6.50% Private buyer Primewest 5,000
8 George Young Street, Auburn, NSW 2144 $6,660,000 Apr-17 N/A F & J Zou Undisclosed 3,338
Table 3—North Western Building/Investment Sales—Source Preston Rowe Paterson Research/CPM
N/A = not currently available
Table 4—North Western Region Industrial leases—Source Preston Rowe Paterson Research/CPM
Table 5—Central West Building/Investment Sales—Source Preston Rowe Paterson Research/CPM
N/A = not currently available

4
Phone: +61 2 9292 7400
Fax: +61 2 9292 7404
Address: Level 14, 347 Kent Street Sydney NSW 2000
Email: [email protected]
Follow us: Visit www.prpsydney.com.au
© Copyright Preston Rowe Paterson NSW Pty Limited
4
Rentals
Preston Rowe Paterson recorded the following major leasing transactions in the Central Western industrial market over the first half of 2017:
Outer West Region
Preston Rowe Paterson Research classifies the Outer West region of Sydney’s Industrial Market to include the suburbs of:
Arndell Park, Blacktown, Bonnyrigg, Eastern Creek, Erskine Park, Fairfield, Glendenning, Girraween, Greystanes, Holroyd, Huntingwood, Minchin-
bury, Penrith, Smithfield, St Marys, Wetherill Park and Yennora.
Building/Investment Sales
The following table displays reported investment sales transactions over $5 million which occurred in the Outer West Region over the first half of 2017:
ADDRESS RATE /SQM RENT P.A AREA (SQM) LESSOR LESSEE TERM DATE
10 Hill Road, Homebush, NSW 2140 $155 $120,125 775 Orlani Property Group Lowa Lighting 3 Jan-17
9 Euston Street, Rydalmere, NSW 2116 $117 $107,523 919 Undisclosed Vault Interiors 3 Mar-17
10 Hill Road, Homebush, NSW 2140 $155 $147,095 949 Orlani Property Group Inskin Cosmetics 3 Apr-17
38-46 South Street, Rydalmere, NSW 2116 $145 $99,180 684 AMP Capital Oliver Brown 5 Apr-17
ADDRESS SALE PRICE SALE DATE REPORTED YIELD VENDOR PURCHASER AREA (SQM)
12 Donald Street, Guildford, NSW 2161 $5,700,000 Jan-17 N/A Undisclosed Undisclosed 2,220
180 Reservoir Road, Blacktown, NSW 2148 $7,500,000 Feb-17 N/A Henaford Pty LtdThakker Investment (Arndell
Park)212
29 Chifley Street, Smithfield, NSW 2164 $5,210,000 Feb-17 N/A Diversey Australia Pty Ltd Finocchiaro 5,900
115-119 Cowpasture Road, Wetherill Park, NSW 2164 $6,600,000 Feb-17 N/A Laing Investments Pty LtdBma Construction Pty Ltd and
Habib4,310
69 Sargents Road, Minchinbury, NSW 2770 $161,000,000 Feb-17 7.98% Lendlease Logos 88,555
71 Tattersall Road, Kings Park, NSW 2148 $9,850,000 Mar-17 N/A Undisclosed Undisclosed 1,250
129-141 Woodpark Road, Smithfield, NSW 2164 $5,300,000 Mar-17 N/A Undisclosed Undisclosed 5,210
1 Davis Road, Wetherill Park, NSW 2164 $7,765,000 Mar-17 N/A Penn Morrall Holdings Pty Ltd Penrite Holdings Pty Ltd 4,744
8 Blaxland Road, Blacktown, NSW 2148 $5,900,000 Apr-17 N/A SJC Investments Pty Ltd Vendlein Pty Ltd 2,336
Table 6—Central Western Region Industrial leases—Source Preston Rowe Paterson Research/CPM
Table 7—Outer Western Building/Investment Sales—Source Preston Rowe Paterson Research/CPM

5
Phone: +61 2 9292 7400
Fax: +61 2 9292 7404
Address: Level 14, 347 Kent Street Sydney NSW 2000
Email: [email protected]
Follow us: Visit www.prpsydney.com.au
© Copyright Preston Rowe Paterson NSW Pty Limited
5
Rentals
Preston Rowe Paterson recorded the following major leasing transactions in the Outer West industrial market over the six months to March 2017:
South Sydney Region
Preston Rowe Paterson Research classifies the South Sydney region of Sydney’s Industrial Market to include the suburbs of:
Alexandria, Banksmeadow, Botany, Erskineville, Marrickville, Mascot, Matraville, Redfern, Rosebery, Tempe and Waterloo
Building/Investment Sales
The following table displays reported investment sales transactions over $5 million which occurred in South Sydney over the first half of 2017:
ADDRESS RATE /SQM RENT P.A AREA (SQM) LESSOR LESSEE TERM DATE
6 Wonderland Drive, Eastern Creek,
NSW 2766$120 $491,880 4,099 Titan Australia Undisclosed 5 Feb-17
2/26 McIlwraith Street, Wetherill Park,
NSW 2164$97 $113,295 1,169 Simco Catering Equipment Private investor 5 Feb-17
10 Vicars Place, Wetherill Park, NSW
2164$115 $253,805 2,207 Aggressor Corporation Private landlord 3 Feb-17
M4 Freeway, Eastern Creek, NSW 2766 $120 $2,200,000 18,000 CEVA Logistics Calibre 4 Feb-17
74-94 Newtown Road, Wetherill Park,
NSW 2164$125 $198,000 1,584 360 Capital ITW Australia 3 Feb-17
2 Muir Place, Wetherill Park, NSW 2164 $115 $119,140 1,036 Foxcom Australia Private investor 4 Feb-17
16 Voyager Circuit, Glendenning, NSW
2761$120 $113,880 949 Xero Manufacturing SND Properties 3 yrs 2 months Feb-17
ADDRESS SALE PRICE SALE DATE REPORTED YIELD VENDOR PURCHASER AREA (SQM)
12-18 Stokes Avenue, Alexandria, NSW 2015 $9,200,000 May-17 N/A Undisclosed Undisclosed 3,359
30 Carrington Road, Marrickville, NSW 2204 $6,750,000 Mar-17 N/ANikolopoulos, Nikolopolos &
Nikolopoul
Bedrock Property Developments
Pty Ltd1,119 (land)
136 Cope Street, Waterloo, NSW 2017 $7,250,000 Feb-17 N/A Radama3 Pty Ltd Transport for NSW 753 (land)
Table 9—South Sydney Building/Investment Sales—Source Preston Rowe Paterson Research/CPM
Table 8—Outer Western Region Industrial leases—Source Preston Rowe Paterson Research/CPM

6
Phone: +61 2 9292 7400
Fax: +61 2 9292 7404
Address: Level 14, 347 Kent Street Sydney NSW 2000
Email: [email protected]
Follow us: Visit www.prpsydney.com.au
© Copyright Preston Rowe Paterson NSW Pty Limited
6
Rentals
Preston Rowe Paterson recorded the following major leasing transactions in the South Sydney industrial market over the first half of 2017:
South West Region
Preston Rowe Paterson Research classifies the South West region of Sydney’s Industrial market to include suburbs of:
Bankstown, Bexley, Campbelltown, Chipping Norton, Chullora, Enfield, Ingleburn, Kingsgrove, Lakemba, Liverpool, Milperra, Minto, Moorebank,
Padstow, Peakhurst, Prestons, Punchbowl, Revesby, Riverwood, Smeaton Grange and Villawood.
Building/Investment Sales
The following table displays reported investment sales transactions over $5 million which occurred over the first half of 2017:
ADDRESS RATE /SQM RENT P.A AREA (SQM) LESSOR LESSEE TERM DATE
17 Chester Street, Camperdown, NSW 2050 $300 $60,000 200 Peter FitzSmart Plumbing Admin
Services Pty Ltd3 Jan-17
105-109 McEvoy Street, Alexandria, NSW 2015 $780 $62,400 80 McEvoy 105 Pty Ltd Victoria Uriarte 4 Jan-17
57A Rhodes Street, Botany, NSW 2019 $166 $44,986 271 Qiumin Estate Pty Ltd Prostruct Projects Pty Ltd 2 Feb-17
17-21 Bowden Street, Alexandria, NSW 2015 $220 $80,000 364 Eustone Properties Pty LtdRomero Ranoa Group Pty
Ltd4 Feb-17
125A Houston Road, Kingsford, NSW 2032 $250 $113,750 455 Alex Bowen Carpets The Design Ark 5 Feb-17
4 Buckley Street, Marrickville, NSW 2204 $210 $46,801 223 Sa Zhang & Xi Zhuang Simon Harsent 5 Feb-17
19 McCauley Street, Port Botany, NSW 2036 $295 $721,570 2,446 Landlord Lenga Custodians Chinese Food City
Australia3 Feb-17
29 Australia Street, Camperdown, NSW 2050 $365 $179,945 493 Undisclosed Catalogic Pty Ltd 5 Mar-17
1 Coggins Place, Mascot, NSW 2020 $200 $120,200 601 Redpence Pty Ltd Zookal Pty Ltd 2 Apr-17
ADDRESS SALE PRICE SALE DATEREPORTED
YIELDVENDOR PURCHASER AREA (SQM)
32 South Street, Rydalmere, NSW 2116 $8,250,000 Jan-17 N/A Undisclosed Undisclosed 3,034
60 Marple Avenue, Villawood, NSW 2163 $20,000,000 Jan-17 8.50% 360 Capital Industrial Fund Owner-occupier 8,615
36 Gow Street, Padstow, NSW 2211 $30,000,000 Feb-17 N/A Mirvac Undisclosed 20,389
Table 10—South Sydney Region Leases—Source Preston Rowe Paterson Research/CPM

7
Phone: +61 2 9292 7400
Fax: +61 2 9292 7404
Address: Level 14, 347 Kent Street Sydney NSW 2000
Email: [email protected]
Follow us: Visit www.prpsydney.com.au
© Copyright Preston Rowe Paterson NSW Pty Limited
7
6 Clements Avenue, Bankstown, NSW 2200 $5,225,000 Mar-17 N/A Eurowood Machinery Pty Ltd Profile Plaster & Metal Pty Ltd 2,737
13 Sheridan Close, Milperra, NSW 2214 $5,700,000 Mar-17 N/ASG Gaming Australia Property
Pty LtdHarosenne Pty Ltd 5,098
60 Marple Avenue, Villawood, NSW 2163 $20,000,000 Mar-17 N/A The 360 Capital Inustrial Fund Undisclosed 8,615
Rentals
Preston Rowe Paterson did not record any major leasing transactions in the South West industrial market over the first half of 2017:
Land Sales
The following table displays significant land sales across the Sydney Metropolitan area over the six months to June 2017:
ADDRESS RATE /SQM RENT P.A AREA (SQM) LESSOR LESSEE TERM DATE
7 Watsford Road, Campbelltown, NSW 2560 $129 $137,859 1,070 Liason Pty LtdNational Indoor Sports Pty
Ltd7 Feb-17
66-68 Jedda Road, Prestons, NSW 2170 $110 $309,320 2,812 UndisclosedGemini Accident Repair
Centre3 Apr-17
45 Davies Road, Padstow, NSW 2211 $85 $133,535 1,571 Kingsmede Pty Ltd Ozstair Pty Ltd 6 May-17
ADDRESS SALE PRICE RATE /SQM AREA (SQM) VENDOR PURCHASER SALE DATE
22-24 South Street, Rydalmere, NSW 2116 $8,250,000 $1,337 6,169 Reg Snith Motors (NSW) Pty
LtdPrivate Buyers Jan-17
10-12 Pike Street, Rydalmere, NSW 2116 $27,500,000 $1,373 20,022 Undisclosed Property link Group Jan-17
24 Bernara Road, Prestons, NSW 2170 $7,000,000 $389 18,000 Undisclosed Apex Investment Feb-17
101 Derby Street, Silverwater, NSW 2128 $7,000,000 $2,096 3,340 Buckingham Investment
Financial Serv icesArese Holdings Pty Ltd Feb-17
12 Burrows Road, St Peters, NSW 2044 $20,054,000 $2,478 8,093 Davis & Davis Roads and Maritime Serv ices Feb-17
36 Huntingwood Drive, Huntingwood,
NSW 2148$29,700,000 $525 56,600 Beiersdorf Charter Hall Feb-17
Lot D/ 31 Bay Road, Taren Point, NSW
2229$24,300,000 $764 31,800
Leda Business Enterprises Pty
LtdAnglican Retirement Villages May-17
Table 12—South West Sydney Region Industrial leases—Source Preston Rowe Paterson Research/CPM
Table 11—South West Sydney Building/Investment Sales—Source Preston Rowe Paterson Research/CPM
N/A = not currently available
Table 12—Industrial Land Sales in NSW—Source Preston Rowe Paterson Research/CPM
8
Phone: +61 2 9292 7400
Fax: +61 2 9292 7404
Address: Level 14, 347 Kent Street Sydney NSW 2000
Email: [email protected]
Follow us: Visit www.prpsydney.com.au
© Copyright Preston Rowe Paterson NSW Pty Limited
8
According to National Australia Bank’s Commercial Property Index,
sentiment around the commercial property market increased by +6
to +27 index points. When we look at different sectors, the Office
sector experienced a strong increase in sentiment, from +14 in Q4
2016, to +35 in Q1 2017. Looking at the industrial sector, confidence
lifted from +5 in Q4 2016, to +14 in Q1 2017, showing modest
improvements overall over the six months to June. When we look at
confidence in the commercial property market, gains were recorded
in Office, Industrial and CBD Hotels, though declined in Retail as
household consumption declines further across most states and
territories.
Expectations for capital growth within the next one to two years have
lifted for the Industrial sector, with an expectation of 1% growth
within the next year, and 1.5% within the next two years. Notably,
Victoria and New South Wales both benefited from a strong
Industrial capital growth in their states, with gains of 1.7% in the
NAB Commercial Property Survey
Quarter 1 2017
0
0.5
1
1.5
2
2.5
3
3.5
Q1 2017 Q2 2017 Q1 2018 Q1 2019
Pe
rce
nta
ge
Gro
wth
(%
)
Industrial Capital Values Industrial Rents
Source: NAB/ PRP Research
3
3.5
4
4.5
5
5.5
6
6.5
7
Q1 2017 Q2 2017 Q1 2018 Q1 2019
Exp
ect
ed
Va
can
cy R
ate
(%
)
Office Retail Industrial
Source: NAB/ PRP Research
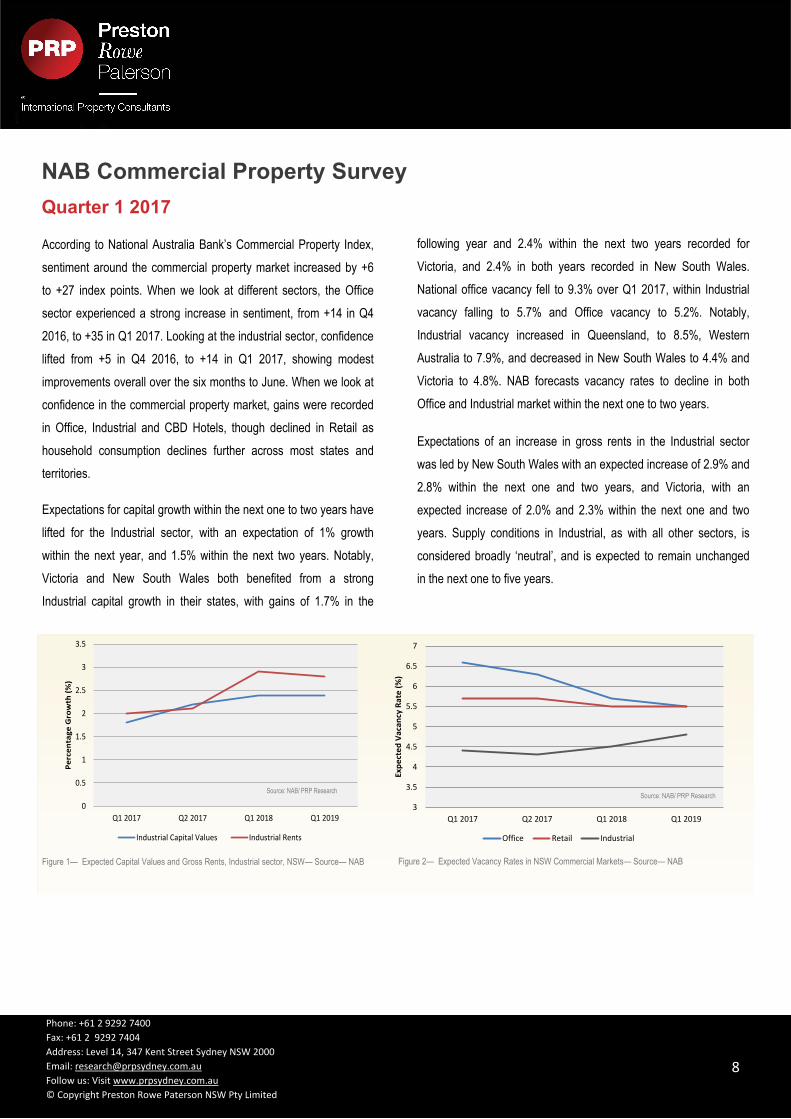
Figure 1— Expected Capital Values and Gross Rents, Industrial sector, NSW— Source— NAB Figure 2— Expected Vacancy Rates in NSW Commercial Markets— Source— NAB
following year and 2.4% within the next two years recorded for
Victoria, and 2.4% in both years recorded in New South Wales.
National office vacancy fell to 9.3% over Q1 2017, within Industrial
vacancy falling to 5.7% and Office vacancy to 5.2%. Notably,
Industrial vacancy increased in Queensland, to 8.5%, Western
Australia to 7.9%, and decreased in New South Wales to 4.4% and
Victoria to 4.8%. NAB forecasts vacancy rates to decline in both
Office and Industrial market within the next one to two years.
Expectations of an increase in gross rents in the Industrial sector
was led by New South Wales with an expected increase of 2.9% and
2.8% within the next one and two years, and Victoria, with an
expected increase of 2.0% and 2.3% within the next one and two
years. Supply conditions in Industrial, as with all other sectors, is
considered broadly ‘neutral’, and is expected to remain unchanged
in the next one to five years.

9
Phone: +61 2 9292 7400
Fax: +61 2 9292 7404
Address: Level 14, 347 Kent Street Sydney NSW 2000
Email: [email protected]
Follow us: Visit www.prpsydney.com.au
© Copyright Preston Rowe Paterson NSW Pty Limited
9
Consumer Price Index
The June quarter Consumer Price Index (CPI) figures will not be available until 27th
July, hence March quarter figures will be used for the following analysis. CPI increased
by 0.5% over the March quarter, following an increase of 0.5% in the December quarter
2016. The main contributor to this increase was the Housing group (+0.8% over the
quarter), the Transport group (+1.5% over the quarter), the Health group (+2.0%),
Education group (+3.1%) and the Alcohol and tobacco Group (+1.1%). In contrast, the
main inhibitors to further increases in CPI were the Furnishing, household equipment &
services group (-1.0%), Recreation & culture group (-0.7%), Clothing and footwear
group (-1.4%), Communications group (-0.3%) and Food & alcoholic beverage group (-
0.2%).
Over the year to March 2017, All Groups CPI increased across all eight capital cities in
Australia, with Melbourne and Sydney recording the biggest yearly increase, of +2.5%
and +2.4% respectively. In contrast, Darwin recorded the lowest increase, with an
annual change of 0.5%. Over the March quarter, CPI increased in all capital cities,
except for Darwin.
Economic Fundamentals
Business Sentiment
Both business conditions and business confidence declined over the month of May.
Figures released by National Australia Bank indicate that business conditions dropped
by 1 point, to +12 index points, whilst business confidence index fell by 6 points to +7
index points. In stating this, both indices remain slightly above their long-run average
index (+5 for business conditions, +6 for business confidence), with leading indicators
for both business condition and business confidence remaining relatively strong. NAB’s
chief economist, Alan Oster, noted that a disconnect is present when we look at
evidence of solid business activity in conjunction with data that indicates a slowdown in
consumer spending. With weak household data and wage growth remaining at record
low, and a strong business sector, Mr Oster have noted how this ‘disparity resolves itself
will be critical to the outlook for growth’.
According to the Westpac Melbourne Institute Index of Consumer Sentiment, consumers
over the month of June are feeling the most pessimistic since the Reserve Bank’s 2016
rate cuts. The index fell 1.8% from 98.0 in May to 96.2 in June, with a reading below 100
indicating that the number of pessimists outweigh optimists in their outlook of the
economy. The main contributor to the results stems from the March quarter GDP figures,
which produced relatively weak results. Annual growth had declined to 1.7%, the slowest
increase since the GFC prompting consumers’ pessimistic responses during the June
survey.
Job security remains a topic on most consumers’ mind, with the Westpac Melbourne
Institute Unemployment Expectations Index increasing from 135.5 to 140.3, with a lower
number indicating that fewer consumers expect unemployment to rise over the next
twelve months. In saying this, job figures have come out positive, with unemployment
expectations showing a positive improvement, as average index figures for 2015 and
2016 were both at 144 points.
Consumer Sentiment
-0.20
0.00
0.20
0.40
0.60
0.80
1.00
1.20
107.0
107.5
108.0
108.5
109.0
109.5
110.0
110.5
111.0
111.5
112.0
Australia Sydney Melbourne Brisbane Adelaide Perth Hobart Darwin Canberra
% C
hang
e Fr
om P
revi
ous
Qua
rter
Con
sum
er P
rice
Inde
x (A
ll G
roup
s)
CPI (All Groups) Percentage Change From Previous QuarterSource: ABS/Preston Rowe Paterson Research
Chart 1—All Group CPI (Capital Cities) and Percentage Change from December 2016 to March 2017—Source—
ABS
Net Balance
March 2017 April 2017 May 2017
Business confidence 7 13 7
Business conditions 14 13 12
Table 1— Monthly Net Balance of Business confidence index and Business conditions index — Source— National
Chart 2—Consumer Sentiment Index, February 2016 to February 2017—Source—Westpac Melbourne Institute Survey
90
92
94
96
98
100
102
104
Jun-16 Jul-16 Aug-16 Sep-16 Oct-16 Nov-16 Dec-16 Jan-17 Feb-17 Mar-17 Apr-17 May-17 Jun-17
Con
sum
er S
entim
ent
Consumer Sentiment Index
Source: Westpac Melbourne Institute /Preston Rowe Paterson Research
June 2016 May 2017 June 2017
Consumer Sentiment Index 102.2 98 111.3
Family finance vs. a year ago 90.3 82.6 81.4
Economic conditions next 12 months 97.9 95.9 91.3
Time to buy a dwelling 103.7 90.0 90.9
Table 2— Consumer Sentiment– June 2017 — Source— National Australia Bank

10
Phone: +61 2 9292 7400
Fax: +61 2 9292 7404
Address: Level 14, 347 Kent Street Sydney NSW 2000
Email: [email protected]
Follow us: Visit www.prpsydney.com.au
© Copyright Preston Rowe Paterson NSW Pty Limited
10
Over the first quarter of 2017, Australia’s gross domestic product (GDP) increased by
a seasonally adjusted 0.3%- a relatively weak figure when compared to December
2016 quarterly increase of 1.1%. Over the twelve months to March 2017, Australia’s
economy grew by 1.7%, relatively weaker than the 2.4% yearly increase in the fourth
quarter 2016. Many economists had anticipated weaker growth over March quarter,
after current account figures had indicated a dramatic slowdown in exports over the
three months. However, the quarter’s growth now means that Australia has
experienced 103 quarters without a technical recession (defined as two consecutive
quarters of negative growths).
We note that export of goods and services declined by a seasonally adjusted 1.6%
over the quarter. The main influence was a decline in the export of mineral ores and
coal, which contributed to a 2.6% decline in the export of goods. The export of
services partially offset this decline by increasing by 2.5% over the quarter, though
was not enough to stimulate an overall positive growth after the previous six quarters
of growth. Moreover, terms of trade increased by 6.6% over the quarter, a decline
from the 9.6% increase from last quarter.
Dwelling investments declined by 4.4% over the March quarter, though over the
twelve months, dwelling investment has declined by 2.5%. Victoria was the only state
to experience an increase in dwelling investment over the quarter, though at a
national level, dwelling investment remains high.
Gross Domestic Product
Over the month to May 2017, seasonally adjusted unemployment rate declined to 5.5%,
the lowest level since February 2013. There were 52,100 new persons in full time em-
ployment, though the number of persons starting part-time roles declined by 10,100-
bringing the net total number of employed persons to 42,000 over the month. Over the
same period, the participation rate declined to 64.9% (-0.1%), underemployment rate
declined to 8.8% (-0.1%) and the underutilisation rate declined to 14.4% (-0.4%).
New South Wales experienced the largest month-on-month increase in employment with
32,600 persons. Victoria and Queensland experienced the next largest increases, with
6,900 persons and 5,500 persons respectively. When we look at the unemployment rate
around the country, South Australia and Western Australia experienced the largest
decline, both by -0.4%. Tasmania experienced an increase of 0.2%, whilst New South
Wales increased by 0.1%. Tasmania experienced an increase of 0.8% in their participa-
tion rate, whilst Western Australia experienced a decline of 0.1% in theirs.
Unemployment
-1.00%
-0.80%
-0.60%
-0.40%
-0.20%
0.00%
0.20%
0.40%
0.60%
0.80%
1.00%
1.20%
1.40%
-15.00%
-10.00%
-5.00%
0.00%
5.00%
10.00%
15.00%
20.00%
25.00%
Dec
-10
Mar
-11
Jun-
11
Sep
-11
Dec
-11
Mar
-12
Jun-
12
Sep
-12
Dec
-12
Mar
-13
Jun-
13
Sep
-13
Dec
-13
Mar
-14
Jun-
14
Sep
-14
Dec
-14
Mar
-15
Jun-
15
Sep
-15
Dec
-15
Mar
-16
Jun-
16
Sep
-16
Dec
-16
Qu
arte
rly
Ch
ang
e in
GD
P
Qu
arte
rly
Ch
ang
e in
Dw
ellin
g a
nd
No
n-D
wel
ling
Inve
stm
ents
Dwelling Investment Non-Dwelling Construction Gross Domestic Product
Source: RBA /Preston Rowe Paterson Research
Chart 3— Percentage Change in Dwelling, Non-Dwelling Investments and GDP— Source: ABS
Chart 4— Seasonally Adjusted GDP and Seasonally Adjusted Change in GDP— Source: ABS
-2.0
-1.5
-1.0
-0.5
0.0
0.5
1.0
1.5
2.0
250,000.0
300,000.0
350,000.0
400,000.0
450,000.0
Mar
-12
Jun-
12
Sep
-12
Dec
-12
Mar
-13
Jun-
13
Sep
-13
Dec
-13
Mar
-14
Jun-
14
Sep
-14
Dec
-14
Mar
-15
Jun-
15
Sep
-15
Dec
-15
Mar
-16
Jun-
16
Sep
-16
Dec
-16
Mar
-17
Per
cent
age
(%)
GD
P ($
Mill
ions
)
Gross Domestic Product Seasonally Adjusted % Change Seasonally Adjusted
Source: RBA /Preston Rowe Paterson Research
Chart 5— Unemployment Persons and Unemployment Rate, March 2011 to March 2017 — Source: ABS
2.00
2.50
3.00
3.50
4.00
4.50
5.00
5.50
6.00
6.50
7.00
500,000
550,000
600,000
650,000
700,000
750,000
800,000
May
-12
Nov
-12
May
-13
Nov
-13
May
-14
Nov
-14
May
-15
Nov
-15
May
-16
Nov
-16
May
-17
Un
emp
loym
ent
rate
(%
)
Un
emp
loye
d p
erso
ns
Unemployed Persons Unemployment Rate
Source: ABS/Preston Rowe Paterson Research
Table 3— Unemployment Rate and Participation Rate, February vs. March 2017 — Source: ABS
Unemployment Rate (%) Participation Rate (%)
April May April May
Australia 5.7 5.5 ▼ 64.9 64.9 ▬
New South Wales 4.7 4.8 ▲ 65.3 65.2 ▼
Victoria 6.1 6.0 ▼ 66.0 65.5 ▼
Queensland 6.3 6.1 ▼ 69.0 68.1 ▼
South Australia 7.3 6.9 ▼ 65.0 64.8 ▼
Western Australia 5.9 5.5 ▼ 68.8 67.5 ▼
Tasmania 5.9 6.1 ▲ 59.5 59.9 ▲
Northern Territory* 3.3 3.2 ▼ 74.3 65.6 ▼
Australian Capital Territory* 3.6 3.5 ▼ 67.8 66.1 ▼
11
Phone: +61 2 9292 7400
Fax: +61 2 9292 7404
Address: Level 14, 347 Kent Street Sydney NSW 2000
Email: [email protected]
Follow us: Visit www.prpsydney.com.au
© Copyright Preston Rowe Paterson NSW Pty Limited
11
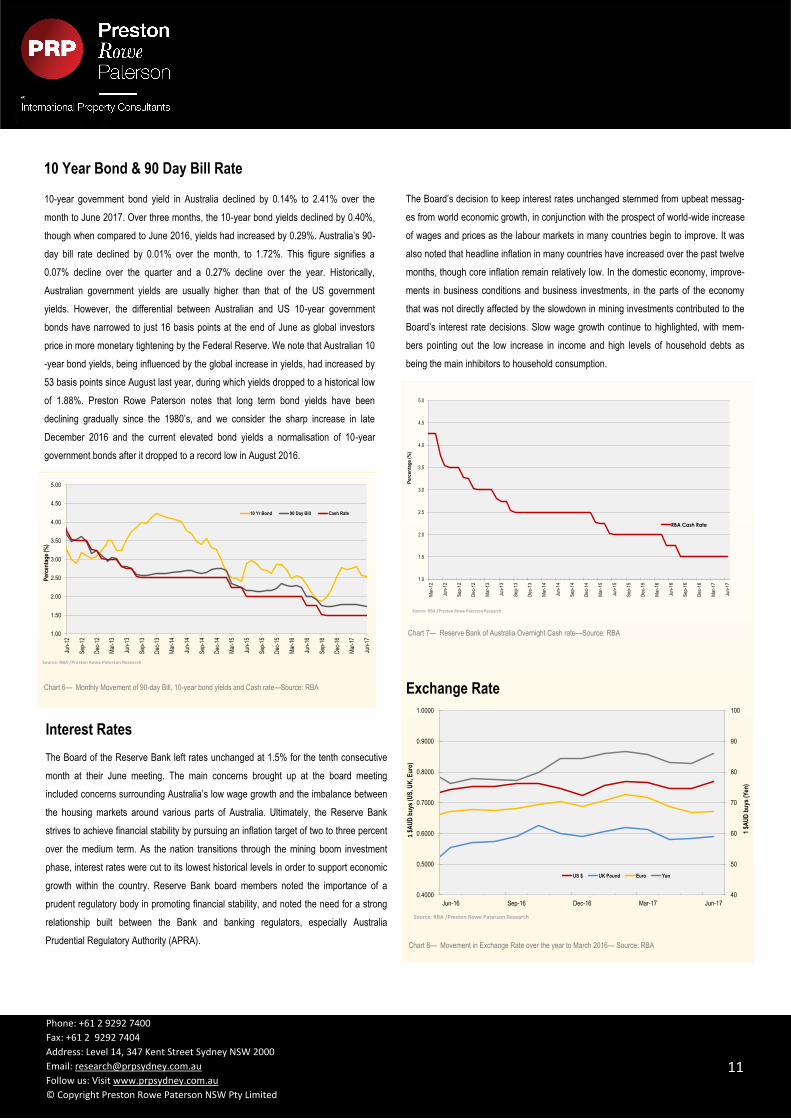
10-year government bond yield in Australia declined by 0.14% to 2.41% over the
month to June 2017. Over three months, the 10-year bond yields declined by 0.40%,
though when compared to June 2016, yields had increased by 0.29%. Australia’s 90-
day bill rate declined by 0.01% over the month, to 1.72%. This figure signifies a
0.07% decline over the quarter and a 0.27% decline over the year. Historically,
Australian government yields are usually higher than that of the US government
yields. However, the differential between Australian and US 10-year government
bonds have narrowed to just 16 basis points at the end of June as global investors
price in more monetary tightening by the Federal Reserve. We note that Australian 10
-year bond yields, being influenced by the global increase in yields, had increased by
53 basis points since August last year, during which yields dropped to a historical low
of 1.88%. Preston Rowe Paterson notes that long term bond yields have been
declining gradually since the 1980’s, and we consider the sharp increase in late
December 2016 and the current elevated bond yields a normalisation of 10-year
government bonds after it dropped to a record low in August 2016.
10 Year Bond & 90 Day Bill Rate
The Board of the Reserve Bank left rates unchanged at 1.5% for the tenth consecutive
month at their June meeting. The main concerns brought up at the board meeting
included concerns surrounding Australia’s low wage growth and the imbalance between
the housing markets around various parts of Australia. Ultimately, the Reserve Bank
strives to achieve financial stability by pursuing an inflation target of two to three percent
over the medium term. As the nation transitions through the mining boom investment
phase, interest rates were cut to its lowest historical levels in order to support economic
growth within the country. Reserve Bank board members noted the importance of a
prudent regulatory body in promoting financial stability, and noted the need for a strong
relationship built between the Bank and banking regulators, especially Australia
Prudential Regulatory Authority (APRA).
Interest Rates
The Board’s decision to keep interest rates unchanged stemmed from upbeat messag-
es from world economic growth, in conjunction with the prospect of world-wide increase
of wages and prices as the labour markets in many countries begin to improve. It was
also noted that headline inflation in many countries have increased over the past twelve
months, though core inflation remain relatively low. In the domestic economy, improve-
ments in business conditions and business investments, in the parts of the economy
that was not directly affected by the slowdown in mining investments contributed to the
Board’s interest rate decisions. Slow wage growth continue to highlighted, with mem-
bers pointing out the low increase in income and high levels of household debts as
being the main inhibitors to household consumption.
Exchange Rate
Chart 8— Movement in Exchange Rate over the year to March 2016— Source: RBA
1.0
1.5
2.0
2.5
3.0
3.5
4.0
4.5
5.0
Mar-
12
Jun
-12
Se
p-1
2
De
c-12
Mar-
13
Jun
-13
Se
p-1
3
De
c-13
Mar-
14
Jun
-14
Se
p-1
4
De
c-14
Mar-
15
Jun
-15
Se
p-1
5
De
c-15
Mar-
16
Jun
-16
Se
p-1
6
De
c-16
Mar-
17
Jun
-17
Pe
rce
nta
ge
(%
)
RBA Cash Rate
Source: RBA /Preston Rowe Paterson Research
Chart 7— Reserve Bank of Australia Overnight Cash rate—Source: RBA
40
50
60
70
80
90
100
0.4000
0.5000
0.6000
0.7000
0.8000
0.9000
1.0000
Jun-16 Sep-16 Dec-16 Mar-17 Jun-17
1 $A
UD
bu
ys (
Yen
)
1 $A
UD
bu
ys (
US
, UK
, Eu
ro)
US $ UK Pound Euro Yen
Source: RBA /Preston Rowe Paterson Research
Chart 6— Monthly Movement of 90-day Bill, 10-year bond yields and Cash rate—Source: RBA
1.00
1.50
2.00
2.50
3.00
3.50
4.00
4.50
5.00
Jun-
12
Sep
-12
Dec
-12
Mar
-13
Jun-
13
Sep
-13
Dec
-13
Mar
-14
Jun-
14
Sep
-14
Dec
-14
Mar
-15
Jun-
15
Sep
-15
Dec
-15
Mar
-16
Jun-
16
Sep
-16
Dec
-16
Mar
-17
Jun-
17
Per
cen
tag
e (%
)
10 Yr Bond 90 Day Bill Cash Rate
Source: RBA /Preston Rowe Paterson Research

12
Phone: +61 2 9292 7400
Fax: +61 2 9292 7404
Address: Level 14, 347 Kent Street Sydney NSW 2000
Email: [email protected]
Follow us: Visit www.prpsydney.com.au
© Copyright Preston Rowe Paterson NSW Pty Limited
12
ur esearc At Preston Rowe Paterson, we pride ourselves on the research which we prepare in the market sectors with in which
we operate. These include Commercia l, Retail, Industrial, Hotel & Leisure and Residential proper ty markets as well as infrastructure, capita l and plant and machinery markets
e ave covere Investment
Development Asset Corporate Real Estate
Mortgage Government Insurance
Occupancy Sustainability Research Real Estate Investment Valuation
Real Estate Development Valuation Property Consultancy and Advisory Transaction Advisory
Property and Asset Management Listed Fund, Property Trust, Super Fund and Syndicate
Advisors Plant & Machinery Valuation
General and Insurance Valuation Economic and Property Market Research
e ave all types covere
We regularly provide valuation, proper ty and asset management, consultancy and leasing services for all types of Real Estate including:
CBD and Metropolitan commercia l office buildings Retail shopping centres and shops Industrial, office/warehouses and factories
Business parks Hotels (accommodation) and resor ts Hotels (pubs), motels and caravan parks
Residential development projects Residential dwellings (individual houses and apar tments/
units)
Rural properties Special purpose properties such as: nursing homes; private
hospita ls, service stations, oil terminals and refineries, theatre complexes; etc.
Infrastructure
e ave all types of covere
We regularly under take valuations of a ll forms of plant, machinery, furniture, fittings and equipment including:
Mining & earth moving equipment/road plant Office fit outs, equipment & furniture Agricultural machinery & equipment Heavy, light commercial & passenger vehicles
Industrial manufacturing equipment Wineries and processing plants Special purpose plant, machinery & equipment
Extractive industries, land fills and resource based enterprises
Hotel furniture, fittings & equipment
e ave all covere Preston Rowe Paterson acts for an array of clients with all types of real estate, plant, machinery and equipment interests such as:
Accountants Banks, finance companies and lending institutions Commercial and Residentia l non bank lenders
Co-operatives Developers Finance and mor tgage brokers
Hotel owners and operators Institutional investors Insurance brokers and companies
Investment advisors Lessors and lessees Listed and private companies corporations Listed Property Trusts
Local, State and Federal Government Depar tments and Agencies
Mining companies
Mortgage trusts Overseas clients Private investors
Property Syndication Managers Rural landholders Self managed super funds Solicitors and barristers
Sovereign wealth funds Stock brokers Trustee and Custodial companies
13
Phone: +61 2 9292 7400
Fax: +61 2 9292 7404
Address: Level 14, 347 Kent Street Sydney NSW 2000
Email: [email protected]
Follow us: Visit www.prpsydney.com.au
© Copyright Preston Rowe Paterson NSW Pty Limited
13
e ave all covere
From our capita l city and regional office locations we serve our client’s needs throughout Australia. Globally, we operate directly
or via our relationship offices for special purpose real estate asset classes, infrastructure and plant & machinery.
e ave covere Our clients seek our property (real estate, infrastructure, p lant
and machinery) services for a multitude of reasons including: Acquisitions & Disposals Alternative use & highest and best use analysis Asset Management
Asset Valuations for financial reporting to meet ASIC, AASB, IFRS & IVSC guidelines
Compulsory acquisition and resumption
Corporate merger & acquisition real estate due diligence Due Diligence management for acquisitions and sales Facilities management
Feasibility studies Funds management advice & portfo lio analysis Income and outgoings projections and analysis Insurance valuations (replacement & reinstatement costs)
Leasing vacant space with in managed properties Listed proper ty trust & investment fund valuations & revalua-
tions
Litigation support Marketing & development strategies Mortgage valuations
Property Management Property syndicate valuations and re-valuations Rating and taxing objections Receivership, Insolvency and liquidation valuations and sup-
port/advice Relocation advice, strategies and consultancy Rental assessments and determinations
Sensitivity analysis Strategic proper ty planning

14
Phone: +61 2 9292 7400
Fax: +61 2 9292 7404
Address: Level 14, 347 Kent Street Sydney NSW 2000
Email: [email protected]
Follow us: Visit www.prpsydney.com.au
© Copyright Preston Rowe Paterson NSW Pty Limited
14
Head Office (Sydney)
Level 14, 347 Kent Street
Sydney NSW 2000
PO BOX 4120, Sydney NSW 2001
P: 02 9292 7400
F: 02 9292 7404
National Directors
Gregory Preston
M: 0408 622 400
Gregory Rowe M: 0411 191 179
Neal Ellis
M: 0417 053 116
Damian Kininmonth
M: 0417 059 836
Greg Sugars M: 0435 911 465
E: greg.su [email protected]
www.prp.com.au
Capital City Offices
Adelaide
Rob Simmons M: 0418 857 555
Brisbane
Troy Chaplin M: 0419 029 045
Hobart
Damien Taplin
M: 0418 513 003
Shelley Taplin
M: 0413 309 895 E: [email protected]
Melbourne
Neal Ellis
M: 0417 053 116 E: [email protected]
Damian Kininmonth
M: 0417 059 836
Perth Cameron Sharp
M: 0438 069 103
Sydney
Gregory Preston M: 0408 622 400
Gregory Rowe
M: 0411 191 179
Affiliat e offices in Canberra, Darw in and ot her regional
areas.
Regional Offices
Albury Wodonga
Michael Redfern
M: 0428 235 588 E: [email protected]
Ballarat
Darren Evans
M: 0417 380 324
E: [email protected] Peter Murphy
M: 0402 058 775
Bendigo
Damien Jerinic M: 0409 820 623
Central Coast/Gosford
Colin Pugsley
M: 0435 376 630 E: [email protected]
Dubbo
James Skuthorp
M: 0409 466 779
Tom Needham
M: 0412 740 093 E: [email protected]
Geelong
Gareth Kent
M: 0413 407 820
Stuart Mcdonald
M: 0405 266 783 E: [email protected]
Gippsland
Tim Barlow
M: 0400 724 444 E: [email protected]
Alexandra Ellis
M: 0407 724 444
Griffith
Dan Hogg
M: 0408 585 119 E: [email protected]
Horsham Ben Sawyer
M: 0429 826 541
Launceston
Damien Taplin
M: 0418 513 003
Mornington
Neal Ellis M: 0417 053 116
Damian Kininmonth
M: 0417 059 836
Mount Gambier
Stuart McDonald M: 0405 2660783
Newcastle
Robert Dupont
M: 0418 681 874 E: [email protected]
David Rich
M: 0413 052 166
Southport Ian Hawley
M: 0458 700 272
Troy Chaplin
M: 0419 029 045 E: [email protected]
Swan Hill
Ian Boyd-Law
M: 0418 5980232 E: [email protected]
Tamworth
Bruce Sharrock
M: 0429 465 012 E: [email protected]
Matt Spencer
M: 0447 227 002
Wagga Wagga Dan Hogg
M: 0408 585 119
Warrnambool
Stuart McDonald M: 0405 266 783 E: [email protected]
New Zealand Offices
Head Office (Auckland)
Greg Sugars M: +64 (0)27 777 9010
E: greg.su [email protected] z
Mitchell Stubbs
M: +64 (0)27 774 34100 E: [email protected]
Dunedin
James Stowell
M: +64 (0)17 807 3866
Greymouth Mark Bollard
M: +64 (0)27 694 7041
E: [email protected] z
Tauranga Alex Haden
M: +64 (0)21 833 118
www.prpnz.nz
Asian Offices Associated office networks throughout:
China
Hong Kong
Japan
Philippines
Thailand
Preston Rowe Paterson Australasia Pty Ltd
ACN: 060 005 807
The information provided within this publication should be
regarded solely as a general guide. We believe that the
information herein is accurate however no warranty of accuracy or reliability is given in relation to any
information contained in this publication. Nor is any
responsibility for any loss or damage whatsoever arising in
any way for any representation, act or omission, whether
expressed or implied (including responsibility to any person or entity by reason of negligence) accepted by
Preston Rowe Paterson Australasia Pty Ltd or any of its
associated offices or any officer, agent or employee of
Preston Rowe Paterson Australasia Pty Limited.